Embed Size (px)
DESCRIPTION
Oracle Diagnostic Events in 12g. www.oraclue.com. Agenda. About me 45 min Oracle Diagnostic Events 1 min. www.oraclue.com. 2. Oracle Diagnostic Events in 11g. www.oraclue.com. 3. About me. www.oraclue.com. www.oraclue.com. Agenda. Overview History Documentation - PowerPoint PPT Presentation
Citation preview
1
Oracle Diagnostic Eventsin 12g
www.oraclue.com
2
Agenda
• About me 45 min• Oracle Diagnostic Events 1 min
2
www.oraclue.com
33
Oracle Diagnostic Eventsin 11g
www.oraclue.com
4
About me
www.oraclue.com
5
www.oraclue.com
6
Agenda
• Overview
• History
• Documentation
• Demos
• Conclusion
www.oraclue.com
7
Events
• Built in low-level kernel diagnostics and tracing infrastructure
• Syntax coming from ksdp.c Kernel Service Debug Parser• Debug facilities are available after process has actually
initialized its fixed-PGA-part .This happen at connect time• If a number is specified, it is taken to be an Oracle error
number. • If a name is specified, the parser looks it up in an event
name table if it is not "immediate".Oracle diagnostic events and ORA- errors share the same range of numbers from 0 to 65535 for their codes
www.oraclue.com
8
Caution!
• Activate events in production only under the direction of Oracle Support.
• Events can cause instance outages• Test first in “sandbox” environment before implementing it
into production.• Always check compatibly between event codes and database
version.• Certain events can corrupt database• Some events can cause performance issues• Check documentation
www.oraclue.com
9
Usage & Categories
Events are primarily used to:• Produce additional diagnostics• Workaround problem• Change Oracle’s behavior• Enable undocumented features
Based on usage events can be divided into four categories:• Immediate Dump Events : systemstate, pga_detail_get• On Error Dump Events : 4031 , 942• Change Behavior Events : 10235 • Process Trace Events : 10046 , 10053
www.oraclue.com
10
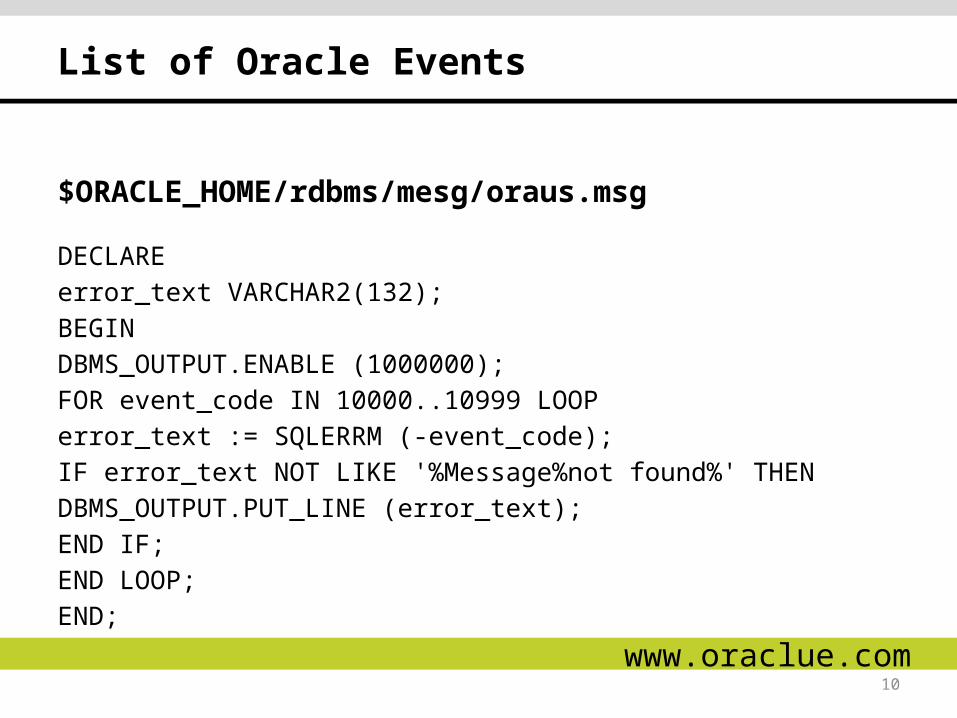
$ORACLE_HOME/rdbms/mesg/oraus.msg
DECLARE
error_text VARCHAR2(132);
BEGIN
DBMS_OUTPUT.ENABLE (1000000);
FOR event_code IN 10000..10999 LOOP
error_text := SQLERRM (-event_code);
IF error_text NOT LIKE '%Message%not found%' THEN
DBMS_OUTPUT.PUT_LINE (error_text);
END IF;
END LOOP;
END;www.oraclue.com
List of Oracle Events
11
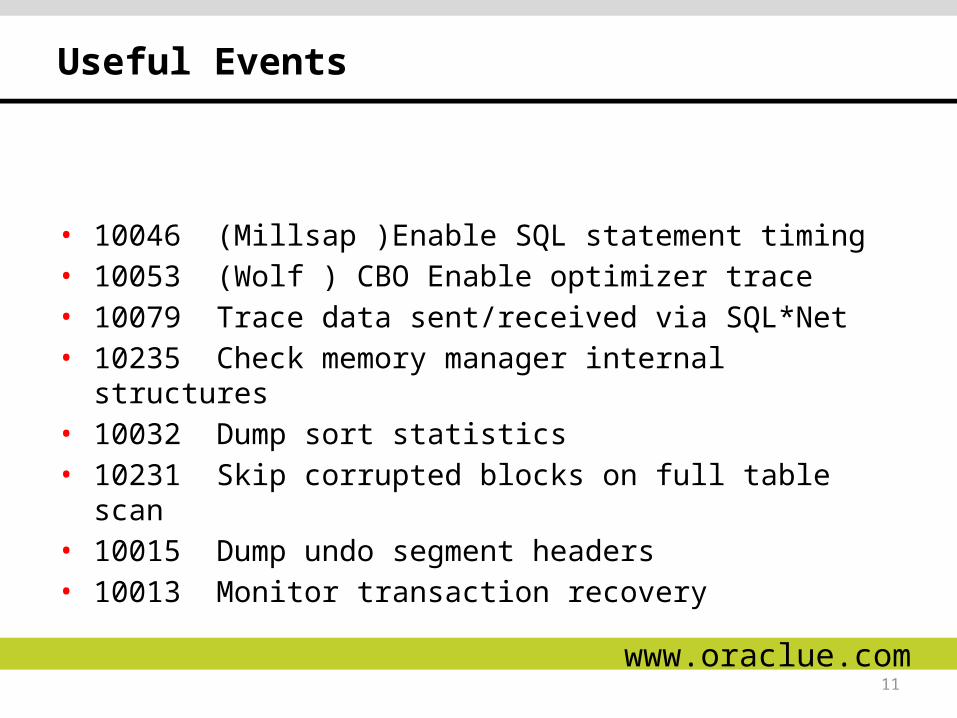
Useful Events
• 10046 (Millsap )Enable SQL statement timing• 10053 (Wolf ) CBO Enable optimizer trace • 10079 Trace data sent/received via SQL*Net• 10235 Check memory manager internal structures• 10032 Dump sort statistics• 10231 Skip corrupted blocks on full table scan• 10015 Dump undo segment headers• 10013 Monitor transaction recovery
www.oraclue.com
12
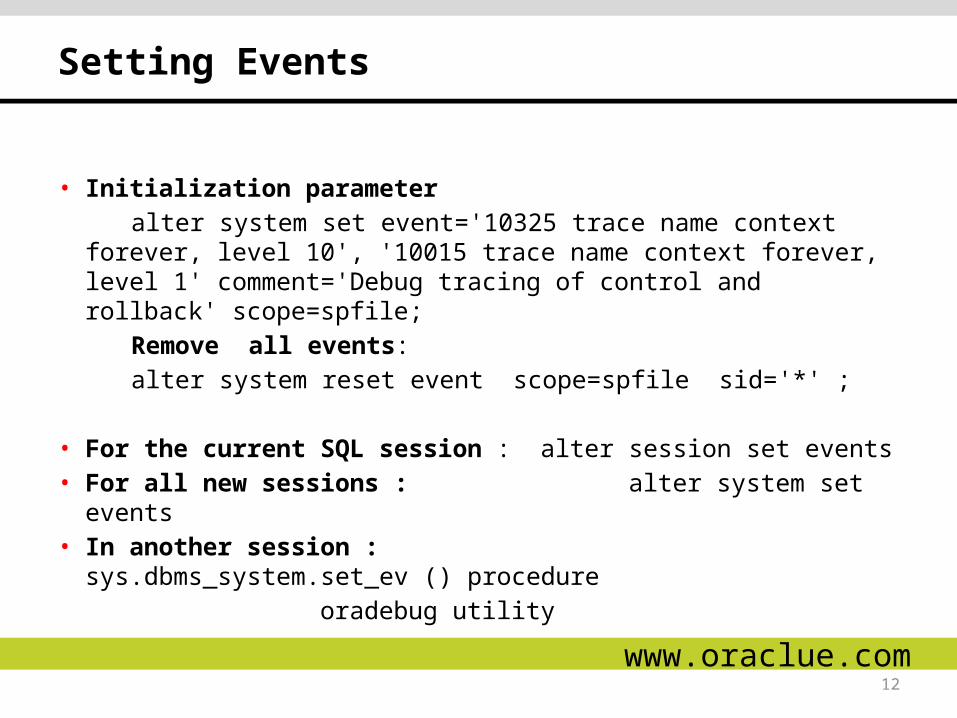
Setting Events
• Initialization parameter alter system set event='10325 trace name context forever, level
10', '10015 trace name context forever, level 1' comment='Debug tracing of control and rollback' scope=spfile;
Remove all events: alter system reset event scope=spfile sid='*' ;
• For the current SQL session : alter session set events • For all new sessions : alter system set events• In another session : sys.dbms_system.set_ev ()
procedure oradebug utility
www.oraclue.com
13
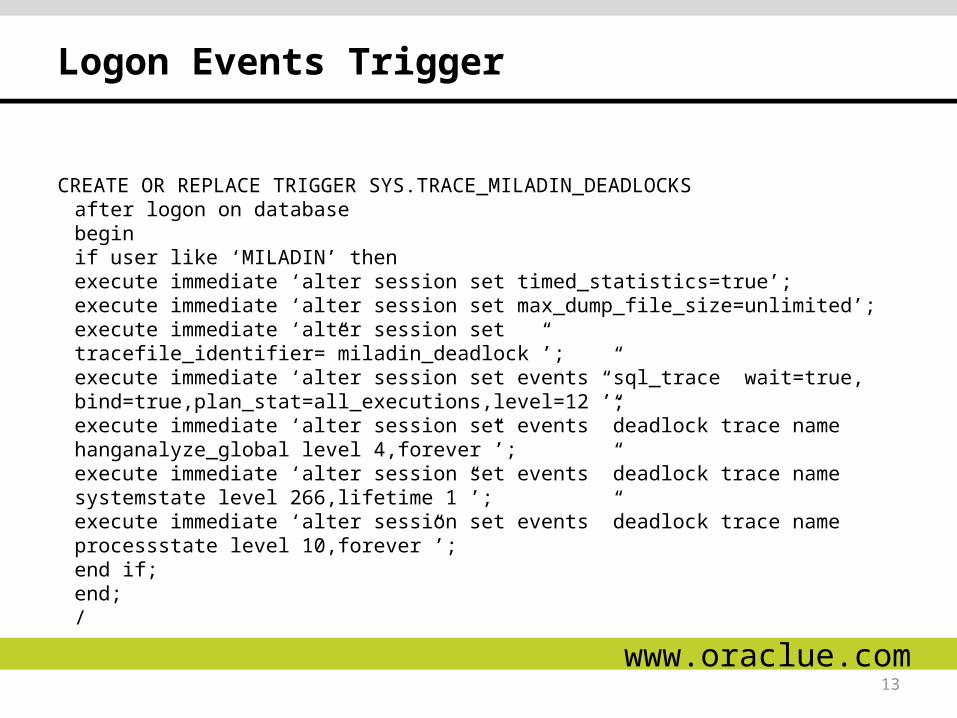
Logon Events Trigger
CREATE OR REPLACE TRIGGER SYS.TRACE_MILADIN_DEADLOCKSafter logon on databasebeginif user like ‘MILADIN’ thenexecute immediate ‘alter session set timed_statistics=true’;execute immediate ‘alter session set max_dump_file_size=unlimited’;execute immediate ‘alter session set tracefile_identifier=”miladin_deadlock”’;execute immediate ‘alter session set events ”sql_trace wait=true, bind=true,plan_stat=all_executions,level=12”’;execute immediate ‘alter session set events ”deadlock trace name hanganalyze_global level 4,forever”’;execute immediate ‘alter session set events ”deadlock trace name systemstate level 266,lifetime 1”’;execute immediate ‘alter session set events ”deadlock trace name processstate level 10,forever”’;end if;end;/ www.oraclue.com
14
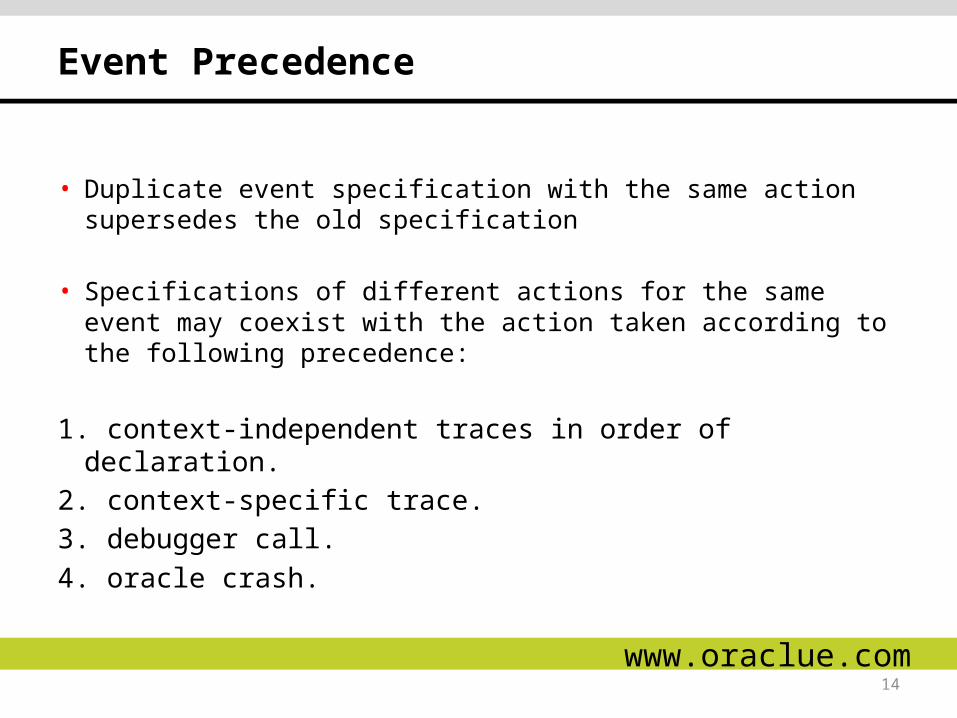
Event Precedence
• Duplicate event specification with the same action supersedes the old specification
• Specifications of different actions for the same event may coexist with the action taken according to the following precedence:
1. context-independent traces in order of declaration.2. context-specific trace.3. debugger call.4. oracle crash.
www.oraclue.com
15
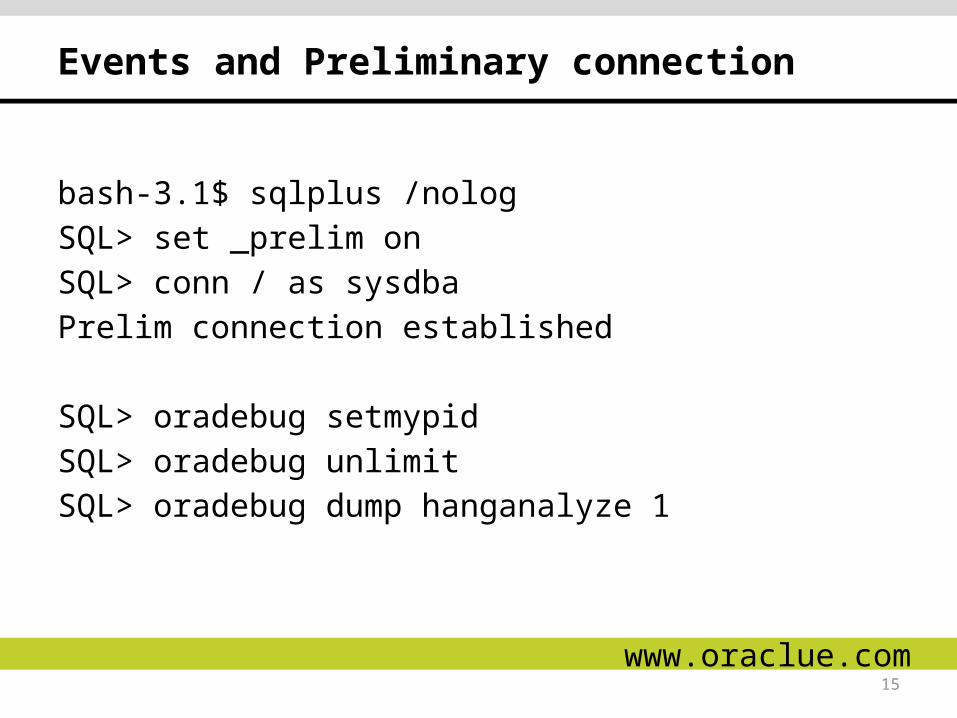
Events and Preliminary connection
bash-3.1$ sqlplus /nolog
SQL> set _prelim on
SQL> conn / as sysdba
Prelim connection established
SQL> oradebug setmypid
SQL> oradebug unlimit
SQL> oradebug dump hanganalyze 1
www.oraclue.com
16
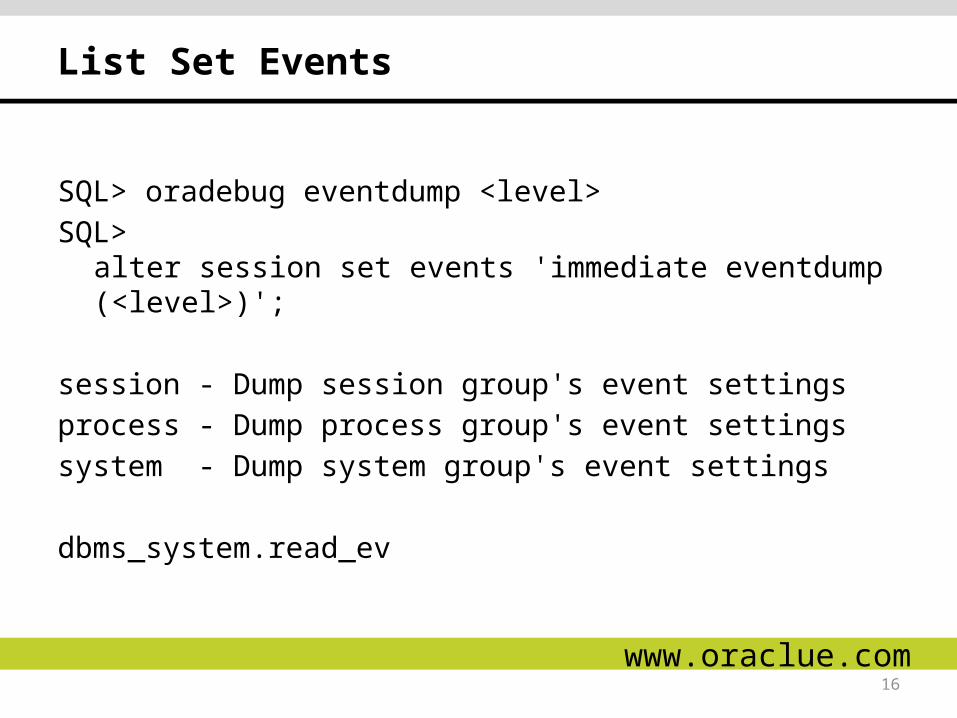
List Set Events
SQL> oradebug eventdump <level>
SQL> alter session set events 'immediate eventdump(<level>)';
session - Dump session group's event settings
process - Dump process group's event settings
system - Dump system group's event settings
dbms_system.read_ev
www.oraclue.com
17
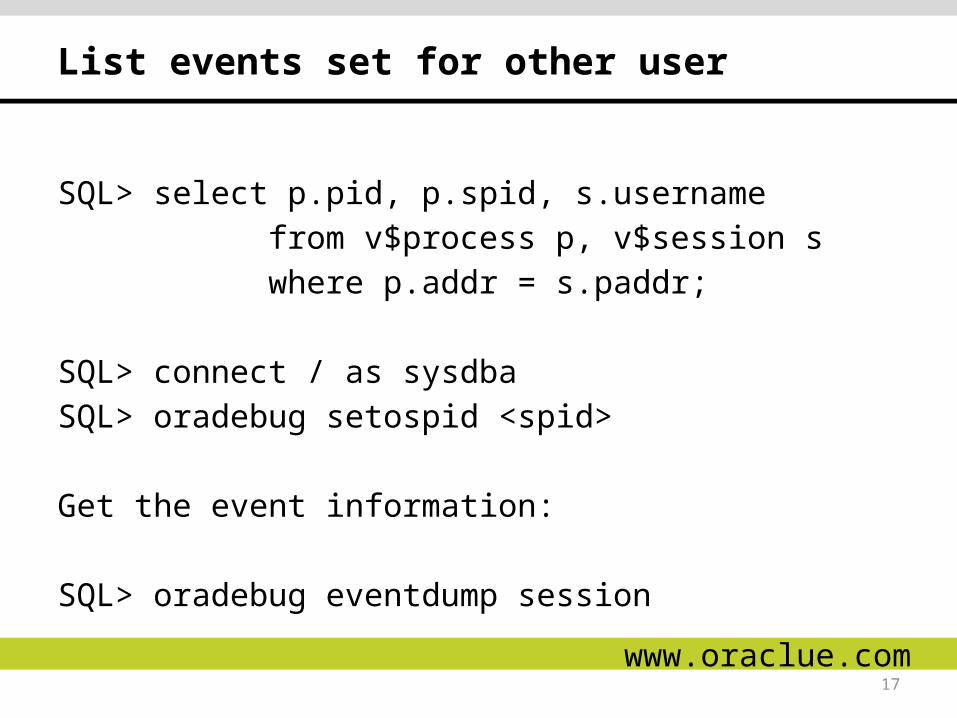
List events set for other user
SQL> select p.pid, p.spid, s.username
from v$process p, v$session s
where p.addr = s.paddr;
SQL> connect / as sysdba
SQL> oradebug setospid <spid>
Get the event information:
SQL> oradebug eventdump session
www.oraclue.com
18
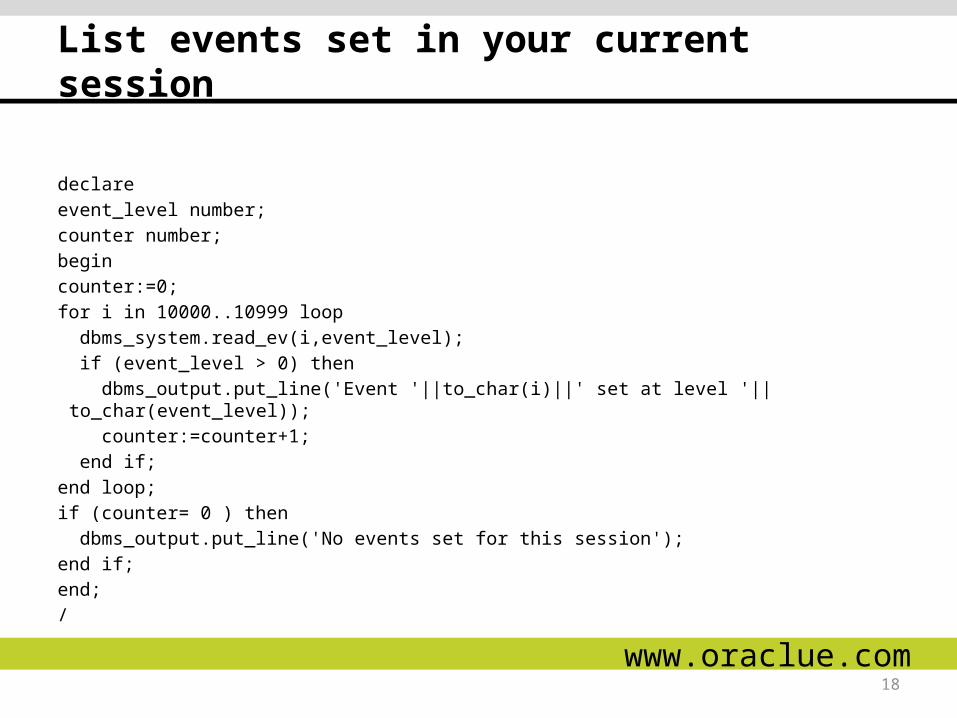
List events set in your current session
declare event_level number; counter number; begin counter:=0; for i in 10000..10999 loop dbms_system.read_ev(i,event_level); if (event_level > 0) then dbms_output.put_line('Event '||to_char(i)||' set at level '|| to_char(event_level)); counter:=counter+1; end if; end loop; if (counter= 0 ) then dbms_output.put_line('No events set for this session'); end if; end; /
www.oraclue.com
19
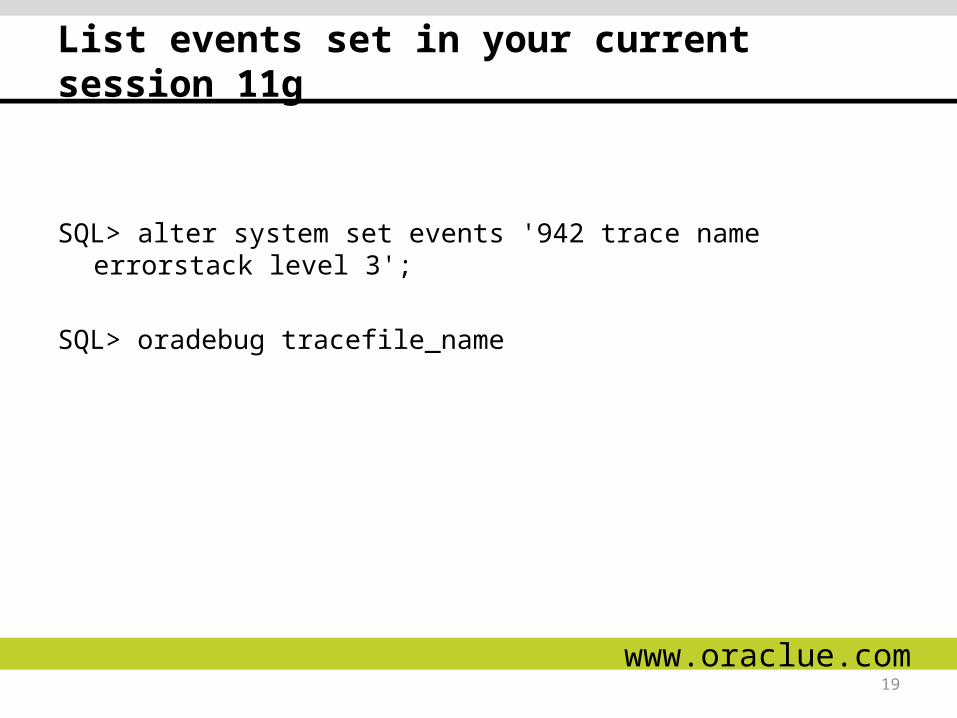
List events set in your current session 11g
SQL> alter system set events '942 trace name errorstack level 3';
SQL> oradebug tracefile_name
www.oraclue.com
20
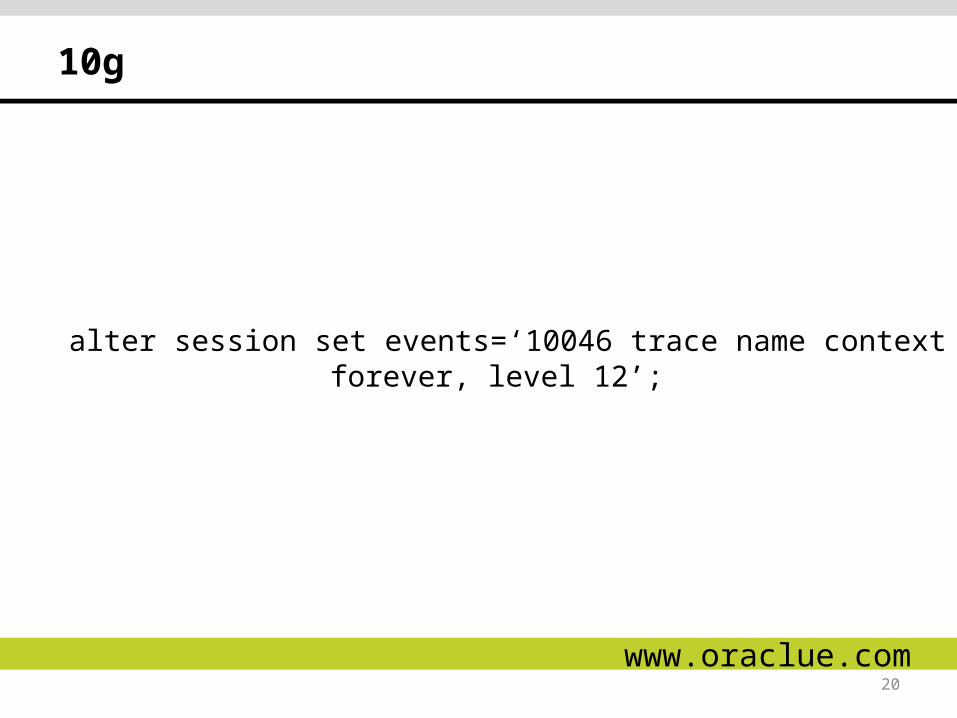
10g
alter session set events=‘10046 trace name context forever, level 12’;
www.oraclue.com
21
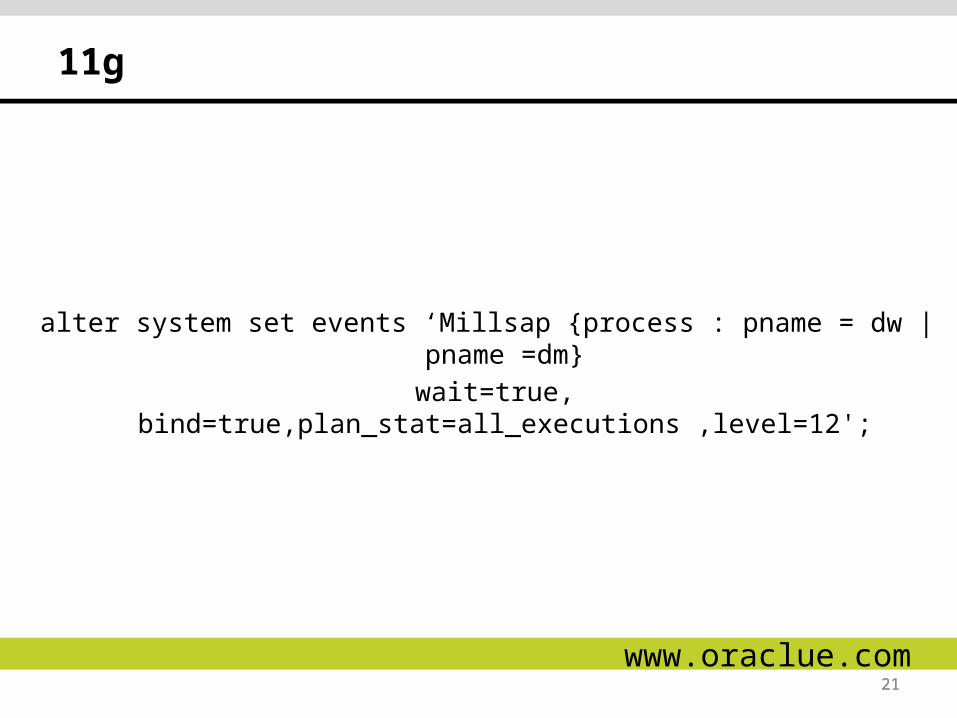
11g
alter system set events ‘Millsap {process : pname = dw | pname =dm}
wait=true, bind=true,plan_stat=all_executions ,level=12';
21
www.oraclue.com
22
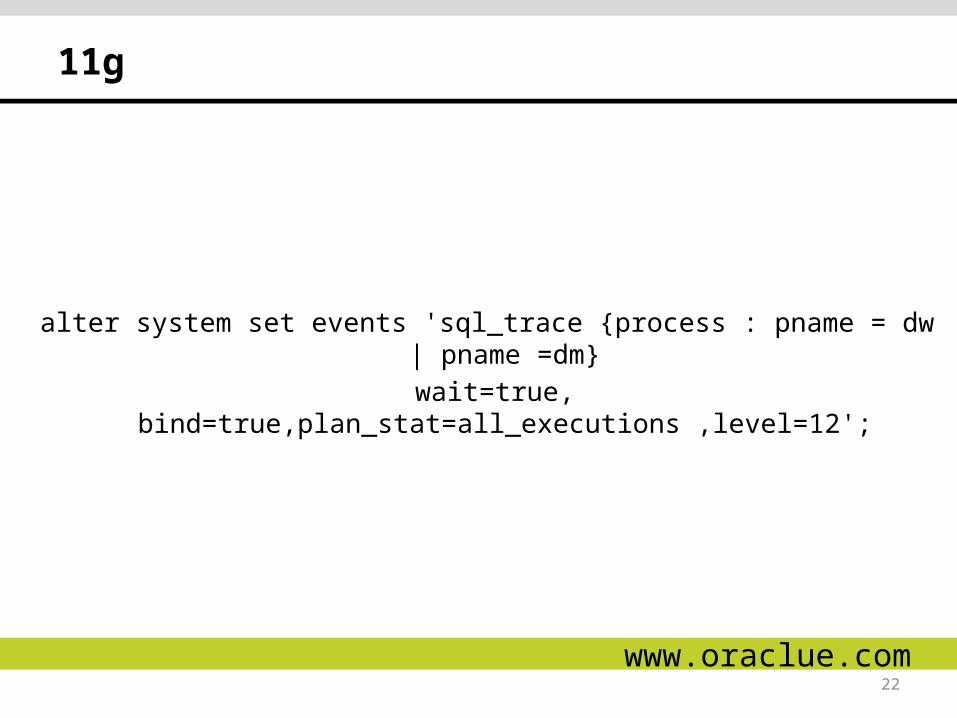
11g
alter system set events 'sql_trace {process : pname = dw | pname =dm}
wait=true, bind=true,plan_stat=all_executions ,level=12';
www.oraclue.com
23
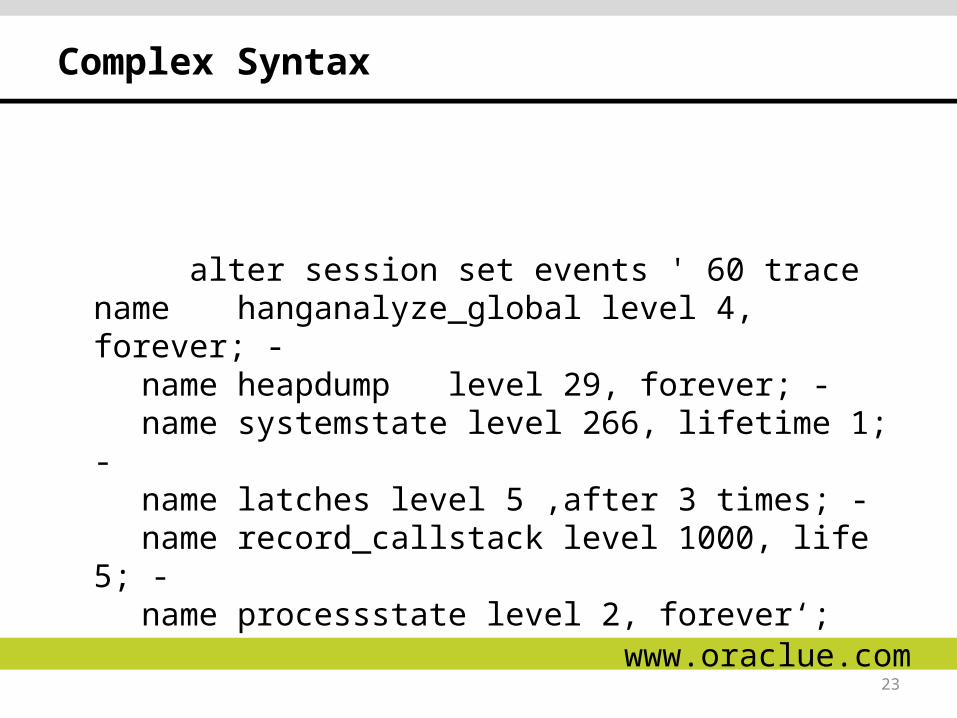
Complex Syntax
alter session set events ' 60 trace name hanganalyze_global level 4, forever; -
name heapdump level 29, forever; -name systemstate level 266, lifetime 1; -name latches level 5 ,after 3 times; -name record_callstack level 1000, life 5; -name processstate level 2, forever‘;
www.oraclue.com
24
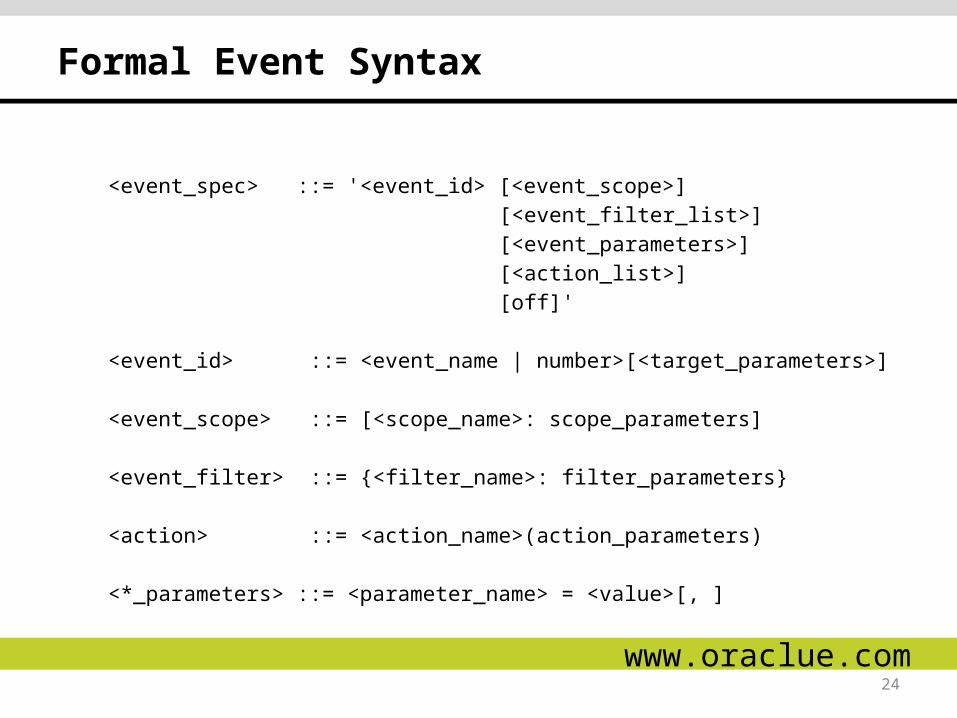
Formal Event Syntax
<event_spec> ::= '<event_id> [<event_scope>] [<event_filter_list>] [<event_parameters>] [<action_list>] [off]'
<event_id> ::= <event_name | number>[<target_parameters>]
<event_scope> ::= [<scope_name>: scope_parameters]
<event_filter> ::= {<filter_name>: filter_parameters}
<action> ::= <action_name>(action_parameters)
<*_parameters> ::= <parameter_name> = <value>[, ]www.oraclue.com
25
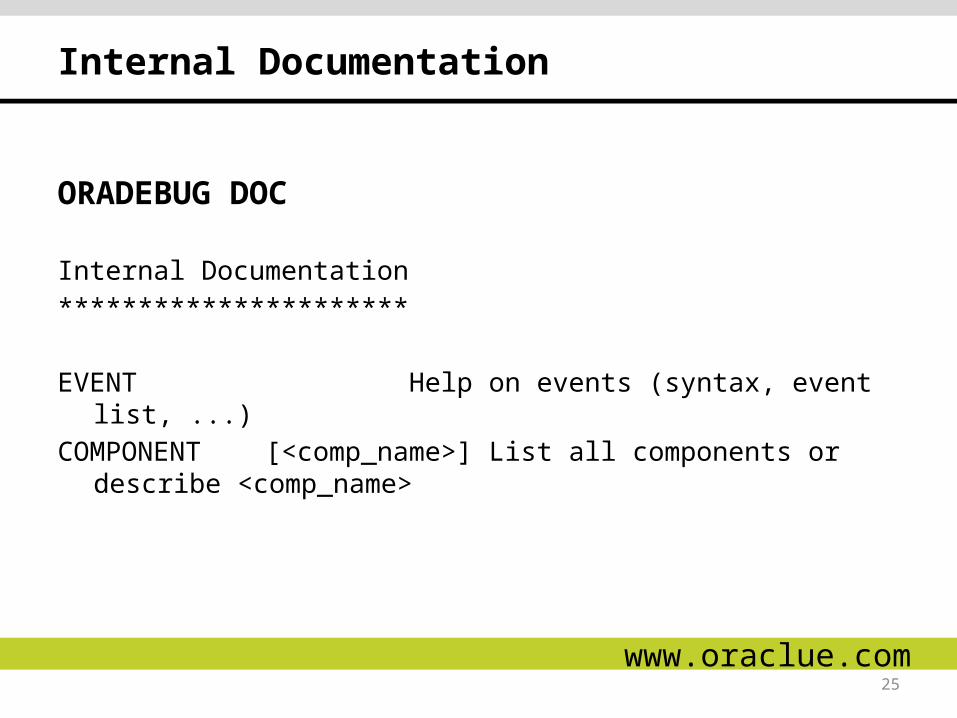
Internal Documentation
ORADEBUG DOC
Internal Documentation**********************
EVENT Help on events (syntax, event list, ...)COMPONENT [<comp_name>] List all components or describe <comp_name>
www.oraclue.com
26
ORADEBUG DOC EVENT
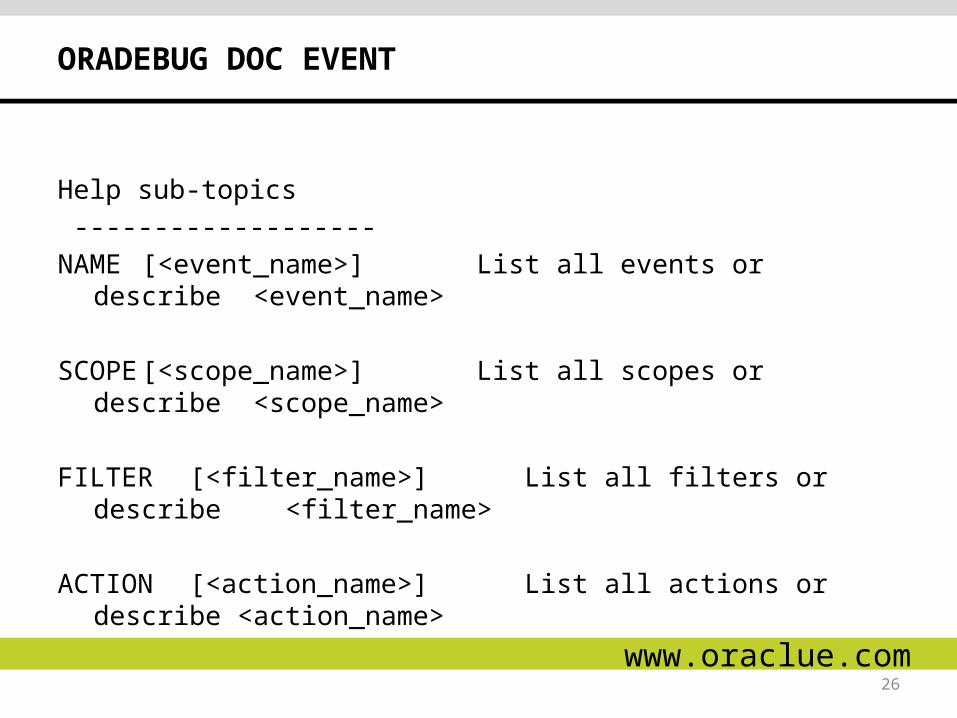
Help sub-topics -------------------NAME [<event_name>] List all events or describe
<event_name>
SCOPE [<scope_name>] List all scopes or describe <scope_name>
FILTER [<filter_name>] List all filters or describe <filter_name>
ACTION [<action_name>] List all actions or describe <action_name>
www.oraclue.com
27
ORADEBUG DOC EVENT NAME
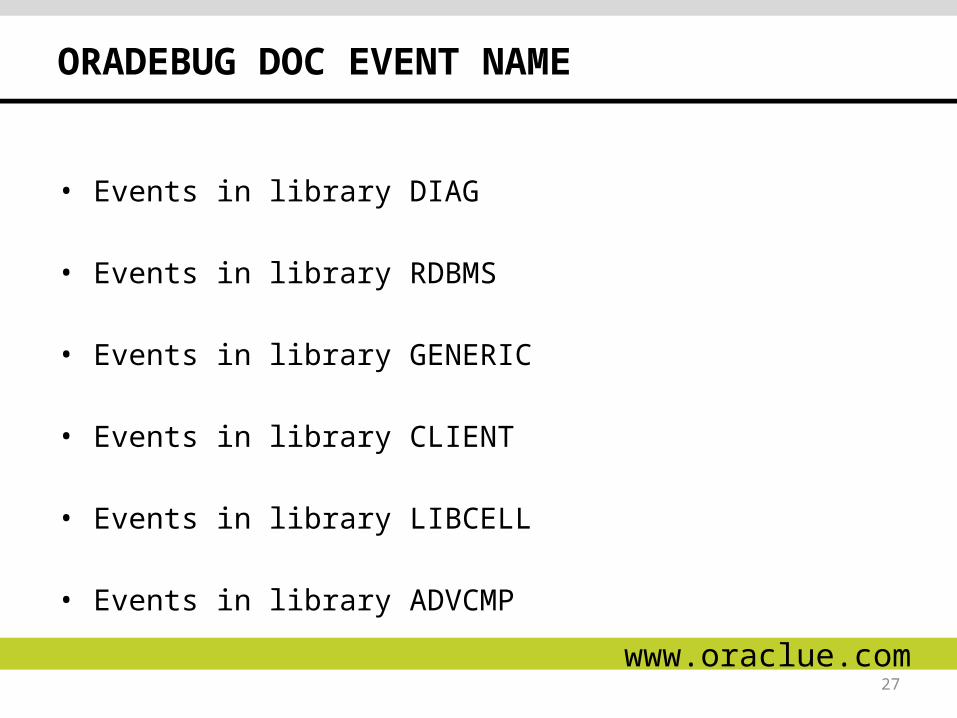
• Events in library DIAG
• Events in library RDBMS
• Events in library GENERIC
• Events in library CLIENT
• Events in library LIBCELL
• Events in library ADVCMP
www.oraclue.com
28
ORADEBUG DOC EVENT NAME
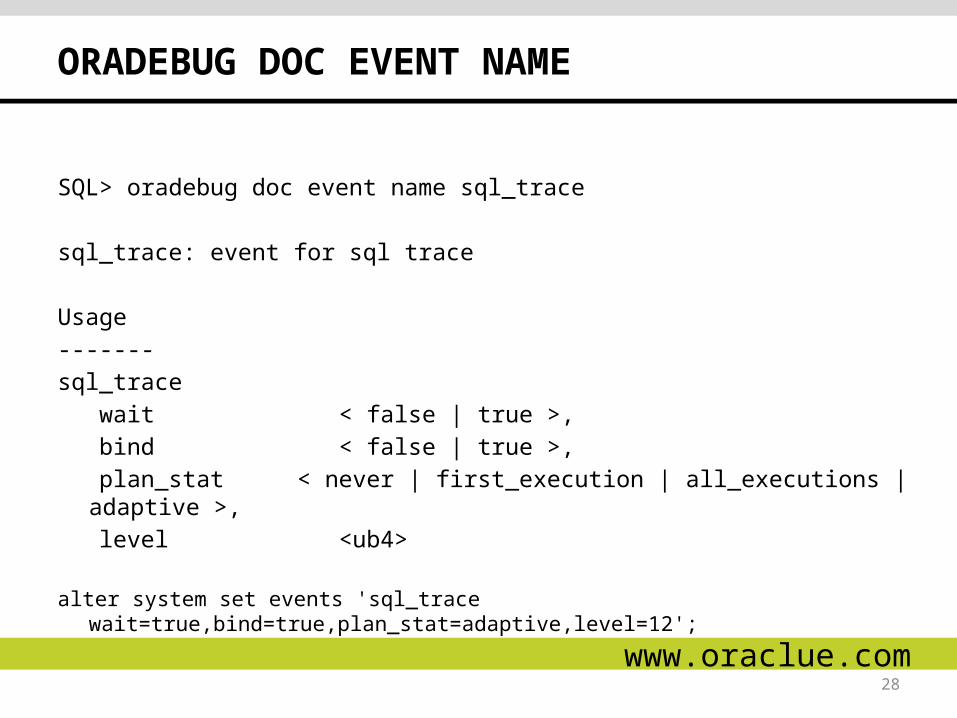
SQL> oradebug doc event name sql_trace
sql_trace: event for sql trace
Usage
-------
sql_trace
wait < false | true >,
bind < false | true >,
plan_stat < never | first_execution | all_executions | adaptive >,
level <ub4>
alter system set events 'sql_trace wait=true,bind=true,plan_stat=adaptive,level=12';
www.oraclue.com
29
ORADEBUG DOC EVENT NAME
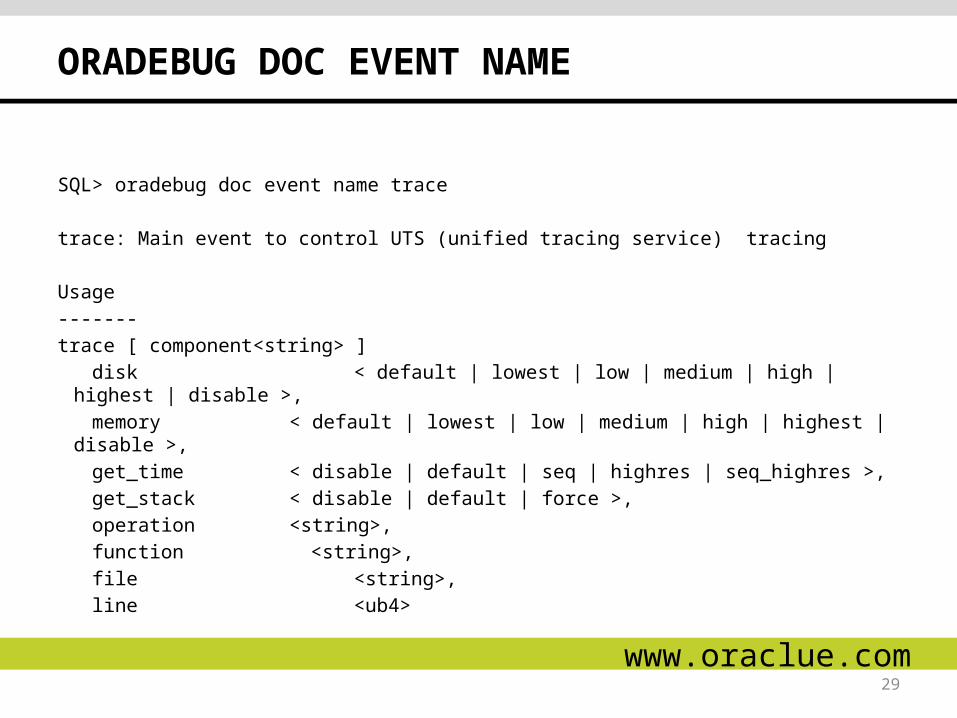
SQL> oradebug doc event name trace
trace: Main event to control UTS (unified tracing service) tracing
Usage
-------
trace [ component<string> ]
disk < default | lowest | low | medium | high | highest | disable >,
memory < default | lowest | low | medium | high | highest | disable >,
get_time < disable | default | seq | highres | seq_highres >,
get_stack < disable | default | force >,
operation <string>,
function <string>,
file <string>,
line <ub4>www.oraclue.com
30
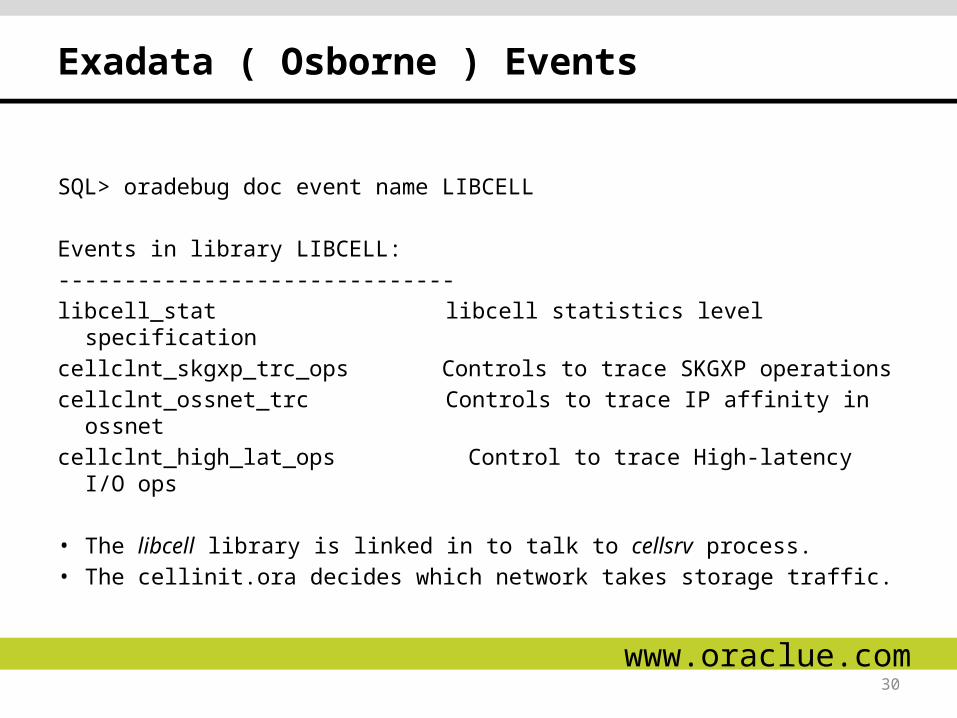
Exadata ( Osborne ) Events
SQL> oradebug doc event name LIBCELL
Events in library LIBCELL:
------------------------------
libcell_stat libcell statistics level specification
cellclnt_skgxp_trc_ops Controls to trace SKGXP operations
cellclnt_ossnet_trc Controls to trace IP affinity in ossnet
cellclnt_high_lat_ops Control to trace High-latency I/O ops
• The libcell library is linked in to talk to cellsrv process. • The cellinit.ora decides which network takes storage traffic.
www.oraclue.com
31
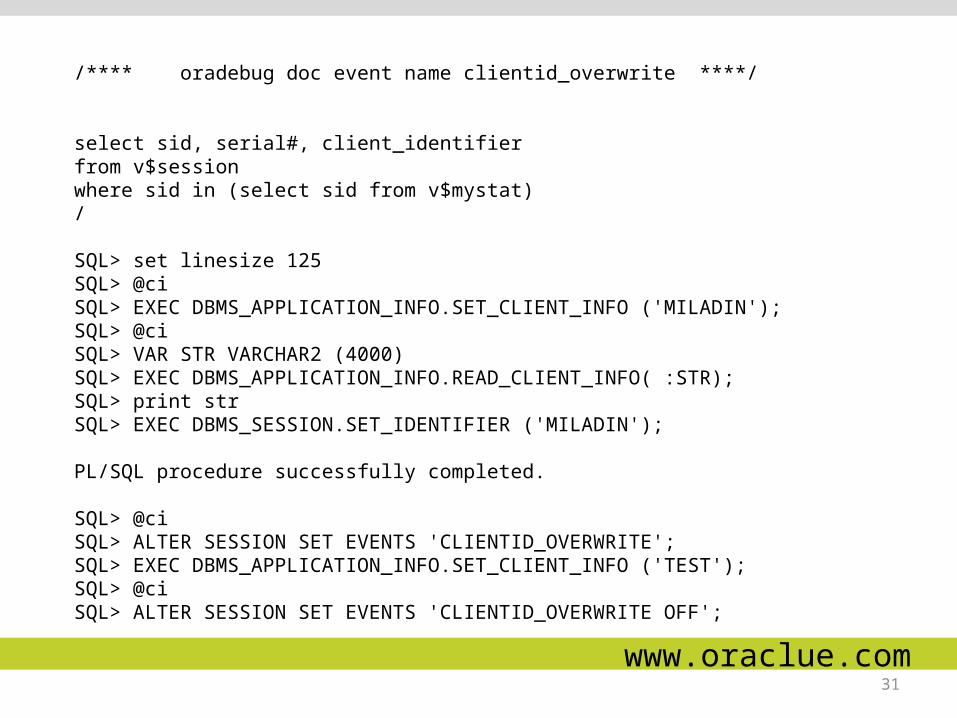
/**** oradebug doc event name clientid_overwrite ****/
select sid, serial#, client_identifierfrom v$sessionwhere sid in (select sid from v$mystat)/
SQL> set linesize 125SQL> @ciSQL> EXEC DBMS_APPLICATION_INFO.SET_CLIENT_INFO ('MILADIN');SQL> @ciSQL> VAR STR VARCHAR2 (4000)SQL> EXEC DBMS_APPLICATION_INFO.READ_CLIENT_INFO( :STR);SQL> print strSQL> EXEC DBMS_SESSION.SET_IDENTIFIER ('MILADIN');
PL/SQL procedure successfully completed.
SQL> @ciSQL> ALTER SESSION SET EVENTS 'CLIENTID_OVERWRITE';SQL> EXEC DBMS_APPLICATION_INFO.SET_CLIENT_INFO ('TEST');SQL> @ciSQL> ALTER SESSION SET EVENTS 'CLIENTID_OVERWRITE OFF'; www.oraclue.com
32
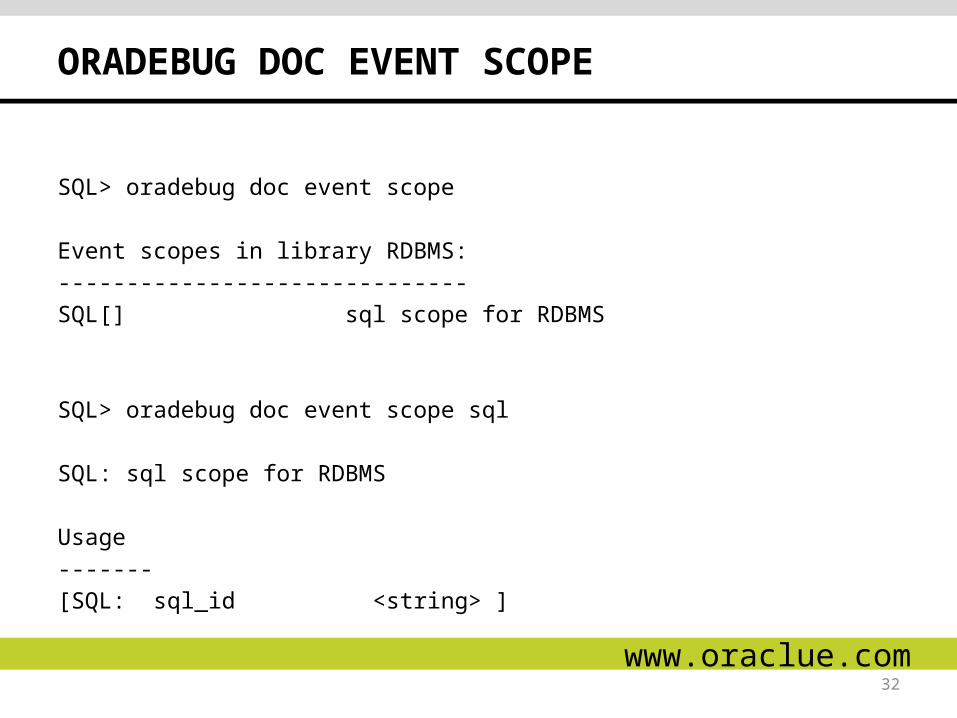
ORADEBUG DOC EVENT SCOPE
SQL> oradebug doc event scope
Event scopes in library RDBMS:
------------------------------
SQL[] sql scope for RDBMS
SQL> oradebug doc event scope sql
SQL: sql scope for RDBMS
Usage
-------
[SQL: sql_id <string> ]
www.oraclue.com
33
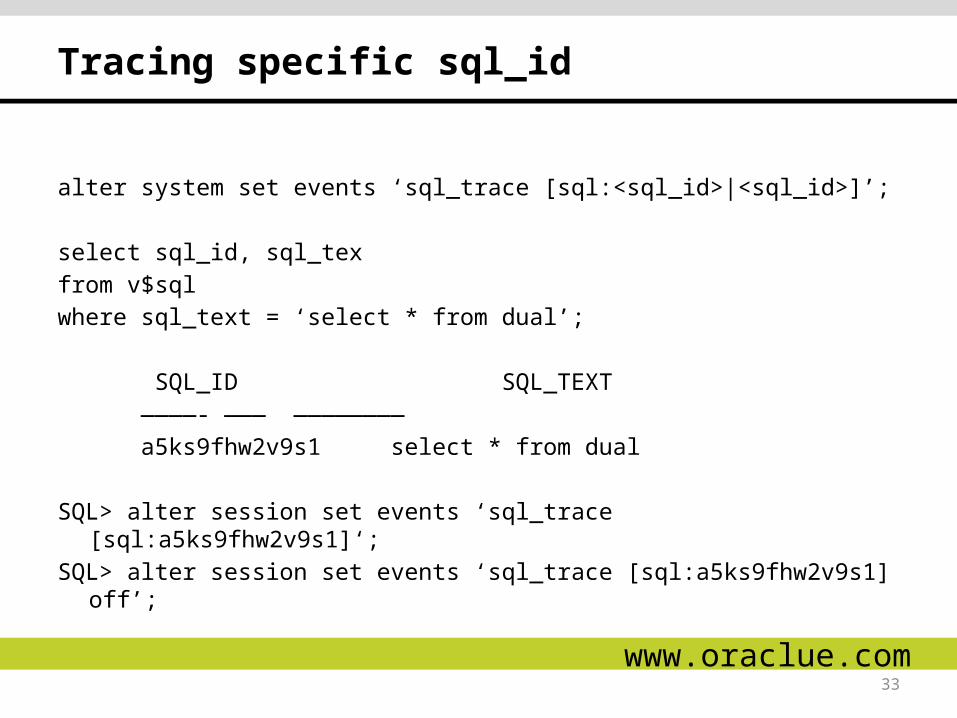
Tracing specific sql_id
alter system set events ‘sql_trace [sql:<sql_id>|<sql_id>]’;
select sql_id, sql_tex
from v$sql
where sql_text = ‘select * from dual’;
SQL_ID SQL_TEXT
————- ——— ————————
a5ks9fhw2v9s1 select * from dual
SQL> alter session set events ‘sql_trace [sql:a5ks9fhw2v9s1]‘;
SQL> alter session set events ‘sql_trace [sql:a5ks9fhw2v9s1] off’;
www.oraclue.com
34
ORADEBUG DOC EVENT FILTER
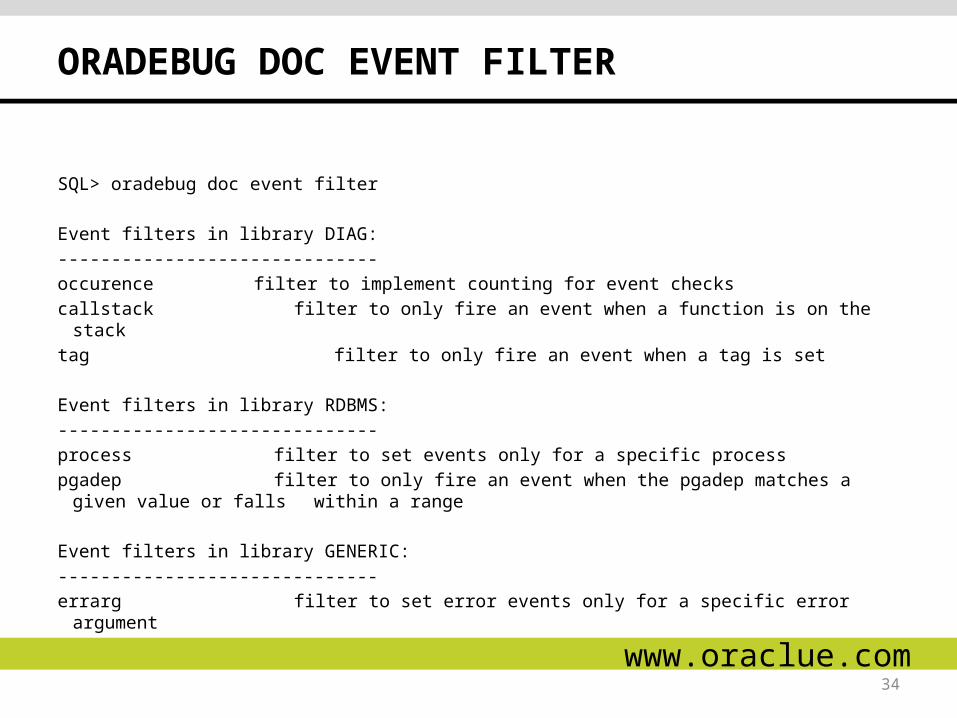
SQL> oradebug doc event filter
Event filters in library DIAG:
------------------------------
occurence filter to implement counting for event checks
callstack filter to only fire an event when a function is on the stack
tag filter to only fire an event when a tag is set
Event filters in library RDBMS:
------------------------------
process filter to set events only for a specific process
pgadep filter to only fire an event when the pgadep matches a given value or falls within a range
Event filters in library GENERIC:
------------------------------
errarg filter to set error events only for a specific error argumentwww.oraclue.com
35
ORADEBUG DOC EVENT FILTER
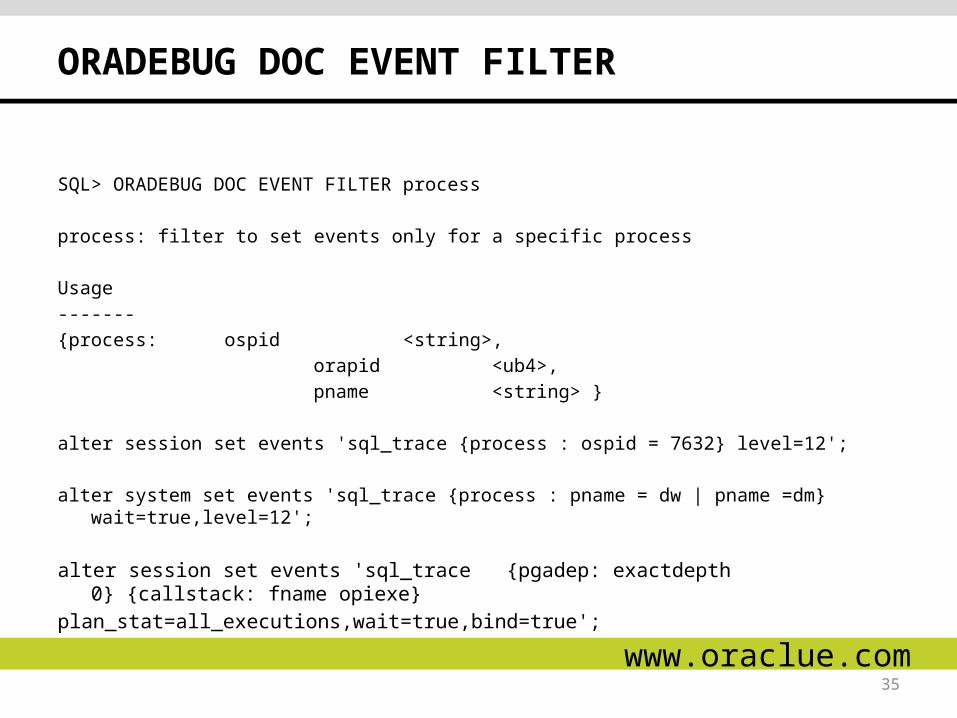
SQL> ORADEBUG DOC EVENT FILTER process
process: filter to set events only for a specific process
Usage
-------
{process: ospid <string>,
orapid <ub4>,
pname <string> }
alter session set events 'sql_trace {process : ospid = 7632} level=12';
alter system set events 'sql_trace {process : pname = dw | pname =dm} wait=true,level=12';
alter session set events 'sql_trace {pgadep: exactdepth 0} {callstack: fname opiexe}
plan_stat=all_executions,wait=true,bind=true';
www.oraclue.com
36
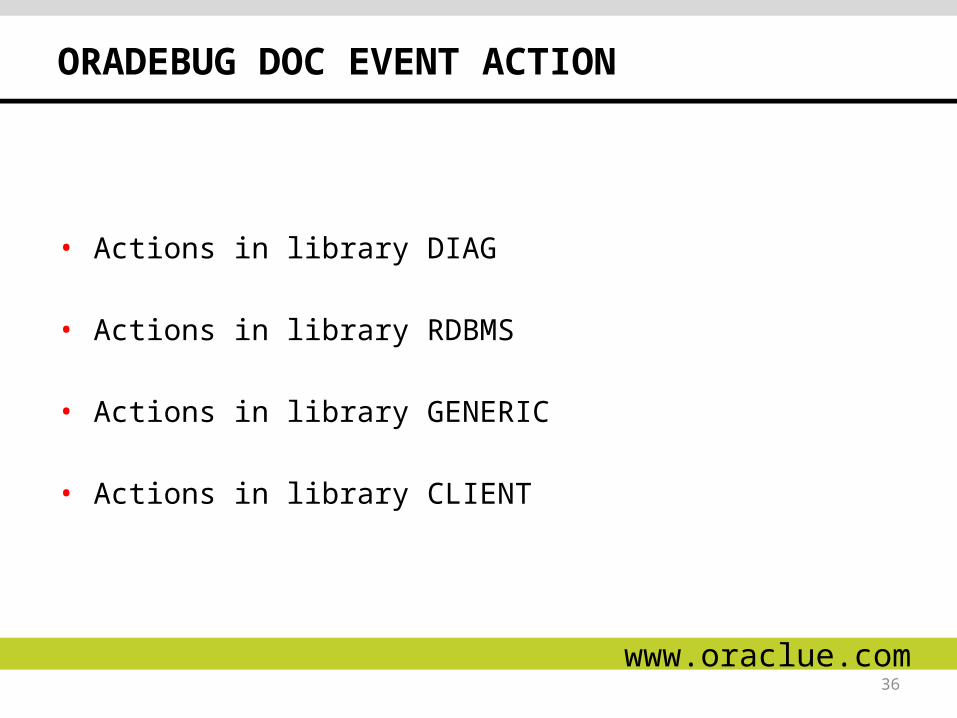
ORADEBUG DOC EVENT ACTION
• Actions in library DIAG
• Actions in library RDBMS
• Actions in library GENERIC
• Actions in library CLIENT
www.oraclue.com
37
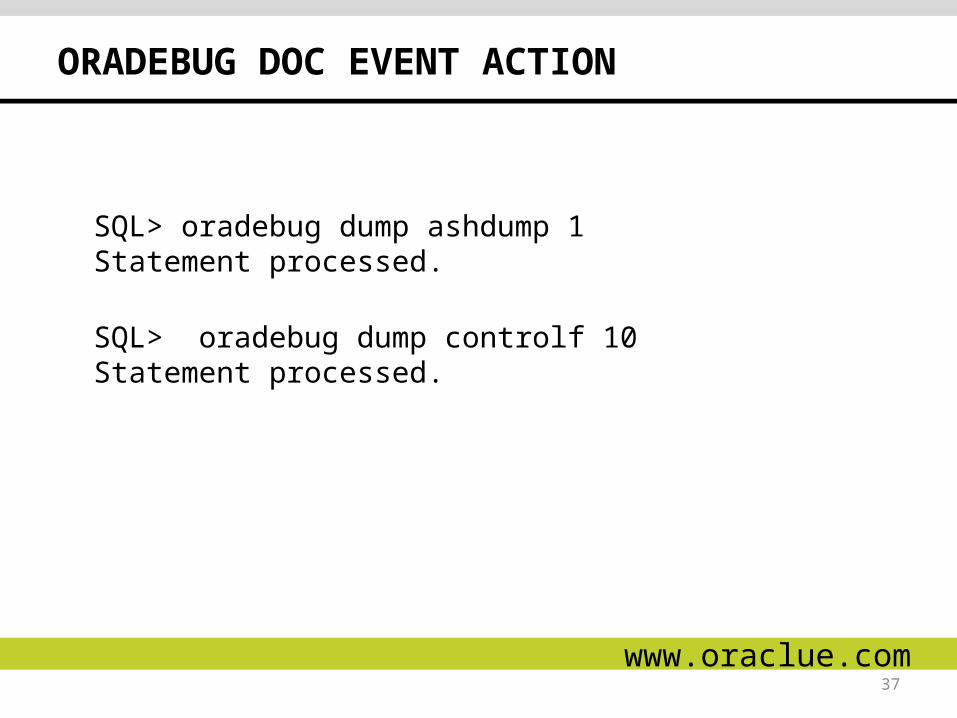
ORADEBUG DOC EVENT ACTION
SQL> oradebug dump ashdump 1Statement processed.
SQL> oradebug dump controlf 10Statement processed.
www.oraclue.com
38
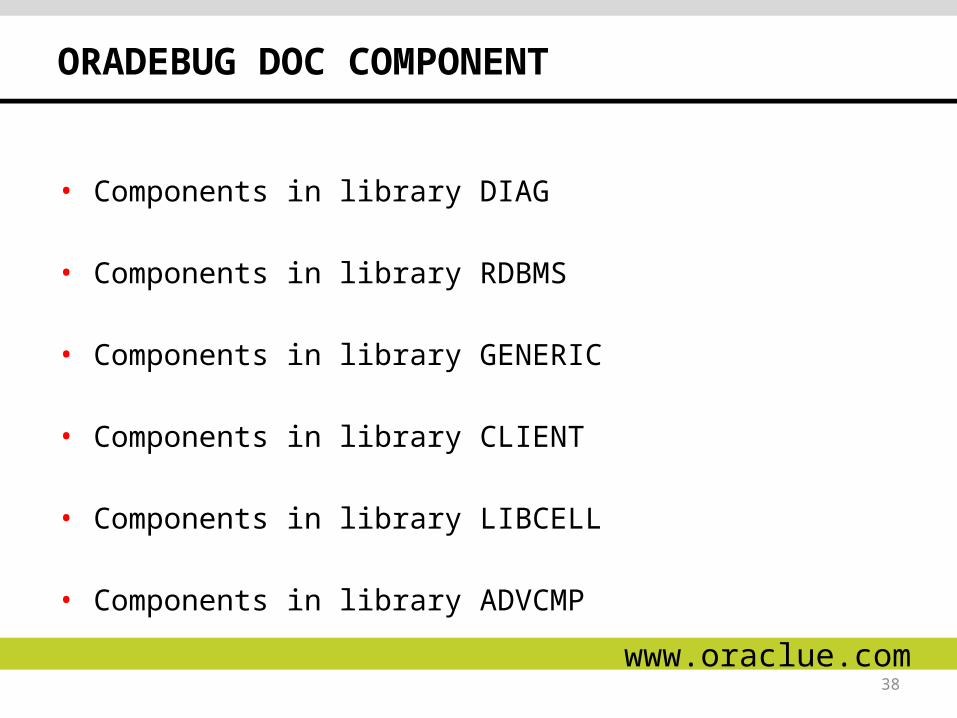
ORADEBUG DOC COMPONENT
• Components in library DIAG
• Components in library RDBMS
• Components in library GENERIC
• Components in library CLIENT
• Components in library LIBCELL
• Components in library ADVCMP
www.oraclue.com

39
SQL> oradebug doc component RDBMS.RAC
RAC Real Application Clusters
GES Global Enqueue Service
GCS Global Cache Service (kjb)
GSIPC Global Enqueue/Cache Service IPC
KSI Kernel Service Instance locking (ksi)
RAC_ENQ Enqueue Operations
RAC_RCFG Reconfiguration
RAC_DRM Dynamic Remastering
RAC_MRDOM Multiple Recovery Domains
CGS Cluster Group Services (kjxg)
CGSIMR Instance Membership Recovery (kjxgr)
DD GES Deadlock Detection
GCS_BSCN Broadcast SCN (kjb, kcrfw)
RAC_WLM Work Load Management (wlm)
RAC_MLMDS RAC Multiple LMS (kjm)
GCS_READMOSTLY GCS Read-mostly (kjb)
GCS_READER_BYPASS GCS Reader Bypass (kjb)
GCS_DELTAPUSH GCS Delta Push (kjb)
SUB-COMPONENT
39
www.oraclue.com
40
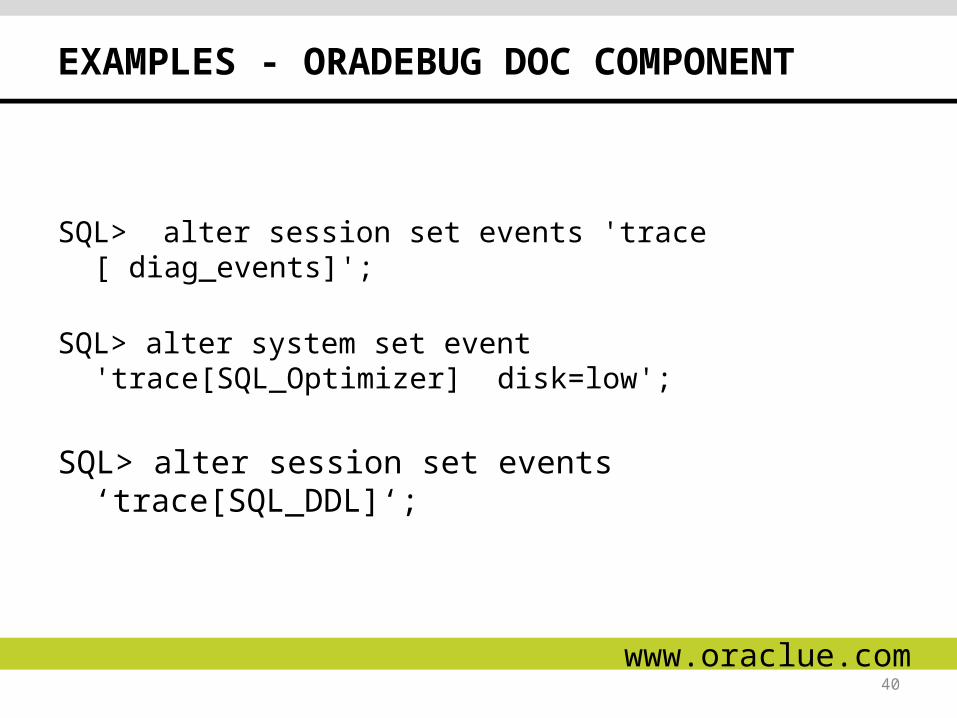
EXAMPLES - ORADEBUG DOC COMPONENT
SQL> alter session set events 'trace [ diag_events]';
SQL> alter system set event 'trace[SQL_Optimizer] disk=low';
SQL> alter session set events ‘trace[SQL_DDL]‘;
www.oraclue.com
41
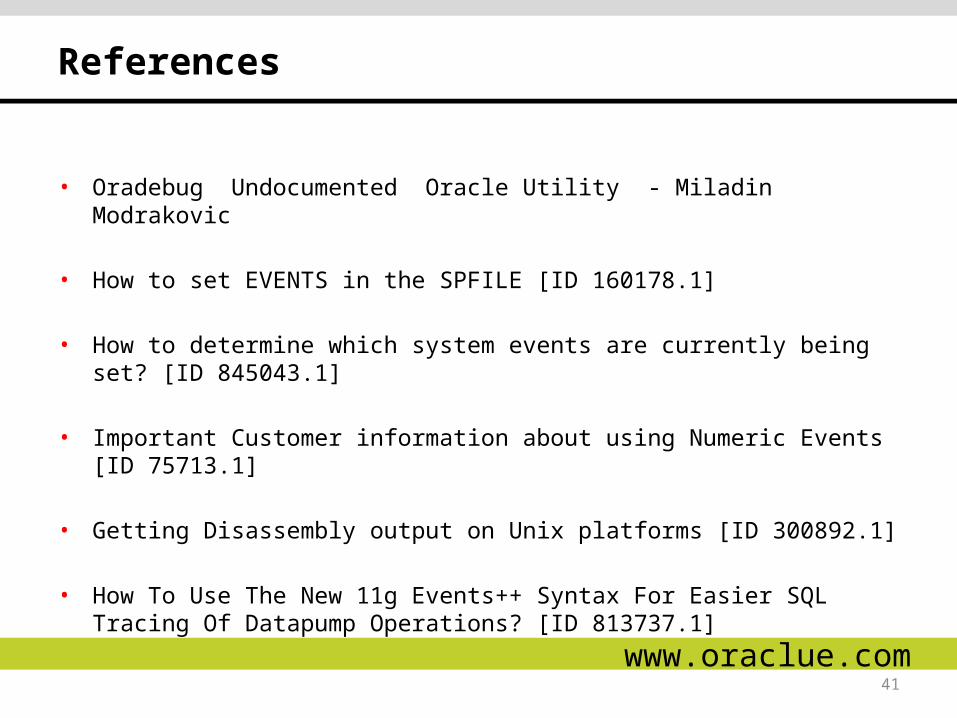
References
• Oradebug Undocumented Oracle Utility - Miladin Modrakovic
• How to set EVENTS in the SPFILE [ID 160178.1]
• How to determine which system events are currently being set? [ID 845043.1]
• Important Customer information about using Numeric Events [ID 75713.1]
• Getting Disassembly output on Unix platforms [ID 300892.1]
• How To Use The New 11g Events++ Syntax For Easier SQL Tracing Of Datapump Operations? [ID 813737.1]
www.oraclue.com
42
Questions & Answers
www.oraclue.com


![[GUNSMITHING] The 12g Pistol](https://img.pdfslide.net/doc/110x75/5529676f550346b52e8b474c/gunsmithing-the-12g-pistol.jpg)