Embed Size (px)
Citation preview

Oracle® Reference ArchitectureManagement and Monitoring
Release 3.0
E16583-03
September 2010
ORA Management and Monitoring, Release 3.0
E16583-03
Copyright © 2010, Oracle and/or its affiliates. All rights reserved.
Primary Author: Stephen G. Bennett
Contributing Authors: Dave Chappelle, Bob Hensle, Anbu Krishnaswamy, Mark Wilkins, Cliff Booth, Jeff McDaniel
Contributor:
Warranty Disclaimer
THIS DOCUMENT AND ALL INFORMATION PROVIDED HEREIN (THE "INFORMATION") IS PROVIDED ON AN "AS IS" BASIS AND FOR GENERAL INFORMATION PURPOSES ONLY. ORACLE EXPRESSLY DISCLAIMS ALL WARRANTIES OF ANY KIND, WHETHER EXPRESS OR IMPLIED, INCLUDING, BUT NOT LIMITED TO, THE IMPLIED WARRANTIES OF MERCHANTABILITY, FITNESS FOR A PARTICULAR PURPOSE AND NON-INFRINGEMENT. ORACLE MAKES NO WARRANTY THAT THE INFORMATION IS ERROR-FREE, ACCURATE OR RELIABLE. ORACLE RESERVES THE RIGHT TO MAKE CHANGES OR UPDATES AT ANY TIME WITHOUT NOTICE.
As individual requirements are dependent upon a number of factors and may vary significantly, you should perform your own tests and evaluations when making technology infrastructure decisions. This document is not part of your license agreement nor can it be incorporated into any contractual agreement with Oracle Corporation or its affiliates. If you find any errors, please report them to us in writing.
Third Party Content, Products, and Services Disclaimer
This document may provide information on content, products, and Services from third parties. Oracle is not responsible for and expressly disclaim all warranties of any kind with respect to third-party content, products, and Services. Oracle will not be responsible for any loss, costs, or damages incurred due to your access to or use of third-party content, products, or Services.
Limitation of Liability
IN NO EVENT SHALL ORACLE BE LIABLE FOR ANY DIRECT, INDIRECT, INCIDENTAL, SPECIAL OR CONSEQUENTIAL DAMAGES, OR DAMAGES FOR LOSS OF PROFITS, REVENUE, DATA OR USE, INCURRED BY YOU OR ANY THIRD PARTY, WHETHER IN AN ACTION IN CONTRACT OR TORT, ARISING FROM YOUR ACCESS TO, OR USE OF, THIS DOCUMENT OR THE INFORMATION.
Oracle is a registered trademark of Oracle Corporation and/or its affiliates. Other names may be trademarks of their respective owners.

iii
Contents
Send Us Your Comments ........................................................................................................................ xi
Preface ............................................................................................................................................................... xiii
Document Purpose.................................................................................................................................... xiiiAudience..................................................................................................................................................... xivDocument Structure .................................................................................................................................. xivHow to Use This Document..................................................................................................................... xivRelated Documents ................................................................................................................................... xivConventions ............................................................................................................................................... xv
1 Introduction
1.1 The Management and Visibility Gap ....................................................................................... 1-11.1.1 On-going Shift to Move to an Agile Shared Service Computing Environment ......... 1-21.1.2 On-going Shift to Manage IT from an End User Experience Perspective ................... 1-31.1.3 Increasing Need to Enforce Regulatory and Corporate Policies .................................. 1-31.1.4 Increasing Number of Heterogeneous IT Infrastructure Components to Manage.... 1-31.1.5 Complex Distributed Environments Require Access to Consolidated Information . 1-4
2 Common Management & Monitoring Standards
2.1 IP Standards................................................................................................................................. 2-12.1.1 Simple Network Management Protocol ........................................................................... 2-12.2 JavaTM Standards......................................................................................................................... 2-2
2.2.1 JavaTM Management Extensions........................................................................................ 2-2
2.2.2 JavaTM EE Management ...................................................................................................... 2-3
2.2.3 JavaTM EE Application Deployment ................................................................................. 2-42.3 Web Services Standards ............................................................................................................. 2-42.3.1 Universal Description Discovery & Integration.............................................................. 2-42.3.2 WS-Policy.............................................................................................................................. 2-42.3.3 WS-PolicyAttachment ......................................................................................................... 2-42.3.4 WS-SecurityPolicy ............................................................................................................... 2-52.3.5 MTOM Serialization Policy Assertion .............................................................................. 2-52.3.6 Web Services Reliable Messaging Policy Assertion........................................................ 2-52.4 Regulatory & Governance Standards ...................................................................................... 2-52.4.1 Information Technology Infrastructure Library ............................................................. 2-5

iv
2.4.2 Control Objectives for Information and Related Technology ....................................... 2-52.4.3 Sarbanes-Oxley..................................................................................................................... 2-62.4.4 Payment Card Industry Data Security Standards........................................................... 2-6
3 Key Management & Monitoring Capabilities
3.1 Service Management .................................................................................................................. 3-13.1.1 Service.................................................................................................................................... 3-23.1.2 System ................................................................................................................................... 3-33.1.3 Infrastructure Component.................................................................................................. 3-33.2 Performance Management......................................................................................................... 3-53.3 Lifecycle Management ............................................................................................................... 3-63.4 Configuration Management ...................................................................................................... 3-73.5 Policy Management .................................................................................................................... 3-93.5.1 Policy ..................................................................................................................................... 3-93.6 Administration & Monitoring................................................................................................ 3-103.6.1 Group.................................................................................................................................. 3-113.6.2 Job........................................................................................................................................ 3-113.6.3 Metric.................................................................................................................................. 3-123.6.4 Threshold ........................................................................................................................... 3-123.6.5 Corrective Actions ............................................................................................................ 3-12
4 Conceptual View
4.1 Architecture Principles............................................................................................................... 4-14.2 Unified Management & Monitoring Framework................................................................... 4-34.3 User Interaction........................................................................................................................... 4-64.3.1 Administration ..................................................................................................................... 4-64.3.2 Dashboard............................................................................................................................. 4-64.3.3 Troubleshooting & Diagnostic Analysis........................................................................... 4-64.3.4 Query ..................................................................................................................................... 4-64.3.5 Reporting .............................................................................................................................. 4-74.3.6 Topology Viewer ................................................................................................................. 4-74.4 Management ................................................................................................................................ 4-74.4.1 Alert & Notification Management..................................................................................... 4-74.4.2 Configuration Reconciliation ............................................................................................. 4-74.4.3 Group Management ............................................................................................................ 4-84.4.4 Job Management .................................................................................................................. 4-84.4.5 Corrective Action Management......................................................................................... 4-84.4.6 Service Definition................................................................................................................. 4-84.4.7 Patch Management .............................................................................................................. 4-94.4.8 Policy Authoring.................................................................................................................. 4-94.4.9 Policy Enforcement.............................................................................................................. 4-94.4.10 Provision Management ....................................................................................................... 4-94.4.11 Service Level Authoring .................................................................................................. 4-104.5 Monitoring ................................................................................................................................ 4-104.5.1 Service Level Monitoring................................................................................................. 4-104.5.2 Log Monitoring ................................................................................................................. 4-104.5.3 Resource Monitoring........................................................................................................ 4-10

v
4.5.4 Transaction Monitoring ................................................................................................... 4-114.5.5 Patch Monitoring .............................................................................................................. 4-114.5.6 Environment Analysis...................................................................................................... 4-114.5.7 Configuration Change Detection.................................................................................... 4-114.5.8 Policy Violation Detection ............................................................................................... 4-124.5.9 User Experience Monitoring ........................................................................................... 4-124.5.10 System Monitoring ........................................................................................................... 4-124.6 Integration................................................................................................................................. 4-124.6.1 Alert & Notification Integration ..................................................................................... 4-124.6.2 Extensibility Framework.................................................................................................. 4-134.6.3 Data Exchange................................................................................................................... 4-134.7 Management Repository......................................................................................................... 4-134.7.1 Monitoring Templates...................................................................................................... 4-134.7.2 Job Library ......................................................................................................................... 4-134.7.3 Software Library ............................................................................................................... 4-134.7.4 Policy Library .................................................................................................................... 4-144.7.5 Service Level Rules ........................................................................................................... 4-144.7.6 Corrective Action.............................................................................................................. 4-144.7.7 Historical Monitoring Data ............................................................................................. 4-144.7.8 Deployment Procedures .................................................................................................. 4-144.7.9 Reports................................................................................................................................ 4-144.7.10 Configurations................................................................................................................... 4-14
5 Logical View
5.1 Logical Tiers................................................................................................................................. 5-15.1.1 Client Tier ............................................................................................................................. 5-15.1.2 Management Tier................................................................................................................. 5-25.1.3 Managed Target Tier ........................................................................................................... 5-25.2 Detailed Logical View ................................................................................................................ 5-25.2.1 Managed Target Tier ........................................................................................................... 5-45.2.1.1 Collection Manager, Collection Engine..................................................................... 5-45.2.1.2 Job Executor................................................................................................................... 5-65.2.2 Management Tier................................................................................................................. 5-65.2.2.1 Resource Monitor ......................................................................................................... 5-65.2.2.2 Service Monitor............................................................................................................. 5-65.2.2.3 System Monitor............................................................................................................. 5-75.2.2.4 Composite Application Monitor ................................................................................ 5-75.2.2.5 End User Experience Monitor..................................................................................... 5-75.2.2.6 Configuration Change Monitor.................................................................................. 5-75.2.2.7 Alert Manager ............................................................................................................... 5-85.2.2.8 Job System...................................................................................................................... 5-85.2.2.9 Provisioning Engine ..................................................................................................... 5-8
6 Product Mapping
6.1 Products........................................................................................................................................ 6-16.2 Product Mapping ........................................................................................................................ 6-2

vi
6.3 Product Information ................................................................................................................... 6-3
7 Deployment View
7.1 Client Tier..................................................................................................................................... 7-27.2 Management Tier ........................................................................................................................ 7-27.3 Managed Target Tier .................................................................................................................. 7-3
8 Summary

vii

viii
List of Figures
1–1 Management and Visibility Gap............................................................................................... 1-22–1 Management & Monitoring Standards.................................................................................... 2-12–2 Basic SNMP Messaging.............................................................................................................. 2-22–3 JMX Architecture......................................................................................................................... 2-33–1 Key Capabilities for a Unified Management Infrastructure ................................................. 3-13–2 Service Management Phases ..................................................................................................... 3-23–3 Concept: Service .......................................................................................................................... 3-23–4 Infrastructure Components mapped to a Service ................................................................. 3-43–5 Performance and Availability Testing ..................................................................................... 3-53–6 Lifecycle Management Lifecycle............................................................................................... 3-73–7 Configuration Management Lifecycle ..................................................................................... 3-83–8 Policy Management Lifecycle.................................................................................................... 3-93–9 Policy Types.............................................................................................................................. 3-103–10 Concept: Group ........................................................................................................................ 3-113–11 Concept: Metric ........................................................................................................................ 3-124–1 High-level Conceptual View ..................................................................................................... 4-44–2 Detailed Conceptual View......................................................................................................... 4-55–1 Logical Tiers................................................................................................................................. 5-15–2 Logical View ................................................................................................................................ 5-35–3 Capabilities by Tiers ................................................................................................................... 5-46–1 Product Mapping ........................................................................................................................ 6-37–1 Deployment View ....................................................................................................................... 7-2

ix
List of Tables
2–1 PCI DSS Requirements.............................................................................................................. 2-65–1 Example Collectors .................................................................................................................... 5-56–1 Product List................................................................................................................................. 6-1

x
xi
Send Us Your Comments
ORA Management and Monitoring, Release 3.0
E16583-03
Oracle welcomes your comments and suggestions on the quality and usefulness of this publication. Your input is an important part of the information used for revision.
■ Did you find any errors?
■ Is the information clearly presented?
■ Do you need more information? If so, where?
■ Are the examples correct? Do you need more examples?
■ What features did you like most about this document?
If you find any errors or have any other suggestions for improvement, please indicate the title and part number of the documentation and the chapter, section, and page number (if available). You can send comments to us at [email protected].

xii
xiii
Preface
Some of the most talked about concerns within IT operations today involve the need to make enterprise computing more ubiquitous, agile, and the requirement to better align/support the needs of the business
Many IT organizations currently use a variety of traditional IT management and monitoring tools, such as event managers, network managers and help desk systems, to monitor and manage their IT environment. However, as companies deploy emerging computing strategies such as Service-Oriented Architectures (SOA), Business Process Management (BPM), and Cloud Computing, which are designed to make functions, processes, information, and computing resources more available, the inadequacies of these traditional tools are being highlighted..
Traditionally, different stakeholders within an IT organization have used different siloed IT management and monitoring tools, which have lent themselves to a more bottom-up approach to IT management whereby the focus has been on the status of individual low level infrastructure components. Coupled with the fact that these emerging computing strategies represent an on-going shift to move from locked down, siloed monolithic applications to highly distributed and shared computing environments, makes the management and monitoring of the modern IT environment more challenging and complex.
This shift in the IT environment increases the need to make holistic IT operational decisions, perform root cause analysis, share information between the various stakeholders, and manage IT with the end-user experience in mind.
There is a need to supplement an enterprise's existing bottom-up approach and tooling with a more business aligned top-down approach and tooling that enables a more holistic and managed dependency approach of the entire IT environment, which facilitates improved information sharing, superior diagnostics and root cause analysis, and the realization of service level management.
Document PurposeThis document provides a reference architecture for designing a management and monitoring framework to address the needs for the modern IT environment. This document does not cover the more traditional aspects of IT management and monitoring such as database and network management but covers key areas that should be considered when supplementing an existing management and monitoring approach.

xiv
AudienceThis document is intended for IT Operation architects, administrators and enterprise architects. The material is designed for a technical audience that is interested in learning about the intricacies of management and monitoring and how infrastructure can be leveraged to satisfy the management and monitoring needs. In-depth knowledge or specific expertise in management and monitoring fundamentals is not required.
Document StructureThis document is organized into chapters that introduce management and monitoring concepts, standards, and architecture views.
The first chapter provides a background into management and monitoring and is intended to give the novice reader an understanding into the needs and challenges of a modern IT environment.
The next two chapters provide a primer on key management and monitoring capabilities and common industry management and monitoring standards. These chapters are intended to give the novice reader an understanding of key concepts for a management and monitoring framework.
The remaining chapters describe a reference architecture for a management and monitoring framework. The framework is presented using a set of common viewpoints which include conceptual, logical, and deployment views. The architecture is also mapped to Oracle products.
How to Use This DocumentThis document is designed to be read from beginning to end. Those that are already familiar with management and monitoring concepts and standards may wish to skip the initial chapters and proceed with the reference architecture definition that begins with Chapter 4, "Conceptual View".
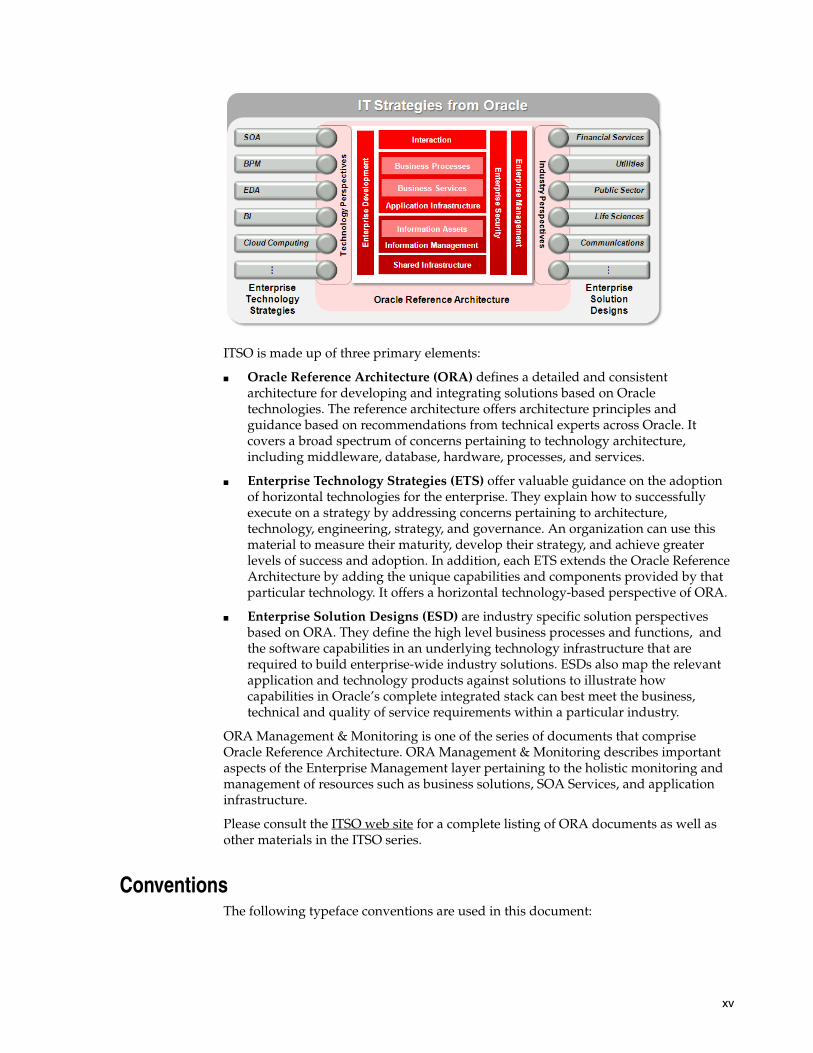
Related DocumentsIT Strategies from Oracle (ITSO) is a series of documentation and supporting collateral designed to enable organizations to develop an architecture-centric approach to enterprise-class IT initiatives. ITSO presents successful technology strategies and solution designs by defining universally adopted architecture concepts, principles, guidelines, standards, and patterns.
xv
ITSO is made up of three primary elements:
■ Oracle Reference Architecture (ORA) defines a detailed and consistent architecture for developing and integrating solutions based on Oracle technologies. The reference architecture offers architecture principles and guidance based on recommendations from technical experts across Oracle. It covers a broad spectrum of concerns pertaining to technology architecture, including middleware, database, hardware, processes, and services.
■ Enterprise Technology Strategies (ETS) offer valuable guidance on the adoption of horizontal technologies for the enterprise. They explain how to successfully execute on a strategy by addressing concerns pertaining to architecture, technology, engineering, strategy, and governance. An organization can use this material to measure their maturity, develop their strategy, and achieve greater levels of success and adoption. In addition, each ETS extends the Oracle Reference Architecture by adding the unique capabilities and components provided by that particular technology. It offers a horizontal technology-based perspective of ORA.
■ Enterprise Solution Designs (ESD) are industry specific solution perspectives based on ORA. They define the high level business processes and functions, and the software capabilities in an underlying technology infrastructure that are required to build enterprise-wide industry solutions. ESDs also map the relevant application and technology products against solutions to illustrate how capabilities in Oracle’s complete integrated stack can best meet the business, technical and quality of service requirements within a particular industry.
ORA Management & Monitoring is one of the series of documents that comprise Oracle Reference Architecture. ORA Management & Monitoring describes important aspects of the Enterprise Management layer pertaining to the holistic monitoring and management of resources such as business solutions, SOA Services, and application infrastructure.
Please consult the ITSO web site for a complete listing of ORA documents as well as other materials in the ITSO series.
ConventionsThe following typeface conventions are used in this document:
xvi
Convention Meaning
boldface text Boldface type in text indicates a term defined in the text, the ORA Master Glossary, or in both locations.
italic text Italics type in text indicates the name of a document or external reference.
underline text Underline text indicates a hypertext link.

1
Introduction 1-1
1Introduction
A common thread running through many services, and systems is the ability to monitor and manage assets in a consistent and efficient manner. This ORA Monitoring and Management document offers a framework for OA&M to rationalize these capabilities and help optimize the operational aspects of enterprise computing.
This chapter introduces and provides a background into the key drivers pushing IT operations to consider evolving their current IT management and monitoring environment. These drivers are influenced by organizations adopting enterprise technology strategies such as SOA, BPM, and EDA, which warrant new management capabilities. Therefore this chapter does not cover traditional management and monitoring capabilities such as network management, etc.
1.1 The Management and Visibility GapMany companies today are deploying enterprise technology strategies (ETS) such as Service-Oriented Architectures (SOA), Business Process Management (BPM), and Cloud Computing, which are designed to make functions, processes, information, and computing resources more available. While these ETSs offer additional benefits and sophistication, they have created a management and visibility gap between the traditionally monitored IT infrastructure resources and the services that contribute to the overall experience encountered by the end user. Examples of this management and visibility gap are described in the following sections. See Figure 1–1, "Management and Visibility Gap".

The Management and Visibility Gap
1-2 ORA Management and Monitoring
Figure 1–1 Management and Visibility Gap
1.1.1 On-going Shift to Move to an Agile Shared Service Computing EnvironmentThe enterprise technology strategies being deployed by many enterprises today represent an on-going shift to move from locked down, siloed, monolithic applications to highly distributed and shared services computing environments, that makes the management and monitoring of the modern IT environment more challenging and complex. IT organizations facing an increased demand for services and composite applications require a shift in system diagnostics and the approach to the monitoring of services. The architecture and runtime environments for these new services require a management and monitoring framework to cope with a more dynamic and escalating technologically complex environment.
Conventional tools tend to focus and produce metrics on individual resources which is inadequate for an agile shared services computing environment. For example, a more conventional approach produces metrics that measure invocations and the average response time of various methods in the shared component, but the counts for method invocation and average response times are polluted, because they capture the combined behavior of several components interacting with the shared component. In other words, these metrics represent the performance of the shared component in the context of multiple composite applications; they do not capture the performance of the shared component for any single application. The knock on effect of this approach to monitoring is that it is impossible to set service levels and thresholds because there is no specific way to break out measurements of the shared component by a specific service context.
Therefore there is a management and visibility gap within conventional tools that do not fully understand the relationship and interactions between components, which affects the IT organization's ability to perform monitoring, diagnostic analysis and to manage service levels. The architecture and runtime environments for these new services require a management and monitoring framework to cope with a more complex and dynamic relationship environment whereby existing infrastructure assets are tracked, changes are discovered and updated instrumentation is automatic.
The Management and Visibility Gap
Introduction 1-3
1.1.2 On-going Shift to Manage IT from an End User Experience PerspectiveToday's user communities are much larger, more geographically dispersed than ever before, and are continuously connected. Coupled with the increasing importance of services to business delivery it is important that enterprises deliver superior performance and user experience. They need to be able to mitigate lost revenue from frustrated users, reduce support costs by lowering call center volumes, accelerate problem resolution of poorly performing applications, and adapt to changing needs by providing insight into business activity and user preferences.
IT Operation teams are therefore increasingly realizing that the end user experience and business transactions as opposed to servers, network links or other infrastructure elements, should be the focal point of their monitoring and optimization efforts. This is not to say that they should neglect the health of low level resources residing further down in the stack, but rather, that the health of these resources should be evaluated in terms of the contributions they make toward the effective execution of a business transaction and the experience that the end user encounters.
Enterprises today require a consolidated view that must also take into account a business view, whereby business success measurements and IT infrastructure performance are monitored and analyzed.
Conventional management and monitoring tools do not deliver any real insight into what the end-user is experiencing. Therefore there is a management and visibility gap within conventional tools that do not fully monitor and manage the end-user experience and associated business transactions, which forces IT operations to adopt a reactive approach to monitoring, diagnostic analysis, and usage intelligence.
1.1.3 Increasing Need to Enforce Regulatory and Corporate PoliciesIT environments today have an increasing need to be in compliance with not only regulatory policies such as Sarbanes-Oxley (SOX) and the Payment Card Industry Data Security Standards (PCI DSS), but also with corporate policies around security, standards, and best practices for provisioning/configuring of hardware, software, and services. Coupled with an ever increasing metadata driven environment, frequently updated polices, and the dynamic nature of services, conventional approaches to compliance management and monitoring can be inadequate.
Many enterprises neglect policy enforcement or rely on manual governance processes to enforce policies within their IT operations. Even enterprises with documented governance processes have found that it is all too easy to become out of compliance by not following the governance process completely.
Overtime the IT environment becomes ineffective and harder to manage and monitor. For example, without managing and monitoring policies which enforce consistency and compatibility across the IT environment, service and server configurations can drift and open themselves up to security vulnerabilities that lead to lack of compliance.
Conventional management and monitoring tools usually do not utilize a system of policy enforcement points, alerts, notifications, and compliance dashboards to enable a proactive approach to compliance management. Therefore there is a management and visibility gap within conventional tools that do not fully support today's compliance needs.
1.1.4 Increasing Number of Heterogeneous IT Infrastructure Components to ManageThe enterprise technology strategies utilized by many enterprises are leading to more and more infrastructure components being deployed which are required to be

The Management and Visibility Gap
1-4 ORA Management and Monitoring
managed and monitored by the IT operations team. The cost of managing large sets of infrastructure components has increased linearly, or more, with each new infrastructure component added to the enterprise. Conventional management and monitoring tools struggle with both cost containment and the pressure to maintain such a large number of infrastructure components.
Administrator productivity has taken a hit as the scale and complexity of the IT environment increases. Administrators are now responsible for far more infrastructure components and the relationships between the infrastructure components are much too complicated to track manually. Firewalls, load-balancers, application servers, service buses, shared services, composite applications, and clusters are all distributed and connected through complex rules.
As businesses rely on IT more and more, they can lose revenue on an hourly basis if their IT infrastructure can not handle the load placed on it by its customers. In addition, infrastructure components are becoming more distributed, complex, and virtual.
Therefore administrators require management and monitoring tools that enable the quick deployment and configuration of resources in both a horizontal and vertical manner whilst detecting and overcoming human error.
Conventional management and monitoring tools do not enable the ability to increase access to resources/services and automatically provision based on the current demand conditions. Therefore there is a management and visibility gap within conventional approaches that do not fully support today's management and provisioning needs.
1.1.5 Complex Distributed Environments Require Access to Consolidated InformationTraditionally, different stakeholders within an IT organization have used different siloed IT management and monitoring tools such as event managers and network managers. This has led to monitoring being performed in a siloed manner, whereby network administrators, database administrators, and host administrators utilize siloed and point solution monitoring and management tools. In addition, these conventional monitoring tools have lent themselves to a more bottom-up approach to IT management where the focus has been on the status of individual low level infrastructure components. These tools only address a portion of the larger need, and focus on the IT infrastructure and not the services and more importantly the user experience.
Infrastructure components have become more dependent on one another, with many of these interdependencies crossing corporate boundaries. Without access to information concerning these dynamic interdependencies, diagnosing and correlating problems in a complex, distributed environment is a huge challenge. In the past there has been a reliance on architects and engineers to reverse-engineer an application to identify the relationship between an individual infrastructure component and the business function/process that it supports. This manual and expensive approach breaks down with rising complexity and a rapid rate of change.
Not having access to the right information and not being able to effectively communicate interdependencies and shared concerns can adversely impact the availability and performance of critical business solutions. Therefore there is a management and visibility gap within conventional approaches that do not fully support today's management and monitoring information needs.

2
Common Management & Monitoring Standards 2-1
2Common Management & MonitoringStandards
This chapter introduces some of the most common management & monitoring standards available today. This is not an exhaustive list of everything that pertains to management & monitoring, but rather a look at many of the most widely adopted standards that support a modern computing environment. The following sections provide a brief overview of each standard.
Figure 2–1 Management & Monitoring Standards
A number of Security standards are also key to an overall management and monitoring framework. For an overview on Security-related standards see ORA Security.
2.1 IP Standards
2.1.1 Simple Network Management ProtocolSimple Network Management Protocol (SNMP) is a well-known and popular protocol for network management. It is utilized for collecting information from and configuring network devices such as servers, printers, hubs, switches, and routers on

JavaTM Standards
2-2 ORA Management and Monitoring
an Internet Protocol (IP) network. An SNMP Manager can be used to monitor network performance, audit network usage, and detect network faults. The SNMP Manager sends information and update requests to SNMP agent devices. A SNMP agent in turn responds with the information requested, and when permission is granted may also configure the device’s configuration. See Figure 2–2, "Basic SNMP Messaging"
Figure 2–2 Basic SNMP Messaging
An SNMP Manager will learn of problems by receiving traps or change notices from network devices implementing SNMP. SNMP uses protocol data units to send information between management applications and agents distributed in the network. This information is in the form of a standard Management Information Base (MIB) which describes all objects that are managed by SNMP management applications. The agents supply or change the values of MIB objects, as requested by the management applications.
More information about SNMP can be found at: http://www.ietf.org/
2.2 JavaTM StandardsThis section includes some common Java standards that relate to a management and monitoring framework.
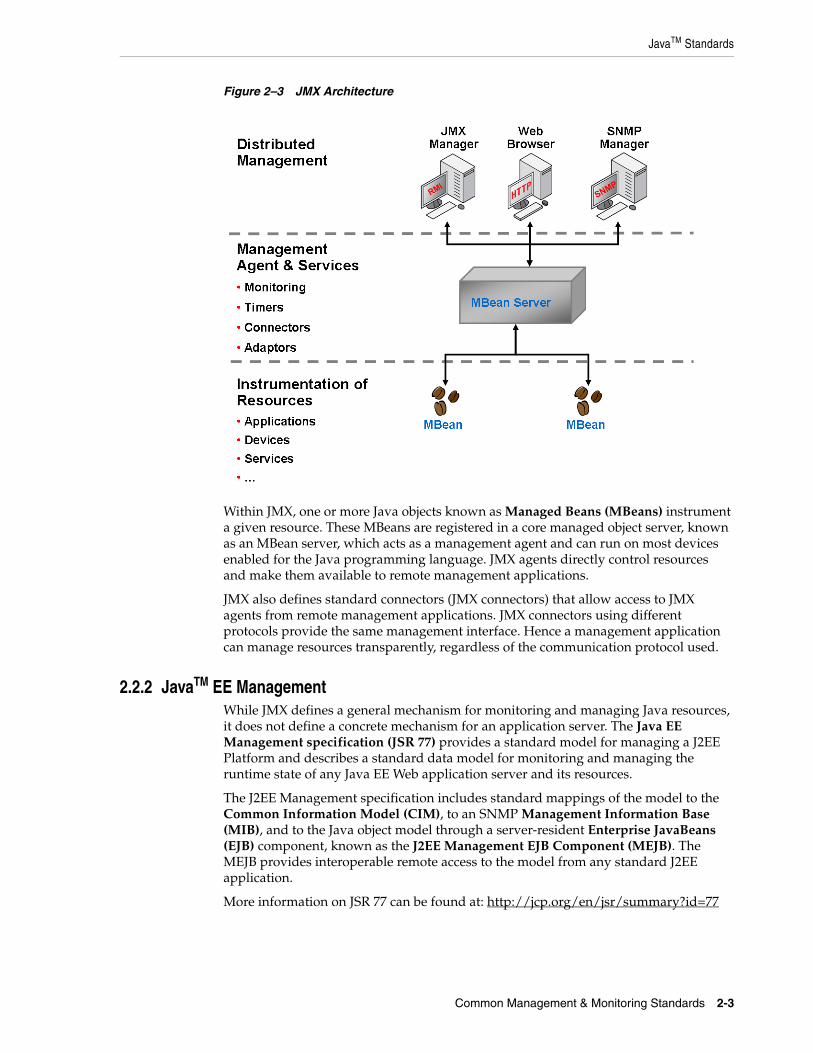
2.2.1 JavaTM Management ExtensionsJava Management Extensions (JMX) is a specification for monitoring and managing Java resources such as applications, JVM, and J2EE resources. It enables a standard generic management system to monitor applications; raise notifications when the application needs attention; and change the state of an application to remedy problems. Because JMX is dynamic, it can be used to monitor and manage resources as they are created, installed, and implemented. See Figure 2–3, "JMX Architecture".
JavaTM Standards
Common Management & Monitoring Standards 2-3
Figure 2–3 JMX Architecture
Within JMX, one or more Java objects known as Managed Beans (MBeans) instrument a given resource. These MBeans are registered in a core managed object server, known as an MBean server, which acts as a management agent and can run on most devices enabled for the Java programming language. JMX agents directly control resources and make them available to remote management applications.
JMX also defines standard connectors (JMX connectors) that allow access to JMX agents from remote management applications. JMX connectors using different protocols provide the same management interface. Hence a management application can manage resources transparently, regardless of the communication protocol used.
2.2.2 JavaTM EE ManagementWhile JMX defines a general mechanism for monitoring and managing Java resources, it does not define a concrete mechanism for an application server. The Java EE Management specification (JSR 77) provides a standard model for managing a J2EE Platform and describes a standard data model for monitoring and managing the runtime state of any Java EE Web application server and its resources.
The J2EE Management specification includes standard mappings of the model to the Common Information Model (CIM), to an SNMP Management Information Base (MIB), and to the Java object model through a server-resident Enterprise JavaBeans (EJB) component, known as the J2EE Management EJB Component (MEJB). The MEJB provides interoperable remote access to the model from any standard J2EE application.
More information on JSR 77 can be found at: http://jcp.org/en/jsr/summary?id=77
Web Services Standards
2-4 ORA Management and Monitoring
2.2.3 JavaTM EE Application DeploymentJSR 88 simplifies deployment and redeployment of J2EE applications by addressing the standardization of the deployment of an assembled application onto an application server by providing standard APIs. The APIs provided can be used by management tools to interact with any compliant server. JSR 88 makes use of JSR 77.
Before JSR 88, proprietary deployment interfaces made deployment cumbersome for companies that hosted heterogeneous J2EE environments, because they had to run the designated deploy tool for a given server. A standard deployment API enables any J2EE application to be deployed by any deployment tool that uses the deployment APIs onto any J2EE compatible environment.
More information on JSR 88 can be found at: http://jcp.org/en/jsr/detail?id=088
2.3 Web Services StandardsThis section includes some common Web Services standards that relate to a management and monitoring framework.
2.3.1 Universal Description Discovery & IntegrationA Universal Description Discovery & Integration (UDDI) registry provides a standards-based foundation for classifying, cataloging, publishing, discovering, and invoking services. In addition a UDDI registry manages information about service providers, service implementations, and service metadata (i.e. security, transport, or quality of service) using arbitrary categorizations.
UDDI enables service configurability and adaptability by using the service-oriented architectural principle of location and transport independence. UDDI defines a universal method for enterprises to dynamically discover and invoke Web Services.
More information on UDDI can be found at http://www.oasis-open.org/committees/uddi-spec/doc/tcspecs.htm#uddiv3
2.3.2 WS-PolicyThe goal of WS-Policy is to provide the mechanisms needed to enable Web Services to specify policy information. It provides a flexible and extensible XML grammar for expressing the capabilities, requirements, and general characteristics of Web Services.
WS-Policy defines a policy to be a collection of policy alternatives, where each policy alternative is a collection of policy assertions. Assertions may pertain to functional capabilities, such as security or protocol requirements, while others may be non-functional, such as QoS characteristics. WS-Policy relies on other specifications, such as WS-PolicyAttachment, to describe discovery and attachment scenarios, and WS-SecurityPolicy - one example of a specific policy definition specification.
More information on WS-Policy can be found at: http://www.w3.org/Submission/WS-Policy/
2.3.3 WS-PolicyAttachmentWS-PolicyAttachment defines two general-purpose mechanisms for associating policies with the subjects to which they apply. They may be defined as part of existing metadata about the subject (e.g., attached to the service definition WSDL), or defined independently and associated through an external binding (e.g., referenced to a UDDI

Regulatory & Governance Standards
Common Management & Monitoring Standards 2-5
entry). As such, the specification describes the use of policies with WSDL 1.1, UDDI 2.0, and UDDI 3.0.
More information on WS-PolicyAttachment can be found at http://www.w3.org/Submission/WS-PolicyAttachment/
2.3.4 WS-SecurityPolicyWS-SecurityPolicy defines a set of security policy assertions for use with the WS-Policy framework with respect to security features provided in WS-Security, WS-Trust, and WS-SecureConversation. It defines a base set of assertions that describe how messages are to be secured. It is meant to be flexible with respect to token types, algorithms, and mechanisms used, in order to allow for evolution over time.
2.3.5 MTOM Serialization Policy AssertionMTOM Serialization Policy Assertion (WS-MTOMPolicy) is a domain-specific policy assertion that indicates endpoint support of the optimized MIME multipart/related serialization of SOAP messages. This policy assertion can be specified within a policy alternative as defined in WS-Policy Framework.
More information on WS-MTOMPolicy can be found at http://www.w3.org/TR/soap12-mtom-policy/
2.3.6 Web Services Reliable Messaging Policy AssertionWeb Services Reliable Messaging Policy Assertion (WS-RM Policy) describes a domain-specific policy assertion for WS-ReliableMessaging that can be specified within a policy alternative as defined in WS-Policy Framework.
More information on WS-RM Policy can be found at http://docs.oasis-open.org/ws-rx/wsrmp/200702
2.4 Regulatory & Governance StandardsThis section includes some common regulatory and management standards encountered as part of an overall management and monitoring framework.
2.4.1 Information Technology Infrastructure LibraryThe Information Technology Infrastructure Library (ITIL) is a set of concepts, best practices, processes, and policies around IT Service Management. Enterprises have recognized that IT Services are crucial, strategic, organizational assets and therefore enterprises must invest appropriate levels of resource into the support, delivery, and management of these critical IT Services and the IT systems that underpin them.
ITIL consists of a series of books giving guidance at each stage of the IT Service lifecycle, from the initial definition and analysis of business requirements in Service Strategy and Service Design, through migration into the live environment within Service Transition, to live operation and improvement in Service Operation and Continual Service Improvement.
More information on ITIL can be found at: http://www.itil-officialsite.com
2.4.2 Control Objectives for Information and Related TechnologyControl Objectives for Information and related Technology (COBIT) is an IT governance framework and supporting toolset that allows managers to bridge the gap

Regulatory & Governance Standards
2-6 ORA Management and Monitoring
between control requirements, technical issues, and business risks. COBIT enables clear policy development and good practice for IT control throughout organizations. COBIT emphasizes regulatory compliance, helps organizations increase the value attained from IT, enables alignment, and simplifies implementation of the COBIT framework.
More information on COBIT can be found at: http://www.isaca.org/
2.4.3 Sarbanes-OxleySarbanes-Oxley (SOX) is a United States federal law as a reaction to a number of major corporate and accounting scandals. The legislation set new or enhanced standards for all U.S. public company boards, management, and public accounting firms.
Sarbanes-Oxley contains 11 titles that describe specific mandates and requirements for financial reporting.
The text of the law can be found at: http://frwebgate.access.gpo.gov/cgibin/getdoc.cgi?dbname=107_cong_bills&docid=f:h3763enr.tst.pdf
2.4.4 Payment Card Industry Data Security StandardsThe Payment Card Industry Data Security Standards (PCI DSS) is a set of security requirements around management, policies, procedures, network architecture, software design, and other critical protective measures. (See Table 2–1, " PCI DSS Requirements").
The standard assists enterprises that process card payments to prevent credit card fraud through increased controls around data and its exposure to compromise. The
Table 2–1 PCI DSS Requirements
Control Objectives PCI DSS Requirements
Build and Maintain a Secure Network
■ Install and maintain a firewall configuration to protect cardholder data
■ Do not use vendor-supplied defaults for system passwords and other security parameters
Protect Cardholder Data ■ Protect stored cardholder data
■ Encrypt transmission of cardholder data across open, public networks
Maintain a Vulnerability Management Program
■ Use and regularly update anti-virus software on all systems commonly affected by malware
■ Develop and maintain secure systems and applications
Implement Strong Access Control Measures
■ Restrict access to cardholder data by business need-to-know
■ Assign a unique ID to each person with computer access
■ Restrict physical access to cardholder data
Regularly Monitor and Test Networks
■ Track and monitor all access to network resources and cardholder data
■ Regularly test security systems and processes
Maintain an Information Security Policy
■ Maintain a policy that addresses information security
Regulatory & Governance Standards
Common Management & Monitoring Standards 2-7
standard applies to all organizations which hold, process, or pass cardholder information from any card branded with the logo of one of the card brands.
Enterprises require a management and monitoring framework that not only assists in implementing these requirements but also monitors and takes corrective actions when necessary when the environment becomes out of compliance.
More information on PCI DSS can be found at: https://www.pcisecuritystandards.org/security_standards/pci_dss.shtml
Regulatory & Governance Standards
2-8 ORA Management and Monitoring
3
Key Management & Monitoring Capabilities 3-1
3Key Management & Monitoring Capabilities
This chapter introduces a number of key concepts and capabilities that pertain to addressing the management and visibility gap when managing within a highly distributed and shared computing environment.
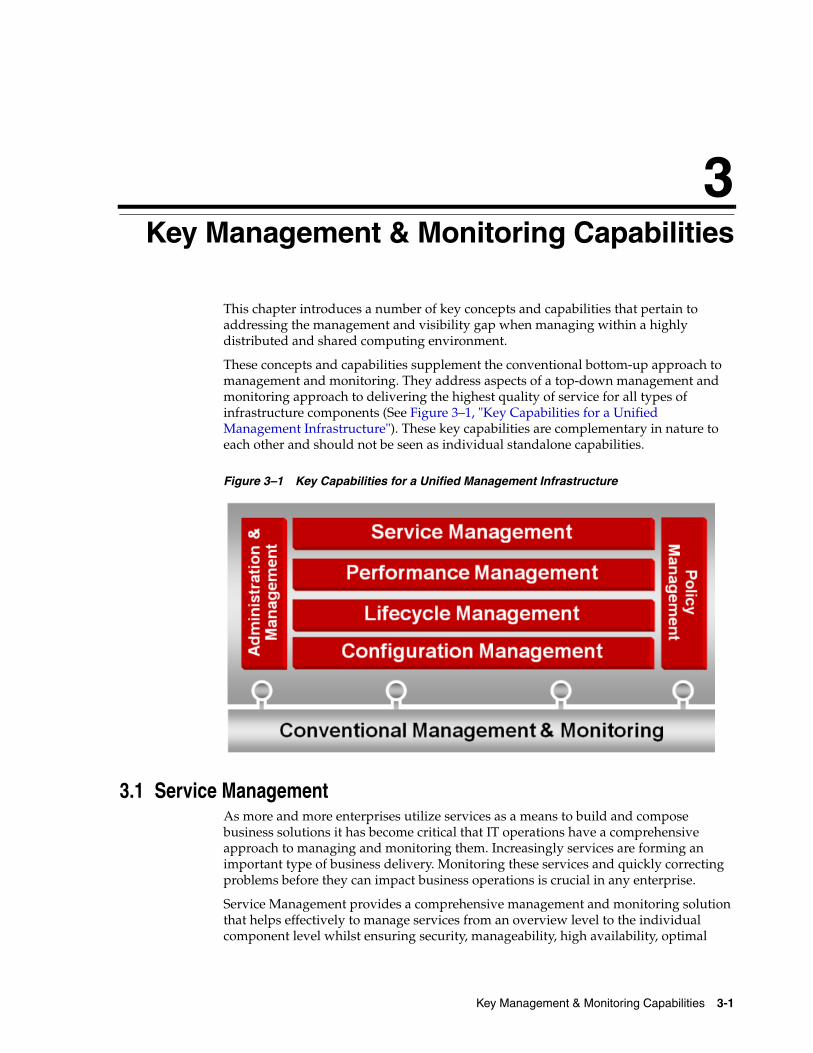
These concepts and capabilities supplement the conventional bottom-up approach to management and monitoring. They address aspects of a top-down management and monitoring approach to delivering the highest quality of service for all types of infrastructure components (See Figure 3–1, "Key Capabilities for a Unified Management Infrastructure"). These key capabilities are complementary in nature to each other and should not be seen as individual standalone capabilities.
Figure 3–1 Key Capabilities for a Unified Management Infrastructure
3.1 Service ManagementAs more and more enterprises utilize services as a means to build and compose business solutions it has become critical that IT operations have a comprehensive approach to managing and monitoring them. Increasingly services are forming an important type of business delivery. Monitoring these services and quickly correcting problems before they can impact business operations is crucial in any enterprise.
Service Management provides a comprehensive management and monitoring solution that helps effectively to manage services from an overview level to the individual component level whilst ensuring security, manageability, high availability, optimal

Service Management
3-2 ORA Management and Monitoring
performance, and service compliance. See Figure 3–2, "Service Management Phases" for the high-level phases of Service Management.
Figure 3–2 Service Management Phases
3.1.1 ServiceIn the context of management and monitoring, a "Service" is a defined entity that exposes a useful business and/or IT function to its consumers.
Figure 3–3 Concept: Service
Figure 3–3, "Concept: Service" above shows some example service types such as SOA Service and Application. In addition, Services can be grouped into higher-level logical Services called Aggregate Services. A Service may have an associated Service Level
Note: The definition of "Service" within the context of management and monitoring is broader in scope than SOA Services (aka shared services). The relationship between these contructs is represented in Figure 3–3, "Concept: Service".
Service Management
Key Management & Monitoring Capabilities 3-3
Agreement (SLA) which establishes the goals for Service levels around availability, performance, and usage.
Service Management enables the definition of the Service which includes the modeling and mapping of the System in which the Service relies on. This Service modeling enables intelligent root cause diagnostics through the entire stack to pinpoint any offending infrastructure component.
3.1.2 SystemA System is a logical grouping of hardware and software infrastructure components that collectively support one or more Services.
3.1.3 Infrastructure ComponentInfrastructure components are individual instances that can be managed and monitored. Example infrastructure components include databases, application servers, web servers, web applications, Linux host computer, and load balancer switches.
See Figure 3–4, "Infrastructure Components mapped to a Service" below for relationship between these concepts.

Service Management
3-4 ORA Management and Monitoring
Figure 3–4 Infrastructure Components mapped to a Service
As well as defining service levels, the underlying infrastructure components may have a number of policies applied against it. Service Management enables the ability to define policies centrally that then propagate to the appropriate enforcement points that govern infrastructure operations. See the Section 3.5, "Policy Management" for more details.
In addition to trend analysis, a key part of Service Management is actively monitoring and reporting service level achievements against goals over a defined period of time. Dashboards provide an accurate measure of the availability, performance, usage, and compliance of the critical business Services which ensures that the line of business executives are getting what they need from IT to ensure the productivity of their people.
In addition, by constantly monitoring the service levels, IT organizations can identify problems and their potential impact, diagnose root causes of Service failure, and fix these in compliance with the service level agreements.
Performance Management
Key Management & Monitoring Capabilities 3-5
3.2 Performance ManagementBecause of the size, complexity, and business criticality of today's enterprise IT operations, the challenge for IT professionals is to be able to maintain the levels of availability and performance required for both Services and infrastructure components in order to ensure that business operations are not impacted. This requires a business context based performance, availability, and usage monitoring approach, whereby a proactive approach to correcting problems is achieved.
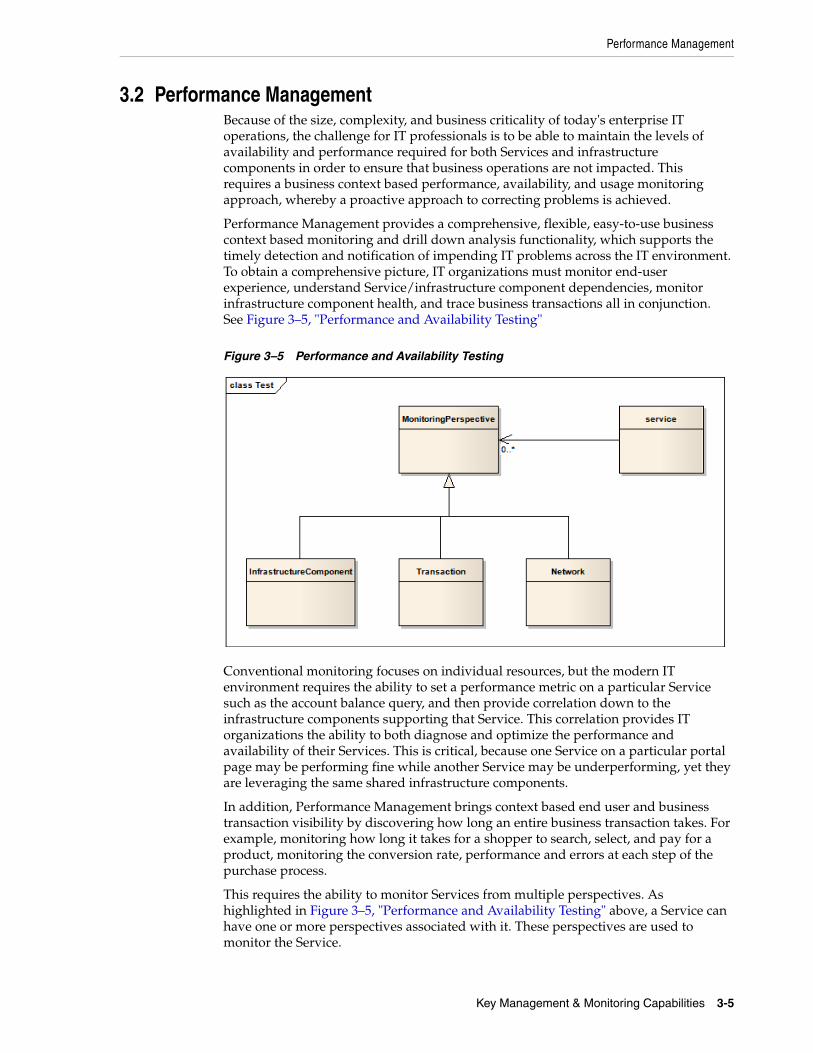
Performance Management provides a comprehensive, flexible, easy-to-use business context based monitoring and drill down analysis functionality, which supports the timely detection and notification of impending IT problems across the IT environment. To obtain a comprehensive picture, IT organizations must monitor end-user experience, understand Service/infrastructure component dependencies, monitor infrastructure component health, and trace business transactions all in conjunction. See Figure 3–5, "Performance and Availability Testing"
Figure 3–5 Performance and Availability Testing
Conventional monitoring focuses on individual resources, but the modern IT environment requires the ability to set a performance metric on a particular Service such as the account balance query, and then provide correlation down to the infrastructure components supporting that Service. This correlation provides IT organizations the ability to both diagnose and optimize the performance and availability of their Services. This is critical, because one Service on a particular portal page may be performing fine while another Service may be underperforming, yet they are leveraging the same shared infrastructure components.
In addition, Performance Management brings context based end user and business transaction visibility by discovering how long an entire business transaction takes. For example, monitoring how long it takes for a shopper to search, select, and pay for a product, monitoring the conversion rate, performance and errors at each step of the purchase process.
This requires the ability to monitor Services from multiple perspectives. As highlighted in Figure 3–5, "Performance and Availability Testing" above, a Service can have one or more perspectives associated with it. These perspectives are used to monitor the Service.
Lifecycle Management
3-6 ORA Management and Monitoring
A transaction perspective is used to test the performance and availability from remote user locations. Important business activities are recorded as transactions, which are then used to test availability and performance of a Service. This enables insight into real end user experienced issues and facilitates working on the resolution before end users start complaining, thus reducing support costs by lowering call center volumes, accelerating problem resolution of poorly performing applications, and adapting to changing needs by providing insight into business activity and user preferences.
A Service can also be monitored by an infrastructure component perspective which focuses on the underlying infrastructure components that support the Service. The infrastructure components that are critical to running a Service are designated as key infrastructure components, which are used to determine the performance and availability of the Service.
Another important perspective is to record every user session and report on real user traffic requested by, and generated from the network. It measures the response times of pages and transactions at the most critical points within the network infrastructure. Powerful session statistics and diagnostics can then be the basis of effective business and operational decisions as well as an aid to perform root-cause analysis.
3.3 Lifecycle ManagementIT operations have long acknowledged the difficulty in deploying and maintaining new software, in provisioning and maintaining new servers with a variety of configurations, and the difficulty in adapting to changes in workload of the environment in a timely and consistent manner. This is especially true in grid computing environments. Grid architectures bring in several benefits to the enterprise but unless managed effectively, those benefits won't be realized. The infrastructure components must be constantly monitored and automatically provisioned based on the current demand conditions. For more details regarding infrastructure virtualization and grid computing refer to the ORA Foundation Infrastructure document.
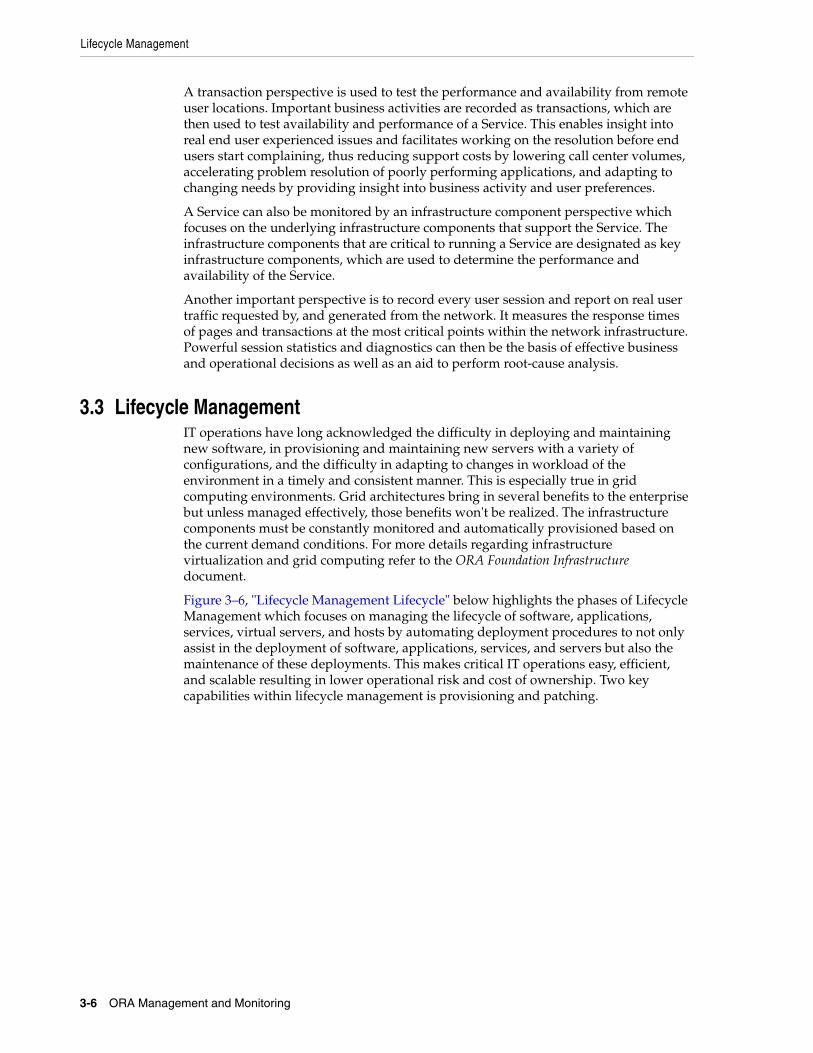
Figure 3–6, "Lifecycle Management Lifecycle" below highlights the phases of Lifecycle Management which focuses on managing the lifecycle of software, applications, services, virtual servers, and hosts by automating deployment procedures to not only assist in the deployment of software, applications, services, and servers but also the maintenance of these deployments. This makes critical IT operations easy, efficient, and scalable resulting in lower operational risk and cost of ownership. Two key capabilities within lifecycle management is provisioning and patching.
Configuration Management
Key Management & Monitoring Capabilities 3-7
Figure 3–6 Lifecycle Management Lifecycle
Provisioning deals with automation of the installation and configuration of operating systems, infrastructure software, applications, services, virtual servers, and hosts across different platforms, environments, and locations.
Patching maintains the software over a period of time and helps keep it updated with the latest features/bug fixes offered by the software vendor. Patches can be one-off patches, interim patches, or critical patch updates. Patch automation enables predictable and reliable patching rollouts where the relevant effected infrastructure components are identified and are analyzed to make sure that the patch can be applied without causing issues to the infrastructure component. This analysis ensures preventive failures rather than destabilizing production infrastructure components by identifying known compatibility issue up front.
Centrally location information forms the foundation for lifecycle management. This enables administrators to store base images in a central library-pre-configured and certified-from which new deployments can be based.
3.4 Configuration ManagementOne of the well-acknowledged problems of IT operations includes the difficulty in managing consistency and compatibility across the entire stack. This can lead to infrastructure component configuration drifts and security vulnerabilities that lead to lack of compliance.
Using configuration management, administrators can rely upon automation to ensure that all infrastructure components are deployed following specified practices and rules. This way, only pre-tested, pre-certified configurations enter the IT environment.

Configuration Management
3-8 ORA Management and Monitoring
Figure 3–7 Configuration Management Lifecycle
Central storage of enterprise configuration information lays the foundation for defining, deploying, auditing, enforcing, and maintaining the infrastructure components. Therefore the first part of any configuration management approach is to understand what infrastructure components are currently available. This aspect of configuration management is quite common to be part of a comprehensive IT asset management strategy.
Apart from understanding what infrastructure components are available, their individual configurations are harvested. In addition to be able to discover infrastructure components and their configuration on demand, it should be possible to perform these tasks automatically.
Within modern IT computing environments the infrastructure components have strong symbiotic relationships which are important to understand and analyze, as they form a critical portion of IT environment. For example undertanding the complex relationships between Services, components and the runtime environment (e.g. JVMs). Without this relationship configuration information it is easy to deploy a configuration and/or patch update that will cause issues without understanding the potential impact it may cause with the other supporting infrastructure components. For example, changing a configuration element of one Weblogic Server which is part of multi-node Weblogic Cluster which inturn may cause Weblogic Cluster Health issues.
Once the infrastructure components have been deployed, it is important that the configurations of these infrastructure components be monitored. Real time detection of updates to the configurations captures what has changed, when it changed, and who changed the configuration. This proactive approach to configuration monitoring enables a full configuration change history.
Any updates to the configuration information can be compared either against a reference configuration set or against previously saved configuration snapshots. Configuration management should reconcile with change management systems to highlight whether the configuration change was authorized or not. This approach enables an administrator to see the drift in configuration and track compliance over time.
Policy Management
Key Management & Monitoring Capabilities 3-9
If an infrastructure component falls out of compliance, administrators can optionally define corrective action to bring them back into compliance. A comprehensive set of compliance reports highlights the infrastructure components that are in and out of compliance and details any deviations. See Section 3.5, "Policy Management" for more details around compliance.
3.5 Policy ManagementTo have your enterprise run efficiently, it must adhere to standards that promote the best practices such as security, configuration, and QoS. Once these standards are developed, you can apply and test for these standards throughout your organization; that is, test for compliance.
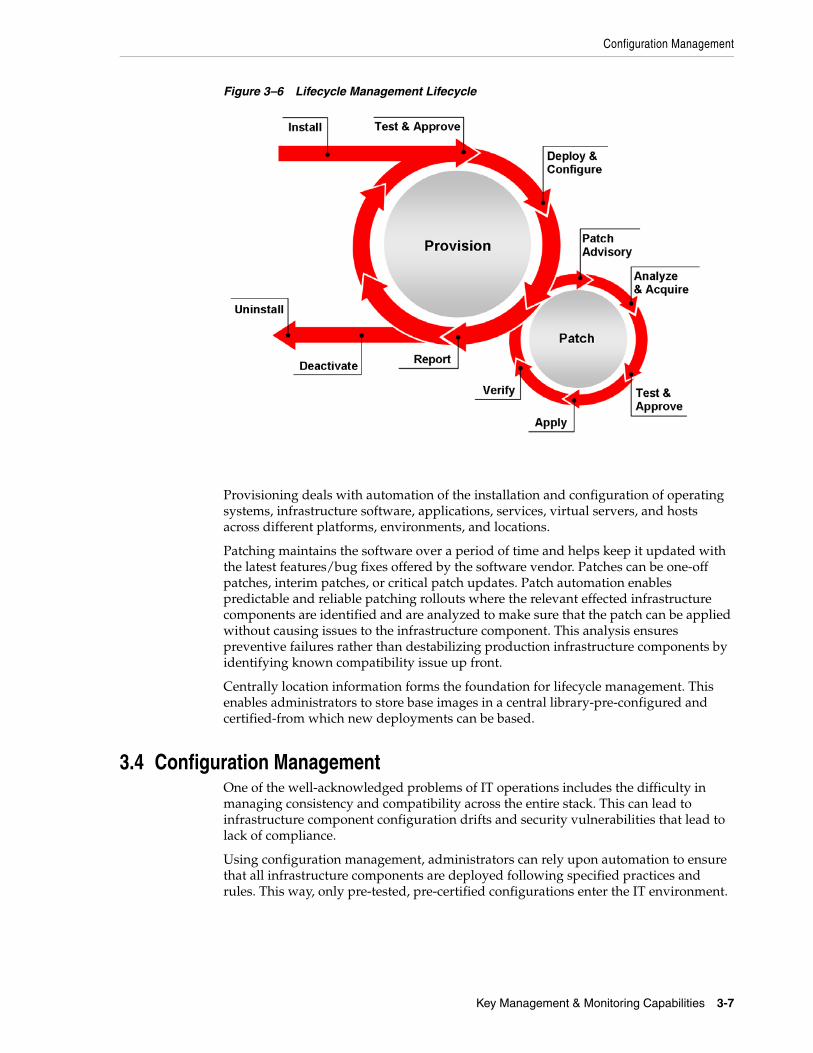
Compliance is part of an overall policy management approach which covers the entire lifecycle and increases the flexibility of the modern IT infrastructure. Policy Management in this context is the demonstration of, and enforcement to, regulatory standards, industry standards, and internal best practices. See Figure 3–8, "Policy Management Lifecycle"
See the ORA Engineering document for more details around policy management at design-time.
Figure 3–8 Policy Management Lifecycle
Conformance is assessed by way of defining policies that provide rules against which managed infrastructure components are evaluated. For example, an identity management solution can provide a mechanism for implementing the user management aspects of a corporate policy, as well as a means to audit users and their access privileges.
3.5.1 PolicyA policy defines the desired behavior and is associated with one or more infrastructure components. Policies include different categories of policies, such as configuration, security, and management rules. (See Figure 3–9, "Policy Types")

Administration & Monitoring
3-10 ORA Management and Monitoring
Figure 3–9 Policy Types
A policy can map and support directly to an industry standard such as SOX, PCI, COBIT, and ITIL, which ensure an IT organization is adhering to the standard.
Policies are distributed to the appropriate policy enforcement points using common approaches such as gateways and agents. These policies are monitored/assessed for compliance and if infrastructure components fall out of compliance, remedial action can bring the infrastructure component back into compliance.
Detailed compliance reporting highlights the infrastructure components that are in and out of compliance and details any deviations. This enables administrators to take action quickly and address the high impact items to improve the compliance score.
3.6 Administration & MonitoringThe increasing number of infrastructure components and the use of grid computing brings many benefits, but unless managed effectively, the benefits that grid computing brings won't be realized. The key in grid management is to have a unified management infrastructure that can monitor and manage all layers of the grid. Rather than utilizing several siloed solutions, a solution that caters for a comprehensive consolidation of the administration and monitoring of Services and infrastructure components as much as possible, e.g. managing more things with fewer administration consoles is required.
This comprehensive and flexible approach to management and monitoring supports the timely detection and notification of impending IT problems across the enterprise, which in turn requires the ability to correlate events across all layers. In addition, being able to ensure performance requires that the infrastructure components are constantly monitored and automatically provisioned based on the current demand conditions.
The large number of infrastructure components to manage and monitor coupled with the need to logically define infrastructure components by geographical locations,
Administration & Monitoring
Key Management & Monitoring Capabilities 3-11
staging areas, security requirements, etc., has highlighted the need to approach management by way of groups and the use of job automation.
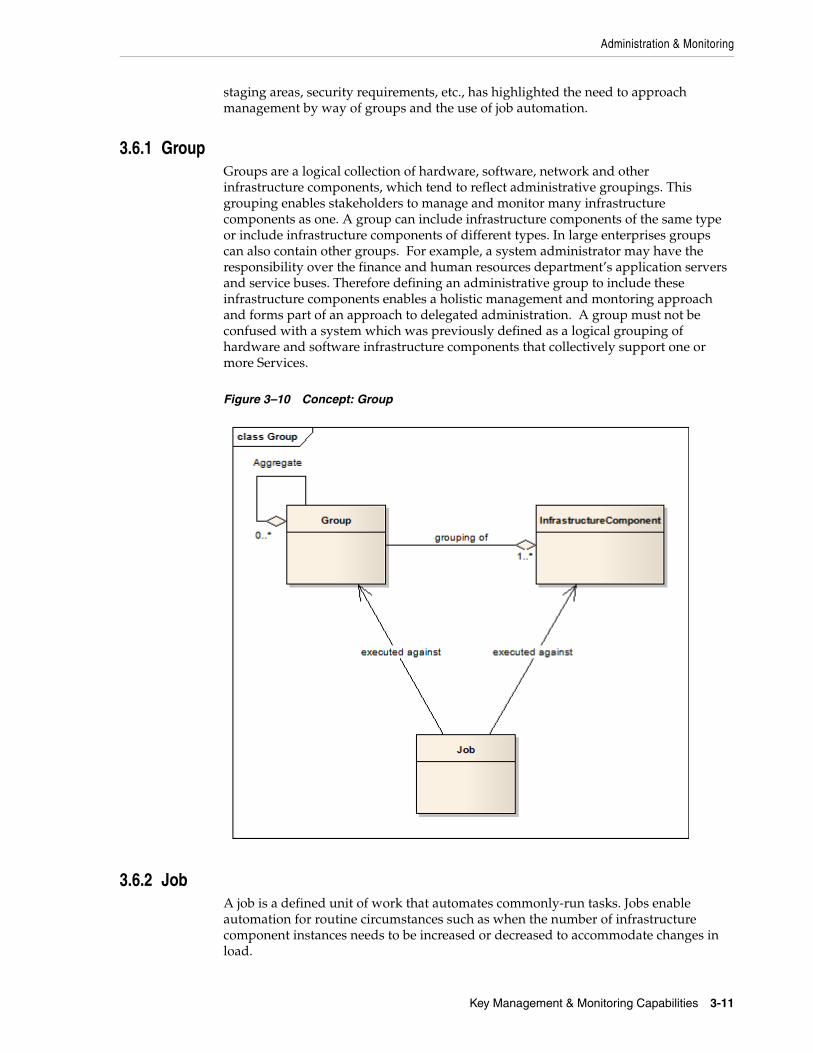
3.6.1 GroupGroups are a logical collection of hardware, software, network and other infrastructure components, which tend to reflect administrative groupings. This grouping enables stakeholders to manage and monitor many infrastructure components as one. A group can include infrastructure components of the same type or include infrastructure components of different types. In large enterprises groups can also contain other groups. For example, a system administrator may have the responsibility over the finance and human resources department’s application servers and service buses. Therefore defining an administrative group to include these infrastructure components enables a holistic management and montoring approach and forms part of an approach to delegated administration. A group must not be confused with a system which was previously defined as a logical grouping of hardware and software infrastructure components that collectively support one or more Services.
Figure 3–10 Concept: Group
3.6.2 JobA job is a defined unit of work that automates commonly-run tasks. Jobs enable automation for routine circumstances such as when the number of infrastructure component instances needs to be increased or decreased to accommodate changes in load.
Administration & Monitoring
3-12 ORA Management and Monitoring
Jobs can be scheduled to start immediately or start at a later date and time and can be submitted to individual targets or against a group. Any job that is submitted to a group is automatically extended to all its members and takes into account the membership of the group as it changes. Having a single console as a central point of control and the use of Groups allows administrators to perform common administrative and monitoring tasks.
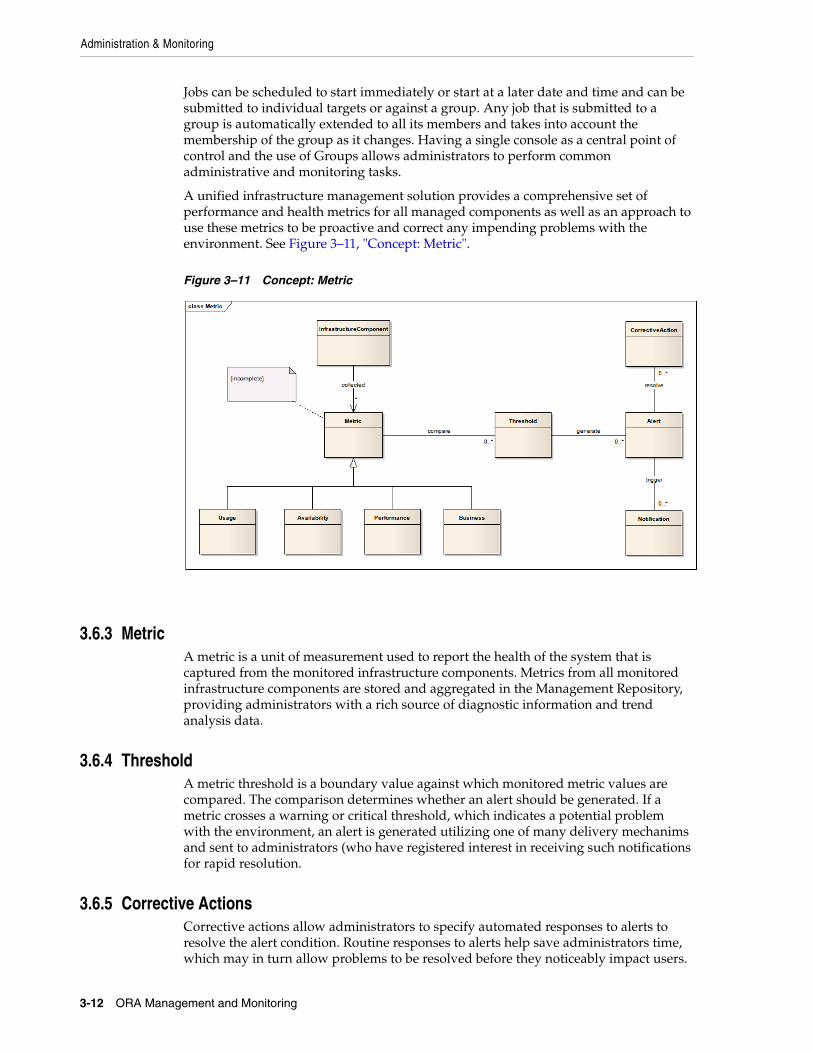
A unified infrastructure management solution provides a comprehensive set of performance and health metrics for all managed components as well as an approach to use these metrics to be proactive and correct any impending problems with the environment. See Figure 3–11, "Concept: Metric".
Figure 3–11 Concept: Metric
3.6.3 MetricA metric is a unit of measurement used to report the health of the system that is captured from the monitored infrastructure components. Metrics from all monitored infrastructure components are stored and aggregated in the Management Repository, providing administrators with a rich source of diagnostic information and trend analysis data.
3.6.4 ThresholdA metric threshold is a boundary value against which monitored metric values are compared. The comparison determines whether an alert should be generated. If a metric crosses a warning or critical threshold, which indicates a potential problem with the environment, an alert is generated utilizing one of many delivery mechanims and sent to administrators (who have registered interest in receiving such notifications for rapid resolution.
3.6.5 Corrective ActionsCorrective actions allow administrators to specify automated responses to alerts to resolve the alert condition. Routine responses to alerts help save administrators time, which may in turn allow problems to be resolved before they noticeably impact users.
4
Conceptual View 4-1
4Conceptual View
The previous sections of this document described a number of concepts, capabilities, and standards that an integrated end to end management and monitoring computing environment must provide. Some of these concepts have been around for a relatively long time, and have been addressed over the years in a number of ways. Therefore providing these capabilities is not new, and not necessarily difficult. The real challenge is providing them in a way that supports business agility, improves IT responsiveness, and enables an organization to know what measures are in place.
This chapter conceptually introduces a framework to cover the capabilities and standards described in the previous chapters and provides context for the next chapter which presents a logical view.
4.1 Architecture PrinciplesThe following section contains a list of sample architecture principles that pertain to the management and monitoring framework.
Principle Standards-based Integration
Statement Standards based approach to integration to interact with internal and external IT operational systems.
Rationale Standards-based integration improves the ability to interoperate with existing but also future and unknown IT operational systems. This facilitates the ability to manage and monitor the IT environment holistically as well as minimizing the cost of maintaining the integrations.
Implications ■ Support of industry standards such as Web Services, SNMP and JMS
■ Development effort to avoid point to point integrations, as they tend to become brittle, inflexible, and expensive to maintain.
■ See ORA Integration document for further implications for a standards-based approach to integration.
Principle Extensible
Statement Extend management and monitoring functionality for new and updated infrastructure components

Architecture Principles
4-2 ORA Management and Monitoring
Rationale There are an increasing number of new heterogeneous infrastructure components as defined by enterprise technology strategies. To control costs and enhance administrator productivity, it is favorable to have a single management and monitoring framework that can cater for all infrastructure components.
Implications ■ Framework required to cater for a large number of diverse infrastructure components.
■ Standards based approach to defining infrastructure components.
■ To cater for future unknown infrastructure components a variety of standards based metric collection mechanisms including new and custom-developed mechanisms are required.
■ To cater for future unknown infrastructure components a variety of techniques to monitor performance and availability are required.
Principle Service Aware
Statement Treat a Service as a super infrastructure component.
Rationale As more and more enterprises utilize Services as a means to build and compose business solutions it has become critical that IT operations have a comprehensive approach to managing and monitoring these Services.
Implications ■ Manage Services from an overview level to the individual component level whilst ensuring security, manageability, high availability, optimal performance, and service compliance.
■ Understanding of the association of related infrastructure components to the reliant Service.
Principle Discoverable
Statement Discovery of deployed services and infrastructure components.
Rationale Services and infrastructure components have become more dependent on one another, with many of these interdependencies crossing corporate boundaries. Without access to information concerning these dynamic interdependencies diagnosing problems and correlating problems in a complex, distributed environment is a huge challenge. Identifying and understanding dependencies manually is cost prohibitive, and breaks down with rising complexity and a rapid rate of change.
Implications ■ Understand of relationships between Services, infrastructure components and resources and their configurations to produce dependency map.
Principle Manage and Monitor as One
Statement Manage and monitor logical collections of infrastructure components as a single entity.
Unified Management & Monitoring Framework
Conceptual View 4-3
4.2 Unified Management & Monitoring FrameworkTo define a framework that meets both the management and monitoring requirements and the architecture principles, one might consider the framework to be comprised of four major parts (User Interaction, Management, Monitoring, and Integration) that complement other ORA components (ORA Engineering, ORA Security). The framework utilizes a management repository for storage of all current and historical
Rationale Administrator productivity has taken a hit as the scale and complexity of the IT environment increases. This has led to the cost of managing large sets of infrastructure components increasing linearly, or more, as each new infrastructure component is added to the enterprise.
Implications ■ Alerts, policies, blackouts, templates, metric collection, configuration management, and provisioning must be applied to group as a whole.
■ Flexibility of Group definitions to enable the grouping of the same infrastructure component types or include infrastructure components of different types.
Principle Externalize Management
Statement Management functionality must be externalized and not embeeded within the infrastructure component
Rationale Embedded management functionality leads to inflexibility
Implications ■ Services must not have hand coded management rules and policies.
■ Flexible policy deployment models with automatic dynamic propagation of policy updates.
Principle Proactive
Statement Pre-empt and respond to administrative needs
Rationale Avert possible error situations and anticipate additional resource needs.
Implications ■ Automatic provisioning of infrastructure components based on the current demand conditions.
■ Rule based approach to raise timely alerts and notifications to enable automation of administration tasks.
Principle Compliant
Statement Standardization and consistency of Infrastructure Components/Services
Rationale IT environments have an increasing need to be in compliance with not only regulatory policies such as SOX and PCI DSS, but also with corporate policies around security, standards, and best practices for provisioning/configuring of hardware, software, and Services.
Implications ■ Enforcement of regulatory, industry and corporate policies and best practices.
■ Actively monitor and measure compliance.
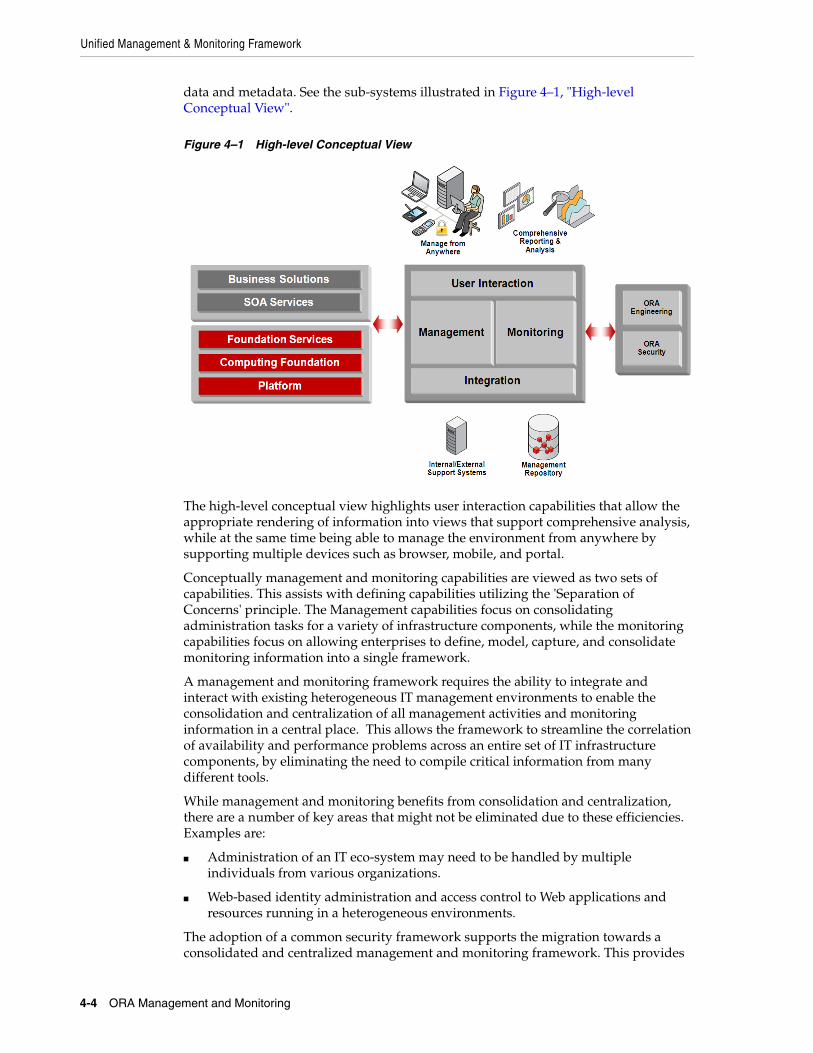
Unified Management & Monitoring Framework
4-4 ORA Management and Monitoring
data and metadata. See the sub-systems illustrated in Figure 4–1, "High-level Conceptual View".
Figure 4–1 High-level Conceptual View
The high-level conceptual view highlights user interaction capabilities that allow the appropriate rendering of information into views that support comprehensive analysis, while at the same time being able to manage the environment from anywhere by supporting multiple devices such as browser, mobile, and portal.
Conceptually management and monitoring capabilities are viewed as two sets of capabilities. This assists with defining capabilities utilizing the 'Separation of Concerns' principle. The Management capabilities focus on consolidating administration tasks for a variety of infrastructure components, while the monitoring capabilities focus on allowing enterprises to define, model, capture, and consolidate monitoring information into a single framework.
A management and monitoring framework requires the ability to integrate and interact with existing heterogeneous IT management environments to enable the consolidation and centralization of all management activities and monitoring information in a central place. This allows the framework to streamline the correlation of availability and performance problems across an entire set of IT infrastructure components, by eliminating the need to compile critical information from many different tools.
While management and monitoring benefits from consolidation and centralization, there are a number of key areas that might not be eliminated due to these efficiencies. Examples are:
■ Administration of an IT eco-system may need to be handled by multiple individuals from various organizations.
■ Web-based identity administration and access control to Web applications and resources running in a heterogeneous environments.
The adoption of a common security framework supports the migration towards a consolidated and centralized management and monitoring framework. This provides

Unified Management & Monitoring Framework
Conceptual View 4-5
an efficient and effective means of administration and at the same time supports a unified management platform. See ORA Security document for more details.
Infrastructure components such as applications, Services, and policies have an associated lifecycle which covers not only the operational aspects but also development aspects such as development, testing, and packaging. This means that management capabilities such as performance and availability reporting, and administration must be available as Services are developed and deployed. Therefore a management and monitoring framework intersects with the engineering framework to make sure that all components, infrastructure, and metrics are in sync, especially when it comes to migrating between environments and the eventual deployment of these components into production. See ORA Engineering document for more details.
To address these needs the management and monitoring framework requires access to a logical centralized storage of enterprise configuration information as this lays the foundation for defining, deploying, auditing, enforcing, and maintaining the systems.
The diagram below (Figure 4–2, "Detailed Conceptual View" expands on this concept by including some example capabilities for each of the major parts highlighted above.
Figure 4–2 Detailed Conceptual View
User Interaction
4-6 ORA Management and Monitoring
4.3 User InteractionThe functionality that interacts with the user will always vary from one enterprise to another, so it is important that any user interaction framework have a fully customizable interface that can also support multiple devices such as browser, mobile, and portal.
Below are a number of key architecture capabilities that are commonly provided:
4.3.1 AdministrationAdministration enables the ability though a single console to manage and monitor the entire environment, including all infrastructure components such as applications, Services, and operating systems. As well as managing all infrastructure components it enables administration tasks to be applied to logically related infrastructure components. This facilitates administering many infrastructure components as one. (See Section 4.4.3, "Group Management", Section 4.4.6, "Service Definition" and the ORA Security document regarding delegated administration.)
The console has the built-in intelligence to understand the characteristics of each infrastructure component and allow the appropriate administrative tasks. This approach allows the framework to support new infrastructure component types in the future.
4.3.2 DashboardDashboards provide an "at-a-glance" monitoring of all critical indicators for Services and other infrastructure components. They offer access to a series of rich real-time customizable and consolidated views of the IT eco-system with the ability to drill down. Administrators are able to spot recent changes or issues by presenting actionable information using intuitive icons and graphics, which assist in identifying trends, patterns, and anomalies.
4.3.3 Troubleshooting & Diagnostic AnalysisAs part of an overall approach to quality management, Troubleshooting and Diagnostic Analysis enables the ability to analyze collected metrics for the purpose of investigating and resolving application and Service issues. Examples include:
■ The diagnoses of the root cause of a performance problem, such as Services crashing and hanging in the production environment.
■ The rapid detection of memory leaks using real-time heap and garbage collection metrics.
■ The analysis and comparison of one or more memory heap dumps over a customized period of time to find the object that is causing a memory leak.
■ Drill down to view the performance of a specific method call and even track the details of JDBC/SQL calls obtain via instrumentation.
■ Diagnostics presented via an architecture view showing the call path.
See the document for more details regarding quality management.
4.3.4 QueryQuery enables the searching of the management and monitoring repository using pre-defined or ad-hoc queries. For example, an administrator can use this capability to
Management
Conceptual View 4-7
find all resources with a given configuration. Commonly used user-defined queries could be stored within the monitoring repository for future use.
4.3.5 ReportingReporting and publishing capabilities allow the definition of custom reports, that can be produced as needed or on a defined schedule. The reports present an intuitive interface to critical decision-making information stored in the Management Repository, which should be able to be distributed via several means, email, portal access, etc. For example, a report could be defined that reports on actual Service levels achieved, helping IT and business to find out whether their Services indeed function as expected to support business activities.
4.3.6 Topology ViewerA topology viewer provides the ability to depict a graphical representation of the infrastructure, infrastructure components, Services, and their dependencies. The viewer displays all the determinants for the Service's availability in a graphical form and allows the understanding of how requests are routed through different layers of the infrastructure. In addition, the topology viewer can allow users to drill down to detail pages to get more information on the key infrastructure components, alerts and policy violations, possible root causes and Services impacted.
4.4 ManagementThe capabilities that supplement a conventional bottom-up approach to management can vary from enterprise to enterprise depending on their current capability set. Below are a number of key management capabilities that are commonly required:
4.4.1 Alert & Notification ManagementSignificant events that occur within the IT infrastructure are detected by the monitoring sub-system, which in turn raises an alert. Alerts provide mechanisms for early detection of incidents. Example events include:
■ Threshold crossed on a monitored metric.
■ Policy Violation.
■ Service Level Violation.
■ Infrastructure unavailability.
■ Unauthorized configuration change.
Alert & Notification management makes sense of the events and determines the appropriate action. This requires the maintenance of notification rules that specify the alert conditions for which notifications are sent. This includes defining flexible notification schedules and multiple delivery mechanisms, such as email, pager, SNMP trap, and execution of custom scripts.
In addition, Alert & Notification management should integrate with a help desk solution to automatically raise an incident report or pass control to "Corrective Action Management".
4.4.2 Configuration ReconciliationAn administrator that has been alerted to an unauthorized configuration change, (See Section 4.5.7, "Configuration Change Detection") can perform configuration drift
Management
4-8 ORA Management and Monitoring
analysis which makes it easier to track changes in the environment through comparisons, snapshots, and querying the change history. This approach enables an administrator to see the drift in configuration and track the configuration over time.
During root cause analysis an administrator may query the management repository to compare two or more configurations which often highlight the source of the problem. Any updates to the configuration might be compared against:
■ A reference configuration set
■ A previously saved configuration snapshot.
■ A live configuration.
Configuration reconciliation can integrate with a change management solution to highlight whether the configuration change was authorized or not. To rectify the situation an administrator might reconcile the configuration in many ways. For example:
■ Synchronize differences of selected configuration items.
■ Restore configuration to a fixed point in time when the configuration was reliable.
4.4.3 Group ManagementGroup Management provides the capability to define infrastructure components into logical groups to assist in the efficient management and monitoring of a large number of infrastructure components. This allows the ability to partition and delegate management and monitoring capabilities such that stakeholders can perform management and monitoring functions based on their role and group/department within the organization. Each defined group inherits the persona of an individual infrastructure component on which additional capabilities can be applied, such as submitting a job.
4.4.4 Job ManagementJob Management provides the capability to define and schedule common administrative task(s) for a single infrastructure component or group. This enables the capacity to automate routine administrative tasks and synchronize components in the environment to manage them more efficiently. A job might be made up of multiple tasks which allow the definition of complex operations.
4.4.5 Corrective Action ManagementCorrective Action Management is a specialist form of "Job Management" that provides the capability to specify automated responses to alerts, eliminating the need for operator intervention while minimizing human error. Corrective Action Management can address not only automated recovery, and gather diagnostic information, but also dynamically allocate resources as demand increases.
4.4.6 Service DefinitionService Definition provides the foundation of managing and monitoring the many infrastructure components of a Service as a single logical entity that facilitates business oriented management. Before defining a Service, the system that the Service relies on must be specified. This involves selecting the infrastructure components for the system and then defining the associations between the infrastructure components of the system. This system topology logically represents the connections or interactions between them.
Management
Conceptual View 4-9
4.4.7 Patch ManagementPatch Management provides the capabilities to download and test patches identified by "Patch Monitoring", and then apply them to the identified infrastructure components. Patch Management involves the stopping of the infrastructure component (when required), applying the patch, and then bringing the infrastructure component back online. Finally Patch Management verifies whether the patches were applied successfully and reports compliance.
4.4.8 Policy AuthoringPolicy Authoring is the ability to author policies which define the desired behavior to support enterprise requirements. Example policy types cover configuration, access, authorization, logging, and load balancing. Once authored, policies are associated with one or more infrastructure components or groups and provide rules against which managed infrastructure components are evaluated, and utilized to identify any policy violations. See Section 4.5.8, "Policy Violation Detection".
4.4.9 Policy EnforcementWhen possible, Policy Enforcement enables the ability to ensure that policy requirements are being met and are enforced by utilizing policy enforcement points (PEP) or policy associated corrective actions. Policy enforcement points can be applied in many forms but it is common to utilize either a gateway or agent approach that intercepts requests to or responses from a Service and enforces the policies that are attached to the requests and responses. For example - routing and prioritization of service requests based on business criteria, and deciding whether a consumer has authorization to access a Service. See the ORA Security document for more details.
4.4.10 Provision ManagementProvision Management enables the automation of the installation and configuration of infrastructure components such as operating systems, infrastructure software, applications, shared services, virtual servers, and hosts across different platforms, environments, and locations.
Provision Management utilizes workflow capabilities to define and execute a sequence of tasks required to provisioning the appropriate infrastructure component. These sequences of tasks can vary greatly due to the various types of infrastructure components, the existing environment, and the objective of the provisioning activity. Some example provisioning activities includes:
■ Conversion of single node to multi-node.
■ Scaling out an existing cluster with additional nodes.
■ Provision new clusters.
■ Retire and relocate nodes.
■ Promotion of entire stack from test to stage to production.
To enforce consistency and standardization, Provision Management enables the provision of tested and approved "gold" software images and configurations from the management repository, while automatically applying context-specific adjustments such as IP address, hostnames, etc.
Lastly, Provision Management also enables the automation of a number of pre/post tasks such as creating/removing blackouts (scheduled downtimes), executing backups and cleaning up stage and temporary files.
Monitoring
4-10 ORA Management and Monitoring
4.4.11 Service Level AuthoringThe business establishes performance and availability criteria, and the key business activities that a Service needs to support in order for it to be considered working properly. This criterion forms the foundation of a service level agreement (SLA). Service Level Authoring defines an assessment criterion to determine Service quality. It allows the specification of the availability and performance criteria that the Service must meet during business hours as defined in the SLA.
The availability of a Service indicates the percentage or amount of scheduled time available to the users at any given point in time, while the performance of a Service denotes the response time of the Service, or how well the Service is performing as perceived by end-users. For example, "CheckCreditRating" Service must be 99.99% available between 8am and 8pm, Monday through Friday.
4.5 MonitoringThe capabilities that supplement a conventional bottom-up approach to monitoring can vary from enterprise to enterprise depending on their current capability set. Below are a number of key monitoring capabilities that are commonly required. These capabilities should not be viewed in isolation, as many have a symbiotic relationship.
4.5.1 Service Level MonitoringService Level Monitoring enables the ability to automatically collect key metrics in order to measure whether Service level objectives are being met. See Section 4.4.11, "Service Level Authoring" for criterion. Example key metrics include the availability, performance, usage, and business needs within the Service's business hours.
Metrics can be collected for Services by remote beacons which execute a synthetic web transaction. A synthetic web transaction includes a combination of one or more navigation paths within the application to be used as the criteria for determining the Service's availability and performance. Performance metrics can be calculated from the minimum, maximum, and average response data collected by two or more beacons. A beacon captures the availability of a Service by measuring the end users' ability to access the Service at a given point in time.
In addition to beacons, metrics can be collected by monitoring the Service's underlying infrastructure components, and then calculating the minimum, maximum, and average values across all components.
Lastly, metrics can be collected via network protocol analysis, which enables the ability to track response times of URLs to determine performance. Using a segmentation approach enables the ability to investigate if performance degradation occurred only to users in certain areas or to all users. See Section 4.5.9, "User Experience Monitoring".
4.5.2 Log MonitoringLog Monitoring continuously monitors log files for errors and anomalies utilizing specifically defined error patterns. Log Monitoring raises an alert if an error pattern is encountered during a log file scan.
4.5.3 Resource MonitoringResource Monitoring provides the ability to take a resource-centric approach to identifying bottlenecks and collecting low-level technology oriented measurements
Monitoring
Conceptual View 4-11
from components (i.e. URLs, Servlets, EJBs, DataSources, JVM, Connections, Caches, etc.) to monitor the performance, load and usage of resources.
4.5.4 Transaction MonitoringTransaction Monitoring enables a transaction-centric approach to diagnosing problems, which follows the path of a single transaction across multiple resources/tiers and collects low-level technology oriented measurements along the way. All invocation paths of a transaction are traced and hierarchically broken down by servlet/JSP, EJB, and database times to help locate and solve the problem quickly
4.5.5 Patch MonitoringPatch Monitoring provides the capabilities to proactively monitor and identify released critical patches that affect the current environment and raise an event to alert the appropriate administrators. Patch advisories are analyzed and the appropriate infrastructure components are identified where the patch could be applied without any issues to the infrastructure component. This entails an assessment of vulnerabilities by examining the infrastructure components configuration to determine if one or more critical patches need to be applied. See Section 4.4.7, "Patch Management".
4.5.6 Environment AnalysisEnvironment Analysis provides the ability to discover the infrastructure environment including the infrastructure components, their configurations, and the static and dynamic relationships between the infrastructure components.
This provides the basis for:
■ A Configuration Management baseline to monitor and audit changes.
■ Determining monitoring points.
■ Auto-generating dependency maps, which assists with top-down problem isolation and management.
■ Understanding the infrastructure components that Services rely on.
■ Understanding the infrastrucutre components and thier dependencies to enable system recovering.
Environment Analysis can use both manual and automatic techniques to establish knowledge regarding the infrastructure environment such as agent discovering and metadata analysis.
4.5.7 Configuration Change DetectionConfiguration Change Detection provides the ability to monitor and detect configuration changes to the infrastructure their infrastructure components which in turn raises the appropriate alerts. This rule-based monitoring approach assists with controlling configuration drift and captures what has changed, when it changed, and who changed the configuration. This proactive approach to configuration monitoring enables a full configuration audit history and integrates with change management solutions to identify unauthorized configuration updates.
Integration
4-12 ORA Management and Monitoring
4.5.8 Policy Violation DetectionPolicy Violation Detection enables the ability to detect and record whether there has been an infringement of an associated defined policy. This monitoring and detection of policy violations assists in ensuring compliance, and alignment with security and QoS requirements. See Section 4.4.9, "Policy Enforcement". The recording and auditing of policy violations is utilized to monitor policy trends over time, which in turn can be used to determine a course of action in solving the policy violations.
4.5.9 User Experience MonitoringUser Experience Monitoring provides the ability to collect and process every detail of an end user experience, whereby the usage and actual response time are tracked as the end user accesses and navigates a web site. The response times for every user and of all individual pages and Services are tracked. This allows a better understanding of the end user experience, and the opportunity to tackle potential issues before they seriously impact users.
Furthermore, monitoring segments such as domains and regions might be defined. This would allow User Experience Monitoring to track response times of URLs and determine if performance degradation occurred only to users in certain areas, or to all users. The preferable approach to User Experience Monitoring is to collect metrics via Network Protocol Analysis which is a non-intrusive manner where there is no impact on the environment’s performance and no change is required to any web application or Service.
4.5.10 System MonitoringSystem Monitoring enables the ability to automatically collect pre-defined and/or user-defined metrics focused around the status, health and performance of all infrastrcuture components. Defined metrics have an associated collection frequency and appropriate thresholds. Whenever a threshold is crossed a context sensitive alert is generated. See Section 4.4.1, "Alert & Notification Management".
4.6 IntegrationWhile it is preferable to have a single management and monitoring solution it is unrealistic that a single management and monitoring framework can support every available infrastructure component now and in the future. Two-way integration capabilities that cater for message exchange, bulk data exchange and extending the framework are key in addressing the needs of the modern IT environment. Below are a number of key integration capabilities:
4.6.1 Alert & Notification IntegrationAlert & Notification Integration enables the interaction with additional alert/management solutions using standards-based protocols, such as Web Services, JMS or SNMP. This enables better correlation of IT problems across the technology stack. These integrations allow enterprises to realize a better return on investment of owning multiple solutions and provide greater flexibility in managing the IT environment by enabling a single console. See Section 4.4.1, "Alert & Notification Management".

Management Repository
Conceptual View 4-13
4.6.2 Extensibility FrameworkAn Extensibility Framework enables the ability to extend the infrastructure components that the overall management and monitoring framework can support. Newly added infrastructure components automatically inherit the monitoring and management framework capabilities, such as alerts, policies, blackouts, templates, metric collection, groups/systems, configuration management, and reporting.
4.6.3 Data ExchangeData Exchange enables the ability to selectively forward and accept information such as metrics. This facilitates consolidating all the information in a single console, improving modeling and monitoring of an enterprise's Services, and performing comprehensive root cause analysis.
For example, Data Exchange enables the ability to:
■ Access business metrics such as KPIs and associate these metrics with existing Services and SLA definitions. This allows administrators to correlate business metrics with service availability, performance and usage, which in turn leads to better diagnostic and root cause analysis.
■ Export bulk data to other solutions, i.e. Business intelligence solutions for further consolidated analysis.
4.7 Management RepositoryThe data required to manage and monitor in the modern IT infrastructure can be quite extensive, complex, and distributed in nature. Below are a number of key information stores that are commonly required. Note that one should not infer that all data be centrally located.
4.7.1 Monitoring TemplatesA monitoring template contains an enterprise's standards for monitoring-metrics, thresholds, corrective actions and/or policy rules. Once defined, the standards can be propagated by applying the template to managed infrastructure components. This makes it easy to apply specific monitoring settings to specific classes of infrastructure components and services throughout the enterprise. For example, one monitoring template can be defined for test application servers and another for production application servers.
4.7.2 Job LibraryDefined jobs can be saved in a central store known as the Job Library. The Job Library is a repository for frequently used jobs. Jobs can be applied to different infrastructure components and customized accordingly.
4.7.3 Software LibraryA software library is a central repository for metadata and binary content for certified software images. An image is a set of infrastructure components and scripts that form a required software configuration. Images reference the infrastructure components logically rather than include them directly. These images can then be automatically mass-deployed to provision software, software updates, and servers in a reliable and repeatable manner.

Management Repository
4-14 ORA Management and Monitoring
4.7.4 Policy LibraryLibrary of reusable policies that can be applied to multiple infrastructure components.
4.7.5 Service Level RulesA Service level rule is a measure of Service quality, defined as the minimum percentage of time during business hours in which a Service is expected to meet certain performance and availability criteria.
4.7.6 Corrective ActionCorrective Actions allow administrators to specify automated responses to alerts or policy violations. Corrective Actions ensure that routine responses to alerts or policy violations are automatically executed, thereby saving administrator time and ensuring problems are dealt with before they noticeably impact end users.
4.7.7 Historical Monitoring DataMetrics are collected and stored in the Management Repository and can be analyzed well after the situation has changed. For example, you can use historical data and diagnostic reports to research a performance problem that occurred days or even weeks ago.
4.7.8 Deployment ProceduresThe workflow of all the tasks that need to be performed for a particular life cycle management activity is encapsulated in a Deployment Procedure. A Deployment Procedure is a hierarchal sequence of provisioning steps, where each step may contain a sequence of other steps. It provides a framework where specific infrastructure components can be built.
4.7.9 ReportsReporting capabilities allow the definition of custom reports which can be saved in the management repository to be reused and executed on an ad-hoc or scheduled basis.
4.7.10 ConfigurationsThe management repository stores the infrastructure components’ configurations and the static and dynamic relationships between infrastructure components. This enables capabilities such as "Configuration Change Detection".

5
Logical View 5-1
5Logical View
The logical view builds on the conceptual view by highlighting the architecture tiers and the key interactions between capabilities. It is important to note that the capabilities and interactions depicted in the Logical View are not specific to any product or set of products.
5.1 Logical TiersFigure 5–1, "Logical Tiers" below highlights the 3 major tiers of the logical view.
Figure 5–1 Logical Tiers
5.1.1 Client TierThe Client Tier represents access to management content and operations as well as end users accessing the appropriate business solution. Administrators utilize a browser based console to perform their management tasks using a standard browser interface. The management console which is lightweight, easy to access and firewall friendly, enables administrators to centrally manage their entire environment.
Detailed Logical View
5-2 ORA Management and Monitoring
The management content is organized to allow different classes of users to see customized views of management and monitoring information that is appropriate for their needs.
5.1.2 Management TierThe Management Tier renders the content and interface for the management console that gives access to management operations such as monitoring, administration, configuration, central policy setting, and security. The Management Tier controls the accessing and uploading of management information.
The management information is centrally managed in a management repository. The management repository is the comprehensive source for all the management information. The information in the management repository includes configuration details, historical metric data and alert information, client and web server response time information, availability information, and product and patch inventory information.
The richness of the information stored in the management repository is useful for tasks such as end-to-end reporting, problem diagnosis, as well as service level agreement and availability reporting.
5.1.3 Managed Target TierThe Managed Target Tier contains the named infrastructure components that are required to be managed and monitored. It is common to utilize a combination of agent based and gateway (a.k.a. proxy) patterns to monitor and manage hosted and non-hosted targets.
5.2 Detailed Logical ViewThe diagram below expands on the above logical view tiers by detailing some of the lower level capabilities and their common interactions. Given the large number of capabilities that comprise the architecture, the diagram below currently focuses on highlighting only a few of these capabilities and the operations that they support.
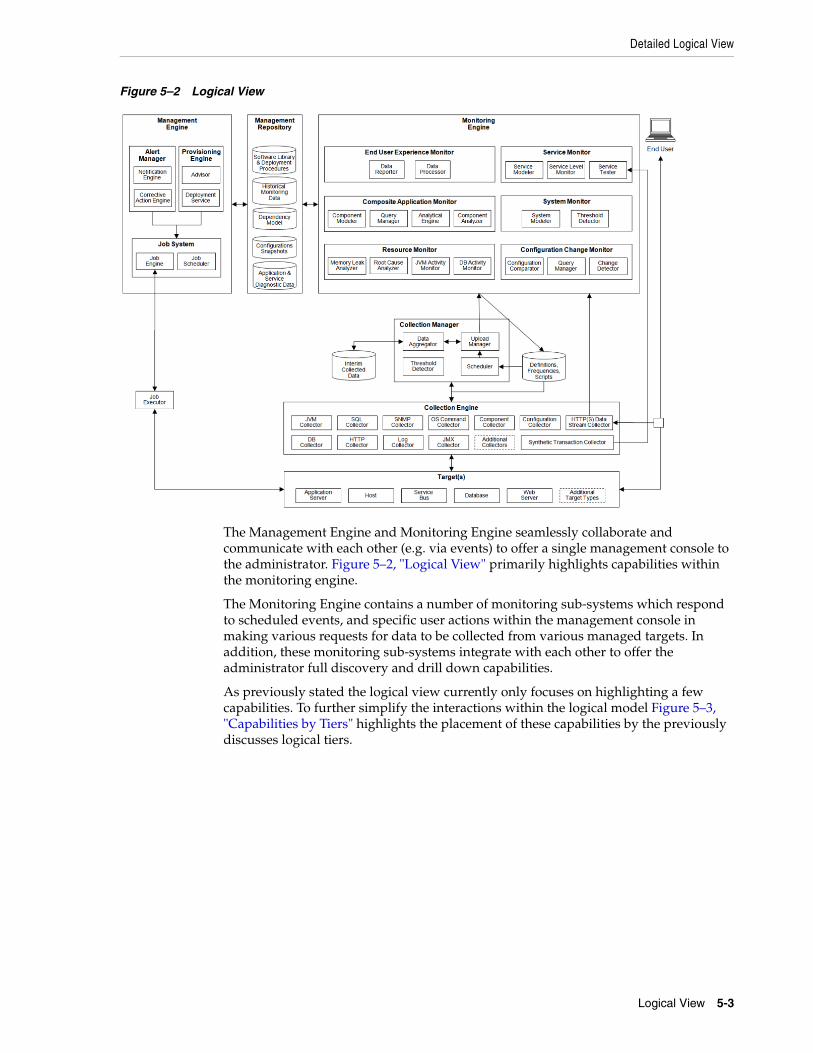
Detailed Logical View
Logical View 5-3
Figure 5–2 Logical View
The Management Engine and Monitoring Engine seamlessly collaborate and communicate with each other (e.g. via events) to offer a single management console to the administrator. Figure 5–2, "Logical View" primarily highlights capabilities within the monitoring engine.
The Monitoring Engine contains a number of monitoring sub-systems which respond to scheduled events, and specific user actions within the management console in making various requests for data to be collected from various managed targets. In addition, these monitoring sub-systems integrate with each other to offer the administrator full discovery and drill down capabilities.
As previously stated the logical view currently only focuses on highlighting a few capabilities. To further simplify the interactions within the logical model Figure 5–3, "Capabilities by Tiers" highlights the placement of these capabilities by the previously discusses logical tiers.
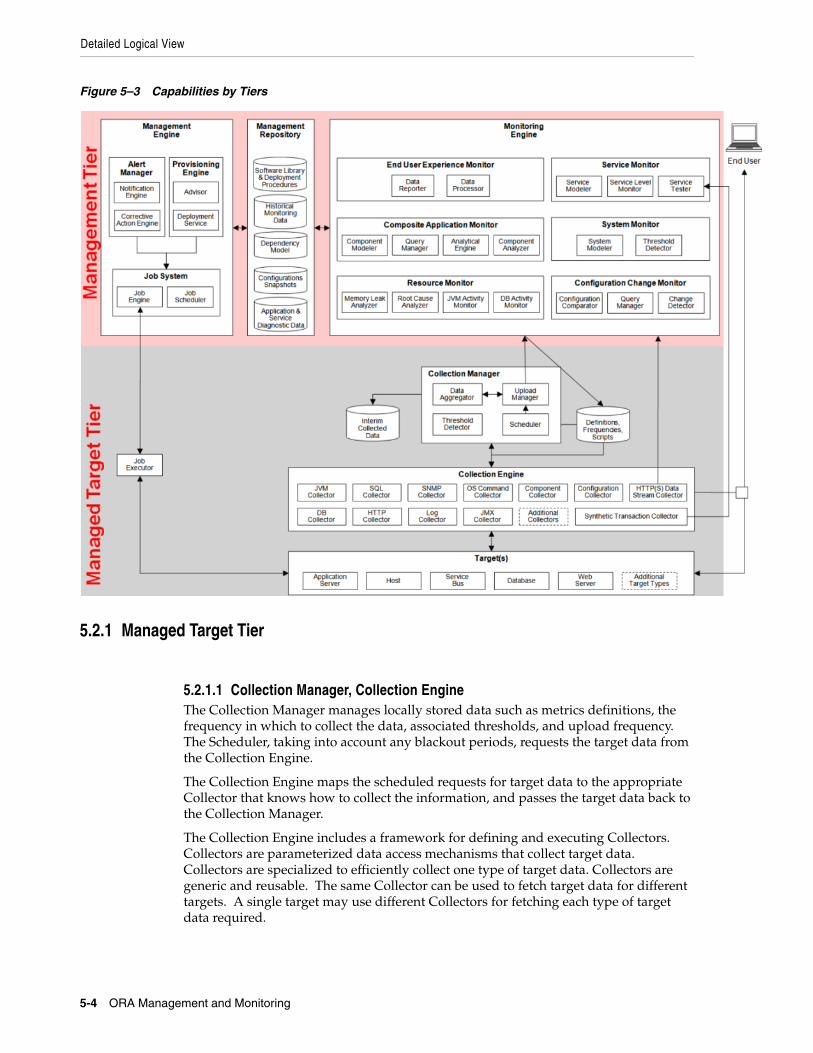
Detailed Logical View
5-4 ORA Management and Monitoring
Figure 5–3 Capabilities by Tiers
5.2.1 Managed Target Tier
5.2.1.1 Collection Manager, Collection EngineThe Collection Manager manages locally stored data such as metrics definitions, the frequency in which to collect the data, associated thresholds, and upload frequency. The Scheduler, taking into account any blackout periods, requests the target data from the Collection Engine.
The Collection Engine maps the scheduled requests for target data to the appropriate Collector that knows how to collect the information, and passes the target data back to the Collection Manager.
The Collection Engine includes a framework for defining and executing Collectors. Collectors are parameterized data access mechanisms that collect target data. Collectors are specialized to efficiently collect one type of target data. Collectors are generic and reusable. The same Collector can be used to fetch target data for different targets. A single target may use different Collectors for fetching each type of target data required.

Detailed Logical View
Logical View 5-5
Once the data has been collected it is stored in an interim data store. The Threshold Detector compares the data to any specified threshold to determine whether to trigger an alert.
The Upload Manager aggregates this interim target data with previously collected target data. The Upload Manager then transmits the target data to the Monitoring Engine. Examples of data transmitted include monitoring information, alert
Table 5–1 Example Collectors
Collector Description
SQL Collector The SQL Collector executes a SQL statement using the supplied connection information and returns the results in a buffer. In addition the SQL Collector could return statistics, explain plans, or other metric content for the database.
SNMP, JMX Collectors This category of Collectors utilizes standard access mechanisms to access content from the relevant management standards, such as SNMP and JMX. For example, a JMX Collector collects metric data from a target JMX MBeanServer which enables metrics collection from a J2EE server and JMX instrumented J2EE applications.
Log Collector The Log Collector reads through a log file for specific patterns and returns any lines of the file that match. Log files can be database alert logs, web server logs, or any other text-based file where a pattern can be used to identify relevant content. For example, this enables the monitoring of the response time data generated by actual end-users as they access and navigate web sites. Web servers collect the end-user performance data and store it in the log file.
OS Command Collector For the ultimate flexibility an OS Command Collector executes a command line and returns the results in a buffer.
JVM Collector JVM Collector provides in-depth monitoring of Java applications to identify the slowest requests, slowest methods, requests waiting on I/O, requests using a lot of CPU cycles, and requests waiting on database calls. In essence the JVM Collector provides visibility into the Java stack by monitoring thread states and Java method/line numbers in real time.
DB Collector In conjunction with the JVM Collector, the DB Collector facilitates tracing of Java requests to the associated database sessions and can highlight areas such as the slowest SQL queries.
Synthetic Transaction Collector
A Synthetic Transaction Collector executes pre-recorded transactions and collects performance, and availability metrics. This enables the ability to monitor transactions from different user communities or geographical regions.
Configuration Collector The Configuration Collector accesses configuration information for various targets. The Configuration Collector utilizes various discovery techniques such as JMX and metadata file analysis.
Component Collector The Component Collector uses its deep knowledge of specific infrastructure components, both the programming framework and the execution environment, to determine what low level technology metrics and high level functional metrics are required to capture the complex relationships among various application building blocks.
HTTP(S) Collector The HTTP(S) Data Collector is responsible for acquiring and recording raw network traffic data and delivering it directly to the End User Experience Monitor.

Detailed Logical View
5-6 ORA Management and Monitoring
conditions, target inventory details, and status information for any job or administration operations that are performed on behalf of a client. The Monitoring Engine in turn then stores the data in the Management Repository.
5.2.1.2 Job ExecutorThe job executor executes at the request of the Job System. Upon receiving a new request, the task executor spawns a process that validates the user credentials, and then executes the specified command to satisfy the request. Job output from the process is coordinated from the Job Executor back to the Job System.
5.2.2 Management Tier
5.2.2.1 Resource MonitorThe Resource Monitor, in response to specific user actions on the console, makes various requests for monitoring information for JVM and DB resources.
The JVM Activity Monitor provides immediate visibility into the Java stack, which provides capabilities such as:
■ Monitoring thread states and Java method/line numbers in real time
■ Executing real-time transaction traces to debug slow or hanging requests
■ View JVM threads and their execution call stacks
The DB Activity Monitor facilitates tracing of Java requests to the associated database sessions and vice-versa enabling rapid resolution of problems that span different tiers. The DB Activity Monitor reports SQL query performance, which helps facilitate SQL and database performance tuning.
The Resource Monitor alerts administrators on abnormalities in Java memory consumption.
The Memory Leak Analyzer captures multiple heap dumps over a period of time, analyzes the differences between the heap dumps, and identifies the object causing the memory leak.
The Root Cause Analyzer plays back transactions interactively from the browser and enables an administrator to view the time spent in the network, the server, and the response times breakdown by Servlet, JSP, EJB, JDBC, and SQL layers. This allows an administrator to perform real-time and historical diagnostics on Java applications.
5.2.2.2 Service MonitorThe Service Monitor proactively monitors a Service. Each Service has associated performance and usage metrics that have corresponding critical and warning thresholds. When a threshold is reached, an alert is raised.
The Synthetic Transaction Collector commonly known as a Beacon uses pre-recorded transactions to simulate common end-user functionality to capture availability and performance metrics. The Service Tester measures the performance and availability of critical business functions.
The Service Modeler provides the ability to view the dependencies between the Service, its system components, and other Services that define its availability. This facilitates root cause analysis by highlighting potential causes of Service failure.
Detailed Logical View
Logical View 5-7
5.2.2.3 System MonitorThe System Monitor performs real-time and historical monitoring of key components in the environment such as applications, application servers, clusters, databases, as well as the back-end components on which they rely, such as hosts, operating systems and storage. It utilizes metrics that can have critical and warning thresholds. When a threshold is reached, alerts are raised.
The System Modeler provides the ability to view the dependency relationships between infrastructure components of the system. This facilitates a drill down capability to retrieve detailed information on the key components, alerts and policy violations, possible root causes and Services impacted, and more.
5.2.2.4 Composite Application MonitorThe Component Analyzer and Component Modeler analyze the data collected to discover the complex relationships among various application building blocks. The resulting dependency model is then stored in the Management Repository.
The Query Manager supports information access techniques such as hierarchical traversal, architecture model navigation, string queries, drill down, drill out, etc.
5.2.2.5 End User Experience MonitorWhen an object is requested by an end user, the End User Experience Monitor sees the request and starts measuring the time the Web server requires to present the user with the requested object. At this point, the End User Experience Monitor knows who requested the page, which object was requested, and from which server the object was requested. When the Web server responds and sends the object to the user, the End User Experience Monitor sees that response, and stops timing the server response time. At this stage, the End User Experience Monitor can see whether there is a response from the server, whether this response is correct, how much time the Web server required to generate the requested object, and the size of the object.
The Data Processor converts raw data into relevant OLAP datasets (or views), which in turn facilitates the Data Reporter to enable browser access to the analysis and reporting of the end user's experience data.
5.2.2.6 Configuration Change MonitorThe Monitoring Engine receives configuration information for a target and stores it in the Management Repository. Reactively, an administrator can track historical changes to configurations to assist in diagnosing problems. The Configuration Change Monitor utilizes the Query Manager to perform searches that query the enterprise configuration views in the Management Repository to find configuration information that satisfies the specified search criteria.
In addition, the Configuration Change Monitor utilizes a rules based approached to raise alerts if it detects configuration changes to the infrastructure components. This enables a proactive auditable approach to controlling configuration drift and capture what has changed, when it changed, and who changed the configuration. It is common for the Configuration Change Monitor to be integrated with change management solutions to identify unauthorized configuration updates.
As part of a root cause analysis process an administrator will commonly investigate configuration differences between multiple targets. The Configuration Comparator performs comparisons between configurations of the same target type. These comparisons are useful for quickly finding similarities and differences between two or more configurations. The Configuration Comparator presents the summary results of
Detailed Logical View
5-8 ORA Management and Monitoring
the comparison in a tabular format, and more detailed information is a drilling down approach.
5.2.2.7 Alert ManagerThe Alert Manager responds to alerts in multiple ways using both the Notification Engine and the Corrective Action Engine. The Corrective Action Engine enables automated responses to alerts. It ensures that responses are automatically executed and utilizes the Job System to execute the defined actions. The Notification Engine enables users to register their interest in specific types of alerts and the manner in which they should be informed, i.e. eMail, SMS, SNMP traps, and integration to Help Desk Systems.
5.2.2.8 Job SystemThe Job System coordinates the submission and scheduling of jobs. An example of a job is one that patches the database on a particular host system (or systems). The job system runs the job on behalf of the submitter and records any output and logs generated by the job.
5.2.2.9 Provisioning EngineThe Provisioning Engine automates the deployment of software, applications, and patches. The Advisor proactively informs administrators about the critical patches and vulnerabilities required for the current environment. The Deployment Service enables the deployment of images created from reference deployments. An image is a set of infrastructure components that form the required software configuration, which is deployed on the target machines. The workflow of all the tasks that need to be performed for a particular deployment activity is encapsulated in a deployment procedure that utilizes the Job System to schedule and submit the tasks.
6
Product Mapping 6-1
6Product Mapping
This section describes how Oracle products fit together to realize the management & monitoring framework defined in the previous sections.
6.1 ProductsThere are a number of products from Oracle that can be used individually to satisfy specific management & monitoring needs, or used in combination to establish a complete management & monitoring framework.
Table 6–1 Product List
Product Description
Oracle Enterprise Manager Oracle Enterprise Manager (OEM) is a family of management products, to manage Oracle environments. OEM enables centralized management functionality for the complete Oracle IT infrastructure, including systems running Oracle and non-Oracle technologies. OEM is a single, integrated solution for managing all aspects of the Oracle Grid and the applications running on it. It delivers a top-down monitoring approach to delivering the highest quality of service for applications with a cost-effective, automated configuration management, provisioning, and administration solution.
Oracle Enterprise Manager - Service Level Management Pack
OEM - Service Level Management Pack actively monitors and reports on the availability and performance of Services. In addition, it assess the business impact of any Service problem or failure, and indicates whether service level goals have been met.
Oracle Enterprise Manager - Diagnostic Pack for Oracle Middleware
OEM - Diagnostic Pack for Oracle Middleware provides proactive monitoring and advanced diagnostic capabilities that empower administrators to prevent crashes and other undesirable outcomes in high load production environments. A lightweight Java application monitoring and diagnostics tool enables administrators to diagnose performance problems in production.
Oracle Enterprise Manager - Diagnostic Pack for Non-Oracle Middleware
OEM - Diagnostic Pack for Non-Oracle Middleware provides proactive monitoring and advanced diagnostic capabilities for applications running on non-Oracle middleware and for standalone Java applications to help administrators prevent crashes and other undesirable outcomes in high load production environments.
Oracle Enterprise Manager - Management Pack for Coherence
OEM - Management Pack for Coherence provides comprehensive tools for discovery, monitoring, reporting, events management, configuration management, lifecycle management and deployment automation to simplify the management of an organization's Oracle Coherence cluster.

Product Mapping
6-2 ORA Management and Monitoring
6.2 Product MappingThe following section illustrates the mapping of Oracle products onto the Logical View. This mapping does not show all of Oracle management and monitoring products due to the following reasons.
■ The logical view only highlights a sampling of the capabilities of the conceptual view
■ Extensive number of management packs, connectors, plug-ins to show on a single mapping diagram.
Oracle Enterprise Manager - Business Intelligence Management Pack
OEM - Business Intelligence Management Pack is an integrated solution for ensuring the performance and availability of Oracle Business Intelligence Enterprise Edition, which assists in reducing the cost of managing BI applications.
Oracle Enterprise Manager - Management Pack Plus for SOA
OEM - Management Pack Plus for SOA ensures runtime governance through composite application modelling and monitoring as well as comprehensive Service and infrastructure management functionality to help organizations maximize the return on investment.
Oracle Enterprise Manager - Management Pack for WebCenter Suite
OEM - Management Pack for WebCenter Suite ensures mission critical portal applications perform at peak levels. By correlating portal application Services to the underlying code components and automating performance management, OEM - Management Pack for WebCenter Suite fills the IT visibility gap at the abstract portal layer.
Oracle Enterprise Manager - Management Pack for Websphere Portal
OEM - Management Pack for Websphere Portal ensures mission critical portal and J2EE applications perform at optimal levels. By correlating portal application Services to the underlying code components and automating performance management, OEM - Management Pack for Websphere Portal fills the IT visibility gap at the abstract portal layer.
Oracle Enterprise Manager - Management Pack for Weblogic Server
OEM - Management Pack for Weblogic Server provides a complete, integrated, and easy to use solution for managing Oracle Weblogic Server and Oracle Application Server. It provides powerful performance management, configuration tracking, compliance management, and operations automation capabilities for multiple Oracle Weblogic Domains.
Oracle Enterprise Manager - VM Management Pack
OEM - VM Management Pack provides end to end monitoring, configuration management, and lifecycle automation of virtual machines to address the unique management challenges that virtualization requires.
Oracle Enterprise Manager Plug-ins and Connectors
Extensive list of Plug-ins and Connectors. See
http://www.oracle.com/enterprise_manager/plug-ins.html
Oracle Real User Experience Insight
Oracle Real User Experience enables enterprises to maximize the value of their business critical applications by delivering insight into real end-user experiences. It integrates performance and usage analysis enabling business and IT stakeholders to develop a shared understanding of their application users' experience.
Oracle Web Services Manager
Oracle Web Services Manager defines and implements Web Services Security in heterogeneous environments, providing tools to manage Web Services based on service-level agreements, and allow the user to monitor runtime activity in graphical charts.
Table 6–1 (Cont.) Product List
Product Description
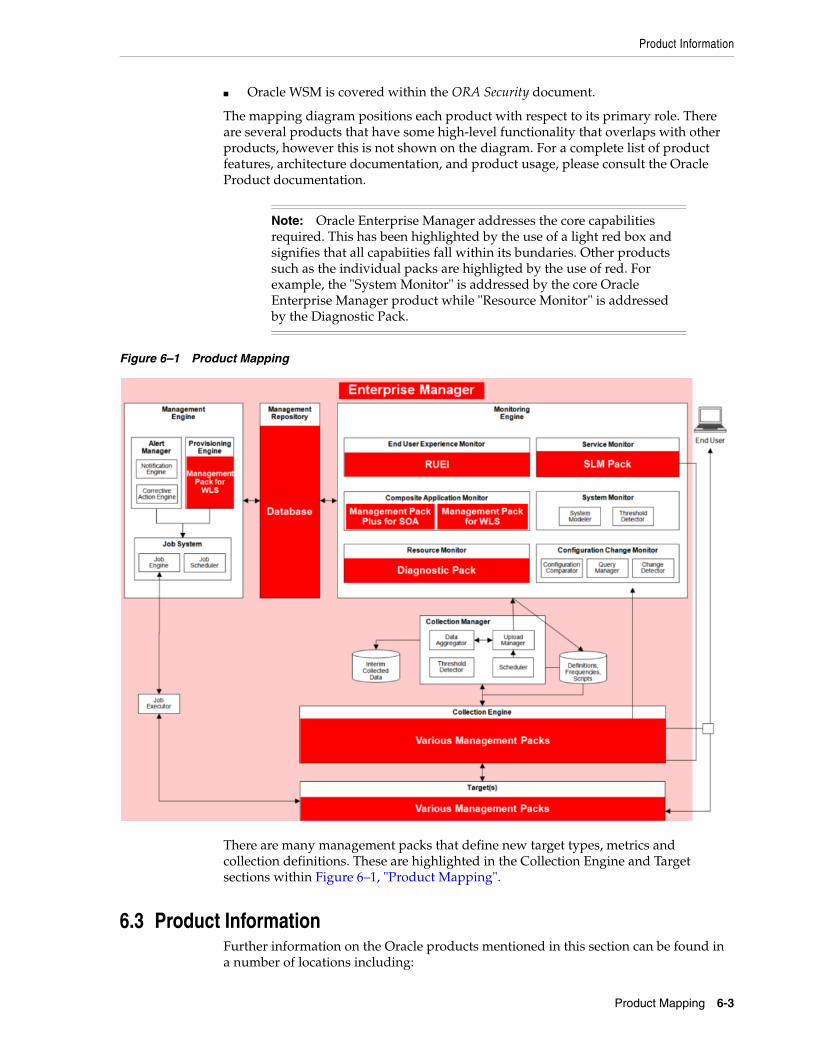
Product Information
Product Mapping 6-3
■ Oracle WSM is covered within the ORA Security document.
The mapping diagram positions each product with respect to its primary role. There are several products that have some high-level functionality that overlaps with other products, however this is not shown on the diagram. For a complete list of product features, architecture documentation, and product usage, please consult the Oracle Product documentation.
Figure 6–1 Product Mapping
There are many management packs that define new target types, metrics and collection definitions. These are highlighted in the Collection Engine and Target sections within Figure 6–1, "Product Mapping".
6.3 Product InformationFurther information on the Oracle products mentioned in this section can be found in a number of locations including:
Note: Oracle Enterprise Manager addresses the core capabilities required. This has been highlighted by the use of a light red box and signifies that all capabiities fall within its bundaries. Other products such as the individual packs are highligted by the use of red. For example, the "System Monitor" is addressed by the core Oracle Enterprise Manager product while "Resource Monitor" is addressed by the Diagnostic Pack.
Product Information
6-4 ORA Management and Monitoring
■ Oracle Enterprise Management web page: - http://www.oracle.com/enterprise_manager
■ Oracle Web Services Manager web page - http://www.oracle.com/appserver/web-Services-manager.html
7
Deployment View 7-1
7Deployment View
This section provides an example of how Oracle products might be deployed to physical hardware. A network topology format is used to illustrate where products are most likely to be deployed in terms of network tiers.
A number of factors influence the way products are deployed in an enterprise. For instance, load and high availability requirements will influence decisions about the number of physical machines to use for each product. Federation and disaster recovery concerns will influence the number of deployments and failover strategy to use. In addition, deployment configurations and options may vary depending on product versions. Given these and other variables it is not feasible to provide a single, definitive deployment for the products. Please consult product documentation for further deployment information.
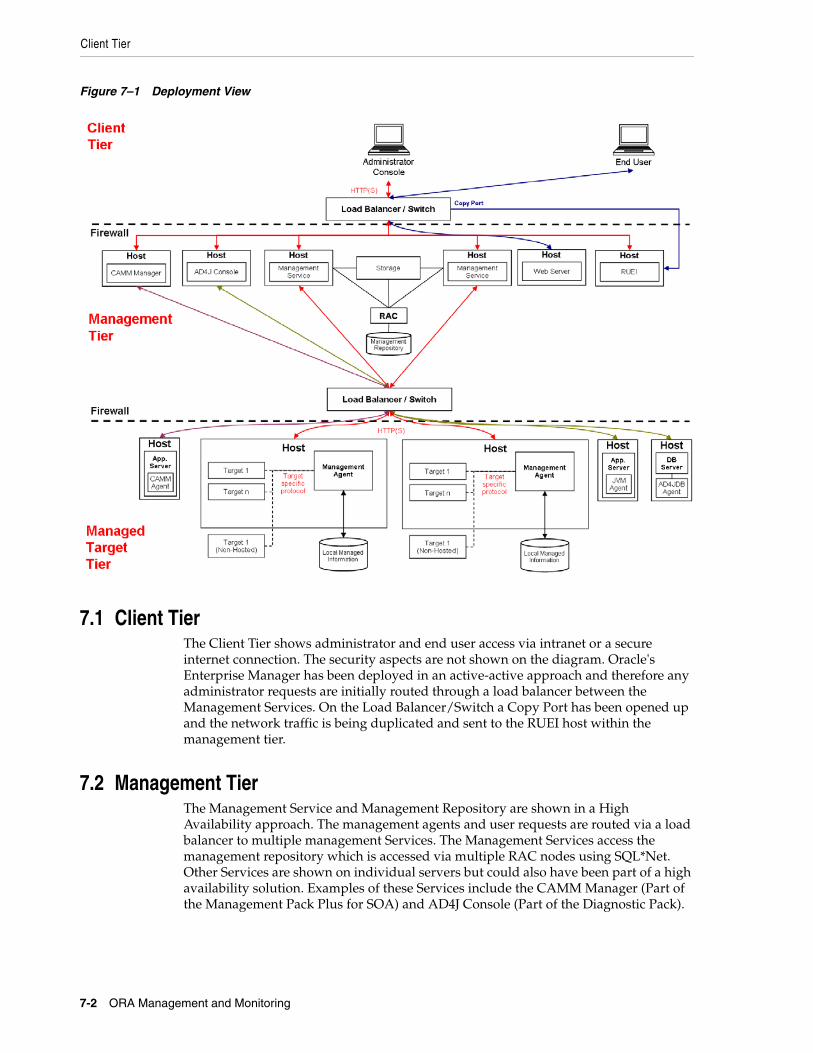
Client Tier
7-2 ORA Management and Monitoring
Figure 7–1 Deployment View
7.1 Client TierThe Client Tier shows administrator and end user access via intranet or a secure internet connection. The security aspects are not shown on the diagram. Oracle's Enterprise Manager has been deployed in an active-active approach and therefore any administrator requests are initially routed through a load balancer between the Management Services. On the Load Balancer/Switch a Copy Port has been opened up and the network traffic is being duplicated and sent to the RUEI host within the management tier.
7.2 Management TierThe Management Service and Management Repository are shown in a High Availability approach. The management agents and user requests are routed via a load balancer to multiple management Services. The Management Services access the management repository which is accessed via multiple RAC nodes using SQL*Net. Other Services are shown on individual servers but could also have been part of a high availability solution. Examples of these Services include the CAMM Manager (Part of the Management Pack Plus for SOA) and AD4J Console (Part of the Diagnostic Pack).
Managed Target Tier
Deployment View 7-3
7.3 Managed Target TierThe Managed Target Tier shows a number of agents deployed on individual hosts. Agent monitoring is uses for scalability and efficiency. For large deployments, the advantage of having multiple semi-autonomous agents collecting information and periodically relaying it to a central repository is more scalable and consumes less network bandwidth than polling from the central console. The proximity of the agent to the managed resource results in communication efficiency. Moreover, the central console is not required to maintain direct connections to all managed targets. An agent communicating with a target on the same machine will usually not be required to traverse a firewall. This provides more flexibility in the communication protocol used between the agent and the target
The management agent is the primary management component for the managed target tier of the architecture. The agent is responsible for the discovery and coordination of management operations for a managed target. A management agent monitors the "targeted" infrastructure components and the host on which the agent has been deployed. Infrastructure components that are not hosted (i.e. firewalls, load balancers, etc.) can be monitored remotely by a management agent. Agents can also execute tasks as instructed by the Management Service.
Managed Target Tier
7-4 ORA Management and Monitoring

8
Summary 8-1
8Summary
As companies deploy emerging computing strategies such as Service-Oriented Architectures (SOA), Business Process Management (BPM), Business Intelligence, and Cloud Computing, which are designed to make functions, processes, information, and computing resources more available, the inadequacies of traditional tools are being highlighted.
Coupled with the fact that management and monitoring seems to be an afterthought for many development organizations, it has become imperative to have a management and monitoring framework that can cater to the requirements of these emerging computing strategies, integrate with the current management environment and facilitates improved information sharing, superior diagnostics and root cause analysis.
ORA Management and Monitoring describes an architecture that is designed to meet these criteria using an extensible framework. It presents architecture principles and advocates the use of components and standards to provide management and monitoring in a consistent and extensible manner.
Oracle Enterprise Manager can be used to implement any or all of the components outlined in the reference architecture. Oracle Enterprise Manager is a comprehensive suite of integrated products that are best-in-class.

8-2 ORA Management and Monitoring