Embed Size (px)
Citation preview

@Orbital Transfer Rocket EngineTechnology Program
Final Report Oxygen Materials Compatibility TestingContract/Task Order NAS3-23772-B.5NASACR-182195
January 1989
Prepared For:
National Aeronautics and Space AdministrationLewis Research Center
Cleveland, Ohio 44135
|I_ASA-C[_-182155) 0_RBI_ TRANSFER BOCKF.__._GI_E _ECH_IGI.OGY Pi_OGS&M-" CXIGE_ MI_._IALS
CCMPA_I_ILII_ _IS_IhG _inal _c_c_t (Ae_ojet
l_chSystess C¢.) 224 _ CSCL 21HG3/20
N89-1_256
unclas0185_88
AerqetTechSystemsConspamy
https://ntrs.nasa.gov/search.jsp?R=19890004885 2020-05-30T17:58:53+00:00Z


ORBIT TRANSFER ROCKET ENGINE TECHNOLOGY PROGRAM
CONTRACT NAS 3-23772 TASK ORDER B.5
FINAL REPORT OXYGEN MATERIALS COMPATIBILITY TESTING
Prepared by:
Leonard Schoenman
For:
NASA - Lewis Research Center
Cleveland, Ohio 44135
January 1989
RPT/CC0134


I. Report No. 2. Government Accession No.
NASA CR 1821954. Title and Subtitle
Orbit Transfer Rocket Technology ProgramOxygen Compatible Materials Testing Task Order B.5
7. Author(s)
L. Schoenman
9. Padorming Organization Name end A_ress
Aerojet TechSystems CompanySacramento, California
12. Spon_ring Agency Name and Address
National Aeronautics and Space AdministrationWashington, D.C. 20546
3. Reclpient's Catalog No.
5. Report Date
June 1988
6 Performing Organization Code
8. Performing Organization Report No.
10. Work Unit No.
11. Contract or Grant No.
NAS 3-23772
13 Type of Report end Period Covered
Final Report1983 to 1987
14. Sponsoring Agency Code
15 Supplementary Notes
Project Manager, John Kazaroff, NASA Lewis Research Center, Cleveland, Ohio
16 Abstract
Particle impact and frictional heating tests of metals in high pressure
oxygen, are conducted In support of the design of an advanced rocket engineoxygen turbopump. Materials having a wide range of thermodynamic properties
including heat of combustion and thermal diffusivity were compared in theirresistance to ignition and sustained burning. Copper, nickel and their alloys
were found superior to iron based and stainless steel alloys.
Some materials became more difficult to ignite as the oxygen pressure wasincreased from 7 to 21MPa (I000 to 3000 psla).
17 Key Words (Suggest_ by Authods)) 18 Distribution Statement
Metal ignition
Oxygen turbopump
Particle impact
Friction heatingMnnpl
19 Security Claself (of this report) _. Secudty Cluslf. _f this p_a) 21. No of pages
Unclassified Unclassified 259
*For sale _ the National T_hnical Information Se_ice, Springfield, Virginia 22161
Unclassified - Unlimited
22 Price"


FRT
GH2
GOX
ID
L
IbM/Sec, Kg/Sec
LH2
LOX
OD
OTV
PIT
RPM
S, Sec
T
TPA
Acronyms/ Nomenc I atu re
Friction Rubbing Test
Gaseous Hydrogen
Gaseous Oxygen
Inside Diameter
Load or Length
Mass Flow Rate
Liquid Hydrogen
Liquid Oxygen
Outside Diameter
Orbit Transfer Vehicle
Particle Impact Test
Rotational Speed Revolutions per Minute
Time Seconds
Temperature °F, °K
Turbopump Assembly
II


FOREWORD
This Task Order was performed in support of the design, fabrication and
testing of an advanced oxygen turbopump required for the Space Based Orbit
Transfer Vehicle Propulsion System employing the Aerojet dual propellant
expander cycle. The experimental results reported herein are applicable to a
wide range of components and applications in which high pressure oxygen flows
at high velocities or is In contact with high speed moving metallic surfaces,
and where safety and reliability are of primary importance.
This Final Report combines a series of progress reports by Schoenman
et al (Ref. I-6) covering the period from 1983 through 1987 in which five
categories of testing were conducted as follows:
1983-1984 Particle Impact Testing
Like Material Friction Induced Ignition
1984-1985 Oxygen Pressure Sensitivity in Friction Heating
1985-1986 Unlike Material Friction Induced Ignition
1986-1987 The Effect of Surface Modifications on
Monel K-500 Wear and Friction Heating
Three organizations were involved in the execution of this program.
NASA LeRC provided funding under the direction of contract monitors;
L. Cooper, J.P. Wanhainen_and D Scheer. The NASA Lewis Research Center Task
Manager was John Kazaroff. The planning, analysis and documentation were
provided by Len Schoenman of the Aerojet TechSystems Company. The testing and
data processing were conducted at the NASA-JSC Whlte Sands Test Facility under
the direction of Frank Benz, Joel Stoltzfus and Mohan Gungi.
lli


TABLE OF CONTENTS
Io
II.
Ill.
IV.
V.
VI.
Vll.
Introduction
Program Task Objectives
Data Base
Turbopump and Test Material Selection
Test Methods
A. Selection
B. Test System Description
1. Particle Impact Test (PIT)
2. Frictional Heating Test Apparatus (FRT)
Test Results
A. Particle Impact Results
I. Test with Impact Plates
2. Test with Rupture Disks
B. Friction Heating Test Results
1. Like Materials
2. Friction Heating of Unlike Materials
3. Gas Composition and Pressure Effects in
Friction Rubbing
4. Temperature Oscillations
5. Burn Factor Correlation
Friction Heating and Wear Rates of Monel K-500 in Oxygen
A. Objectives and Background Data
I. Objectives
2. Background
B. Test Method
I. Apparatus
2. Measurements
3. Test Procedures
C. Surface Modifications
I. Test Specimen and Surface Modification Selections
1
12
13
18
24
24
24
24
31
43
43
43
50
55
56
62
78
87
90
98
98
98
9B
99
99
I00
105
105
I08
iv

TABLE OF CONTENTS (cont.)
D. Test Summary
I. Variable Loading Friction Tests
2. Constant Loading Friction Tests
E. Results and Discussions
I. Friction Heating
2. Comparison of Overall Wear
F. Effect of Surface Modifications
on Monel K-500 Wear Rates
G. Friction Coefficient
I. Friction Coefficients Variable
2. Constant Load Testing
H. Analysis of Indivldual Surface
I. Ion Implanted Oxygen
2. Ion Implanted Chromium
3. Ion Implanted Silver
4. Ion Implanted Lead
5. Electrodeposlted Chromium
6. Composite Plating of NiSiC
7. Electrodeposlted Silver
8. Electroplated Gold
I.
VIII.
References
Appendices
A.
B.
Conclusions
and Oxygen Pressure
Load Testing
Modifications
Photographic and Metallurgical Analyses
I. Pre Test Condition
2. Post Test Condition
and Recommendations
Particle Impact Data Summary
White Sands Report on Composition of Surface Modifications
Page111
111
111
115
115
124
134
148
148
152
152
152
153
154
155
155
156
157
157
157
158
164
184
187
A-I
B-1


LIST OF TABLES
Table No.
I
II
Ill
IV
V
VI
VII
VIII
IX
X
XI
XII
XIII
XIV
XV
XVI
XVII
XVIII
XIX
XX
Materials Selection Matrix
Heat of Combustion of Metals and Alloys
Burn Factor Ranking of Typical Materials
Candidate Materials Tested
Test Data Compilation for Friction Rubbing(Ramped Load)
Summary of Data for Dissimilar Materials
Test with Fixed Load Variable 02 Pressure
Average Heat Rate per Unit Area (PV Product) Required
for Ignition by Frictional Heating of Pairs of LikeMaterials
Baseline Data Comparison for Monel K-500
Rubbing of Low and High Burn Factor Metals (Copper andStainless Steel)
Rubbing of Low and Moderate Burn Factor Metals (Nickeland Monel K-500)
Rubbing of Moderate Burn Factor and Hlgh Burn Factor
Metals (Monel K-500 vs 316 Stainless Steel)
Rubbing of Moderate Burn Factor Metal and Ceramic
(Monel K-500 and Silicon Carbide)
Rubbing of Moderate Burn Factor Ceramic and High BurnFactor Metal (Silicon Carbide and Invar 36)
Comparison of Friction Heating Ignition of Copper 150and Brass 360 in. 6.9 MPa (I000 psia) Oxidizer at17,000 RPM
Monel K-500 Surface Modifications
Summary of Weight and Length Data for the VariableLoad Test
Constant (50 psi) Load Friction Tests in 6.9 MPa
(1000 psi) 02
Comparison of Peak Temperatures In the Time Interval0-40 s for Step Load and Constant Load
Comparison of Wear Data for Test Conducted with Step
Load Applied to the Samples at Ambient Oxygen and6.9 MPa (1000 psl) Oxygen Environment Pressure
Page19
21
23
23
58
59
6O
61
69
71
72
73
74
75
95
107
112
114
125
126
vi


LIST OF TABLES (cont.)
Table No.
XXI
XXII
XXIII
Comparison of Wear Data for Tests Conducted at
Constant 50 psi Load in 1000 psi Oxygen
Comparison of Wear Rates for Monel K-500 with SurfaceCoating with Step Load
Comparison of Wear Rates for Monel K-500 with Surface
Coating and Constant Load with 16-9 MPA (1000 psi)Oxygen Environment Pressure
Page
127
135
136
vii


LIST OF FIGURES
Figure No.
1
2
8
9
10
11
12
13
14
15
16
17
18
19
Standard Design Approach for LOX Turbopumps
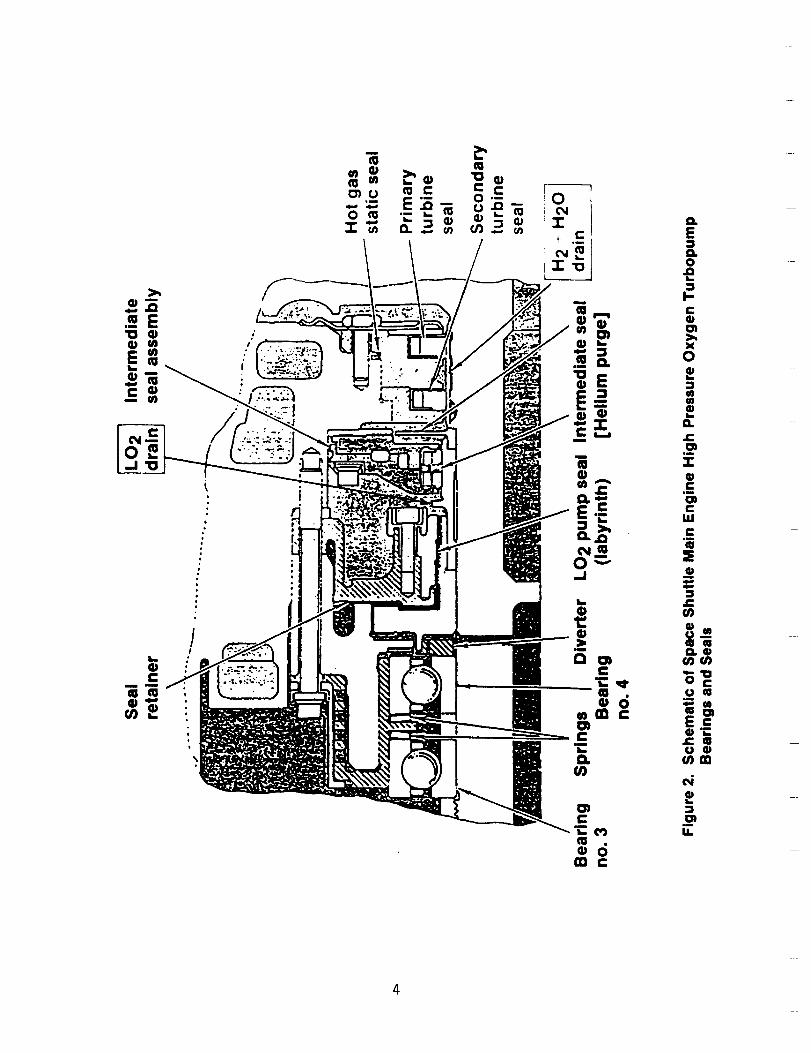
Schematic of Space Shuttle Main Engine High PressureOxygen Turbopump Bearings and Seals
Flow Schematic and Advantages of the Dual Propellant
Expander Cycle Engine
Schematic Design Approach to Gaseous Oxygen-Driven
Liquid Oxygen Pump for Dual-Propellant ExpanderCycle Engine
Advanced Turbopump Flow Paths and Seal Locations
Oxidizer Turbopump Components Fabricated fromMonel K-500 and Monel 400
Advanced Rocket Engine Oxygen Turbopump DesignParameters
Comparison of Ignition Temperatures of 304 StainlessSteel in Heated Oxygen Gas at High Pressure as
Determined by Resistance Heating with and withoutRupture
Range of Ignitabillty for Non-metallics
Range of Ignitability for Metals
Structural and Thermal Properties of Materials forUse in Oxygen
Test Methods for Material Ignition in Oxygen
Schematic of Particle Impact Test Apparatus
Particle Impact Test Assembly for Rupture DiskEvaluation
Particle Impact Test Assembly for Plate Impact Studies
Frictional Heating Test Apparatus
Frictional Rubbing Test Chamber
Torque Load Measurement as Mode (A) in OriginalFrictional Heating Apparatus and (B) in Test
Apparatus as Modified for the Pressure Study andall Subsequent Tests
Friction Rubbing Test Specimen Configurations
Page
2
4
6
8
9
10
14
16
17
2O
25
26
27
28
32
33
35
37
viii


LIST OF FIGURES
Figure No.
20
21
22
23
24
25
26
27
28
29
30
31
32
33
34
35
36
37
Selected Material Test Combinations and TheirCalculated Burn Factors
Typical Data from 02 Ramped Load Friction RubbingTest
5000 rpm - Monel K-500 Friction Rubbing Test Data
from GO2 Incrementally Stepped Pressure Test;100, 1000 and 3000 psi
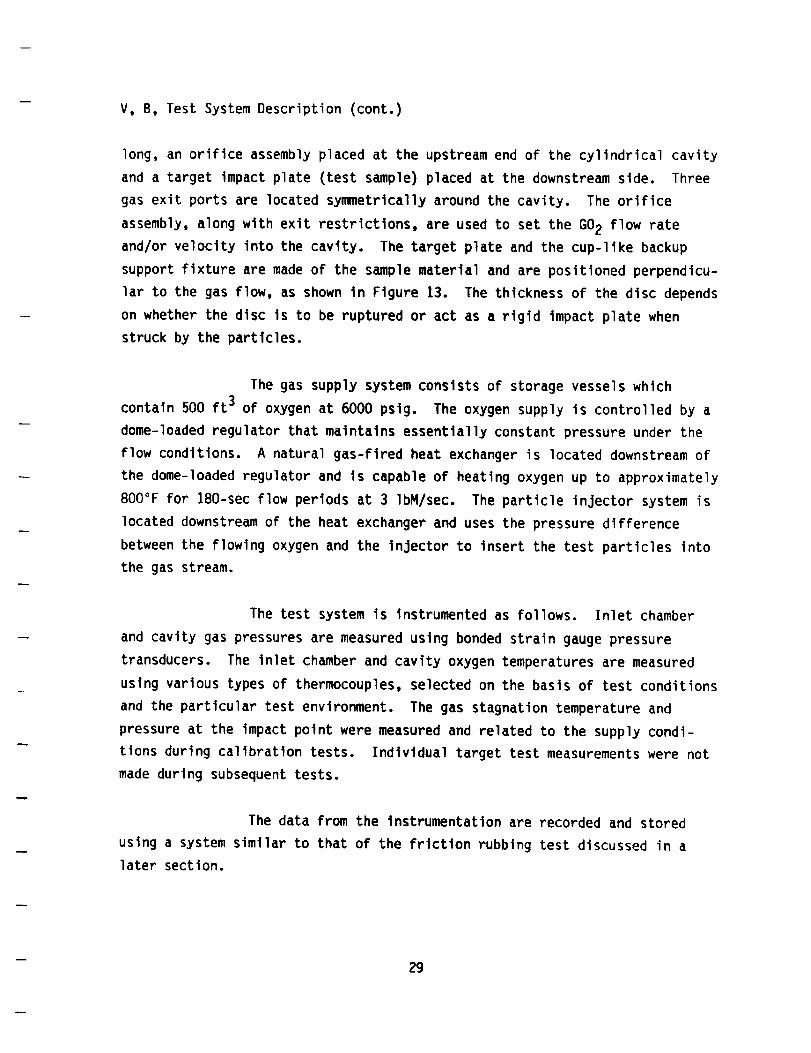
Impact Plates Showing ga) No Burning, (b) SlightEvidence of Burning, (c) Partial Burning
End View of a Test Chamber as it Appeared(a) Before Test and (b) After the Complete
Burn of an Impact Plate
Results of Particle Impact Tests on Impact Plates
Ignitions Experienced in Particle Impact Testingat 4500 psi
Examples of the Results of Particle Impact TestsUsing 316 Stainless Steel Rupture Disks
Comparison of Particle Impact Tests on CRES 316
Rupture Disks of Different Thickness and PlateImpact
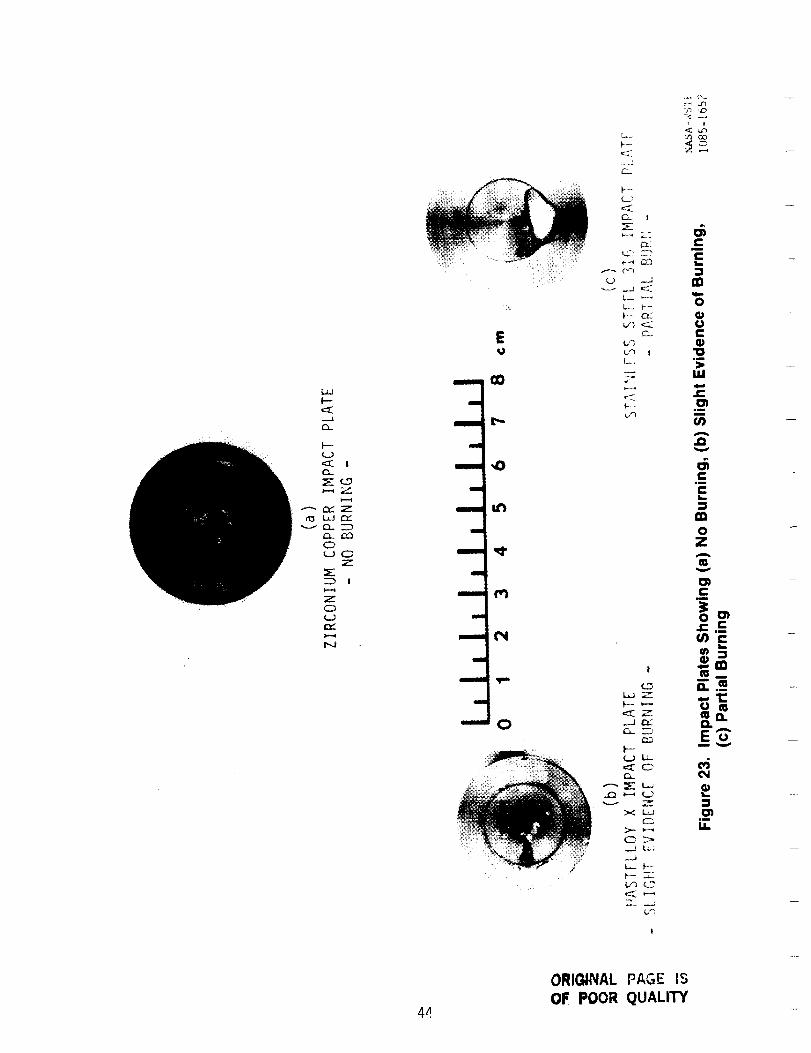
Particle Impact Test Results for Ni 200 Plate and
Rupture Disks
Test Specimen Design and Typical Results
9,000 RPM, I000 psi 02
Total Load vs Time Dissimilar Materials (Cu/Steel)Friction Heating Ignition Tests
Copper - Stainless Steel Friction Heating Test 02Pressure vs Time
Copper - Stainlees Steel Friction Heating IgnitionTest Displacement vs Time
Copper - Stainless Steel Friction Heating IgnitionTest Temperature vs Time
Copper - Stainless Steel Friction Coefficient
PV Products Required to Ignite Pairs of DifferentMaterials
Effect of 02 Pressure on Heating Rates of Monel 400
Page38
40
42
44
46
47
48
51
53
54
57
63
64
65
66
67
68
79
ix


LIST OF FIGURES (cont.)
Figure No.
38
39
40
41
42
43
44
45
46
47
48
49
50
51
52
53
54
55
56
57
58
Time to Ignition vs Oxygen Pressure
Load at Ignition vs Oxygen Pressure
Heat Rate per Unit Area Required for Ignition vs 02Pressure (from Benz and Stoltzfus)
Effect of 02 Pressure on Ignition Temperature
Effect of Surface Temperature and Oxygen Pressureon Friction Coefficient
Friction Heating of 1015 Carbon Steel, 02 and N2
Effect of Gas Pressure on Friction Heating Rates of1015 Steel Under Ramped Loading at 5000 RPM
Phase Comparison of Optical and ThermocoupleTemperature Measurements
Effect of Oxygen Pressure on Thermal Cycle Time inRamped Loading Tests
Hypothesis of Events Leading to Ignition in FrictionRubbing Tests
Burn Factor vs Ignition Temperature in 6.9 MPa
(I000 psl) 02
Burn Factor vs Load at Ignition in 6.9 MPa 02 at17,000 RPM
Thermal Diffuslvity Based Burn Factor Correlation
vs Experimental Ignition PXV Data
Comparison of Friction Heating Rate and Ignition ofBrass 360 and Copper 150
Correlation of Heat of Combustion with PV Product
for Metal Ignition
Typical Baseline Monel K-500 Power, Load and
Temperature vs Time Data 14.7 psla 02 17,000 RPM
Representative Data Set Unmodified Surface
Friction Coefficient Computed from Drive Power for
5 Load Steps (Untreated Monel K-500, 1000 psia 02,17,000 RPM)
Test Specimen Design
Cross-Section of NYE-Carb ®Composite
Superposltlon of Friction Heating Data of Monel K-500,
2 Tests at 1000 psia, 2 Tests as 14.7 psla
Paqe
79
80
80
82
84
85
86
86
88
89
91
92
93
94
96
101
103
104
106
110
116


LIST OF FIGURES (cont.)
Figure No.
59
60
61
62
63
64
65
66
67
68
69
7O
71
72
73
74
75
76
77
Comparison of Friction Heating of Monel K-500 in
1000 psla 02 with Selected Surface Treatments
Comparison of Maximum Surface Temperatures forMonel K-500 in Low and Hlgh Pressure Oxygen with
Surface Modifications and a Step Load
Friction Heating of Monel K-500 In 1000 psia 02at 17,000 RPM Contact Pressure 50 psi for 40 sec
Maximum Temperature Observed in 6.9 MPa 02, ConstantLoad Testing
Maximum Temperature Observed in 6.9 MPa 02, ConstantLoad Testing
Sample Wear Rates vs Time, Load, and OxygenPressure at 17,000 RPM
Displacement (Wear) Measurements for Untreated
Monel K-500 in 1000 psia Oxygen
Wear Data at Constant 50 psi Load for 300 sec
02 = 1000 psia
Wear Data for Stepped Loading Cycle (02 = 1000 psia)
Wear Data for Stepped Loading Cycle (02 = 12.7 psla)
Wear Rate of Untreated Monel K-500 in 14.7 and
1000 psi Oxygen at a Contact Pressure of 50 psi
Correlation of Material Loss Rate by the ArrheniusRelation
Wear Rates vs Time Monel K-500 02 = 1000 psia
Post Test Hardness Profile Untreated Monel K-500
6.9 MPa (1000 psia) 02 Step Loading
Post Test Hardness Profile Untreated Monel K-500
6.9 MPa (1000 psia) 02 , Constant Loading
Comparison of Displacement Measurements for Ion
Implanted Cr from Tests 175 and 181 1000 psi 02 ,50 psi Contact Load
Effect of Surface Modification on Wear Rate
and in 02 at 6.9 MPa (1000 psi)
Effect of Surface Modification on Wear Rate as
a Function of Contact Pressure in 6.9 MPa
(1000 psla) 02
Comparison of Wear Rates in Low (14.7 psla) and High(1000 psia) Oxygen
Paqe
118
119
120
122
123
129
130
131
132
133
138
139
140
142
143
145
146
147
149
xi

LIST OF FIGURES (cont.)
Figure No.
78
79
80
81
81a
82
83
84
85
86
87
88
89
90
91
92
93
94
95
96
Summary of Friction Coefficients at 14.7 and 1000 psia
02 17,000 RPM
Comparison of Friction Coefficients in 1000 psi Oxygen
Pretest Photos of Surface Modified Test Specimen
Pretest Surface Comparisons of E1ectrolized Cr, Ion
Implanted Surfaces and NYE Carb (Ni + SiC)
Pretest Surface Comparisons (continued)
Surface Composition 02 Ion Implanted Monel K-500
Composition Profile 02 Ion Implanted Monel K-500
Surface Modified Monel K-500 After Step Load Testingin Oxygen at Ambient Pressure
Surface Modified Monel K-500 After Testing 6.9 MPa
(1000 psia) Oxygen
E1ectroplated Silver Post Test 108, 02 = 6.9 MPa(1000 psi)
Friction Rubbing of Electroplated Gold in Oxygen Testing
Monel K-500 Without Surface Modifications, Following
Test 75 in 02 at I ATM and Test 86 at 6.9 MPa(1000 psia)
Ion Implanted Oxygen Post Test 81 and 79 Low and HighOxygen Pressure
Ion Implanted Chronium Post Test 87 and 80 Low and
High Oxygen Pressure
Monel K-500 with Composite Ni + 30% SiC, Post Test
No. 85, 6.9 MPa, I000 psia
Photomicrograph FRT Specimen No. IPb6, 14.7 psia
02 400 X
Ion Implanted Lead Specimen Post Test No. 91
02 = I ATM
Blistered Zone Ion Implanted Lead Post Test No. 91
02 1ATM
Spalled Zone Ion Implanted Lead Test Post Test No. 91
Ion Implanted Lead Post Test No. 82 02 6.9 MPa(1000 psia)
Page
150
151
159
160
161
162
163
165
166
167
168
169
170
171
172
173
174
175
176
177
xil


LIST OF FIGURES (cont.)
Figure No.
97
98
99
Spalled and Cracked Region Ion Implanted Lead Post Test
No. 82 02 6.9 MPa (1000 psia)
Ion Implanted Silver Post Test 90 Specimen IAG-4
02 = I ATM
Ion Implanted Silver Post Test No. 81 Specimen IAG-2,
02 = 6.9 MPa
Page178
179
180
xlli


I. INTRODUCTION
TASK SIGNIFICANCE IN RELATION TO THE ORBIT TRANSFER VEHICLE PROPULSION
The Reusable Orbit Transfer Vehicle represents a national goal which
complements a permanent presence of man in Space, starting with the Space
Station in the 1990's.
In a continuing effort to develop a more economical Space Transporta-
tion System, the NASA (Cooper (Ref. 7) has defined a series of propulsion
goals for a new generation of space-basedOrbit Transfer Vehicles (OTV). The
propulsion system for these vehicles would utilize hydrogen and oxygen as
propellants and deliver a specific impulse approaching 500 ]bF-sec/IbM. The
OTVs would be transported to the space station in the STS Orbiter starting in
the mid-1990's. Operating out of a fueling station located near the space
station, each of these OTVs will make up to I00 round-trip flights, trans-
porting numerous types of manned and unmanned payloads to and from higher
orbits, including geosynchronous and also perform translunar and planetary
missions.
The desired performance goals can be approached only by utilizing
engines which combine much higher operating pressures with higher expansion
ratio nozzles. The need for longer life and a minimum maintenance in conjunc-
tion with the higher operating pressures is the real technical challenge.
The use of a fuel rich gas to power a turbine which drives a lOX pump
creates a problem in seal maintenance and safety.
The industry standard design approach utilizing fuel or fuel-rich
combustion gas to drive a LOX pump is shown schematically in Figure I. The
fuel rich turbine drive gas is selected for bipropellant rocket applications
as a means of lowering the combustion temperature to a level compatible with
engineering materials. The alternative oxidizer rich drive gas which can also
provide acceptable temperatures is not common to the industry because most
prior demonstration attempts have resulted metal ignition and burning.

Hlgh pressure
t L02
Vented series seals
Interpropellant
seal cavity
Low pressure
LO2
Fuel Rich
Turbine drive Gas
Pump -_ He purge gas
Figure 1. Standard Design Approach for LOX Turbopumps

I, Introduction (cont.)
A detailed review of pump-fed blpropellant engine designs has identi-
fied three critical areas of engine maintenance common to all designs, i.e.,
(1) the hlgh-speed (50,000 to 100,000 rpm) dynamic interpropellant shaft seal
which separates the fuel-drlven turbine (direct drive or fuel-cooled gearbox)
from the oxygen pump, (2) excessive wear rates on propellant-cooled rolling
contact bearings, and (3) turbine blade wear and cracking resulting from rapid
engine transient heating and hlgh operating temperature.
The hazards and life limitations of interpropellant seals are as
follows:
High rubbing speeds, combined with even a minor level of vibration
and repeated thermal cycling, result in seal wear and eventual
leakage. The potential of hydrogen and oxygen leakage into a
common cavity provides an unacceptable fire or explosion hazard.
Existing engine designs, such as the Titan, avoid the interpropellant
seal problem by utilizing an oil lubricated gear system. This, however,
results in other maintenance and cooling needs. The RL-IO utilizes H2 propel-
lant cooled gears to synchronize the hydrogen and oxygen pumps and has similar
interpropellant seal limitations.
The SSME utilizes redundant seals and a helium purge, as shown in
Figure 2. This solution is acceptable, except for the additional weight of
the helium purge system. Since ground checks, maintenance and helium replace-
ment are possible following each flight (one engine start per flight), seals
with excessive wear and leakage can be replaced. Such is not the case for
space-based OTV where three or more engine restarts may be required for a
single mission and between-flight maintenance is even more costly and diffi-
cult and helium must be transported from earth.
3
I1
E
Q.0
.Q
I-
@
x0
w
IDL-
n
c
cw
e_

I, Introduction (cont.)
The technology being developed for the new Aerojet OTV engine under
NASA Contract NAS 3-23772 employs a design concept which eliminates the need
for purging and leak-free, high-speed seals. The new engine cycle and pump
design schematically shown in Figures 3 and 4 uses GO2 to drive the LOX pump
and GH2 to drive the LH2 pump, thus allowing the drive and pumped fluid to
commingle without hazard or loss in performance. Leakage past noncontacting
labyrinth seals is recycled internal to the respective pumps which can he all-
welded assemblies.
The new pump design shown in Figures 5 and 6 eliminates rolling contact
bearings which can become a hazard as the bearings age. These are replaced
with oxygen pressurized hydrostatic bearings which will provide unlimited wear
life capability. The unique material aspects of this design are that it is
free of nonmetallic seals which often provide a point of low temperature
ignition under adiabatic compression, and it is nearly free of iron and chrome
containing alloys. The reason for this unusual design approach will become
apparent in the subsequent chapters of this report.
The engine cycle which makes the GO2 available to drive the turbine
does not require high turbine inlet temperatures [478K (400°F)] at maximum
power and therefore eliminates the usual turbine hot section life problems.
This new approach, however, is not without concerns relative to the use
of high-pressure, high-velocity oxygen as noted by the operating speeds,
pumping power and severe weight and size limitations defined in Figure 7.

\
\\
\ _\ _'-\\ \\ \\\ \\ \\\ \
\
\
• \
f
i
_m
(n4)
r"
(n
(_ _-
(_ (1)
o. E,._ (/) .0.,Q. _) "0L_ _') .m
::3 mG)
< .c_ a.
.__ --iam
X • • •O
\\ \'\ \ \
._innn
_nn
Ibm
q)"0CmQ.X
ill
Cm
m
0O.0L_
(1.m
w
(2
0.1=4mr
qm
0mG)
(uCm=D
'I0
"0CmrJ
m_
m •E_C
,1_ c-
O _
o!.-
,-1
4_
lit
6

0.-I
L_
.13
E
F--"
....... i
0
J
I
E
C
o
-I
C0
Q
0 _C
m- 0
o_
0 m
mm m
Qo
m_E=oa
u_
40
-!

||
_ .-_ r,e
_0
La- e_ I--
_'3 -'r" V'l I_.
-a-
_=ioo
i-=
"Jr-
0._I
e_ew
ewr*e
...I
e_e
0la.
0_--
e_
w ,,_ Q-
":_0
w
I--
M
C
0
mo0
.J
m
c
m
m
Ou.Q.ED
O
L_D
OO
m
O
D
U.
8

ORIC_NAL PAGE IS
DE la_)OR QUALITY
0o
m
t-O
"OCm
O
!
i-
CO
EO
"O
mO
,m
C
COQ.EO
¢J
E
Q.O
.IO
I-"
N
"O
O
Im
9

TURBINE EXHAUST
FLOW TO ROCKET
i INDUCER COMBUSTION CHAMBER, ,1_ I _'_SINGLESTAGE
/ HYDROSTATIC BEARING_
/ 2THR_-USTI:2..JOURNA L -L COMBusHEATFROI_ N
PUMP STAGE COOLING
ASSEMBLY WEIGHT 4.3 kg
FLOW RATE 2.5 kg/secTURBINE SHP 159 HP
SPEED 75,000 RPM
PUMP TURBINE
02 INLET TEMPERATURE (K) 89 478
02 INLET PRESSURE (ATM) 2 306
0 2 DISCHARGEPRESSURE (ATM) 313 163
Figure 7. Advanced Rocket Engine Oxygen Turbopump Design Parameters
10

I, Introduction (cont.)
The hazards of metal ignition and burning are the subject for this
investigation. The materials ignition hazards associated with the use of warm
GO2 in rotating machinery are as follows:
Adiabatic Compression
Mechanical Rub
• Thermal Growth
- Bearings
- Turbine Tip
• Bearing Failures
• Startup and Shutdown Transients
Debris
• Impact of Foreign Materials
• Rubbing of Foreign Materials
From well documented oxygen fire experience, it is quite apparent that
proper material selection, as well as design, is a key factor in demonstrating
the concept feasibility.
11

II. PROGRAM TASK OBJECTIVES
The experimental program had multiple objectives. The initial objec-
tives were to create a data base for metal ignition thresholds under condi-
tions which simulated the OTV bearing and turbine environment. The experi-
mental parameters included oxygen pressure, and temperature, surface rubbing,
and high speed oxygen flow with entrained contamination particles. The use of
analytical parameters to pre-deflne the relative goodness of candidate mate-
rials was also a primary objective.
As the experimental project evolved, and data were examined, additional
objectives were incorporated. One was to develop a plausible explanation for
the observation that certain metals became much more difficult to ignite in
friction heating when the oxygen pressure increased while others showed little
benefit. Another was to determine if surface modification of the selected
turbopump material (Monel K-500) could be used to reduce the friction heating
and the wear rates and if the in situ formation of natural oxide lubricants
could be used to advantage.
12

II[. DATA BASE
A large number of experimental material ignition studies in oxygen have
been conducted. Dean & Thompson 8 investigated the ignition and subsequent
burning of 19 materials in oxygen at pressures between 3.4 and 54 ATM (50 and
800 psia) using electrically heated tubes. In these tests most materials
could be heated to temperatures approaching their melting points before igni-
tion took place. The data suggested that many but not all of the materials
were more susceptible to ignition as the pressure increased, and once ignited,
experienced higher burning rates. These early data identified the more common
iron based alloys to be more ignition prone than the nickel base alloys.
Monroe & Bates9,10 also conducted electrically heated tests on similar
materials in oxygen at pressure between 17 and 68 ATM (250 and 1000 psia). In
contrast to the earlier work, these experiments forced a sample rupture which
simulated a compressor mechanical failure. The rupture introduced two addi-
tlonal variables: one was the exposure of fresh metal unprotected by an
existing oxide film, the second was the external energy applied at the frac-
ture surface. The environmental temperature at which ignition was reported is
significantly different for the two test methods as shown in Figure 8 for
304 stainless steel. Bates reported ignition at temperatures as low as
533°K (500°F) when specimens ruptured in 54 ATM (800 psi) 02 while Dean
reported that ignition did not occur until nearly the material melting point
= 1533°K (2300°F). Neither reference provided data at the higher OTV oper-
ating pressures.
Even more recently, Bransford II heated aluminum in oxygen using a laser
heat source with care given not to disturb the oxide film on the molten alumi-
num surface. Bransford was able to raise the aluminum surface temperature to
Ig30°K (3500°F) prior to experiencing ignition. This compares with 802°K
(1100°F) for Dean and under 449°K (350°F) for Bates using their respective
test method. Based on these reported test results, it can be postulated with
a reasonable level of confidence that the presence and nature of the surface
oxide are factors which must be accounted for in selecting a test method and
ignition criteria.
13

,<m
(na.
n.::)u)u)i¢1n-n
1000
ELECTRIC RESISTANCE HEATED
HEATED AND
URE
0 J I 10 500 1000 1500 2000
tJI
TEMPERATURE AT IGNITION, °F
Figure 8. Comparison of Ignition Temperatures of 304 Stainless Steel in Heated Oxygen
Gas at High Pressure as Determined by Resistance Heating With andWithout Rupture
14

Ill, Data Base (cont.)
The early work identified the most common iron-based alloys and stain-
less steels to be much more prone to ignition and rapid burning than the
nickel-based alloys. Pure nickel appeared to provide exceptionally good
resistance to ignition. These tests, however, did not simulate the dynamic
environments of high-speed turbines, pumps, bearings, and seals.
In the subsequent years a large data base has been accumulated by the
Compressed Gas Association, the NASA and subcontractors in support of the
Apollo Mission and by a recently formed ASTM sponsored G-4 committee for
compatibility and sensitivity of materials in oxygen enriched atmospheres.
Figures 9 and 10 reproduced from a 1983 NASA Ref. Publication 1113
"Design Guide for High Pressure Oxygen Systems" summarize the material experi-
ence base. These two figures indicate range of ignitability for the most
common non-metallics and metals respectively. First it should be noted that
all non-metallics listed with the exception of the metal oxides such as
Alumina, have the potential to ignite in oxygen at pressures which are low
compared to the operational requirements of the OTV engine. Since the
conditions under which these non-metallics can ignite are configuration
sensitive, environment sensitive and application sensitive as well as material
batch sensitive; the first OTV engine design ground rule was "No Soft Seal
Materials will be Allowed."
Referring to Figure 10, which provides only a brief list of common
engineering metals, it can be seen that nearly half are unacceptable at OTV
operating pressures 34 MPa (5000 psi). Even metals which were previously
considered acceptable such as Aluminum bronze have been downgraded based on
data generated after 1983. Unacceptable metals include stainless steel and
aluminum alloys that are in common use in oxygen systems. A simple yes/no
criteria for metal selection is known to be inadequate as the ignition
thresholds have been demonstrated to be application sensitive. It is known
that data obtained by static heating of metals in high pressure oxygen will
understate the true ignition hazard, and thus additional testing under simu-
lated dynamic environments is required.
15

Material
Alumina
Teflon, PTFETeflon, glass-filled
Asbestos
Viton Rubber 1502
Viton Rubber
(Parker Seal V747-70)
KEL-F
Teflon, FEP
Silicone rubber
(Parco Seal 1235-70)
Vespel SP-21
NylonTecfluorfil B
Vespel SP-211
Vespel SP-1Silastic 675
Ty-Ply-3 adhesive
Neoprene Rubber
Chloroprene
(Parker Seal C-557)
Loctite 222
EPR (Parker Seal E-529)
Butyl rubber
Epoxy glass laminateEccobond 104
M-Bond 610
Noryl plastic
0
/ i!!__
I
I
/
/
/
Pressure, 1000 Iblin2
2 3 4 5 6
_:i::!::_::::!iiiiiiii:::i:i:i:i?.i:_:i::_:_,_:_:!:_:!__:.':_:_..:.:_
:'!:_:i:i:.::i:_:_.:_::_.i:_;.:i:.:....P:,..x.:. _.;_._!"''":<'P:::.:.:i_.)_::._.:.::::':::_._.:E_:_:i:_:i¢i:.P:::p..:.:::_.::.:_.:_.!:_,:_
!_:..'._::i_._.p:.:.p:-:.:.pp
i:_:_::::::::>.:::::::::::::_:::"/':::::_
,'Jr,_*_l:..:: _::_.::::.:.: p::>.::::::::.:::::•:_ .::::::::::::::
":."i_:i:i::::i!_!_i:i:ii_!# x::::::::..::If Jl:-.'.:.'e_.l-':;.:.'.P:-P:.;-.'.'.:.PP.'.PP."
•:. C:::::::::::::'_ _ _:-:-:-:°:
.::::::'. ::::: :::::::>:':i:
_i!..'.'_i_._.i!i!iiiii!_i_::::.":::::::: ::N::::::::P.::::.p:.:.:.::::::..::::::::::::::::':::::::::::::::::::....p:.:.:.p-.:..ppp:.p:...o.-......pp.....::.pp.opp:.:.p:
:::::::::.::pp.:.:.p:.p. @:..:o..:......-...o::....pp:..-.:.:.p:
.:.:.::::::::::::..:::::::::::-:::::
7 8
:':::::::::::P':::i::.:::.p>>:.:.:_.:-::::::::::P.:::.:.:.:.:_._.:.:.:...::.::>.:::::::::
:'-":".':'.:_.:P'::.::..:._::::::..::::.:->':::.+._.<:: ..:_.::::..._::_ .._.._,
_'-.":!:_:_:_:_:_:_:i_:P':::::::::":::':>":':':':':'::_:II:.:i':':::':":'P:':':::::':::::::_:::_:::::_:::!:!:'::'_
W.-:!::!:_:_._...:.:.>..... -:.:+:.:-:-.'.:.
:::::::_:::::::: :._:.:::::.:....:.:_.-:.:.:::..:::_:.:.:.::_!:::_..::.:_-_::?_:::.p:o:..'...°.... :::.i:::.p:@:.:.'.:.:.:.ppp:.."
:-::::::::::::::
[ i Not ignitable
P'JJJ,//'/I Ignition varies with lot
Always ignites
0 10 20 30
Pressure, MNIm2
50
Reference NASA Publication 1113
Figure 9. Range of Ignitability for Nonmetallics
16

Material
Gold
Silver
Nickel
Monel
Inconel
MP35N alloy
Beryllium copper
Aluminum bronze or
Phosphor bronze
Copper
Elgiloy
Hastelloy
NI-Span C
Brazing alloys
A-286 alloyPH stainless steels
Stainless steels
Aluminum alloys
Stellite or Stoody 2
Tungsten carbide
with 10% cobalt
Brass
Molybdenum/rheniumPermendur 2-V
Samarium cobalt
Magnesium
Solder
Carbon steel
K-601 (Kennametal alloy)
I J Not Ignitable
I/////J/'/_ Ignition varies with lot
li:i:i!!i!ii!ii!!i_iil Always ignites
iiii_
0
i_i_ii!ii
.:.1.:.:o
!::i}::i_i.%-...-.
"':::::!:i:
10
Pressure, 1000 Iblin 2
2 3 4 5 6 7 8
i:_:!:i:!:!iiii!iii;..°..,....
:_:i:i:!:i:i:i:i:i:!:
*:.:*:,:,:i:.:.:.:.:-:
ii!_ii!ii!!!• ,...,.° ....-.-.,..
iii_i!i_i!!ii!i_!%!iii_iiiiiiiiiiii_iii!_i_!_ii!_:::::o......... • .,.....,:.:.:,:.°1.:-:,:-:.:
!iiiiii_!i! i!iii!i!iii:• .-.-...* ,-,.., ,.-.
iiiiiiiiiiiiiiiiii
ii iiiiii:,;li:,i,i:,i;?i l:ii iii i il!! !ii!ili
.°..........,%. ......o,., . -,.,..-
iiiiiii!iiiiiiiiiii_!_!_i_i_i_!!iiii!ii
iiiiiiiiiiiii!i!il:-:.1"1-:, ,2.:':'1"i
20 30 40
Pressure, MNIm 2
5O
Reference NASA Publication 1113
Figure 10. Range of Ignitability for Metals
17

IV. TURBOPUMP AND TEST MATERIAL SELECTION
The primary criteria for material selection for a rocket engine turbo-
pump are generally structural margin, high cycle fatigue and material
density. In the case of a high pressure cryogenic pump requiring close
clearance bearings and turbine tips, thermal expansion coefficient and modulus
of elasticity become additional factors. In the case of an oxygen pump, the
resistance to ignition must also be included. Table I and Figure 11 itemize
some candidate materials that were suggested for use in an advanced oxygen
pump. Inconel 718 is most commonly selected because of its high strength and
good ductility at cryogenic temperatures.
In order for ignition to occur three things are required; a fuel, an
oxidizer and an ignition source. The turbopump material is the fuel and the
ignition source is the energy contained in the high speed rotational parts and
in the high velocity high pressure oxygen. The present approach to the
design/materlal selection is to remove as much of the energy contained in the
fuel as possible and to preclude the conversion of kinetic and potential
energy to concentrated thermal energy at local spots subject to rubbing or
impact. The additional material physical properties of interest in oxygen
applications are therefore; heat of combustion, thermal conductivity or
diffusivity, melting and ignition temperatures.
Table II from Ref. 12 overviews the heat of combustion of many common
engineering materials. The metals that appear on the bottom of the list will
be preferred as they represent very poor fuels. From a practlcal/engineering
viewpoint gold, silver, platinum, etc. in addltion to being high cost, are
structurally inadequate and heavy.
Moving up to the llst one finds copper and nickel and their alloys
highly attractive. The iron and chrome containing stainless steel alloys in
common use in oxygen systems are much less attractive.
Several different approaches have been suggested for combining the heat
of combustion, the thermal conductivity and the material melting point into a
single parameter which will allow ranking of metals for use in oxygen service.
18

r0
c(1) ._
q-
° _ _cr_
-_ ._ C °l,_C
C
_.J i_" :_ 4-) O w L.J::: _
0
J=l C 0 ._ X _-)
_ -_ o_ o _ _-J E ...1 _ O_
%
L
X
'r"
• _ .0 _
ou_
ff r_ g_
• ®_ 7°° o oz
.--_ _r
I--_0
Q OQ
o o
IM _ ! !• 0'_ v v
"_ "_ _ _ _" ..2.2
o o o _ _ "_ _0 o 0 0 x o 0 0 0
_ z z
r_
o
oo
_n
row
0
q--14-
II
LL.
N
_. =
_._- _ _.®,- ._ _ ,_< ,_• • • • • _"LL(._ _--) I---
j_ Ill 0 CL_
_,_ ._
_"_. _,Z<
19 OR]OI,tNAL PAGE |S
OF P_.QO_ _',J,_I_ITY

e5u_ u_
"_ _u0 0 0 O
0
0C_
00
U3
00
o0._' LL
z 0
V
0
000
A
o
6.
E
(3009....
C4)O_>,X
0c
o
o
0M
o
o
m
Eo
I-
c
L_
u.
ql6UaJIS pla!A
2O

OR_GfP!ALPAGE IS
OF POOR QUALITY
Table II. Heat of Combustion of Metals and Alloys
Materlal (Oxlde Formed) -BH c . cal/g a
Beryllium (8eO) 15.865Aluminum (AlaO,) 7.425Magneslum (MgO) $.900T_tanlum (TlOt) 4.710Chromium (CraO,) 2.600rerrttlc and Martensltlc Stainless Steels 1.900-2.000Austenltlc Stainless Steels 1.850-1.900Preclpltatlon Hardening Stainless Steels 1.850-1.950Carbon Steels 1.765-1.800Iron (Fe,Om) 1.765Manganese 1.673 dHolybdenum 1.458 dInconel 600e 1.300Aluminum Bronzes 1.100-1.400Zinc (ZnO) 1.270Tin (SnOI) 1.170Tungsten (WO, Assumed) 1.093 cCobalt (Coo)e 970 eNlckel (HI0) 980Hone1 4008 870Yellow Brass. 60 Cu/40 Zn 825Cartridge Brass, 70 Cu/30 Zn 790Red Brass, 85 Cu/15 Zn G90Bronze, 10 Snl2 Zn 555Copper (CuO) 58SCadmium (CdO) 541 cLead (PbO) 250Palladium (PdO) 192 cPlatinum (PtO,) 164c.eSilver (Ag20) 35Gold 1.9 d
-J._HXc . cal/cc b
29 35020 06210 26621.19518.72014 726-15.50014 850-15.25114 390-15.16713872-14.14713 872
-12 20014.90010 960
8 250-10,500g 0687 628-8.517
2109486338.7227,68269146.6155,9665.7515.2184.6792,8372.3083.520
36837
a I cal/g . 4.186 kJ/kg. (xcept as noted, from Lowrle (9).b Calculated from -AHc • density. I cal/cc • 4.186 J/ccc Heat of formation from Weast (10) and converted to Cal/g.d From Hust and Clark (15).• From Grosse and Conway (1).
Source, Reference 12
21
IV, Turbopump and Test Material Selection (cont.)
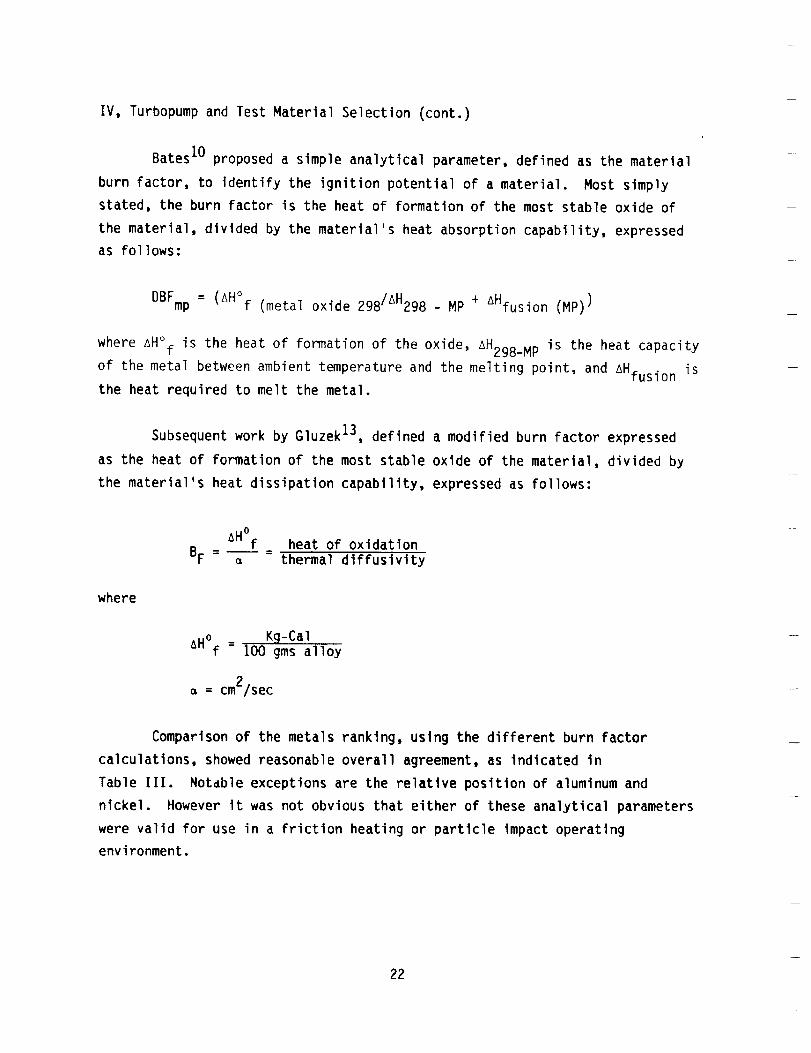
Bates I0 proposed a simple analytical parameter, defined as the material
burn factor, to identify the ignition potential of a material. Most simply
stated, the burn factor is the heat of formation of the most stable oxide of
the material, divided by the material's heat absorption capability, expressed
as follows:
DBFmp = (AH°f (metal oxide 298/_H298 - MP + aHfusion (MP))
where AH°f is the heat of formation of the oxide, _H298_MP is the heat capacity
of the metal between ambient temperature and the melting point, and aHfusion is
the heat required to melt the metal.
Subsequent work by Gluzek 13, defined a modified burn factor expressed
as the heat of formation of the most stable oxide of the material, divided by
the material's heat dissipation capability, expressed as follows:
where
BF =
_H°f heat of oxidat ion
thermal diffuslvity
Kg-CalAH°f = i00 gms alloy
: cm2/sec
Comparison of the metals ranking, using the different burn factor
calculations, showed reasonable overall agreement, as indicated in
Table Ill. Notable exceptions are the relative position of aluminum and
nickel. However It was not obvious that either of these analytical parameters
were valid for use in a friction heating or particle impact operating
environment.
22

IV, Turbopumpand Test Material Selection (cont.)
Table Ill. Burn Factor Ranking of Typical Materials
DynamicBurn FactorBates (Ref. 10)
a Burn Factor
Gluzek (Ref. 13)
Best Silver Silver
Copper CopperMonel 400 NickelMonel K 500 Aluminum
Nickel Monel 400Iron Iron
410 SS Monel K 500304 SS 410 SS
Poorest Aluminum 304 SS
The materials for this test program, as shown In Table IV, were
selected to provide a wide range of burn factors for candidate turbine and
pump materials so that the test results could be correlated with the predic-
tive method. The thermal diffusivity based BF was selected because it more
nearly matched the test results of Ref. 8 in terms of burning rate rank
order. However, it Is expected that test methods representing different
operating hazards could provide a different ranking of materials such that
more than one analytical ranking parameter will be required.
Table IV.
USN Deslgnatlon
C 15000N 02200
N 04400N 05500
N O6600
S 31651K 93601N 06002
Candidate Materials Tested
Burn*Common Name Factor
Zirconium Copper 35Nickel 200 550Silicon Carbide 1145
Monel 400 1390
Mone] K 500 2090Inconel 600 3226
316 Stainless Steel 4515Invar 5444
Hastelloy X 7160
* a
AHfO Cal-S
g_cm2
23

V. TEST METHODS
A. SELECTION
Numerous test methods are available for ranking the ignition
threshold of materials in oxygen. Figure 12 from Ref. 14 defines the avail-
able options. The test method has been shown to play a significant roll in
defining the material ignition threshold which is a Function of time dependent
energy input and physical forces acting on the surface where the energy is
being applied.
Since precise analytical models are not available, it is essential
that the selected test method reproduce both the heating and dynamic forces
expected in actual application. All forms of static testing were therefore
considered unacceptable for the present application in which particle impacts
and friction induced heating represents the most likely failure mode of the
turbopump.
B. TEST SYSTEM DESCRIPTION
Two types of tests were selected to evaluate materials and operat-
Ing hazards. The first was the high velocity particle impact test to simulate
solid particle contamination within the hot high speed 02 flow portion of the
turbine. The second was a friction heating test that simulated a turbine tip
rub or a bearing rub during a start or shutdown transient or loss of bearing
coolant.
All testing was conducted at the NASA White Sands Test Facility.
1. Particle Impact Test (PIT)
The PIT test system consists of a 2-in.-dia (OD), 3-1/2-in.-
long monel chamber connected to a high-flow, high-pressure, high-temperature
GO2 supply. The test chamber assembly shown in Figures 13, 14 and 15, con-
tains an upper cylindrical cavity which is 3/4 in. in diameter and 1 in.
24

ASTM-G63
• CALORIMETER TEST
• UNPRESSURIZED LIQUID OXYGEN
COMPATABILITY MECHANICAL IMPACT TEST
• LIMITING OXYGEN INDEX TEST
• AUTOGENEOUS IGNITION TEMPERATURE TEST
• GASEOUS FLUID IMPACT TEST
• PRESSURIZED MECHANICAL IMPACT TEST
• FRICTION RUBBING TEST
• PARTICLE IMPACT TEST
• PROMOTED IGNITION TEST
• ELECTRIC ARC TEST
OTHER TEST METHODS
• LASER HEATING
• RESONANCE CAVITY HEATING
Figure 12. Test Methods for Material Ignition in Oxygen
25

I
:7
0 '_
J i11
k.ul
C3_
r,.
ZtJ.J O
...u C)
z
z_"- L.ul O
_ ._1 _-....._Z C_;, I"--
..._.J ,,_ Z
r_
I---
I.J.J
'-.r-
O
LJ.-
o,uO
I'--
O
I
Ill
!,--
l/I0,1I,-
I=D
o_
IIIO.
O
om
I=
o
=1
.u
tiE
26
i ¸
_ItVi
l_!r_T!_ _I_ <
_?T_ i
7 _i:_i_
ORIGIHAL
OF POOR
_i_Tt_F _S_
PAGE IS
QUALITY
;oY
0.05 Ho!e Slze-_ '
0.65 Hole Diameter ..._/ 1200 >/:}. _120o /
i L / "_ . i , 1.48
_120 oj //
Rupture Disk Design _--
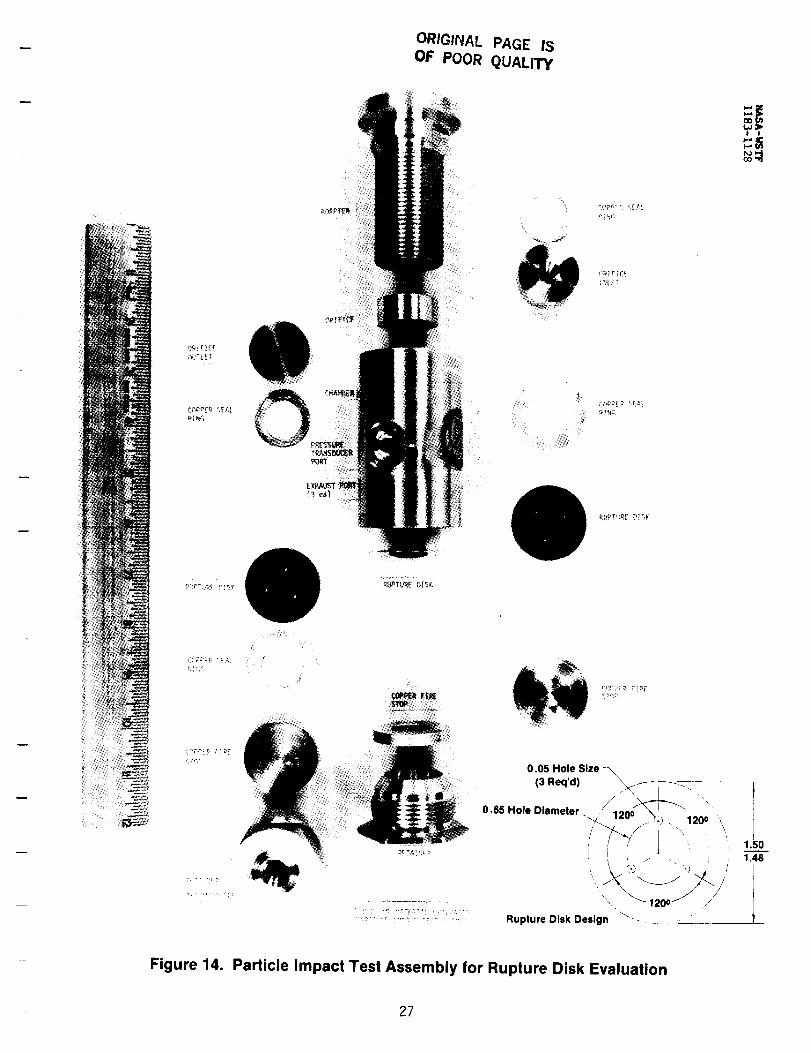
Figure 14. Particle Impact Test Assembly for Rupture Disk Evaluation
27

g_IFTCE
_TLET
|
IMPACT PLATE[_A_T PLAT_
..... 20
"_t .o_ / _ \ _-_.so -_++-+-._TI f \ _ ,
Impact Plate Design
Figure 15. Particle Impact Test Asembly for Plate Impact Studies
ORIGINAL P,aGE IS
28 OF. POOR QUALITY
V, B, Test System Description (cont.)
long, an orifice assembly placed at the upstream end of the cylindrical cavity
and a target impact plate (test sample) placed at the downstream side. Three
gas exit ports are located symmetrically around the cavity. The orifice
assembly, along with exit restrictions, are used to set the GO2 flow rate
and/or velocity into the cavity. The target plate and the cup-like backup
support fixture are made of the sample material and are positioned perpendicu-
lar to the gas flow, as shown in Figure 13. The thickness of the disc depends
on whether the disc is to be ruptured or act as a rigid impact plate when
struck by the particles.
The gas supply system consists of storage vessels whlch
contain 500 ft3 of oxygen at 6000 psig. The oxygen supply is controlled by a
dome-loaded regulator that maintains essentially constant pressure under the
flow conditions. A natural gas-fired heat exchanger is located downstream of
the dome-loaded regulator and is capable of heating oxygen up to approximately
800°F for 180-sec flow periods at 3 IbM/sec. The particle injector system is
located downstream of the heat exchanger and uses the pressure difference
between the flowing oxygen and the injector to insert the test particles into
the gas stream.
The test system is instrumented as follows. Inlet chamber
and cavity gas pressures are measured using bonded strain gauge pressure
transducers. The inlet chamber and cavity oxygen temperatures are measured
using various types of thermocouples, selected on the basis of test conditions
and the particular test environment. The gas stagnation temperature and
pressure at the impact point were measured and related to the supply condi-
tions during calibration tests. Individual target test measurements were not
made during subsequent tests.
The data from the instrumentation are recorded and stored
using a system similar to that of the friction rubbing test discussed in a
later section.
29

V, B, Test SystemDescription (cont.)
The particle material and size used in the testing were basedon the work of Porter 15 who conductedscreening tests of candidate particle
materials and sizes. In this earlier program, the materials and particlesizes evaluated were selected basedon sizes and types anticipated to be foundin the SpaceShuttle Main Enginepropulsion system. This led to the selection
of 2024Aluminum,and Inconel 718 at the 150 and 800 micron level. The
screening test data showedthat aluminumand larger particle sizes providedthe greatest probability of ignition up to the temperature limits of theprevious test series of 550°F. The present programutilized 1580-micron
aluminumalloy 2017-T4particles propelled by 4500 psi 02 at temperatures upto 800°F. The use of large aluminumparticles are believed to represent aworst case condition for metallic particle impact. The impact, and burning ofa single particle represents an energy release of 0.12 KJ or 5.9 KJ/cm2 at the
.02 cm2 impact areas. In this test methodten such particles randomlystrikethe 2.85 cm2 target surface area during each test. The calculated particle
velocity at impact is 260 M/S (853-ft/s).
The test procedure involves the preheating of the test speci-
menfor 30 sec with GO2, followed by sequential injection of I0 particles of2017-T4aluminumof 1580_mdiameter. Temperaturedata from the calibrationrun established the preheat time. The calibration measurementsrevealed a
standing shock waveaheadof the impact plate. A stagnation pressure of 1700psia wasmeasuredwhenthe pressure upstreamof the nozzle reached 4500 psi.Thedownstreamplenumpressure was 500 psia, as illustrated in Figure 13.
Temperaturesat the impact plate typically run 40 to 70°F higher than the
stream temperatures measuredin the upstreamflow.
In this test methodthe temperature of the GO2 is increasedin each sequential test up to the facility limits of 800°F or until a condi-
tion of metal ignition on impact is detected.
30

V, B, Test System Description (cont.)
Particle impact testing was conducted on two types of tar-
gets; thick plates which simulate rigid structures such as the turbopump or
valve housings and, and thin rupture discs which better simulate the thin
leading and trailing edges of turbine blades or vanes. Figures 14 and 15 show
the details of the test targets.
2. Friction Heatin9 Test Apparatus (FRT)
The WSTF frictional heating apparatus 16,17 shown in Figure 16
can simulate failure modes caused by rubbing of hydrostatic bearings and
turbine blade tips. The apparatus consists of a hlgh-pressure test chamber,
an electric motor and transmission assembly, and a pneumatic actuation
cylinder. The hlgh-pressure test chamber (Figure 17) consists of a
cylindrical chamber with an outside diameter of 12.7 cm (6 in.) and an inside
diameter of 3.B cm (1.5 in.) and fabricated from Monel 400. The internal
cavity of the chamber contains a replaceable copper sleeve and a gas cavity a
volume of 49 cm3 (3 in.3). The chamber contains a rotating shaft that extends
through the chamber attached at one end to the drive motor-transmlssion
assembly and at the other end to the pneumatic actuation cylinder. The drive
motor-transmission assembly is a 15 hp, constant speed electric motor, and a
variable speed belt-drlven transmission. The assembly provides the capability
to rotate the shaft at speeds over a range from 3,000 to 17,000 RPM. The
pneumatic actuation cylinder is pressurized with nitrogen and an actuation
linkage provides axial movement of the shaft and the capability to apply
normal loads of up to 3160 N (710 Ibf) on the test samples.
Identical water cooled copper housing assemblies containing
bearings and seals are attached to both ends of the chamber. Sealing of the
high-pressure oxygen chamber is accomplished by mounting two seals on the
rotating shaft in each housing on either side of a copper cooling block.
Water under high pressure cools the seals and provides a back-pressure to the
chamber pressure seals.
31

ROTATIONAL .-_
SPEED SENSOR_
TEST CHAMBER
WITH SHAFT
ENCLOSED -_
TEST GAS E_INLET/VENT LIN
DRIVE MOTOR AND
TRANSMISSION
ASSEMBLY
I_"I" ....._. THRUST
;ARING
HOUSING
NORMAL FORCELOAD CELL
AIR CYLINDER
LINEAR DISPLACEMENT
TRANSDUCER
Figure 16. Frictional Heating Test Apparatus
3?

SAMPLE TORQUE LOAD
CHAMBER
TEST GAS INLET/VENT
STATIONARY SAMPLE
Y SAMPLE
SHAFT
RPM
SAMPLE
TEMPERATURE
0.20 IN. FROM
INTERFACE
TWO-COLOR
PYROMETEROR THERMOPILE
TEST GAS
THERMOCOUPLE
(SHEATHED)
SAMPLE TEMPERATURE
0.05 IN. FROM INTERFACE
Figure 17. Friction Rubbing Test Chamber
33

V, B, Test System Description (cont.)
The metallic test samples provide a rubbing surface of 1.8
cm2 (0.28 in.2). One sample is mounted to the rotating shaft and the second
sample is affixed to the chamber via a sample mounting housing. Contact of
the two samples is accomplished by pulling the shaft and rotating sample
against the fixed sample using the pneumatic actuation assembly. In the
original design, the sample housing was attached directly to the chamber such
that, as the samples rubbed, torque was applied to the entire chamber. Move-
ment of the chamber was restrained by an extended arm, attached to the chamber
at one end, and positioned against a load cell at the other end (Figure 18a).
During the course of the program, a more accurate torque
measurement was required to support testing to determine the effect of varying
oxygen pressure on frictional heating of the test samples. The method for
measuring torque was changed by mounting the sample housing in a bearing which
was attached to the chamber. Movement of the sample housing is now restrained
by a pin positioned against a load cell (Figure 18b).
Oxygen or nitrogen are provided to the chamber via a high-
pressure gas distribution system which interfaces to the WSTF high-pressure
oxygen test facility. The system is capable of providing and regulating
oxygen up to 68.9 MPa (10,000 psia) and nitrogen up to 20.7 MPa (3000 psia).
The measured test parameters, instrumentation and range are
defined as follows:
a.
b.
Pressure in the gas chamber, digital Bourdon tube gauge
68.9 ± 0.7 MPa (10,000 psia)
Pressure in the pneumatic actuation cylinder, bonded
strain gauge transducer 6.9 ± 0.07 MPa (1000 psia)
34

TORQUE TRANSMITTED TO
STATIONARY TEST SAMPLE/_
TORQUE LOAD MEASURED _/
FROM TEST _ / /
sCHAM2 :SMEFREE TO ROTATE FIXED TO CHAMBER
(A)
TORQUELOADMEASURED7//DIRECTLYFROM _ /
TEST SAM_,
TEST CHAMBER _._ _,.
FIXED _STATIONARY TEST SAMPLE _'
FREE TO ROTATE
(B)
Figure 18. Torque Load Measurement as Made (A) in Original Frictional Heating
Apparatus and (B) in Test Apparatus as Modified for the Pressure Studyand All Subsequent Tests
35

V, B, Test System Description (cont.)
Cl Temperature oxygen/nitrogen gas, fixed specimen tempera-
ture at 0.13 and 0.51 cm (0.05 and 0.20 in.) from rub-
bing surface via .12 MM sheathed type K thermocouples
ranged 273 to 1477°K (0-2200°F).
A noncalibrated fast response themlopile is employed to sense
time phasing and relative intensity of the radiant energy at the rubbing
interface. The output data is useful in detecting the time of ignition and
thermal instabilities below 120OK. The applied normal load is measured by a
4450 ± 22 N (I000 Ibf) load cell, and torque from the rubbing samples by 890
± 5 N (202 Ib) load cell. Axial displacement of the rotating shaft or sample
wear is measured using a linear displacement transducer with an accuracy of
± 0.005 cm (0.002 in.). The rotational speed is sensed by a 0 to 20,000 RPM
indicator having an accuracy of ± 3 percent of full speed.
The data were digitally processed by a microprocessor and
stored on a floppy disk. Data from each instrumentation channel were stored
every i00 ms and represented an average value of eight readings taken 8 ms
prior to the stored value.
a. Test Sample Design Material and Preparation
The metal test specimens were machined from stock mate-
rial into hollow cylinders with outside diameters of 2.5 cm (I in.) and inside
diameters of 2.0 cm (0.8 in.) as shown in Figure 19. Two thermocouple wells
were drilled on the 00 of the cylinder at a specified distance from the rub-
bing surface as indicated above. The ceramic specimens were prepared using
proprietary procedures employed by the suppliers and were supplied in the
configuration shown in the figure. The samples were washed with a sodium
hydroxide solution, then with a phosphoric acid solution and, finally, with an
emulsion agent. The samples were rinsed with isopropyl alcohol and then Freon
113, dried with nitrogen and sealed individually in Teflon bags. Figure 20
summarizes the materials and material combinations employed in the various
friction heating tests.
36

0.376-_ _.-
.".___iii1 1_00
STANDARD
METAL
SPECIMEN
(ALL)
T ORIGINAL
SILICON1.24
CARBIDE
.._. METTECH CORP.
T MODIFIED
1.02 SILICON
_ CARBIDESA GRADE
Figure 19. Friction Rubbing Test Specimen Configurations
37

A LIKE MATERIALS TESTED IN 0 2
MATERIALS
BURN *
FACTOR
Zr Cu (Cu 150)Nickel 200
SILICON CARBIDE
MONEL 400
1015 CARBON STEEL
MONEL K 500
INCONEL 600
316 STAINLESS STEEL
INVAR-36
HASTELLOY X
* ZlHf/a
35
550
1145
1390
1400
2090
3226
4515
5444
7160
o: AT 70 ° F
B UNLIKE MATERIALS TESTED IN 0 2
MATERIALS
COPPER 150/316 STAINLESS STEEL
NICKEL (ELECTRODEPOSITED)
MONEL K-500
MONEL-K500/316 STAINLESS STEEL
INVAR 36/SILICON CARBIDE
MONEL-K500/SILICON CARBIDE
BURN
FACTOR
35/4515
550/2090
2090/4515
5444/1145
2090/1145
C LIKE MATERIALS TESTED IN N 2
MATERIALS
BURN
FACTOR
1015 CARBON STEEL
MONEL K-500
* Cai.S/g.cm 2
1400
2090
Figure 20. Selected Material Test Combinations and Their Calculated Burn Factors
38

V, B, Test System Description (cont.)
The silicon carbide test specimen design was changed
after the first test phase to eliminate the stress concentration produced by
the drive notches and the wall thickness was increased as shown. Minor modi-
fications to the rotating sample holder were made to allow the testing of the
new silicon carbide specimen.
b. Test Procedures and Conditions
Several types of test procedures were employed. One
procedure brought the specimens up to the desired rotational speed ±200 RPM in
the ambient temperature gas pressurized chamber without contact load. A
ramped compressive stress was then applied at a rate of .14 MPa/sec
(20 psi/sec) at the rubbing interface. The load continued to increase until
one of the Following events occurred.
(i) The specimen ignited, as determined by a rapid drop
in 02 pressure and increase in specimen tempera-
ture.
(z)
(3)
The maximum applied load of 3160N (710 Ibf) was
reached.
The ram moved its full travel length, 0.51 cm (0.2
in.), because the specimen had failed in compres-
sion or melted.
Figure 21 shows a typical set of data from a single test
utilizing fixed 02 pressure and ramped loading.
3g

A
¢oQZ
0a.
Q
0J
wJO.
aZ
oa.
LU
0
o
w
I
,OlD
_a
_$
_0
Z_
_Q
i;
I0
0
o
f_T u?g TLST al z _]'_
(,¢-M, gooe
,OAD,%%*
! ,
Q o_ o
TORQUE
TIME, SECONDS
14lie
|#INt
IdUI_ i oee
I'- t_e'K
hin . ell
ILl%_'= II
I¢/)
v
uJmr
U)¢/)I.g
ILlm
<'1"
TEMPERATURE IGNITION_
TES, T _PL( IGhITION
AT 90 $(C.
02 PRESSURE
o
>
O -soO
I"
I--
o14,1 i'O..i
0 _
"t-l--
THERMOPILE
I IttE, ._¢?C,t_D_
Figure 21. Typical Data from 0 2 Ramped Load Friction Rubbing Test
4O

V, B, Test System Description (cont.)
The second test procedure was designed to evaluate the
effect of gas composition and gas pressure on friction heating and utilized a
fixed speed and contact stress. In these tests, the rpm and contact stress
were flxed, and the gas (02 or N2) pressure was increased in steps from 0.69
to 21MPa (I00 to 3000) psi, in order to specifically observe the effect of
gas pressure on convective cooling with and without surface oxide reformation
during rubbing. Data from one such typical 02 test are shown in Figure 22.
The loads and speeds in these tests were selected to avoid ignition and were
thus much lower than the ramped load tests.
A third 5 step loading and unloading test procedure was
designed to measure the effect of surface modifications on the wear rate and
friction heating of Monel K-500 in oxygen. Monel K-500 was selected for this
test phase because it is the OTV turbopump material of construction. The
details of thls phase of testing are discussed in Section VII.
41

A
B
C
D
I00
I0
{i
4¢
i. - • .- . _i ¸ _..... _.... :, i .:- •
.... _....._.... _.......i......... , ...:- _.... i........:....
NORMAL LOAD (LBF)
- :, ; - - ; - ::- - - ':. .. : '.. ,.
}:30 • • - ; ....
'°°°I r_a •
I SOQ .......
,,,° i ,/ . i
.:5:3 ..... -, •i
?
: _ :.... :I"EMPERATtJRE :
N . ,
._, ..... :........_....... _...... :... _............... i ..... :.... ....... :.. :COEFFICIENT OF FRICTION
,d ; ...... ? ;
,.,_ _, 3. _: _ ;:-; ._ ._ ._ _ :- ._ ._,
TIME, SEC
Figure 22, 5000 RPMMonel K-500 Friction Rubbing Test Data from GO 2 Incrementally
Stepped Pressure Test; 100, 1000 and 3000 psi
42

VI. TEST RESULTS
A. PARTICLE IMPACT RESULTS
1. Test with Impact Plates
The following sections summarize the results of tests in
which impact plates were used as targets. Appendix A contains complete test
log and the results for individual tests.
a. Types of Ignition Event Observed
When subjected to particle impact, the impact plates
either did not burn, showed slight burning on the target surface, burned
partially, or burned completely, as shown in Figure 23. The results of a test
in which a zirconium copper sample did not ignite upon particle impact are
shown in Figure 23a. The dents made in the sample by the impacting particles
can be seen in the photograph. Similar dents typically appeared on impact
plates that did not ignite upon impact.
The results of a test in which a Hastelloy X sample
exhibited only slight surface burning upon particle impact are shown in Figure
23b. A small triangle-shaped marking extends from the center of a dent made
by an impacting particle. Careful observation of the mark reveals that some
of the material has been removed from the surface of the impact plate by
erosion or burning.
The results of a test in which a type 316 stainless
steel sample partially burned are shown in Figure 23c. A hole extending
through the target material is visible and indicates that partial combustion
of the test material occurred. Burning was quenched before the entire target
material was consumed. Each of the impact plates that burned partially
exhibited a similar burn pattern.
43
l--
c_
._-,-rF Z
0
Z
Z
W
4_
--J
c_
(_?
_.J
L_ _-
L_
I
z
z
l--
el
x
i_-
zz _.J
C
C
0
A
,i
C
0
zA
C
I/),"l_
mm
--IIIm_
Z'.__
im
_4
i._
ORIGgNAL PAGE IS
OF[ POOR QUALITY

VI, A, Particle Impact Results (cont.)
Chamber photographs taken before and after a test
in which a type 316 stainless steel target material burned completely are
shown in Figure 24. The target material, the back of which can be seen in the
photograph of the pretest assembly, was completely consumed by the reaction.
The retainer was almost completely destroyed and the test chamber was irrepar-
ably damaged. Such extensive damage to the test chamber was typical of the
tests in which target materials were totally consumed.
b. Test Results on Impact Plates
The ignition events resulting from the tests in which
target material were configured as impact plates are shown as a function of
the initial oxygen temperature in Figure 25. Complete burning occurred only
with samples of Invar 36 and type 316 stainless steel. In tests with
Invar 36, the sample burned completely in 6 out of 12 tests conducted at
oxygen temperatures above 625°K (655°F). The frequency with which the
Invar 36 burned completely appeared to increase as the oxygen temperature
increased. In the 29 tests conducted with type 316 stainless steel at oxygen
temperatures between 450 and 625°K (350 and 665°F), five tests resulted in
complete burning of the target, and six tests resulted in only slight surface
burning of the target. As shown in Figure 26 the frequency with which burning
occurred also appeared to be a function of the oxygen temperature for type 316
stainless steel.
When targets of Hastelloy X were tested, partial burning
occurred in 6 of the 19 tests conducted at oxygen temperatures above 625°K
(665°F), and slight surface burning was observed in one other test. The
frequency of the burning events appeared to increase as the oxygen temperature
was increased.
45

g
m
roll
IBB
t
I
Ilml
m
====l
Ill
m
m
E
00
¢N
0
t,,-<
P
_o
ioim
w ¢J
,_ Q.®EJ_mEct_ tqle-,_.(jo¢/h ,.-
m
®E
c •e-ILl.,.,
4
i1
46
ORIGINAL PAGE IS
OF POOR QUALITY

1
N
O
0 o0
00
0
0 0 00 0 0 00 0
OoO o O
OO
I,.-U
O
° oo o oO
O %.
O O oOOo O O
IOO OOO
O
• 0• -00 O0
_0 oo
0
OOJoo o_0 0
0 0O oO O C
G Oee lOo GO )
oO oO O
"I.-
Z m _ _
_OOQ) O
6o
i l ,I _ ,I i I l0 _ *0 0 ,0 0
_ N 8 I_ 10 e_l 0
)4 '3UFI.LVEI3dM3.L .L3"INI EI381_IVH3 .I.S3.L
4
I"
On
ue,
l_O
(.hid
Jj
,_luJI.- l.--
IOin
O Q
.-In"
U
_ozo
i
X
o
J
W
W
J
n
I'--U
ill.
mB
m
EI
0
oI-
ra
Em
n
mo._m
0
m
L_
,m
1,1,.
47

F--
Z
r-,."or)"-} L,J
,,, .,_r,m c_
z 0
Z
mr..
l.O"
0.I.
0.01
0.001
316-SS
I INVAR-36
HASTeI10y
II
_.-TEST FACILITYI TEMP LIMIT6
O 0 O0 O0
GO2 TEMP, °F
Figure 26. Ignitions Experienced in Particle Impact Testing at 4500 psi
48

VI, A, Particle Impact Results (cont.)
Samples of the remaining target materials either did not
burn or showed slight surface burning at oxygen temperatures above 625°K
(665°F). Monel 400 and silicon carbide showed no evidence of burning. Mone]
K-500 and zirconium copper showed slight surface burning, as did Nickel 200 in
one test. However, this one test with Nickel 200 that produced slight surface
burning was the ninth test in a series of ten tests using the same Nickel 200
target as the impact plate. The burning event may have been initiated from a
particle impacting on aluminum deposited on the surface of the target in the
previous eight tests. When Nlcke] 200 targets were replaced after each test,
no evidence of burning was observed out of five tests at oxygen temperatures
above 675°K (755°F).
c. Discussion of Test Results
The objective of these tests was to determine the rela-
tive resistance of selected materials to ignition by particle impact. In a
broad sense, Monel 400, silicon carbide, and Nickel 200, can be ranked as the
materials most resistant to ignition, since no samples of these materials were
observed to burn in the limited number of tests performed. Similarly, type
316 stainless steel and Invar 36 can be ranked as the materials least resis-
tant to ignition, since samples of these materials were observed to burn
completely.
However, an absolute rating for the remaining three
materials, which exhibited partial or slight surface burning, is difficult to
determine. In general, Hastelloy X, which exhibited partial burning, can be
ranked as less resistant to ignition than Monel K-500 and zirconium copper,
which exhibited only slight evidence of burning.
A comparison of 316 Stainless Steel with Invar 36 and
Hastelloy X at 31MPa (4500 psi) Is shown in Figure 26. The data presented
are the ratio of the number of tests resulting in metal burning to the total
49

Vl, A, Particle Impact Results (cont.)
numberof tests conductedwithin each 50°F temperature test band. The prob-ability of igniting the Invar 36 and Hastelloy X by contamination particleimpact is only slightly less than the 316 Stainless.
2. Test with Rupture Disks
Thin sheets of metal were employed to simulate the edges of
turbine blades to determine if impact and rupture is more or less severe than
impact only. The following sections summarize the results of tests in which
rupture disks of various thicknesses of type 316 stainless steel and Nickel
200 were used as targets. Appendix A contains complete test results for each
of the individual tests.
a. Types of Ignition Events Observed
When subjected to particle impact, the target materials
configured as rupture disks may neither rupture nor burn, rupture but not
burn, or rupture and burn completely, as shown In Figure 27. A rupture disk
as it appeared prior to test is shown In Figure 27a. The result from a par-
ticle impact test in which a disk neither ruptured nor burned is shown in
Figure 27b. Dents caused by the impact of the particles are visible. Similar
dents appeared on disks that neither ruptured nor burned upon impact.
The result of a test in which a disk was ruptured by the
particles but did not burn is shown in Figure 27c. The dents made in the disk
by the particles are visible. In some of the tests at the lower inlet gas
temperatures, dents appeared on the rupture disk but not on the back-up plate
behind the disk, indicating that the dlsk was hit and ruptured by the par-
ticles. In tests at higher inlet gas temperatures, dents appeared on both the
disk and back-up plate, indicating that the first particles to arrive hit and
ruptured the disk, and the following particles hlt and dented the backup
plate.
50

OR!Cr_i,_,I- PAGE !S
Of POOR QUALITY
0 1 2 3 4 5 b 7 8 cm
(a)
RUPTURE DISK BEFORE TEST
(b)p "r_ ' F) 'I" Nr10 ,UP,,JRE, _l b'JP.:,., ....
e
(d)RUPTURE PRIOR TO PARTICLE IMPACT
NO BURNING_.
(c)RUPTURE DUE TO PARTICLE IMPACT
NO BURNING
_': ....................................... I["Irl' Hr _._
(e)B,JRNED RUPTURE DISF
NASA-WSTFFigure 27. Examples of the Results of Particle Impact Tests Using ! _,___ 6_'_
316 Stainless Steel Rupture Disks
51

VI, A, Particle Impact Results (cont.)
A disk that was ruptured by gas flow over pressure prior
to impact by particles is shown in Figure 27d. No evidence exists that a
particle hit the disk and several dents can be seen on the backup plate. A
rupture disk that was burned is shown in Figure 27e. The material in the
impact area was consumed and the fire was quenched at the inside edge of the
copper seal ring.
b. Ignition Resistance of CRES-316 andNickel 200 Foil and Plate
In five tests of the 0.38 mm (0.015 in.) thick CRES-316
rupture disks, two did not rupture or burn and three ruptured but did not
burn. These results are displayed in Figure 28. When the temperature of the
inlet gas was increased above 513°K (465°F), the disk was ruptured by gas
pressurization prior to the impact of particles. For the rupture disks that
were 0.5 mm (0.020 in.) thick, two did not rupture and/or burn, three ruptured
but did not burn, and four ruptured and burned completely. Generally, the
disks also ruptured and burned more frequently at the higher temperatures. In
one case, the disk burned at only 480°K (420°F), which was 28°K (50°F) lower
than the temperature at which two disks neither ruptured nor burned. However,
it is uncertain if the disk ruptured and then burned, or if the disk did not
rupture but ignited and burned by only particle impacts.
The limited test results indicate that the rupturing of
thin 316 disks is not significantly worse than the impact on thick plates, and
if any trend could be observed it is one of lesser ignitions on thin sheet
possibly due to the manner and rate at which energy is transferred from the
particle to the target. The thin targets will deform and thus reduce the rate
of energy transfer, thus minimizing the temperature at the impact point.
Figure 29 shows the results of similar data for 0.13 and
.038 mm (0.005 and 0.015 in.) thick Nickel Z00 foil. No ignitions were
experienced in any of the testing at temperatures up to 650K (750°F). The
rupture of the thin material again produced no adverse effects.
52

oz"
I-.-,<n-bJ
I.iJI,-
t-1.1.1Jz
£1:IMrn
,,,¢-r"
I-
i,iI--
675
65O
625
600
575
550
525
500
475
450
42,5
400
®
0• Q
_)00
0
0
®
®
0 o
0
0
OQ
©U_
eooe
C_0
0
0
0
KEY
0 NO RUPTURE, NO BURtJING
RUPTURE, NO BURNING
SAMPLE PARTIALLY BURNED
• SAMPLE COMPLETELY BURNED
375 i l I0.38 mm THICK 0.51 mm THICK IMPACT PLATE
CONFIGURATION
Figure 28. Comparison of Particle Impact Tests on CRES 316 Rupture Disks of
Different Thickness and Plate Impact
52
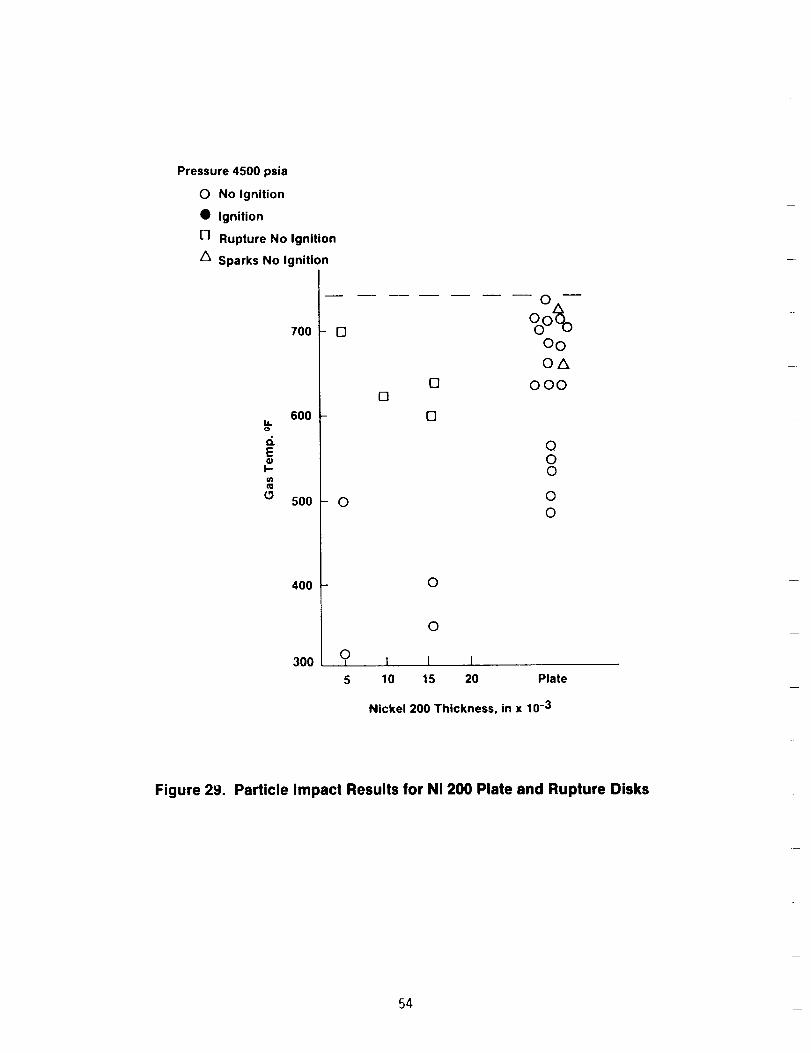
Pressure 4500 psia
O No Ignition
• Ignition
C] Rupture No Ignition
A Sparks No Ignition
M.o
E!-(/)
o
700
600
500
400
300
[]
I-1
0
I-1
[]
Oo
0A
OOO
0OO
O0
- O
o5
O
1 1 I
10 15 20 Plate
Nickel 200 Thickness, in x 10-3
Figure 29. Particle Impact Results for Ni 200 Plate and Rupture Disks
54

VI, Test Results (cont.)
B. FRICTION HEATING TEST RESULTS
The results from this test method are presented in four parts.
The first covers rubbing of llke materials that have burn factors ranging from
35 for copper to over 5000 for two iron based super alloys. The test vari-
ables include oxygen pressure and rubbing speed. The linearly increasing load
vs time method was used in all tests. The 2nd section covers the results from
unlike materials having different burn factors as listed in Figure 20. The
same time variable load was applied in each case. A single value for oxygen
pressure and surface speed was selected and comparisons of rubbing like and
unlike materials were made.
The third section discusses the friction results where the contact
load was kept constant and the gas pressure and composition was varied.
Comparison of the heating rates using oxygen and nitrogen in the test cell are
made.
The fourth section is focused on wear of Monel K-500, the material
employed for the OTV turbopump. The test parameters included oxygen pressure,
contact load and surface modifications which might be beneficial in reducing
friction heating and wear. The contact loads in these tests were much lower
than the previous tests in order to avoid burning and thus allow the wear
rates and the resulting surface damage following each test be measured and
observed. The test durations were extended to allow equilibrium thermal
conditions to be achieved and produce more easily measurable wear.
In addition to visual inspection of the failed specimen, several
different criteria were employed in ranking materials in there ability to
withstand ignition. One was simply the time required to produce ignition
under a fixed set of test conditions, i.e., RPM, oxygen pressure and load
application rate. A second is the material temperature at which ignition is
detected as measured by the thermocouple nearest the rubbing surface. The use
55

VI, B, Friction Heating Test Results (cont.)
of temperature eliminates differences In time to ignition caused by differ-
ences in the material friction coefficient and thermal conductivity. A third
often used criteria is energy based i.e., the product of the normal contact
pressure P and V, the surface rubbing velocity (PV).
Figure 30 shows the copper alloy 150 (Cu-0.15 Zr) and 316 stain-
less steel test specimen following a typical 6.9 MPa (lO00-psig), 9000-rpm
test. This copper alloy consistently failed in compression as the melting
temperature was approached and in no case did ignition occur. In contrast the
figure also shows one of the more severely burned stainless steel specimen.
Table V summarizes the ramped load tests conducted on similarly
configured specimens for different materials. In most situations, each test
condition was repeated three times and unless otherwise noted the most adverse
results were used for stating ignition threshold. Table Vl summarizes the
test results of unlike metals in ramped loading testing. Table VII summarizes
the testing using fixed loads in which the gas pressure was varied.
1. Like Materials
The relative ranking of materials was accomplished using data
obtained at the maximum speed capability of the machine (17,000 RPM) at 6.g
MPa (1000 psi) oxygen pressure which, at present, appears more adverse than
higher pressure for most materials. The effect of 02 pressure is discussed in
greater detail in subsequent sections.
Table VIII documents the ranking of the test materials based
on the average PV products obtained from the three test runs conducted on each
material. A high average PV product indicates greater resistance to ignition
by friction heating. Of the materials tested, nickel 200, Inconel 600, and
Cu-150 were the most resistant to ignition. The copper alloy 150 failed
mechanically and did not ignite in these tests. The PV products before the
samples failed were large enough to indicate that this material is just as
56

ORIGINAL PAGE IS
OF POOR QUALITY
o
i-a.
m
oIlc
t-O
ell
Oim
a,
ooo
a.n-
ooo
o
m
D.
I,-"ae-
e,,
IB
c-oE
Im
O
I,-
_m
i1
57

FRT
nO.
Table V.
Test Data Compilation for Friction Rubbing (Ramped Load)
RPM Speed Pressure, Load,' Rate, Post-test samples b Time offt/s IxJl psi psi/s Rotary Stationary test/$
Temp "F
at 0.05 in.
316 Stainless Steel
22 5000 19 1000 1577 16 R9 R7 100
23 5000 19 1000 1450 20 R9 R7U 70
24 5000 19 I0O9 1510 21 R9 R7U 69
32 9000 35 1000 608 21 R6E R6E 27
34 5000 19 3000 2143 24 R9 R9 86
35 3000 II I000 2705 17 N2 N2 > 155
84 9000 35 1000 597 21.3 R6E R6E 28
85 9000 35 1020 633 18.6 ROE R6E 34I01 SO00 19 I00 1163 18.$ R6E R6E 62
102 5000 19 0 1984 16.5 N2 N2 > 120
103 5000 19 50 877 19 N2 N3 45
104 5000 19 IO9 1365 20.4 ROE ROE 67
109 5000 19 500 1234 R6E R6U 56
140 17000 67 10O9 406 16 ROE ROE 24
141 17000 67 1000 512 18 N2 N2 28
143 ! 7000 67 1000 459 18 R6E R6E 25
5000 19 4500 2739 19 138
1500
14(30
200O
12001200
1600
>2000
22OO1800
8OO
4OO
1247
.450
Zirconium copper (Cu 150)
111 9000 35 1000 1181 19 -- --
145 17000 67 1000 1043 19 N5 N2146 17000 67 1000 1209 19 N5 N2 63
147 17000 67 1000 1556 19 N2 N3 75
148 17000 67 IO90 2288 15 N2 N3 115
1650
1880
1880
Nickd 200
142 17000 67 1002 1651 21 R7E R73 80
144 17000 67 1000 2 ! 82 19 RSU R7E 120
156 9000 35 1000 2313 21 N3 N3 105
157 13000 51 I000 2406 21 N3 N3 120
158 15000 59 1000 2355 N3 N3 112
161 17000 67 1000 2436 22 N N 120
17000 67 4000 2511 535 c N N 25
>22O0 _
>2200 _
>22O0 _
>2200 _
>2200> 2200 c
>1940
Incond600
195 17132 67 1072 1400 21.9 R R 64194 17104 67 1239 1950 20.1 R R 97
196 17094 67 1088 2050 21.8 R R 94
1351
14861109
Silicon carbide
123 9000 44 100t) 1167 13 N5 N5
177 17000 83 1000 106 21 N5 7
178 9000 44 I(XX) 244 15 N5 NI 17
Monel K-500
179 17000 67 1000 1174 25 ROE ROE 46 1600
180 17000 67 1000 1025 25 ROE R6E 42 1500
181 17000 67 10ft) 1025 25 ROE R6E 41 --
Mone1400
162 17000 67 1O90 1050 23.3 R6E R6E 45 --
163 17000 67 1000 1114 24.2 R6E R6E 46 1200
164 17000 67 1O90 1138 24.2 R6E R6E 4782 9000 35 3000 2791 21.7 N N 130 1200
79 9000 35 2000 1922 21.5 R R 90 1070
75 5000 19 1000 2580 19.2 R R 134 1500
68 9000 35 1000 1689 22.5 R R 75 1160
72 7000 28 10O9 2664 19.7 R R 135 1600
lnvtr-36
149 17(300 67 1000 686 27 R7E R7E 24 364
150 17000 67 1000 703 27 RTE RTE 25 339
154 i 7000 67 1000 714 25 R9U R7E 26 900
Hastalloy-X
! 51 17000 67 1O90 661 20 R6E R6E 33 750
152 17000 67 IO90 643 22 R6E R7E 28 1(XX)
153 17000 67 IO90 799 19 R6E R6E 41 1000
aThe contact load normally is the peak contact load within 0.5 s of the reaction, bThe poe-test utmple code is air follows. NI: No-reaction. very tittle wear; N2:No-reaction, dilht wear and deformation; N3: No-reaction, mushroomed; N4: No-reacuon. melted and totally deformed; NS: No-reaction, shattered; R6:Reaction, ¼ of sample consumed; RT: Reaction. _ of sample consumed; Ell: Reaction, _, of sample consumed; R9: Reaction. total utmple consumed; E: Evenconsumption of the rubbing surface: U: Uneven ¢omumption of the rubbing surface; W: Sample welded but did not react; M: Sample melted but did not react,tRspid ramp rate used to attempt isnition, test, or semi failuse caused test termination without ignition.
5_

S-
cIJ
U 0
i, • • leo eoe • eoe
O0
oO,,Dr...000
000C,J
000
_')0r,--4P,,._
' C,
_r_tooooo ooo 0
0
I.o C-
IGJ
i-
o_- .r-E F--.r--
o o_
0 0
Q;
r_
p-
000000r_OOoO
or- o_
u-),-._Lo
000umO0
C)_m
00000_0
X•_ ._---r--
OOcO_
c0mo
000
o_-, _ 0r-'
0,-_0
000
o_o
.r--
0000_0
0_'-or--.r--
umO00
00,.40,,I
r_ P.._ r_
ilo
000000000
000
000
I I I
00000014o I.¢_ I,¢_
! ! I
000000000
r-,,r_, r-,,
NNN
000000000
r'_ r_ r_
000000
! ! I
0 ,-_ 0,;
000000000
•i-- .r.- *r-
I I I
i-=-i i=-i i=.-i
59
000000OOC)
e. e.
r--¢ ,,-.i e-.i
¢.__ (._) (_)0t- .r-
000000
I I I
000000000
r'._r-_ r'.,,
000
000
i I I
o,--.r- ._ZZZLL b.. LLI..l.J i.iJ LIJ
r,_. f-.., P-..cM c_ c_
o_- .r-o_
•r- ,I--
L-- .p-
•p. j_4J
o .t-
O _- _-•r- _I "-_
_- _ _
.,--_._ _..
II II II
0
C_0,...
Q;
c-
J_
c-O
or-
-_.or-
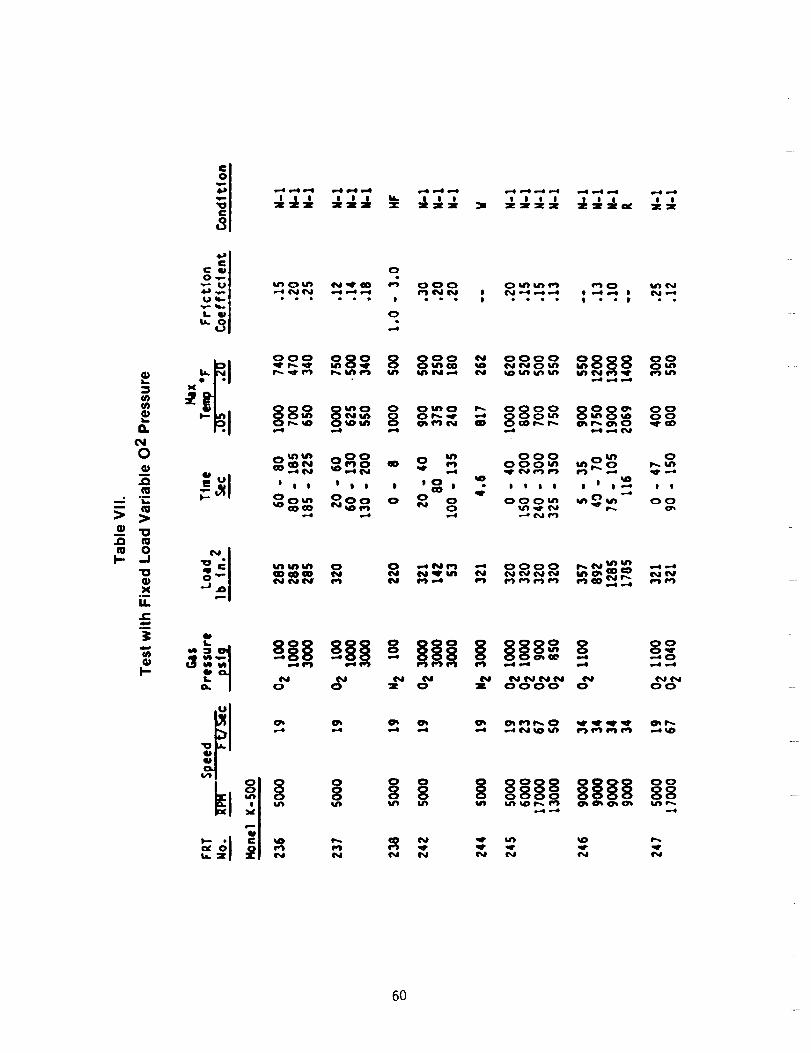
m
.0mI,-
Q.
ou
.o_U
°i1,__
¢U
mo
-J
"00X
OR
14.e"
OR
I,-
o_ o_- u_o_ NqP_ _ 0004_ ,,,-,INN _,,,4 w,-4 ,,,_1 iI'_ N (%11
°.
(_ k_l. M') r_ e'_(O U'I_ ('%Ju0 (',_,P-4..,-4,_.e O e.,4 .,.le | (%l),,'-e
0 * • • • e • Q P • •
O_ _ OO
NN
NNNN _0000
8 °,-"DO
NNoo
'il ° °°8 8 8
_.. ,IN e'_ N
_ _D, r_
N N N N
6O

Table VIII.
Average Heat Rateper Unit Area (PV Product) Required for Ignition by
Frictional Heating of Pairs of Like Material
A) Data from this Contract
USNDESIGNATION
C 15000N 02200
N 06600N 04400N 05500
N 06002K 93601S 31651
HEAT RATE PERUNIT AREA
(PV PRODUCT)
MATERIALkW/m2 STANDARD BURN**"
x 10-5 DEVIATION FACTOR
COPPER-0.15 Zr* NOT IGNITABLE
NICKEL 200 2.88 0.56INCONEL 600 2.54 0.48
MONEL 400 1.47 0.07MONEL K-500 1.46 0.14HASTELLOY X 1.05 0.18INVAR 36 0.78 0.17
STAINLESS STEEL 316 0.63 0.09
SILICON CARBIDE (SIC) ** m
35
5503226
1390209071605444
45151145
* DID NOT IGNITE, FAILED MECHANICALLY"" DID NOT IGNITE, SHATTERED AT
RELATIVELY SMALL CONTACT PRESSURES
"'* Cal-sec/gm-cm2
B) Data from Other Programs Using the Same Test Method
c 36000 BRASS 360 .74 to 1.26
ALUMINUM 6061-T6 0.074
TI-6AL-4V 0.0035
223
1026
14623
61

VI, B, Friction Heating Test Results (cont.)
resistant or possibly more resistant to ignition than nickel 200 or
Inconel 600. Of the materials tested, Invar 36 and type 316 stainless steel
were the easiest to ignite. However, as a comparison, the PV products
reported by Benz and Stoltzfus 17 for Aluminum 6061-T6 and TI-6AI-4V (Table
VIIIB) under similar test conditions were one and two orders of magnitude
less, respectively, than the PV products observed in these tests for the Invar
36 and type 316 stainless steel.
2. Friction Heatinq of Unlike Materials
The following test conditions were maintained in this series.
Initial Pressure:
Initial Temperature:
Surface Speed:
Maximum Contact Pressure Limit:
Contact Pressure Rise Rate:
1000 psig Oxygen
Ambient
Approximately 67 ft/sec(17,000 rpm)
3275 Ibf/in. 2
19 ± 11bf/in.2-sec
Figures 31 through 35 provide data from a typical test show-
ing how each significant event was determined. The interface load rise rate
was determined from the slope of the total load vs time curve using the area
of the metal sample (0.283 in.2) as the bearing surface.
A summary tabulation of results from the baseline Monel K-500
tests and the unlike materials evaluated in the present series are documented
in Table VI and shown graphically in Figure 36. A comparison of current
Monel-Monel baseline tests (Nos. 255 and 256) with previous data, (Test Nos.
179-181), is given in Table IX.
62

FRT#25g: Zr(-;u-.-,tat. ; 3 !B _'_. . .-,o-R,-,t.
40_
'd-
._]
ij
ilJ
O
,mJ
--.--.
T i rll
f,f
f
Pressure RiseAL
Rate .--AIxA
1 l
(] :'--:_e.0 n l-i ,-J,--_-:)
Figure 31. Total Load vs Time Dissimilar Materials (Cu/Steel)
Friction Heating Ignition Tests
63
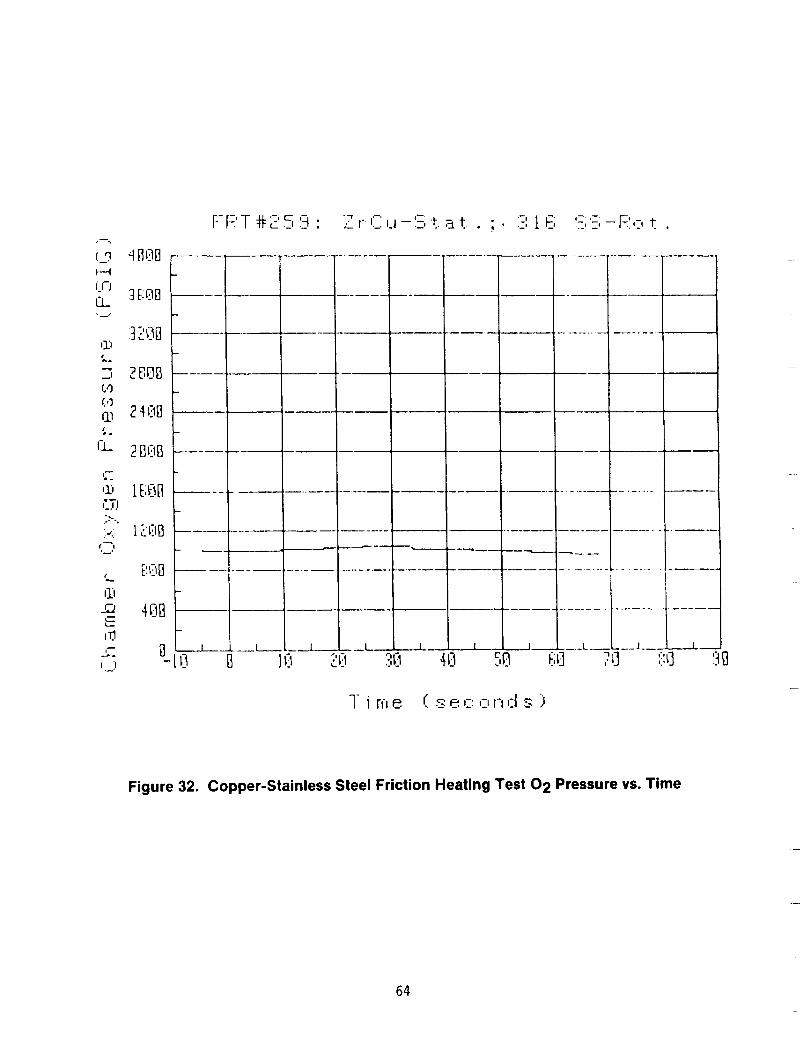
I.--4
LrJL3.... _ E:O_]
3_Bi!.'l
C")
(.'3G._ 2_E1B
EL_ 2 _-_I_
I
,z, IE;_-_B
]i:-.,
, E'.E1D
III
4r:lB
iU.I
I' "1
F-RT #2 5 9 •
.
B i
Z r _-._.,.l -'.-; h. a i-.. . ; • .:,-'1 F;_
!
_l_ ,I _ 1 , I_
:',t'.'l 4El 5_
,-,- _ p. _ ..._,.-, _-_ "ti.
.....................
....L ..... J.___ .---.--J---
7 i rn P._ ( ._'___,-:_,-,_n ,:i s )
Figure 32. Copper-Stainless Steel Friction Heating Test 02 Pressure vs. Time
64

.5
- - -Ro t .
i>)
ID
E'E.
I--I
E_
Q_E
[0
.4
_t
,&
.t
-.Lto
r--"-
,iI//l
t'
I 1 I I I l I I I r
Time :::-":@ ,-: 0 I"i ,zt :S )
Figure 33. Copper-Stainless Steel Friction Heating Ignition Test Displacement vs. Time
65

FRT#259; ZrCu-Stat, ; 318 SS-Rot,
240_
s_
LI._o_j
e
4.-)¢O
i_
03O_E
F--
BO_
_ I
Ignition Temp_
__dT_ _.. %, '...
I 1 1 I 1 1 1 t 1
l_t 2¢I ". _ okl 4B SEt _;i] 7_] ,!',i.] 911
T i r,-,e ( :-:e ,z;o n',-I s )
Figure 34. Copper-Stainless Steel Friction Heating Ignition Test Temeprature vs. Time
66

i-i
4--'[.',
b_.
0
£:
rJ
'4."t-,330
':_7
_9
&l
,1__-_
LL
.9
.8
.7
.E;
.5
.4
.t
O
-.LIO ,
L _ll"-j
I
#i,_,_,j "_,,
I I
lg 28 :7,n.
\"\
I I I I
40 _n _,_3•.J. o
I
i'17;7 ,:,_]
T i r,-,e ( s _.c n n d :s.
Figure 35. Copper-Stainless Steel Friction Coefficient
67

4.0 --
3.5
3.0A
coI
Oqf_
x
o_ 2.5!
E
2.0
a0 1.5n-O.
o. 1.0
0.5
m
p*/.
RANGE WITHIN WHICHIGNITION OCCURED
IJUre
i<;u.
iz'O
tl,IIn.n
Ou
m
<CI
OZ
.H
o o o_0 0 0
,0
WW_ W 0 W0
Oo_ _ _ o
<_ z _
O00 _0 0_0 000 _0
Figure 36. PV Products Required to Ignite Pairs of Different Materials
68

u oI! I I
oo I o
0
I
0
c-
O
%..
(...i
(I)
G,)
#.--
•_._ _,_1 _°
0 _ _
0_.m
1_) o o8 °0ib a
_1
0 0
! !
X X
.___1_•"_ 0 0
0 0 0 '_
888
0 0 0
888_ _ r_
0 0 0

Vl, B, Friction Heating Test Results (cont.)
The load application rate on previous tests was higher than
the present series; 25 vs 18 psi/sec. This resulted in the present series of
tests requiring a longer duration to reach the limiting load and ignition.
The 02 pressure was also 10 to 20% higher in the new series.
The average load at which Monel K-500 ignition occurred was
15% higher in the present series, while the temperatures were approximately
200°F higher. This trend is expected, as both the reduced load application
rates and the higher 02 pressure have been noted to have second-order effects
which tend to extend the time and load required to cause ignition. In viewing
the overall test results, differences of 20% in load at ignition and several
hundred degrees of temperature should therefore not be considered significant
in the subsequent evaluation of unlike materials.
The tabular format used in comparing the ignition potential
of unlike materials with the like materials is as follows. The first two
columns, in Tables X - XlV document like material rubbing data from previous
testing. The unlike material data from the present series is provided in the
last column. The average values are presented for each measured parameter
where multiple tests at a given condition were conducted.
The results of rubbing a burn resistant material such as
copper with an easily ignitable stainless steel is displayed in Table X. The
load application rate for the copper, stainless steel and copper-stainless
steel is identical (18-19 psi/sec) and, thus, the data are directly compar-
able.
The three copper vs copper tests were terminated without
ignition when the copper failed in compressive yield at temperatures approach-
ing the melting point. The relative ease of igniting 316 stainless steel is
noted by the consistent lower load, temperature and time required to cause
metal burning as compared to the copper.
7O

Table X. Rubbing of Low and High Burn Factor MetalsCopper and Stainless Steel
Rotating
Fixed
Cu 316-SS 316-SS
Cu 316-SS Cu
Time To Ignition 63 * 24 31
(sec) 75 * 28 * 34
115 * 25 33
Avg 84 26 33
Load at
Ignition, (psi)
Avg
1209 * 406 600
1566 * 512 * 671
2288 * 459 636
1684 459 636
Temp at
Ignition (°F)
Avg
1650 * 800 750
1880 * 400 * 500
1880 * 1247 500
1803 1024 583
Load Rate psi/sec 19 18 19
*Test limit by deformation No ignition
71
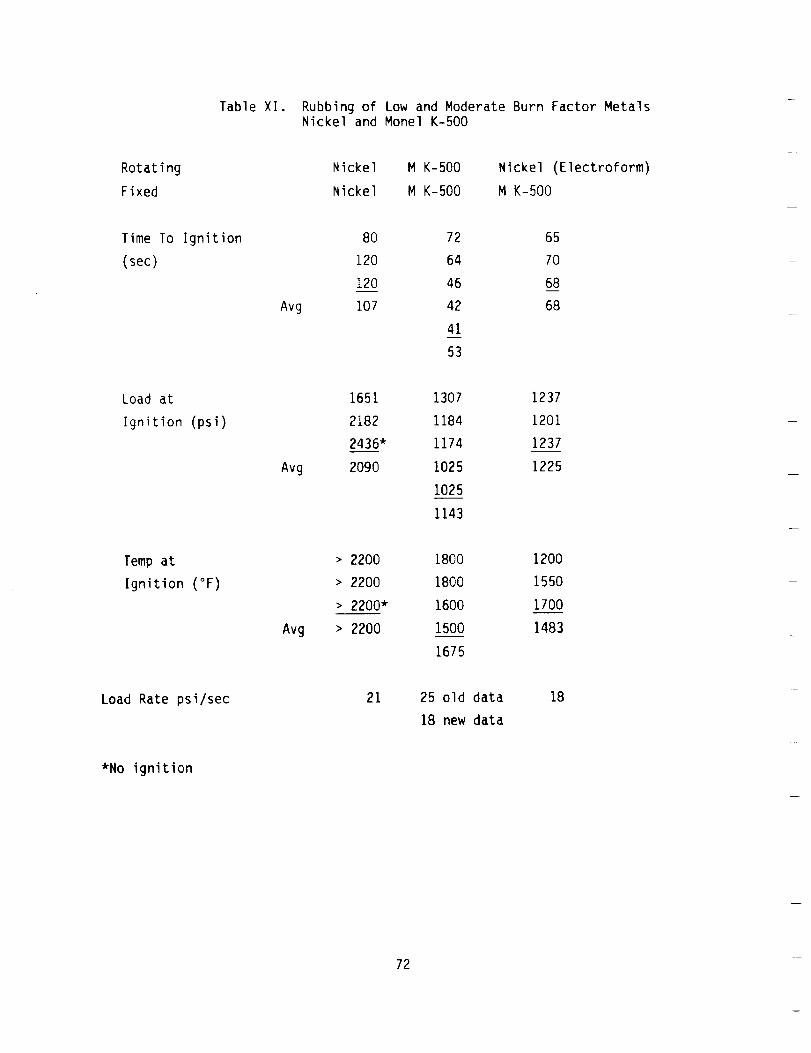
Table XI.
RotatingFixed
Time To Ignition(sec)
Avg
Load at
Ignition (psi)
Avg
Temp at
Ignition (°F)
Avg
Load Rate psi/sec
*No ignition
Rubbing of Low and Moderate Burn Factor MetalsNickel and Monel K-500
Nickel M K-500 Nickel (Electroform)
Nickel M K-500 M K-500
80 72 65
120 64 70
120 46 68
107 42 68
41
53
1651 1307 1237
2182 1184 1201
2436* 1174 1237
2090 1025 1225
1025
1143
> 2200 1800 1200
> 2200 1800 1550
> 2200* 1600 1700
> 2200 1500 1483
1675
21 25 old data 18
18 new data
72

Table XII. Rubbingof ModerateBurn Factor and High Burn Factor MetalsMonel K-500 vs 316 Stainless Steel
Rotating M K-500 316-SS M K-500Fixed M K-500 316-SS 316-SS
TimeTo 72 24 28
Ignition (sec) 64 28 * 3346 25 2642 26 2941
Avg 53
Loadat Ignition 1307 406 618(psi) 1184 512 * 583
1174 459 5301025 459 5771025
Avg 1143
Tempat 1800 800 -Ignition (°F) 1800 400 * 700
1600 1247 5801500 1024 640
Avg 1675
LoadRate psi/sec 25 old18 new
18 20
*No ignition
73

Table XIII. Rubbingof ModerateBurn Factor Metal and CeramicMonel K-500and Silicon Carbide
Rotating Silicon Carbide M K-500 M K-500Fixed Silicon Carbide M K-500 Silicon Carbide
Mettech-Compound SAgrade **
Timeto 7 * 72 26 f
Ignition sec 64 40 i46 25 f
42 3041
Avg 53
Loadat 106 * 1307 530 f
Ignition sec 1184 707 i1174 477 f1025 571
1025
Avg 1143
Temp Nodata 1800 1400fat °F 1800 1600 i
Ignition 1600 1200 f
1500 1400
Avg 1675
Load Rate psl/sec 21 25 old
18 new
f = Mechanical Failure
i = Ignition
lg
*Specimens contained notch; Failed Mechanically**Unnotched, increased wall thickness specimen of SA material supplied by
Carborundum, Inc.
74

Table XIV. Rubbingof ModerateBurn Factor Ceramicand High Burn Factor MetalSilicon Carbide and Invar 36
Rotating Silicon Carbinde INVAR-36 INVAR36*Fixed Silicon Carbide INVAR-36 Silicon Carbide
(Mettech Compound) (SA Grade)
Time to 7 ** 24 48 ignitionIgnition (sec) 25 46 Fracture
2_66 58 ignitionAvg 25 51
Loadat 106 ** 686 883Ignition (psi) 703 848
714 1131
Avg 701 954
Temp at No data 364 1400
Ignition (°F) 339 1650
900 1200
Avg 534 1417
Load Rate psi/sec 21 26 19
*composition of failed specimen verified by SEM analysis as Fe, 36% Ni 0.5% Cr**specimen contained notch; failed mechanically
75

VI, B, Friction Heating Test Results (cont.)
It was postulated that copper in contact with stainless steelwould act as a heat sink and inhibit ignition of this high burn factor mate-
rial. The experimental results indicated that this was not the case. The
copper wassuccessful in lowering the interface temperatures, as measuredbythe thermocouple located in the copper 0.05 in. from the rubbing surface.
However,316 stainless steel ignition took place only 7 sec later than was
observed in the stainless steel vs stainless steel tests. The load at igni-
tion for the Cu-SS was 636 psi vs 459 for the SS-SS and 1684 psi with no
ignition for copper-copper.
Similar results were observed for low vs moderate BF metals,
i.e., nickel vs Monel K-500, as shown in Table XI. The Ni vs Monel K-500
responded more like the easier to ignite Monel than the difficult to ignite
nickel. Note that the load application rate was lower in the present series
and, thus, the time to ignition for the unlike metals is expected to decrease
further if the 18 psi/sec were increased to the 25 psi/sec.
Data for a moderate BF metal in contact with a high BF metal
(Monel K-500 vs 316 stainless steel) Table XII provides similar results, i.e.,
the system degrades to that of the most ignitlon-prone material.
Two test series were conducted in which the rotating specimen
was an alpha-grade silicon carbide ring, as shown in Figure lg. (Note the
heavier wall cross-section incorporated to overcome structural failures
encountered with the original design.) The results of these tests are shown
in Tables XIII and XIV. Both the Monel and silicon carbide have moderate burn
factors, while the Invar 36 has a very high burn factor and was found to
ignite quite easily when rubbed against itself.
76

VI, B, Friction Heating Test Results (cont.)
Previous testing with the notched silicon carbide specimensrevealed mechanical failure to be the limiting factor. Evenwith catastrophicmaterial disintegration, no ignition were reported in these like-on-liketests. Thermal data were absent due to the inability to attach thermocouplesto the silicon carbide.
The current testing without the notch allowed longer testdurations and higher loads to be attained. Temperaturemeasurementswere made
by instrumenting the fixed metal specimen.
In the Monelvs SiC testing, only one of the three tests
resulted in ignition. The others terminated whenthe specimenfractured.Since no previous valid data were available in SiC vs SiC, it is difficult to
draw any conclusions except to state that the material is more likely to failmechanically than to burn whenin contact with other low or moderateburnfactor materials.
The results of the high burn factor Invar 36 and the SiCproved to be an exception to the previous metal on metal test results. A
significant improvementin time, temperature and load to cause ignition of theInvar 36 wasobserved; this cannot be fully explained at this time, and couldbe due to the thicker wall of the SAsilicon carbide test section or the
change in the material supplier.
a. Conclusions
The results of a limited test series involving the friction
rubbing heating of unlike metals in a gaseous02 environment demonstrated thatconditions required to initiate metal burning are established by the limits ofmost burn prone metal. The introduction of a highly burn resistant metal as
one of the rubbing surface was found to be of little value in preventingignition although it is useful in limiting the propagation.
77

Vl, B, Friction Heating Test Results (cont.)
Exceptions to the above results were observedwhena non-
metallic (SIC) material was employedin contact with an easily ignitablemetal. This combination resulted in a significant increase in the load, time
and temperature required to ignite the metal. A valid explanation of thiseffort is not available. Geometricdifferences in the SiC and Metallic Test
Sections maybe a factor and additional testing with consistent geometry isrecommended.
3. Gas Composition and Pressure Effects in Friction Rubbin_
The effect of 02 pressure under ramped loading was evaluated
for four materials: Monel 400, 316 Stainless Steel, 1015 Carbon Steel, and
Nickel 200. Various rotational speeds were investigated.
The results of these tests, shown in Figures 37 through 40,
were |nternally consistent and significantly different from what was expected
by the extrapolation of earlier data from Figure 8. The test data indicate
that, as the oxygen pressure is increased above the old data base of 6.9 MPa
(1000 psia) the time, contact loading and speed required to ignite Monel 400,
316 stainless steel and 1015 carbon steel became progressively greater. The
Monel 400 and Nickel 200 became unignitable at the highest pressures. How-
ever, once ignited, the burning at high pressure was more extensive. This is
most probably due to the greater concentration of 02 present in the test
chamber at the higher pressure.
Figure 37 shows the overlay of the measured temperature 0.12
cm (0.05 in.) from the contacting surface for Monel 400 at 6.9, 13.8 and 20.7
MPa) (1000, 2000, and 3000 psi). The time, and thus the friction energy,
required to heat the specimen to the ignition temperature of 866°K (1100°F)
increased with increasing 02 pressure. It was not possible to ignite the
Monel at 20.7 MPa (3000 psi), even though the same apparent ignition threshold
temperature was reached. This lower ignition potential can be explained by
78

o _ 1500
v __ 1000
k-500
(2000)
(1500]
(lOOO)
(sOO]
0
6.9 MPa 13.8
(1000) PSIG 12000)
- I 20.7
- IGNITION---J (3OOO)NO IGNITION
AMPED LOAD
"" I I I I I I0 20 40" 60 80 100 120
TIME (SEC)
Figure 37. Effect of 0 2 Pressure on Heating Rates of Monel 400
140
(J 120ulIR
ilooO
- 80ZI9
O 6O
MI
r-20
NO
O MONEL 400/
11.7_ S
• /- _ 316 STAINLESS
1015 CARSON STEEL6.3 M/S
I
0 1
10 20 0 MPa
I I
2 3 _ 1000 PSIG
OXYGEN PRESSURE
Figure 38. Time to Ignition vs. Oxygen Pressure
79

ultn.Jv
==
EZ
I-,<
Q,,¢0.,.I
..IO.
<c¢t)
1800)1
I
1700)[
3 i6OO)I
(soo)t2-
(4oo)t
(3oo)ti
1
(200) I
1100)
10)
Figure 39.
11
//_ 316 SS 6.3 M/S
S [ Solid NO IgnitionOpen Ignition
6.3 N/S
2bPRESSURE MPa
PRESSURE 1000 PSlG
Load at Ignition vs. Oxygen Pressure
2.4
2.2
v_ 2.0
1.8
x 1.4j
tu -= 1.2
ml--P o 1.0
_:o 0.8_O,_acuu =. 0.61->
a."-" 0.4
0.2
D
m
D
0.01
NI 200 &
INCONEL 600A_t
MONEL K-500 &o/MONEL 400
3"
&015
I Solid No IgnlUon IOpen Ignition
I I I I0.1 1.0 10 100
PRESSURE, MPe
:]16 STAINLESS STEEL
CARBON STEEL
Figure 40. Heat Rate per Unit Area Required for Ignition vs. 0 2 Pressure(From Benz & Stoltzfus 9)
8O

VI, B, Friction Heating Test Results (cont.)
a) better convective cooling at the higher pressure, b) the formation of a
thicker protective, insulating oxide film, c) the possibility of lower fric-
tion coefficients or d) some combination of these.
The temperature oscillations observed in Figure 37 were
common throughout the test program and the frequency always tended to increase
with increasing 02 pressure. These effects are not fully understood and are
discussed later in more detail.
Figure 38 compares the time to ignition of 1015 Carbon Steel
and 316 Stainless Steel at 6 m/sec (19 fps) surface velocity, and Monel 400
and Ni 200 at 11 m/sec (35 fps), as a function of 02 pressure. Note that the
Monel 400 did not ignite at 20.7 MPa (3000 psi) and it was not possible to
ignite the nickel at 27.6 MPa (4000 psi) even when the speed was increased to
22.3 m/sec (67 fps). Figure 39 shows the maximum attainable load on the test
specimen in each test. Figure 40 displays the (PV) parameter vs oxygen pres-
sure again indicating greater allowable energy input with increasing oxygen
pressure. It is significant to note that the Monel 400 derives much greater
benefit from the higher oxygen pressure than either carbon or stainless
steel. With the exception of low ignition temperature of the 1015 Carbon
Steel shown in Figure 41, the similarity of results in these tests provided
encouragement that operation at very high oxygen pressure actually may be less
severe than at moderate pressure. The observation that high oxygen pressure
can be beneficial when applied to equipment design warrants additional experi-
mental investigation using more metals and a wider range of test environments.
In the fixed load, variable 02 pressure test for Monel K-500,
shown in Figure 22, the highest friction heating temperature is obtained at
the lowest 02 pressure 0.69 MPA (100 psi). Increasing the 02 pressure to 6.9
and then 21MPA (1000 and then 3000 psi) results in lower measured temperature
and higher measured friction coefficients, Figure 22d.
81

o="E"U. ----
V
m
(J
Ol,(5-"
uJ(nn-
).-o
".F-ujZa.Q
LU
1500-
1000-
500-
(2o00).
(1600)-
(1200)-
(soo)-
(400)-
[_L Ul Ni 200, 22.3 M/S
O 316 SS 6.3 M/S
MONEL 400 11.7 M/S
I Open Ignition 
VI, B, Friction Heating Test Results (cont.)
The reduction in metal temperature which accompanies the
increase in 02 pressure could be attributed to increased convective cooling by
the higher density oxygen, while the increase in friction coefficient could be
a result of slower rates of oxide formation due to the lower temperature. The
average friction coefficient measurements for the Monel K-500 in 02 at several
pressures and rubbing velocities are shown in Figure 42. These data suggest
that surface temperature influences the friction coefficient more than either
speed or the 02 pressure.
In order to separate oxidation and cooling effects, addi-
tional Monel K-500 tests (Number 238 and 244 Table VII) were conducted in N2
at 0.69 and 21MPa (100 psi and 3000 psi). At a given set of pressure and
load parameters, the N2 tests resulted in nearly twice the heating rates and
significantly higher (5 to 10 times) friction coefficients. The frictional
forces in N2 became large enough in 5 to 8 sec to fail the drive mechanism
shear pin. No cooling benefit of the 21 vs 0.69 MPa (3000 psi vs. the 100
psi) N2 was observed. These tests clearly indicate that 02 and the resulting
oxide film plays the major role in suppressing the surface heating rates.
Further separation of the effects of gas density induced
cooling and friction reduction produced by the oxide film are displayed by the
data set in Figure 43. This figure compares the heating of 9 ramped loaded
1015 Carbon Steel specimens in 02 with 9 identical tests in N2 at three sig-
nificantly different pressures. The specimen temperature rise rate on the
measurement at 0.127 cm (0.05 in.) from the rubbing surface are plotted in
Figure 44 as a function of pressure. The benefits of the 02 cooling plus
oxide film over the N2 cooling without the film are apparent.
83

l-ZILl
214.
U.
0(.1Z0I-
lL
0.3 _
RPM
5000 17,000
(lOO) •0 (300) •[] (1000) •
(3000) •
0 2 Pressure
MPA (PSi)
0.69 (100)
2.07 (300)
6.9 (1000)
20.7 (3000)
\o
\%
, I I I 1 i z J
(200) (400) (SO0) (800) (1000) (1200) (1400)
500 750 1000
MAX. TEMPERATURE K (F) 0.05 IN.FROM SURFACE
Figure 42. Effect of Surface Temperature and Oxygen Pressure
on Friction Coefficient
84 __ •

IALL T_ESTS 5000 RPM t
" 0 2(J
,,< (1500) _100
1000,
(lOOO)z_ N 2 PSI
0.69 MPA-m 500 (500)
-(o)._: 02,
o_lOOO. (15oo) __ _ II
(1000). N2
SOD- (500).
,,_ J--(O), _ 6.9 MPaA
'1ooo.!(15oo)4 02
_- (looo)1
1__ 20.7 MPA< 3000 PS._J,m, 500- (500) N2
30 40" 0 20I.-
TIME (SECONDS)
Figure 43. Friction Heating of 1015 Carbon Steel 0 2 and N2
85

Figure 44.
MPa
: ,o ,_ 2o
40
_. (O)L _ o< o 1ooo zooo 3000
GAS PRESSURE, PSI
Effect of Gas Pressure on Friction Heating Rates of 1015 Steel
Under Ramped Loading at 5000 RPM
F
_. Frt #82 Monel 400: 9K rpm; 3K psi 02
IF
Z
I-
Thermopile ,e'_ /" V _
_-- \ Temperature (.05" from! _,j _ _,,,,,,ur,<.o,,",_o_)
0 10 2o 30 40 so 60 70 80 901001101201301401soTime (sec)
Figure 45. Phase Comparison of Optical and Thermocouple
Temeprature Measurements
A
EOO
312.
300
Q.0
Eb,.
t--
h-
86

_ Vl, B, Friction Heating Test Results (cont.)
4. Temperature Oscillations
Repeated temperature cycling of the specimen throughout the
program was noted. This is evident in Figures 21 and 37 for Monel 400 and
this was also observed for 316 Stainless Steel and Monel K-500. The thermal
cycling was less apparent in the 1015 Carbon Steel and copper alloy 150. The
following observations are noted relative to this effect: 1) the cycling
frequency increases at higher 02 pressure; and 2) the thermopile cycling,
which is sensitive to light or spark intensity, is 180 degrees out of phase
with the temperature measurement. This can be observed by comparing the
position of the peaks of the thermocouple and thermopile in Figure 45.
Figure 46 displays the observed mean a time from one temperature peak to the
next as a function of the oxygen pressure.
This observed temperature cycling is believed to be a result
of oxide scale spalling and reforming. It can be postulated, as illustrated
in Figure 47, that oxidation starts at some elevated temperature and the scale
or glaze thickness increases to the point where it can no longer support the
shear loads and is mechanically removed. The loss of the scale is immediately
followed by fresh metal exposure and rapid combined frictional and oxidation
heating. The rate of heating diminishes as a new protective film is formed.
Since the oxidation rate at high-pressure can occur more rapidly, the cycle
can be expected to have a higher frequency.
The thermopile and thermocouple are out of phase because of
the low thermal conductivity of the oxide scale. The scale is at a maximum
temperature at the surface where the friction energy is being generated. The
metal is most insulated by this scale when the scale is at its maximum thick-
ness, thus the metal temperature is at a minimum at this time. Radiation from
the hot oxide film reaches a maximum as it approaches its spalling thickness,
thus the maximum light intensity corresponds to the minimum sub-surface metal
temperature.
87

ORtGINAL pAGE ISOF pOOR QUALITY
70-
60-
50-
u 40-@
(/)
g- 3o-
20"
10-
0
0
_.2OO
! e{]_
;4_E}
12_ae
1000
g :}--3
:100
200
o
IA I OPEN 9000 RPM
SOLID 7000 RPM
\ O MONEL 400\
\O Z_ 316 STAINLESS STEEL
\\
\
%.
_O
I , J , 1
(1) (2) (3)|
10 20
Oxygen Pressure
, 1000 PSIA
MPa
_1""
'_ : THERMOPILE
I "_ 'l ', "" " '_I I I I Ill i JI I t ,
# l _el t#
I _. I I " I. ) tI L { I [ . I ,_'
.o 4oo II
lIME _-,ECOr,IO'_
Figure 46. Effect of Oxygen Pressure on Thermal Cycle Time
in Ramped Loading Tests
88

Metal Ignition
Point Reached
Heat Generation Rate
Exceeds Heel Removal Rate
I
iI.-
Friction Heeling with Oxide Film (MxOy)
Shear Force ExcmKIs Film Strength2 Metal to Melai Contact Increases Fdction
3 New Oxide Film Established (MxOy)
. Friction Heating Drops as
m Thickens ,1
el)eat
• TameIncremmd Load Exceeds Oxide Film Slreu
S Umlt. _le_ Contact Increases Frtctlon
Heating Retas
Figure 47. Hypothesis of Events Leading to Ignition in Friction Rubbing Tests
89

Vl, B, Friction Heating Test Results (cont.)
If the above hypothesis is correct, desirable materials for
friction rubbing applications should oxidize rapidly to form a high-strength,
low-friction film. In order to prevent burning, the material should also have
a low burn factor, as indicated in the next section.
5. Burn Factor Correlation
Correlation of the experimental data provided in Table V with
the burn factor (BF), based on room temperature thermal diffusivity, is shown
in Figures 48, 49 and 50. These data indicate the burn factor can provide a
reasonable analytical guideline for ranking the materials employed in the
friction rubbing test when temperature and contact loads at ignition are used
as correlating parameters. The line drawn below data in the BF vs temperature
plot can be assumed to contain design margin, in that the temperature shown is
measured 0.0127 cm (0.05) in. from the heated interface. The actual contact-
ing surface could be up to several hundred degrees hotter for the low thermal
conductivity materials.
Data for an aluminum alloy and Brass 360, obtained through
the same test procedures, Ref. 17, proved to be exceptions. The ignition and
burning of brass is indicated by data point "B" in Figures 48, 49 and 50.
The alloy (B360) containing copper plus 3% Pb and 35% Zn
behaved significantly different than the Cu (150) containing 0.15 Zr, as shown
in Figure 51 and Table XV even though the calculated burn factors are not
significantly different. The 360 alloy exhibited thermal instabilities and
ignited in less than 30 sec, while the Cu-150 operated more than twice as long
without igniting.
Figure 52 was prepared in an attempt to understand why alumi-
num and the Brass alloy did not fall inline with the other data. Figure 52
displays the metal heat of combustion vs the PV product required for metal
90

10.0
_ 0
0 1.0I-
,<
ZllC
0.1 -
0.01
(o)
500 1000 1511)0| | |
X X s,O
-,_xK__i BURN
NO BURN _'- N"
O
17,000 RPM
I ! l I ,L I L(400) (8001 (1200)(1600)(20001(2400)
TEMPERATURE OF REFERENCE
LOCATION AT TIME OF IGNITION, K (F)
NOTES:
--) YIELD FAILURE, NO IGNITION
• TIC OFF SCALE AT IGNITION
B = BRASS 360
G : INC-600
X : HASTELLOY X
I = INVAR 36
SS = CRES 316
M-4 = MONEL 400
K = K MONEL
N = NI 200
C : Cu 150
---'> MELT OR FLOWNO BURN
Figure 48. Burn Factor vs. Ignition Temperature in 6.9 MPa (1000 psi) 0 2
91

10.0
?_ 1.0
0 0.Il-(J<M.
z
0.01
02 AT 1000 PSI
HIGH BF
X X : HASTELLOY X
- ss L_. i: ,,VAR_ C_ ss: 316STAINLESS"Y_ I a GG
_ .SO,UUe_G = INCONEL-400 (76% Hi)M--4 = MONEL 400
M 4r "_K - MONEL KS00
B 8 "_ NN@ ©
C C C
B = BRASS 360
I I I I l '
200) (600) (1000) (1400)(1800) (2000)L I I ,5 10 15
LOAD MPa, (PSI)
Lw_N : NI 200
C = Cu 0.2% Zr
.-a. = YIELD FAILURE
NO IGNITION
Figure 49. Burn Factor vs. Load at Ignition in 6.9 MPa 02 at 17,000 RPM
92

- Burn Factor
®10.0
1.0
0.1
K Cal - sec
gm - cm 2
®
l" B .J
®%
M4b
Burn
Except A&B \
\
\
T i -- Titanium 6 AI-4VS -- 316 Stainless Steel
H -- Hastelloy XI -- Invar-36
Ni = Nickel 200
M4 = Monel 400
MK = Monel K-500
I-6 = Inconel 600
C = Copper 150B -- Brass 360
A = 6061 Aluminum
*Not Ignitable
\
0 2 Pressure 1000 psi17000 rpm
\\
\
©\I I
1 x 10⁶ 2 x 10⁶
PXV Ib/in 2 x in/sec for Metal Ignition
Figure 50. Thermal Diffusivity Based Burn Factor Condition vs. ExperimentalIgnition PXV Data
93

1500
A14.v
14J
D I000I-.
w
500
(20001
(1600)
(1200]
(800)
(4oo)1
IGNITION
TEST NO.165 BRASS 360 2 TESTS
" \_146
-- 148
COPPER 150,
3 TESTS
NO IGNITION
6.9 MPA
L I I | I0 20 40 60 80 1-00
TIME, SEC
Figure 51. Comparison of Friction Heating Rate Ignition of
Brass 360 and Copper 150
120
94

Table XV. Comparison of Friction Heating Ignition of Copper 150and Brass 360 in 6.9 MPa (1000 psla) Oxygen at 17,000 RPM
Ignition Temp IgnltIo9 PV
Alloy (_C) (°F) kw/M_
Cu-150 982 (1800) >2.3-105a( )
Brass 360 649 (1200) 0.74-1.3-105
Ign_tio_ Load
N/M_ I0v (psi)
11.2 (1600)a
3.6-6.2 (530-930)
Burn Factor _
cal-sec/gm-cm _
35
223
aDoes not ignite.
95

2OOO
1000
F
Symb
A
T
S
I
H
1-6
MK
M4
B
N
C
Melt P Cp Btu L_Hc
Alloy Temp OF Ib/In 3 Btu/Ibf H 2 ft F KJ/g-mol
6061 T6 AI 1080 .10 .23 104 676
TI-6AI-4V 3000 .16 .14 4 1369
316 Stainless 2500 .29 .12 9.4 802
Invar 36 2605 .3 .11 _-10 608
Hastelloy X 1400 .29 .11 14.5 572Inconel 600 2470 .30 .11 8.6 422
Monel K-500 2400 .31 .10 10.1 260
Monel 400 2370 .32 .10 12.8 219
Brass 360 1630 .31 .09 87 226
Nlckel 200 2615 .32 .11 43 241
Copper 150 1796 32 09 212 142
E&
.,-j
co
.QEoO
O
@-I-
o
5OO
200
I B I
[ I-6T
Nominal Band
Better than Nominal
N
Worse Than Norminal
C
lOO I I I I I I I I I0 .2 .4 .6 .8 1.0 1.2 1.4 1.6 1.8 2.0
PV Product at Ignition (Ib/in 2) (in/sec) (10 e)
Figure 52. Correlation of Heat of Combustion with PV Product for Metal Ignition
96

Vl, B, Friction Heating Test Results (cont.)
ignition in the 17,000 RPM ramped rubbing tests in 1000 psia oxygen. No
attempt was made to account for other physical parameters in the graphical
display however the thermal parameters which could influence the results are
included in the properties tabulation.
The band drawn through the bulk of the data marked nominal is
arbitrary and is provided only to aid in the discussion. In this format the
aluminum falls within the nominal band which is in contrast to Figure 50 where
aluminum falls below the llne. The Brass again falls in a category that
indicates worse than nominal operation while the nickel and Inconel 600 are
better than nominal. The Brass, Monel and Nickel all have approximately the
same heat of combustion. The goodness of the material appears to be in rela-
tion to the melting temperature where the brass at 1161K (1630°F) is the
lowest and nickel at 1708K (2615°F) is the highest. Melting temperature alone
is not the answer as titanium has a melting temperature 3 times that of alumi-
num but ignites more readily as noted in Table VII. The Inconel 600 has a
heat of combustion approximately 2 times that of pure nickel 200 and a much
lower thermal conductivity but is equal to nickel in burn resistance. The
Inconel 600 contains 15.5% chrome and 8_ Iron which appears to be capable of
reducing friction heating by nature of the oxidized glaze formed.
One would normally expect the soft lead and zinc oxides
formed by the brass to offer a significant reduction in friction coefficient
over pure copper. The faster heating rate of this material as compared to
Cu 150, In Figure 51, indicates that these soft oxides may do more harm than
good.
Further investigation of the nature of the oxides Formed in
friction heating is the subject of the next phase of the experimental program.
g7

VII. FRICTION HEATING AND WEAR RATES OF MONEL K-500 IN OXYGEN
A. OBJECTIVES AND BACKGROUND DATA
1. Objectives
The bearings, pump impeller turbine and portions of the
structural housing of the OTV oxygen turbopump are fabricated from Monel
K-500. The balance is Monel 400. The objectives of the phase of the program
were to define the friction heating and wear rates of Monel K-500 material as
a function of oxygen pressure and applied normal load and also to investigate
the use of surface modifications to reduce both wear rate and friction heat-
ing.
2. Background
Whenever two surfaces undergo slip or sliding under a load
there is wear. Wear could be classified as:
a. Adhesive wear
b. Abrasive wear
c. Erosive wear
Sarkar 18 reports that of the three types of wear mentioned
above the adhesive wear is the most destructive.
The tribiological behavior of the metals used in turbo-
machinery has been investigated by some researchers. Lin et a119 investigated
the friction and wear characteristics of Nickel base (Nimonic 75, C 263,
Nimonlc 108 and Incoloy 901) alloys in air at room temperature. Lin et al.
tested the samples at relatively low speeds (500-600 rpm) and concluded that
the mechanism for room temperature wear of these alloys was associated with
the strength properties and the changes in the coefficient of friction and the
wear rate during sliding related to work hardening and age hardening of the
load bearing areas. The work hardening and age hardening are probably due to
mechanical and thermal stresses developed.
98
VII, A, Objective and BackgroundData (cont.)
Stott 20 studied the tribiological behavior of Nickel and
Nickel Chromiumalloys. Friction and wear characteristics were investigatedat temperatures ranging from 193 to 1073K (-113 to 1471F). They found thatthe alloys showa transition temperature abovewhich a low coefficient of
friction and relatively low wear are observed. Abovethe transition tempera-tures the changes in the frictional and wear characteristics were associated
with the formation of a thermally softened oxide layer (glaze) on the loadbearing areas.
Bisson21'22 reported that the presenceof any material other
than that comprising the sliding surfaces (contaminating film) can have a
considerable effect on the friction, wear and surface damage. Hestudied theformation of solid films on steel, nickel and copper alloys and basedon
earlier reported data concluded that the films formed of lower shear strengthmaterials give low friction coefficients. Stott et a123 reports that the
shiny, glassy looking film or glaze plays a major role in reducing frictionand wear of the alloy surfaces during sliding at elevated temperature. Thedetails of the mechanismsfor the formation of glaze are reported by Stott eta123. Noneof these previous experiments were conducted using surfaces which
were cleaned for oxygen surface, i.e., all surface films removed, and nonewere conducted in a pure oxygenatmosphere.
B. TEST METHOD
1. Apparatus
The test apparatus employed was identical to that used in the
earlier friction heating tests and all tests were conducted at a rotational
speed of 17,000 rpm.
99

Vll, B, Test Method (cont.)
The test variables in addition to the surface modifications
were the oxygen pressure and the applied loading. The initial tests employed
the following normal contact stress vs time profile for a total test duration
of 240 S.
Time
0-40 S40-80 S
80-140 S140-180 S180-240 S
Normal Contact Stress
0.34 MPa (50 psi)1.38 MPa (200 psi)0.34 MPa ( 50 psi)
2.7 MPa (400 psi)0.34 MPa ( 50 psi)
Figure 53 shows the total normal forced and drive power vs
time for an ambient pressure 02 test on untreated Monel K-500. The
repeatability of the measured temperature profiles 1.27 mm (.05 in.) from the
rubbing surfaces in Tests 75 and 76 is also shown in this figure.
The applied load was returned to the initial load after each
higher load step to allow changes in wear rate and friction heating to be
identified. Tests for each type of surface were conducted at 87.5 kPa (12.7
psia) (1ATM at the White Sands Test Facility) and 6.9 MPa (i000 psi) oxygen
pressure using a new pair of wear rings for each test. Comparisons of surface
material parts were made with untreated Monel K-500.
The second type of test also conducted, used a constant
0.34 MPa (50 psi) load for a 300 S duration test. The oxygen pressure in the
constant load test was 6.9 MPa (I000 psia) o
2. Measurements
The following measurements were made:
a.
b.
C°
d.
RPM vs time
Motor drive power vs time (watts)
Normal load vs time (IbF)
Torsional load vs time (IbF)
I00
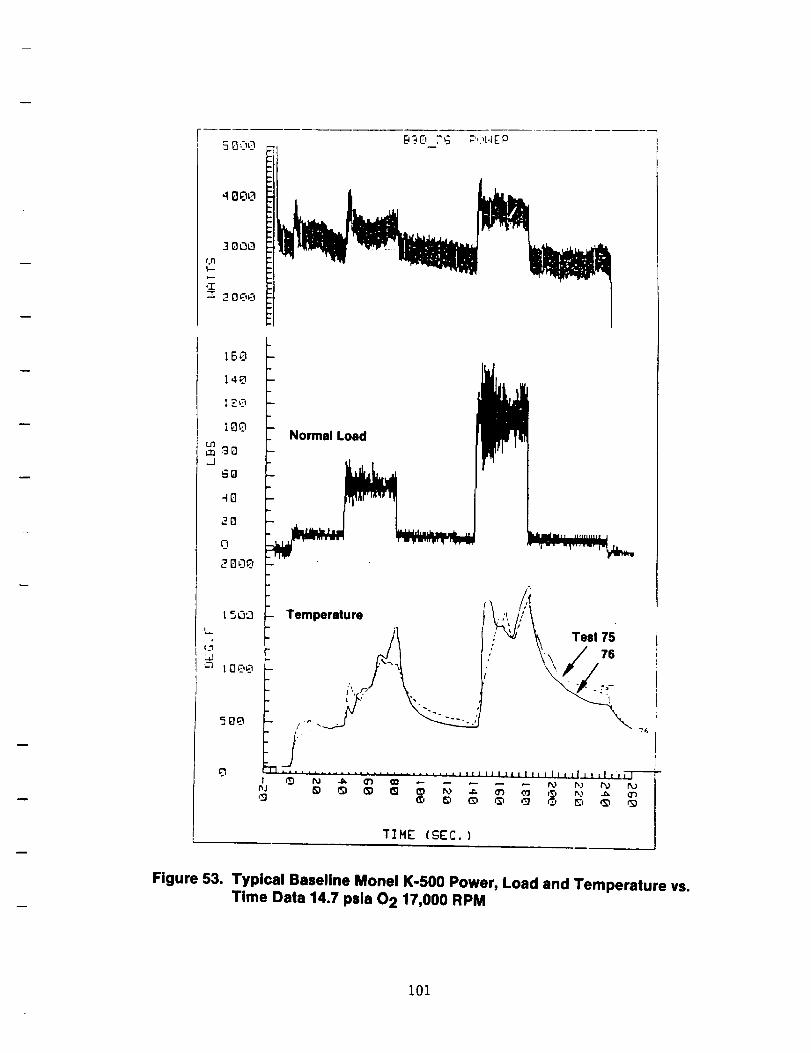
4 {]00
3 _3L_
r.r_
E
B_ F:.,._7G p,>_..EP
Normal Load
_IME (SEC.}
Figure 53. Typical Baseline Monel K-500 Power, Load and Temperature vs.Time Oata 14.7 psia 02 17,000 RPM
i01
VII, B, Test Method (cont.)
e.
f.
g.
h.
Shaft displacement vs time (in.)
02 pressure vs time (psia)
Temperature vs time at 1.27 and 5.08 mm (0.05 and
0.2 in.) from the
rubbing surface of the fixed specimen
02 temperature in the cell
The temperature at the rubbing interface was also observed by
a thermopile. The lack of a valid calibration for the various surface emis-
sions limited this function to defining heating and cooling relative to the
data recorded on the thermocouples used for Item g. above. Figure 54 displays
these measurements for a typical test. The one large spike in thermopile
output at 155 sec is again noted to correspond to a minimum thermocouple
reading.
In theory the experimental friction coefficients can be
computed from the torque, normal load and speed data, and independently from
the sample heating rates and also from the power input after appropriate
calibrations. The figure shows the friction coefficient computed from the two
force and speed measurements. Figure 55 displays the friction coefficient
based on power measurements from Tests 77, 78 and 86, untreated Monel K-500 in
6.9 MPa (1000 psia) oxygen. It can be observed that repeatable data are
obtained at the two high load steps only in the 40 to 80 and 140 to 180 time-
frame. The power measurement was of little value in computing friction coef-
ficients and is not discussed further.
In addition to the above, each test specimen was weighed and
measured before and after testing. This provided 3 methods of computing wear
rate data as follows:
ao
b.
C.
Displacement sensor provided on line data
Pre to post test weight reduction
Pre to post test length change
102

0 2 Pr ISlUlrl
Figure 54. Representative Data Set Unmodified Surface
103 ORIGINAL PAGE IS
OF+F_)OR QUALITY

r.r
_4
I,
, )L.4
r_3C_
Ul:
L,
Figure 55.
I01 r'J9??
"IItIE
_0IN078
% m m G m _ m
Test 77
Test 78
JIHE _SEC
Joirl_l::
,t o
a Test 86
'_._o'_ _ I _
..... 01 OJ
JIHE I__'_gC ''
Friction Coefficient Computed from Drive Power for 5 Load Steps
(Untreated Monel K-500, 1000 psia 02, 17,000 RPM)ORIGINAL
104 OF POOR
PAGE 1.9
QUALITY

VII, B, Test Method (cont.)
The online displacement sensor provided the only method of
estimating wear rate vs time during a test.
3. Test Procedures
In the ambient pressure tests the chamber was purged with
oxygen to ensure that all air was removed. In tests conducted at 6.9 MPa
(1000 psi) the test chamber was pressurized with oxygen after purging. The
drive motor was then turned on and the rotational speed of 17,000 rpm was
established. The data acquisition system was then activated and the friction
test Initiated by pressurizing the pneumatic actuation cylinder which applied
the desired pre-programmed load to the samples. After the test was completed
the data acquisition system was turned off, the test chamber was vented, and
the samples were removed and then weighed, measured and visually examined.
C. SURFACE MODIFICATIONS
The test specimen design, shown in Figure 56, consists of the base
material Monel K-500 heat treated to provide a hardness of Rockwell C-35 which
is the same as specified for the OTV turbopump material. Heat treatment was
per QQ-N286E Class A form (1), i.e., age harden 16 hour at 1100°F, cool in
IO0°F steps to 900°F holding at each step from 4 to 6 hours before cooling
from go0 to room temperature. The 8 micron RMS surface finish and flatness
was applied after heat treatment.
Table XVI defines the surface modifications applied to the sub-
strate and the source of the surface processing. The Ion implants were accom-
plished under subcontract to the SPIRE Corp. using their recommended implant
dosages.
105

.224¢
]F_-'_.900
.0001 J
.._. Fdctlon Rubbing SufficeFlat within .0001"Surface Finish 8 Micro-In RM_'
T1.000
.A. ]
Material Monel KS00
Heat Treat per OON 386E
Hardness RC 3_"All Dimensions In Inches
Figure 56. Test Specimen Design
106

Q,J
i o o o o ..--_,-.4 ,-4 ,.--I _ e-
c_ E OOo._
_%_._ oo .
_8oooo _." o,,, o o
o .90o o ,--,-_<_
_ o. o.
o
5.- _ S- 0
U u',
o R '-° '-°
N
f,;5
*r""
Ig
('- _" _ t'" N_:I _ _ .,-
I_. I_. 1:3. (3. 0E E E E
U
0 0 0 0 ,"-
"0°r-
%,.
0U0_
or--
+
Z
_.m0
U
_- "0 "0Z _ CUv _ 4-*
•_ C_. (3."- 0 0
5.. S-O 4-) ._
107

VII, C, Surface Modifications (cont.)
I. Test Specimen and Surface Modification Selections
a. Baseline
The baseline material was Monel K-500 having the
8 micron surface finish and the RC 35, (350 Kg/mm2 knoop) hardness shown in
Figure 56. Post heat treatment hardness testing indicated that the desired
hardness was attained.
b. Surface Modification (I) - Oxygen, Ion Implantation
The Monel K-500 was modified by the ion implantation of
oxygen. The objectives were to obtain an understanding of the influence of a
high concentration of oxygen and surface oxides on the friction coefficient,
hardness, and wear resistance of the baseline material.
c. Surface Modification (2) - Lead, Ion Implantation
The presence of soft oxides, as in the 360 brass,
appears to have an adverse effect on ignition under heavy loading condi-
tions. The influence of a metal which forms a very soft oxide will be eval-
uated. Other candidate metals which form soft oxides are boron and rhenium.
These could be investigated in future tests.
d. Surface Modification (3) - Chrome, Ion Implantation
Chrome forms a very hard oxide. The favorable results
with Inconel-600 (76Ni, 15Cr, 8Fe) suggest a beneficial effect of chrome
oxide.
108

Vll, C, Surface Modification (cont.)
e. Surface Modification (4) - Silver, Ion Implantation
Silver has the lowest burn factor of all candidate
surface materials. Silver will not form an oxide at elevated temperature but
has been reported to provide good lubrication characteristics.
f. Surface Modification (5) - Chrome Plating
Comparison of ion implantation and conventional con-
tinuous film plating will be made. The plating provides a 100% surface coat-
ing of chrome vs a nominal 10% for ion implantation. The proprietary
"Electrolizing" hard chrome plating process was selected and is reported to
provide a Rockwell C70, (1070 Knoop) hardness. The harder surface is expected
to reduce the wear rate under normal rubbing conditions.
g. Surface Modification (6) - Composite Plating Ni-SiC
Nickel and silicon carbide both have been shown to
provide good ignition resistance. Electro Coatings, Inc. provides a propri-
etary Ni-SiC composite plating which contains 30 volume % 1 to 3 micron par-
ticulate silicon carbide in an electroless nickel matrix. The matrix has a
hardness of RC68 (920 _ Knoop) and the SiC particulate hardness is 1400
mm
on the Knoop scale. The bulk hardness of the coating reported by the manu-
facturer is 1200 Kg/mm 2 on the Knoop scale. Figure 57 shows a cross section
of a typical coating supplied by the manufacturer.
Additional test samples of silver and gold plated onto
the Monel were also available as residual cryogenically cycled rings fabri-
cated as part of the OTV turbopump tank.
109

N YE-CAR B® COMPOSI TE
Cross-Section
600X
Figure 57. Cross-Section of NYE-CARB(_Composite
'T-'t_!_t'iAL PAGE IS
,_F POOR QU,_LITY
110

VII, Friction Heating and Wear Rates of Monel K-500 in Oxygen (cont.)
D. TEST SUMMARY
1. Variable Loadlnq Friction Tests
Test Numbers 75 through 109, documented in Table XVII, employed
the five step variable loading profile discussed earlier. The tests are
listed in the order in which they were conducted. The table shows the speci-
men material code for the rotating (r) and stationary (s) specimen, the ring
serial number, and the weight change for each specimen resulting from the
coating processing as well as the subsequent change in friction testing. Some
weight loss was reported for the ion implantation as a result of the ion beam
surface milling cleaning prior to the ion implant. The material removal
apparently exceeded the material addition. The weight change measurements
were more sensitive than length change which was also measured.
The after test length of each set of rings was measured by rotat-
ing and clamping the wear surfaces face to face until a minimum total length
was achieved. The average of multiple measurements taken around the periphery
are reported in this table. The change in length reported is the difference
between the pre- and post test length.
The change in length, calculated from the change in weight using
the 8.46 gm/cc density of Monel K-500 is provided in the table for comparison
with the direct measurement of length change.
The test type code shows an A for testing in oxygen at ambient
pressure and a B for tests in oxygen at 6.9 MPa (1000 psia).
2. Constant Loadinq Friction Tests
Table XVIII provides similar data for the constant load tests in
the order in which they were conducted.
111

Table XVII. Summary of Weight and Length Data for the Variable Load Test
Test
Test
Type Before/After Coatinq Before/After Test
A = Amb 07 Specimen Weight Length Weight a Length
B = 6.9 MPA-O 2 Code (g) (in.) (g) (a) (in.)
AL in.from
a Weight
1515
76
76
7777
7878
A C5 s N/A N/A +.0048
A C6 r N/A N/A -.0464
A C7 s N/A N/A -.0591A C8 r N/A N/A -.0410
B C9 s N/A N/A -.2023
B CI0 r N/A N/A -.1414
B C11 s N/A N/A -.3683
B C12 r N/A N/A +.0014
-.0022 b
-.0026 b
_.0104b
-.0095 b
-.0016
-.0039
-.0135
-.0144
7979
B 1-01 s -.0013 +.0000 -.1410 -.0085
B 1-02 r -.0004 +.0000 -.0213
-.0064
8080
B I-Crl s -.0012 +.0000 -.0882 -.0055B I-Cr2 r -.0009 +.0000 -.0278
-.0046
8181
B l-Agl s -.0014 +.0000 -.0852 -.0140
B l-Ag2 r -.0010 +.0000 -.2582
-.0135
82
82
B I-Pbl s -.0010 +.0000 -.0441 -.0045
B I-Pb2 r -.0006 +.0000 -.1224
-.0065
8383
B E-Crl s +.0050 +.0004 -.3120 -.0115B E-Cr2 r -.0013 +.0003 -.1773
-.0192
8484
B E-Cr6 r +.0070 +.0005 -.0222 -.0070B E-Cr7 s +.0011 +.0003 -.3182
-.0134
8585
B E-C6 r +.7872 +.0034 -.I050 -.0055B E-C7 s +.7125 +.0029 -.0710
-.O069
8686
B Mk-1 s N/A N/A -.2476 -.0090
B Mk-2 r N/A N/A -.0226
-.0106
8787
8888
A l-Cr3 s -.0013 +.0000 +.0025 -.0105
A l-Cr2 r -.0006 +.0000 -.0488
A E-Cr3 s +.0152 +.0005 +.0033 c -.0255
A E-Cr4 r +.0018 +.0004 -.5498
-.0018
-.0216
112

Test
Table XVII. Summary of Weight and Length Data for the Variable
Load Test (cont.)
Test
Type Before/After Coatinq Before/After Test
A = Amb O? Specimen Weight Length Weight A Length
B = 6.9 MPA-O 2 Code (g) (in.) (g) (a)(in.)
AL in.
from
A Weight
89 A 1-03 s -.0008 +.0000 -.0303 -.0015 -.0013
89 A 1-04 r -.0005 +.0000 -.0028
90 A I-Ag3 s -.0012 +.0000 -.0283c -.0030 -.0018
91 A I-Pb5 s -.0009 +.0000 +.0058 c -.0040 -.0040
91 A I-Pb6 r -.0004 -.0001 -.1080
92 A Mk-3 s N/A N/A -.6564 -.0540 -.0888
92 A Mk-4 r N/A N/A -1.6058 Burned?
93 A E-C8 r +.8062 +.0020 -.1676 -.0030 -.010793 A E-C9 s +.7472 +.0029 -.1057
94-99 were calibration tests.
100 A Mk-5 s N/A N/A -.0284 -.0030 .00317I00 A Mk-6 r N/A N/A -.0523
101-102 were calibration tests.
103 A I-cr5 s -.0012 +.0000 -.1530 -.0080 .00663103 A I-Cr6 r -.0008 +.0000 +.0158
104 A E-Cr8 r -.0054 +.0000 -.0110 -.0080 -.0054
104 A E-Cr9 s -.0007 +.0001 -.1265
105-107 were calibration tests.
Coating Thickness(in.)
108 B Silver5 s .0027 -.3285 -.0135 -.018
108 B Sllver6 r .0021 -.1297
109 B Gold1 r .0055 +.3826 +.0020 -0.000
109 B Gold2 s .0059 -.4118
a This delta-length measurement was made by subtracting the combined length of thetest samples after the test from the combined length of the test samples beforethe test.
b The combined length of the test samples before the test was not measured forthese samples, therefore the delta-length was determined by adding the average
lengths of the individual samples measured before the test and subtracting thecombined length of the test samples measured after the test.
c Small piece of thermocouple wire was stuck in one of the thermocouple holes andcould not be removed.
113

Table XVIII. Constant (50 psi) Load Friction Tests in 6.9 MPa(I000 psi) 02
Test TestNo. Sample
830-167 MKRMKS
830-168 MK-14RMK-15S
830-169 IPb 4 RIPb-7 S
830-170 IAg-8 RIAg-9 S
830-171 Io-6 RIo-5 S
830-175 ICR-8 RIgR-7 S
830-176 EC-2REC-I S
830-177 ECR-14RECR-13S
830-178 ECR-16RECR-15S
830-179 IAg 6 RIAg 5 S
830-180 IPb-8 RIPb-9 S
830-181 ICr-10 RICr-9 S
830-182 10-8 R10-7 S
830-183 MK-16RMK-17S
830-184 EC-3REC-4S
Combined Length
Length Reduction Weight, _ms AL = AWPretest Posttest in. Pretest Posttest (.0392 gm/mil)
1.7080" 1.7045" 0.0035 30.8093 30.760430.5293 30.5220 1.4
1,704" 1.702" 0.002 30.7265 30.647530.692 30.6928 2
1.7075" 1.7065" 0.001 30.7594 30.754730.6447 30.5759 1.9
1.7075" 1.7060" 0.0015 30.8297 30.826530.7165 30.6633 1.4
1.706" 1.7075" 0.0015 30.7854 30.752330.7038 30.6252 2.8
1.707" 1.699" 0.008 30.7253 30.725630.6850 30.3173 8.0
1.7115" 1.7095" 0.002 31.5340 31.530130.8797 30.8745 0.2
1.704" 1.680" 0.024 30.7393 29.812930.6901 30.7058 23.2
1.705" 1.672" 0.033 30.7215 30.736030.6296 28.7671 47.1
1.705" 1.699" 0.006 30.8203 30.802730.6956 30.6874 0.7
1.707" 1.705" 0.002 30.7495 30.7457 0.430.6877 30.6747
1.705" 1.705" 0.0 30.6342 30.6603 0.3 (gain)30.6821 30.6230
1.705" 1.705" 0.00 30.7581 30.8486 0.630.5871 30.5720
1.702" 1.703" -0.001" 30.6712 30.6615 0.730.6246 30.6070
1.709" 1.7095" -0.0005" 31.5205 31.5207 0.330.6197 30.6205
114

VII, Friction Heating and WearRates of Monel K-500 in Oxygen(cont.)
E. RESULTSANDDISCUSSIONS
The following sections summarizethe results for the tests con-ducted to determine the friction and wear characteristics of heat treatedMonelK-500 with surface modifications.
I. Friction Heating
The heat generated due to friction at the areas of contact
diffuses to the surroundings to establish an average temperature at the inter-
face once steady state heat transfer is achieved.
Figure 58 provides a comparison of superimposed temperature
profiles from four uncoated Monel tests using the time variable loading. All
temperatures are measured on the stationary specimen 1.27 mm (0.05 in.) from
the rubbing surface. As noted in the figure two tests were in ambient pres-
sure oxygen and two were in oxygen at much higher pressures. The following
observations can be made from these data.
a. No specific temperature can be assigned to set of test
conditions but a peak temperature and range can be
provided.
bo Similar time temperature profiles for repeat tests were
obtained.
Co The test specimen operates at a lower temperature in
high pressure oxygen.
115

0
a:)el.mS 5u!qqnu tu0Jl (,,SO') aJnleJedtuaJ.
o
o
o
oo
g
g
oo
g
O¢0
O
OC_
O
O
i
¢f)
D.OOOqp,,
t_
4)
OIn
!
4)C05.e-=
0
c_OIC
tl4)3:
0
Uo_
_.._m
0 Q-r-I,-o4
•e=. qP"
=1-(ntN
o_in4)
o1o_
U.
116
VII, E, Results and Discussions (cont.)
do Temperature spikes tend to occur at various times during
the run but most commonly immediately after a load
increase.
e. The temperatures tend to return to common low value when
the contact load is reduced.
Figure 59 compares the temperatures for several surface
modifications in the variable load tests conducted in 1000 psi, oxygen. At
the initial 50 psi load step the silver and Nl-composlte surfaces run cooler
than the average of 3 untreated Monel specimens. When the load is increased
from 50 psl to 200 psi the temperature of the silver plated surface increase
rapidly to over IO00°F. Thls was accompanied by an increase in wear and
friction torque measurements. In contrast the Ni-30% SiC composite ran cooler
than either untreated monel or the silver plated material. The inability to
develop a stable silver oxide film at elevated temperatures is the probable
causes of the high friction heating rates.
At the conclusion of each test, when most or all of the
modified surface is worn down all the measured temperatures are nearly the
s,me.
A comparison of the measured peak (spike) temperature in the
variable load test series at two oxygen environment pressures is shown in
Figure 60. In general the data indicates that all tests conducted at a high
pressure oxygen environment of 6.g MPa (1000 psi), showed a lower peak temper-
ature than those for tests conducted at ambient oxygen pressure.
Between 0-40 s, with the load of 0.34 MPa (50 psi), ion
implanted lead has the lowest peak temperature for the test conducted at
ambient oxygen pressure envlronment while for the high pressure test silver
has the lowest peak temperatures. Elaboration of these early time data in
Figure 61 shows that implants of Cr and 02 eliminated the initial spike as did
the electro deposited silver and that all the implants had some benefit.
117

m
m
uI
w
co
0
0Z
o
ooqP
o
oo
oQn
J,o
-: =0 -"
o_--- _ og -- __
u u _D •
o o oo oo in
(.50") .:10 a.mleJaduJa£
0
.E
o_ o
.___
•- X E
O _
ul--
E_?o •
° git.
118

M
"3Q.
00
O
m
G.,--, :[5I- o_
v
.,_ 'm
W W
m mG. O.
0 0
O_
-J 3:
L"x\"x',: ' "_ I |IY/////I!" 'H'I leuon k-1 k\'q "-"1
_//,/.///_ ,_M l pelemiun
L----_. K",N\"_ " "!
[ f :V///f/'//, • pbuonii K\\\\ ,_-m
V/f //J////JJ/Z _._I peleo_lun[ p,,\'q • II
JOAII$ ]
,
L[
I t///_/_, r"IJ _ OllsoduloD
! , K\N _I-Ry////////_ ,/1# ,_,e_, ::)" =
_\N • m
' b,\\x_ • IH-- V////////_ " .H_ ,,,nluJojq::)
i k_'_ _q'_ pOlll$°deor////ill////, ,_._,, . oqoeia
II
I b,\N" _-o![i i . Ill'I/Ill " w-ill uJnlmo,qo
y///J////'/./}_ illm-iliqq'l'N:pelueldUJluo,
L k\X2 • m ,
[ b,",_• 'HV//////// " .H. uaeXxo
l)il////_/, .lll,..ll p,llueidluin_om--_,i uo IK\'x " ill
l K\\ "1 y//l//li/,, _ ,e^i!s
i ["X\ :_'u Ptllueldl'ulY'////I//. Ill _"_ UOl
L _, ''=
YI/IIlI.,t" "_l_ _ l _ k\\"i'_'l-ml
L r/lllll/llllll,_" _ II--- [ K\xl • ..i 1tl:ui il -1
pea']polueldUal
uol
00tn
nO
C_OU
li
5.,-Ii
5f_
'--0"11¢
mill
im
e_i--
ml31
::l It(nOE_E_t(,-
=i=._
o_oO'Oo.
@
im
4 0 oJnigJodtuo.L
119

Q..
0rj_
.m
Or)
¢,)
Q,-O
-4 o
o,. I.-
I
I i2
i
c0
Q.
o
<
m _-
x _
z <
_J
os
_- N
•-- t_ 0
e--
<
<
|
\'
\
\-
|
\-\"
0 _
E d' < a. o0
E C C
_- o. _.. W
+ E E E
w o o .2°
000
0
000I"
.E U
I
-- 0
C:'_o _.
®m
¢_ 1,-•_- 0
.i
120

VII, E, Results and Discussions (cont.)
Between 40-80 s when the load was 1.38 MPa (200 psi) ion
implanted silver has the lowest peak temperature for the ambient pressure test
while for the high pressure test a composite plating of Ni and SiC was the
lowest.
Between 80-140 s, when the load was returned to 0.35 MPa
(50 psi), the untreated Monel K-500 had the lowest peak temperature for the
ambient oxygen pressure test while for the high pressure test all surface
modifications had a peak temperature of the order of 366 K (200°F).
Between 140-180 s when the load was at 2.7 MPa (400 psi) the
ion implanted lead exhibited the lowest peak temperature for the ambient
oxygen pressure test while ion implanted silver exhibited the lowest peak
temperature for the high pressure test.
The comparison of the peak temperature at 200 s showed that
for the ambient oxygen environment test ion implanted oxygen had the lowest
peak temperature while for the high pressure test all surface modifications
exhibited a temperature of the order of 366°K (200°F).
Thus, as far as the peak surface temperatures are concerned
the data does not indicate that one surface modification is significantly
superior to the other, although all the ion implants seem to offer some advan-
tage over untreated Monel.
For tests conducted under a constant load with the oxygen
environment pressure as 6.9 MPa (1000 psi) peak surface temperatures during
the time intervals are shown in Figure 62 and continued in Figure 63. These
figures indicate that under a constant load and high oxygen pressure the
temperatures are in the range of 366°K to 477°K (200°F to 400°F) for all the
121

i
oo,_r
,o,=>
l
E
11i
I[
" "0
m ¢).,_iE
n
_E
i
1
oo
[l
I
Ioo
Ioov-"
o
1
F
01'-0
09-01'
I OPL-oll
oil I.,-otrL
Ot,E-O9L
OOC-Ot/i[
I'T"
I
I
--[I
I I - Io 0o o 8
do aJnleJ0dme.L
122
c0
o1_o
08-0_
ot_-oIt
ooc-oti
Ot'-O
Og-O_"0
M COgL-O_L' 0 0
e-o_-osll. ::::)
0o£,-Olr1_
12)C::
o_
m
I,-'I0
0--I
e-
t-O
0_q
0
n
(D
c-
O
a.
E
I-
E
E
e_¢,D
o_
[1

| "' i i I '
L
OY'-O
08*OIP
01r1.-08
08L-OIPI,
0tP[-081.E
01_0 i
O8*OS' I
OY_-Oe I
_L'_ I
os,_.-oei. I
ooc-ot_ I
E
iI
oIP-.o I
oe-ot i
ot L..o8 !
o8 L-Olrl.I
ot_..Ogl, I
ooc..otz_I
oUJ
01_o
OI*OY
oIp_-o8
OSL-Oyl.
olp[-ogL
ooc.'ogP[
rj
l&l
LI
7
08-Olp i
OIL'08
O(IL-OtL
OY_-O8I,
r.)
I' I I
123
I OIP-O
I ' Og-Olp '
0_1.'08
I 08 L-or L
I otz-oo i.
I _'°"oo
c_i ,p.
do oJnleJodma/,
(J|
uJ
01
4)
"0
0.J
Cm
0
0
0m
5
C.m
'I0
J_
oim
mIm
Q.
E
E
E.m
)<m
_D
:3
U.

VII, E, Results and Discussions (cont.)
tests except when Monel K-500 was coated with electrodeposited chromium in
which case the temperature was in the range of 505°K to 700°K (450°F to
800°F). Thls discrepancy could not however be reproduced in another test
conducted wlth electrodeposlted chromium.
Since the variable and constant load test types are identical
for the first 40 s, a direct comparison of the peak surface temperature in the
6.9 MPa (1000 psi) oxygen environment pressure can be made.
Table XIX provides a comparison of the peak temperature
during the time interval 0-40 s for the tests conducted with step load and a
constant load. The data indicate that during the time interval 0-40 s there
is no exact repeatability in the peak temperature for similar coatings, but in
genera] the peak surface temperature for Monel K-S00 with surface modifica-
tions are lower than untreated Monel K-500. The column on the right of the
table provides rank order from best to worse of the peak temperatures for the
various surface modifications. The rank order from best down for low contact
loads are Electroplated Silver, Ni-SiC composite and ion implanted lead. Only
the Electroplated chrome was worse than untreated Monel.
2. Comparison of Overall Wear
The factors that cause wear are mechanical, thermal and
chemical (oxidation). These three factors do not operate individually but
usually operate in combination and thus increases the complexity of the wear
phenomenon. All three independent variables are examined for the various
surface conditions.
Wear measurements obtained by three separate methods are
listed in Table XX for the variable load testing in, low and high pressure
oxygen, and in Table XXI for the constant load testing in high pressure
oxygen.
124

Table XIX.
Coatinq
Untreated
Untreated
Untreated
Untreated
Ion Implanted Lead
Ion Implanted Lead
Ion Implanted Silver
Ion Implanted 02
Ion Implanted 02
Ion Implanted Cr
Ion Implanted Cr
Electrodeposited Cr
Electrodeposited Cr
EC Composite
EC Composite
Silver
Comparison of Peak Temperatures in the Time
Internal 0-40 s for Step Load and Constant Load
Peak Surface TemperaturesStep = Load Constant = Load
K (OF) K (OF)
449 (350) 433 (320)
463 (375) 422 (300)
449 (350) 344 (160)
--- 383 (230)
366 (200) 388 (240)
--- 344 (160)
366 (200) 433 (320)
366 (200) 383 (230)
--- 400 (260)
366 (200) 499 (350)
--- 388 (150)
435 (325) 505 (450)
394 (250) 410 (280)
366 (200) 388 (240)
338 9150)
324 (125)
421K
(298)F
367K
(200)F
400K
(260)F
383K
(230)F
385
(233)F
437K
(326)F
365K
(198)F
325K
(125)F
Rank*
3
6
4
5
8
2
I
* 1 best
125

Table XX. Comparison of Wear Data for Test Conducted with Step LoadApplied to the Samples at Ambient Oxygen and 6.9 MPa
(1000 psi) Oxygen Environment Pressure
Test
No.
Untreated Monel K-500 77
Untreated Monel K-500 78
Untreated Monel K-500 86
Ion Implanted 02 79
Ion Implanted Cr 80
Ion Implanted Ag 81
Ion Implanted Lead 82
Electrolized Cr 84
Electrolized Cr 83
E-C Composite 85
6.9 MPa
Wear Mil
Oxygen Pressure(1000 psia) 87 KPa MPa (12.7 psl)
Test
AL AW Disp No. A__L_L AW Disp
10.4 13.5 15.8 75 2.2 1.6 37.6
9.5 14.4 13o3 76 2.6 3.9 14.0
9.0 g.o 14.8 100 3.0 3.2 7.1
8.5 6.4 6.8 89 1.5 1.3 11.0
5.5 4.6 7.1 87 10.5 1.8 7.6
14.0 13.5 13.1 90 3.0 1.8 7.3
4.5 6.5 6.4 91 4.0 4.0 5.2
7.0 13.4 10.6 88 25.5 21.6 25.3
11.5 19.2 - 104 8.0 5.4 13.3
5.5 6.9 12.8 93 3.0 10.7 10.0
126

Table XXI. Comparison of Wear Data for Tests Conducted at Constant 50 psiLoad in i000 psi Oxygen
NominalSurface Load Wear Data Mil
Modification Test IbF AL from a Weight AL Disp. Sensor
None 168 2. 2.183 16 0.7 I.167 16 1.4 3.5
4.54.5
IAg 170 15 1.4 1.5179 16 0.66 6.
1.50.0
IO2 171 18 2.8 1.5182 15 0.6 0.0
2.50.0
ICr 175 18 8.0 8.0181 15 0.33 0.0
9.00.0
IPb 180 14 0.4 2.169 16 1.9 1.
+6.02.5
Ec 176 17 .20 2.
Composite 184 15 0.26 0.5
It
2.5
Electrolized Cr 177 14 23. 24. 23.178 14 47. 33. 46.
127

VII, E, Results and Discussions (cont.)
Figure 64 comparesthe measureddisplacement data from all
tests conductedusing the variable loading test methods. The left columnshowsthe wear using ambient pressure oxygenwhile the right columndisplays
the data from the higher 02 pressure testing. The upper portion of Figure 64displays the baseline untreated Monel.
Consistent results were obtained in the variable load testing
of the untreated monel at the two pressures whenrepeat tests were con-ducted. Whenadditional extendedduration tests were conductedat constant a
50 psi load it wasexpected that the early time wear would continue. Thishoweverwasnot the case as shownin Figure 65. Furthermore the wear data for
the constant load testing appears randomexcept for the electrolized chrome
which wasvery high.
The data provided in these figures were examinedby several
methodsto eliminate possible measurementerrors. Figures 66, 67 and 68comparethe pre- to post test specimenmeasuredlength changewith displace-mentmeasurementsand also length changecomputedfrom weight change. Errorfree measurementswould result in all data falling on a line having a 45
degree slope. It is apparent that someof the measurementsare in consider-able error and thus engineering judgementmust be applied using agreementof 2out of 3 measurement techniques. The goodness and confidence level for each
surface modification can be inferred by the proximity of wear the data to the
origin of the plot and the distance from the line.
The most consistent measurements were with constant 50 psi
loading in 1000 psi 02 . In these tests the electrolized Cr had the greatest
wear with all three measurement methods being in good agreement. The indi-
cated wear was 23-24 mil in Test 177 and 33-47 mil in Test 178. The three ion
implanted Cr wear measurements in Test 175 also were in good agreement and
showed a consistent and high wear 8-9 mil. All of the other surface including
untreated monel indicated much lower material loss.
128

OKygvn Pressure 14.7 pail 1000 psia
Untre lied
Monet K-500
Ion Imptsnled
Chr_
Electrolyzed
Chrome
Ele¢trotsss
NI* 30'k SiC
Composite
Ion Implanted
Oxygen
ion Imp_llnted
Sliver
ion Implented
Lesd
Ele¢lrophilled
Silver
Measured Pre Io Post Tesl Length Change
toe the hmp_e Set
.... =i'' _'_ 0022
;Dr [_da _030 _'G DT-;'|| .OON I0
-L
830 9E DT-?@I .054
?l :'_
g 30._100 DT-?Oi .003
0
-1
z 030 103 O'r-;'el .008
0
• .l B)O @7 DI-?@I
! ,'1105
,t
-I
D30 104 [IT-?ei ,._2
0
I
I
) j .. _--_tU 93 D1-;=il I ,003
_, .., ose__eg t)T-?Ut .ooss
I i " e_o._ge D'T-/'el .003
, e.'_ 9 DT-_IDI .004
1]|1[ tSEC. I
03o eG DI-_'II
0
I i L:I)O glO [1T-7@1
I
_1
.0O55
830 84 D'l-?g I=__.... oo_o
0
2 g3e ?g OT-?|t
I . --. ,
e
-i
_ 030 g! DT-?ID l 0.014
.OO45
0_0 tog _T-?Ot .0135
Figure 64. Sample Wear Rates vs. Time, Load, and Oxygen Pressure at 17,000 RPM
129 ORIGINAL PAGE
OF POOR QUALITY

o
J¢
co
-I<_
o
oo
.J<_110
[
K, +P,.
r-, _aP'-I
P,- ! ,
I
:1
it,,l,,,,l,J
--I
<IT"o
I
p--r-,
10Q
,-,r,
I
I
6
__
T
\*I*J*IAI_JlII
r
-- C.
O
• C,
7
%. t
il_- +
; C
7_
el
tmo
oo
d"1
1J
3oO
Z7__
q
-_ t00.4
-_ 150-i
-_120
-_9o
3O
-30
o 7 2G0
-_tBO
+I -]140
Q -_120
co -_8o
--,GO
"4
,,+ ,Z)
Q.
0,3 u,
__ml--LJ I_
0
0
- l--
J--
>
r"
00
|
0
L.
0
E
U _
°_ _
M
IL
130
ORIGINAL PAGE IS
OF POOR QUALITY

18-
17-
16
E 15,.,..,.
ce 14.E= 13.t_mo=_ 12,
m•o 11,coo 10,
u)
c 9.O
"oo
8'{u
0O
G) 7.OlCI= 6.
o_c 5.Olr-4p
_.I 4.
3
2,
1.
00
Implanted Cr
,_ /__/lon Implanted Ag
1 2 3 4 5 6 7 8 9 10 11
_L Test NumbersCalculated from Weight Loss
--_ Real Time Displacement
| w u !
12 13 14 15 16 17 18
Length Change Based on Pre to Post Test Measured Length (roll)
Figure 66. Wear Data at Constant 50 psi Load for 300 sec 0 2 -- 1000 psla
131

om
E
r/)
r-
E
P',,z
¢gG)
:Z
C0U
_')
C0
m
C
r-u
C
.-J
19-
18
17
16
15
14
13.
12.
11-
10.
Electrolized Cr _8_
9.
8-
7
6
5"
4
3
2
1
0
0
Untreated Monel _--_
1 2 3 4
[]®
[]
Ion ,'_ (_ #__--_P--- Ion
Implanted Pb "-4_1_ ! _///// (_ Implanted O2
Test Number_/_'_ QALfromL_Weight
Ion Implanted Cr -=,,,-(_
I\ l n Implanted Ag
___Real Time Displacement
i v i i i i i i , l
5 6 7 8 9 10 11 12 13 14 15 16
Length Reduction Based On Pre to Post Test Measurement (mil)
Figure 67. Wear Data for Stepped Loading Cycle (0 2 -- 1000 psla)
132
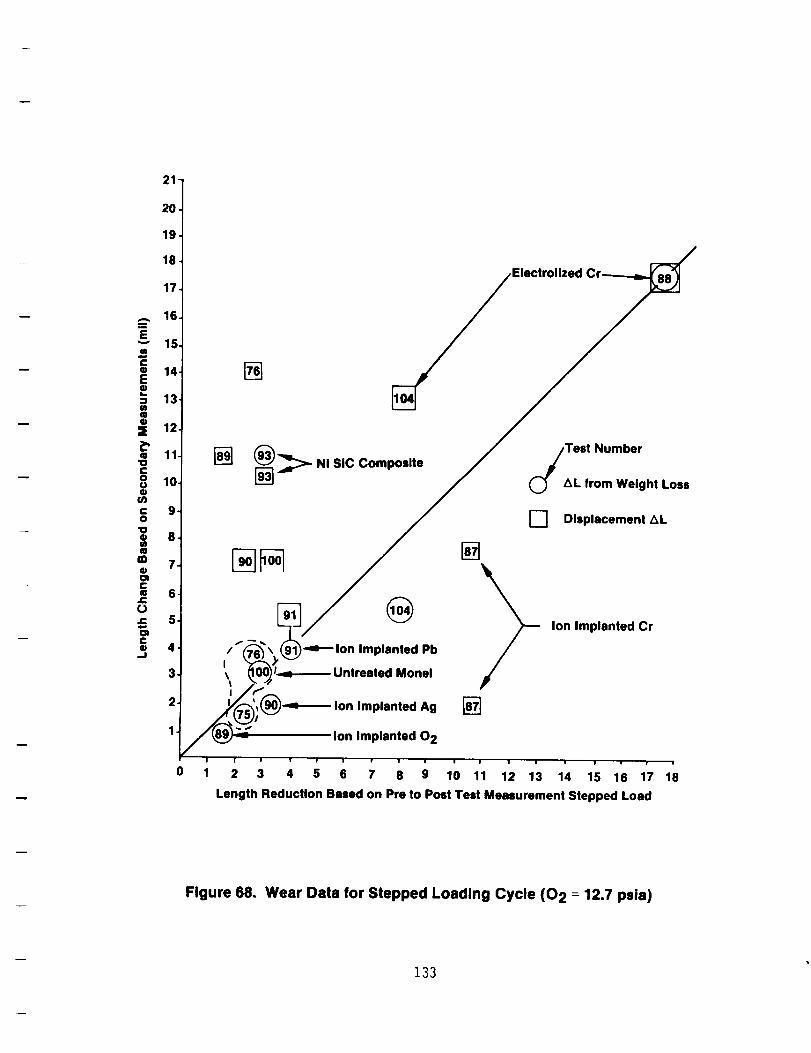
21-
20
19
18
17
... 16.
.iE"-" 15.mC• 14-Ee= 13.(@elO• 12.
e 11,
C@U0
CO
'O0cOmm0
m
£C0
.J
10
9.
8.
7.
6.
5.
4,
[]
Electrollzed Cr-__
[]_ _:>- Ni SiC Composite Test Number
L from Weight Loss
I--] Displacement LIL
/ 1_,,,_ r-_--- Ion Implanted Pb
I _00_/I.._-.--.-- Untreated Monel3 \
/ a /,"(_
2__, ,'_, Ion Implanted Ag1 Ion Implanted 0 2
i i i ! i
0 1 2 3 4 5 6 7 8 9
@
@
Ion Implanted Cr
i i i i i ! , w
10 11 12 13 14 15 16 17
Length Reduction Based on Pre to Post Test Measurement Stepped Load
18
Figure 68. Wear Data for Stepped Loading Cycle (0 2 = 12.7 psla)
133

VII, E, Results and Discussions (cont.)
The material loss for the variable load testing in 1000 psi
02 was higher. This was expected since the loads were higher. In this series
all of the ion implanted specimen seemed to offer some advantage over the
three sets of data for the base line untreated monel tests 77, 78 and 86. In
these tests the ion implanted Cr and Pb were the most favorable while the
electrolized Cr Test 83 was the worst. The high wear of the ion implanted Ag
on Test 81 was confirmed by 3 independent measurements.
Examination of the data for the variable load tests in
ambient pressure oxygen indicates that the displacement measurements are
generally much higher than both pre-post length and weight change values
except for Test 93 (Ni-SiC composite) where the length change is in disagree-
ment with both the displacement and weight change measurements. In general
the displacement measurements could be in error in this entire series since
the specimen heating rates were much greater in the low pressure oxygen tests
and this could have influenced the online sensor. Two electrolized Cr tests
resulted in greater material loss, with Test 88 being significantly more (25
mil) than Test 83 (5-10 mil), and both being more than all others under which
were 4 mil.
F • EFFECT OF SURFACE MODIFICATIONS AND OXYGEN PRESSUREON MONEL K-500 WEAR RATES
The online displacement sensor was used to obtain these data.
Tables XXll and XXIII provide the material regression rates for each load
condition assuming a linear loss over the test duration in which the inde-
pendent parameters of load and 02 pressure were held constant•
134

Test
No. Coatinqs/Load
77 Untreated
Monel K-500
18 UntreatedMonel K-500
86 UntreatedMonel K-500
80 Ion In_)lantedChromium
81 Ion ImplantedSilver
82 Ion ImplantedLead
ElectroplatedChromium
85 E-C Composite
02 at Ambient Pressure
75 UntreatedMonel K-500
76 UntreatedMone] K-500
92 UntreatedMonel K-500
100 UntreatedMonel K-500
87 Ion ImplantedChrome
100 Ion ImplantedChrome
88 Elect. Cr
104 Elect. Cr
89 Ion ImplantedOxygen
90 Ion ImplantedSilver
91 Ion l_lantedLead
93 EC Composite
Table XXII. Comparison of Wear Rates For Monel K-500 with SurfaceCoating with Step Load
6.9 MPa (1000 psi) Oxygen Environment Pressure
Wear Rates in./sTimes
O-40s 40-80s 80-140s 140-180s 180-240s
50 psi 200 psi 50 psi 400 psi 50 psi
I. 5xi0-4 I. Ox10-4 3. 333x10 "5 I. 25xi0 "4 -3. 33xi0 -5
2x10⁻⁴ 5x10"5 I. 667x10 -5 7. 5xi0-5 -2. 5xi0-5
2. 25x10 -4 7. 5xi0-5 0 2. 5×10⁻⁵ I. 667xi0 -5
2. 5x10⁻⁵
5xi0-5
5xi0-5
5xi0"5 3. 33x10 -5 I. 25xi0 "5 0
lx10-4 1. 6667x10 -5 I. 25x10 -4 8. 33xi0 "6
2xi0-5 5xi0-5 0
lxi0-4 7. 5xi0"5 1. 667x10 -5 2. 5x10"5 1. 667xi0 "5
5xi0-5 5xi0-5 0 I. 75x10 "4 I. 667x10 -5
0
0
0
0
0
0
0
0
0
0
7.5xi0 "5 10. 10-5
0 6.6xi0 -5 0 11. 10-5
0 6.6x10 -5
0 5.0xi0 "5 Ignited 13. 10-5
0 6.6x10 "5 - 10. 10-5
0 5.0x10 -5 - 13. 10-5
42x10 "5 I0.0xi0 "5 0 8. 10-5
10xi0 -5 6.6x10 -5 0 13. 10-5
0 8.3xi0 "5 0 8. 10-5
0 6.6x10 -5 - 12. x10 "5
0 8.3x10 -5 13. 10-5
- 11.7 12. x10 -5
135
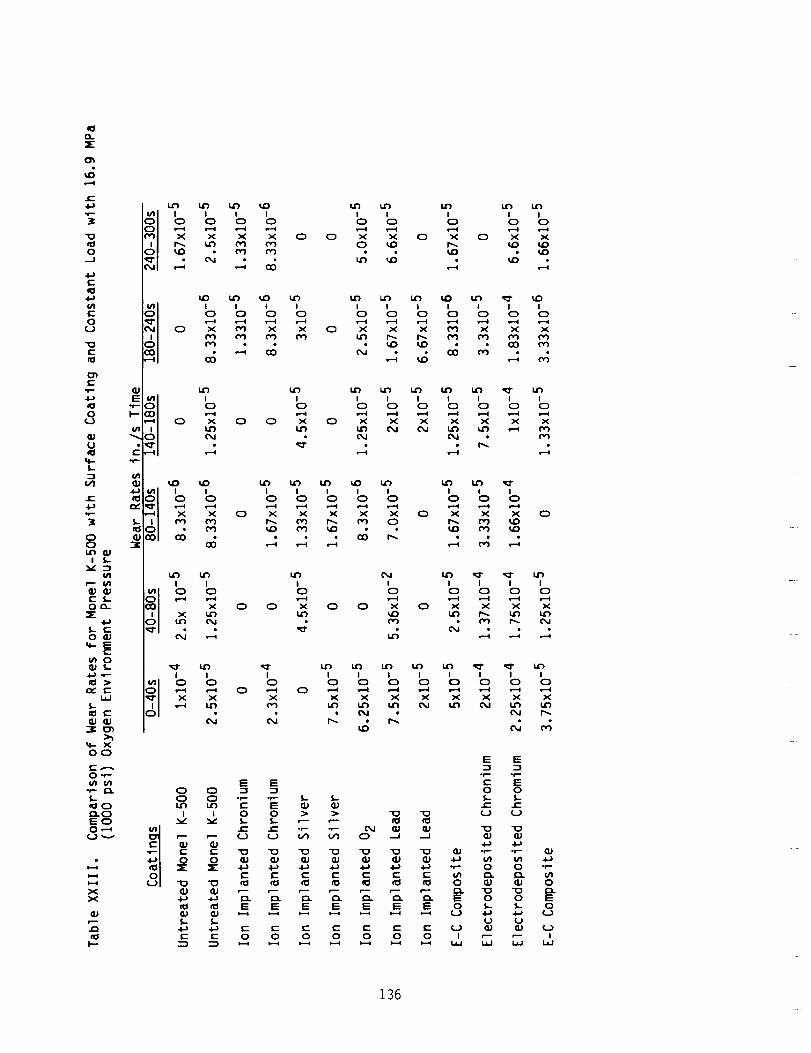
n
dr-
e_0_.J
4or-
t-O
¢-
¢-
4-)a_0
Ue_
S-
t-
O
_- S-Oo-ZE
0
_ 0
S-
qJQJ
O0
O',-
S,-
0,--4
XX
I--
X
tO
! I0 0 0
X X X 0 0
I0 0
X X
0
0 X
I0 0
0 X X'4:) _0
I I I0 0 0 0
X (_ X Xin ,,,,0 0 X X X 0") X X XIt) r--. r'-- _ ¢,3 o'i (vl• _ _D • • O0 eo
I
°X0
X 0 0
I0
X 0
N
0
0 X
0
0 X
I I0 0 0
X X Xr',,, _
0
XL_
14")I I0 C)
X X
¢",J r',,,
I0 0
,,-...4X X
°
I0 0
...-4X X
i0 0
,--iX X
i0
X
!
o
00
I
I.Q;
136

VII, F, Effect on Surface Modifications and Oxygen Pressure on Monel K-500in Oxygen (cont.)
Figure 69 graphically displays the wear rate of untreated Monel at
50 psi contact load in oxygen at 2 pressures. Rate data are presented for the
first 40 sec of wear, the 60 sec following the 200 psi load step and the
60 sec following the 400 psi load step. The material loss rate in 02 at one
atmosphere is noted to increase each time the 50 psi load step is applied.
Since the test rings were hotter at each subsequent 50 psi load step an
Arrhenius type plot (loss = I/T) was prepared to see if the loss rates con-
formed to normal temperature dependencies. Figure 70 indicates that the
regression rate of untreated monel in 12.7 psi 02 is predictable by the
increase in temperature at each 50 psi load step. Post test analysis of the
material hardness also showed a loss of the heat treatment near the rubbing
surface which can also explain greater wear. The hardness measurements are
covered in a later section.
In contrast as noted in Figure 6g the highest wear rates in 1000
psla 02 were experienced only during the first load 50 psi load step. Much
lower wear rates were recorded in subsequent loadings. Since the temperatures
were nearly constant this reversal cannot be fully explained except for the
possible formation of a low friction surface glaze or a surface work harden-
ing.
Additional analyses of the wear rates of untreated monel were made
by comparing the results of the first 40 sec from the variable load test with
data from same time period on the constant load tests. Figure 71 shows this
comparison and also wear rate vs time for comparable time periods over the
remainder of this test.
This figure shows much higher wear rates upon first contact. The
inconsistency between the variable load test and the constant load test was to
say the least disturbing.
137

t26-
24-
22-
20-
18-
16-
14-
12_
10.
8
6.
4.
2.
0.
Wear Rate 10 -5 in/sec
First Applied Load of 50 psi
O
O
/
/
//
•4- 50 psi after 200 psi
)-50 psi after 400 psi
[] / 14.7 psi 0 2
/
/
/o/
[]
0 00
0 01000 psi 0 2
O
Time
I-I Low 0 2 Pressure
O High 0 2 Pressure
Figure 69. Wear Rate of Untreated Monel K-500 in 14.7 & 1000 psi Oxygen at a Contact
Pressure of 50 psi
138

f26
24
22
20
18
16
14
12
10
8
6
4
2
0
.4
Test No.
77
78
86
75
76
92
I00
Time
0 2 psi
1000
1000
1000
14.7
14.7
14.7
14.7
I
0-40
3OO
300
250
400
5OO
500
900
40-80
350
55O
400
1000
1000
1000
1100
Avg Temp OF
80-14i)
200
250
250
7OO
6OO
600
7O0
140-180
6OO
6OO
600
1500
1500
Melt
1500
Wear Rate 10 .5 in/sec
180-260
250
250
30O
1000
1000
1100
Load 50 psi
17,000 RPM
[]
(_ 1000"1100°F
OO.5OOOF
.0 D
. , , . ,, ,0--0, ,
.5 .6 .7 .8 .9 1.0 1.1 1.2 1.3
l/Tabs (lO00OR)
Load
psi4OO-- 200
50
Time
Pi °21000 psl ]
Load Step
,®,®200-300OF
1.4 1.5 (10 .3 )
Figure 70. Correlation of Material Loss Rate by the Arrhenlus Relation
139

18
16
14
12
10
8
6
4
2
0
10 .5 In/sec
M
M
First 40 sec
50 psi Period of Variable Load Tests
_ 0 psi Constant Load
/-_ 2nd 50 psi Load Step
_ i! 1
100 200Time, sec
/-_ 3rd 50
i
)si Load Step
!
3OO
Figure 71. Wear Rates vs. Time Monel K-500 0 2 = 1000 psla
140

VII, F, Effect on Surface Modifications and Oxygen Pressure on Monel K-500in Oxygen (cont.)
Hardness surveys were conducted to determine if all the specimens
had the same initial heat treatment. Measurements were taken in the center
and on the cold end furthest away from the heat effected zone. The results
were as follows:
Step Load Tests 02 Pressure psla
76 12.778 100086 1000
Hardness Away from
Rubbing Surface R/45N Rot/Sta
35-36 / 33-3732-33 / 33-3636-37 / 35-37
Constant Load Tests 02 Pressure
167 1000
168 1000183 1000
35-37 / 35-3635-37 / 34-3733-35 / 35-37
As can be noted all of the test rings had similar hardness values and thus the
difference in wear could not be attributed to differences in initial hard-
ness. The expected hardness for the age hardening Monel is RC 35 which trans-
lates to 37 on the 45N scale.
Hardness profiles were then taken along the length of the cylinder
wall starting at the rubbing end. These are shown in Figures 72 and 73.
Figure 72 shows a reduction in hardness near the rubbing surface in 5 of the 6
rings used in the step load test. Test 76 run in 12.7 psia 02 had the
greatest reduction in hardness which can be explained by the higher operating
temperatures experienced in the low oxygen pressure tests. Figure 73 shows
that 5 of the 6 rings tested at the lower fixed load in high pressure oxygen
retained their original hardness to within .03 in. of the rubbing surface.
Valid measurements on the contact surface could not be attained because the
wear surfaces were too irregular.
141

02 Press Test Wear Rangepsi Sym. No. MII
12.7 _ 7e 2.6-4.o1000 [] 78 9 - 14
1000 O 86 9 - 15
12.7 _ 100 3.0 - 7.1
zIn
n-
w@e-
(03:
40
30
20 /
lO _
oDistance from Rubbing Surface (in)
Pretest Value
RC 35 = R/45N
/
R = RotatingS = Stationary
Figure 72. Post Test Hardness Profile Untreated Monel K-500
142

Sym TestNo
Wear RangeMII
N 167 1.4 - 4.5O 168 2 - 4<> ls3 1- 4.s
ZIn
rm-
o@
:=n2:
4O
3O
2O
10
Pre Test Value RC 35
R/45N
,
/- /
/ _ JJ
R -- Rotating
S -- Stationary
J i I I I.1 .2 .3 .4 .5
Distance from Rubbing Surface (in)
Figure 73. Post Test Hardness Profile Untreated Monel K-500 6.9 MPA (1000 psia)
0 2, Constant Loading
143

VII, F, Effect on Surface Modifications and Oxygen Pressure on Monel K-500|n Oxygen (cont.)
The lower overall wear and the harder post test surface following
the constant load tests are expected. The higher wear and softer surface
measured following the more heavily loaded step loading tests are also
expected due to the higher surface temperatures. The greater depth of soften-
ing following the low pressure tests were also expected due to the reduced
cooling. The following two factors however are still not explainable:
i) The cause of the higher wear rates in Tests 78 and 86 in the
first load step and
2) The low wear rate In Test 76 where the oxygen pressure was
reduced.
The following speculations can be offered. The reduced wear rate
after initial contact could be due to work hardening of the surface or devel-
opment of an oxide glaze which reduces the wear rate.
The advantages of the various surface treatments should also in
theory be quantifiable by comparing the material loss rate for the flrst 40
sec of the variable and constant load tests. Unfortunately no such correla-
tion could be obtained and thus the wear data from this test method which
appeared valid at first has become suspect especially at the lower loads.
Figure 74 shows the inconsistency between wear of ion implanted Cr in two
identical tests, 175 vs 181.
Figure 75 shows the influence of surface modifications on wear
rate for the 3, 50 psi load steps in the variable load tests while Figure 76
shows the wear rate as a function of load. Using only the data from the first
50 psi contact period is shown in this figure. All of the ion implants and
all the platings show a measurable benefit in the form of reduced wear for the
initial contact and little or no advantage for subsequent rubbing.
144

1
-1
-2
-3
Z
-7
-8 _j i_l j t i I , l , , I , , I , , I , , I I , I , , I , , I , ,
I _ _ _ _ _ _ _ _ _
930 175 D'I'- 70 L,.hd.dBiL_ I_,.,,_,dI_)_,,,L.J_L_ dk .a,,ik'--_JiL dLl J. AL,.+. tkU_ • .J.,.JJ_l +_'`'_0h"-.'-" t_
V _H ]q.-F,_,ir_- T'I_ "_+l'r++_ll_" _T ..I.,_.MII-F_qvr_[-'_- r "l_--Irr "
I.o <.__;) cJ_D r_
TIHE (gEC.)
l
0
-1
-2T
z_ 3
-4
.-5
-6
I
I-i-
]-
030 lgl DT- 70i
.liJ_.lj£ SJd, llit.Jlb_ll._,,.J,I ,. II ,.,, ijl+.jdlut ..... .I -LJI-ItlJLI,+,I,J..Ij,L.J
"P'P"_ '_+ "T-' .... ,-r'Ir .... _' m-" r'-P"'"+r+'"r'-"'+- I
II
#iI II.
, _ 1 _ t I_J_..J.__.J__Lt I , _ 1 _.j_L___...L.I__t_JI_J
_.) O'_ ¢D -- _ P_ r_ I%1 _._ ¢._._
T]HE (SIC.)
Figure 74. Comparison of Displacement Measurements for Ion Implanted Cr fromTests 175 and 181 1000 psl 02, 50 psi Contact Load
145

too
¢:.D
o
IZ
@
20
1098
6
5
4
3
-- Initial Load Application 50 psi
A
/M_
[]
®
m
m
m
m
m
ECr
EC
IPb lAg
ICr
-- 50 psi after 200 psi
® ®ICr
D-- 50 psi after 400 psi
IAgA
/M_ EC_ ECr
ECr
IAg
_ ' ,2 3
50 psi Load Step
Figure 75. Effect of Surface Modification and Load History on Wear Rate
in 0 2 at 6.9 MPa (1000 psi)
146

20x10-5
10x10 5,
8x10⁻⁵-
6x10⁻⁵-
4x10⁻⁵-
2x10⁻⁵-
Wear Rate In/sec
M
M
M
ECr M, lAg
E or M, M
IPb EC
lag MICr IPbEC
ICr
IPb
M
M;IAg
ECr EC
ICr
!
lx10"5 0 100 2()0 '300 4()0
Normal Load psi
Figure 76. Effect of Surface Modification on Wear Rate as a Function of Contact
Pressure in 6.9 MPa (1000 psi) 0 2
147

VII, F, Effect of Surface Modifications and Oxygen Pressure on Monel K-500Wear Rates (cont.)
Figure 77 summarizes the influence of 02 pressure and surface
treatment on the sample wear. The untreated Monel lost material 3 times
faster at 6.9 MPa (1000 psi) than in .088 MPa (12.7 psia) 02, even though
these operated at much lower temperatures. An oxidation process would appear
to be involved. The ion implanted Cr, ion implanted lead, and the electro-
plated Ni-SiC composite appeared to be of some advantage in reducing the
wear/oxldation rate; however additional tests are required to provide a
statistical base for these conclusions.
G. FRICTION COEFFICIENT
I. Friction Coefficients Variable Load Testinq
Figure 78 provides a summary of the friction coefficients,
computed from normal load and torque measurements for twelve tests at .088 MPa
(12.7 psia), and ten tests at 6.9 MPa (I000 psia) 02 in which valid data were
obtained. A portion of the high pressure data have been reproduced in Figure
79 to aid in the discussion of results. The three untreated Monel samples
yielded friction coefficients Cf of 0.1 to 0.2 during the first 30 sec in
which the 50 psia normal contact load was applied. All of the ion implanted
samples indicated friction coefficients reduced by a nominal factor of 2,
during this early contact period (Cf = 0.05). The ion implanted lead provided
the greatest friction reduction and in contrast with the brass 360 did not
initiate premature metal ignition at the higher loads. Lead forms a soft low
melting temperature oxide with good lubricating properties. No significant
advantage was observed at the higher contact loads or after 40 sec of rubbing
and it could be assumed that the surface modification has been rubbed away.
Electro-plated silver also reduces the friction coefficient to a value less
than 0.05 at low contact load, however when the stress is increased to 200 psi
at 40 sec the samples show a sudden increase in friction of 500% which was
148
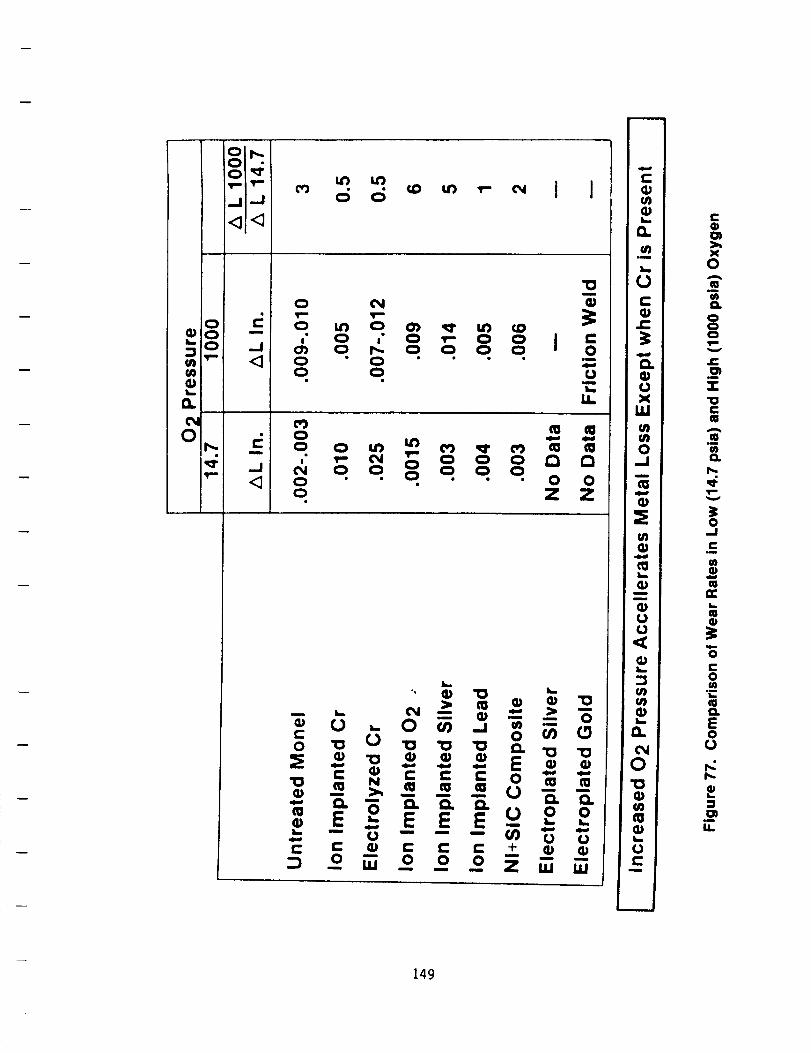
T-, 't-- t_ • _ I_ ,r" t_l i I..I --I 0 0
"- _ o • . o. o. o. o. o oo Z Z
->
oC C 4) C _ C + _ 4)
emm m .ram mm
0 m 0 0 0 Z UJ mm m
L-
n
U
U
I,U
0..Im
UU.<
i._
"I
I1.
C_0'ID
U
m
Co
0A
in
ooo_m
em
'1"
ct_
(f)
r,.
4
0,,Ji,-
w
L_
m
ot-Ow
E00
,u
149

147
• j, _ , , , _ :
. , o . | ....
r ,Hr I _ : i i r i i i I _ i _ :
"i : i ! ! ! -!-! _ - .!_! : !
_ _' : I i I i I I 1 I l I
L-_'--' ' : ' ' _--'--4--.'--;.-i
"I " ' - ...... i
2 " " ? : : I _ ? = = l .', ? -"
• A_i.:.__i.i i i..i : L_.i_ : i
I,? , _ I , _- ? I I , I- r"_,
: 4 ,_.
I i ; ! i4 i4 i-; i ;4
, .-b!.::.i--i i--i--i--! 4--!--_---i---_-!
i,_'[: : ; ! i ! ! ! i-:-.!-.! iq ' _ : r I I I I I I
100(I ps_a
/
i:' ':"T"I: i i ] i : : . T
I I l I I I I I I i I
' '_ "i _ - ; -t:-:_
.. _ :_.'_..;_.7..'__.'_"II'_.!. !"pl , _ _ _ i _ _ _ _ : _ I!:_
• i r_llO_mia 06 I"O'lt _ 500 I_-t _._ ,: j
U' '--k--'- ' .'. ' -_.- ' ;_'";-i
i _ l I l I I I P I I l I
0 2 Preslure
UnlTelted
Mon_ K-S00
. : ........ L ...:.
p • i I I I i r ! I : I i l ! Chrome1111j ] I L _J _I : ....... _ lon|mplented
? - _ . o
t .......• " -'. ; : : _i : ? ; : ! - =- =-,
Electrolyzed
Chrome
'_'-i_ ! i _ _ _ : :T-!
- _? ,._-_-_._-..a.--_n.. _ k -_- _ ....
.,__-_;' - ' --'--' ' ' --4--.;---i- ' '_ O_yo,n
-._ "-4 _ ! ! ! _. ! 4---;---!- -' _"' ......
,-_k_'_. :L=;._.,,_,,_-_ --W,;=._.-,i-- _,,,,,
;4 : : : : : : i : : : : Ion Implanled
• f,[, : . .: ............... " " :
......... L : .; . L . ; ..... : : ;
[leclropleted
SIlYer
• z , : : ! - .. = =_ ! . . . ......
Figure 78. Summary of Friction Coefficients, at 14.7 and 1000 psia, 0 2 17,000 RPM
ORIGINAL PAGE IS
OF. PDOR QUALITY150

ORIGINAL PAGE IS
OF POOR QUALITY
• • •
151

VII, G, Frlction Coefficient (cont.)
shown earlier to be accompanied by rapid heating. The tests conducted in low
pressure oxygen showed no significant reduction In friction for any of the
surface modifications evaluated.
2. Constant Load Testinq
No valid data were obtained from this test series due to
problems with the torque measurement system.
H. ANALYSIS OF INDIVIDUAL SURFACE MODIFICATIONS
The following section compares the results for each of the modi-
fied surfaces with untreated Monel K-500.
I. Ion Implanted Oxygen
This implant was selected to study the effect of 02 enrich-
ment at the rubbing surface or as a possible passivation treatment. No par-
ticular advantages over other ion implanted materials were observed.
a. Step Load Tests
The data indicated that the peak temperature for the
tests conducted with 6.9 MPa (1000 psi) oxygen environment pressure were lower
than peak temperatures observed for tests conducted with ambient oxygen envi-
ronment pressure in all 5 time intervals of the test. The times at which the
peak temperatures occurs for the high pressure tests are approximately 20s
after the load has been changed from 5000 kN/m2 (50 psl) to 20,300 kN/m2 (200
psi) or from 5000 kN/m2 (50 psi) to 40,500 kN/m2 (400 psi) while for the low
pressure tests the peak temperatures occur 35s after the load is changed. The
values of the peak temperature for the high pressure test during the time
152

VII, H, Analysis of Individual Surface Modifications (cont.)
intervals 40-80s and 140-180sare 588°K (600°F) and 811°K (1000°F) respec-tively. The corresponding values for the low pressure tests are 977°K(1300°F) and 1297°K(1875°F) respectively.
Thevalues for the coefficient of friction at the time
whenpeak temperatures occurs is 0.1 in both the high pressure and low pres-sure tests and there is no appreciable difference in the coefficient of fric-
tion after the load is changedfrom 5000 k/m2 (50 psi) to 20,300 k/m2 (200psi). The starting values for the coefficient friction was0.[I and the value
close to the end of the test was0.05. Thedecrease in the coefficient of
friction is probably due to the formation of the beneficial oxide layer called'glaze' which maybe formed at the contact surface.
b. Constant Load Tests
During the constant load test large fluctuations in the
temperature were observed and peak temperatures were 400°K (260°F) and 444°K
(340°F) for the two tests conducted.
2. Ion Implanted Chromium
The chromium implant was selected because the presence of
Cr203 near the surface was thought to be beneficial. Measurable benefits over
untreated Monel K-500 were observed.
a. Step Load Tests
The peak temperatures with ion implanted chromium in the
time intervals 40-80s and 140-180s are 533°K (500°F) and 755°K (gOO°F) for the
high pressure tests and 1116°K (1550°F) and 1255°K (1800°F) for the ambient
pressure tests.
153

VII, H, Analysis of Individual Surface Modifications (cont.)
The coefficient of friction does not change appreciably
during the test when the step load is applied. The starting and end value for
the coefficient of friction is approximately 0.5.
b. Constant Load Tests
For the two tests conducted the data were not repeatable
and peak temperatures were 449°K (350°F) and 363°K (lg5°F). The interval
during which these peak temperatures occurred was different, with the former
occurring in the O-40s of the test period while the latter in 240-300s of the
test interval.
3. Ion Implanted Silver
Silver does not form a stable oxide at elevated tempera-
tures. The possibility of blocking the surface oxide was a concern. This
material exhibited greater wear than other implants in high pressure oxygen.
a. Step Load Tests
The peak temperatures in the reference time intervals in
this case were 602°K (625°F) and 658°K (725°F) for the high pressure tests and
691°K (850°F) and 1366°K (2000°F) for the low pressure tests.
The starting and end values for the coefficient of
friction were 0.14 and 0.06 respectively.
b. Constant Load Tests
The peak temperatures in this case was 433°K (320°F)
which occurred during O-40s of the test period.
154

-- VII, H, Analysis of Individual Surface Modifications (cont.)
4. Ion Implanted Lead
Lead was selected because of the unfavorable results of the
360 Brass which contained lead copper and zinc. Lead proved to be one of the
better implant materials.
a. Step Load Tests
In this case the peak temperatures in the time intervals
when the load was 20,300 k/m2 (200 psi) and 40,500 k/m2 (400 psi) was 547°K
(525°F) and 811°K (IO00°F) for the high pressure test and 811°K (IO00°F) and
I033°K (1400°F) for the ambient oxygen pressure tests.
The start and finish value for the coefficient of fric-
tion were 0.06 and 0.03 respectively at high 02 pressure. The lead also
showed an advantage over untreated Monel at low oxygen pressure.
b. Constant Load Tests
There was good repeatability of the peak temperatures in
this case, 389°K (240°F) and 383°K (230°F) but the time interval in which they
occurred differed during the two tests. The former occurred in O-40s while
the latter in 240-300s intervals.
5. Electrodeposited Chromium
This surface treatment proved to be the worst from all
respects, when rubbed against itself.
a. Step Load Tests
Two tests were conducted at high and ambient oxygen
environment pressure. In one test at ambient oxygen environment the peak
temperatures in the 40-80s interval and 140-180s interval were I144°K (1600°F)
155

VII, H, Analysis of Individual Surface Modifications (cont.)
and 1366°K (2000°F) while in the other test the corresponding values for the
temperatures were 772°K (930°F) and 1228°K (1750°F). In the high pressure
tests the corresponding values for the temperatures in one test were 644°K
(700°F) and 558°K (600°F) and for the other test 616°K (650°F) and 755°K
(900°F). These values indicate that the repeatability of the test data was
not very good.
The start and finish values for the coefficient of
friction in this case were 0.22 and 0.08.
b. Constant Load Tests
In this case the peak temperatures differed considerably
for the two tests conducted. The peak temperatures were 455°K (360°F) and
710°K (820°F).
Future tests should include a chrome-silver combination
(hard on soft) for several reasons. 1) other data suggest this to be a good
combination, 2) portions of the turbopump incorporate this combination and
3) it will add to the data base of unlike materials.
6. Composite Plating of Ni-SiC
The composite provided the highest surface hardness combined
with a substantial thickness to resist wear for extended periods. An advan-
tage over untreated monel was observed and further testing is suggested.
a. Step Load Tests
The peak temperature values for ambient pressure tests
were 1144°K (1600°F) and 1200°K (1700°F) while for the hlgh pressure tests the
values were 505°K (450°F) and 755°K (900°F) respectively.
156
VII, H, Analysis of Individual Surface Modifications (cont.)
The start and finish values for the coefficient of
friction were in the range 0.15 and 0.07 for the tests conducted.
b. Constant Load Tests
The peak temperatures in this case were 411°K (280°F)
and 366°K (200°F) for the two tests conducted.
7. Electrodeposited Silver
This material functioned well at low contact pressure but
tended to heat rapidly when a high contact load was applied. The sudden
increase in temperature and friction coefficient indicated the inability to
form a protective oxide film on a hot surface was causing local surface weld-
ing.
. Electroplated Gold
This material failed by shearing at the gold-monel inter-
face. The failure is attributed to surface welding due to the absence of a
protective oxide film. The next section provides additional documentation of
this failure.
I. PHOTOGRAPHIC AND METALLURGICAL ANALYSES
Photographic documentation of the various test specimen and sur-
face modifications were taken before and after testing. Detailed surface
analyses were also conducted using optical, Scanning Electron Microscopy (SEM)
and Auger Electron Spectroscopy (AES). Appendix B documents the analyses con-
ducted at the WSTF. The following section contains the materials evaluation.
157

Vll, I, Photographic and Metallurgical Analyses (cont.)
1. Pretest Condition
Figure 80 shows an overview of the test r|ngs with the
various surface modifications. The composite and the silver plated surfaces
are substantially thicker than the others.
Figure 81 shows a 14X enlargement of surfaces before test-
ing. The ion implanted surfaces (upper right) did not change in appearance
from the pre-treated surfaces and all of the implanted elements provided
identical visual surface finished as shown in Figure 81a. The electrolized
chrome surface (upper left) was shiney and considerably smoother. All
specimens had the same appearance. The edges were more rounded than the
original surface and the Ion implanted specimen either due to the preparation
and masking or plating process. As noted earlier the composite plating
(bottom) was much thicker and tended to mask the machining marks on the
untreated surfaces. Some of the plated specimens contained small surface
imperfections as may be noted on EC-2 while most appeared smooth as shown by
specimen EC-5 in Figure 81.
In order to understand the role of oxygen on the surface
composition of the Monel K-500 one of the ion implanted oxygen surfaces was
examined by AES techniques. Figure 82 documents the atomic composition of the
surface treated specimen indicating the percentage of Ni, Cu, A] expected in
the monel plus oxygen which was implanted. The other materials, i.e., Zn and
C represent surface contamination.
The Indepth concentration profile was then determined by ion
beam milling (sputtering) the surface away at a rate of approximately 300A/min
to obtain the results shown in Figure 83. The carbon was observed to be
present only on the surface. The oxygen showed an atomic concentration of 10%
for a depth of "1200A" and then reduced to "0" at a depth of 2100A. In the
zone where oxygen was present in measurable quantities the following
alterations were observed in the monel substate.
158

S_:?!}'/b,L PAGE IS
OF POOR QUALITY
e.
Eeg
UOQ.
(/)
G)I-"O
im
im
'tOO:E
Um
1:
(/)
OO
O.1=13.
OI-
!,._
13.
c_OO
II.
-,1O1
.m
I.I.
159

Specimen ECR-1Electrolized Cr 14X Specimen I-O-10
Ion Implant 0 2 14X
NYE Carb Ni+SiC 14XSpecimen EC-2
Specimen EC-5
Figure 81. Pre Test Surface Comparisons of Electrolized Cr, IonImplanted Surface and NYE Carb (Ni+SiC)
160

OF POOR QUALF_
xooo
Q;I-
a.
-ooe.
Q.Ec-O
xooo
I,,-2
Q.
¢,j
@
iiiO.E
c0
A
"o0
e-
c-OU
c-o
.e-ranE0U
Um
CO
0L_
161
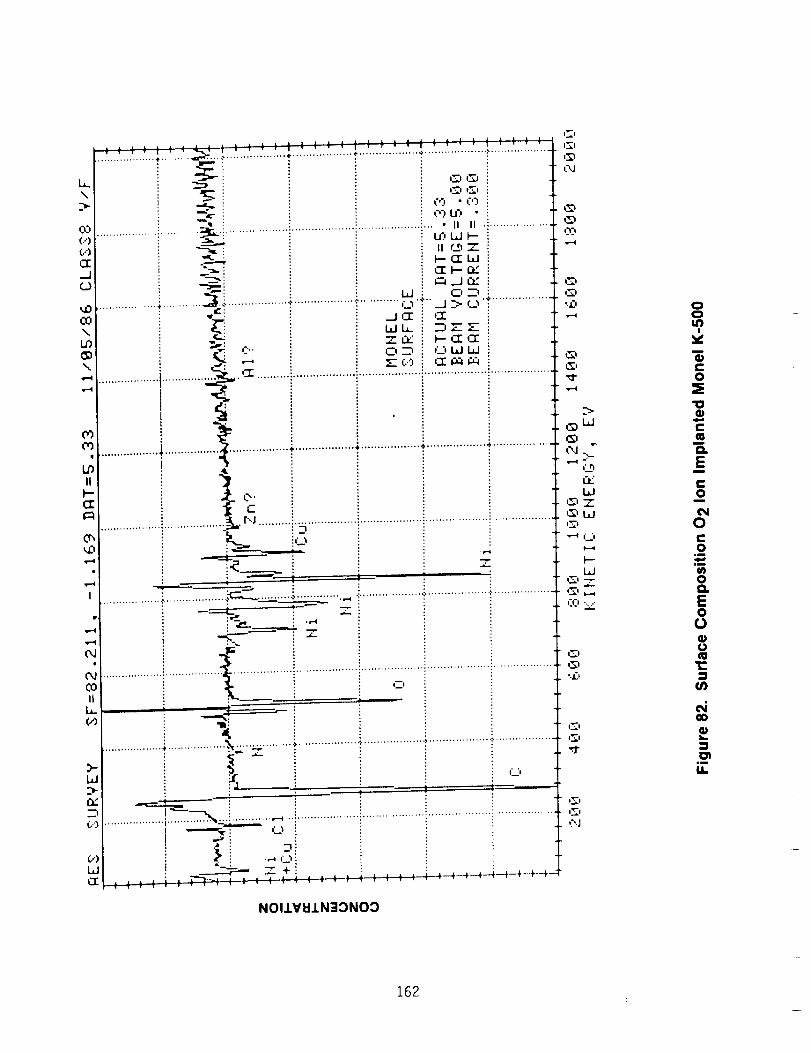
L • ......... ,_, ,_ .... ,__ ; : i ; : : _, ,_,',_,'.....'.' '__ ' '_..-.-.-.-.-.-.-.-.-_"_ '...................................................•......................................
lw.--
"_ "0 LF' "
(..') _ Li3W I--(..g _ . II ¢_n.,_.-"
_ _ cc L,J.-J __.,..:C) -,_. '. _1 d CIC
.................................................................................... C.." J ."=,-.r....','*.................,,,r"i
O_ J ,'T ,-r
IJ) -_, ...T_Cx:: I--¢_:,'T"_ C" C' --_ '_'W W
\ .--: ,_..,,... "T _.,_iI_................................. ,._, l'T" .................................................. . ................... :..................
I
I ............ " .........................................................................
LO
")-..
• : __ == .':-
, .................................... ..................._......,!..........................................................
.__ : i Tr--_ '_ :
I'_,! ............................................................................. "",__.............................................
II
....................................._.,,_._................................... , ...................,....................................I
i,i _ ,'-,
............,__...,-, .......................................... ,l_.') ..................
,-----,%.: ,'__
i6") ._ ,L__w __S_ _ +
NOIJ.VIdJ.N'_3N03
i.._i
,3),,.-4
*.I'I
i--4
.¢I-,,,-4
_D
',--4
",--4
,:C,
,'C,
,_,I_1
,__,I.T,.i
,-,j
W
it.
i'.__
W
W
I'_I
l--w
...o.
00It)
I
vi
0i!"I0
,z.-
n
Ei
e-o
m
0
0
0
E00
l.iIg
in
Ipli
01,i
I.I=
162L

I.\
v-4
I.-¢_l,i
N
J 9-4
I"-_v Z ......._..................................................._....................._ tv_-4
............................................................._................ .., ............4,.,
¢:
..............._ ........
1
I
........ ,.o
,°,° ..... ° ...... J°°° _ ..........
W I-- CZ:Z_Q ":
..............i.._. ..........................................!.............................q;.....................
i
.......................<_ ................................................................_; _-' -
1 i",. °• \,: % :: "o
..............f................_............_ ii II i
i . / i
i "
' I ]I _ •
Z
_W
WI'-
(,'9
.,-¢
0,1
,,'z_,
00
|
n
0_..0
"ID
Q.
C0
¢_100
0
e-0
_)0Q.E0r..)
cO
.m
LI.
0 0 0 0 C_ 0 0
IN39_3d 3INOIV NOIIISOdN09
o
163

VII, I, Photographic and Metallurgical Analyses (cont.)
a. The nickel dropped from a nominal 66 A/O* to : 55 A/O.
b, The aluminum concentration increased from an internal
concentration of 6 to 8 A/O to a near surface concentra-
tion of 10 to 14 A/O.
These measurements indicate that the presence of oxygen at the surface will
tend to enrich the surface in aluminum probably to produce Al203. Additional
discussion of the pre to post test change in near surface composition if ion
implanted Cr and Pb is provided in the next section.
2. Post Test Condition
Visual inspections and pre to post test changes in the near
surface and chemical composition were investigated using SEM and EDS methods.
Figure 84 shows the post test condition of the rings after
testing in 02 at 1 atmosphere pressure. A glaze can be observed on all of the
surfaces except for the composite which spalled in places. Similar results
can be observed in Figure 85 where the oxygen pressure was 6.9 MPa (1000
psi). It should be noted that no burning was observed on any of the rings
shown. The thick electroplated silver specimen was also completely stripped
of the plating as shown in Figure 86. The results were similar to those
experienced with gold plating (Test 109) as can be observed in Figure 87. The
gold appears to have welded to itself and sheared clearly at the interface of
the stationary monel specimen.
A detailed investigation and comparison of the rubbing sur-
faces exposed to low and high oxygen pressure was conducted. Figures 88
through 99 show the surface condition at 50 and 500X magnification. The
pretest photos shown in Figure 88 were typical of the untreated and all ion
implanted materials.
*A/O = Atomic Percentage
164

C
01>,X
0C
im
01C
Im
mQ)
I-"0t_0
..I
Q.
(nI"--
q,m
mooin
I
m
4)t-O
• _N_
IE=
umE'1::<
4
IJ.
165

ORIGINAL PAGE IS
OF POOR QUALITY
166
C0
X0A
g_
wO.
000
v
L
t-im
e-ll
o
oo
!
m0e,,0
im
0
0U
im
U,.

OR!G/NA LoF POORP,46_:s
CuAO_
Figure 86. Electroplated Silver Post Test 108, 0 2 = 6.9 MPa (1000 psi)
167
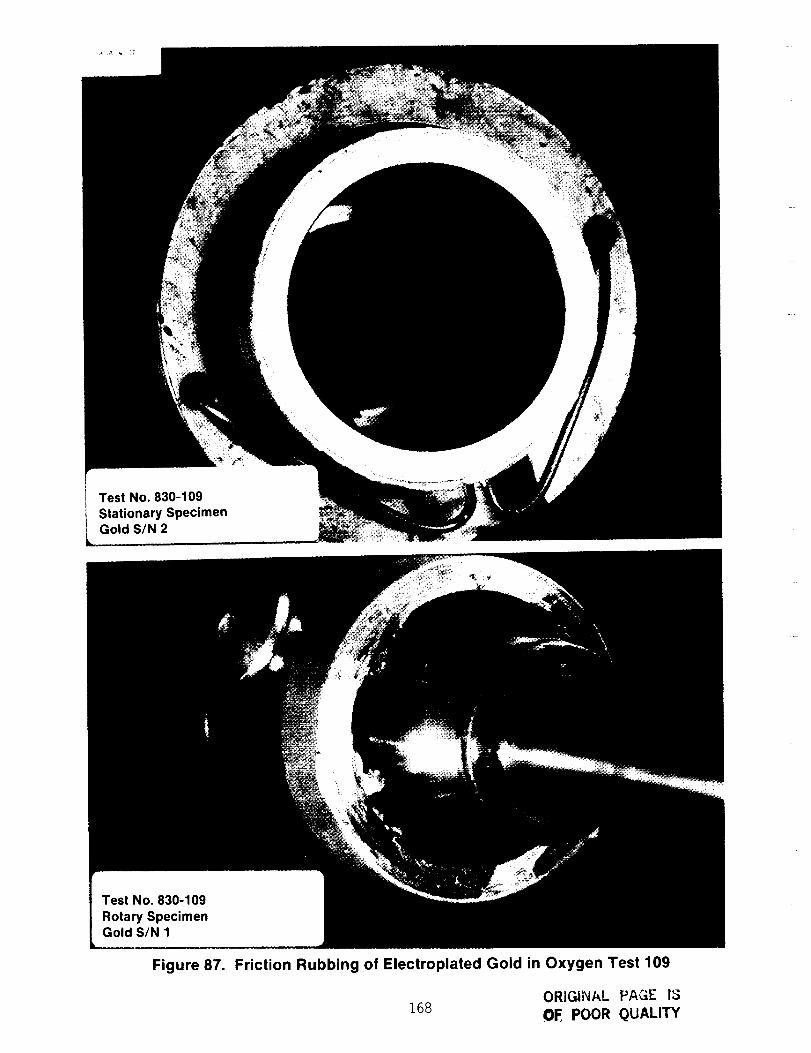
Figure 87. Friction Rubbing of Electroplated Gold in Oxygen Test 109
ORIGINAL PAGE IS
168 ,OE POOR QUALITY

ORIGINAL PAGE IS
OF POOR QUALITY
co
I-
U')
I-
I-
.=O.
I-,,¢,p-
040¢,-
lid
I-O)t-im
0Im
0LI.
c-O
U
"O'_0 _.
_o
UO
•I= '.-_
¢/)_--.=i
_" cad
OlD0
e-
e,
I1
169

0 2 = 1 ATM 0 2 = 6.9 MPa (100 psi)
Figure 89. Ion Implanted Oxygen Post Test 81 and 79 Low and High Oxygen Pressure
OR!GIhiAL PAGE i5
i70 OE POOR QUALITY

OF POOR QUA,.i,Y
0 2 = 1 ATM 02 = 6.9 MPa (1000 psi)
Figure 90. Ion Implanted Chromium Post Test 87 and 80 Low and High Oxygen Pressure
171

Figure 91. Monel D-500 with Composite Ni + 30% SiC
Post Test No. 85 6.9 MPa, 1000 psi
ORIGINAL PAGE 15
OF.. POOR QUALITY
172

OF POOR QUALITY
D
B
A
RotationalDirection
C
A. Smooth Mirror Like Surface, Circumferential with Radial Cracks
B. Subsurface in Spalled Zone
C. Deep Glossy Circumferential Grooved, No Cracks
D. Pitted
Figure 92. Photomicrograph FRT Specimen No. IPb 6, 14.7 psi 0 2 400x
173

Zone 1 & 2 Smooth Glazed Surface
3 & 4 Orignial Surface
5 & 6 Zone under Spall
Figure 93. Ion Implanted Lead Specimen Post Test No. 91, 0 2 -- 1 ATM
174
ORIGINAL PAGE IS
OF POOR QUALITY

OF POOiY "_,, ,'
PB-6 1-21 A PB-6 1-21
B PB-6 1-21
Figure 94. Blistered Zone Ion Implanted Lead Post Test No. 91, 0 2 = 1 ATM
175
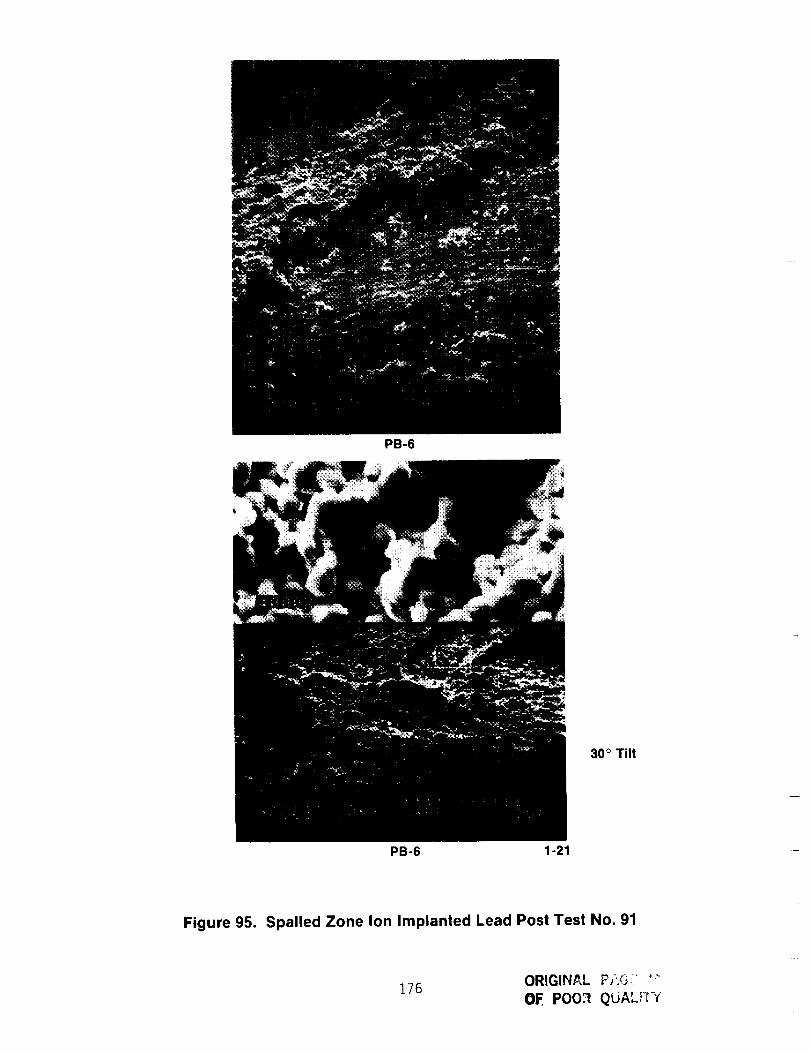
PB-6
30 ° Tilt
PB-6 1-21
Figure 95. Spalled Zone Ion Implanted Lead Post Test No. 91
176 ORIGINAL pf.c_,:: ,-OF POOff QLiAL_-I_'

OF POOR QUALITY
Figure 96. Ion Implatned Lead Post Test No. 82 02, 6.9 MPa (1000 psi)
-- 177

Figure 97. Spalled and Cracked Region for Implanted Lead Post Test No. 82 02,6.9 MPa (1000 psi)
178
ORIGINAL PJ;._.__T_..
OF POOR QUALi'FY

Figure 98. Ion Implanted Silver Post Test 90, Specimen lAg-4, 02 -- 1 ATM
179

OF POOi_'_:.;.-.,-::
Figure 99. Ion Implanted Silver Post Test No. 81, Specimen I Ag-2, 0 2 = 6.9 MPa
180

- VII, I, Photographic and Metallurgical Analyses (cont.)
An overview of all the photos indicates no significant dif-
ferences in appearance in comparison to untreated Monel or differences between
testing at low and high oxygen pressures.
In general the following types of surfaces can be observed.
a. Very smooth circumferential glazed or mirror like
regions with surface cracking transverse to the
direction of motion.
be Subsurface areas where the top layer appears to have
spalled. The top layer could have been molten during
the test.
Co
de
Deep glossy circumferential grooves free of surface
cracks. This region could also be a glaze.
Pitted zones of undefined nature.
These are illustrated in Figure 92 which provides a 400X magnification of ion
implanted sample PB #6 which was the rotating half of the set used in the 14.7
psia 02 functional heating Test No 91. The subsurface (.05 in.) temperature
measurement indicated that I033K (1400°F) was attained in the 140 to 180 sec
time frame when the contact pressure was 1.7 MPa (400 psi) at 17,000 rpm.
Visual evidence of local surface melting suggests that temperatures as high as
1589K (2400°F) were experienced.
Analyses of the elemental composition in Zones A through D
indicated that the pretest lead content of 15% by weight had been reduced to
less than 0.5% in all areas indicating the original surface was worn away.
181

VII, I, Photographic and Metallurgical Analyses (cont.)
EDS analyses were conducted to establish the influence of 02
pressure on wear. These investigations revealed the following compositional
changes in the various zones.
Zone
Specimen/Maximum Temperature °F
A Smooth Mirror Like
with Radial Cracks
B Sub Surface Spall
C Deep Glossy Groove
Low 02 Pressure
IPb-6/1400 IPb-5
High 02 Pressure
Ipb-2/1000
Ni 73 73
Cu 23 24
Other Bal Bal
Ni 58 54
Cu 39 41Other Bal
Ni 53 73Cu 43 21
D Spherical Deposits Ni 62 73on Surface Cu 33 21
91/R 91/S 82/RTest No./Position
The nominal composition for Monel K-500 is 66.5 Ni and 29.5 Cu. The pretest
surface analysis indicated 61Ni, 22 Cu and 15 ion implanted lead. Monel also
contains 2.7% Al, 0.06%/TI and 0.75% Mn. The latter concentration are too low
to detect changes by the test method employed.
It is obvious from the composition analysis that the concen-
tration of Ni has increased from nominal by about 10% in Zone A and decreased
by about the same amount in Zone B. Zones C and D do not suggest any specific
trends. One would assume from first principles that if melting took place, a
zone refining could cause copper, (the lower melting element) to move to the
surface. Without melting, nickel would provide a more stable oxide than
copper and thus would move to the surface at a rate that has some direct
relation to the oxygen pressure.
182
VII, I, Photographic and Metallurgical Analyses (cont.)
As evidenced by examining the great variety of the surfaces
produced following a rubbing test in oxygen it is likely that melting zonerefining, diffusion, oxidation, etc. are occurring simultaneously, thus making
an indepth analysis of events impractical.
183

VIII. CONCLUSIONS AND RECOMMENDATIONS
I) The burn factor or material heat of combustion can be employed as
a guideline for screening metals for oxygen service.
2) Materials having a low heat of combustion and burn factor should
be selected For oxygen applications when surface rubbing and/or
high flow velocities can exist. Alloys of copper, nickel, silver
are the most resistant to metal Ignition. In fraction rubbing
applications the addition of small amounts of chromium to nickel
may be beneficial. Monel 400 and K-500 are reasonable selections
for the OTV oxygen turbopump; however better materials may exist
and further investigations of mechanically alloyed copper and
nickel are recommended.
3) Aluminum and titanium alloy should be avoided except where these
are well isolated from energy sources such as high flow velocity,
rubbing, sparks, high strain energy, etc. Stainless steel and
related alloys having high iron and chrome contents should also be
avoided.
4) When dissimilar metals are subject to friction heating in oxygen
the ignition threshold is controlled by the material having the
highest burn Factor. The fact that the mating material is dif-
ficult to ignite by itself does little to enhance the system
ignition threshold.
5) Some materials were found to benefit much more than others from
increased oxygen pressure in the friction heating tests. The
impFovement could not be solely attributed to improved cooling
thus suggesting additional benefits due to surface oxidation.
Tests where nitrogen at the same pressure replaced the oxygen
confirmed the chemical dependency. Additional investigations are
recommended to develop an understanding of the mechanisms that
suppress ignition at high oxygen pressure.
184

VIII, Conclusions and Recommendations (cont.)
6) Some materials experienced thermal instabilities (cyclic heating
and cooling) under a linearly increasing rubbing load. A mech-
anism involving the formation and spalling of an oxide surface
layer has been offered to explain these events.
7) The test method employed to evaluate the effect of surface modifi-
cation on friction coefficient and wear of Monel K-500 did not
provide sufficient sensitivity to detect modest improvements.
None of the surface treatments yielded a quantum jump in wear
resistance. The process of ion implantation appeared to be mildly
beneficial at low contact loads and nearly independent of the
implanted material.
8) Electroplated chrome was found to be undesirable as surface treat-
ment for Monel K-500.
Based on the data obtained and the discussion it can be concluded that:
I) The peak temperatures for tests conducted in hlgh oxygen
environment pressure were lower than peak temperatures observed
with ambient oxygen environment pressure. Monel K-500 with
surface modifications has lower peak temperatures than untreated
Monel K-500. Overall Ion implanted lead is best whlle the worst
is electrodeposited chromium.
2) In high pressure oxygen environment, surface modifications do help
in reducing wear. For the step load tests, the worst case was
untreated Monel K-500 while the surface modification which
performed best were those implemented not with lead and oxygen.
For the constant load tests the worst case was electrodeposited
chromium and the coatings that performed well were ion implanted
lead and ion implanted silver.
185
VIII, Conclusions and Recommendations (cont.)
3) The starting values for the coefficient of friction was between
0.15 to 0.22 for both Monel K-500 with and without surface
modifications. During the tests the coefficients of friction
changed considerably and the end values for Monel K-500 with
surface modification were lower than those for untreated Monel
K-500. The data indicate that ion implanted lead had the lowest
coefficient of friction in both high and ambient oxygen pressure
environment.
4) The repeatability of the friction and wear tester was poor and for
more detailed analysis it is recommended that another friction and
wear tester be designed which would give repeatable data in good
precision.
186

REFERENCES
Io
.
.
e
o
o
o
o
Q
10.
11.
14.
Schoenman, L., "Selection of Burn-Resistant Materials for Oxygen-Driven
Turbopumps," AIAA/ASME/SAE 20th Joint Propulsion Conference Paper No.AIAA-84-1287.
Schoenman, L., "Advanced Cryogenic OTV Engine Technology," AIAA/ASME/ASEE21st Joint Propulsion Conference Paper No. AIAA-85-1341, 8-10 July 1985.
Schoenman, L., J.M. Stoltzfus, "An Experimental Data Base for Material
Selection and Design of High-Speed, High Pressure Oxygen Turbomachinery",CPIA-JANNAF Propulsion Conference, San Diego, 1985.
Schoenman, L., "Friction Rubbing Test Results of Dissimilar Materials inHigh-Pressure Oxygen," Aerojet TechSystems Company Report 23772-M-32,Appendix A, January 1986.
Schoenman, L., "Oxygen TPA Material Ignition Study," Aerojet TechSystems
Company Report 23772-M-42, pp 23-33, November 986.
Schoenman, L., Stoltzfus, J. and Kazaroff, V., "Friction Induced Ignitionof Metals in High Pressure Oxygen," Appendix B, Orbit Transfer RocketEngine Technology Program, Monthly Report 23772-M-48, May 1987. Also,STM-STP 986, 1988.
Copper, L.P., "Advanced Propulsion Concepts for Orbital TransferVehicle," NASA TM-83-419, June 1983.
Dean, L.E. and W.R. Thompson, "Ignition Characteristics of Metals andAlloys," ARS Journal, July 1961.
Monroe, R.W. and C.E. Bates, "Metal Combustion in High Pressure FlowingOxygen," ASTM STP 812.
Bates, C.E., et al, "Ignition and Combustion of Ferrous Metals in High-
Pressure, High-Velocity Gaseous Oxygen," J. Material for Energy Systems,American Society for Metals, June 1979.
Bransford, J.W., "Ignition and Combustion Temperature Determined by LaserHeating," ASTM STP 910.
ASTM Std G94 Standard Guide for Evaluating Metals for Oxygen Service.
G1uzek, F., et a1., "Liquid Oxygen/Liquld Hydrogen Boost Vane Pump forAdvanced Orbit Vehicle Auxiliary Propulsion System," NASA CR-158648,September 1979.
Standard Guide for Evaluating Nonmetallic Materials for Oxygen Service,ASTM G 63-83a.
187

REFERENCES (cont.)
15.
16.
17.
20.
21.
22.
23.
Porter, W.S., "Test Report, Metals Ignition Study in Gaseous Oxygen,"NASA/White Sands Test Facility TR 277-001, October 1981.
Stoltzfus, J.M. and F.J. Benz, "Test Plan Ignition of Metals in Oxygen byFriction Heating," NASA JSC, TP WSTF 412, 27 March 1985.
Stoltzfus, J.M. and F.J. Benz, "Determination of the Relative Resistance
to Ignition of Selected Turbopump Materials in High Pressure Oxygen,"NASA JSC WSTF TR324001.
Sarkar, A.D. Friction and Wear. Academic Press, Inc. New York 1980.
Lin, D.S., F.H. Stott, Wood, G.C., Wright, K.W. and Allen, J.H. "Thefriction and wear behavior of Nickel-Base Alloys in air at room tempera-tures" Wear Volume 27 pp 261-278. Elsevier Sequoia S.A., Netherlands,1973.
Stott, F.H., D.S. Lin, G.C. Wood and C.W. Stevenson "The TribiologicalBehavior of Nickel and Nickel Chromium Alloys at Temperatures from 20°C
to 800°C - Wear Volume 36 pp 147-174 (1976) Elsevier Sequoia,S.A. Netherlands.
Bisson, E.E. in Handbook of Mechanical Wear, edited by Lipson, C., andL.V. Colwell University of Michigan Press, 1961.
Bisson, E.E. "Friction, Wear and Surface Damage of Metals as affected by
solid surface films" in Handbook of Mechanical Wear edited by Lipson, C.
and Colwell, L.V., Ann Arbor. The University of Michigan Press, 1961.
Stott, F.H., Lin, D.S. and Wood, G.C. "Glazes" produces on nickel-base
alloys during high temperatures Vol. 242, Noll 8 pp. 75-77. NaturePhysical Sciences Great Britain (1973).
188
PARTICLE
APPENDIX A
IMPACT DATA SUMMARY
A-1


Particle Impact Tests
The results are summarized as follows:
Burn Number Number ofMaterial Factor Tests Burns
Zr Cu 35 I0 0
Nickel 200 550 15 0
Silicon Carbide 1145 7 0
Monel 400 1390 I0 0
K Monel 500 2090 I0 0
316 Stainless Steel 4515 31 II
Invar 36 5444 II 5
Hastel loy X 7160 20 6
Max Test TempNumber with or Min Temp
Sparks at Ignition °F* TI T2
3 790 850
I 825 880
4 - 880
4 800 850
2 750 880
I <450 <450**
0 675 780
5 725 800
*Sparks are Aluminum burning
**Testing at lower GH2 temperature is required to obtain the minimumignition point.
T I = Stream Temp Upstream of Orifice
T2 = Sample Temperature
A-2

c/')
F-_J
LJ
O_
W
LD
_Cr_
H
W
C.)H
F-QC
(3-
t/)
r_
LAJ
Z
(_J
E
_ _ _ O
|. f_ L. L- _--
_3 ::3 O
•,- -,- -_- E _- E _ _ E E E u _ >
coc*'3
r.-
(o
o o o o o o o o o o o o o r- o ,-" _ r- o _ o
C_C O O O O
Z Z Z Z
G; 0 0 0 QJ G._ O,.l, _ 0 _ 0 Q; 0 0
>"- Z Z Z _ )'- )'-- :,-- Z )- Z >-" Z Z
u_ u_ _ u_ ur_ O O O O O O O O
o G ooo_ oo oooo oo
o o oooo_G o_o_ oooooooo o
ur_ ur) uo r_- _ _ r-- _ _ _ _ _ O ,-- _ _ _ _ _
'o
A-3

_O
o_
o4-)c-
O-- L>
I
-- ILl_3
t'--
Z _ w_ _ t,m _ _ w_ (/iO_ QJ I_> Q._ 0 0 0 0 0 0 Q.; 0 0 _ 0 0 0 0 0 0 G_ Q._ 0 CI_ 0 0 0--) >- :>- >- Z Z Z Z Z Z >- Z Z >- Z Z Z Z Z Z >- >- Z >'- Z Z ZO0
_ _ F_ _ o o o o F_ F_ o o o o o o o o F_ o o F_ o F_ o o
A-4

_J
_3
!
c_
!
..I
c_
c."
O0
_-- CO
Z r'-
c-
oy-
>. ,--
0
,., (D 0 0 0
C(D r- r-- r-- r-" _--
Z
CU CD (_P (D
Li_
C_-
WL_
H-b-,< ,-- CO 0 .--
__J_-
t._ V')
0 0 0 0 ,-'- 0 0 _ ,'-- 0 ,'--
0 0 0 0 0 0 0 0 0 0 0
C) 0 0 0 0 0 0 0 0 0 0
0 ur_ 0 0 0 0 0 0 0 _'0 u_
_0 ('3 0"_ (,3 _ (-3 C,3 ,_" ('_ _0
O Q.) _ O (:3 G,_ O O O G J, _.)
Z )" >'- Z Z >- Z Z Z )'- )'-
('%1 CO _-- ,--'. k_, _ _ _ _ r"_ _'--
L_
r-- r-- r-- _--" _---C'_ ('3 _'_ l'_ ("3
_) 0 0 0
p--
O0 CO CO
r-- r-- r- r-- r-
_ _O _ _ ,/3 _ _ _G' _
Z Z Z Z Z Z Z Z Z Z Z
0 0 0 0 0 0 0 0 0
A-5

I
!
E
0
(J
I
L±J
_J
_3
1-I"-
t_
r_
W
C_
7L_J
0
t.J
_ _r
O O Q O O O O C_ ,'--
O (_ O O O O O O O Ot"xJ fx3 CM O,_ _ _ _ _ C%; i_
O
_3 0 0 0 0 0 C_ C_ C3 0 C_r-" r--" f--" f-- *-'- _ r-- _ t-"
L_tlJ
.--JL_I q'_ _ CO ,--- _ 00 ,z:l" _ t'O r--
_--J _ 00 r'_ CO 00 t'_ CO O0 0O CO
(..jr,
.--_3E<[<[
C.) u'_
O_ tY
U _ U
r- c- e-- _--
. . . --O
0 0 0 0 0 0 0 0 C3 ,--
0 0 0 0 0 0 0 0 0 0
O O O O O O O O C_ O
u'_ C3 0 0 C3 un u_ 0 u_ u_
O O O O O O O O O O
Z Z Z Z Z Z Z Z Z Z
P- 0O r-_ 0O OO _ r-_ CO 0O CO
Zk_J u_) CO _:r ,_- q_ u_3 _ _ ,m_ ,m_
Ck
r_J P_J N _J N P_I N
oSooooSSoo
0 0 0 0 0 0 0 0 0 0
0 0 0 0 0 0 0 0 0 0
0 C) 0 0 0 0 0 0 0 o
A-6

!
I
4-Jc-Ou
I
I_U
F-
n_
u_
h-Z
0c_
r_
ka.
0 C) 0 0 0 C_ o 0 _ ,--0 0 C_ 0 0 0 0 0 0 C3
LLJ 0 0 0 0 C3 C_ 0 0 0 0
3 L_I 0 0 0 0 0 0 0 0 0 U_
,-- r-- r--L_-
0 0 0 0 0 0 0 0 0 0Z Z Z Z _" Z Z Z _" Z
._.;L,.; or) '_" _ ¢'0 (DO OD _ ,_3 oO__J _0 (]D OD OD OD OD O0 CO O0 OD
__j_-
U_
0 o o o 0 o o o o o
o o o 0 o 0 o o 0 0
o _ o F_ F_ o o _ o o
o o o 0 0 o 0 _ _
0 r-" "0
u .4_ _ _s_ 0
0 _ 0 0 ,'0 0 0 0 0 0 0 t-O _ 0 0 _ 0 0 0 0 0 0 0 0
0 0 C3 0 0 0 0 0 0 0 0
U_ C3 0 0 0 Ur_ 0 0 U_ Ur_
¢I_ 0 0 0 0 _ 0 _._ 0_- _ Z Z Z Z )'- Z >- Z
0 0 _ cO 0"_ ,--
c() _ _ _ _ _ 0
I
¢/) _/_
I .l_
r--"
0 0 0
0 r-
0 0 0 0 0 0
A-7

C
0
U
!
I--
I
J
QW
v_
w
0
v _ v v
v _ _ v
0 0 0 0 0 0 0 0 0
¢Y
r-- r m e '=- _ ¢-=- ,-'-- _ e-"
,--N
0
c-
z _0 0 0 0 0 _ 0 0 G,P 0
C_ Z Z Z Z Z >- Z Z >- Z
C_3E
t_Jw
,,_ r-..- r-*- ,.0 ,,D _n, _ O0 ('_ 0
....j _'-*,aC ,_
£..) V')
O0 _ C_ O_ _ 0 O_ _ C',,J 0
k-- Z3, _ _ r-..- c_ c'_ 0,.I 0"_ c'o O0 _ _r_
L.,.J _,rl, _ r"..- _ u'_ _ ,_- _ _ _
r-_
t_ t.. ,.I 4-_
4-) -_ _
0 0 _
r--" ,'-'- _ ,_
0 0
_, _, _ z
OD
C_ C) 0 0 r--
0 0
0 0 O 0 0 0 0 0 0
_ _ _ _ _ r-m _
0 0 0 0 0 0 0 _ 0
0 0 0 0 0 0 0
Z Z Z Z Z Z Z
OD OD aO _0 O0 CO CO CO OD
v v v
o o '-" o
A-8

c-
O
U
I
LLJ
._A
rf_
k--
I
I
Z 0 0 0 O O 0 0 0 0 0 0 0 0 0 0
O_ Z Z Z Z Z Z Z Z Z Z Z Z Z Z Z
O 0 0 O 0 O 0 0 O 0 0 (:3 0 0 0 0 0
I-- 0 0 0 0 O O 0 0 0 0 0 0 (:3 0 0 0 O
CM _ C_a ('M _ C_I ('M (%a ('M (M (_ ('M ('M _ (M ('_ (M
Z Z Z Z Z Z Z Z Z Z Z Z Z Z Z Z Z
0 0 0 0 0 0 0 0 0 e-- 0 0 0 0 0 0 0
_-- . o °
_t_ _ _ _ _ _ _ _ _ _r_ 0 _ _ _ _" _ O
A-9

_ Lockheed
T I TLE: -rt_- Prr
DP,AW I NG
PREPARATION SHEET
I OOO
90o
gx)o
uJV
qoo
4f__
_o0
0
Q
00
O
I
G
..00.
#
_oo
l NLCT
ii i
Con,trector Authorized Sic_notures
I ,'
,45OO 47D0
PR_5 UK_
Figure I-Ai
Page 1
TPS No.
MOO No.
of 8
I
OR_GINj._,! P," ,"_."
OF PO0;_ QUALITY
O NO FI_F-
N O FtlZ._, 5PA_K.
• FIIz_
DilkI_F=-T_,,..E_. bOlT -T4 ALUM _NU_
P'A._'3"IC,;:%.
Z) r,.D1"IPo"_Tl_l_ 01;'3 i¢,, $_ "
F_ N; c, vI,,C S, I"I,, V4 E, P 5
/,,I._ to t_ z .c_ t Z -- _ .0"_14 I_ ..5
I
NASA Authorized Signotures
A-IO

,I uI
"=-_ Lockheed± • ii
TITLE: -rt.'_...-P r'r
DRAWING
PRE-PARAT I ON SHEETii I •
#NV_.. _ "T_T DATA
|0o£>
900
700<C
t_
II _OO
400
3o0
O
O
T ' b , . '' ',l',,
4_o _ 47Do
(_I) Figure 2 Ai
Controctor Authorized Sicjnatures J ,,
tA-11
I r'oge
TPS No.MOO I_:_.
0 NO FII_I::
O NO FIIZE, _>PAR:i_.
• FIRF..
,I
PAt'<.T_...tL_5,
F,: _ C.,-_ C _ _,_
(._._ _ - - .07.3. ,'_._
ORIGE_iAL PAGE IS
OF POOR QUALITY
i
NAS A Authorized Signotures
u_

I -_ LockheedTITLE: T_E>prr
DRAWING
PREPARAT ION SHEETi
page 3
I'PSNo.MODNo.
of 8
i
EIrz.CoNIL3v_ CoPP_CL T'E-_'TD_,TI_
t.--
L_
t- t-<_
_d_1
Iooo
c_OO
_C)o
700
500
400
o #0
o
(3 E)
0
"_t_O0 ...... ! i ' . i .
4_0o 4'300 47Oo
i
Contractor Authorized Signatures
IN LE'T "P_--GSU
( P.._)Figure 3-A
I A-12
m|
ORIGINAL PA_E 1"3OF POOR QUALITY
c) ND FlEE
Q NO FI_.E- - :bPAR.K.
• FIKF-.
NOTE: i) IVlP_C.TED w/|o_=_ IS_'/.,=
DIAt,'IF.Tr=_. ,ZO1"/-'1"4 ALUHIMUP't
{),AX_.'TICLIE_.
L) _.DMPGSt'I"iDN _>F :_; _ ;
99.e,5 ,I_
NASA Authorized Signatures
i i
I i L_ 4 _'_
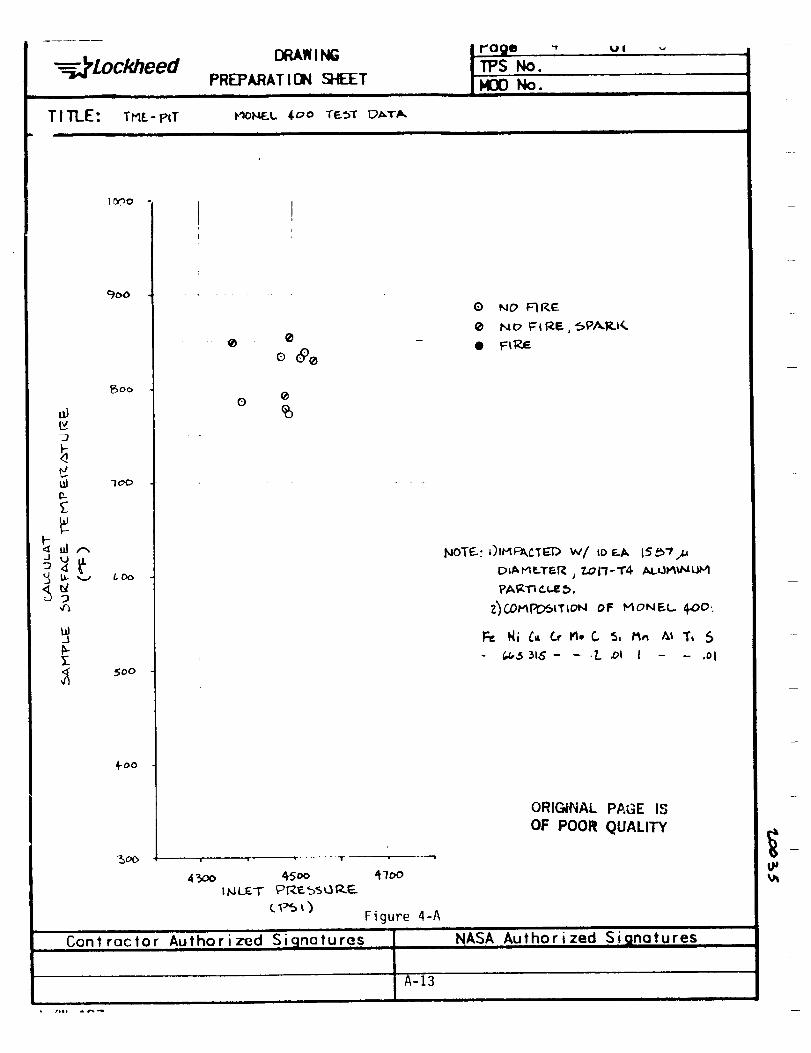
_ Lockheed
T I TLE: Tin+.- F'IT
DRAWl NO
PREPARAT I ON SHEETi
I,'_OtaE.L 4oo TF_.ST 1_T/k
I
uJP-
S 3
p-
tr'_o
900
7o0
(,Do
500
4-oo
500
. ®
Q
!
4:>oo
O
e _e
@
%
1
4-500 _7oo
Figure 4-A11
Contractor Authorized Signatures I
i
A-13
I r'ago "_ u i _,
TPS No.NO0 NO.
® NO F1R.t_
0 NC_ FIRE, _PA.I_.I_,
• FII_E
ORIGINAL PAGE IS
OF POOR QUALITY
NASA Authorized Signatures
IP

DRAWING
PR_ARAT I ON SLEETi i
Mc:_q_l,.. g(_ _'1" "z::=_,,-t_
10oo
190o
tip
E.\
F--
,.,_
3"
0
0
@
0
- '1 '1 w !
4._o 4._o 41oo
Figure 5-A
i
Contractor Authorized Signatures,, JA-14,
I Page
ITF'S No.
IH0O No
5 of 8
• _ "', ...-_.=.IS
OF pOOR Q_JALITY
Q NO _tl_..F-- -
• F'I_.E-
NOTE: I) fIvIPAC--TED V4/ tO F_.A.. _581.,_
I]>_AVlETE1-C. gl:) 17 -T4- ALtJMJNI UH
PA_.I-I CLF_._.
7._) Co_PogTIOIq OF" HOMEL K-3oo
_,, Nt _.u Cr Ho C 5; t'tr, &= Ti
- /,_,.5 Z9.5 - - .I .Z ,& Z.'/ ._ .oo5
NASA Authorized Signatures

-=' - Lockheed
TITLE: TmL- pn"
DRAWING
PREPARAT I ON SHEETIII
H_T_ _, _ DATA,
I
tC_o
_J
_JJ
v_
oe
o
O
0 0 0
| NUE,1
!
CPs,)Figure 6-A
Contractor Authorized Signatures
A-15
! _.J_1__m U ,,am u
II=S No.
MOt) No.
O NO FII__
@ ND FII?.__. 5PA_..F.
• FI R.E-
NDc_ 0 irn1_Ac't_D W/io_.=. 1587M,,
DIAMF...'TEI_. , Z..DI7-I-4 t__ilMtNQl_
PA£'no..r=_.
ORIGINAL PAGE IS
OF POOR QUALITY
NASA Authorized Signatures
p_
I /w ln7 --

_-_L Dp,AWi ,,=-,. I Page 7 ot 8 Iockheed oo=,o.T,_ '7=_-_ ITPSNo. !• , """ "''" '"" "'-_" i _eo N°. I
TITLE: TMc-PiT blLI(.O_P. LI, R.1BII)e. T'{._ l:)A._r_
I J__ i i I
eZ
_d
_3
I000
90O
"/OO
600
V_
_-OO
3o0
lt
$
t .........
e
......................... 09 .... !e
@O
O
i
4500
i i i
Controctor Authorizod Sic_natures
i ! I I !
450O $700
(Psi JFigure 7-A
ii
/'k_J 4 rt-?
A-16
ORIGINAL P{:GE IS
OF POOR QUALITY
0 NO _IC_-
@ NO FIRE:, _PAR.IL
NOTE.: ()IHPACTF=.D W/ IO,,_ 1567,_
I)I/.%F'IETF..I_..,ZOI-/-T4 ALL}N_INUH
PART Ir..t_$.
I
NASA Authorized Signotures
pi
8

i i i
_ Lockheed
i
TITLE: Tr_- r_T
i ii
DRAWING
PREPARAT I ON _-EETin i
N IC._,F..L. _ TE._T DATA
'i'Pago
11:'5 No.__.
8 ofii
I DOo
9_
_O
3 7o0I--
F _ID
oiv'
4
4o0
_O
_O0 .... , ' • •4_o0 45DO
o °eo
0
0
Q
IIJL_'I" PEE_LJ _r..
_l)
0
@
i i iii
Contractor Authorized Signatures
ORIC_lf_L PAq_ _"
g N_ Ft_.E
• Fflz,._
0
NoTrr.. • _) II'lP_TrcJ) VV/ lDta 15E,"/p
PART _CLF_.
?')CC)I"IPCblTIONO1_ N_CK.EL t_OC)=
F¢ H; C, C_ C _, P_. A I T, S
,Z _-_ - .I .ob .Z .'L - -._
t •
470O
Figure 8-A
t NASA Authorized Signatures
ii
A 17
N
8

APPENDIX B
WHITE SANDS REPORT ON COMPOSITIONOF SURFACE MODIFICATIONS
B-1


LOG 657732
BACKGROUND
Six pretest and six posttest friction heating samples that had
been either implanted or eiectroplated with one foreign material
were received for analysis. The requestor wanted to know if any
of the foreign material was present in the posttest sample. The
samples received were all Monel K 500, the ion implantedmaterials were silver, chromium, lead, oxygen, and the
electroplated materials were chromium, and silicon carbide. The
sample ID contains the letter I for implanted or E for
electroplated respectively. Samples identification numbers
containing the number ten were the pretest and those with the
number two were the posttest. Three areas of the posttest
samples were analyzed; a flat surface, a gouged area and an area
containing both.
DISCUSSION
Implanted materials are present on the surface of a substance to
a depth of approximately 0.01 microns. Electroplated materials
are usually much thicker, I0 to 50 microns or greater. The
composition of all samples was determined using an energy
dispersive X-ray analyzer. This technique analyzes the sample to
a depth of several to tens or hundreds of microns depending on
the sample. Considering the lack of relative surface sensitivity
the analytical technique has, it is not surprising that
concentrations of only two percent of implanted material were
detected in the pretest samples. At these levels the possible
error in the analysis could be as high as + or - 100%. At lower
levels (tenths of a percent) 300% to DO0% errors can be expected.
What one should look at when reviewing the results is simply the
fact that the implanted or electroplated material was detected
and the concentration used to judge relative not absolute
abundance.

RESULTS
PRETEST SAMPLES
Silver, chromium, and lead were detected in both the
implanted and electroplated pretest samples. Silicon
carbide was also present in the pretest electroplated
sample, and to a much greater degree than any of the
other materials, possibly with the exception of the
electroplated chromium. The presence of oxygen in the
pretest samples could not be ascertained with any
certainty. If it was present, it was there in an
exceedingly small concentration.
POSTTEST SAMPLES
The posttest samples showed that the foreign materials
were present in some areas and not in others. In some
cases more was present on the flat surface and in
others, more was present in the gouged area.
Sample .ID - [Ag 2
Silver was detected at very low concentrations (0.1%)
on a portion of the sample containing both flat
surfaces and gouged areas. It was present on the flat
surface, at about the same concentration, but was
absent in a gouged area of another portion of the same
sample.
Sample ID - I Cr 2
A small amount of chromium (0.1%) was detected on the
flat surface of this sample. A larger amount (0.3%) was
found in the gouged area. The portion containing both
types of surfaces contained 0.5%.
Sample ID - E Cr 2
Chromium (0.2%) was detected on the flat surface, 0.1%
was detected in the gouged area. The location
containing both flat and gouged areas had 1.5%
chromium.
Sample ID - I Pb 2
Lead was absent in the area that contained both flat
surfaces and gouged areas. It was present (0.7%) in a
secor_d flat surface and 1.2% in another gouged area.
Sample [D - EC 2
Silicon was more abundant in the gouged area examined
than on the flat surface, 1.5% as opposed to 0.3%. Thearea containing both flat surfaces and gouged areas had
0.6%.
B-3

Sample ID - IO+ 2 (*)
Oxygen was detected on all posttest sample surfaces
examined. It was present to a much larger degree on the
posttest sample than on the pretest sample, and it was
more abundant on the flat surface than on the gouged
area.
(*) The software available on the X-ray analyzer is not
capable of providing semi-quantitative results when
oxygen is to be included. It is for this reason that
the raw data (cps) was used to indicate the presence of
this element in the pre and posttest samples. No
concentrations can be provided for oxygen.
8-4


![Rocket! :]](https://img.pdfslide.net/doc/110x75/558c01cdd8b42abd5b8b4570/rocket-.jpg)
