Embed Size (px)
Citation preview
274
[ Journal of Political Economy, 2010, vol. 118, no. 2]� 2010 by The University of Chicago. All rights reserved. 0022-3808/2010/11802-0003$10.00
Order in Product Customization Decisions:
Evidence from Field Experiments
Jonathan LevavColumbia University
Mark HeitmannChristian-Albrechts-University at Kiel
Andreas HerrmannUniversity of St. Gallen
Sheena S. IyengarColumbia University
Differentiated product models are predicated on the belief that aproduct’s utility can be derived from the summation of utilities forits individual attributes. In one framed field experiment and two nat-ural field experiments, we test this assumption by experimentally ma-nipulating the order of attribute presentation in the product custom-ization process of custom-made suits and automobiles. We find thatorder affects the design of a suit that people configure and the designand price of a car that people purchase by influencing the likelihoodthat they will accept the default option suggested by the firm.
We are grateful to James Bettman, Ray Fisman, Brett Gordon, Daniel Kahneman, EmirKamenica, Dean Karlan, Oded Netzer, John Lynch, John Payne, Dan Silverman, CatherineThomas, and Olivier Toubia for their comments on previous drafts and to Dan Ariely,Colin Camerer, Uri Gneezy, Michael Riordan, and Richard Thaler for helpful discussions.We are particularly grateful to Eric Johnson for facilitating our collaboration and for hishelpful comments. We would also like to acknowledge the Center for Excellence in E-Business at Columbia Business School for its financial support.

product customization decisions 275
Differentiated product models are a popular econometric tool to esti-mate demand for a wide variety of goods, including housing, wines,automobiles, and computers (McFadden 1974; Rosen 1974; Epple 1987;Berry, Levinsohn, and Pakes 1995; Bajari and Benkard 2005; Berry andPakes 2007). These models are predicated on the belief that a product’sutility can be derived from the summation of utilities for its individualattributes or characteristics (Lancaster 1966; Rosen 1974). If consumersare utility-maximizing agents, their preferences for any finished productshould be independent of the order in which they considered its at-tributes: any order should yield an equivalent “final” bundle. Whereattribute decisions are reversible, a difference due to order might castdoubt about the robustness of the assumption that utility from productsis derived from the summed utilities of the products’ attributes.
Product customization is a particularly appropriate context to test thispossibility both because of its ubiquity in the modern marketplace and,more important, because it requires consumers to directly constructtheir preferred product via a sequence of attribute decisions. Each at-tribute might have different numbers of options from which to choose,with greater variety within each attribute increasing the likelihood of aconsumer maximizing her welfare by selecting the option that bestmatches her preferences. For instance, a homeowner who renovates herapartment engages in a complicated sequence of decision steps, witheach step including dozens of options that she can select from (e.g., atypical U.S. paint manufacturer offers 2,000 different colors).
We argue and demonstrate empirically in framed and natural fieldexperiments (Harrison and List 2004) involving financially consequen-tial decisions that, in some circumstances, order of attribute presenta-tion can influence the bundle of attributes a consumer purchases. Inaddition, we attempt to characterize the pattern of this influence andshow that it can create an opportunity for firms to exploit. The exper-iments we discuss below involve major durable products possessing mul-tiple attributes that are configured by a consumer. Each attribute in-cludes multiple options from which the consumer can choose; differentattributes have different numbers of options. The configuration processis ordered either such that the attributes with a greater number ofoptions come first in the sequence and are followed by the attributeswith a successively smaller number of options or vice versa. This is ouronly experimental treatment.
Our argument relies on three basic premises. The first is that, whereconsumers lack expertise in a product class, they assess the prospectiveutility from an option at the time that they make their decision (Payne,Bettman, and Johnson 1993; Slovic 1995); options that elicit utility be-yond some minimum threshold level are more likely to be chosen. Forinstance, when a shopper decides which ceiling fan to purchase for her

276 journal of political economy
new home, she makes an on-the-spot assessment of the utility she willderive from each of the fan’s aesthetic and technical features (Kahne-man 1994). Following this assessment, she selects the fan that elicitssufficient utility (i.e., the option that “satisfices” [Simon 1955]).
The second premise is that assessing utility requires effort that de-pletes a limited mental resource. This idea is derived from the conceptsof bounded rationality and cost of thinking, the twin notions that eco-nomic agents have limited computational abilities and that computa-tions incur a mental cost (Simon 1955; Rubinstein 1998; Ortoleva 2008).In other words, assessing the utility from the fan in the example aboveis mentally costly. Furthermore, we conjecture that the cost of evaluatingoptions is convex, so that assessing the utility from the next fan in thesequence is relatively more costly. The latter is inspired by research inpsychology and economics that models self-control as a muscle that“contracts” in the face of temptation (Muraven and Baumeister 2000);each subsequent encounter with a tempting stimulus requires greaterwillpower resources than an identical earlier encounter (Ozdenoren,Salant, and Silverman 2008). Likewise, recent research shows that asimilar decline in self-control can be caused by having made repeatedchoices in a previous task (Vohs et al. 2008).
The third premise is that consumers are partially “myopic” in theirallocation of mental resources. Instead of distributing their mental effortefficiently across the configuration process, we invoke the Gabaix et al.(2006) directed cognition model to predict that consumers will behaveas if the current decision in a sequence is practically their last (despitethe fact that in our experiments it is obvious that subsequent decisionswill follow). Consequently, in our setting, consumers “overspend” theirmental capacity early in the configuration sequence, leaving them withfewer resources to assess their utility from subsequent attributes in thesequence.
In product customization decisions these three premises can conspireto undermine the principle that the utility from a product is the sumof the utilities of its attributes. More specifically, we suggest that theeffort invested in previous attribute decisions affects subsequent attri-bute decisions because the previous decisions deplete people’s capacityto evaluate options. Here, however, depletion is a function not only ofthe number of decisions that the consumer has made, but also of thenumber of options that she had to evaluate at each stage. Our inves-tigation focuses on the combined effect of these two factors and howthey influence revealed preferences. Our thesis is that early decisionsin a customization sequence affect subsequent decisions in the sequencebecause the early decisions deplete people’s mental capacity but thatthis depletion effect depends on whether the early decisions involve

product customization decisions 277
attributes that are high in number of options (high variety) or low innumber of options (low variety).
People’s depleted capacity may heighten the difficulty of finding anyoption to be above their minimum utility threshold and, hence, to bechosen. Such an experience of “choice overload” can prompt peopleto forgo making a choice altogether, or when avoidance is not a practicalor possible alternative to making a choice, it can prompt them to em-brace options that are relatively simple and easier to understand. Anotable study of decision avoidance conducted by Iyengar and Lepper(2000) at an upscale grocery store in Menlo Park, California, presentedshoppers with one of two displays of gourmet jams. Every hour thedisplay alternated between 24 different jams and six different jams (rep-resenting a subset of the 24). Each shopper who approached the displaywas given a discount coupon. Coupon redemption (and purchase) rateswere 10 times greater for shoppers who had encountered the smallersubset of jams rather than the complete display. Similarly, a field studyby Bertrand et al. (2006) offers evidence that loan take-up is significantlygreater when a single loan is offered than when multiple loans areoffered. Iyengar and Kamenica (2007) investigate a context in whichpeople feel compelled to make a choice: retirement decisions. Theyfind that the presence of a large variety of funds in employees’ 401(k)plans leads them to simplify their retirement allocations by increasingtheir contribution to bond and money market funds.
The simplifying strategy that we focus on in our experiments ispeople’s likelihood of accepting the default alternative for a given de-cision in the sequence. Defaults simplify choice because they reducedecision effort and can sometimes be interpreted as options that areendorsed by the firm or policy maker ( Johnson and Goldstein 2003;McKenzie, Liersch, and Finkelstein 2006). Their influence on people’srevealed preferences is pervasive. For instance, Madrian and Shea(2001) report that employees are much more likely to contribute totheir retirement savings plan (401[k]) if enrollment in the plan is au-tomatic (see also Choi et al. 2004). Similar effects have been observedin the domains of preferences for privacy and participation in e-maillists online (Bellman, Johnson, and Lohse 2001) and, more dramatically,for participation in national organ donation programs (Johnson andGoldstein 2003; Abadie and Gay 2006).
As we explain above, our experimental treatment manipulates theconfiguration process such that the attributes with a greater number ofoptions come first in the sequence and are followed by the attributeswith a smaller number of options, or vice versa. Normatively, the se-quence should not affect choices or willingness to pay; the same pref-erence should be revealed irrespective of the sequence. If, however,choices are sensitive to the individual’s capacity to evaluate options,

278 journal of political economy
then each sequence should yield different revealed preferences becausedecision makers will be depleted at different parts of the sequencedepending on the experimental condition. In particular, we predict thatpeople who encounter high-variety, depleting choices early in the se-quence will evince a tendency to accept the default alternative in sub-sequent decisions even if these decisions involve relatively few optionsthat would ordinarily require less capacity to evaluate. In contrast, thosewho begin the sequence with less complex decisions offering fewer op-tions from which to choose will evince little effect of depletion later ina sequence, even if these subsequent decisions are of the complex, high-variety sort. This differential choice pattern provides firms with an op-portunity to extract higher revenues from their customers by manipu-lating the order in which they present product attributes and the optionthat they select as the default alternative. We conduct our empiricaltests in one framed and two natural field experiments involving realchoices in financially consequential domains: custom-made men’s suitsand automobiles.
I. Suit Study
Design
We recruited 73 master of business administration (MBA) students atthe University of St. Gallen in Switzerland under the aegis of a studyabout clothing taste in Switzerland and the United States. Participantswere told that we would be raffling two business suits, custom madeaccording to their specifications and taste by a well-known local tailorshop with which the students were familiar. MBA students are an idealparticipant pool for a study involving suits because, at some point oranother, they all purchase at least one suit for job interviews and summerinternships. Participants were told that they would be asked to designa suit ensemble, including a shirt and tie, and that they would have tocontribute SF 75 (Swiss francs) toward its cost (which was approximatelySF 2,000) in the event that they won the raffle. The fee, a substantialcharge for the typical student participant, was included in order toensure that participants would understand that their selections had asignificant financial consequence.1
Under the tailor’s close guidance, we created a makeshift tailor shopin a laboratory space at the university. The tailor provided the shop’sseven booklets of swatches of suit fabric (100 options), suit lining fabric(5), shirt fabric (50), tie fabric (42), suit buttons (20), dress belts (8),
1 Participants were unaware of their odds of winning. Note that the expected value ofthe prize was approximately SF 53, derived by multiplying the odds of winning (2 in 73)by the value of the suit (SF 2,000 minus the SF 75 fee).

product customization decisions 279
and dress socks (20). Upon arrival in the lab, participants were askedto complete a short survey in order to be provided “a standard set ofrecommendations” by the tailor. The survey asked participants to in-dicate their prospective use for the suit (multipurpose, business, pri-vate), whether and how often they intended to travel in their suit, anda subjective rating of their preference for a classic versus a modern look(on a seven-point scale with “rather modern” and “rather classic” asanchors). The survey was handed to an assistant, who proceeded tocompile its results.
Next, participants were randomly assigned to one of two treatmentconditions, high (hi) to low (lo) ( ) or lo to hi ( ). In then p 34 n p 39hi-to-lo condition, participants were presented with the booklets begin-ning with the attribute that had the most options (suit fabric, 100 op-tions) and ending with the attribute that had the fewest options (suitlining, five options) in descending order; in the lo-to-hi condition, theorder was reversed, that is, options were ordered in ascending order.The final choice for all participants in both conditions was the sockcategory (20 options). We included this item in order to ascertain theeffect of our treatment for a category that was offered at the same pointin the decision sequence for both conditions.
Participants were presented with each booklet of options in succes-sion. For each booklet one of the options was randomly chosen to bethe tailor’s recommended option given the participant’s survey re-sponses.2 This option was indicated by a small piece of poster boardthat was labeled “standard recommendation” and was attached to theitem; the recommended option was considered the default option inour analysis. Participants’ choices were recorded by the experiment’sadministrator. The dependent variable was whether the participant ac-cepted the standard recommendation for each suit attribute. Thus, eachparticipant provided seven observations, of which six belonged to thetarget attribute sequence.
After participants completed the suit configuration process, they wereasked to complete a self-reported satisfaction survey that asked them torate (on a 1–7 scale) their satisfaction with the ensemble that they hadselected, how certain they were that their selections matched their pref-erences, their likelihood of making a similar selection in the future,and their satisfaction with the decision-making process.
2 In order to make the study’s administration more manageable, the recommendedoption was randomly chosen from a subset of three possible options that the tailor reportedwere mainstream.

280 journal of political economy
Analysis and Results
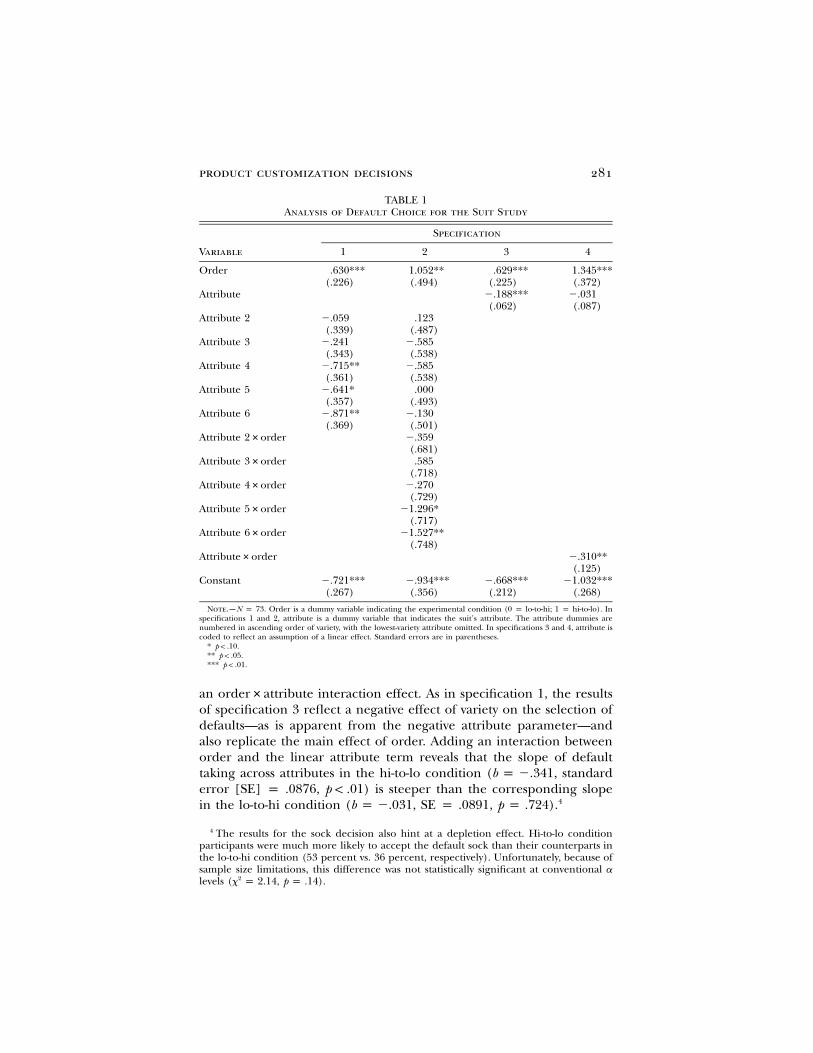
The first six choices were analyzed using a series of four population-averaged logistic regressions with default choice as the dependent var-iable (socks were excluded and analyzed separately).3 These analysestested the effect of order using different assumptions about its functionalform. More specifically, they allowed us to test for differences in theoverall propensity to accept the default between conditions as well asthe pattern of default taking in each experimental condition. The resultsare presented in table 1.
Our first specification included a dummy variable indicating the ex-perimental condition, order (1 p hi-to-lo, 0 p lo-to-hi), and dummyvariables indicating each of the suit’s attributes, thus allowing for anonlinear effect of the attributes on the probability of selecting a default.The reference category for the attribute dummy variables was the lowest-variety attribute, lining, with the remaining attributes coded in ascend-ing order from low variety (attribute 2) to high variety (attribute 6). Weobserve a significant and positive effect of order, indicating that partic-ipants’ revealed preference for their suit was influenced by the orderof attribute presentation. In particular, the overall tendency to acceptthe default was greater when the number of options available decreasedthrough the decision sequence (i.e., hi-to-lo). We also observe that theattribute coefficients progressively decreased, an intuitive result imply-ing that the likelihood of default selection increases as variety increases.
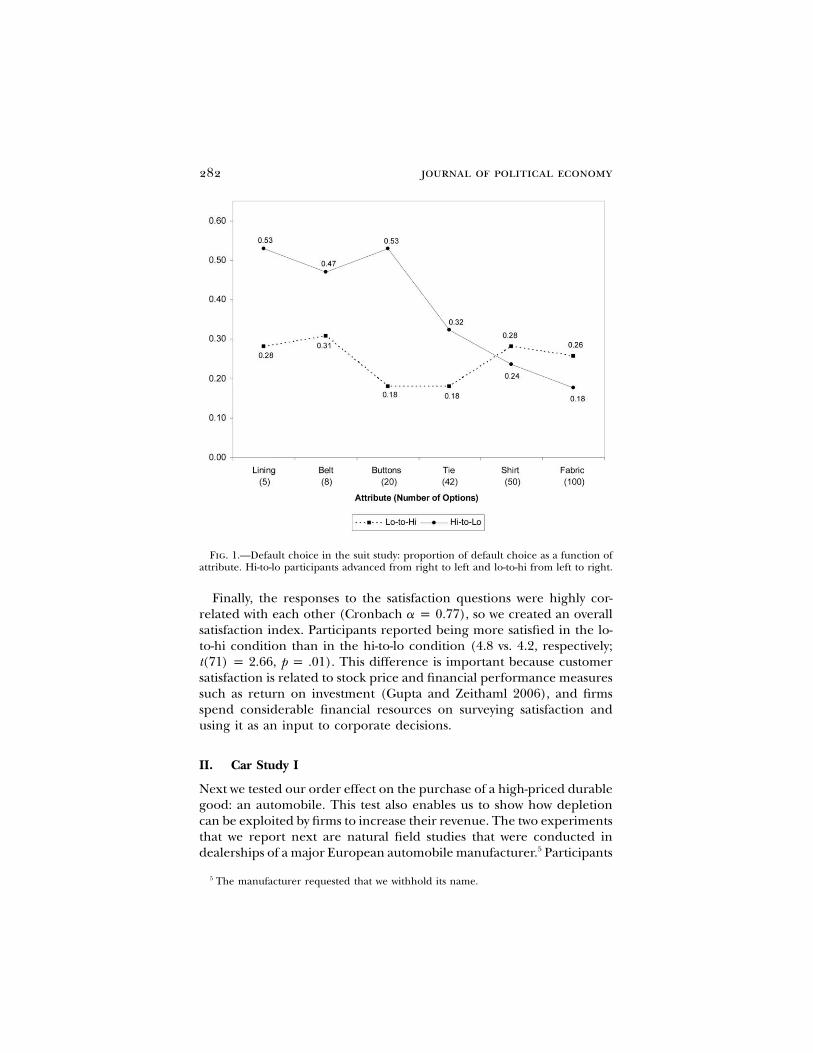
However, our predicted depletion effect entails that default accep-tance will be greater in the low-variety items when these are precededby high-variety items, but not in the reverse order. In the second spec-ification we test this hypothesis by adding an interaction term betweeneach attribute and the order dummy variables. We find that the inter-action parameters tend to decrease as attribute variety increases; thatis, the difference between default choice early in the sequence and latein the sequence is greater in the hi-to-lo condition than in the lo-to-hicondition. This pattern is reflected in figure 1: the slope of the pro-portion of customers accepting the default across the decision sequenceis negative in the hi-to-lo condition but appears to be approximatelyflat in the lo-to-hi condition.
We also tested versions of specifications 1 and 2 that assume a lineareffect of the attributes. In particular, the third specification includedan order dummy and an attribute variable, and the fourth added to this
3 We also ran the same analysis using a random effects logistic regression, with partic-ipants treated as a random factor in order to account for the individual-specific tendencyto accept a default (i.e., observations were “grouped” by individual). The results werevirtually identical to the population-averaged models, attesting to the robustness of ourfindings.
product customization decisions 281
TABLE 1Analysis of Default Choice for the Suit Study
Variable
Specification
1 2 3 4
Order .630***(.226)
1.052**(.494)
.629***(.225)
1.345***(.372)
Attribute �.188***(.062)
�.031(.087)
Attribute 2 �.059(.339)
.123(.487)
Attribute 3 �.241(.343)
�.585(.538)
Attribute 4 �.715**(.361)
�.585(.538)
Attribute 5 �.641*(.357)
.000(.493)
Attribute 6 �.871**(.369)
�.130(.501)
Attribute 2#order �.359(.681)
Attribute 3#order .585(.718)
Attribute 4#order �.270(.729)
Attribute 5#order �1.296*(.717)
Attribute 6#order �1.527**(.748)
Attribute#order �.310**(.125)
Constant �.721***(.267)
�.934***(.356)
�.668***(.212)
�1.032***(.268)
Note.—N p 73. Order is a dummy variable indicating the experimental condition (0 p lo-to-hi; 1 p hi-to-lo). Inspecifications 1 and 2, attribute is a dummy variable that indicates the suit’s attribute. The attribute dummies arenumbered in ascending order of variety, with the lowest-variety attribute omitted. In specifications 3 and 4, attribute iscoded to reflect an assumption of a linear effect. Standard errors are in parentheses.
* .p ! .10** .p ! .05*** .p ! .01
an order#attribute interaction effect. As in specification 1, the resultsof specification 3 reflect a negative effect of variety on the selection ofdefaults—as is apparent from the negative attribute parameter—andalso replicate the main effect of order. Adding an interaction betweenorder and the linear attribute term reveals that the slope of defaulttaking across attributes in the hi-to-lo condition ( , standardb p �.341error [SE] p .0876, ) is steeper than the corresponding slopep ! .01in the lo-to-hi condition ( , SE p .0891, ).4b p �.031 p p .724
4 The results for the sock decision also hint at a depletion effect. Hi-to-lo conditionparticipants were much more likely to accept the default sock than their counterparts inthe lo-to-hi condition (53 percent vs. 36 percent, respectively). Unfortunately, because ofsample size limitations, this difference was not statistically significant at conventional alevels ( , ).2x p 2.14 p p .14
282 journal of political economy
Fig. 1.—Default choice in the suit study: proportion of default choice as a function ofattribute. Hi-to-lo participants advanced from right to left and lo-to-hi from left to right.
Finally, the responses to the satisfaction questions were highly cor-related with each other (Cronbach ), so we created an overalla p 0.77satisfaction index. Participants reported being more satisfied in the lo-to-hi condition than in the hi-to-lo condition (4.8 vs. 4.2, respectively;
, ). This difference is important because customert(71) p 2.66 p p .01satisfaction is related to stock price and financial performance measuressuch as return on investment (Gupta and Zeithaml 2006), and firmsspend considerable financial resources on surveying satisfaction andusing it as an input to corporate decisions.
II. Car Study I
Next we tested our order effect on the purchase of a high-priced durablegood: an automobile. This test also enables us to show how depletioncan be exploited by firms to increase their revenue. The two experimentsthat we report next are natural field studies that were conducted indealerships of a major European automobile manufacturer.5 Participants
5 The manufacturer requested that we withhold its name.

product customization decisions 283
were 750 car buyers (450 in the first study and 300 in the second) acrossthree major metropolitan areas in Germany. There are some small butimportant design differences between the two studies, so we presentthem separately.
In Germany, customers of the manufacturer that participated in ourexperiments configure their vehicle to their own specification and pur-chase it in advance of delivery; cars are not purchased off the dealer’slot. Typically customers either configure their car using the company’sconfiguration software on the Internet or use a catalog that is presentedto them by the salesperson at the dealership. Our studies were con-ducted at a computer terminal in the dealership using the same con-figuration software available to customers who configure their car onthe Internet. We restricted our sample to customers who had come tothe dealership to purchase the manufacturer’s entry-level sedan andwho had not previously configured their car online. The screening wasconducted by the salesperson; if prospective customers did not meetboth of these criteria, they were not invited to participate. Participantswere told by the salesperson that the manufacturer was testing the useof its configurator at its dealerships and that they could configure thecar that they had come to purchase on the computer. Those who choseto participate were given a free miniature toy car (approximate valueUS$7) as a token of appreciation for using the computerized configu-ration. (Note that the salespeople were blind to the purpose of theexperiment.)
The configuration process includes a sequence of 67 decisions aboutattributes of the car, made one at a time by clicking on the desiredoption, and takes approximately 30 minutes to complete. Each decisionappears on a different screen, with a sidebar indicating the total priceof the car to that point and all the features it includes. With eachconfiguration decision the price is updated on the screen, and at anypoint, customers are free to revise their previous choices or scroll (click)forward. This is an important aspect because it means that all customerscan have access to information about any attribute at any point in time.6
Each attribute consists of a different variety of options, and differentoptions have different prices; for instance, there are 56 interior colorsand 13 types of wheel rims from which to choose. At every screen thereis a default option that is already checked off by the manufacturer (e.g.,the default engine is 1.6 liters with a five-speed manual transmission).For all attributes except exterior color, the default is the cheapest option
6 Some readers might be concerned about interattribute dependencies in our experi-ment, such that choosing one option would restrict potential choices in subsequent op-tions. This was not the case for any of our target attributes (in fact, only the top-of-the-line sport package creates a restriction on some attributes; only two participants in thecontrol conditions actually chose this package).

284 journal of political economy
and appears at the top of the list.7 We selected eight “target” attributesfor the purposes of our experiment (number of options in parentheses):interior color (56), exterior color (26), engine and gearbox (25), wheelrims/tires (13), steering wheel (10), rearview mirror (6), interior decorstyle (4), and gearshift knob style (4). The target attributes were placedat the beginning of the configuration sequence, and our manipulationconsisted of changing their order.
Design
After the initial screening questions, each customer-participant beganby completing a short questionnaire in which he (or she) was asked tostate his willingness to pay for the new sedan. This question was designedto make the customer’s budget constraint salient and as a way to em-phasize the magnitude of the financial commitment at stake. Next re-spondents were asked to rate their knowledge about the vehicles pro-duced by the participating manufacturer (on a 1–7 scale). Finally, inthe last phase of the preconfiguration survey, participants were askedto rate the importance of each of the target attributes using a constantsum scale in which they allocated 100 points across the eight attributesaccording to subjective importance. The software forced participants toallocate all 100 points but allowed for ties and for zeros. The purposeof this survey item was to test whether self-rated importance exertedany effect on customers’ choices in our study.
Next participants were randomly assigned to one of three groups bythe configuration software. As in the suit study, we manipulated theorder in which participants made their decisions regarding the (eight)target attributes. The target attributes appeared at the beginning of theconfiguration process. In the hi-to-lo group ( ) participants weren p 150presented with a sequence that was sorted by descending variety suchthat the attribute that had the most options (interior color, 56) appearedfirst and the attribute with the fewest options (gearshift knob style, four)appeared eighth. The lo-to-hi group ( ) was presented with then p 150exact opposite, ascending sequence (i.e., gearshift style was first andinterior color eighth). Control condition participants ( ) weren p 150presented with a randomly determined sequence of the eight attributes.The remainder of the configuration was identical for all participants.Our dependent variable was whether or not the customer-participantaccepted the default option at each of the eight stages of the (target)decision sequence. Thus, each customer provided eight observations.
7 Note that the manufacturer specified the default levels and did not allow us to ma-nipulate them. Recall, however, that we randomized the default in the suit study. Thisindicates that our order effect does not depend on the default being set at a specific levelor price.

product customization decisions 285
In addition to recording the customer’s selections, the software alsorecorded the price of the chosen option, the time taken to arrive at thechoice, and the total price for the configured car.
At the end of the configuration process participants were asked toindicate their satisfaction with the configuration software and the car,their likelihood of configuring the same car again, their satisfaction withthe decision-making process, and the extent to which the car they hadconfigured matched their preferences (all measured on 1–7 scales).Having completed the configuration process, participants notified thedealer, who then proceeded to print a summary of their selections andto input them directly into the manufacturer’s ordering system, as wouldnormally be done any time a car was configured (at the time of ourstudy this process was conducted manually). The latter system generateda purchase order that participants then proceeded to sign and thatrepresented the contract for the car’s purchase (there was no oppor-tunity to bargain on the car price). Thus, the data we analyze from theconfigurator matches the purchase order that customers signed.8
Analysis and Results
We used the exact same approach as in the suit study to analyze oureight manipulated attributes in this study, except that here we includedthe covariates of self-rated knowledge and importance. We controlledfor the knowledge variable because we suspected that more knowl-edgeable customers would be less likely to be affected by our experi-mental treatment. The importance parameter was added to ascertainwhether participants show greater resistance to the default when theyconsider the attribute to be important. Note that the decisions of controlcondition participants were not included in the regression analyses sincewe did not expect to find the same depletion pattern when the orderof attributes was random rather than ordered.
Table 2 presents the key summary statistics, and table 3 presents theresults of our analyses of the influence of order in this study. The pro-portion of participants accepting the default for each attribute, in each
8 Note that theoretically it was possible to change the purchase order until a few weeksprior to the car’s delivery. Only some of the attributes were changeable and only up to acertain date (e.g., the engine could be changed until 4 weeks prior to delivery). For variousreasons related to German privacy laws, we were not able to obtain the data on the exactcorrespondence between the configured car and the ultimately delivered car. However,in data collected subsequent to our studies, we were able to obtain the price of theconfigured car and the price of the delivered car for a separate sample ( ) ofN p 113buyers of the same entry-level sedan. The average configured price was i38,196, and theaverage final order price was i39,818. The i902 represents only a 2.2 percent differencebetween the configured and the delivered car. Thus, the correspondence between theconfigured and the delivered car was expected to be extremely high.

TABLE 2Summary Statistics for Car Study I
Attribute (Options) Lo-to-Hi Hi-to-Lo Control
Gearshift style (4):Default proportion .28 .41 .37Average price 169.67 115.80 136.33Standard deviation 146.28 130.43 140.22Average time (secs.) 17.19 29.82 24.31Standard deviation 11.78 17.92 14.23
Interior decor (4):Default proportion .33 .39 .36Average price 181.53 108.53 147.13Standard deviation 300.82 182.13 246.39Average time (secs.) 19.43 30.47 27.41Standard deviation 12.69 20.03 19.47
Rearview mirror (6):Default proportion .40 .55 .51Average price 191.33 141.33 148.77Standard deviation 165.57 155.69 158.36Average time (secs.) 22.09 31.82 29.73Standard deviation 14.97 24.08 18.09
Steering wheel (10):Default proportion .28 .38 .37Average price 262.53 193.90 203.67Standard deviation 200.33 183.15 186.37Average time (secs.) 68.31 94.09 82.96Standard deviation 60.27 97.01 81.07
Rims and tires (13):Default proportion .30 .37 .37Average price 1,006.00 895.00 906.33Standard deviation 557.98 456.82 495.53Average time (secs.) 76.25 102.17 93.63Standard deviation 60.77 84.53 120.80
Engine and gearbox (25):Default proportion .19 .11 .12Average price 28,543.53 29,986.93 29,346.53Standard deviation 3,264.16 3,580.49 3,177.73Average time (secs.) 115.65 81.35 91.77Standard deviation 123.87 64.09 89.85
Exterior color (26):Default proportion .33 .29 .31Average price 561.27 660.27 625.87Standard deviation 486.31 532.64 520.62Average time (secs.) 157.83 121.87 133.17Standard deviation 162.62 98.68 114.16
Interior color (56):Default proportion .19 .13 .13Average price 131.93 347.27 199.47Standard deviation 579.27 940.03 756.69Average time (secs.) 135.25 107.43 117.79Standard deviation 156.65 95.19 118.45

product customization decisions 287
TABLE 2(Continued)
Attribute (Options) Lo-to-Hi Hi-to-Lo Control
Total price (euros) 35,808.00 37,290.37 36,424.07Standard deviation 3,900.53 4,147.92 3,730.18Total time (secs.) 1,763.35 1,762.23 1,760.12Standard deviation 442.57 395.75 457.89
Note.—The table lists the attribute and (in parentheses) the number of options available for that attribute,proportion of customers accepting the default for the attribute, the average price paid for the attribute, and theaverage time in seconds it took from the moment that the attribute was displayed to the moment that the customersclicked over to the next attribute for each treatment condition and the control. In addition, the last rows displaythe total price and time taken. Note that in the lo-to-hi condition customers began with “gearshift style,” i.e., thefirst row of the table, and moved “down” the table, whereas in the hi-to-lo condition customers began with “interiorcolor,” i.e., the last row of attributes, and then moved “up” the table.
treatment condition, is graphed in figure 2. We replicate the results ofthe suit study: a mere change in attribute order appears to influencerevealed preferences and subsequent real purchase orders, even whereattribute information is equally available to all participants at all timesand there are no interattribute dependencies that restrict choice (seen. 6).9 More specifically, all four regression specifications indicate thatthe overall tendency to accept the default was greater in the hi-to-locondition than in the lo-to-hi condition. Furthermore, the effect ofattribute and the pattern of increasingly negative (and significant) at-tribute#order interactions in the second regression specification in-dicate that the likelihood of accepting the default increased as partic-ipants progressed through the hi-to-lo sequence. The linearized versionof this analysis, specification 4, showed a similar effect. The attrib-ute#order interaction term indicates that the difference between theslope of default acceptance in the hi-to-lo condition ( , SE pb p �.137.0413, ) and the corresponding slope in the lo-to-hi conditionp p .001( , SE p .0445, ) was significant. Finally, greater knowl-b p .004 p p .928
9 Note that the pattern of results in the control condition appears to be mixed. Althoughthe decision time for each attribute and the prices paid for the car were generally in themiddle of the range of decision times and prices paid for each treatment condition (aswere the satisfaction ratings, which we do not report here), for some attributes (e.g.,engine) the proportion of default acceptance tended to resemble the hi-to-lo conditionmore closely. At first blush, the latter may seem at odds with our interpretation that thedefault choice pattern that we observe is the result of a depletion effect in the hi-to-locondition rather than some kind of “repletion effect” in the lo-to-hi condition. We believe,however, that the control condition results are not inconsistent with our depletion expla-nation. As can be seen in table 2, in the low-variety items (e.g., gearshift style or interiordecor), default taking in the control condition falls between the two treatment conditions.As we explain in the introduction, the effect of depletion should be most apparent inlow-variety choices that follow high-variety choices, since high-variety choices should bedepleting regardless because of the sheer amount of options that need to be considered.Hence, we see little difference in the proportion of default taking between both treatmentconditions (i.e., hi-to-lo vs. lo-to-hi) and the treatment and control conditions for high-variety items but do find differences for low-variety items.

TABLE 3Analysis of Default Choice for Car Study I
Variable
Specification
1 2 3 4
Order .216**(.092)
.579**(.247)
.211**(.090)
.648***(.157)
Attribute �.083**(.023)
�.014(.030)
Attribute 2 .072(.172)
.232(.251)
Attribute 3 .528***(.168)
.522**(.247)
Attribute 4 �.059(.173)
.000(.257)
Attribute 5 �.018(.174)
.124(.255)
Attribute 6 �.756**(.369)
�.173(.420)
Attribute 7 �.024(.203)
.368(.271)
Attribute 8 �.962***(.212)
�.448(.286)
Attribute 2#order �.302(.344)
Attribute 3#order .030(.339)
Attribute 4#order �.112(.349)
Attribute 5#order �.264(.348)
Attribute 6#order �1.163***(.413)
Attribute 7#order �.750**(.350)
Attribute 8#order �1.026**(.406)
Attribute#order �.136***(.040)
Importance �.009(.008)
�.009(.008)
�.020***(.004)
�.020***(.004)
Knowledge �.060**(.028)
�.060**(.028)
�.059**(.027)
�.059**(.272)
Constant �.825***(.145)
�1.021***(.192)
�.662***(.102)
�.887***(.123)
Note.—N p 300. Order is a dummy variable indicating the experimental condition (0 p lo-to-hi; 1 p hi-to-lo). Inspecifications 1 and 2, attribute is a dummy variable that indicates the car’s attribute. The attribute dummies arenumbered in ascending order of variety, with the lowest-variety attribute omitted. In specifications 3 and 4, attribute iscoded to reflect an assumption of a linear effect. Importance is an attribute importance constant-sum scale ratingprovided by the customer. Knowledge is an index summarizing a series of questions about the customer’s self-ratedknowledge about the participating manufacturer’s automobiles. Standard errors are in parentheses.
* .p ! .10** .p ! .05*** .p ! .01

product customization decisions 289
Fig. 2.—Default choice in car study I: proportion of default choices as a function ofattribute. Hi-to-lo participants advanced from right to left and lo-to-hi from left to right.
edge was associated with a reduced likelihood of default acceptance.The effect of importance depended on the specification used.
We also obtained data on how long it took each participant to makehis or her choice for each attribute, as well as the duration of the overallconfiguration process. The average total configuration completion timeswere within 3 seconds of each other in all conditions and stood at justunder 30 minutes (see table 2). The timing data for the eight manip-ulated attributes (in the treatment conditions) are plotted in figure 3.Note that the pattern of the time taken tracks the choice pattern: whereparticipants chose the default, they also took longer. If time is taken asa proxy for decision effort, then it appears that participants did notdisengage from the decision process when choosing the default. It isnoteworthy that for every attribute decision, times differed significantlybetween experimental conditions. Nonetheless, it is possible that onesegment of participants chose the default as a way to disengage quicklyfrom the decision process whereas the other remained engaged for avery long time before making a choice. In order to examine this pos-sibility, we compared the mean time taken by customers who chose thedefault for a given attribute with the mean time taken by customers who

290 journal of political economy
Fig. 3.—Timing of choices in car study I: time taken in seconds as a function of attribute.Hi-to-lo participants advanced from right to left and lo-to-hi from left to right.
did not accept the default, for each condition. Of the 16 possible com-parisons that we tested, only one was significant at a conventional a
level of .05, about what would be expected by chance alone.An analysis of the total price for the configured automobile dem-
onstrates the potential financial consequences of our experimental ma-nipulation in this study. Table 2 shows the prices for each of the eighttarget attributes and for the car overall in each condition. Since theorder manipulation affected the features of the vehicle that participantschose and where participants accepted the default, it also affected itsprice: participants in the hi-to-lo condition paid i1,482.37 more thanthey did in the lo-to-hi condition, a statistically significant difference( , ). This difference indicates that the effects of ourt(298) p 3.18 p ! .01subtle order manipulation—recall that order was altered for only eightof the automobile’s 67 configurable attributes—were of financial con-sequence. The results hint that, under certain circumstances, the firmmight be able to increase its revenues using a potentially costless ma-nipulation of strategically altering the order of the configuration as wellas the default option for certain attributes.
Finally, owing to the high correlation between the satisfaction mea-

product customization decisions 291
sures, we combined them to form a satisfaction index (Cronbach). In a replication of the suit study, participants reporteda p 0.91
greater satisfaction in the lo-to-hi condition than in the hi-to-lo condition( , ). It is noteworthy that there was no statisticallyt(298) p 5.12 p ! .0001significant correlation between self-reported satisfaction and purchaseprice ( , not significant).r p �0.02
III. Car Study II
The price difference that we found in the previous study raises thequestion of whether a higher willingness to pay is endemic to hi-to-losequences. We suggest that this is not the case. Instead, we believe thatthe reason we observed price differences was that the target attributesequence included a relatively high-priced item, an engine, whose de-fault option was substantially cheaper in absolute terms than its non-default options (a difference of i4,200 between the default and the nextmore expensive option). Since the engine was a high-variety item (25options), hi-to-lo participants chose it early in the sequence, hence in-creasing their likelihood of choosing a more expensive, nondefault en-gine. Thus, we reason that placing the engine after the target attributesequence should diminish the price difference that we observed in carstudy I because, by the time they make their engine selection, partici-pants in both the hi-to-lo and lo-to-hi conditions should be relativelydepleted. This is a particularly important issue for firms because it meansthat willingness to pay might depend not only on the configurationsequence but also on the price of the attributes in the sequence.
In order to address this matter we replicated car study I in a follow-up study with another group of 300 entry-level sedan purchasers in thesame participating dealerships approximately 6 months after the firststudy. In addition to replacing the engine with a cheaper item, a radio(four options), we also removed the importance rating task from thepreconfiguration questionnaire. The engine now appeared after thetarget attributes in both the hi-to-lo ( ) and lo-to-hi ( )n p 150 n p 150conditions. We did not include any control conditions in this follow-upstudy.
Analysis and Results
We followed the same analytic strategy in this experiment as in theprevious study. Table 4 presents the summary statistics, and table 5 pre-sents the results of the four regression specifications that tested theeffect of our order manipulation. The order effect that we observe inthis study is consistent with the effect observed in the suit and car Istudies, although here its influence is weaker. Furthermore, in the sec-

TABLE 4Summary Statistics for Car Study II
Attribute (Options) Lo-to-Hi Hi-to-Lo
Radio (4):Default proportion .28 .31Average price 506.60 471.03Standard deviation 358.49 348.67Average time (secs.) 26.25 30.73Standard deviation 17.80 18.59
Gearshift (4):Default proportion .29 .35Average price 160.40 128.27Standard deviation 143.69 129.44Average time (secs.) 19.73 26.91Standard deviation 11.21 16.02
Interior decor (4):Default proportion .31 .35Average price 160.93 144.53Standard deviation 276.46 237.95Average time (secs.) 20.17 29.63Standard deviation 12.02 20.60
Rearview mirror (6):Default proportion .39 .49Average price 194.40 155.20Standard deviation 163.42 159.23Average time (secs.) 21.53 29.67Standard deviation 12.64 18.63
Steering wheel (10):Default proportion .31 .38Average price 242.23 215.70Standard deviation 196.12 197.55Average time (secs.) 76.69 89.50Standard deviation 63.68 75.27
Rims and tires (13):Default proportion .32 .34Average price 955.33 931.67Standard deviation 502.88 482.42Average time (secs.) 83.47 81.19Standard deviation 64.27 57.74
Exterior color (26):Default proportion .34 .29Average price 575.13 625.87Standard deviation 505.05 555.79Average time (secs.) 151.13 128.67Standard deviation 107.93 75.24
Interior color (56):Default proportion .19 .22Average price 164.87 305.13Standard deviation 631.67 758.25Average time (secs.) 145.11 106.47Standard deviation 99.84 82.08

product customization decisions 293
TABLE 4(Continued)
Attribute (Options) Lo-to-Hi Hi-to-Lo
Total price (euros) 36,435.83 36,200.80Standard deviation 4,176.08 4,181.72Total time (secs.) 1,755.65 1,759.65Standard deviation 386.85 392.00
Note.—The table lists the attribute and (in parentheses) the number of optionsavailable for that attribute, the proportion of customers accepting the default forthe attribute, the average price paid for the attribute, and the average time inseconds it took from the moment that the attribute was displayed to the momentthat the customers clicked over to the next attribute for each treatment condition.In addition, the last rows display the total price and time taken. Note that in thelo-to-hi condition customers began with “gearshift style,” i.e., the first row of thetable, and moved “down” the table, whereas in the hi-to-lo condition customersbegan with “interior color,” i.e., the last row of attributes, and then moved “up” thetable.
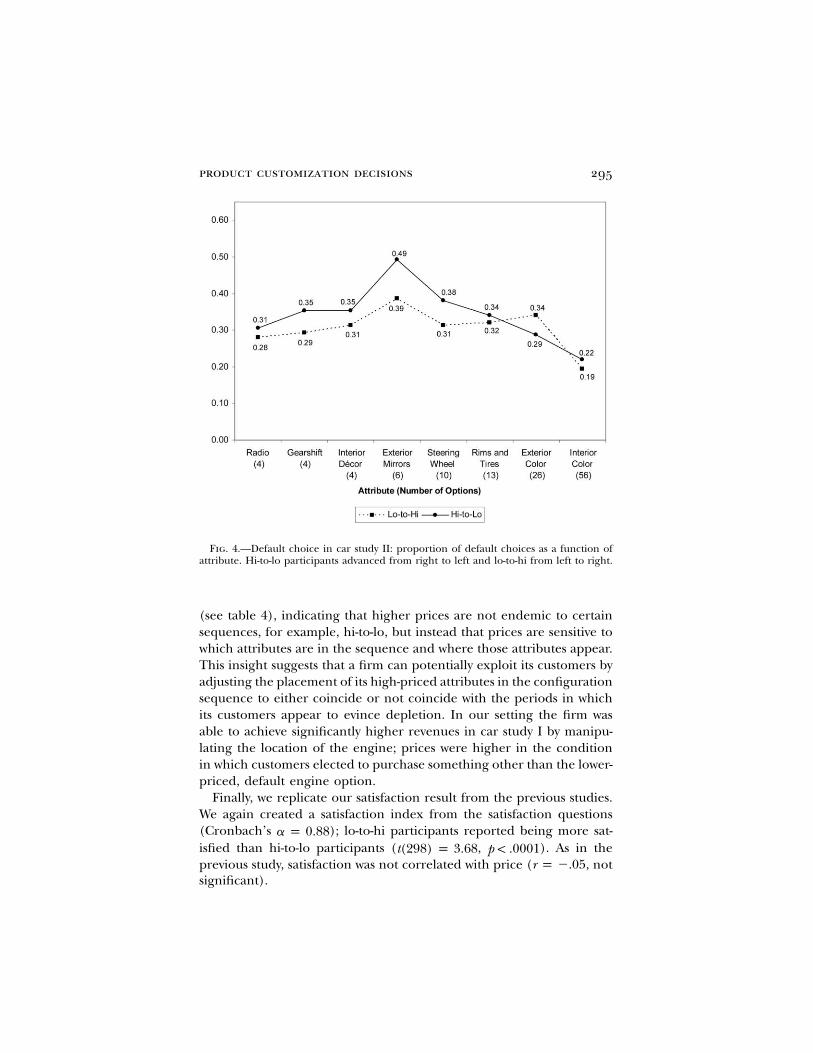
ond regression specification, the pattern of increasingly smaller attri-bute#order interactions is far less evident than in the previous studies(see fig. 4). Finally, whereas the slope in the hi-to-lo condition signifi-cantly differs from zero ( , SE p .0263, ) and itsb p �.058 p p .027lo-to-hi counterpart does not ( , SE p .0272, ), theb p .024 p p .379fourth regression specification indicates that these slopes are not sig-nificantly different from each other. The weaker effects that we observein this study are not surprising given the fact that we replaced a high-variety item (the engine had 25 options) with a low-variety item (theradio had only four options), which would naturally reduce the degreeof depletion experienced by our participants. Indeed, this observationhighlights the link between depletion, variety, and attribute order:higher- (lower-) variety items early in the sequence will lead to greater(lower) depletion and, in turn, larger (smaller) effects of attribute orderon choices.
The average duration of the total configuration process in this studywas within 5 seconds of the duration in the previous car study and againstood at just under 30 minutes. Figure 5 plots the average duration ofeach decision in the configuration process in each experimental con-dition. As in the previous car study, here, too, the timing data patterntracks the choice data pattern and suggests that the default choice wasnot the result of a lack of effort. Furthermore, for six of the eightattributes the difference in time taken between conditions is significant(and marginally so for the seventh). We also analyzed the time takento reach a decision conditional on whether the customer had chosenthe default. As in car study I, time to decision did not depend on thedefault choice in this study either.
Removing the engine from the target attribute list eliminated anystatistically significant differences in purchase price between conditions

TABLE 5Analysis of Default Choice for Car Study II
Variable
Specification
1 2 3 4
Order .171*(.094)
.129(.254)
.168*(.093)
.285*(.159)
Attribute �.041**(.019)
�.024(.027)
Attribute 2 .141(.175)
.065(.252)
Attribute 3 .186(.174)
.160(.250)
Attribute 4 .639***(.170)
.483**(.244)
Attribute 5 .246(.174)
.160(.250)
Attribute 6 .171(.175)
.191(.250)
Attribute 7 .095(.176)
.281(.248)
Attribute 8 �.467**(.189)
�.484*(.272)
Attribute 2#order .146(.351)
Attribute 3#order .051(.349)
Attribute 4#order .306(.341)
Attribute 5#order .166(.348)
Attribute 6#order �.038(.349)
Attribute 7#order �.377(.352)
Attribute 8#order .034(.378)
Attribute#order �.034(.038)
Knowledge .003(.035)
.003(.035)
.002(.034)
.002(.034)
Constant �.966***(.136)
�.944***(.181)
�.680***(.093)
�.740***(.115)
Note.—N p 300. Order is a dummy variable indicating the experimental condition (0 p lo-to-hi; 1 p hi-to-lo). Inspecifications 1 and 2, attribute is a dummy variable that indicates the car’s attribute. The attribute dummies arenumbered in ascending order of variety, with the lowest-variety attribute omitted. In specifications 3 and 4, attribute iscoded to reflect an assumption of linearity. Knowledge is an index summarizing a series of questions about the customer’sself-rated knowledge about the participating manufacturer’s automobiles. Standard errors are in parentheses.
* .p ! .10** p ! .05.*** .p ! .01
product customization decisions 295
Fig. 4.—Default choice in car study II: proportion of default choices as a function ofattribute. Hi-to-lo participants advanced from right to left and lo-to-hi from left to right.
(see table 4), indicating that higher prices are not endemic to certainsequences, for example, hi-to-lo, but instead that prices are sensitive towhich attributes are in the sequence and where those attributes appear.This insight suggests that a firm can potentially exploit its customers byadjusting the placement of its high-priced attributes in the configurationsequence to either coincide or not coincide with the periods in whichits customers appear to evince depletion. In our setting the firm wasable to achieve significantly higher revenues in car study I by manipu-lating the location of the engine; prices were higher in the conditionin which customers elected to purchase something other than the lower-priced, default engine option.
Finally, we replicate our satisfaction result from the previous studies.We again created a satisfaction index from the satisfaction questions(Cronbach’s ); lo-to-hi participants reported being more sat-a p 0.88isfied than hi-to-lo participants ( , ). As in thet(298) p 3.68 p ! .0001previous study, satisfaction was not correlated with price ( , notr p �.05significant).

296 journal of political economy
Fig. 5.—Timing of choices in car study II: time taken in seconds as a function of attribute.Hi-to-lo participants advanced from right to left and lo-to-hi from left to right.
IV. Conclusion
We have examined the influence of attribute order on product custom-ization decisions. Our results suggest that in some circumstances orderof attributes can change people’s revealed preferences in customizationdecisions of major durable goods. When attributes with relatively fewoptions follow attributes with relatively many options—a high-to-low se-quence—people appear more likely to accept default options than whenthis sequence of attributes is reversed. In particular, the tendency toaccept the default appears to increase through the high-to-low sequencedespite the fact that attributes with relatively few options can be theo-retically less costly to consider. The tendency to accept the default in areverse, low-to-high sequence remains unchanged throughout the cus-tomization process. The fact that we observe our effect across entirelyunrelated product categories that are characterized by completely dif-ferent attributes hints at the generalizability of the effect of order inproduct choice.
Our findings offer implications for the conception of preferences indifferentiated product models as well as for firms. First, although the

product customization decisions 297
representation of product preferences as the summation of attributepreferences is both intuitively and econometrically attractive, it mayembody an idealization that does not hold in some contexts, just as itdid not hold in our empirical tests. The price differences that we reportin the car studies suggest that price differences observed by the econ-ometrician might not always reflect stable underlying preferences (i.e.,demand) for product attributes.
Second, a firm that offers customizable products might be able toincrease its revenues in contexts in which its customers appear sensitiveto attribute order. For instance, the firm can use the order manipulationreported herein and then offer a higher-priced default alternative forattributes that appear later in the decision sequence. Note that it is notnecessarily the case that, at equilibrium, all firms should converge onthe same attribute order, for example, hi-to-lo, because price paid is afunction of the combined effect of order and which option is the default,and this might vary depending on the product. An added complicationis that different orders yield different levels of customer satisfaction,which in turn can affect future sales. Revenues in the short run mustbe balanced against the potential loss of customers in the long run.Although we cannot measure the actual magnitude of the welfare im-plications of our order effect, if one makes the reasonable assumptionthat high-priced items have higher margins, the price difference thatwe observe suggests that firm surplus is likely positively affected.
Finally, the order effect we observe offers empirical evidence consis-tent with a tradition of research in experimental psychology and be-havioral economics about the malleability of revealed preferences(Payne, Bettman, and Johnson 1993; Payne et al. 2000; Ariely, Loew-enstein, and Prelec 2003). This literature shows that sometimes nor-matively equivalent decision contexts—as is the case for our experi-mental groups—yield different decisions. Although this research istypically viewed as a challenge to the assumption that people maximizeutility and possess a complete preference ordering, some have arguedthat consumers rationally use decision context as a way to obtain market-related information (Wernerfelt 1995; Kamenica 2008). Similarly, it maybe possible to explain the results we report here with a rational frame-work, albeit under relatively implausible assumptions. First, suppose thatconsumers infer that attributes that come earlier in the sequence aresomehow more important. Next, assume that the return on the effortspent on the important attributes increases with the number of attributeoptions available whereas the return on effort spent on the nonimpor-tant attributes is fixed. A fixed or highly convex time budget would leadto our observed results.10 We believe, however, that the findings that we
10 We thank a reviewer for this suggestion and reasoning.

298 journal of political economy
report herein are unlikely to be the consequence of such rational think-ing on the part of consumers, if only because it is difficult to conjurerational thinking that would lead one group of consumers to choose adifferent car than another group simply because of a trivial differencein the order of eight of 67 attributes. Instead, it is more likely that ourfindings are a consequence of people’s bounded rationality and its effecton their revealed preferences, even for highly consequential decisions.
References
Abadie, Alberto, and Sebastien Gay. 2006. “The Impact of Presumed ConsentLegislation on Cadaveric Organ Donation: A Cross-Country Study.” J. HealthEcon. 25:599–620.
Ariely, Dan, George F. Loewenstein, and Drazen Prelec. 2003. “Coherent Ar-bitrariness: Stable Demand Curves without Stable Preferences.” Q.J.E. 118:73–105.
Bajari, Patrick, and C. Lanier Benkard. 2005. “Demand Estimation with Het-erogeneous Consumers and Unobserved Product Characteristics: A HedonicApproach.” J.P.E. 113:1239–76.
Bellman, Steven, Eric J. Johnson, and Gerald L. Lohse. 2001. “To Opt-In or Opt-Out? That Depends on the Question.” Communications ACM 44 (2): 25–27.
Berry, Steven, James Levinsohn, and Ariel Pakes. 1995. “Automobile Prices inMarket Equilibrium.” Econometrica 63:841–90.
Berry, Steven, and Ariel Pakes. 2007. “The Pure Characteristics Demand Model.”Internat. Econ. Rev. 48:1193–1225.
Bertrand, Marianne, Dean S. Karlan, Sendil Mullainathan, Eldar Shafir, andJonathan Zinman. 2006. “Pricing Psychology: A Field Experiment in the Con-sumer Credit Market.” Manuscript, Princeton Univ.
Choi, James, David Laibson, Brigitte Madrian, and Andrew Metrick. 2004. “ForBetter or for Worse: Default Effects and 401(k) Savings Behavior.” In Perspec-tives in the Economics of Aging, edited by David Wise. Chicago: Univ. ChicagoPress.
Epple, Dennis. 1987. “Hedonic Prices and Implicit Markets: Estimating Demandand Supply Functions for Differentiated Products.” J.P.E. 95:59–80.
Gabaix, Xavier, David Laibson, Guillermo Moloche, and Stephen Weinberg.2006. “Costly Information Acquisition: Experimental Analysis of a BoundedlyRational Model.” A.E.R. 96:1043–68.
Gupta, Sunil, and Valerie Zeithaml. 2006. “Customer Metrics and Their Impacton Financial Performance.” Marketing Sci. 25:718–39.
Harrison, Glenn W., and John A. List. 2004. “Field Experiments.” J. Econ. Lit-erature 42:1009–55.
Iyengar, Sheena S., and Emir Kamenica. 2007. “Choice Overload and SimplicitySeeking.” Manuscript, Columbia Univ.
Iyengar, Sheena S., and Mark Lepper. 2000. “When Choice Is Demotivating: CanOne Desire Too Much of a Good Thing?” J. Personality and Soc. Psychology 79:995–1006.
Johnson, Eric J., and Daniel Goldstein. 2003. “Do Defaults Save Lives?” Science302:1338–39.
Kahneman, Daniel. 1994. “New Challenges to the Rationality Assumption.” J.Inst. and Theoretical Econ. 150:18–36.

product customization decisions 299
Kamenica, Emir. 2008. “Contextual Inference in Markets: On the InformationalContent of Product Lines.” A.E.R. 98 (5): 2127–49.
Lancaster, Kelvin. 1966. “A New Approach to Consumer Theory.” J.P.E. 74:132–57.
Madrian, Brigitte C., and Dennis F. Shea. 2001. “The Power of Suggestion in401(k) Participation and Savings Behavior.” Q.J.E. 116:1149–87.
McFadden, Daniel. 1974. “Conditional Logit Analysis of Qualitative Choice Be-havior.” In Frontiers of Econometrics, edited by P. Zarembka. New York: AcademicPress.
McKenzie, Craig R. M., Michael J. Liersch, and Stacey R. Finkelstein. 2006.“Recommendations Implicit in Policy Defaults.” Psychological Sci. 17:414–20.
Muraven, Mark, and Roy F. Baumeister. 2000. “Self-Regulation and Depletionof Limited Resources: Does Self-Control Resemble a Muscle?” PsychologicalBull. 126:247–59.
Ortoleva, Pietro. 2008. “The Price of Flexibility: Towards a Theory of ThinkingAversion.” Manuscript, New York Univ.
Ozdenoren, Emre, Stephen Salant, and Dan Silverman. 2008. “Willpower andthe Optimal Control of Visceral Urges.” Manuscript, Univ. Michigan.
Payne, John W., James R. Bettman, and Eric J. Johnson. 1993. The AdaptiveDecision-Maker. New York: Cambridge Univ. Press.
Payne, John W., David A. Schkade, William H. Desvousges, and Chris Aultman.2000. “Valuation of Multiple Environmental Programs.” J. Risk and Uncertainty21:95–115.
Rosen, Sherwin. 1974. “Hedonic Prices and Implicit Markets: Product Differ-entiation in Pure Competition.” J.P.E. 82:34–55.
Rubinstein, Ariel. 1998. Modeling Bounded Rationality. Cambridge, MA: MIT Press.Simon, Herbert A. 1955. “A Behavioral Model of Rational Choice.” Q.J.E. 69:
99–118.Slovic, Paul. 1995. “The Construction of Preference.” American Psychologist 50:
364–71.Vohs, Kathleen D., Roy F. Baumeister, Brandon J. Schmeichel, Jean M. Twenge,
Noelle M. Nelson, and Dianne M. Tice. 2008. “Making Choices Impairs Sub-sequent Self-Control: A Limited-Resource Account of Decision Making, Self-Regulation, and Active Initiative.” J. Personality and Soc. Psychology 94:883–98.
Wernerfelt, Birger. 1995. “A Rational Reconstruction of the Compromise Effect.”J. Consumer Res. 21:627–33.