Embed Size (px)
Citation preview
Journal of Colloid and Interface Science 336 (2009) 90–99
Contents lists available at ScienceDirect
Journal of Colloid and Interface Science
www.elsevier .com/locate / jc is
Ordering transitions in micrometer-thick films of nematic liquid crystals drivenby self-assembly of ganglioside GM1
I-Hsin Lin, Maria-Victoria Meli, Nicholas L. Abbott *
Department of Chemical & Biological Engineering, University of Wisconsin-Madison, 1415 Engineering Drive, Madison, Wisconsin 53706, USA
a r t i c l e i n f o
Article history:Received 14 January 2009Accepted 30 March 2009Available online 8 April 2009
Keywords:GangliosideGM1
Self-AssemblyLiquid CrystalsBiomolecular InterfacesLangmuir–SchaeferOrdering TransitionsAnchoring of Liquid CrystalsBiosensors
0021-9797/$ - see front matter � 2009 Elsevier Inc. Adoi:10.1016/j.jcis.2009.03.068
Abbreviations: 5CB, 40-pentyl-4-cyanobiphenyl; L-DLPoline; DPPC, 1,2-dipalmitoyl-sn-Glycero-3-phosphocholinGalBeta1-3GalNAcBeta1-4(NeuAcAlpha2-3)GalBeta1-4GlcFL-GM1, BODIPY FL-GalBeta1-3GalNAcBeta1-4(NeuAcAlCeramide.
* Corresponding author. Fax: +1 608 262 5434.E-mail address: [email protected] (N.L. Abbott
a b s t r a c t
We report an investigation of the self-assembly of the monosialoganglioside (GM1) at interfaces formedbetween aqueous solutions of 10 lM GM1 (at 25 �C) and micrometer-thick films of the nematic liquidcrystal (LC) 40-pentyl-4-cyanobiphenyl (5CB). We observe the process of spontaneous transfer of GM1
onto the interfaces to be accompanied by continuous ordering transitions within the micrometer-thickfilms of the LC. At saturation coverage, the GM1 orders the LC in an orientation that is perpendicularto the interface, an orientation that is similar to that caused by phospholipids such as dila-uroylphosphatidylcholine (DLPC). This result suggests an interaction between the LC and GM1 that isdominated by the hydrophobic tails of the GM1. Relative to DLPC, however, we observe the dynamicsof the LC ordering transition driven by GM1 to be slow (2 h for DLPC versus 100 h for GM1). To provideinsight into the origins of the slow dynamics of the GM1-induced ordering transition in the LC, we per-formed two additional measurements. First, we quantified the time-dependent adsorption of GM1 at theLC interface by using fluorescently-labeled GM1. Second, we used the Langmuir–Schaefer method totransfer preorganized monolayers of GM1 from an air–water interface to the aqueous-LC interface.Results obtained from these two experiments are consistent with a physical picture in which the finalstages of spontaneous adsorption/ordering of GM1 at the aqueous-LC interface dictate the dynamics ofthe LC ordering transition. This rate limiting process underlying the ordering transition was substantiallyaccelerated by heating the system above the phase transition temperature of GM1(26 �C), suggesting thatthe phase state of the GM1 micellar aggregates in bulk solution strongly influences the kinetics of the finalstages of ordering/adsorption of GM1 at the LC interface. Overall, these results and others presented inthis manuscript reveal that it is possible to decorate interfaces of a nematic LC with GM1, and that theassembly of GM1 at these interfaces impacts the dynamic and equilibrium ordering of the LC.
� 2009 Elsevier Inc. All rights reserved.
1. Introduction
A series of recent studies have reported on ordering transitions in-duced in micrometer-thick films of liquid crystals (LC) that are causedby the self-assembly of amphiphiles at aqueous interfaces of LC films[1–13]. Of the various different amphiphiles explored in these studies(which includes surfactants, phospholipids, macromolecular amphi-philes), the ordering of nematic LCs by the interfacial self-assembly ofthe phospholipid L-a-dilauroylphosphatidylcholine (L-DLPC) hasbeen particularly well characterized [3,5,6,9–13]. Specifically, equil-
ll rights reserved.
C, L-a-dilauroylphosphatidylch-e; GM1, monosialogangliosideBeta1-10-Ceramide; BODIPYpha2-3)GalBeta1-4GlcBeta1-10-
).
ibration of aqueous dispersions of unilamellar vesicles formed fromL-DLPC has been shown to lead to formation of monolayers of DLPCat the interfaces of the LC. The formation of the monolayer of L-DLPChas in turn been demonstrated to cause the LC to adopt a perpendic-ular (homeotropic) ordering at the aqueous interface. Additionalexperiments have also revealed that (i) the phase behavior of mono-layers of DLPC formed at the interfaces of the nematic LC is substan-tially different from that observed in the absence of the nematicordering of the LC, and (ii) that binding of proteins (such as phospho-lipases) to these lipid-laden LC interfaces leads to easily visualizedordering transitions in the LCs [5,6]. Whereas an increasingly com-plete understanding of the assembly of phospholipids at aqueousinterfaces of LCs is emerging, in this paper, we move to report onthe assembly of glycolipids at aqueous-LC interfaces. In particular,as a prototypical example of the wide range of glycolipids found inbiological systems, we focus on the self-assembly of the monosialo-ganglioside GalBeta1-3GalNAcBeta1-4(NeuAcAlpha2-3)GalBeta1-4GlcBeta1-10-ceramide (GM1) at aqueous interfaces of thermotropic

I-Hsin Lin et al. / Journal of Colloid and Interface Science 336 (2009) 90–99 91
LCs. We note that GM1 binds the bacterial toxin produced by Vibriocholerae and, consequently, that the biophysical properties of GM1
have been studied in detail within Langmuir monolayers and lipidbilayers.
Gangliosides, in general, are lipids with head groups comprisedof oligosaccharides containing one or more N-acetylneuraminicacid (sialic acid) residues [14]. GM1 contains a pentasaccharide(Fig. 1). As noted above, the self-organization of gangliosides within vitro mimics of biological membranes have been widely studied[15–22] as have the interactions of protein toxins with these mod-els of cell membranes [23–35]. In the context of the former inves-tigations, the physicochemical characteristics of GM1-ladeninterfaces have been investigated with atomic force microscopy(AFM) [16,19–21,24], light scattering techniques [17,18], surfaceplasmon resonance (SPR) [25], and fluorescence microscopy [36].In this paper, we report the results of an investigation that soughtto create a new class of GM1-decorated interfaces that are preparedby self-assembling GM1 at the interfaces of LCs. By analogy tophospholipid-decorated LCs, we hypothesized that the orienta-tional ordering of the LC would be closely coupled to the formationof the GM1-decorated interface, and thus that the LC orderingbehavior could be used to report on the interfacial behavior ofthe GM1. Although certain similarities in the orientational orderingof the LC in the presence of phospholipids and GM1 are noted inour paper, the results of our study also reveal striking differencesin the dynamics of these two systems. We end our introductionby noting that the development of methods that lead to formationof GM1-laden interfaces of LCs, and an understanding of the equi-librium and dynamic properties of the interfaces, is a prerequisiteto exploring their potential use as biomolecular interfaces at which
Fig. 1. Structures of GM1, BODIPY FL-GM1, DLPC and DPPC. Gal, galactose; Glc,
protein toxin interactions with GM1 can be reported via orderingtransitions in LCs. In future studies, we will investigate the influ-ence of protein toxins on the ordering of GM1-decorated interfacesof LCs.
2. Materials and methods
2.1. Materials
GalBeta1-3GalNAcBeta1-4(NeuAcAlpha2-3)GalBeta1-4GlcBe-ta1-10-Cer (GM1) was obtained from Avanti Polar Lipids, Inc.(Alabaster, AL). Trizma-hydrochloride (Tris[hydroxymethyl]-aminomethane hydrochloride, Tris HCl), sodium azide, ethylenedi-aminetetraacetic acid (EDTA), and chloroform were obtained fromSigma–Aldrich (St. Louis, MO). Octadecyltrichlorosilane (OTS), so-dium chloride, methanol, methylene chloride, sulfuric acid, hydro-gen peroxide (30% w/v), 2-propanol, and heptane were obtainedfrom Fisher Scientific (Pittsburgh, PA). BODIPY FL C5-GalBeta1-3GalNAcBeta1-4(NeuAcAlpha2-3)GalBeta1-4GlcBeta1-10-Cer(BODIPY FL-GM1) was purchased from Molecular Probes (Eugene,OR). Sodium hydroxide was obtained from LabChem Inc. (Pitts-burgh, PA). The LC 40-pentyl-4-cyanobiphenyl (5CB) was obtainedfrom EM Sciences (New York, NY). All chemicals were used as ob-tained. Deionization of a distilled water source was performedwith a Milli-Q system (Millipore, Bedford, MA) to give water witha resistivity of 18.2 MXcm. Glass microscope slides were Fisher’sFinest Premium Grade obtained from Fisher Scientific. Gold speci-men grids (20 lm thickness, 50 lm wide bars, and 283 lm gridspacing) were obtained from Electron Microscopy Sciences (FortWashington, PA).
glucose; GalNAc, N-acetylgalactosamine; Neu5Ac, N-acetylneuraminic acid.
92 I-Hsin Lin et al. / Journal of Colloid and Interface Science 336 (2009) 90–99
2.2. Preparation of LC-filled grids
Detailed descriptions of procedures used to prepare LC-filledgrids can be found in our previous publications [1–13,37]. Briefly,glass microscope slides were cleaned according to published pro-cedures [38] and coated with OTS [8]. The quality of the OTS layerwas assessed by checking the alignment of 5CB confined betweentwo OTS-coated glass slides. Any surface not causing homeotropicanchoring (perpendicular alignment of 5CB) of 5CB was discarded[39,40]. Gold specimen grids that were cleaned sequentially inmethylene chloride, ethanol, and methanol were placed onto thesurface of OTS-coated glass slides. Approximately 1 lL of 5CBwas dispensed onto each grid and then excess LC was removedby contacting a capillary tube with the droplet of 5CB [1–13,37].We estimated the variation in 5CB thickness to be approx ±10%based on interference colors generated when viewing the 5CB withwhite light. Each LC-filled grid was equilibrated at ambient tem-perature and subsequently immersed in or contacted with theaqueous solution of interest at the desired temperature.
2.3. Preparation of aqueous dispersions of GM1
Dispersions of GM1 were prepared following published proce-dures [5,9,32,35]. Briefly, GM1 was dissolved in a mixture of chlo-roform and methanol (4:1 by volume) and dispensed into glassvials. The chloroform:methanol mixture was evaporated under astream of N2, and the vial containing the lipids was then placed un-der vacuum for at least 2 h. The dried lipid was resuspended in anaqueous solution consisting of 50 mM Tris HCl, 200 mM NaCl,3 mM NaN3, and 1 mM Na2EDTA adjusted using NaOH to a pH of7.5 (denoted as pH 7.5 TRIS buffer in the remainder of this paper).This procedure resulted in a slightly cloudy solution. Before con-tacting with LC interfaces, the aqueous dispersion of GM1 wasequilibrated at ambient temperatures for at least 1 h. Experimentsutilizing the aqueous GM1 dispersions were typically initiatedwithin 4 h of their preparation.
2.4. Determination of the orientation of liquid crystals by polarizedlight microscopy
The orientation of 5CB was observed by using an Olympus BX60microscope with crossed polarizers (transmission mode). LC-filledgrids were placed on a rotating stage located between the polariz-ers. Orthoscopic examinations were performed with the sourcelight intensity set to 50% of full illumination and the aperture setto 10% to collimate the incident light. Homeotropic (perpendicular)alignment of a LC was determined by first observing the absence oftransmitted light during a 360 � rotation of the sample. Next, inser-tion of a condenser below the stage and a Bertrand lens above thestage allowed conoscopic examination of the specimen. An inter-ference pattern consisting of two crossed isogyres confirmed thehomeotropic alignment. [41] Images were captured with a micro-scope-mounted digital camera (Olympus C-4000 Zoom) set to anf-stop of 2.8 and a shutter speed of 1/320 s. Temperature was con-trolled with a heat stage (INSTEC, Inc., Boulder, CO) or a water bath(ISOTEMP 202, Fisher Scientific, Pittsburgh, PA).
2.5. Epifluorescence imaging of GM1-Laden aqueous-LC interfaces
Lipid layers comprised of mixtures of BODIPY FL-GM1 and GM1
were formed by incubating the LC interface against aqueous dis-persions of GM1 that contained 1 mol% BODIPY FL-GM1. Before per-forming the epifluorescence measurements, the LC-filled grid wassequentially moved from the aqueous dispersion of BODIPY FL-GM1 and GM1 to 2 mL and then subsequently 400 mL of the pH7.5 TRIS buffer (see above for composition) before a final transfer
into a third volume of the pH 7.5 TRIS buffer solution. During eachtransfer of the sample between solutions, care was taken to ensurethat a thin film of the water covered the lipid-laden interface of the5CB hosted within the grid [4,42]. GM1-laden interfaces were thenimaged by epifluorescence microscopy using an Olympus IX71 in-verted microscope equipped with a 100 W mercury lamp. A fluo-rescence filter cube with excitation at 480 nm and emission at535 nm (Chroma, Rockingham, VT) was used to visualize BODIPYFL fluorescence. Images were collected with a Hamamatsu 1394ORCA-ER CCD camera (Bridgewater, NJ) connected to a computerand controlled through SimplePCI imaging software (Compix,Inc., Cranberry Twp., NJ).
Fluorescence imaging was performed using an objective powerof 4X and an exposure time of 0.3 s. After each epifluorescencemeasurement, the sample was discarded. At least four replicateLC-filled grids were measured at each time point. To account for ef-fects of fluorophore degradation/bleaching encountered whenusing long incubation times (>72 h), we normalized all fluores-cence measurements to the intensity measured using an OTS-trea-ted slide immersed in the same aqueous dispersion of BODIPYFL-GM1/GM1. All fluorescence intensity measurements were cor-rected for background fluorescence, measured using lipid-free buf-fer solutions. Intensity values were determined using SimplePCIand Adobe Photoshop.
2.6. Quantification of interfacial concentration of BODIPY FL-GM1/GM1
adsorbed at aqueous-LC interfaces via fluorimetric measurements
The interfacial concentration of BODIPY FL-GM1/GM1 adsorbedat the aqueous-LC interface was determined by using the followingprocedure. First, a calibration plot of fluorimetric intensity versusknown BODIPY FL-GM1 concentration in bulk solution preparedusing 2 mL of a 2-propanol solution containing 1 lL of 5CB, knownamounts of BODIPY FL-GM1 and GM1 (at molar ratio of BODIPY FL-GM1 to GM1 of 1:99), and 5 lL of pH 7.5 TRIS buffer solution. Thismatrix was used so as to mimic the solution composition that re-sulted when BODIPY FL-GM1/GM1-decorated 5CB hosted withingrids was extracted and then dissolved in a 2-propanol solvent(see below). Fluorimetric measurements were performed using aFluoroMax-3 fluorimeter (Instruments S. A./Jobin Yvon/Spex Hori-ba Group, Edison, NJ) with an excitation wavelength of 480 nm(0.5 nm excitation slit) and an emission wavelength range of490–850 nm (5 nm emission slit) for the detection of BODIPY fluo-rescence. The fluorimeter was connected to a computer and con-trolled using DATAMAX software (Instruments S. A./Jobin Yvon/Spex Horiba Group).
To determine the interfacial concentration of BODIPY FL-GM1/GM1 adsorbed at an aqueous-LC interface, the LC sample (LChosted in grid, volume of LC was �1 lL) was physically transferredfrom the aqueous BODIPY FL-GM1/GM1 dispersion to 2 mL andthen 400 mL of pH 7.5 TRIS buffer solution to successively diluteBODIPY FL-GM1/GM1 in the bulk solution contacting the surfaceof the LC sample. Each sample was then removed from the pH7.5 TRIS buffer, and a blunt-tip 10 lL micro-syringe was used towithdraw the lipid-decorated 5CB from each grid. The 5CB ex-tracted using the micro-syringe was dissolved in 2 mL 2-propanolfor fluorimetric measurements to determine the concentration ofBODIPY FL-GM1 in the sample. We illuminated the solutions at480 nm and recorded the emission intensity from 490 to 850 nmto ensure that only monomer emission was observed with a peakaround 510 nm. With a known BODIPY FL-GM1 concentration ver-sus fluorimetric intensity calibration plot (Figure S1), this measure-ment permitted quantification of the interfacial concentration ofGM1 adsorbed at the interface as a function of time during the LCordering transition. Polarized light microscopy was used to confirmthat all LC was extracted from each grid. Control experiments not
I-Hsin Lin et al. / Journal of Colloid and Interface Science 336 (2009) 90–99 93
containing BODIPY FL-GM1were performed to determine the back-ground fluorescence. Furthermore, to ensure that fluorescenceintensities resulted only from assemblies of BODIPY FL-GM1/GM1
adsorbed at the aqueous-5CB interface (and did not include anycontributions from the fluorophore-containing bulk solution), weconfirmed that the 400 mL pH 7.5 TRIS buffer solution used to di-lute excess BODIPY FL-GM1/GM1 at the LC sample surface did notpossess significant fluorescence intensity after the last dilutionstep (data not shown). As noted above, we observed the fluorimet-ric intensity of BODIPY-FL in the bulk aqueous solution to decreasein experiments that involved long incubation times (>72 h) due tophotobleaching/degradation. To correct for this process of degrada-tion, fluorimetric measurements of the bulk solution intensitywere recorded at each time point. All raw fluorimetric intensitiesmeasured after �72-h of incubation were corrected for this processof degradation. To minimize degradation processes, light exposurewas minimized in all steps of the experiments.
The above measurements, when combined with knowledge ofthe areas of the aqueous-LC interfaces within each grid, were usedto calculate the areal density (area/molecule) of the GM1 moleculesassembled at each interface. All experiments were repeated 4times using the same batch of reagents (e.g., 2-propanol, BODIPYFL-GM1, and GM1 from the same lot number). Error bars were cal-
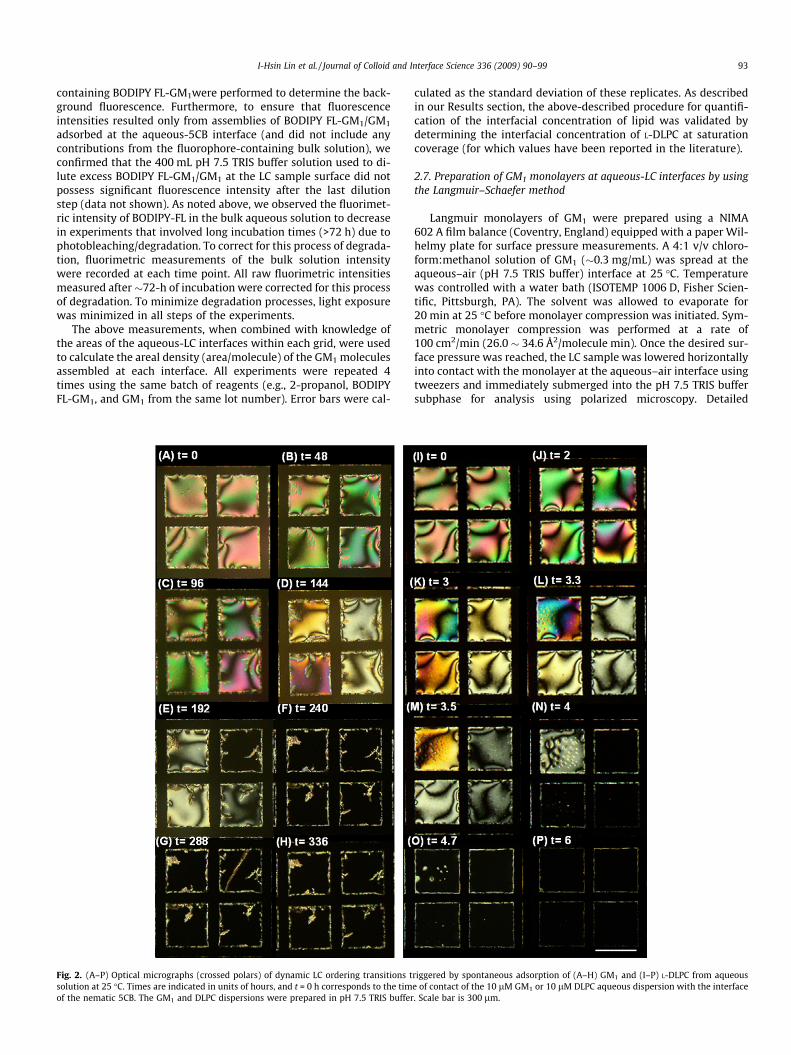
Fig. 2. (A–P) Optical micrographs (crossed polars) of dynamic LC ordering transitions tsolution at 25 �C. Times are indicated in units of hours, and t = 0 h corresponds to the timof the nematic 5CB. The GM1 and DLPC dispersions were prepared in pH 7.5 TRIS buffer
culated as the standard deviation of these replicates. As describedin our Results section, the above-described procedure for quantifi-cation of the interfacial concentration of lipid was validated bydetermining the interfacial concentration of L-DLPC at saturationcoverage (for which values have been reported in the literature).
2.7. Preparation of GM1 monolayers at aqueous-LC interfaces by usingthe Langmuir–Schaefer method
Langmuir monolayers of GM1 were prepared using a NIMA602 A film balance (Coventry, England) equipped with a paper Wil-helmy plate for surface pressure measurements. A 4:1 v/v chloro-form:methanol solution of GM1 (�0.3 mg/mL) was spread at theaqueous–air (pH 7.5 TRIS buffer) interface at 25 �C. Temperaturewas controlled with a water bath (ISOTEMP 1006 D, Fisher Scien-tific, Pittsburgh, PA). The solvent was allowed to evaporate for20 min at 25 �C before monolayer compression was initiated. Sym-metric monolayer compression was performed at a rate of100 cm2/min (26.0 � 34.6 Å2/molecule min). Once the desired sur-face pressure was reached, the LC sample was lowered horizontallyinto contact with the monolayer at the aqueous–air interface usingtweezers and immediately submerged into the pH 7.5 TRIS buffersubphase for analysis using polarized microscopy. Detailed
riggered by spontaneous adsorption of (A–H) GM1 and (I–P) L-DLPC from aqueouse of contact of the 10 lM GM1 or 10 lM DLPC aqueous dispersion with the interface. Scale bar is 300 lm.

Fig. 3. (A) Schematic illustration corresponding to Fig. 2A and I, showing theorientation of the nematic LC at the aqueous-LC and OTS-LC interfaces, and thedeformation of the LC induced by these boundary conditions. (B) Schematicillustration corresponding to Fig. 2H and P, showing the homeotropic orientation ofthe LC at the interface of the LC decorated with GM1 or DLPC. (C and D) Effective tiltangles of 5CB at the aqueous-LC interface estimated from interference colorsgenerated by the 5CB with white-light illumination. The tilt angles are plotted as afunction of time of adsorption of (C) GM1 and (D) DLPC, with each lipid present at aconcentration of 10 lM in pH 7.5 TRIS buffer.
94 I-Hsin Lin et al. / Journal of Colloid and Interface Science 336 (2009) 90–99
descriptions regarding the experimental setup used for the Lang-muir–Schaefer transfer can be found elsewhere [10].
3. Results and discussion
3.1. Spontaneous adsorption of GM1 onto aqueous-LC interfaces
Our initial experiments sought to determine if GM1 would ad-sorb spontaneously from bulk aqueous solution onto the interfaceof a LC and thereby trigger an ordering transition in the LC. We alsosought to determine whether or not the dynamic and equilibriumcharacteristics of LC ordering transitions triggered by GM1, if ob-served, would be similar to those reported previously for phospho-lipids such as L-DLPC [3,5,6,9,11,12]. To this end, we first contactednematic 5CB hosted within grids (see Section 2 for details) withaqueous dispersions of 10 lM GM1 (pH 7.5 TRIS buffer) at 25 �C.As shown in Fig. 2A–H, we recorded the optical appearance ofthe LC under crossed polars for 336 h (14 days). Immediately fol-lowing contact with the aqueous dispersion of GM1, the opticalappearance of the LC appeared colorful and bright (Fig. 2A). Thisoptical appearance of the LC is caused by orientations of the LC thatare illustrated in the cartoon shown in Fig. 3A. In brief, as describedin past studies [3,5,6,9,11,12], in the absence of adsorbates at theaqueous-LC interface, the orientation of 5CB is close to parallel tothe aqueous-LC interface. At the interface of the OTS-treated glass,the LC assumes a perpendicular orientation. These two boundaryconditions, when combined, result in the introduction of splayand bend distortions into the LC as the film of LC accommodatesthe two boundary conditions. The LC [2,4], when viewed underwhite-light illumination, possesses pale yellow-green and pinkhues due to interference effects caused by the birefringence ofthe LC. Variation in the azimuthal orientation of the 5CB resultsin the dark brush patterns evident in Fig. 2A within each compart-ment of the grids [2].
Inspection of Fig. 2A–H reveals that the optical appearance ofthe LC changed gradually from bright to dark during incubationagainst the aqueous dispersion of 10 lM GM1 for �240 h. Ortho-scopic and conoscopic examination of the sample shown inFig. 2F (see Section 2 for procedures) indicated that the LC hadslowly transitioned to a homeotropic orientation at the aqueous-LC interface during the 240 h (see Fig. 3B for a schematic illustra-tion). To further characterize the nature of the transition, we usedthe interference colors observed under white-light illumination tocalculate the tilt angle of the LC (orientation of the LC at the aque-ous-LC interface measured with respect to the surface normal, with0� corresponding to homeotropic alignment; detailed descriptionsof methods can be obtained from our past study [4]) during incu-bation against the aqueous dispersion of GM1 (Fig. 3C). Inspectionof Fig. 3C reveals that the change in the orientation of the LC oc-curred in two steps. Within the first 24 h, the tilt of the LC changedto 65�, and subsequently, between 100 and 200 h, a second contin-uous transition in the orientation to the homeotropic state oc-curred. Incubation of the LC against the aqueous dispersion ofGM1 for times longer than 240 h did not result in any furtherchanges in the orientation of the LC (see Fig. 2F–H, and Fig. 3C).
We interpret the results described above to indicate that GM1
does transfer spontaneously from aqueous dispersions onto theaqueous-LC interface, and that the GM1 present at the aqueous-LC interface does cause an ordering transition in the LC. The finalstate of the interface corresponds to the homeotropic orientationof the LC. Although the final homeotropic state of the GM1-ladeninterface of the LC is similar to that observed in past studies ofthe orientation of phospholipid-decorated interfaces of LCs [5,9],and thus suggests that the hydrophobic tails of the GM1 play a cen-tral role in defining the interactions of GM1 with the nematic LC,

Fig. 4. Quantification of BODIPY FL-GM1/GM1 adsorbed at aqueous-5CB interfacesby fluorescence measurements at 25 �C (10 lM GM1 in pH 7.5 TRIS buffer). (A) Plotof epifluorescence intensity generated by mixed BODIPY FL-GM1/GM1 assembliesadsorbed at the interface of nematic 5CB as a function of time. (B) Plot offluorimetric intensity generated by mixed BODIPY FL-GM1/GM1 assembliesadsorbed at the LC interface, and subsequently dissolved into 2-propanol forquantification. (C) Plot of the corresponding area per GM1 molecule at the LCinterface as a function of time, obtained using data shown in part B.
I-Hsin Lin et al. / Journal of Colloid and Interface Science 336 (2009) 90–99 95
we note here two important differences between the behaviors ofGM1 and phospholipids. First, past studies of the self-assembly ofL-DLPC (10 lM in 10 mM Tris (hydroxymethyl)-aminomethaneand 100 mM NaCl at pH 8.9, referred hereafter to as pH 8.9 TBSbuffer) at the aqueous-LC interface have reported that L-DLPC willtrigger an ordering transition of 5CB within 2 h [5,9]. In contrast,the dynamics of the 5CB ordering transition induced by contactwith the dispersion of GM1 (Fig. 2A–H) was surprising slow. Sec-ond, past observations of LC ordering transitions driven by L-DLPChave revealed that it can occur through a process that involves thenucleation and growth of domains of oriented LC: In contrast, frominspection of Fig. 2A–H, it is evident that the ordering transitiondriven by GM1 is a continuous one [9,10]. We note, however, thatthe above-described measurements with GM1 and L-DLPC wereperformed in different aqueous buffers.
In order to provide a more precise comparison of the character-istics of the ordering transitions of the LC induced by GM1 andL-DLPC, we performed measurements of the ordering of nematic5CB incubated against aqueous dispersions of L-DLPC preparedusing the same buffer as used in our measurements with GM1(pH7.5 TRIS buffer; Fig. 2A–H). Optical micrographs of the LC incu-bated against the L-DLPC are shown in Fig. 2I–P, and the tilt angleof the LC at the aqueous-LC interface is shown in Fig. 3D. We maketwo principal observations from these measurements. First, thetime-scale of the ordering transition induced by L-DLPC when dis-persed in pH 7.5 TRIS buffer is much shorter (�4 h) than that ob-served with GM1 (240 h). Second, consistent with pastmeasurements of the self-assembly of L-DLPC at the aqueous-LCinterface from pH 8.9 TBS buffer [5,9], the ordering transition ofthe LC induced by L-DLPC in pH 7.5 TRIS buffer involves domainsof oriented LC. Figure S3 of Supporting Information presents adirect comparison of the ordering transition of the LC induced byL-DLPC dissolved in the two buffers. Inspection of this Figure S3 re-veals relatively minor effects of the buffer, the most pronouncedeffect being a change in the rate of the ordering transition (the ratechanges by a factor of approximately 2).
The most striking difference between the behavior of GM1 andL-DLPC that emerges from the above-reported study is the slowerdynamics of the ordering transition induced by GM1, as comparedto L-DLPC. To provide a first perspective on the possible origins ofthe slow ordering transition induced by GM1, we calculated thetime for GM1 molecules present in bulk solution at a concentrationof 10 lM to diffuse to the aqueous-LC interface in quantity suffi-cient to saturate the interface with GM1 molecules. The calculateddiffusion time was �4 min, estimated as L2/2Dm where L = C/C andcorresponds to the diffusion distance, Dm is the diffusion coefficientof GM1 aggregates (micelles) obtained from light scattering mea-surements [43] (Dm = 3.7 � 10�6 cm2/s), C is the surface concentra-tion of GM1 molecules at the interface, and C is the concentrationof GM1 in the bulk solution. For this calculation, we estimatedthe density of GM1 molecules at the aqueous-LC interface to be� 40 Å
2=GM26
1 We note that the conclusion extracted from this cal-culation is not sensitive to the exact value of the interfacial densitythat we assumed. The main conclusion is that the ordering transi-tion of 5CB driven by GM1 is not controlled by diffusion-limitedtransport of GM1 to the interface.
3.2. Quantification of the interfacial concentration of BODIPY FL-GM1/GM1 at aqueous-LC interfaces via fluorescence measurements
We hypothesized that the slow ordering transition of the LC in-duced by spontaneous adsorption of GM1 from the bulk aqueousdispersion onto the aqueous-LC interface (�240 h) was due to slowkinetics of adsorption of GM1 from the bulk dispersion adjacent tothe interface. We note that GM1dispersed under the aqueous solu-tion conditions used in our study is known to form micellar aggre-
gates, and evolution of the aggregate structure and sizedistribution has been reported to occur slowly (over days) at roomtemperature [43,44]. To test the above-described hypothesis, weincorporated 1% BODIPY FL-GM1(Fig. 1) into a mixture of BODIPY

96 I-Hsin Lin et al. / Journal of Colloid and Interface Science 336 (2009) 90–99
FL-GM1 and GM1, and used epifluorescence intensity measure-ments, as described in Section 2, to record the rise in fluorescenceof the aqueous-LC interfaces at various time intervals followingcontact with the BODIPY FL-GM1/GM1. Inspection of Fig. 4A con-firms BODIPY FL-GM1/GM1 adsorption at the interface of the LC.Surprisingly, however, inspection of Fig. 4A suggests that the inter-facial concentration of the mixture of BODIPY FL-GM1 and GM1
reached near-saturation coverage (within experimental uncer-tainty) within �20 h. In contrast, as noted in Figs. 2 and 3, polar-ized light microscopy revealed the ordering transition of the LCto occur over �240 h following contact with the dispersion ofGM1. In particular, inspection of Fig. 3C shows that the orientationof the LC was nearly parallel to the interface after �20 h of incuba-tion in the aqueous dispersion of GM1.
Although the above-described measurements lead to the sug-gestion that the ordering transition of the LC lags substantially be-hind the adsorption of the GM1 onto the aqueous-LC interface,quantitative interpretation of fluorescence intensity measure-ments during adsorption processes should be interpreted cau-tiously because past studies have shown that BODIPY-labeledlipids possess concentration-dependent emission properties thatare consistent with dimer formation in both monolayer [45,46]and unilamellar vesicle [47,48] systems. For example, Dahimet al. have demonstrated that if the BODIPY monomers are suffi-ciently close (critical radius is 25.9 ± 1.8 Å) within a fluid mono-layer at the time of excitation, excited dimers of BODIPY willform and the monomer emission at 515 nm will be progressivelyreplaced by the dimer emission at �620 nm [45]. To address pos-sible artifacts associated with dimer formation in the epifluore-sence measurements shows in Fig. 4A, we pursued a secondmethodology based on fluorescence measurements wherein thelipids adsorbed at the aqueous-LC interface were extracted, andquantified after dissolution into an organic solvent (see Section 2for the details). This method had two advantageous attributes.First, dilution of BODIPY FL-GM1 into the organic solvent avoidedthe potential for dimer formation. Second, the methodology ledto an estimate of the absolute density of BODIPY FL-GM1 moleculesat the aqueous-LC interface.
To validate the second methodology, we first used it to quantifythe interfacial concentration of L-DLPC within monolayers ad-sorbed at the aqueous-5CB interface, as determined previouslyby Brake and coworkers [4–6,9] (see Supporting Information).The fluorimetric results revealed that at saturation coverage, theareal density of the L-DLPC at the interface was 48 ± 10 Å2/L-DLPC.This value is in reasonable agreement with the area occupied by L-DLPC at the air–water interface within condensed monolayers[10,49–53]. In addition, recent experiments by Meli and coworkersused the Langmuir–Schaefer method to transfer monolayers of L-DLPC from the aqueous–air interface onto the aqueous-5CB inter-face. These experiments revealed that monolayers of L-DLPC withan area density between 45 and 56 Å2/L-DLPC molecule causedhomeotropic ordering of L-DLPC (consistent with our experimentalresults) [10].
Fig. 4B shows a plot of the fluorimetric intensity of mixtures ofBODIPY FL-GM1 and GM1 extracted from the aqueous-LC interface,as a function of time of incubation of the LC against the GM1disper-sion (at 25 �C). As can be seen in Fig. 4B, the fluorimetric intensityof the extracted BODIPY FL-GM1/GM1reached a saturation valuewithin 24 h of incubation. This result is consistent with epifluores-cence measurements shown in Fig. 4A, suggesting that the satura-tion of the epifluoresence intensity in Fig. 4A was not an artifactassociated with dimer formation. We note that the uncertaintiesin the values of the fluorescence intensity shown in Fig. 4B are sub-stantial, limiting the precision with which we can define the timeat which saturation coverage of the interface takes place. We sus-pect that variation in the shape of the LC-aqueous meniscus leads
to variation in the LC interfacial area, and thus capacity of theinterface to adsorb the lipid. By combining the calibration plotshown in Figure S1 with the mean value of the fluorimetric inten-sity shown in Fig. 4B in the limit of long adsorption times, we cal-culate the limiting area density of GM1 at the aqueous-LC interfaceto be 50 ± 12 Å2/GM1. This mean area density is similar to the den-sity of GM1 at the air–aqueous interface at which surface pressure-area isotherms indicate densely-packed, condensed monolayers ofGM1 to form [17,54–56]. Past studies have reported that GM1
forms a densely-packed monolayer at �50 to 62 Å2/GM1 moleculeand a tilted, condensed monolayer at �62 to 71 Å2/GM1moleculewithin Langmuir films (26 �C and a subphase pH of 5.6) [56], fol-lowing the definitions described by Kaganer et al. [57].
The results above lead us to conclude that a relatively high sur-face concentration of GM1 (52 ± 14 Å2/GM1) at the aqueous-LCinterface is achieved within �24 h of placement of the LC into con-tact with the aqueous dispersion of GM1; further incubation of theLC against the GM1 dispersion does not result in a measurable in-crease in the surface concentration of GM1 (50 ± 12 Å2/GM1),whereas the ordering of the LCs changes over 9 days of subsequentincubation. The above described observations led us to considerseveral possible physical scenarios. First, we considered it possiblethat the slow ordering transition of the LC was triggered by thevery final stages of adsorption of the GM1, which leads to changesin surface concentrations of GM1 that lie beyond the precision ofthe methods we have developed to determine the surface concen-trations. Second, we considered it possible that the adsorbed GM1
undergoes a slow ordering process at the interface, and that an or-dered state of the GM1 triggers the ordering transition in the LC.Below, we report experiments that were performed to distinguishbetween these two scenarios.
3.3. GM1 adsorption and LC anchoring transitions at the aqueous-LCinterface
The first experiment we performed sought to find evidence forthe second physical scenario, in which ordering of the adsorbedGM1 controls the rate of the LC ordering transition. To this end,we incubated the LC against an aqueous dispersion of 10 lMGM1 at 25 �C for 24 h and then physically transferred the LC intoa lipid-free buffer solution. Through transfer of the GM1-ladenaqueous-5CB interface into the pH 7.5 TRIS buffer, we eliminatedthe possibility of additional GM1 adsorption. We hypothesized thatif the slow ordering of the LC was due to a process that involved theordering of adsorbed GM1 at the interface, the ordering transitionof the LC in the above experiment would be similar to that shownin Fig. 2. It was not. After transfer of the GM1-decorated LC inter-face to the lipid-free buffer, we observed the LC to remain in an ori-entation that was nearly parallel to the interface (at 25 �C) for thesubsequent �240 h. This result suggests that additional adsorptionof GM1 to the interface of the LC occurs during the prolonged incu-bation of the LC interface against the dispersion of GM1, and thatthe final stages of the adsorption process leading to saturation ofthe GM1-laden interface is a slow process that regulates thedynamics of the LC ordering transition.
The above-mentioned results suggest that the rate of adsorptionof GM1 is much lower than for L-DLPC. We note that past studies ofgangliosides and phospholipids have demonstrated that they differsubstantially in their self-assembly behavior in bulk solution and atinterfaces. The sialic acid moiety of the head group of GM1 gives theganglioside a negative charge near neutral pH [14,58]. The resultingelectrostatic interactions influence the phase behavior of GM1 bothin aqueous dispersions and in monolayers formed at air–waterinterfaces (as evidenced in surface pressure-area isotherms andmeasurements of bulk phase transition temperatures Tm, from agel phase to a fluid phase) [59]. When compared with DPPC (with

Fig. 5. (A) Surface pressure-area isotherm measured at 25 �C for a Langmuir film ofGM1 formed on an aqueous subphase comprising pH 7.5 TRIS buffer. Squares depictsurface pressure-area conditions under which Langmuir–Schaefer transfer to the LCinterface was performed. (B–J) Polarized light micrographs of nematic 5CB afterLangmuir–Shaefer transfer of GM1 monolayers (prepared at the indicated surfacepressure) to the interface of the LC. Scale bar is 300 lm.
I-Hsin Lin et al. / Journal of Colloid and Interface Science 336 (2009) 90–99 97
two saturated C16 chains) [60], dilauroylphosphatidylcholine(DLPC, with two saturated C12 chains) [10,49–53], and diol-eoylphosphatidylcholine (DOPC, with two symmetric unsaturatedC18 chains) [61], the surface pressure-area isotherm of GM1 has alarger collapse pressure and the liquid-expanded (LE)/liquid-con-densed(LCD) phase coexistence region is observed at higher surfacepressure [54]. The higher collapse and LE/LCD phase coexistencepressures of the GM1 isotherm suggests that intermolecular GM1
interactions within a well-packed monolayer are more repulsivethan with phospholipids, and thus the kinetics of adsorption ofGM1 at the aqueous-LC interface may be slower than for DLPCand other zwitterionic phospholipids.
3.4. Langmuir–Schaefer transfer of monolayers of GM1 from theaqueous–air interface to the aqueous-LC interface
The results above suggest that the slow ordering transition ofthe LC induced by GM1 is due to a slow rate of adsorption ofGM1 to the aqueous-LC interface during spontaneous transfer froman aqueous dispersion of GM1. To further test this proposition, wehypothesized that processes that would lead to accelerated rates oftransfer of GM1 onto the aqueous-LC interface would lead to morerapid ordering transitions of the LC. Here we report the use of theLangmuir–Schaefer transfer technique, as described recently byMeli et al. [10,11], to rapidly transfer preformed, high density mon-olayers of GM1 onto the aqueous interface of the LC. Fig. 5A showsthe surface pressure-area isotherm for GM1 within a Langmuirmonolayer, with data points indicating the areal densities of GM1
at which monolayers of GM1 were transferred to the interface ofthe LC. Fig. 5B–J show optical micrographs (crossed polars) of theLC after transfer of the preformed GM1 monolayers onto the inter-face of the LC. Inspection of Fig. 5B–E reveals that liquid-condensedmonolayers of GM1 (< 53 Å2/GM1 molecule) cause homeotropicordering of the LC within 1 min of transfer onto the interface ofthe LC. Tilted states of the LC were observed when the density ofGM1 at the interface of the LC was between 53 and 58 Å2/GM1
(Fig. 5F and G). Finally, liquid-condensed/liquid-expanded mono-layers of GM1 (>58 Å2/GM1molecule) resulted in near-planar align-ment of the LC. Because homeotropic ordering of the LC wasobserved almost immediately following transfer of the preformeddensely-packed monolayer of GM1 onto the LC, these results sup-port our hypothesis that the slow ordering transition of the LC ob-served during spontaneous adsorption of GM1 is due to a slowadsorption process leading to completion of the GM1 monolayer.
3.5. Influence of temperature on the adsorption of GM1 to aqueous-LCinterfaces
Past studies have demonstrated by using differential scanningcalorimetry (DSC) measurements that hydrated GM1 undergoes abroad endothermic phase transition at 26 �C [59,62,63]. In multi-layer systems formed by GM1 below the phase transition temper-ature, the mobility of the GM1 was low. Above the phase transitiontemperature, the tails of the GM1 showed increased degrees offreedom, as is typically for the so-called La phase [64]. Becausethe measurements described above lead to the conclusion thatthe slow ordering transition of GM1 is due to a slow adsorptionprocess, and given that our measurements were performed at25 �C (below the above-mentioned phase transition temperatureof GM1), we investigated the influence of temperature on GM1
adsorption at the LC interface. We sought to determine if the phasestate of GM1 in the aqueous dispersions played a central role in theslow adsorption process that we noted above. Fig. 6 reveals thatthe temperature of the GM1 dispersion does play a key role inthe dynamics of the ordering transition. Specifically, we observeda threshold time that characterized the planar-to-homeotropic
ordering transition (defined as the time required for LC within atleast 6 of 40 grid squares in the Au grid to turn homeotropic) de-creased dramatically above 25 �C (Fig. 6). We further note thatthe liquid crystal 5CB is nematic at 25 �C, and that it undergoes abulk phase transition from a nematic phase to an isotropic phaseat 35 �C [65,66]. Because of this phase transition, the data reportedin Fig. 6 at temperatures above 35�C was obtained by cooling the5CB to room temperature just before observation of the orientationof the LC. Overall, the results in Fig. 6 strongly support our propo-sition that the phase state of GM1 plays a central role in the rate ofadsorption of GM1, and thus the dynamics of the ordering transi-tion of the LC. This result is consistent with past reports of theadsorption of phospholipids. Whereas dispersions of L-DLPC
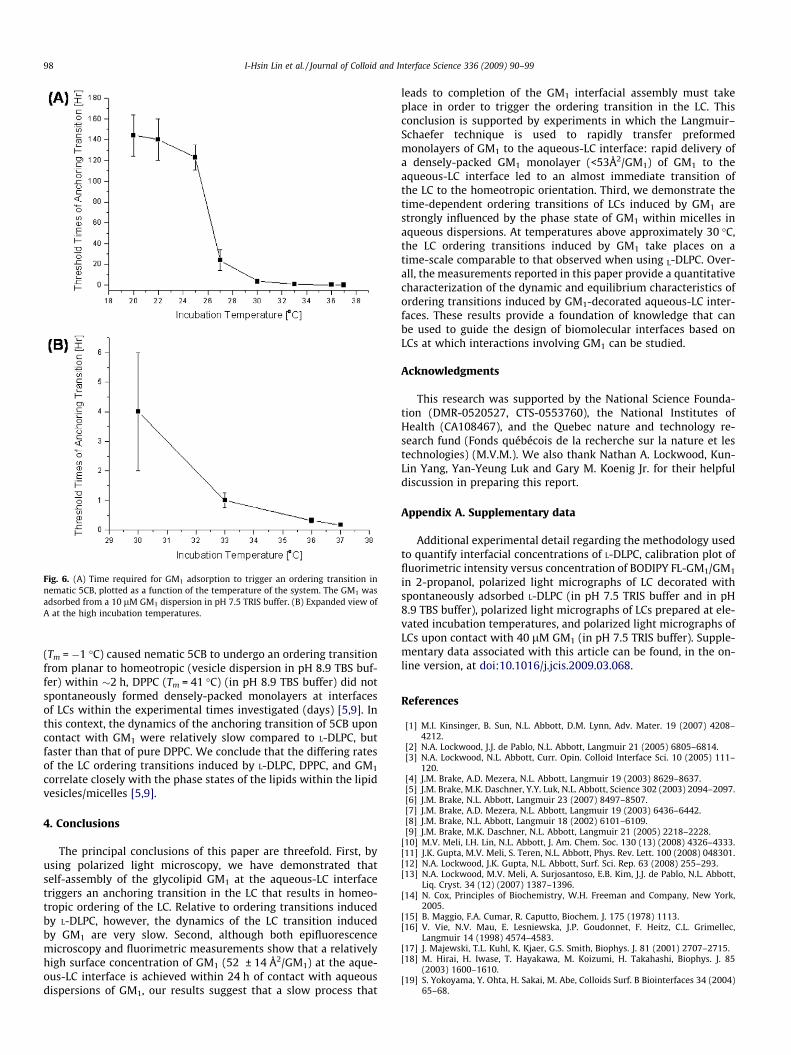
Fig. 6. (A) Time required for GM1 adsorption to trigger an ordering transition innematic 5CB, plotted as a function of the temperature of the system. The GM1 wasadsorbed from a 10 lM GM1 dispersion in pH 7.5 TRIS buffer. (B) Expanded view ofA at the high incubation temperatures.
98 I-Hsin Lin et al. / Journal of Colloid and Interface Science 336 (2009) 90–99
(Tm = �1 �C) caused nematic 5CB to undergo an ordering transitionfrom planar to homeotropic (vesicle dispersion in pH 8.9 TBS buf-fer) within �2 h, DPPC (Tm = 41 �C) (in pH 8.9 TBS buffer) did notspontaneously formed densely-packed monolayers at interfacesof LCs within the experimental times investigated (days) [5,9]. Inthis context, the dynamics of the anchoring transition of 5CB uponcontact with GM1 were relatively slow compared to L-DLPC, butfaster than that of pure DPPC. We conclude that the differing ratesof the LC ordering transitions induced by L-DLPC, DPPC, and GM1
correlate closely with the phase states of the lipids within the lipidvesicles/micelles [5,9].
4. Conclusions
The principal conclusions of this paper are threefold. First, byusing polarized light microscopy, we have demonstrated thatself-assembly of the glycolipid GM1 at the aqueous-LC interfacetriggers an anchoring transition in the LC that results in homeo-tropic ordering of the LC. Relative to ordering transitions inducedby L-DLPC, however, the dynamics of the LC transition inducedby GM1 are very slow. Second, although both epifluorescencemicroscopy and fluorimetric measurements show that a relativelyhigh surface concentration of GM1 (52 ± 14 Å2/GM1) at the aque-ous-LC interface is achieved within 24 h of contact with aqueousdispersions of GM1, our results suggest that a slow process that
leads to completion of the GM1 interfacial assembly must takeplace in order to trigger the ordering transition in the LC. Thisconclusion is supported by experiments in which the Langmuir–Schaefer technique is used to rapidly transfer preformedmonolayers of GM1 to the aqueous-LC interface: rapid delivery ofa densely-packed GM1 monolayer (<53Å2/GM1) of GM1 to theaqueous-LC interface led to an almost immediate transition ofthe LC to the homeotropic orientation. Third, we demonstrate thetime-dependent ordering transitions of LCs induced by GM1 arestrongly influenced by the phase state of GM1 within micelles inaqueous dispersions. At temperatures above approximately 30 �C,the LC ordering transitions induced by GM1 take places on atime-scale comparable to that observed when using L-DLPC. Over-all, the measurements reported in this paper provide a quantitativecharacterization of the dynamic and equilibrium characteristics ofordering transitions induced by GM1-decorated aqueous-LC inter-faces. These results provide a foundation of knowledge that canbe used to guide the design of biomolecular interfaces based onLCs at which interactions involving GM1 can be studied.
Acknowledgments
This research was supported by the National Science Founda-tion (DMR-0520527, CTS-0553760), the National Institutes ofHealth (CA108467), and the Quebec nature and technology re-search fund (Fonds québécois de la recherche sur la nature et lestechnologies) (M.V.M.). We also thank Nathan A. Lockwood, Kun-Lin Yang, Yan-Yeung Luk and Gary M. Koenig Jr. for their helpfuldiscussion in preparing this report.
Appendix A. Supplementary data
Additional experimental detail regarding the methodology usedto quantify interfacial concentrations of L-DLPC, calibration plot offluorimetric intensity versus concentration of BODIPY FL-GM1/GM1
in 2-propanol, polarized light micrographs of LC decorated withspontaneously adsorbed L-DLPC (in pH 7.5 TRIS buffer and in pH8.9 TBS buffer), polarized light micrographs of LCs prepared at ele-vated incubation temperatures, and polarized light micrographs ofLCs upon contact with 40 lM GM1 (in pH 7.5 TRIS buffer). Supple-mentary data associated with this article can be found, in the on-line version, at doi:10.1016/j.jcis.2009.03.068.
References
[1] M.I. Kinsinger, B. Sun, N.L. Abbott, D.M. Lynn, Adv. Mater. 19 (2007) 4208–4212.
[2] N.A. Lockwood, J.J. de Pablo, N.L. Abbott, Langmuir 21 (2005) 6805–6814.[3] N.A. Lockwood, N.L. Abbott, Curr. Opin. Colloid Interface Sci. 10 (2005) 111–
120.[4] J.M. Brake, A.D. Mezera, N.L. Abbott, Langmuir 19 (2003) 8629–8637.[5] J.M. Brake, M.K. Daschner, Y.Y. Luk, N.L. Abbott, Science 302 (2003) 2094–2097.[6] J.M. Brake, N.L. Abbott, Langmuir 23 (2007) 8497–8507.[7] J.M. Brake, A.D. Mezera, N.L. Abbott, Langmuir 19 (2003) 6436–6442.[8] J.M. Brake, N.L. Abbott, Langmuir 18 (2002) 6101–6109.[9] J.M. Brake, M.K. Daschner, N.L. Abbott, Langmuir 21 (2005) 2218–2228.
[10] M.V. Meli, I.H. Lin, N.L. Abbott, J. Am. Chem. Soc. 130 (13) (2008) 4326–4333.[11] J.K. Gupta, M.V. Meli, S. Teren, N.L. Abbott, Phys. Rev. Lett. 100 (2008) 048301.[12] N.A. Lockwood, J.K. Gupta, N.L. Abbott, Surf. Sci. Rep. 63 (2008) 255–293.[13] N.A. Lockwood, M.V. Meli, A. Surjosantoso, E.B. Kim, J.J. de Pablo, N.L. Abbott,
Liq. Cryst. 34 (12) (2007) 1387–1396.[14] N. Cox, Principles of Biochemistry, W.H. Freeman and Company, New York,
2005.[15] B. Maggio, F.A. Cumar, R. Caputto, Biochem. J. 175 (1978) 1113.[16] V. Vie, N.V. Mau, E. Lesniewska, J.P. Goudonnet, F. Heitz, C.L. Grimellec,
Langmuir 14 (1998) 4574–4583.[17] J. Majewski, T.L. Kuhl, K. Kjaer, G.S. Smith, Biophys. J. 81 (2001) 2707–2715.[18] M. Hirai, H. Iwase, T. Hayakawa, M. Koizumi, H. Takahashi, Biophys. J. 85
(2003) 1600–1610.[19] S. Yokoyama, Y. Ohta, H. Sakai, M. Abe, Colloids Surf. B Biointerfaces 34 (2004)
65–68.

I-Hsin Lin et al. / Journal of Colloid and Interface Science 336 (2009) 90–99 99
[20] R. Wang, J. Shi, A.N. Parikh, A.P. Shreve, L. Chen, B.I. Swanson, Colloids Surf. BBiointerfaces 33 (2004) 45–51.
[21] Y. Ohta, S. Yokoyama, H. Sakai, M. Abe, Colloids Surf. B Biointerfaces 33 (2004)191–197.
[22] R.E. Brown, J. Cell Sci. 111 (1998) 1–9.[23] S. van Heyningen, Science 183 (1974) 656–657.[24] P.F. Luckham, K. Smith, Faraday Discuss. 111 (1998) 307–320.[25] G.M. Kuziemko, M. Stroh, R.C. Stevens, Biochemistry 35 (1996) 6375–6384.[26] C.E. Miller, J. Majewski, R. Faller, S. Satija, T.L. Kuhl, Biophys. J. 86 (2004) 3700–
3708.[27] W.B. Turnbull, B.L. Precious, S.W. Homans, J. Am. Chem. Soc. 126 (2004) 1047–
1054.[28] S. Vengasandra, G. Sethumadhavan, F. Yan, R. Wang, Langmuir 19 (2003)
10940–10946.[29] W.I. Lencer, T.R. Hirst, R.K. Holmes, Biochim. Biophys. Acta 1450 (1999) 177–
190.[30] W.L. Picking, H. Moon, H. Wu, W.D. Picking, Biochim. Biophys. Acta 1247
(1995) 65–73.[31] I.R. Miller, H. Vinkler, E. Yavin, Bioelectrochem. Bioenerg. 22 (1989) 365–377.[32] A. Schon, E. Freire, Biochemistry 28 (1989) 5019–5024.[33] H.O. Ribi, D.S. Ludwig, K.L. Mercer, G.K. Schoolnik, R.D. Kornberg, Science 239
(1988) 1272.[34] B.J. Wisnieski, J.S. Bramhall, Nature 289 (1981) 319–321.[35] P.H. Fishman, J. Moss, J.J.C. Osborne, Biochemistry 17 (1978) 711–716.[36] Y. Fang, A.G. Frutos, J. Lahiri, Langmuir 19 (2003) 1500–1505.[37] J.S. Park, N.L. Abbott, Adv. Mater. 20 (2008) 1185–1190.[38] J.J. Skaife, N.L. Abbott, Chem. Mater. 11 (1999) 612–623.[39] J. Cognard, Mol. Cryst. Liq. Cryst. 1 (1982) 1.[40] J.Y. Yang, K. Mathauer, C.W. Frank, Microchemistry: Spectroscopy and
Chemistry in Small Domains, In: H. Masuhara (Ed.), Elsevier, Science B.V.,New York, 1994.
[41] F.D. Bloss, An Introduction to the Methods of Optical Crystallograpy, Holt,Rinehart and Winston, New York, 1961.
[42] P.S. Cremer, S.G. Boxer, J. Phys. Chem. 103 (13) (1999) 2554–2559.[43] M. Corti, L. Cantu, P. Salina, Adv. Colloid Interface Sci. 36 (1991) 153–171.[44] D. Orthaber, O. Glatter, Chem. Phys. Lipids 92 (1998) 53–62.
[45] M. Dahim, N.K. Mizuno, X.M. Li, W.E. Momsen, M.M. Momsen, H.L. Brockman,Biophys. J. 83 (3) (2002) 1511–1524.
[46] I. Mikhalyov, N. Gretskaya, F. Bergstrom, L.B.A. Johansson, Phys. Chem. Chem.Phys. 4 (2002) 5663–5670.
[47] R.E. Pagano, O.C. Martin, H.C. Kang, R.P. Haugl, J. Cell Biol. 113 (1991) 1267–1279.
[48] D. Tleugabulova, Z. Zhang, J.D. Brennan, J. Phys. Chem. B 106 (2002) 13133–13138.
[49] T.L. Phang, Y.C. Liao, E.I. Franses, Langmuir 20 (10) (2004) 4004–4010.[50] S. Kim, H. Yu, J. Phys. Chem. 96 (10) (1992) 4034–4040.[51] K. Tamada, S. Kim, H. Yu, Langmuir 9 (6) (1993) 1545–1550.[52] T. Thuren, J.A. Virtanen, P.K.J. Kinnunen, Chem. Phys. Lipids 53 (1990) 129–
139.[53] A. Pinazo, M.R. Infante, S.Y. Park, E.I. Franses, Colloids Surf. B Biointerfaces 8
(1996) 1–11.[54] I.R. Gomez-Serranillos, J. Minones, P. Dynarowicz-Latka, E. Iribarnegaray, M.
Casas, Colloids Surf. B Biointerfaces 41 (2005) 63–72.[55] C.M. Rosetti, R.G. Oliveria, B. Maggio, Langmuir 19 (2) (2003) 377–387.[56] P. Luckham, J. Wood, S. Froggatt, R. Swart, J. Colloid Interface Sci. 156 (1993)
164–172.[57] V.M. Kaganer, H. Mohwald, P. Dutta, Rev. Modern Phys. 71 (3) (1999) 779–819.[58] B. Alberts, D. Bray, J. Lewis, M. Raff, K. Roberts, J.D. Watson, Molecular Biology
of the Cell, Garland Publishing Inc., New York & Landon, 1994.[59] B. Maggio, T. Ariga, J.M. Sturtevant, R.K. Yu, Biochemistry 24 (1985) 1084–
1092.[60] U. Kuhnau, B. Madler, S. Wurlitzer, G. Rapp, H. Schmiedel, Mol. Cryst. Liquid
Cryst. 304 (1997) 171–178.[61] M. Bohorquez, L.K. Patterson, Langmuir 6 (1990) 1739–1742.[62] R.A. Reed, G.G. Shipley, Biophys. J. 70 (1996) 1363.[63] W. Curatolo, D.M. Small, G.G. Shipley, Biochim. Biophys. Acta Biomembr. 468
(1977) 11.[64] N. Garti, Thermal Behavior of Dispersed Systems, Marcel Dekker Inc., New
York, 2001.[65] P.J. Collings, M. Hird, Introduction to Liquid Crystals, Taylor & Francis Ltd.,
Philadelphia, 1997.[66] Y.Y. Luk, S.F. Campbell, N.L. Abbott, C.J. Murphy, Liq.Cryst. 31 (2004) 611.