Embed Size (px)
Citation preview

1
Notice of Meeting Notice is hereby given that the Annual General Meeting of shareholders of Equity Trustees Limited will be held at the RACV Club, Level 2, 501 Bourke Street, Melbourne on Friday 27 November 2015 at 11.00am. Ordinary Business 1. To receive and consider the financial statements and the reports of the directors and auditor for the year
ended 30 June 2015. 2. To adopt the remuneration report for the year ended 30 June 2015. 3. To consider the election of directors:
a) Ms Alice Williams retires in accordance with Rule 49 of the Company’s Constitution and, being an
eligible person, offers herself for re-election
b) Mr Kevin Eley retires in accordance with Rule 49 of the Company’s Constitution and, being an eligible person, offers himself for re-election
Special Business 4. To consider and, if thought fit, pass the following resolution as an ordinary resolution:
"That approval is given for the grant to the Managing Director, Mr Robin Burns, of an Award to receive ordinary shares in the Company as described in the Explanatory Notes to the notice convening this meeting, and that such approval be given for the purpose of ASX Listing Rule 10.14 and for all other purposes."
575 Bourke Street By Order of the Board Melbourne Philip Maddox 19 October 2015 Company Secretary
For
per
sona
l use
onl
y

2
Eligibility to Vote For the purpose of voting at the Annual General Meeting, the Directors have determined that all shares in the Company are taken to be held by the persons who are registered as holding them at 7.00 pm (Melbourne time) on Wednesday 25 November 2015. The entitlement of shareholders to vote at the Annual General Meeting will be determined by reference to that time. Voting Exclusions The Corporations Act 2001 (Cth) (Corporations Act) and the ASX Listing Rules require that certain persons must not vote, and the Company must disregard any votes cast by such persons, on two of the resolutions to be considered at the Annual General Meeting. These voting exclusions are described below: Item 2: Adoption of the Remuneration Report for the year ended 30 June 2015 A member of the key management personnel for the EQT consolidated group (each a KMP) whose remuneration details are included in the Remuneration Report (and any closely related party of any such KMP), must not vote, and the Company will disregard any votes cast by that person, on the resolution in item 2 (Resolution 2). A KMP as at the date of the Annual General Meeting (and any closely related party of any such KMP) whose remuneration details are not included in the Remuneration Report, and who is appointed as a proxy, must not vote in that capacity, and the Company will disregard any votes cast by that person in that capacity, on Resolution 2. However, in relation to both circumstances contemplated above, a KMP (and any closely related party of any such KMP), may cast a vote on Resolution 2 as a proxy if the vote is not cast on behalf of a KMP whose remuneration details are included in the Remuneration Report (or a closely related party of any such KMP) and either:
• that person is appointed a proxy by writing that specifies the way the proxy is to vote on the resolution; or
• that person is the Chairman of the Annual General Meeting and the appointment of the Chairman as proxy:
− does not specify the way the proxy is to vote on the resolution; and
− expressly authorises the Chairman to exercise the proxy even if the resolution is connected directly or indirectly with the remuneration of a KMP for the EQT consolidated group.
Item 4: Approval of Long-term Incentive Award for Managing Director
The following persons may not vote, and the Company will disregard any votes cast by the following persons, on the resolution proposed in item 4 (Resolution 4):
• Mr Robin Burns and any of his associates. However, the Company need not disregard a vote if:
− it is cast by a person as proxy for a person who is entitled to vote, in accordance with the directions on the proxy form; or
− it is cast by the Chairman of the Annual General Meeting as proxy for a person who is entitled to vote, in accordance with a direction on the proxy form to vote as the proxy decides.
• A KMP (or a closely related party of any KMP), on the basis of their appointment as a proxy, where the proxy appointment does not specify the way the proxy is to vote on Resolution 4 , unless:
For
per
sona
l use
onl
y

3
− the proxy is the Chairman of the Annual General Meeting; and
− the proxy appointment expressly authorises the Chairman to exercise the proxy even if Resolution 4 is connected directly or indirectly with the remuneration of a KMP.
For the purposes of these voting exclusions:
The 'key management personnel for the EQT consolidated group' (or KMPs) are those persons having authority and responsibility for planning, directing and controlling the activities of the EQT consolidated group either directly or indirectly. It includes all Directors (Executive and Non-Executive). The KMPs during the year ended 30 June 2015 are listed in the Remuneration Report contained in the Directors' Report for the year ended 30 June 2015.
A 'closely related party' of a KMP means:
• a spouse or child of the KMP; or
• a child of the KMP’s spouse; or
• a dependant of the KMP or of the KMP’s spouse; or
• anyone else who is one of the KMP’s family and may be expected to influence the KMP, or be influenced by the KMP, in the KMP’s dealings with the EQT consolidated group; or
• a company the KMP controls.
The Company will also apply these voting exclusions, on an equivalent basis, to persons appointed as attorney by a shareholder to attend and vote at the Annual General Meeting under a power of attorney. Proxies A shareholder of the Company entitled to attend and vote at the Annual General Meeting has the right to appoint a Proxy. The Proxy Form must be signed by the shareholder or by an attorney of the shareholder A Proxy need not be a shareholder of the Company. If the shareholder is entitled to cast two or more votes at the meeting, the shareholder may appoint two Proxies and may specify the proportion or number of votes each proxy is appointed to exercise. If the shareholder appoints two proxies and the appointment does not specify the proportion or number of the shareholder’s votes each Proxy may exercise, each Proxy may exercise half the votes. A Proxy Form accompanies this Notice of Meeting. For the appointment of a proxy to be effective for the meeting, the Proxy Form must be received at least 48 hours before the meeting by the Share Registry of the Company, by mail (reply paid envelope enclosed): Computershare Investor Services Pty Limited, GPO Box 242, Melbourne Victoria 3001, by hand: Computershare Investor Services Pty Limited, located at Yarra Falls, 452 Johnston Street, Abbotsford, Victoria, 3067, or the Company’s Registered Office at Level 2, 575 Bourke Street, Melbourne, or by fax on (within Australia) 1800 783 447 or (outside Australia) +61 3 9473 2555.
For
per
sona
l use
onl
y

4
ONLINE VOTING To be valid, the proxy form, and any authority under which the form is signed, must be received by the Company or the Company’s Share Registry prior to 11.00am (AEDT) on 25 November 2015 Vote online: www.investorvote.com.au A shareholder may submit their proxy online by using their smartphone or by visiting www.investorvote.com.au. To use this option, you will need your Securityholder Reference Number (SRN) or Holder Identification Number (HIN) and your allocated Control Number as shown on your proxy form. You will be taken to have signed the proxy form if you lodge it in accordance with the instructions on the website. To use your smartphone voting service, scan the QR code which appears on the top of your proxy form and follow the instructions provided. To scan the code you need to have already downloaded a free QR code reader app to your smartphone. When scanned, the QR code will take you directly to the mobile voting site. A proxy cannot be appointed electronically if they are appointed under a Power of Attorney or similar authority. The online proxy facility may not be suitable for shareholders who wish to appoint two proxies with different voting directions. Please read the instructions for online proxy submissions carefully before you lodge your proxy. Undirected Proxies The Chairman of the Annual General Meeting intends to vote undirected proxy votes in favour of all resolutions (subject to the voting exclusions noted above). Voting by Corporate Representative A shareholder or proxy which is a corporation and entitled to attend and vote at the Annual General Meeting may appoint an individual to act as its corporate representative. Evidence of the appointment of a corporate representative must be in accordance with section 250D of the Corporations Act and be lodged with the Company before the Annual General Meeting or at the registration desk on the day of the Annual General Meeting. Voting by Attorney A shareholder entitled to attend and vote at the Annual General Meeting is entitled to appoint an attorney to attend and vote at the Annual General Meeting on the shareholder's behalf. An attorney need not themselves be a shareholder. The power of attorney appointing the attorney must be signed and specify the name of each of the shareholder, the Company and the attorney, and also specify the meeting(s) at which the appointment may be used. The appointment may be a standing one. To be effective, the power of attorney must also be returned in the same manner, and by the same time, as specified for Proxy Forms. Evidence of execution If a Proxy Form or appointment of a corporate representative is signed on behalf of an individual or a corporation under power of attorney or other authority, the power of attorney or other authority under which the relevant instrument is signed, or a copy of that power of attorney or other authority, certified as a true copy by statutory declaration, must accompany the instrument unless the power of attorney or other authority has previously been noted by the Company's Share Register.
For
per
sona
l use
onl
y

5
Shareholder Questions Shareholders entitled to vote at the meeting may submit written questions for the Chairman of the Annual General Meeting or the auditor. Please note that any questions to the auditor must be relevant to the content of the Auditor’s Report or the conduct of the audit of the Company’s consolidated financial report for the year ended 30 June 2015. To allow time to collate questions and prepare answers, submitted written questions need to be received by the registry by 5.00 pm on 20 November 2015. EXPLANATORY NOTES Item 2: Adoption of Remuneration report for the year ended 30 June 2015 The Remuneration Report of the Company for the financial year ended 30 June 2015 forms part of the Directors’ Report and is set out on pages 2 to 15 of the Company’s 2015 Annual Report, which is available on the Company’s website at www.eqt.com.au. Shareholders will be given reasonable opportunity at the Meeting to ask questions about, and comment on, the Remuneration Report. A 25% or higher “no” vote on the Remuneration Report at an AGM triggers a reporting obligation on a listed company to explain in its next Annual Report how concerns are being addressed. The Board encourages shareholders to read the 2015 Remuneration Report and vote on this important resolution. Item 3: Election of Directors
a) Ms Alice Williams retires by rotation and offers herself for re-election. The Board, other than Ms Williams, has reviewed Ms Williams’ performance. The Board believes that Ms Williams has performed well and continues to make a valuable contribution to the Board. The Board concluded that Ms Williams should be proposed for re-election and accordingly recommends that you vote in favour of Ms Williams’ re-election. Ms Williams is currently a director of Guild Group Holdings Limited, Defence Health, Djerriwarrh Investments Limited, Port of Melbourne Corporation, Cooper Energy, Barristers’ Chambers Limited and the Foreign Investment Review Board. Further biographical information is available in the 2015 Annual Report.
b) Mr Kevin Eley retires by rotation and offers himself for re-election.
The Board, other than Mr Eley, has reviewed Mr Eley’s performance. The Board believes that Mr Eley has performed well and continues to make a valuable contribution to the Board. The Board concluded that Mr Eley should be proposed for re-election and accordingly recommends that you vote in favour of Mr Eley’s re-election. Mr Eley is currently a director of Milton Corporation Limited, HGL Limited, PO Valley Energy Limited and Hunter Hall International Limited. Further biographical information is available in the 2015 Annual Report.
For
per
sona
l use
onl
y

6
Item 4: Long-Term Incentive Award for the Managing Director, Mr Robin Burns In 1999, shareholders approved the establishment of the Equity Trustees Limited Executive Performance Share Plan 1999 (the Plan). In broad terms, the Plan provides for the Company to grant certain rights (Awards) to eligible executives and to be issued ordinary shares in the Company if certain performance criteria are satisfied. The purpose of the Plan is to attract, retain and reward well performing executives. The terms and conditions of issue of Awards are at the complete discretion of the Board. The purpose of this resolution is to seek the approval of shareholders to grant an Award under the Plan to the Managing Director, Mr Robin Burns, in accordance with the terms and conditions of the Plan, which are broadly outlined below. This Award is the 2015/16 series, with a commencement date of 1 July 2015. The structure of executive compensation at Equity Trustees is a combination of:
- a fixed annual remuneration;
- a short term incentive (STI) payable annually in cash, based on the achievement of certain corporate and personal objectives relative to the Company’s annual business plan and strategic goals; and
- a long term incentive (LTI) awarded in shares if pre-agreed targets are achieved over a three year period.
The intention is to structure executive compensation such that, depending on seniority, a significant proportion of total remuneration is ‘at risk’ and dependent on corporate and personal performance. The underlying principle is that executive rewards should flow as and when commensurate rewards flow to shareholders. The Managing Director’s fixed annual remuneration is currently $620,000. The components of ‘at risk’ compensation for the Managing Director are as follows:
- STI – up to 60% of fixed annual remuneration, payable in cash, and - LTI – up to 60% of fixed annual remuneration, awarded in shares.
For the purposes of the STI, the objectives will be expressed in terms of the business plan parameters, including profitability, leadership, culture, etc and documented as part of the annual business planning cycle. For the purposes of the LTI, the Award is determined by targets based on two components:
- 50% Total Shareholder Return (TSR) - 50% Earnings per Share Growth (EPS).
The key components of the Award proposed to be granted to Mr Burns are as follows:
- The grant date for this Award is 27 November 2015, with the Award being conditional upon approval by shareholders at this meeting. If approved, the Award will be issued to Mr Burns on 30 November 2015.
- The Award covers a three year measurement period, commencing 1 July 2015.
- At the commencement of the three year measurement period, the dollar value of the Award is determined – i.e. 60% (or such other percentage determined by the Board) multiplied by the Managing Director’s fixed annual remuneration.
- The dollar value of the Award is then divided by the volume weighted average price (VWAP) of EQT shares traded on the ASX during the 3 months prior to the commencement of the three year period applicable to the Award to give the number of EQT shares subject to the Award for the three year period. The VWAP for the 2015/16 Award series is $21.73.
- The maximum number of shares subject to this Award is 17,119.
- EQT shares are only issued if TSR and/or EPS criteria (as described below) have been met at the completion of the three year measurement period.
For
per
sona
l use
onl
y

7
- There is no price paid or payable if shares are issued.
- Once shares are issued, they are subject to a disposal restriction period for up to a further 12 years, after which they are released to the Managing Director.
- During the disposal restriction period, dividends paid or reinvested are owned by the Managing Director.
- Any variation in share price over the three year period, as well as the disposal restriction period, is to the benefit/detriment of the Managing Director.
- The Managing Director is responsible for his personal taxation obligations in relation to ownership, sale or dividends received.
- Resignation during the three year measurement period terminates the Award and the value to the Managing Director is nil.
- Details of shares issued under the Plan are recorded in the Annual Report in respect of the period during which the shares are issued.
- Apart from the Managing Director, shareholder approval is currently not required in respect of participants under the Plan.
50% of the Award will be subject to a TSR condition. The achievement of the TSR target is determined by reference to the increase in EQT share price plus dividends reinvested over the three year measurement period compared to a suitable Comparator Group, and linked to the following vesting scale:
- If the EQT TSR is less than the 50th percentile, then: nil share allocation - If EQT TSR is equal to the 50th percentile, then: 50% share allocation - If EQT TSR is equal to the 75th percentile, then: 100% share allocation - If between the 50th and 75th percentile, then: Pro-rata share allocation 50% of the Award will be subject to an EPS condition. The achievement of the EPS target is determined by reference to the growth in EPS over the three year measurement period. EPS is calculated by taking the reported net profit after tax and divided by the reported weighted average shares on issue during each year. The vesting scale is as follows:
- If growth in EQT EPS is less than 5% pa, then: nil share allocation - If growth in EQT EPS is 5% pa, then 25% share allocation - If growth in EQT EPS is 15% pa, then: 100% share allocation - If growth in EQT EPS is between 5% pa and 15% pa, then: Pro-rata share allocation
For each component of the Award, the performance assessment is after each three year measurement period. If necessary, where there is no TSR component of the Award granted after the three year measurement period, the final reassessment of TSR will be made at the end of the fourth year. If the full TSR component of the Award is not achieved at that time, the non-achieved balance of the TSR component of the Award lapses. Once shares are issued they fully vest to the Managing Director, subject to the disposal restriction period of up to 12 years.
For
per
sona
l use
onl
y

8
LTI Awards may be made annually at the discretion of the Board. In some years there may be no Awards made. The extent of participation in both the STI and LTI arrangements, within the above limits, will be at the discretion of the Board, having regard to corporate results and the personal performance of the Managing Director. Each Award under the LTI will be subject to its own TSR and EPS three year target. In relation to the prior year Award (2014/15, as approved by shareholders at the Annual General Meeting on 31 October 2014), 19,194 Awards were issued to Mr Burns on 5 November 2014. This resolution is being put to shareholders of the Company for the purposes of ASX Listing Rule 10.14, which requires shareholder approval for the issue of shares to directors under an employee incentive scheme. If the resolution is passed, it will also mean that the grant of the 2015/16 Award series to the Managing Director will not utilise any of the Company's placement capacity under Listing Rule 7.1. No further shareholder approval under Listing Rule 7.1 is needed for that purpose.
For
per
sona
l use
onl
y
For
per
sona
l use
onl
y

For
per
sona
l use
onl
y

Notice of 2015 Annual General Meeting
Questions Name:
Address:
As a shareholder in Equity Trustees, we invite you to submit questions relating to Equity Trustees or the business of the meeting, prior to the 2015 Annual General Meeting. Your questions can be directed toward the Chair, Equity Trustees’ Auditor or the Chief Executive Officer. Questions must be received by Equity Trustees’ security registrar, Computershare Investor Services Pty Limited, by 5pm on Monday, 20 November 2015; by - posting them in the reply paid envelope provided; or - posting them to Computershare Investor Services Pty Limited at GPO Box 242 Melbourne, Victoria 3001 Australia, or - faxing them to 1800 783 447 in Australia or +61 3 9473 2555 from outside Australia. We will endeavour to respond to as many questions as possible during the 2015 Annual General Meeting. We may address questions together with one response; however there may not be sufficient time during the meeting to address all questions or topics. Please note individual responses will not be sent to shareholders. Questions for the:
� Chair � Auditor � Chief Executive Officer
Questions for the:
� Chair � Auditor � Chief Executive Officer
CONTACT THE REGISTRY Shareholders seeking information about their holding or dividend payments can contact the registry. 1300 850 505 (toll free within Australia) +61 3 9473 2500 (outside of Australia)
The Registrar Computershare Investor Services Pty Limited
GPO Box 2975 Melbourne VIC 3001 Australia
SHAREHOLDER REGISTER DETAILS You can view your holdings, access information and make
changes by visiting www.investorcentre.com. 20
54
94
_0
1S
68
A
Samples/000001/000002/i12
*M00000112Q02*
For
per
sona
l use
onl
y

AnnuAl RepoRt
For
per
sona
l use
onl
y

Board of DirectorsJA (Tony) Killen OAM, BA, FAICD, FAIM (Chairman, Non-executive)
Robin BO Burns, DipAcc, FAICD (Managing Director)
David F Groves, BCom, MCom, CA, FAICD (Deputy Chairman, Non-executive)
Alice JM Williams, BCom, FCPA, FAICD, ASFA AIF, CFA (Non-executive)
The Hon Jeffrey G Kennett AC, HonDBus (Ballarat), Hon LL D (Deakin) (Non-executive)
Anne M O’Donnell, BA (Bkg & Fin), MBA, FAICD, SF Fin (Non-executive)
Kevin J Eley, CA, F FIN, FAICD (Non-executive)
Michael J O’Brien, FIAA, CFA, GAICD (Non-executive)
Corporate Governance StatementOur Corporate Governance Statement is available on our website eqt.com.au.
Company SecretaryPhilip B Maddox, LLB, BA, GDipAppFin (Finsia)
Chief Financial Officer Terry Ryan, BBus, FCA, F Fin
AuditorDeloitte Touche Tohmatsu 550 Bourke Street Melbourne, Victoria 3000
Share RegistryComputershare Investor Services Pty Ltd Yarra Falls, 452 Johnston Street Abbotsford, Victoria 3067
Registered OfficeLevel 2, 575 Bourke Street Melbourne, Victoria 3000 Phone (03) 8623 5000 Fax (03) 8623 5200 Email [email protected]
Annual General Meeting11.00am, Friday 27 November 2015 Level 2, RACV Club 501 Bourke Street, Melbourne
For
per
sona
l use
onl
y

Contents
02
23
16
24
18
25
19
26
29
72
28
70
Statement of Profit or Loss
Directors’ Report
Statement of Profit or Loss and Other Comprehensive Income
Auditor’s Independence Declaration
Statement of Changes in Equity
Independent Auditor’s Report to the Members of Equity Trustees Limited
Board of Directors’ Profiles
Statement of Financial Position
Notes to the Financial Statements
Directors’ Declaration
Statement of Cash Flows
Statement of Shareholdings
Financial Report 2015
Directors’ Report 2015
Equity Trustees Annual Report 2015 1
For
per
sona
l use
onl
y
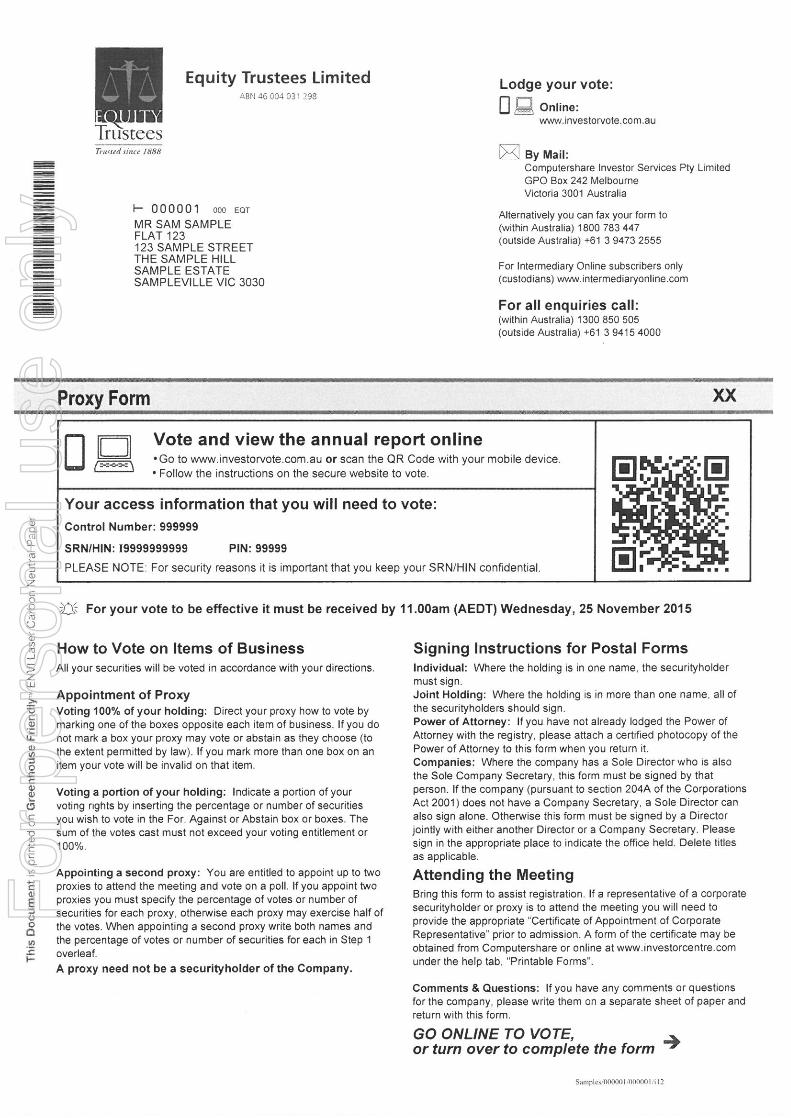
Directors’ Reportfor the Financial Year Ended 30 June 2015The Directors of Equity Trustees Limited (EQT, Equity Trustees or the Company) submit herewith the annual financial report for the financial year ended 30 June 2015. In order to comply with the provisions of the Corporations Act 2001, the Directors’ Report is as follows:
The names of Directors of the Company during or since the end of the financial year are:
JA (Tony) Killen OAM, ChairmanRobin BO Burns, Managing DirectorDavid F Groves, Deputy ChairmanAlice JM WilliamsThe Hon Jeffrey G Kennett ACAnne M O’Donnell Kevin J EleyMichael J O’BrienDetails of directorships and experience are summarised in the Board of Directors’ Profiles, following this report.
Company SecretariesMr Philip B Maddox, Lawyer, held the office of joint Company Secretary during and since the end of the financial year. Mr Maddox joined Equity Trustees Limited in 2001 and previously held senior managerial and operational roles in the trustee industry. He is a member of the Law Institute of Victoria and currently holds a Legal Corporate Practising certificate.
Mr Terry Ryan, Chartered Accountant, held the office of joint Company Secretary during and since the end of the financial year. Mr Ryan joined Equity Trustees Limited in 2003 and previously held senior finance, administration and secretarial roles in the financial services industry and is a fellow of the Institute of Chartered Accountants and the Financial Services Institute of Australasia.
Principal activitiesThe principal activities of the Equity Trustees Limited Group (the Group) during the course of the financial year involved the provision of a range of financial services to clients of Trustee & Wealth Services (TWS), and Corporate Trustee Services (CTS). Further details pertaining to the activities of the business units are summarised below.
Review of operationsResultFor the year ended 30 June 2015, the Group earned a net profit after-tax of $17.0m, a 75% increase over the prior year amount of $9.7m. The result was materially improved following the acquisition of Equity Trustees Wealth Services Limited (ETWSL) (formerly known as ANZ Trustees Limited), effective 4 July 2014, as well as through organic business growth. The material increase in 2015 profit was despite the impact of non-operating costs primarily relating to the acquisition and integration of ETWSL. The net after-tax cost of these non-operating items was $2.9m (2014: $0.7m). In addition, the 2015 result was impacted by the amortisation of finite life intangibles of $1.3m (2014: $0.2m).
The operating profit after-tax, excluding the non-operating items, increased by 104%, from $10.4m to $21.2m. The operating margin increased from 27.1% to 34.9%. The effective tax rate on operating profit has increased slightly, from 28.1% to 28.5%. Both the TWS and CTS Business Units made strong contributions to the Group operating profit and generated good margins. The CTS unit in particular continued its very positive recent trend in organic revenue growth.
The increase in weighted average shares and the level of non-recurring expenses both affected reported earnings per share (EPS), which was 87.8 cps compared to 88.6 cps in the prior year.
Capital and Balance SheetThe number of weighted average shares on issue during the year to 30 June 2015 was 19.32m, up from 10.96m in the prior year. As part of the need to increase capital to meet regulatory purposes, the portion of the 2015 interim dividend not subject to dividend reinvestment was underwritten.
During the year the Group considered a capital structure plan to facilitate greater flexibility and efficiency in relation to the capital, operating and licensing structures. As advised in an ASX announcement in July 2015 the Group is planning a restructure whereby a new non-operating holding company will be introduced. This will enable the Group to have greater flexibility to raise capital via equity, debt, bank guarantee, or a combination thereof. The new structure will also facilitate further steps to be taken to provide more efficient operating and licensing models. The new holding company proposal will be put to shareholders for approval at the 2015 Annual General Meeting.
JA (Tony) Killen OAM, Chairman
2 Equity Trustees Annual Report 2015
For
per
sona
l use
onl
y

Consistent with the timing to introduce a new holding company, the Group has been granted an extension to meet a new minimum Net Tangible Asset (NTA) requirement for ASIC regulatory purposes. This relief applies from 1 July 2015 until 31 December 2015. The minimum level of NTA required during this period is $32m, which is accommodated within the Group’s existing and projected NTA. At 1 January 2016 we expect that the additional capital of $15m to $20m will be met by either debt, equity, guarantee or a combination of these.
The balance sheet remains debt free, however, as a result of the capital efficiency project it is possible that some form of debt or guarantee facility may be introduced to pursue a lower overall cost of capital, which in turn would have a positive impact on earnings per share and return on equity.
In line with the need to increase capital to meet regulatory capital standards, and consistent with the approach in prior years, the Dividend Reinvestment Plan (DRP) will operate for the 2015 final dividend but at a reduced discount of 1.25%. The 2015 final dividend will be fully franked and payable on 16 October 2015.
The Statement of Financial Position discloses that net assets have increased during the year, primarily due to an increase in issued capital arising from capital raised through the DRP, for the two dividends paid during the year, and the underwriting of the 2015 interim dividend. As a result, net assets increased by 4.7% from $230m to $241m. The major movement in assets relates to the acquisition of ETWSL on 4 July 2014. At 30 June 2014 the capital raised to fund the acquisition remained in cash prior to payment to the vendors on 4 July 2014. The purchase price of $156m was split into tangible assets of $11.6m and goodwill/intangibles of $144.4m. The most recent impairment review test, using future discounted cash flows, re-confirmed that there is good headroom above the carrying values of goodwill/intangibles.
DividendIn determining the 2015 final dividend the Board had regard to the expanded capital base to support the ETWSL acquisition, the impact of the 2015 non-operating costs, and likely future trading performance, and approved a fully franked final dividend of 48 cps, giving a total 2015 fully franked dividend of 94 cps, unchanged from the prior year. The 2015 full year dividend of 94 cps represents a payout ratio of 109%, which is above the Board’s stated payout range of 70% to 90%, however, it should be noted that it is 91.5% of 2015 underlying profit after-tax (which includes amortisation of finite life intangibles, but excludes acquisition and integration items). The full year dividend represents a current yield of approximately 4.0%.
Business conditions and strategic directionsThe overall business environment provided variable conditions during the year. Although the local equity market experienced some strongly positive months, there were periods of sharp retractment and for the year as a whole, the index was effectively unchanged. Consumer and business confidence reflected this variability. Local interest rates remain at what are regarded as stimulatory, historically-low levels and, given the high level of exposure to international markets in the Company’s total
funds under administration, the impact of exchange rate movements was also relevant to business results.
The Group now earns a higher proportion of revenue from asset-based fees, following the acquisition of ETWSL in July 2014, than in recent prior periods. However, the continuing strong growth of the Australian financial services market, driven by compulsory superannuation and population demographics, ensures that the sector remains an attractive one for business and investors. The financial advice sector continued to be exposed to negative publicity, arising from past activities or practices at some major participating companies, and although these affected consumer perceptions, the need for personal financial advice and services can only be expected to grow. The forthcoming substantial wealth transfer between generations will provide a long-term positive stimulus for the Group’s activities in the private client sector.
Both operating business units can benefit from the positive long-term trends or factors noted here and the Company’s stance as an independent fiduciary should resonate well with investors and clients. The two operating business units are different in nature and will experience varying organic growth rates, as well as different business risks arising from the nature of their clientele, but both are well placed to take advantage of these opportunities. It should also be noted that during the year, the Group continued to make a significant investment in increasing the capabilities and resources of its support business units to ensure that these critical aspects of overall functionality maintain the levels of professionalism and expertise expected of the Group in the current and future environment. This will continue into the next financial periods.
Business activities
Trustee and Wealth ServicesDuring the year the major immediate focus for TWS was to integrate the ETWSL business. At the time of acquiring ETWSL the stated goals in the short-term were to achieve annualised pre-tax cost synergies of $4m, comprising $1m within 12 months of acquisition and a further $3m within 18 months of acquisition. The expected cost to achieve these synergies was up to $5m.
The integration process was complete by 30 June 2015, and the annualised cost synergies of $4m have been achieved. This was achieved below the expected one-off cost. The integration phase is now being replaced by initiatives to pursue revenue synergy growth from both the existing revenue base and the referral agreement in place with ANZ Banking Group Limited. These initiatives are showing positive early signs. Overall, the acquisition has been very successful, providing further scale in the traditional trustee space.
In addition to the ETWSL acquisition, the TWS business continues to focus on strategies in relation to organic growth initiatives. There has been a continuation of investment in business-generating staff along the eastern seaboard and in Perth. Some of this expenditure is being incurred ahead of material revenue from new initiatives, to gear up for further growth in new client numbers via partnerships with external financial planning groups.
Equity Trustees Annual Report 2015 3
For
per
sona
l use
onl
y
The TWS business unit, including the acquired ETWSL business-generated operating revenue of $59.3m, up 90% on the prior year (which excluded ETWSL). The ETWSL contribution to this operating revenue was $23.3m.
Cross-selling between TWS business lines continues to be an important part of the TWS organic growth initiatives. Funds under management, advice or administration in TWS increased by 81% to $7.8b, of which $2.7b related to ETWSL.
Corporate Trustee ServicesContinuing on from solid progress in recent years, CTS again achieved very good growth in its responsible entity and funds distribution activities, with a net increase of 14 in the number of funds for which we provide responsible entity services from 185 to 199. In addition, CTS was able to successfully pursue a number of new service lines as a fiduciary, beyond the historical focus on pure responsible entity activity. The number of investment managers for which we provide responsible entity services also increased from 76 to 82 over the period. This translated into operating revenue growth of 14.8%, from $21.3m to $24.4m. Overall, CTS Funds under management/ administration increased by 28% from $35.6b to $45.4b.
Support Business UnitsThe Group continues to initiate efficiency projects to help streamline transaction processing, as well as provide greater support for the client-orientated front-line staff.
As a further refinement to the importance of risk management the Group has established a formal Board Risk Committee. In addition, the Group’s risk and compliance team has undergone further expansion to meet the extensive regulatory, compliance and governance expectations. The Board is committed to ensuring that the Group is at the forefront of these obligations in the best interests of clients. Material further development and enhancement of the risk management framework and plan will continue over the next 12 months.
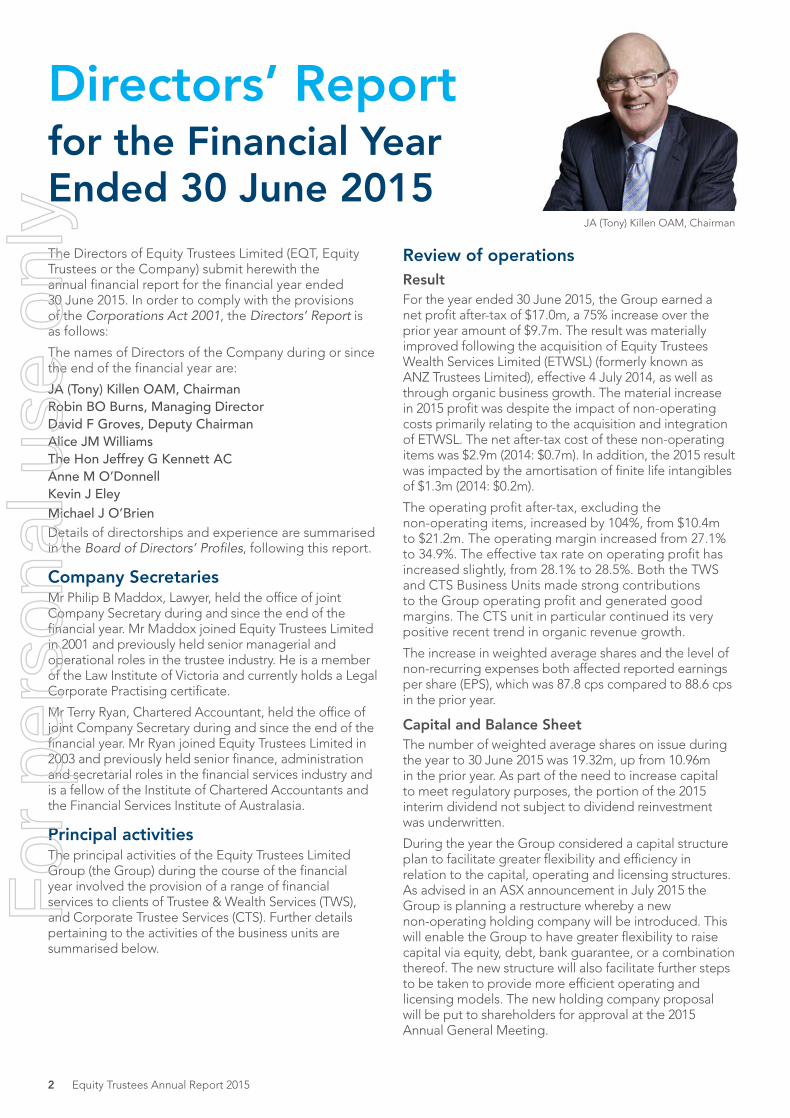
The two business units, their functions and 2015 revenue performance is summarised as follows:
Business unit Key functions 2015 performance
Trustee & Wealth Services
The provision of personal financial, superannuation and asset management services including:
• Personal Estates and Trusts – estate planning, trustee, executor, taxation, and philanthropic services;
• Wealth Management – personalised portfolio management and support services;
• Asset Management – overseeing the investment process for internal and external clients and managing internal funds;
• Aged Care Services – financial planning advice, placement advice and training services specialising in the aged care sector;
• Portfolio Services – employer services, personal superannuation and managed accounts in the superannuation sector
Operating revenue up 90% to $59.3m (2014: $31.3m)
Funds/Assets under management up 81% to $7.8b (2014: $4.3b)
Corporate Trustee Services
Responsible Entity services for managed funds on behalf of local and international managers and sponsors.
Management and coordination of distribution and marketing for Equity Trustees co-branded retail and wholesale funds.
Operating revenue up 14.8% to $24.4m (2014: $21.3m)
Funds under management/ administration up 28% to $45.4b (2014: $35.6b)
4 Equity Trustees Annual Report 2015
For
per
sona
l use
onl
y

Changes in the state of affairsDuring the financial year, there was no significant change in the state of affairs of the Group other than that referred to in the financial statements or notes thereto.
Subsequent eventsThere has not been any matter or circumstance that has arisen since the end of the financial year that has significantly affected, or may significantly affect, the operations of the Group, the results of those operations, or the state of affairs of the Group in future financial years.
Future developmentsApart from matters disclosed elsewhere in this report, disclosure of information regarding likely developments in the operations of the Group in future financial years and the expected results of those operations, is likely to result in unreasonable prejudice to the Group. Accordingly, this information has not been disclosed in this report.
DividendsIn respect of the financial year ended 30 June 2014:
i. An interim dividend of 46 cps, franked to 100% at 30% corporate income tax rate, was paid to holders of fully paid ordinary shares on 16 April 2014.
ii. A final dividend of 48 cps, franked to 100 % at 30 % corporate income tax rate, was paid to holders of fully paid ordinary shares on 16 October 2014.
In respect of the financial year ended 30 June 2015:
i. An interim dividend of 46 cps, franked to 100% at 30% corporate income tax rate, was paid to holders of fully paid ordinary shares on 16 April 2015.
ii. Subsequent to 30 June 2015, the Directors declared a final dividend of 48 cps, franked to 100% at 30% corporate income tax rate, payable to holders of fully paid ordinary shares on 16 October 2015.
Indemnification of Directors, officers and auditorsDuring the financial year, the Company paid a premium in respect of a contract insuring the Directors, Company Secretaries and officers of the Group against a liability incurred as a Director, Secretary or officer to the extent permitted by the Corporations Act 2001. The contract of insurance prohibits disclosure of the nature of the liability and the amount of the premium.
The Company has not otherwise, during or since the financial year, indemnified or agreed to indemnify a Director, a Company Secretary, an officer or auditor of the Company or any related body corporate against a liability incurred as such a Director, Company Secretary, officer or auditor.
Equity Trustees Annual Report 2015 5
For
per
sona
l use
onl
y

Directors’ meetingsThe following table sets out the number of Directors’ meetings (including meetings of Committees of Directors) held during the financial year and the number of meetings attended by each Director (while they were a Director or committee member). During the financial year, 17 Board meetings, 11 Committee of the Board meetings, 7 Remuneration, Human Resources & Nominations Committee (Remuneration Committee) meetings,14 Audit & Compliance Committee (A&CC) meetings, 4 Board Investment Committee (BIC) meetings and 1 Board Risk Committee (BRC) meeting were held.
Directors in attendance Board meetings
Committee of the Board
meetings1
Remuneration Committee
meetingsA&CC
meetings BIC meetings BRC meetings
Eligible to
attend2 Attended
Eligible to
attend2 Attended
Eligible to
attend2 Attended
Eligible to
attend2 Attended
Eligible to
attend2 Attended
Eligible to
attend2 Attended
JA (Tony) Killen 17 17 7 7 4 4 n/a n/a n/a n/a 1 1
RBO Burns 17 17 8 8 n/a n/a n/a n/a 4 4 1 1
DF Groves 17 16 8 8 3 3 14 14 2 2 1 1
AJM Williams 17 17 7 7 7 7 n/a n/a 4 4 1 1
JG Kennett 17 17 6 6 7 7 n/a n/a n/a n/a 1 1
AM O’Donnell 17 17 6 6 3 2 14 13 n/a n/a 1 1
KJ Eley 17 17 10 10 n/a n/a 14 14 2 2 1 1
MJ O’Brien3 16 16 10 10 n/a n/a 14 14 2 2 1 1
1 Committee of the Board meetings are constituted by at least any two Directors acting pursuant to the authority of the full Board.2 Meetings held that the Director was eligible to attend whilst holding office.3 Mr O’Brien was appointed a Director of the Company effective 28 July 2014.
Directors’ shareholdingThe following table sets out each Director’s relevant interest in shares as at the date of this report. All shares are fully paid ordinary shares.
Director Number of shares
DF Groves 380,105
KJ Eley 92,603
JG Kennett 37,397
JA (Tony) Killen 30,345
MJ O’Brien 10,000
AM O’Donnell 7,606
RBO Burns 24,759
AJM Williams 4,140
6 Equity Trustees Annual Report 2015
For
per
sona
l use
onl
y

Remuneration ReportThe Board’s policy on executive remuneration is designed to attract and retain high calibre staff and to reward executives for achieving financial and other business goals, which in turn, increases shareholder wealth.
To assist in performing its duties and making recommendations to the Board, the Remuneration, Human Resources and Nominations Committee (Remuneration Committee) seeks independent advice from external consultants on various remuneration related matters. The Remuneration Committee follows protocols regarding the engagement and use of external remuneration consultants to ensure compliance with the relevant executive remuneration legislation.
The Equity Trustees executive remuneration structure comprises fixed salary and short and long-term variable components and the table below illustrates the remuneration strategy and approach. Executive package components are reviewed and structured annually to focus individuals on, and to reward achievement of, specific measures and targets with both short and medium-term horizons.
Remuneration Strategy
Aligned with Equity Trustees Performance
• Assess rewards against short and long-term company targets
• Make short and long-term components of remuneration ‘at risk’
• Align rewards to building shareholder value
Attract and retain high calibre executives
• Be market competitive with rewards and remuneration
• Continually review strategy and research
Remuneration Components
Fixed Total Employment Costs (TEC)• Based on employee’s level of
responsibility, experience, skills and performance. Includes:
– Salary: fixed annual remuneration
– Non-monetary: eligible salary sacrifice items and Fringe Benefits Tax (FBT)
– Post-employment: Superannuation Guarantee Charge (SGC)
Short-Term Incentives (STI)• Annual ‘at risk’ component based
on company, business unit and individual performance.
– Maximum: The maximum opportunity for executives is in the range of 25% to 60%
– Settlement: Payment as cash through payroll system
Long-Term Incentive Plan (LTiP)• Delivered in equity (shares) based
on prescribed performance hurdles
– Range: 25% to 60% of TEC
• Remuneration Committee to consider and recommend LTiP participation to the Board
• Applied over three year period
• Aligned to long-term growth strategy
– Total Shareholder Return (TSR) for Managing Director
» 50% vesting when 50th percentile achieved
» 100% vesting when 75th percentile achieved
– Adjusted Earnings Per Share (AEPS) for all participants (Refer to page 12 for detail of AEPS calculations)
» 25% vesting when 5% p.a. growth in pre-tax AEPS achieved over three years
» 100% vesting when 15% p.a. growth in pre-tax AEPS achieved over three years
Remuneration mixThe Managing Director and all Group executives continue to have a significant portion of their remuneration linked to performance and at risk. This is shown in the table below which shows the optimal remuneration mix for the Managing Director and Group executive roles.
Managing Director 46% 27% 27%
Group Executives 50% – 61% 22% – 30% 15% – 22%
Fixed (cash) STI (cash) LTI (equity)
Equity Trustees Annual Report 2015 7
For
per
sona
l use
onl
y

Table 1
30 June 2015 $’000
30 June 2014 $’000
30 June 2013 $’000
30 June 2012 $’000
30 June 2011 $’000
Revenue 84,857 54,935 47,482 43,647 39,865
Net profit before tax 24,158 13,406 12,517 11,691 11,484
Net profit after-tax 16,959 9,713 8,671 8,381 8,229
30 June 2015 30 June 2014 30 June 2013 30 June 2012 30 June 2011
Share price at start of year $20.98 $14.90 $11.06 $13.90 $15.20
Share price at end of year $20.39 $20.98 $14.90 $11.06 $13.90
Interim dividend1 46 cps 46 cps 42 cps 40 cps 50 cps
Final dividend1,2 48 cps 48 cps 50 cps 45 cps 50 cps
Total dividend 94 cps 94 cps 92 cps 85 cps 100 cps
Earnings per share3 87.80 cps 88.64 cps 87.58 cps 87.66 cps 87.90 cps
Reported earnings per share 87.80 cps 88.64 cps 96.65 cps 96.74 cps 97.01 cps
1 All dividends are franked to 100% at 30% corporate income tax rate.2 The final dividend was declared after balance date and is not reflected in the financial statements as at 30 June.3 Earnings per share figures for 2011 to 2013 have been restated to reflect the Rights issue in April/May 2014.
Details of incentive plans
Short-term performance incentivesThese are calculated by reference to agreed key performance indicators for the year ended 30 June 2015. These include Group and Business Unit profitability, revenue growth, expense control, and other performance criteria specific to the respective executive’s responsibilities. These performance criteria were chosen so as to provide a suitable incentive for executive performance for the benefit of shareholders and other stakeholders. The measurement of criteria is assessed by adopting a balanced scorecard approach, with each criterion given a threshold representing the minimum incentive and a stretch threshold representing an excellent achievement, for which the maximum incentive is paid. In all cases, the Remuneration Committee confirms the appropriateness of the criteria, appropriate thresholds and, at the conclusion of the measurement period, confirms the level of achievement.
Across all staff, the maximum short-term incentive opportunity is in the range of 5% to 60% of TEC. Short-term incentives are paid in cash through the payroll system.
For the year ended 30 June 2015 the key performance criteria, being Group revenue and profitability and business unit revenue, were partially achieved. Accordingly, across all staff, approximately 33% (2014: 40%) of the maximum short-term incentive opportunity was accrued or paid.
Long-term performance incentivesThese are offered to executives via the grant of LTiP awards (Awards) which confer the right to acquire shares at no cost, subject to meeting prescribed performance hurdles. The details of these incentives are outlined under the heading, Executive Performance Share Plan. The accounting cost of long-term performance incentives is spread over the measurement (vesting) period, with a cost of $840,588 accrued for the year to 30 June 2015 (2014: $337,774).
The maximum share-based long-term performance incentive is in the range of 25% to 60% of TEC.
The operational and financial performance of the Group over the last five years has been positive and the Board is of the view that the remuneration policy has enabled the Group to attract and retain high quality management, and that financial rewards to executives are considered appropriate having regard to the Group’s relative performance.
The table below provides summary information outlining the Group earnings and movements in shareholder wealth for the five years to 30 June 2015.
8 Equity Trustees Annual Report 2015
For
per
sona
l use
onl
y

Directors’ remunerationDirectors’ fees are reviewed annually by the Remuneration Committee, having regard to analysis of the market and industry based data and trends. Fees are set to attract and retain high calibre directors and to reflect the workload and contribution required, the significant number of meetings scheduled each year and their role and responsibilities on the various committees of the Board. Non-Executive Directors’ remuneration consists of a fixed annual fee with no element of performance-related pay. After three years of no increases, Directors’ fees were increased effective 1 January 2015, to reflect the increased size and complexity of the business, renewal of the Board and market rate movements.
The following table discloses the Directors of Equity Trustees Limited during the year, together with remuneration entitlements.
Table 2
DirectorsShort-term
benefitsPost-employment
benefits
Long-term employee
benefits
Share- based
payments4 Total
Non-Executive Directors
Fee / salary
$Bonus
$
Non- monetary1
$
Superan-nuation2
$ DRA3
$ $ $ $
JA (Tony) Killen, Chairman
2015 172,500 - - 16,388 779 - - 189,667
2014 165,000 - - 15,263 1,518 - - 181,781
DF Groves, Deputy Chairman
2015 99,595 - 5,000 32,280 2,059 - - 138,934
2014 101,495 - 5,000 19,142 9,036 - - 134,673
AJM Williams
2015 95,000 - 5,000 9,500 - - - 109,500
2014 87,500 - 5,000 8,556 - - - 101,056
JG Kennett
2015 86,250 - 5,000 8,669 - - - 99,919
2014 80,000 - 5,000 7,862 - - - 92,862
AM O’Donnell
2015 103,750 - 5,000 10,331 - - - 119,081
2014 129,587 - 5,000 12,450 - - - 147,037
KJ Eley
2015 96,667 - 5,000 20,152 - - - 121,819
2014 97,500 - 5,000 9,481 - - - 111,981
MJ O’Brien5
2015 89,583 - - 19,460 - - - 109,043
2014 n/a n/a n/a n/a n/a n/a n/a n/a
Executive Director
RBO Burns, Managing Director
2015 551,575 139,200 9,642 18,783 - 14,130 282,512 1,015,842
2014 474,015 150,000 8,210 17,775 - 4,610 182,384 836,994
1 Non-monetary items include eligible salary sacrificed items and any FBT. This includes any sacrificed amounts into EQT shares in accordance with the EQT Salary Sacrifice Share Plan.
2 Superannuation includes the SGC and, in some cases, additional superannuation payments that have been sacrificed from Directors’ fees and entitlements.
3 Directors’ Retiring Allowance (DRA) represents the movement in the accrual for Directors’ retiring allowance and is calculated in accordance with the accounting policy as outlined in note 3.8 to the financial statements. At the 2005 AGM, shareholders approved an increase in the Directors’ fees cap on the condition that the DRA scheme was grandfathered for existing Directors and closed to future Directors. The DRA for then participating Directors was frozen as at 31 December 2005, however, the frozen amounts are inflation adjusted annually for the movement in CPI. Upon retirement, Directors participating in the DRA scheme are paid their DRA balance.
4 This is the expensed accounting cost of the actual and potential outcomes of the Awards made in 2012/13, 2013/14 and 2014/15. Refer also to footnote 3 on page 10.
5 Mr MJ O’Brien was appointed a Director of the Company effective 28 July 2014.
There were no termination payments made to Directors during the year ended 30 June 2015 (2014: nil).
Equity Trustees Annual Report 2015 9
For
per
sona
l use
onl
y

Executive remunerationRemuneration entitlements of the key management personnel of the Group during the year are made up of a cash component, as well as an accounting-based accrual for such items as long-term employee benefits and share-based payments, as per the following table:
Table 3
ExecutivesShort-term
employee benefits
Post employment
benefits
Total Employment
Cost (TEC)
Short-term bonus/
incentive
Long-termemployee
benefits
Share-based
payments3 Total
Salary
$
Non- monetary1
$
Superan-nuation2
$ $ $ $ $ $
GR Rimmer, Executive General Manager, Trustee & Wealth Services
2015 340,017 5,000 34,983 380,000 137,700 4,518 117,227 639,445
2014 302,225 5,000 17,775 325,000 85,000 1,415 43,123 454,538
HH Kalman, Executive General Manager, Corporate Trustee Services
2015 311,575 9,642 18,783 340,000 92,820 9,824 112,148 554,792
2014 298,890 8,335 17,775 325,000 60,500 9,183 33,852 428,535
T Ryan, CFO & Company Secretary
2015 295,575 9,642 34,783 340,000 38,250 9,319 112,148 499,717
2014 291,759 8,466 24,775 325,000 65,600 8,666 33,852 433,118
RE Bessemer, Chief Operations Officer
2015 263,169 8,048 18,783 290,000 134,800 4,929 90,167 519,896
2014 242,118 - 17,882 260,000 50,000 1,930 29,538 341,468
PB Maddox, Corporate Counsel/Company Secretary
2015 230,266 - 24,734 255,000 17,850 6,611 85,903 365,364
2014 226,087 - 20,913 247,000 30,000 5,176 26,173 308,349
SF Clancy, Executive General Manager HR, Marketing and Communications4
2015 200,189 6,454 14,088 220,731 39,000 698 34,907 295,336
2014 n/a n/a n/a n/a n/a n/a n/a n/a
G Boubouras, Chief Investment Officer5
2015 247,022 - 4,696 251,718 - (940) (21,869) 228,909
2014 332,225 - 17,775 350,000 37,500 940 21,869 410,309
1 Non-monetary items include eligible salary sacrificed items and any FBT. This includes any sacrificed amounts into EQT shares in accordance with the EQT Salary Sacrifice Share Plan.
2 Superannuation includes the SGC and, in some cases, additional superannuation payments that have been sacrificed from salary. 3 Share-based payments relate to the value of Awards. The value attributable to Awards is based on the accounting cost, using the fair value at
grant date. For the AEPS criterion an assessment is made of the likely achievement of performance hurdles over the three year measurement period and the accounting cost is adjusted accordingly. The AEPS criterion for the 2012/13 Series which ended on 30 June 2015 was achieved at 96.86% of the maximum. Where an executive ceases employment during the year, there is a write-back of prior year AEPS accounting costs which can result in a negative figure in the current year. For the TSR criterion the accounting standard requires the accounting cost to be spread over the measurement period regardless of the extent of achievement of the criterion. The TSR for the 2012/13 Series which ended on 30 June 2015 was 100% achieved. Regardless of the outcome of TSR Awards, 100% of the accounting cost is charged against executive remuneration packages, even though the executive may receive a lesser award when measures are finalised.
4 Ms Clancy become a key management person effective 1 September 2014. Therefore, comparative figures are not applicable.5 Mr Boubouras departed the company 13 August 2014. The salary component of the remuneration includes a termination payment of $180,288.n/a Not Applicable.
10 Equity Trustees Annual Report 2015
For
per
sona
l use
onl
y

Short-term incentive: targets and outcomesAt the end of the performance period, short-term incentive targets were assessed by the Board in respect of the Managing Director, and the Managing Director in respect of executives and then considered and approved by both the Remuneration Committee and the Board. The outcome of each assessment is set out below:
Executives TEC STI opportunity STI awarded % awarded in year
$ $ $ %
RBO Burns 580,000 348,000 139,200 40
GR Rimmer 380,000 378,000 137,700 36
HH Kalman 340,000 204,000 92,820 46
T Ryan 340,000 170,000 38,250 23
RE Bessemer 290,000 216,000 134,800 62
PB Maddox 255,000 102,000 17,850 18
SF Clancy 300,000 120,000 39,000 33
Link between profit outcomes and executive remunerationIn line with the short-term incentive criteria, short-term incentives and sales related bonuses were earned by members of the executive team. Based on 2014/15 criteria, when compared to actual 2014/15 performance, approximately 40% (2014: 40%) of the maximum short-term incentive opportunity has been awarded to eligible employees. Individual awards to executives were in the range of 18% to 62% of maximum possible short-term incentives. In both FY2014 and FY2015 short-term incentives payments to some executives included amounts awarded to reflect specific individual contributions to material projects or initiatives, in addition to annual performance incentive criteria. These amounts are included in the “STI awarded” and the “% awarded in the year” columns above.
In relation to the long-term incentive measurement criteria, as described below, eligible participants were awarded 96.86% of their individual award for the AEPS measure for the 2011/12 Series which ended 30 June 2015. For the 2011/12 Series TSR measure, 100% of awards were achieved.
Employment agreementsThe employment agreements for the Managing Director and key management personnel are ongoing, permanent full-time agreements which do not have a stipulated fixed term. The designated notice period for the Managing Director is six months. For other executives, the designated notice period is between four weeks and three months.
Executive Performance Share Plan LTiP awards (Awards) are offered to executives under the Equity Trustees Limited Executive Performance Share Plan 1999 (the Plan). The first issue of Awards commenced with the 2005/06 Series and has continued in each subsequent year.
The structure of the Plan approved by the Remuneration Committee forms part of the remuneration structure of eligible executives, in particular, the long-term incentive component of remuneration.
The following is an overview of the key features of the Plan as determined by the Remuneration Committee and approved by the Board:
• The Remuneration Committee will consider and approve participants under the Plan;
• The value of the Award is determined by the Remuneration Committee;
• The number of share entitlements issued to each participant for a particular Series is calculated by dividing the value of the Award by the weighted average share price of EQT shares traded during the three month period to 30 June of each year;
• The performance criteria are based on:
– TSR for the Managing Director only; and
– AEPS for all participants;
• The criteria are selected as they are aligned to long-term growth in shareholder value;
• TSR is defined as the increase in share price over the three year measurement period, plus dividends reinvested over the three year period. This is compared to a Comparator Group based on the ASX Diversified Financials Index and a vesting scale applied;
– The vesting scale for live TSR Awards for series 2013/14 and 2014/15 is:
» A TSR ranking of 50th percentile achieves 50% of the available Award; or
» A TSR ranking of 75th percentile or above, achieves 100% of the available Award;
Equity Trustees Annual Report 2015 11
For
per
sona
l use
onl
y

• AEPS is based on normalised operating profit before tax, which excludes approved non-operating items such as acquisition and integration expenses and approved adjustments for certain material share issues. The AEPS is compared to the base year and a vesting scale applied to calculate earned entitlements;
– The vesting scale for live AEPS Awards is:
» Growth in pre-tax operating AEPS of 5% p.a. over the three year measurement period achieves 25% of the available Award; or
» Growth in pre-tax operating AEPS of 15% p.a. over three year measurement period achieves 100% of the available Award;
• The term of each Award series is a three year period, with additional performance assessments during the fourth year, if applicable. In relation to Awards aligned to the TSR criterion, if there is no Award achieved after the initial three year period, a fourth year measurement period is undertaken. If there is a partial achievement after the initial three year period, there is no fourth year assessment. There is no fourth year AEPS performance assessment, regardless of the outcome after the initial three year period;
• Each share entitlement converts to one ordinary share of EQT on exercise;
• No amounts are paid or payable by participants on receipt of the share entitlements;
• The share entitlements carry neither rights to dividends nor voting rights;
• The number of share entitlements on issue is adjusted for any capital reconstructions during the measurement period;
• Holders of share entitlements do not have a right, by virtue of the entitlements held, to participate in any new share issue of the Company;
• The participant must be employed within the Group for the duration of the measurement period to exercise any share entitlements;
• Shares are subject to forfeiture conditions during the three year measurement period;
• Shares can be assigned disposal restrictions of up to 12 years which will apply to shares issued following the three year measurement period;
• Dividends are received by participants once awards are vested into shares;
• The use of hedging or derivative techniques is not permitted until shares are released from the forfeiture condition. If hedging or derivative techniques are used during the period when there is still a forfeiture condition in place, then the shares are forfeited; and
• The EQT Securities Dealing Policy also makes reference to the ban on hedging or derivative techniques and applies to all Equity Trustees employees.
In accordance with the Plan, variations to the above features may apply, where approved by the Board.
The grant date for the 2014/15 Series was 25 July 2014 for executives and 31 October 2014 for the Managing Director. There were no alterations to terms or conditions of the 2014/15 Series compared to the prior year.
In relation to the 2012/13 Series, 96.86% of the AEPS criterion was achieved at the conclusion of the three year measurement period ended 30 June 2015. This has resulted in 57,637 EQT shares being awarded and the forfeiture of 4,586 AEPS Awards. In addition, 10,993 shares (100%) where awarded under the TSR criterion. During the year, departed employees received 1,075 shares under the 2013/14 series.
The following unvested share-based payment arrangements under the LTiP were in existence during the period:
Award SeriesNumber at
30 June 2015Grant date
Expiry date
Exercise price
Fair value at Grant date
Total maximum future
accounting value of Grant*
$ $ $2014/15 Series 65,496 ** 30/06/2017 Nil 16.18 706,3592013/14 Series 60,215 *** 30/06/2016 Nil 12.52 338,212Totals 125,711 1,044,571
* The minimum future accounting value of each Grant is nil.** The Grant date for executives was 25 July 2014 and for the Managing Director, 31 October 2014.*** The Grant date for executives was 26 July 2013 and for the Managing Director, 26 October 2013.
12 Equity Trustees Annual Report 2015
For
per
sona
l use
onl
y

The share entitlements were valued by PricewaterhouseCoopers using an adjusted form of the Black-Scholes Option Pricing Model that incorporates a Monte Carlo simulation analysis. The model has been modified to incorporate an estimate of the probability of achieving the TSR hurdle and the number of share entitlements vesting.
Inputs into the model 2014/15 Series 2013/14 Series
Managing Director Other participants Managing Director Other participants
Grant date share price $19.20 $20.20 $18.80 $14.72Exercise price Nil Nil Nil NilExpected volatility 25% 25% 25% 25%Share entitlement life* 3 years 3 years 3 years 3 yearsDividend yield 5.5% 5.5% 6.5% 6.5%Risk-free interest rate 2.57% 2.68% 2.66% 3.0%
* In accordance with the Plan, the measurement of performance criteria is at the end of the three year period ending 30 June, however, if the TSR performance criterion (Managing Director only) is zero a further assessment at the end of the fourth year will apply.
The following reconciles the outstanding share entitlements granted under the Plan at the beginning and end of the financial year:
2015 2014
Number of share entitlements
Number of share entitlements
Balance of Awards not vested at beginning of the financial year 147,928 126,480New Awards granted during the financial year 65,496 74,712Awards exercised into shares during the financial year (5,097) -Awards vested during the financial year (64,608) (33,350)Awards forfeited during the year (18,008) (19,914)Balance of Awards not vested at end of the financial year1 125,711 147,928Vested and Exercisable Awards – Balance at end of the financial year1 135,984 75,471
1 The share entitlements outstanding at the end of the financial year had an exercise price of nil. The share entitlements outstanding at the end of the financial year, excluding the share entitlements exercisable at the end of financial year, had a weighted average remaining contractual life of 556 days (2014: 549 days). For the TSR component of the Managing Director’s Award, a further TSR test may be available at the end of the fourth year if none of the performance criteria is achieved at the end of the three year measurement period.
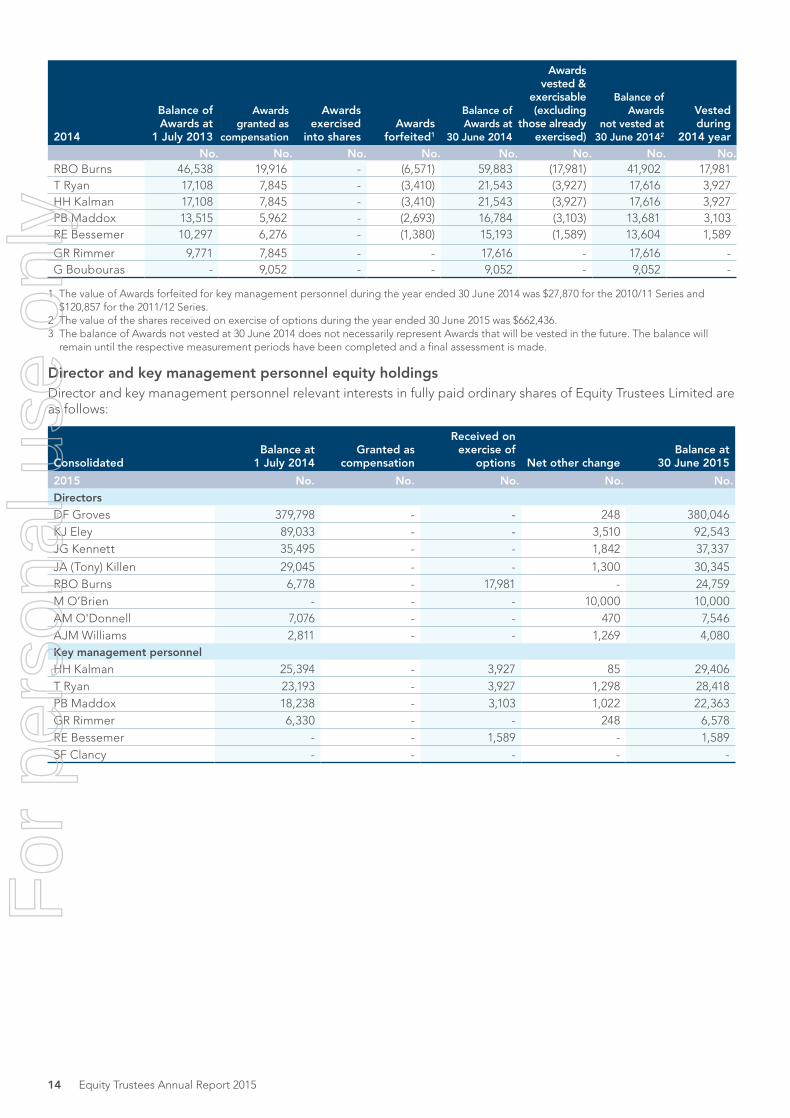
The following is a summary of movements in Awards in respect of key management personnel:
2015
Balance of Awards at
1 July 2014
Awards granted as
compensation
Awards exercised
into sharesAwards
forfeited1
Balance of Awards at
30 June 2015
Awards vested &
exercisable (excluding
those already exercised)
Balance of Awards
not vested at 30 June 20152
Vested during
2015 year
No. No. No. No. No. No. No. No.RBO Burns 41,902 19,194 - (345) 60,751 (21,641) 39,110 21,641T Ryan 17,616 7,501 - (307) 24,810 (9,464) 15,346 9,464HH Kalman 17,616 7,501 - (307) 24,810 (9,464) 15,346 9,464GR Rimmer 17,616 8,383 - (307) 25,692 (9,464) 16,228 9,464PB Maddox 13,681 5,626 - (242) 19,065 (7,477) 11,588 7,477
RE Bessemer 13,604 6,398 - (230) 19,772 (7,098) 12,674 7,098G Boubouras 9,052 - - (9,052) - - - -SF Clancy - 6,067 - - 6,067 - 6,067 -
1 The value of Awards forfeited for key management personnel during the year ended 30 June 2015 was $14,880 for the 2012/13 Series.2 The balance of Awards not vested at 30 June 2015 does not necessarily represent Awards that will be vested in the future. The balance will
remain until the respective measurement periods have been completed and a final assessment is made.
Equity Trustees Annual Report 2015 13
For
per
sona
l use
onl
y
2014
Balance of Awards at
1 July 2013
Awards granted as
compensation
Awards exercised
into sharesAwards
forfeited1
Balance of Awards at
30 June 2014
Awards vested &
exercisable (excluding
those already exercised)
Balance of
Awards not vested at
30 June 20142
Vested during
2014 year
No. No. No. No. No. No. No. No.RBO Burns 46,538 19,916 - (6,571) 59,883 (17,981) 41,902 17,981T Ryan 17,108 7,845 - (3,410) 21,543 (3,927) 17,616 3,927HH Kalman 17,108 7,845 - (3,410) 21,543 (3,927) 17,616 3,927PB Maddox 13,515 5,962 - (2,693) 16,784 (3,103) 13,681 3,103RE Bessemer 10,297 6,276 - (1,380) 15,193 (1,589) 13,604 1,589
GR Rimmer 9,771 7,845 - - 17,616 - 17,616 -G Boubouras - 9,052 - - 9,052 - 9,052 -
1 The value of Awards forfeited for key management personnel during the year ended 30 June 2014 was $27,870 for the 2010/11 Series and $120,857 for the 2011/12 Series.
2 The value of the shares received on exercise of options during the year ended 30 June 2015 was $662,436.3 The balance of Awards not vested at 30 June 2014 does not necessarily represent Awards that will be vested in the future. The balance will
remain until the respective measurement periods have been completed and a final assessment is made.
Director and key management personnel equity holdingsDirector and key management personnel relevant interests in fully paid ordinary shares of Equity Trustees Limited are as follows:
ConsolidatedBalance at
1 July 2014Granted as
compensation
Received on exercise of
options Net other changeBalance at
30 June 2015
2015 No. No. No. No. No.
Directors
DF Groves 379,798 - - 248 380,046KJ Eley 89,033 - - 3,510 92,543JG Kennett 35,495 - - 1,842 37,337
JA (Tony) Killen 29,045 - - 1,300 30,345RBO Burns 6,778 - 17,981 - 24,759M O’Brien - - - 10,000 10,000AM O'Donnell 7,076 - - 470 7,546AJM Williams 2,811 - - 1,269 4,080Key management personnel
HH Kalman 25,394 - 3,927 85 29,406T Ryan 23,193 - 3,927 1,298 28,418PB Maddox 18,238 - 3,103 1,022 22,363GR Rimmer 6,330 - - 248 6,578RE Bessemer - - 1,589 - 1,589SF Clancy - - - - -
14 Equity Trustees Annual Report 2015
For
per
sona
l use
onl
y

ConsolidatedBalance at
1 July 2013Granted as
compensation
Received on exercise of
optionsNet other
changeBalance at
30 June 2014
2014 No. No. No. No. No.
Directors
DF Groves 640,961 - - (261,163) 379,798KJ Eley 34,832 - - 54,201 89,033JG Kennett 19,279 - - 16,216 35,495JA (Tony) Killen 15,982 - - 13,063 29,045AM O’Donnell 1,050 - - 6,026 7,076RBO Burns 1,000 3,017 2,011 750 6,778AJM Williams 436 - - 2,375 2,811Key management personnel
HH Kalman 12,674 - 1,798 10,922 25,394T Ryan 17,914 - 1,798 3,481 23,193PB Maddox 15,911 - 1,451 876 18,238GR Rimmer 3,759 - - 2,571 6,330RE Bessemer - - - - -
Non-audit servicesThe Directors are satisfied that the provision of non-audit services during the year, by the auditor (or by another person or firm on the auditor’s behalf), is compatible with the general standard of independence for auditors imposed by the Corporations Act 2001.
Details of amounts paid or payable to the auditor for non-audit services provided during the year by the auditor are outlined in note 11 to the financial statements.
Auditors’ independence declarationThe auditors’ independence declaration is included on page 18 of the financial report.
Licensed TrusteeEquity Trustees Limited is licensed under the Corporations Act 2001 to provide traditional trustee company services. This includes performing estate management functions, preparing a Will, preparing a trust instrument, preparing a power of attorney or preparing an agency agreement, applying for probate of a Will, applying for grant of letter of administration or electing to administer a deceased estate, and establishing and operating common funds. Assets and liabilities of trusts, estates and agencies for which the Company acts as trustee, executor or agent, are not included in the Company’s financial statement.
On behalf of the Directors
Mr Robin BO Burns
Managing Director Dated 27 August 2015
Equity Trustees Annual Report 2015 15
For
per
sona
l use
onl
y

Board of Directors’ ProfilesThe qualifications and experience of the Board of Directors of Equity Trustees Limited, before, during and since the year ended 30 June 2015 is as follows:
BA, FAICD, FAIM
Chairman – Appointed 30 August 2007
Non-Executive Director – Appointed September 2002
Chairman of the Board Risk Committee since May 2015
Tony is Chairman of listed company Templeton Global Growth Fund Ltd and Chairman of CCI Asset Management Ltd. He is also a non-executive director of Victoria Golf Club Limited and Catholic Church Insurance Ltd.
Tony is a former Group Managing Director and Chief Executive Officer of AXA Asia Pacific Holdings Ltd, having had a 36 year career with the National Mutual/AXA group. He was also Chairman of Australia’s largest not-for-profit health services provider, Sisters of Charity Health Service Ltd. Tony was also a non-executive director of listed company IRESS Market Technology Ltd and Chairman of Sisters of Charity Community Care Ltd.
In 2011, Mr Killen was awarded the Medal of the Order of Australia.
DipAcc, FAICD
Executive Director since 1 March 2010
Member of the Board Investment Committee from 1 July 2013.
Robin was appointed Managing Director of Equity Trustees on 1 March 2010. Before joining Equity Trustees he was, from 2002, Chief Executive Officer of Equipsuper Pty Ltd, the trustee company for the Equipsuper multi-employer superannuation fund. Robin is a non-executive director of the Financial Services Council.
Robin previously worked for AXA Asia Pacific, where he held the positions of General Manager, Corporate Affairs and Chief Executive, Risk Insurance and for the stockbroking firm Prudential-Bache Securities (Australia), where he was Managing Director, having joined the firm as Chief Financial Officer.
Robin has 29 years of experience in the financial services industry. He gained his initial professional qualification as a chartered accountant in the UK in 1981.
BCom, MCom, CA, FAICD
Deputy Chairman since December 2007
Non-Executive Director since November 2000.
Member of the Audit & Compliance Committee since January 2002. Chairman from January 2003 to January 2015. Member of the Remuneration, Human Resources & Nominations Committee and Board Investment Committee since January 2015. Member of the Board Risk Committee since May 2015.
David is a director of Pipers Brook Vineyard Pty Ltd and Tasman Sea Salt Pty Ltd. Since March 2015, he has been a member of the Australian Rugby Foundation Advisory Board.
David is a former director of Tassal Group Limited, GrainCorp Limited, Mason Stewart Publishing, Camelot Resources NL and a former executive with Macquarie Bank Limited and its antecedent, Hill Samuel Australia.
BCom, FCPA, FAICD, ASFA AIF, CFA
Non-Executive Director – Appointed September 2007
Member of the Remuneration, Human Resources & Nominations Committee since July 2011. Appointed Chairman in August 2011. Member of the Board Investment Committee from 1 July 2013.
Member of the Board Risk Committee since May 2015. Member of Audit & Compliance Committee between September 2007 and February 2012.
Alice has over 25 years’ senior management and Board level experience in the corporate and Government sectors specialising in investment management, corporate advisory and equity fundraising.
Other non-executive directorships include; Djerriwarrh Investments Ltd, Defence Health, Guild Group Holdings Limited, Port of Melbourne Corporation, Cooper Energy, Barristers’ Chambers Ltd and the Foreign Investment Review Board. Alice is also a member of the Djerriwarrh Investment Committee.
Alice was formerly a director of Australian Accounting Standards Board, State Trustees, NM Rothschild and Sons (Australia) Limited, Director of Strategy and Planning for Ansett Australia Holdings Limited, Victorian Funds Management Corporation and a Vice President at JP Morgan Australia.
JA (TONY) KILLEN OAM
CHAIRMAN
ROBIN BO BURNS
MANAGING DIRECTOR
DAVID F GROVES
DEPUTY CHAIRMAN
ALICE JM WILLIAMS
DIRECTOR
16 Equity Trustees Annual Report 2015
For
per
sona
l use
onl
y

HonDBus (Ballarat), Hon LL D (Deakin)
Non-Executive Director – Appointed September 2008
Member of the Remuneration, Human Resources & Nominations Committee since September 2008. Member of the Board Risk Committee since May 2015.
Jeff was an Officer in the Royal Australian Regiment, serving at home and overseas. He was a Member of the Victorian Parliament for 23 years, and was Premier of the State from 1992 to 1999.
Jeff is Chairman of beyondblue: the national depression initiative and Chairman of The Torch, a program assisting incarcerated Indigenous men and women.
Jeff is Chairman of Primary Opinion Limited and a Director of Seven West Media Ltd.
He is also Chairman of Open Windows Australia Proprietary Limited, Chairman of CT Management Group Pty Ltd, Chairman of Amtek Corporation Pty Ltd and Chairman of LEDified Lighting Corporation Pty Ltd.
Jeff is Patron of The Royal District Nursing Service and Sovereign Hill Ballarat and associated with many other community organisations.
In 2005, he was awarded the Companion of the Order of Australia.
BA (Bkg & Fin), MBA, FAICD, SF Fin
Non-Executive Director – Appointed September 2010
Member of the Audit & Compliance Committee since December 2010.
Member of the Remuneration, Human Resources & Nominations Committee since January 2015.
Member of the Board Risk Committee since May 2015.
Anne has some 35 years’ experience in the finance sector. She is an experienced executive and non-executive director in the listed, not-for-profit and mutual sectors.
Anne is a director of the Australian Institute of Company Directors, Community CPS Australia Ltd (trading as Beyond Bank Australia), Eastwoods Pty Ltd and The Winston Churchill Memorial Trust.
Anne is also an external member of the UBS Global Asset Management (Australia) Ltd Compliance Committee, Chair of the IP Australia Audit Committee, a member of the Investment, Audit & Risk Committee of the Winston Churchill Memorial Trust and a member of the Nominations Committee of Goodwin Aged Care Services Ltd.
Anne is the former Managing Director of Australian Ethical Investment Ltd. Anne was formerly a director of the Financial Services Council, The Centre for Australian Ethical Research Pty Ltd, the ANZ Staff Superannuation Fund and The Grain Growers Association Ltd.
CA, F FIN, FAICD
Non-Executive Director – Appointed November 2011
Member of the Audit & Compliance Committee from November 2011 and appointed Chair in January 2015.
Member of Board Risk Committee since May 2015.
Kevin is a Chartered Accountant and a Fellow of the Financial Services Institute of Australia. He has over 30 years’ experience in management, financing and investment and has worked for a major international accounting firm, two investment banks and was CEO of HGL Limited where he remains as a non-executive director.
Other current non-executive directorships include: Milton Corporation Limited and PO Valley Energy Limited.
In the previous three years, Kevin sat on Kresta Holdings Limited Board and prior to that had numerous other listed company Board positions.
FIAA, CFA, GAICD
Non-Executive Director – Appointed August 2014
Member of Audit & Compliance Committee from 1 January 2015.
Chairperson of the Board Investment Committee from 1 January 2015.
Member of the Board Risk Committee from May 2015.
Mick is a Fellow of the Institute of Actuaries of Australia and holds the Chartered Financial Analyst designation.
He is a non-executive director of Templeton Global Growth Fund Limited and Franklin Global Property Limited and a member of the Actuaries Institute Wealth Management Committee.
Mick has broad wealth management experience in superannuation, investment management, insurance and advice, spanning over 30 years in both retail and institutional markets. Mick was formerly CEO and director of Invesco Australia Limited, director of Alliance Capital Management Australia and Chief Investment Officer of AXA Australia and New Zealand where he was also a director of all AXA’s Responsible Entities and Regulated Superannuation Entities.
THE HON JEFFREY G
KENNETT AC
DIRECTOR
ANNE M O’DONNELL
DIRECTOR
KEVIN J ELEY
DIRECTOR
MICHAEL J O’BRIEN
DIRECTOR
Equity Trustees Annual Report 2015 17
For
per
sona
l use
onl
y
Auditor’s Independence Declaration
Liability limited by a scheme approved under Professional Standards Legislation.
Member of Deloitte Touche Tohmatsu Limited
Deloitte Touche Tohmatsu ABN 74 490 121 060 550 Bourke Street Melbourne VIC 3000 GPO Box 78 Melbourne VIC 3001 Australia Tel: +61 3 9671 7000 Fax: +61 3 9671 7001 www.deloitte.com.au
The Board of Directors Equity Trustees Limited Level 2, 575 Bourke Street MELBOURNE VIC 3000
27 August 2015
Dear Board Members
Equity Trustees Limited
In accordance with section 307C of the Corporations Act 2001, I am pleased to provide the following declaration of independence to the directors of Equity Trustees Limited.
As lead audit partner for the audit of the financial statements of Equity Trustees Limited for the financial year ended 30 June 2015, I declare that to the best of my knowledge and belief, there have been no contraventions of:
(i) the auditor independence requirements of the Corporations Act 2001 in relation to the audit; and
(ii) any applicable code of professional conduct in relation to the audit.
Yours sincerely
DELOITTE TOUCHE TOHMATSU
Neil Brown Partner Chartered Accountants
18 Equity Trustees Annual Report 2015
For
per
sona
l use
onl
y

Equity Trustees Limited ABN 46 004 031 298
Directors’ Declaration for the financial year ended 30 June 2015
The Directors declare that:
a. In the Directors’ opinion, there are reasonable grounds to believe that the Company will be able to pay its debts as and when they become due and payable;
b. The attached financial statements are in compliance with International Financial Reporting Standards, as stated in note 3 to the financial statements;
c. In the Directors’ opinion, the attached financial statements and notes thereto are in accordance with the Corporations Act 2001, including compliance with accounting standards and giving a true and fair view of the financial position and performance of the Company and the Group; and
d. The Directors have received from the Managing Director and the Chief Financial Officer the declarations required by section 295A of the Corporations Act 2001.
Signed in accordance with a resolution of the Directors made pursuant to section 295(5) of the Corporations Act 2001.
On behalf of the Directors
Mr Robin BO Burns
Managing Director Melbourne, 27 August 2015
Directors’ Declaration
Equity Trustees Annual Report 2015 19
For
per
sona
l use
onl
y

For
per
sona
l use
onl
y

Financial Report 2015F
or p
erso
nal u
se o
nly

For
per
sona
l use
onl
y

Statement of Profit or Lossfor the Financial Year Ended 30 June 2015
Consolidated Company
Note2015
$2014
$2015
$2014
$
Revenue 6 83,735,281 52,584,757 42,919,966 36,025,775
Other revenue 6 1,122,027 2,349,842 39,053,314 11,404,224
Total revenue 6 84,857,308 54,934,599 81,973,280 47,429,999
Employee benefits expenses 8 39,433,097 26,863,735 39,432,455 23,809,791
Other employment and contracting expenses 3,348,953 1,576,134 3,348,953 1,392,113
Audit and tax advice expenses 1,275,398 507,073 1,117,282 448,447
Depreciation and amortisation expenses 8 1,795,960 1,340,544 1,659,109 1,254,111
Management rights amortisation 8 1,345,651 197,030 - -
Insurance expenses 847,921 583,232 840,421 392,323
Legal, consulting and regulatory expenses 2,481,266 3,003,217 2,432,153 2,957,102
Marketing expenses 1,692,548 1,327,099 1,688,350 1,182,324
Information technology expenses 3,784,362 2,361,586 3,778,544 2,176,152
Occupancy expenses 2,334,267 1,736,939 2,339,540 1,391,600
Other expenses 2,359,622 2,031,614 2,446,971 1,770,158
Total expenses 60,699,045 41,528,203 59,083,778 36,774,121
Profit before income tax expense 24,158,263 13,406,396 22,889,502 10,655,878
Income tax expense 9 7,198,841 3,692,984 1,776,911 1,622,214
Profit for the year 16,959,422 9,713,412 21,112,591 9,033,664
Attributable to: Owners of the Company 16,959,422 9,713,412 21,112,591 9,033,664
16,959,422 9,713,412 21,112,591 9,033,664
Earnings per share
Basic (cents per share) 28 87.80 88.64
Diluted (cents per share) 28 87.16 87.51 The above statement should be read in conjunction with the accompanying notes to the financial statements.
Equity Trustees Annual Report 2015 23
For
per
sona
l use
onl
y

Statement of Profit or Loss and Other Comprehensive Incomefor the Financial Year Ended 30 June 2015
Consolidated Company
Note2015
$2014
$2015
$2014
$
Profit for the year 16,959,422 9,713,412 21,112,591 9,033,664
Other comprehensive income
Items that may be reclassified subsequently to profit or loss
Realised (gain)/loss on sale of available-for-sale investments
- (196,977) - (196,977)
Increase/(decrease) from revaluation of available-for-sale investments
(72,950) 277,071 (72,950) 277,071
Income tax relating to items that may be reclassified subsequently
21,885 (24,099) 21,885 (24,099)
Total comprehensive income for the year 16,908,357 9,769,407 21,061,526 9,089,659
Attributable to:
Owners of the Company 16,908,357 9,769,407 21,061,526 9,089,659
16,908,357 9,769,407 21,061,526 9,089,659 The above statement should be read in conjunction with the accompanying notes to the financial statements.
24 Equity Trustees Annual Report 2015
For
per
sona
l use
onl
y
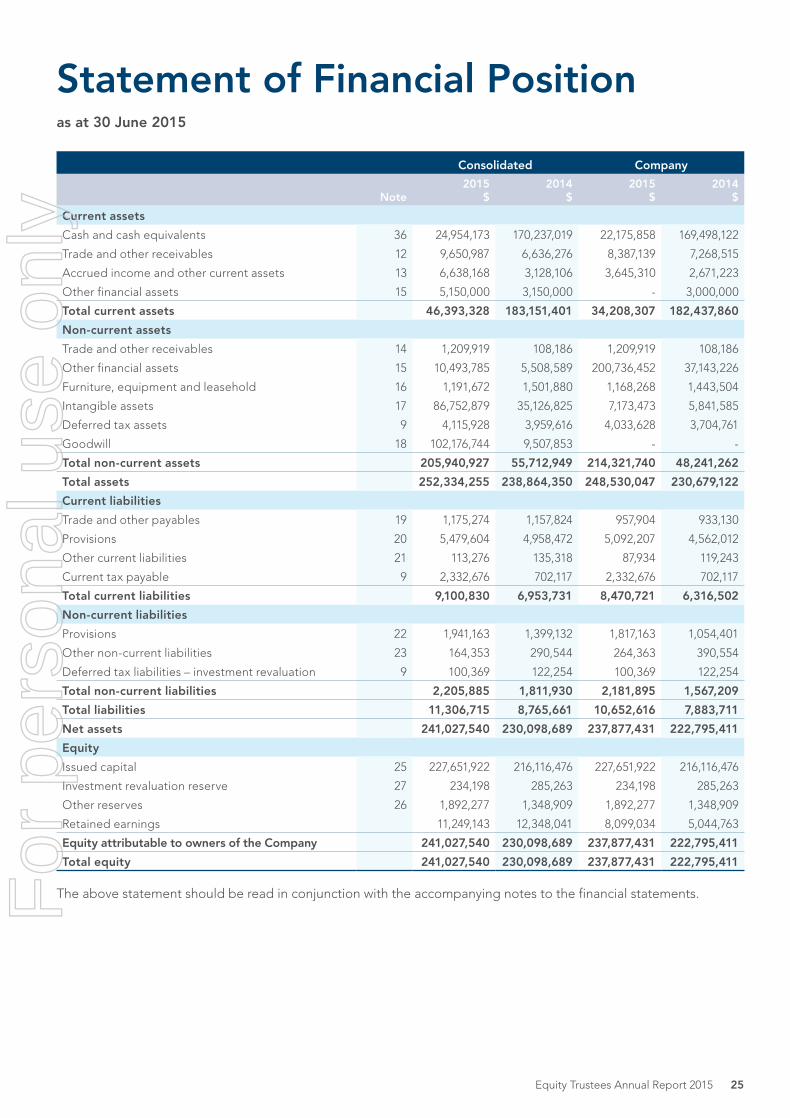
Statement of Financial Positionas at 30 June 2015
Consolidated Company
Note2015
$2014
$2015
$2014
$
Current assets
Cash and cash equivalents 36 24,954,173 170,237,019 22,175,858 169,498,122
Trade and other receivables 12 9,650,987 6,636,276 8,387,139 7,268,515
Accrued income and other current assets 13 6,638,168 3,128,106 3,645,310 2,671,223
Other financial assets 15 5,150,000 3,150,000 - 3,000,000
Total current assets 46,393,328 183,151,401 34,208,307 182,437,860
Non-current assets
Trade and other receivables 14 1,209,919 108,186 1,209,919 108,186
Other financial assets 15 10,493,785 5,508,589 200,736,452 37,143,226
Furniture, equipment and leasehold 16 1,191,672 1,501,880 1,168,268 1,443,504
Intangible assets 17 86,752,879 35,126,825 7,173,473 5,841,585
Deferred tax assets 9 4,115,928 3,959,616 4,033,628 3,704,761
Goodwill 18 102,176,744 9,507,853 - -
Total non-current assets 205,940,927 55,712,949 214,321,740 48,241,262
Total assets 252,334,255 238,864,350 248,530,047 230,679,122
Current liabilities
Trade and other payables 19 1,175,274 1,157,824 957,904 933,130
Provisions 20 5,479,604 4,958,472 5,092,207 4,562,012
Other current liabilities 21 113,276 135,318 87,934 119,243
Current tax payable 9 2,332,676 702,117 2,332,676 702,117
Total current liabilities 9,100,830 6,953,731 8,470,721 6,316,502
Non-current liabilities
Provisions 22 1,941,163 1,399,132 1,817,163 1,054,401
Other non-current liabilities 23 164,353 290,544 264,363 390,554
Deferred tax liabilities – investment revaluation 9 100,369 122,254 100,369 122,254
Total non-current liabilities 2,205,885 1,811,930 2,181,895 1,567,209
Total liabilities 11,306,715 8,765,661 10,652,616 7,883,711
Net assets 241,027,540 230,098,689 237,877,431 222,795,411
Equity
Issued capital 25 227,651,922 216,116,476 227,651,922 216,116,476
Investment revaluation reserve 27 234,198 285,263 234,198 285,263
Other reserves 26 1,892,277 1,348,909 1,892,277 1,348,909
Retained earnings 11,249,143 12,348,041 8,099,034 5,044,763
Equity attributable to owners of the Company 241,027,540 230,098,689 237,877,431 222,795,411
Total equity 241,027,540 230,098,689 237,877,431 222,795,411 The above statement should be read in conjunction with the accompanying notes to the financial statements.
Equity Trustees Annual Report 2015 25
For
per
sona
l use
onl
y

Statement of Changes in Equityfor the Financial Year Ended 30 June 2015
Consolidated Reserves
Fully paid ordinary shares
$
Investment revaluation
$
Retained earnings
$
Equity settled
employee benefits
$
Total equity
$
Balance at 1 July 2013 49,601,432 229,268 11,612,078 1,147,222 62,590,000
Profit for the period - - 9,713,412 - 9,713,412
Increase from revaluation of available-for-sale investments
- 277,071 - - 277,071
Related income tax - (82,757) - - (82,757)
Gain on sale of available-for-sale investments - (196,977) - - (196,977)
Related income tax - 58,658 - - 58,658
Total comprehensive income for the period - 55,995 9,713,412 - 9,769,407
Shares issued under employee salary sacrifice share plan
44,369 - - - 44,369
Shares issued under dividend reinvestment plan 2,334,221 - - - 2,334,221
Shares issued under employee share acquisition plan
169,936 - - (169,936) -
Shares issued under executive share scheme 161,680 - - (161,680) -
Shares issued under share placement 2,979,707 - - - 2,979,707
Shares issued for ANZ Trustees acquisition 159,991,607 - - - 159,991,607
Shares issued for The Trust Company shares 6,072,620 - - - 6,072,620
Share issue costs (7,484,420) - - - (7,484,420)
Related income tax 2,245,324 - - - 2,245,324
Provision for executive share entitlements - - - 356,367 356,367
Provision for employee share acquisition plan - - - 176,936 176,936
Payment of dividends - - (8,977,449) - (8,977,449)
Balance at 30 June 2014 216,116,476 285,263 12,348,041 1,348,909 230,098,689
Profit for the period - - 16,959,422 - 16,959,422
Decrease from revaluation of available-for-sale investments
- (72,950) - - (72,950)
Related income tax - 21,885 - - 21,885
Total comprehensive income for the period - (51,065) 16,959,422 - 16,908,357 Shares issued under employee salary sacrifice share plan
61,908 - - - 61,908
Shares issued under dividend reinvestment plan 6,108,145 - - - 6,108,145
Shares issued under employee share acquisition plan
220,196 - - (220,196) -
Shares issued under executive share scheme 371,824 - - (371,824) - Shares issued under share placement 4,953,325 - - - 4,953,325 Share issue costs (257,075) - - - (257,075)Related income tax 77,123 - - - 77,123 Provision for executive share entitlements - - - 859,192 859,192 Provision for employee share acquisition plan - - - 276,196 276,196 Payment of dividends - - (18,058,320) - (18,058,320)
Balance at 30 June 2015 227,651,922 234,198 11,249,143 1,892,277 241,027,540
The above statement should be read in conjunction with the accompanying notes to the financial statements.
26 Equity Trustees Annual Report 2015
For
per
sona
l use
onl
y
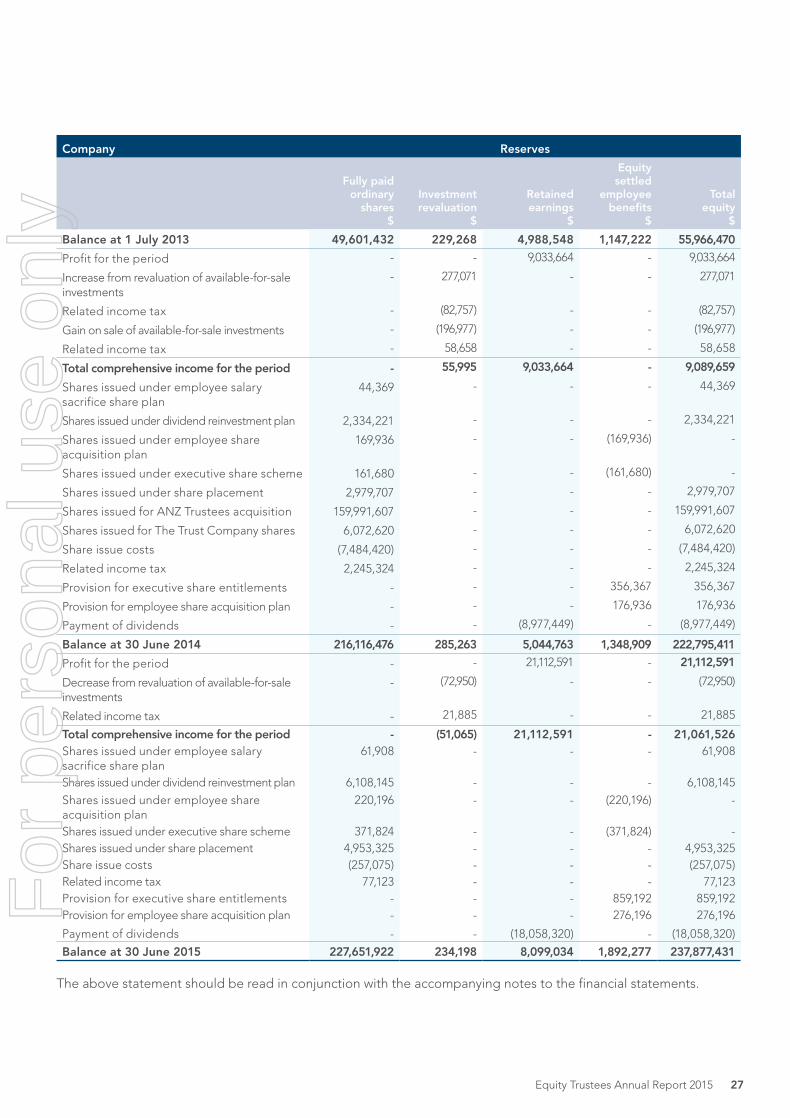
Company Reserves
Fully paid ordinary
shares $
Investment revaluation
$
Retained earnings
$
Equity settled
employee benefits
$
Total equity
$
Balance at 1 July 2013 49,601,432 229,268 4,988,548 1,147,222 55,966,470
Profit for the period - - 9,033,664 - 9,033,664
Increase from revaluation of available-for-sale investments
- 277,071 - - 277,071
Related income tax - (82,757) - - (82,757)
Gain on sale of available-for-sale investments - (196,977) - - (196,977)
Related income tax - 58,658 - - 58,658
Total comprehensive income for the period - 55,995 9,033,664 - 9,089,659
Shares issued under employee salary sacrifice share plan
44,369 - - - 44,369
Shares issued under dividend reinvestment plan 2,334,221 - - - 2,334,221
Shares issued under employee share acquisition plan
169,936 - - (169,936) -
Shares issued under executive share scheme 161,680 - - (161,680) -
Shares issued under share placement 2,979,707 - - - 2,979,707
Shares issued for ANZ Trustees acquisition 159,991,607 - - - 159,991,607
Shares issued for The Trust Company shares 6,072,620 - - - 6,072,620
Share issue costs (7,484,420) - - - (7,484,420)
Related income tax 2,245,324 - - - 2,245,324
Provision for executive share entitlements - - - 356,367 356,367
Provision for employee share acquisition plan - - - 176,936 176,936
Payment of dividends - - (8,977,449) - (8,977,449)
Balance at 30 June 2014 216,116,476 285,263 5,044,763 1,348,909 222,795,411
Profit for the period - - 21,112,591 - 21,112,591
Decrease from revaluation of available-for-sale investments
- (72,950) - - (72,950)
Related income tax - 21,885 - - 21,885
Total comprehensive income for the period - (51,065) 21,112,591 - 21,061,526Shares issued under employee salary sacrifice share plan
61,908 - - - 61,908
Shares issued under dividend reinvestment plan 6,108,145 - - - 6,108,145
Shares issued under employee share acquisition plan
220,196 - - (220,196) -
Shares issued under executive share scheme 371,824 - - (371,824) - Shares issued under share placement 4,953,325 - - - 4,953,325 Share issue costs (257,075) - - - (257,075)Related income tax 77,123 - - - 77,123 Provision for executive share entitlements - - - 859,192 859,192 Provision for employee share acquisition plan - - - 276,196 276,196
Payment of dividends - - (18,058,320) - (18,058,320)
Balance at 30 June 2015 227,651,922 234,198 8,099,034 1,892,277 237,877,431 The above statement should be read in conjunction with the accompanying notes to the financial statements.
Equity Trustees Annual Report 2015 27
For
per
sona
l use
onl
y

Statement of Cash Flowsfor the Financial Year Ended 30 June 2015
Consolidated Company
Note2015
$2014
$2015
$2014
$
Cash flows from operating activities
Receipts from customers 94,424,686 61,289,215 74,703,134 44,155,545
Payments to suppliers and employees (73,770,916) (48,168,861) (68,032,033) (39,846,026)
Income tax paid (5,347,571) (4,139,798) (5,347,571) (4,139,798)
Net cash provided by operating activities 36 (b) 15,306,199 8,980,556 1,323,530 169,721
Cash flows from investing activities
Payment for investment securities (10,000,000) (4,150,000) - (4,000,000)
Proceeds on sale of investment securities 3,000,000 7,938,376 3,000,000 7,938,376
Interest received 953,048 521,258 634,261 500,640
Dividends received 1,491 164,794 1,491 164,794
Proceeds from repayment of related party loans - - 5,900,000 8,949,683
Payment for furniture, equipment and leasehold (548,136) (633,891) (548,136) (633,891)
Payment for intangible assets (2,168,272) (1,503,308) (2,168,272) (1,503,308)
Payment for shares in a subsidiary (145,370,794) - (156,008,756) -
Net cash provided by/(used in) investing activities
(154,132,663) 2,337,229 (149,189,412) 11,416,294
Cash flows from financing activities
Proceeds from issues of equity securities 5,750,684 163,153,729 5,750,684 163,153,729
Dividend received from related party - - 7,000,000 -
Payment for share issue cost (257,075) (7,484,420) (257,075) (7,484,420)
Dividend paid to members of the parent entity (net of shares issued under dividend reinvestment plan)
(11,949,991) (6,642,009) (11,949,991) (6,642,009)
Net cash provided by financing activities (6,456,382) 149,027,300 543,618 149,027,300
Net (decrease)/increase in cash held (145,282,846) 160,345,085 (147,322,264) 160,613,315
Cash and cash equivalents at beginning of financial year
170,237,019 9,891,934 169,498,122 8,884,807
Cash and cash equivalents at end of financial year
36 (a) 24,954,173 170,237,019 22,175,858 169,498,122
The above statement should be read in conjunction with the accompanying notes to the financial statements.
28 Equity Trustees Annual Report 2015
For
per
sona
l use
onl
y

Notes to the Financial Statementsfor the Financial Year Ended 30 June 2015
1. General informationEquity Trustees Limited (the Company) is a public company listed on the Australian Securities Exchange (trading under the symbol “EQT”), incorporated in Australia and operating solely in Australia.
Equity Trustees Limited’s registered office and its principal place of business is Level 2, 575 Bourke St, Melbourne, Victoria 3000, Australia. Equity Trustees Limited and its subsidiaries (refer note 32) are referred to as ‘the Group’ in the following notes. The principal activities of the Group are described in note 34.
2. Application of new and revised Accounting Standards2.1 Amendments to AASBs and the new Interpretation that are mandatorily effective for the current year In the current year, the Group has applied a number of amendments to AASBs and a new Interpretation issued by the Australian Accounting Standards Board (AASB) that are mandatorily effective for an accounting period that begins on or after 1 July 2014, and therefore relevant for the current year end. The amendments and New Interpretations that are relevant to the Group are listed below.
AASB 2014-1
‘Amendments to Australian Accounting Standards’
(Part A: Annual Improvements 2010–2012 and 2011–2013 Cycles)
The Annual Improvements 2010-2012 has made number of amendments to various AASBs.
The application of these amendments does not have any material impact on the disclosures or on the amounts recognised in the Group’s consolidated financial statements.
AASB 1031 ‘Materiality’, AASB 2013-9 ‘Amendments to Australian Accounting Standards’ – Conceptual Framework, Materiality and Financial Instruments’
(Part B: Materiality), AASB 2014-1 ‘Amendments to Australian Accounting Standards’ (Part C: Materiality)
The adoption of AASB 1031, AASB 2013-9 (Part B) and AASB 2014-1 (Part C) does not have any material impact on the disclosures or the amounts recognised in the Group’s consolidated financial statements.
The application of the new and revised Standards has had no impact on basic and diluted earnings per share (2014: nil).
2.2 Standards and Interpretations in issue not yet adoptedAt the date of authorisation of the financial statements, there were a number of Standards and Interpretations in issue but not yet effective. The Standards and Interpretations in issue but not yet effective relevant to the Group are listed below.
Standard/Interpretation
Effective for annual reporting periods
beginning on or after
Expected to be initially applied in
the financial year ending
AASB 9 ‘Financial Instruments’, and the relevant amending standards 1 January 2018 30 June 2019
AASB 15 ‘Revenue from Contracts with Customers’ and AASB 2014-5 ‘Amendments to Australian Accounting Standards arising from AASB 15’
1 January 2017 30 June 2018
AASB 2014-4 ‘Amendments to Australian Accounting Standards – Clarification of Acceptable Methods of Depreciation and Amortisation’
1 January 2016 30 June 2017
AASB 2015-1 ‘Amendments to Australian Accounting Standards – Annual Improvements to Australian Accounting Standards 2012-2014 Cycle’
1 January 2016 30 June 2017
AASB 2015-2 ‘Amendments to Australian Accounting Standards – Disclosure Initiative: Amendments to AASB 101’
1 January 2016 30 June 2017
AASB 2015-3 ‘Amendments to Australian Accounting Standards arising from the Withdrawal of AASB 1031 Materiality’
1 July 2015 30 June 2016
At the date of authorisation of the financial statements, there were no IASB Standards and IFRIC Interpretations that were issued but not yet effective.
Equity Trustees Annual Report 2015 29
For
per
sona
l use
onl
y

2. Application of new and revised Accounting Standards (cont’d)Changes in accounting policiesA number of Australian Accounting Standards and Interpretations are in issue but are not effective for the current year end. The following existing group accounting policies will change on adoption of these pronouncements:
AASB 9 ‘Financial Instruments’, and the relevant amending standardsAASB 9 issued in December 2009 introduced new requirements for the classification and measurement of financial assets. AASB 9 was subsequently amended in December 2010 to include requirements for the classification and measurement of financial liabilities and for derecognition, and in December 2013 to include the new requirements for general hedge accounting. Another revised version of AASB 9 was issued in December 2014 mainly to include a) impairment requirements for financial assets and b) limited amendments to the classification and measurement requirements by introducing a ‘fair value through other comprehensive income’ (FVTOCI) measurement category for certain simple debt instruments. Key requirements of AASB 9 that are relevant to the group are as follows:
AASB 9 requires all recognised financial assets that are within the scope of AASB 139 ‘Financial Instruments: Recognition and Measurement’ to be subsequently measured at amortised cost or fair value. Under AASB 9 debt investments that are held within a business model whose objective is to collect the contractual cash flows, and that have contractual cash flows that are solely payments of principal and interest on the principal outstanding are generally measured at amortised cost. All other debt investments and equity investments are measured at their fair values. Also under AASB 9, for financial liabilities that are designated as at fair value through profit or loss, the amount of change in the fair value of the financial liability that is attributable to changes in the credit risk of that liability is recognised in other comprehensive income, unless the recognition of the effects of changes in the liability’s credit risk in other comprehensive income would create or enlarge an accounting mismatch in profit or loss.
Changes in fair value attributable to a financial liability’s credit risk are not subsequently reclassified to profit or loss. Previously, under AASB 139, the entire amount of the change in the fair value of the financial liability designated as at fair value through profit or loss was recognised in profit or loss. In relation to Equity Trustees, it is anticipated the main impact will be in relation to the classification and measurement of financial assets. In broad terms, the amendments require financial assets to be measured at fair value through profit and loss unless the criteria for amortised cost measurement are met or the entity qualifies and elects to recognise gains and losses on equity securities that are not held for trading directly in other comprehensive income. Currently, the Group’s investments are
designated as available for sale and any unrealised movements are taken to an investment revaluation reserve. Where an available for sale investment suffers a significant or prolonged impairment it must be written down through the profit and loss. However, any reversal of an unrealised impairment loss on equities is not taken to profit and loss but directly to reserves. On adoption of the Standard the non-equity investments in the portfolio will be measured at fair value through the profit and loss (if they do not qualify for amortised cost accounting) and all realised and unrealised gains and losses will be taken to the income statement. Any equity investments will either be measured at fair value through the profit and loss, or if an election is made, at fair value through the statement of other comprehensive income. In the latter case the realised and unrealised movements will be taken up through the statement of other comprehensive income and will not be reclassified to profit and loss on disposal of the equity investments.
In relation to the impairment of financial assets, AASB 9 requires an expected credit loss model, as opposed to an incurred credit loss model under AASB 139. The new general hedge accounting requirements retain the three types of hedge accounting mechanisms currently available in AASB 139 but provide greater flexibility.
The Directors anticipate that AASB 9 will be adopted in the Group’s consolidated financial statements for the annual period beginning 1 July 2018 and that the application of the new Standard will have an impact on amounts reported in respect of the Groups’ financial assets. However, it is not practicable to provide a reasonable estimate of that effect until a detailed review has been completed.
AASB 15 ‘Revenue from Contracts with Customers’AASB 15 establishes a single comprehensive model for entities to use in accounting for revenue arising from contracts with customers. AASB 15 will supersede the current revenue recognition guidance including AASB 118 ‘Revenue,’ AASB 111 ‘Construction Contracts’ and the related Interpretations when it becomes effective.
The core principle of AASB 15 is that an entity should recognise revenue to depict the transfer of promised goods or services to customers in an amount that reflects the consideration to which the entity expects to be entitled in exchange for those goods or services. Under AASB 15, an entity recognises revenue when (or as) a performance obligation is satisfied, i.e. when ‘control’ of the goods or services underlying the particular performance obligation is transferred to the customer.
The Directors anticipate that the application of AASB 15 in the future may have an impact on the amounts reported and disclosures made in the Group’s consolidated financial statements. However, it is not practicable to provide a reasonable estimate of the effect of AASB 15 until the Group performs a detailed review.
30 Equity Trustees Annual Report 2015
For
per
sona
l use
onl
y

2. Application of new and revised Accounting Standards (cont’d)Other than as noted above, the adoption of the various Australian Accounting Standards and Interpretations in issue but not yet effective will not impact the Group’s accounting policies. However, the pronouncements will result in changes to information currently disclosed in the financial statements. The Group does not intend to adopt any of these pronouncements before their effective date.
3. Significant accounting policies3.1 Statement of complianceThese financial statements are general purpose financial statements which have been prepared in accordance with the Corporations Act 2001, Accounting Standards and Interpretations, and comply with other requirements of the law. The financial statements include the separate financial statements of the Company and the consolidated financial statements of the Group. For the purposes of preparing the consolidated financial statements, the Group is a for-profit entity. Accounting Standards include Australian Accounting Standards. Compliance with Australian Accounting Standards ensures that the financial statements and notes of the Group and the Company comply with International Financial Reporting Standards (IFRS).
The financial statements were authorised for issue by the Directors on 27 August 2015.
3.2 Basis of preparationThe consolidated financial statements have been prepared on the basis of historical cost, except for the revaluation of certain financial instruments that are measured at fair value, as explained in the accounting policies below. Historical cost is generally based on the fair values of the consideration given in exchange for assets. All amounts are presented in Australian dollars unless otherwise noted.
Fair value is the price that would be received to sell an asset or paid to transfer a liability in an orderly transaction between market participants at the measurement date, regardless of whether that price is directly observable or estimated using another valuation technique. In estimating the fair value of an asset or a liability, the Group takes into account the characteristics of the asset or liability if market participants would take those characteristics into account when pricing the asset or liability at the measurement date. Fair value for measurement and/or disclosure purposes in these consolidated financial statements is determined on such a basis, except for share-based payment transactions that are within the scope of AASB 2, leasing transactions that are within the scope of AASB 117, and measurements that have some similarities to fair value but are not fair value, such as net realisable value in AASB 2 or value in use in AASB 136 ‘Impairment of Assets’.
In addition, for financial reporting purposes, fair value measurements are categorised into Level 1, 2 or 3 based on the degree to which the inputs to the fair value measurements are observable and the significance of the inputs to the fair value measurement in its entirety, which are described as follows:
• Level 1 inputs are quoted prices (unadjusted) in active markets for identical assets or liabilities that the entity can access at the measurement date;
• Level 2 inputs are inputs, other than quoted prices included within Level 1, that are observable for the asset or liability, either directly or indirectly; and
• Level 3 inputs are unobservable inputs for the asset or liability.
The principal accounting policies are set out below:
3.3 Basis of consolidationThe consolidated financial statements incorporate the financial statements of the Company and entities (including structured entities) controlled by the Company and its subsidiaries. Control is achieved when the Company:
• has power over the investee;
• is exposed, or has rights, to variable returns from its involvement with the investee; and
• has the ability to use its power to affect its returns.
The Company reassesses whether or not it controls an investee if facts and circumstances indicate that there are changes to one or more of the three elements of control listed above.
When the Company has less than a majority of the voting rights of an investee, it has power over the investee when the voting rights are sufficient to give it the practical ability to direct the relevant activities of the investee unilaterally. The Company considers all relevant facts and circumstances in assessing whether or not the Company’s voting rights in an investee are sufficient to give it power, including:
• the size of the Company’s holding of voting rights relative to the size and dispersion of holdings of the other vote holders;
• potential voting rights held by the Company, other vote holders or other parties;
• rights arising from other contractual arrangements; and
• any additional facts and circumstances that indicate that the Company has, or does not have, the current ability to direct the relevant activities at the time that decisions need to be made, including voting patterns at previous shareholders’ meetings.
Consolidation of a subsidiary begins when the Company obtains control over the subsidiary and ceases when the Company loses control of the subsidiary. Specifically, income and expenses of a subsidiary acquired or disposed of during the year are included in the consolidated statement of profit or loss and other comprehensive income from the date the Company gains control until the date when the Company ceases to control the subsidiary.
Equity Trustees Annual Report 2015 31
For
per
sona
l use
onl
y
3. Significant accounting policies (cont’d)Profit or loss and each component of other comprehensive income are attributed to the owners of the Company and to the non-controlling interests. Total comprehensive income of subsidiaries is attributed to the owners of the Company and to the non-controlling interests even if this results in the non-controlling interests having a deficit balance.
When necessary, adjustments are made to the financial statements of subsidiaries to bring their accounting policies into line with the Group’s accounting policies. All intragroup assets and liabilities, equity, income, expenses and cash flows relating to transactions between members of the Group are eliminated in full on consolidation.
Changes in the Group’s ownership interests in subsidiaries that do not result in the Group losing control over the subsidiaries are accounted for as equity transactions. The carrying amounts of the Group’s interests and the non-controlling interests are adjusted to reflect the changes in their relative interests in the subsidiaries. Any difference between the amount by which the non-controlling interests are adjusted and the fair value of the consideration paid or received is recognised directly in equity and attributed to owners of the Company.
When the Group loses control of a subsidiary, a gain or loss is recognised in profit or loss and is calculated as the difference between (i) the aggregate of the fair value of the consideration received and the fair value of any retained interest and (ii) the previous carrying amount of the assets (including goodwill), and liabilities of the subsidiary and any non-controlling interests. All amounts previously recognised in other comprehensive income in relation to that subsidiary are accounted for as if the Group had directly disposed of the related assets or liabilities of the subsidiary (i.e. reclassified to profit or loss or transferred to another category of equity as specified/permitted by applicable AASBs).
3.4 Business combinationsAcquisitions of businesses are accounted for using the acquisition method. The consideration transferred in a business combination is measured at fair value which is calculated as the sum of the acquisition date fair values of assets transferred by the Group, liabilities incurred by the Group to the former owners of the acquiree and the equity instruments issued by the Group in exchange for control of the acquiree. Acquisition related costs are recognised in profit or loss as incurred.
At the acquisition date, the identifiable assets acquired and the liabilities assumed are recognised at their fair value at the acquisition date, except that:
• deferred tax assets or liabilities and liabilities or assets related to employee benefit arrangements are recognised and measured in accordance with AASB 112 ‘Income Taxes’ and AASB 119 ‘Employee Benefits’ respectively;
• liabilities or equity instruments related to share-based payment arrangements of the acquiree or share-based payment arrangements of the Group entered into to replace share-based payment arrangements of the acquiree are measured in accordance with AASB 2 ‘Share-based Payment’ at the acquisition date; and
• assets (or disposal groups) that are classified as held for sale in accordance with AASB 5 ‘Noncurrent Assets Held for Sale and Discontinued Operations’ are measured in accordance with that Standard.
Goodwill is measured as the excess of the sum of the consideration transferred, the amount of any non-controlling interests in the acquiree, and the fair value of the acquirer’s previously held equity interest in the acquiree (if any) over the net of the acquisition date amounts of the identifiable assets acquired and the liabilities assumed. If, after reassessment, the net of the acquisition date amounts of the identifiable assets acquired and liabilities assumed exceeds the sum of the consideration transferred, the amount of any non-controlling interests in the acquiree and the fair value of the acquirer’s previously held interest in the acquiree (if any), the excess is recognised immediately in profit or loss as a bargain purchase gain.
Non-controlling interests that are present ownership interests and entitle their holders to a proportionate share of the entity’s net assets in the event of liquidation may be initially measured either at fair value or at the non-controlling interests’ proportionate share of the recognised amounts of the acquiree’s identifiable net assets. The choice of measurement basis is made on a transaction by transaction basis. Other types of non-controlling interests are measured at fair value or, when applicable, on the basis specified in another Standard.
Where the consideration transferred by the Group in a business combination includes assets or liabilities resulting from a contingent consideration arrangement, the contingent consideration is measured at its acquisition date fair value. Changes in the fair value of the contingent consideration that qualify as measurement period adjustments are adjusted retrospectively, with corresponding adjustments against goodwill. Measurement period adjustments are adjustments that arise from additional information obtained during the ‘measurement period’ (which cannot exceed one year from the acquisition date) about facts and circumstances that existed at the acquisition date.
The subsequent accounting for changes in the fair value of contingent consideration that do not qualify as measurement period adjustments depends on how the contingent consideration is classified. Contingent consideration that is classified as equity is not remeasured at subsequent reporting dates and its subsequent settlement is accounted for within equity. Contingent consideration that is classified as an asset or liability is remeasured at subsequent reporting dates in accordance with AASB 139, or AASB 137 ‘Provisions, Contingent Liabilities and Contingent Assets’, as appropriate, with the corresponding gain or loss being recognised in profit or loss.
32 Equity Trustees Annual Report 2015
For
per
sona
l use
onl
y

3. Significant accounting policies (cont’d)Where a business combination is achieved in stages, the Group’s previously held equity interest in the acquiree is remeasured to fair value at the acquisition date (i.e. the date when the Group attains control) and the resulting gain or loss, if any, is recognised in profit or loss. Amounts arising from interests in the acquiree prior to the acquisition date that have previously been recognised in other comprehensive income are reclassified to profit or loss where such treatment would be appropriate if that interest were disposed of.
If the initial accounting for a business combination is incomplete by the end of the reporting period in which the combination occurs, the Group reports provisional amounts for the items for which the accounting is incomplete. Those provisional amounts are adjusted during the measurement period (see above), or additional assets or liabilities are recognised, to reflect new information obtained about facts and circumstances that existed as of the acquisition date that, if known, would have affected the amounts recognised as of that date.
3.5 Goodwill Goodwill arising on an acquisition of a business is carried at cost as established at the date of the acquisition of the business (see 3.4 above) less accumulated impairment losses, if any. For the purposes of impairment testing, goodwill is allocated to each of the Group’s cash-generating units (or groups of cash-generating units) that is expected to benefit from the synergies of the combination.
A cash-generating unit to which goodwill has been allocated is tested for impairment annually, or more frequently when there is indication that the unit may be impaired. If the recoverable amount of the cash-generating unit is less than its carrying amount, the impairment loss is allocated first to reduce the carrying amount of any goodwill allocated to the unit and then to the other assets of the unit pro-rata based on the carrying amount of each asset in the unit. Any impairment loss for goodwill is recognised directly in profit or loss in the consolidated income statement. An impairment loss recognised for goodwill is not reversed in subsequent periods. On disposal of the relevant cash-generating unit, the attributable amount of goodwill is included in the determination of the profit or loss on disposal.
3.6 Revenue recognitionRevenue is measured at the fair value of the consideration received or receivable on an accruals basis. Revenue is reduced for rebates and other similar allowances.
Fee and commission income Fee and commission income is recognised when the related service has been performed. In relation to corpus commission a percentage of revenue is recognised on completion of each stage of the estate administration.
Dividend and interest revenueDividend and interest revenue are recognised when it is probable that the economic benefits will flow to the Group and the amount of revenue can be measured reliably. Dividend revenue from investments is recognised when the Group’s right to receive payment has been established. Interest revenue is accrued on a time basis, by reference to the principal outstanding and at the effective interest rate applicable, which is the rate that exactly discounts estimated future cash receipts through the expected life of the financial asset to that asset’s net carrying amount on initial recognition.
3.7 Leased assetsLeases are classified as finance leases when the terms of the lease transfer substantially all the risks and rewards incidental to ownership of the leased asset to the lessee. All other leases are classified as operating leases.
Operating lease payments are recognised as an expense on a straight-line basis over the lease term, except where another systematic basis is more representative of the time pattern in which economic benefits from the leased asset are consumed. Contingent rentals arising under operating leases are recognised as an expense in the period in which they are incurred. In the event that lease incentives are received to enter into operating leases, such incentives are recognised as a liability. The aggregate benefits of incentives are recognised as a reduction of rental expense on a straight-line basis, except where another systematic basis is more representative of the time pattern in which economic benefits from the leased asset are consumed.
3.8 Employee benefitsA liability is recognised for benefits accruing to employees in respect of wages and salaries, annual leave, long service leave, and Directors’ retiring allowance when it is probable that settlement will be required and they are capable of being measured reliably. The Directors’ retiring allowance was frozen as at 31 December 2005 except for an annual inflation adjustment in line with the movement in CPI.
Liabilities recognised in respect of short-term employee benefits, are measured at their nominal values using the remuneration rate expected to apply at the time of settlement. Liabilities recognised in respect of long-term employee benefits are measured as the present value of the estimated future cash outflows to be made by the Group in respect of services provided by employees up to reporting date.
Payments to defined contribution superannuation plans are expensed when employees have rendered service entitling them to the contributions.
A liability for a termination benefit is recognised at the earlier of when the entity can no longer withdraw the offer of the termination benefit and when the entity recognises any related restructuring costs.
Equity Trustees Annual Report 2015 33
For
per
sona
l use
onl
y

3. Significant accounting policies (cont’d)3.9 Share-based paymentsEquity-settled share-based payments to employees are measured at the fair value of the equity instrument at the grant date. The Group has two types of equity-settled share-based payments: the Long-term Incentive Awards and the Employee Share Acquisition Plan.
Fair value of the Long-term Incentive Awards is measured by using an adjusted form of the Black-Scholes option pricing model that incorporates a Monte Carlo simulation analysis. The model has been modified to incorporate an estimate of the probability of achieving the performance hurdle and the number of Awards vesting. The fair value determined at the grant date of the equity-settled share-based payments is expensed on a straight-line basis over the vesting period, based on the Group’s estimate of shares that will eventually vest, with a corresponding increase in equity. At the end of each reporting period, the Group revises its estimate of the number of equity instruments expected to vest. The impact of the revision of the original estimates, if any, is recognised in profit or loss such that the cumulative expense reflects the revised estimate, with a corresponding adjustment to the equity-settled employee benefits reserve.
Shares issued under the Employee Share Acquisition Plan are valued at fair value determined at the date of issue to employees and this amount is expensed in the income statement with a corresponding entry in issued capital.
3.10 TaxationIncome tax expense represents the sum of the tax currently payable and deferred tax.
Current taxThe tax currently payable is based on taxable profit for the year. Taxable profit differs from profit as reported in the consolidated statement of profit or loss because of items of income or expense that are taxable or deductible in other years and items that are never taxable or deductible. The Group’s liability for current tax is calculated using tax rates that have been enacted or substantively enacted by the end of the reporting period.
Deferred taxDeferred tax is recognised on temporary differences between the carrying amounts of assets and liabilities in the consolidated financial statements and the corresponding tax bases used in the computation of taxable profit. Deferred tax liabilities are generally recognised for all taxable temporary differences. Deferred tax assets are generally recognised for all deductible temporary differences to the extent that it is probable that taxable profits will be available against which those deductible temporary differences can be utilised. Such deferred tax assets and liabilities are not recognised if the temporary difference arises from goodwill or from the initial recognition (other than in a business combination) of other assets and liabilities in a transaction that affects neither the taxable profit nor the accounting profit. In addition, deferred tax liabilities are not recognised if the temporary difference arises from the initial recognition of goodwill.
Deferred tax liabilities are recognised for taxable temporary differences associated with investments in subsidiaries and associates, and interests in joint ventures, except where the Group is able to control the reversal of the temporary difference and it is probable that the temporary difference will not reverse in the foreseeable future. Deferred tax assets arising from deductible temporary differences associated with such investments and interests are only recognised to the extent that it is probable that there will be sufficient taxable profits against which to utilise the benefits of the temporary differences and they are expected to reverse in the foreseeable future.
The carrying amount of deferred tax assets is reviewed at the end of each reporting period and reduced to the extent that it is no longer probable that sufficient taxable profits will be available to allow all or part of the asset to be recovered.
Deferred tax assets and liabilities are measured at the tax rates that are expected to apply in the period in which the liability is settled or the asset realised, based on tax rates (and tax laws) that have been enacted or substantively enacted by the end of the reporting period. The measurement of deferred tax liabilities and assets reflects the tax consequences that would follow from the manner in which the Group expects, at the end of the reporting period, to recover or settle the carrying amount of its assets and liabilities.
Deferred tax assets and liabilities are offset when there is a legally enforceable right to set off current tax assets against current tax liabilities and when they relate to income taxes levied by the same taxation authority and the Group intends to settle its current tax assets and liabilities on a net basis.
Current and deferred tax for the yearCurrent and deferred tax are recognised in profit or loss, except when they relate to items that are recognised in other comprehensive income or directly in equity, in which case the current and deferred tax are also recognised in other comprehensive income or directly in equity, respectively. Where current tax or deferred tax arises from the initial accounting for a business combination, the tax effect is included in the accounting for the business combination.
Tax consolidationThe Company and all its wholly-owned Australian resident entities are part of a tax-consolidated group under Australian taxation law. Equity Trustees Limited is the head entity in the tax-consolidated group and the other members are identified in note 32. Tax expense/income, deferred tax liabilities and deferred tax assets arising from temporary differences of the members of the tax-consolidated group are recognised in the separate financial statements of the members of the tax-consolidated group using the ‘separate taxpayer within group’ approach by reference to the carrying amounts in the separate financial statements of each entity and the tax values applying under tax consolidation. Current tax liabilities and assets and deferred tax assets arising from unused tax losses and
34 Equity Trustees Annual Report 2015
For
per
sona
l use
onl
y

3. Significant accounting policies (cont’d)tax credits of the members of the tax-consolidated group are recognised by the Company (as head entity in the tax-consolidated group).
Due to the existence of a tax funding arrangement between the entities in the tax-consolidated group, amounts are recognised as payable to or receivable by each member of the tax-consolidated group in relation to the tax contribution amounts paid or payable between the parent entity and the other members of the tax-consolidated group in accordance with the arrangement.
Entities within the tax-consolidated group have entered into a tax funding arrangement and a tax sharing agreement with the head entity. The Company and each of the entities in the tax-consolidated group have agreed to pay a tax equivalent payment to or from the head entity, based on the current tax liability or current tax asset of the entity. The tax sharing agreement entered into between members of the tax-consolidated group provides for the determination of the allocation of income tax liabilities between the entities should the head entity default on its tax payment obligations or if an entity should leave the tax-consolidated group. The effect of the tax sharing agreement is that each member’s liability for the tax payable by the tax-consolidated group is limited to the amount payable to the head entity under the tax funding arrangement.
Investment in tax-consolidated groupUnder Australian tax law, the taxable profit made by a tax-consolidated group in relation to an entity leaving the Group depends on a range of factors, including the tax values and/or carrying values of assets and liabilities of the leaving entity, which vary in line with the transactions and events recognised in each entity. The taxable profit or loss ultimately made on any disposal of the investments within the tax-consolidated group will therefore depend upon when each entity leaves the tax-consolidated group and the assets and liabilities that the leaving entity holds at that time.
Because the consolidated entity has no current intention to dispose of any subsidiaries within the Group, a deferred tax liability has not been recognised in relation to investments within the tax-consolidated group. Furthermore, temporary differences that might arise on disposal of the entities in the tax-consolidated group cannot be reliably measured because of their inherent uncertainties surrounding the nature of any future disposal that might occur.
3.11 Cash and cash equivalentsCash comprises cash on hand and demand deposits. Cash equivalents are short-term, highly liquid investments that are readily convertible to known amounts of cash and which are subject to an insignificant risk of changes in value and have a maturity of three months or less at the date of acquisition.
3.12 Furniture, equipment and leasehold improvementsFurniture, equipment and leasehold improvements are stated at cost less accumulated depreciation and accumulated impairment losses. Depreciation on furniture and equipment is recognised so as to write off the cost or valuation of the assets less their residual values over their useful lives using the straight-line method. Leasehold improvements are depreciated over the period of the lease or estimated useful life, whichever is the shorter, using the straight-line method. The estimated useful lives, residual values and depreciation method are reviewed at the end of each annual reporting period, with the effect of any changes recognised on a prospective basis.
An item of furniture, equipment or leasehold improvement is derecognised upon disposal or when no future economic benefits are expected to arise from the continued use of the asset. The gain or loss arising on disposal or retirement of an item of furniture, equipment or leasehold improvement is determined as the difference between the sales proceeds and the carrying amount of the asset and is recognised in profit or loss.
The following useful lives are used in the calculation of depreciation:
Computer hardware and equipment 1 – 6 years
Office furniture and equipment 1 – 10 years
Leasehold improvements 3 – 6 years
Equity Trustees Annual Report 2015 35
For
per
sona
l use
onl
y
3. Significant accounting policies (cont’d)3.13 Intangible assets
Intangible assets acquired separatelyIntangible assets with finite lives that are acquired separately are carried at cost less accumulated amortisation and accumulated impairment losses. Amortisation is recognised on a straight-line basis over their estimated useful lives. The estimated useful life and amortisation method are reviewed at the end of each reporting period, with the effect of any changes in estimate being accounted for on a prospective basis. Intangible assets with indefinite useful lives that are acquired separately are carried at cost less accumulated impairment losses.
Internally-generated intangible assets – research and development expenditureExpenditure on research activities is recognised as an expense in the period in which it is incurred.
An internally-generated intangible asset arising from development (or from the development phase of an internal project) is recognised if, and only if, all of the following have been demonstrated:
• the technical feasibility of completing the intangible asset so that it will be available for use or sale;
• the intention to complete the intangible asset and use or sell it;
• the ability to use or sell the intangible asset;
• how the intangible asset will generate probable future economic benefits;
• the availability of adequate technical, financial and other resources to complete the development and to use or sell the intangible asset; and
• the ability to measure reliably the expenditure attributable to the intangible asset during its development.
The amount initially recognised for internally-generated intangible assets is the sum of the expenditure incurred from the date when the intangible asset first meets the recognition criteria listed above. Where no internally-generated intangible asset can be recognised, development expenditure is recognised in profit or loss in the period in which it is incurred. Subsequent to initial recognition, internally-generated intangible assets are reported at cost less accumulated amortisation and accumulated impairment losses, on the same basis as intangible assets that are acquired separately.
Intangible assets acquired in a business combinationIntangible assets acquired in a business combination and recognised separately from goodwill are initially recognised at their fair value at the acquisition date (which is regarded as their cost). Subsequent to initial recognition, intangible assets acquired in a business combination are reported at cost less accumulated amortisation (if finite life intangible) and accumulated impairment losses, on the same basis as intangible assets that are acquired separately.
Management rights and customer contract intangiblesManagement rights and customer contract intangibles arising in relation to acquisitions are carried at cost as non-current intangible assets. Where the management rights and customer contract intangibles have an indefinite useful life they are not amortised but are subject to an ongoing impairment test (refer note 3.14). Where the management rights and customer contract intangibles have a finite useful life they are recorded at cost less accumulated amortisation and accumulated impairment. Amortisation is charged on a straight-line basis over their estimated useful lives. The estimated useful life and amortisation method is reviewed at the end of each annual reporting period, with any changes in these accounting estimates being accounted for on a prospective basis.
Derecognition of intangible assetsAn intangible asset is derecognised on disposal, or when no future economic benefits are expected from use or disposal. Gains or losses arising from derecognition of an intangible asset, measured as the difference between the net disposal proceeds and the carrying amount of the asset are recognised in profit or loss when the asset is derecognised.
Useful lives of finite life intangible assetsThe following useful lives are used in the calculation of amortisation expense:
Software 1 – 10 years
Management rights and customer contract intangibles
4 – 16 years
Makegood asset 5 years
3.14 Impairment of tangible and intangible assets other than goodwillAt each reporting date, the Group reviews the carrying amounts of its tangible and intangible assets to determine whether there is any indication that those assets have suffered an impairment loss. If any such indication exists, the recoverable amount of the asset is estimated in order to determine the extent of the impairment loss (if any). Where it is not possible to estimate the recoverable amount of an individual asset, the Group estimates the recoverable amount of the cash-generating unit to which the asset belongs. Where a reasonable and consistent basis of allocation can be identified, corporate assets are also allocated to individual cash-generating units, or otherwise they are allocated to the smallest group of cash-generating units for which a reasonable and consistent allocation basis can be identified.
36 Equity Trustees Annual Report 2015
For
per
sona
l use
onl
y

3. Significant accounting policies (cont’d)Intangible assets with indefinite useful lives and intangible assets not yet available for use are tested for impairment annually and whenever there is an indication that the asset may be impaired. Recoverable amount is the higher of fair value less costs to sell and value in use. In assessing value in use, the estimated future cash flows are discounted to their present value using a pre-tax discount rate that reflects current market assessments of the time value of money and the risks specific to the asset for which the estimates of future cash flows have not been adjusted.
If the recoverable amount of an asset (or cash-generating unit) is estimated to be less than its carrying amount, the carrying amount of the asset (or cash-generating unit) is reduced to its recoverable amount. An impairment loss is recognised immediately in profit or loss, unless the relevant asset is carried at revalued amount, in which case the impairment loss is treated as a revaluation decrease.
Where an impairment loss subsequently reverses, the carrying amount of the asset (or cash-generating unit) is increased to the revised estimate of its recoverable amount, but only to the extent that the increased carrying amount does not exceed the carrying amount that would have been determined had no impairment loss been recognised for the asset (or cash-generating unit) in prior years. A reversal of an impairment loss is recognised immediately in profit or loss, unless the relevant asset is carried at fair value, in which case the reversal of the impairment loss is treated as a revaluation increase.
3.15 ProvisionsProvisions are recognised when the Group has a present obligation (legal or constructive) as a result of a past event, it is probable that the Group will be required to settle the obligation, and a reliable estimate can be made of the amount of the obligation.
The amount recognised as a provision is the best estimate of the consideration required to settle the present obligation at reporting date, taking into account the risks and uncertainties surrounding the obligation. Where a provision is measured using the cash flows estimated to settle the present obligation, its carrying amount is the present value of those cash flows (where the effect of the time value of money is material). When some or all of the economic benefits required to settle a provision are expected to be recovered from a third party, the receivable is recognised as an asset if it is virtually certain that reimbursement will be received and the amount of the receivable can be measured reliably.
3.16 Financial instrumentsFinancial assets and financial liabilities are recognised when a group entity becomes a party to the contractual provisions of the instrument. Financial assets and financial liabilities are initially measured at fair value. Transaction costs that are directly attributable to the acquisition or issue of financial assets and financial liabilities (other than financial assets and financial liabilities at fair value through profit or loss) are added to or deducted from the fair value of the financial assets or financial liabilities, as appropriate, on initial recognition. Transaction costs directly attributable to the acquisition of financial assets or financial liabilities at fair value through profit or loss are recognised immediately in profit or loss.
3.17 Financial assetsFinancial assets are classified into the following specified categories: financial assets ‘at fair value through profit or loss’, ‘held-to-maturity’ investments, ‘available-for-sale’ financial assets and ‘loans and receivables’. The classification depends on the nature and purpose of the financial assets and is determined at the time of initial recognition. The Group does not have any financial assets classified as at ‘fair value through profit or loss’ or ‘held-to-maturity’. All regular way purchases or sales of financial assets are recognised and derecognised on a trade date basis. Regular way purchases or sales are purchases or sales of financial assets that require delivery of assets within the time frame established by regulation or convention in the marketplace.
Effective interest methodThe effective interest method is a method of calculating the amortised cost of a debt instrument and of allocating interest income over the relevant period. The effective interest rate is the rate that exactly discounts estimated future cash receipts (including all fees on points paid or received that form an integral part of the effective interest rate, transaction costs and other premiums or discounts) through the expected life of the debt instrument, or (where appropriate) a shorter period, to the net carrying amount on initial recognition. Income is recognised on an effective interest basis for debt instruments other than those financial assets classified as at fair value through profit or loss.
Available-for-sale financial assetsEquities and investments in managed investment schemes held by the Group are classified as being available-for-sale and are stated at fair value. Fair value is determined in the manner described in note 38. Gains and losses arising from changes in fair value are recognised in other comprehensive income and accumulated in the investments revaluation reserve, with the exception of impairment losses, interest calculated using the effective interest method, and foreign exchange gains and losses on monetary assets, which are recognised in profit or loss. Where the investment is disposed of or is determined to be impaired, the cumulative gain or loss previously accumulated in the investments revaluation reserve is reclassified to profit or
Equity Trustees Annual Report 2015 37
For
per
sona
l use
onl
y

3. Significant accounting policies (cont’d)loss. Dividends on available-for-sale equity instruments are recognised in profit and loss when the Group’s right to receive payments is established.
Loans and receivablesTrade receivables, loans, and other receivables that have fixed or determinable payments that are not quoted in an active market are classified as ‘loans and receivables’. Loans and receivables are measured at amortised cost using the effective interest method less impairment. Interest is recognised by applying the effective interest rate, except for short-term receivables when the recognition of interest would be immaterial.
Impairment of financial assetsFinancial assets, other than those at fair value through profit or loss, are assessed for indicators of impairment at each reporting period. Financial assets are considered to be impaired when there is objective evidence that, as a result of one or more events that occurred after the initial recognition of the financial asset, the estimated future cash flows of the investment have been affected.
For equity instruments, including listed or unlisted shares, objective evidence of impairment includes information about significant changes with an adverse effect that have taken place in the technological, investment market, economic or legal environment in which the issuer operates, and indicates that the cost of the investment in the equity instrument may not be recovered. A significant or prolonged decline in the fair value of the security below its cost is considered to be objective evidence of impairment for unlisted shares classified as available-for-sale.
For all other financial assets objective evidence of impairment could include:
• significant financial difficulty of the issuer or counterparty; or
• default or delinquency in interest or principal payments; or
• it becoming probable that the borrower will enter bankruptcy or financial re-organisation; or
• the disappearance of an active market for that financial asset because of financial difficulties.
For financial assets carried at amortised cost, the amount of the impairment is the difference between the asset’s carrying amount and the present value of estimated future cash flows, discounted at the financial asset’s original effective interest rate.
For financial assets carried at cost, the amount of the impairment loss is measured as the difference between the asset’s carrying amount and the present value of the estimated future cash flows discounted at the current market rate of return for a similar financial asset. Such impairment loss will not be reversed in subsequent periods.
The carrying amount of the financial asset is reduced by the impairment loss directly for all financial assets with the exception of trade receivables where the carrying amount is reduced through the use of an allowance account. When a trade receivable is uncollectible, it is written off against the allowance account. Subsequent recoveries of amounts previously written off are credited against the allowance account. Changes in the carrying amount of the allowance account are recognised in profit or loss.
When an available-for-sale financial asset is considered to be impaired, cumulative gains or losses previously recognised in other comprehensive income are reclassified to profit or loss in the period. With the exception of available-for-sale equity instruments, if, in a subsequent period, the amount of the impairment loss decreases and the decrease can be related objectively to an event occurring after the impairment was recognised, the previously recognised impairment loss is reversed through profit or loss to the extent the carrying amount of the investment at the date the impairment is reversed does not exceed what the amortised cost would have been had the impairment not been recognised. In respect of available-for-sale equity instruments, impairment losses previously recognised in profit or loss are not reversed through profit or loss. Any increase in fair value subsequent to an impairment loss is recognised in other comprehensive income and accumulated in the investment revaluation reserve.
Derecognition of financial assetsThe Group derecognises a financial asset only when the contractual rights to the cash flows from the asset expire, or when it transfers the financial asset and substantially all the risks and rewards of ownership of the asset to another entity. If the Group neither transfers nor retains substantially all the risks and rewards of ownership and continues to control the transferred asset, the Group recognises its retained interest in the asset and an associated liability for amounts it may have to pay. If the Group retains substantially all the risks and rewards of ownership of a transferred financial asset, the Group continues to recognise the financial asset and also recognises a collateralised borrowing for the proceeds received.
On derecognition of a financial asset in its entirety, the difference between the asset’s carrying amount and the sum of the consideration received and receivable and the cumulative gain or loss that had been recognised in other comprehensive income and accumulated in equity is recognised in profit or loss.
On derecognition of a financial asset other than in its entirety (e.g. when the Group retains an option to repurchase part of a transferred asset or retains a residual interest that does not result in the retention of substantially all the risks and rewards of ownership and the Group retains control), the Group allocates the previous carrying amount of the financial asset between the part it continues to recognise under continuing involvement, and the part it no longer recognises on the basis of the relative fair values of those parts on
38 Equity Trustees Annual Report 2015
For
per
sona
l use
onl
y
3. Significant accounting policies (cont’d)the date of the transfer. The difference between the carrying amount allocated to the part that is no longer recognised and the sum of the consideration received for the part no longer recognised and any cumulative gain or loss allocated to it that had been recognised in other comprehensive income is recognised in profit or loss. A cumulative gain or loss that had been recognised in other comprehensive income is allocated between the part that continues to be recognised and the part that is no longer recognised on the basis of the relative fair values of those parts.
3.18 Financial liabilities and equity instruments
Classification as debt or equity Debt and equity instruments are classified as either liabilities or as equity in accordance with the substance of the contractual arrangement.
Equity instrumentsAn equity instrument is any contract that evidences a residual interest in the assets of an entity after deducting all of its liabilities. Equity instruments issued by the Group are recorded at the proceeds received, net of direct issue costs. Repurchase of the Company’s own equity instruments is recognised and deducted directly in equity. No gain or loss is recognised in profit or loss on the purchase, sale, issue or cancellation of the Company’s own equity instruments.
Financial guarantee contract liabilitiesA financial guarantee contract is a contract that requires the issuer to make specified payments to reimburse the holder for a loss it incurs because a specified debtor fails to make payments when due in accordance with the terms of a debt instrument.
Financial guarantee contract liabilities are measured initially at their fair values and, if not designated at fair value through the profit and loss, are subsequently at the higher of:
• the amount of the obligation under the contract, as determined under AASB 137 ‘Provisions, Contingent Liabilities and Contingent Assets’; and
• the amount initially recognised less, where appropriate, cumulative amortisation in accordance with AASB 118 Revenue.
Other financial liabilitiesThe financial liabilities of the Group are classified as other financial liabilities. There are no financial liabilities classified as fair value through the profit and loss. Other financial liabilities are initially measured at fair value, net of transaction costs. Other financial liabilities are subsequently measured at amortised cost using the effective interest method, with interest expense recognised on an effective yield basis. The effective interest method is a method of calculating the amortised cost of a financial liability and of allocating interest expense over the relevant period. The effective interest rate is the rate that exactly discounts estimated future cash payments through the expected life of the financial liability, or, where appropriate, a shorter period, to the net carrying amount on initial recognition.
Derecognition of financial liabilitiesThe Group derecognises financial liabilities when, and only when, the Group’s obligations are discharged, cancelled or they expire. The difference between the carrying amount of the financial liability derecognised and the consideration paid and payable is recognised in profit or loss.
3.19 Goods and Services Tax
Revenues, expenses and assets are recognised net of the amount of Goods and Services Tax (GST), except:
• where the amount of GST incurred is not recoverable from the taxation authority, it is recognised as part of the cost of acquisition of an asset or as part of an item of expense; or
• for receivables and payables which are recognised inclusive of GST.
The net amount of GST recoverable from, or payable to, the taxation authority is included as part of receivables or payables. Cash flows are included in the cash flow statement on a gross basis. The GST component of cash flows arising from investing and financing activities which is recoverable from, or payable to, the taxation authority is classified as operating cash flows.
4. Critical accounting judgements and key sources of estimation uncertainty In the application of the Group’s accounting policies, which are described in note 3, the Directors are required to make judgments, estimates, and assumptions about carrying values of assets and liabilities that are not readily apparent from other sources. The estimates and associated assumptions are based on historical experience and other factors that are considered relevant. Actual results may differ from these estimates.
The estimates and underlying assumptions are reviewed on an ongoing basis. Revisions to accounting estimates are recognised in the period in which the estimate is revised if the revision affects only that period or in the period of the revision and future periods if the revision affects both current and future periods.
The following are the critical judgements and key sources of estimation uncertainty used in the preparation of the financial statements that have a significant impact on the amounts recognised in the consolidated financial statements.
Employee entitlementsJudgement is applied in determining the following key assumptions used in the calculation of long service leave at balance date:
• future increases in salaries;
• future increases in on-costs; and
• experience of employee departures and probability of period of service being achieved.
Equity Trustees Annual Report 2015 39
For
per
sona
l use
onl
y

4. Critical accounting judgements and key sources of estimation uncertaintyImpairment of goodwill, and indefinite life management rights and customer contract intangibles Determining whether goodwill or the indefinite life management rights/customer contract are impaired requires an estimation of the value in use of the cash-generating units to which goodwill and the indefinite life management rights have been allocated. The value in use calculation requires the entity to estimate the future cash flows expected to arise from the cash-generating unit and an appropriate discount rate in order to calculate present value.
At 30 June 2015 the carrying amount of goodwill is $102,176,744 and $79,269,443 for the management rights and customer contract intangibles (2014: $9,507,853 goodwill and $28,863,094 management rights and customer contract intangibles). No impairment has been identified (30 June 2014: nil).
Intangible assetsThe useful lives of intangible assets are reviewed annually. Any reassessment of useful lives in a particular year will affect the amortisation expense (either increasing or decreasing) through to the end of the reassessed useful life for both the current and future years.
Recoverability of internally generated-intangible assets in progressAt 30 June 2015, the Directors reviewed the status of the Group’s internally-generated intangible assets arising from development of in-house software in progress, which is included in the consolidated statement of financial position at 30 June 2015 amounting to $280,658 (30 June 2014: $1,283,431). The projects are progressing well, the developments are technically feasible to complete, there is adequate resourcing to complete and there is the intention and ability to use the completed software.
Useful lives of furniture, equipment and leasehold improvementsAs described in note 3.12, the Group reviews the estimated useful lives of furniture and equipment and leasehold improvements at the end of each annual reporting period. During this financial year, the Directors have not determined any changes should be made to the useful lives of furniture and equipment and leasehold improvements.
ProvisionsAs referred to in note 3.15, the amounts included in provisions represents the Directors’ best estimate of the future outflow of economic benefits that will be required to settle identified outstanding issues.
5. Discontinued operations The Group did not have any discontinued operations (2014: nil)
6. Revenue
Consolidated Company
2015 $
2014 $
2015 $
2014 $
The following is an analysis of the Group’s revenue for the year:
Revenue from service activities 83,735,281 52,584,757 42,919,966 36,025,775
Interest revenue:
– Bank deposits 683,736 1,137,430 377,094 1,116,812
– Investments 185,067 144,990 127,996 144,990
Dividends from non-related companies 253,224 253,736 253,224 253,736
Dividends from wholly owned companies - - 16,500,000 5,000,000
Gain on sale of available-for-sale investments - 813,686 - 813,686
Service charges - - 21,795,000 4,075,000
1,122,027 2,349,842 39,053,314 11,404,224
Total revenue 84,857,308 54,934,599 81,973,280 47,429,999
The following is an analysis of investment revenue earned on financial assets by category of asset:
Available-for-sale financial assets 438,291 1,212,412 381,220 1,212,412
Loans and receivables (including cash and bank balances) 683,736 1,137,430 377,094 1,116,812
Total investment income for financial assets not designated as at fair value through the profit and loss 1,122,027 2,349,842 758,314 2,329,224
40 Equity Trustees Annual Report 2015
For
per
sona
l use
onl
y
7. Finance cost Neither the Group nor the Company have any borrowings. The finance cost for the year is nil (2014: nil).
8. Profit for the year There is no profit or loss attributable to non-controlling interests (2014: $nil).
Consolidated Company
2015 $
2014 $
2015 $
2014 $
Profit for the year has been arrived at after crediting/(charging) the following gains and (losses):Gain from disposal of available-for-sale investments - 813,686 - 813,686 Gain/(loss) on disposal of property, plant and equipment (12,416) (2,005) (648) (2,005)
(12,416) 811,681 (648) 811,681 Profit for the year includes the following expenses:Depreciation and amortisation:Depreciation of non-current assets 649,347 548,146 620,639 517,075 Amortisation of non-current assets 1,146,613 792,398 1,038,470 737,036
1,795,960 1,340,544 1,659,109 1,254,111 Amortisation of management rights 1,345,651 197,030 - -
3,141,611 1,537,574 1,659,109 1,254,111 Operating lease rental expenses:Minimum lease payments 1,906,378 1,453,139 1,906,378 1,166,554 Employee benefit expense: Post employment benefits:
– Superannuation contributions 2,597,799 1,746,463 2,597,799 1,567,099 Share-based payments:
– Equity-settled share-based payments 1,197,297 577,671 1,197,297 577,671 Other employee benefits 35,638,001 24,539,601 35,637,359 21,665,021
39,433,097 26,863,735 39,432,455 23,809,791
Equity Trustees Annual Report 2015 41
For
per
sona
l use
onl
y

9. Income taxes
Consolidated Company
2015 $
2014 $
2015 $
2014 $
Income tax expense comprises:Current income tax expense 6,949,201 3,966,752 1,354,716 1,852,290 Prior year tax adjustments recognised in the current year (22,012) (400,699) (22,012) (396,310)Deferred tax expense relating to the origination and reversal of temporary differences
249,767 68,273 422,322 107,576
Deferred tax reclassified from equity to profit or loss 21,885 58,658 21,885 58,658 Total income tax expense 7,198,841 3,692,984 1,776,911 1,622,214 The income tax expense for the year can be reconciled to accounting profit as follows:Profit before tax from continuing operations 24,158,263 13,406,396 22,889,502 10,655,878 Income tax expense calculated at 30% 7,247,479 4,021,919 6,866,851 3,196,763 Non-deductible expenses 501,747 407,257 97,017 343,825 Non-assessable income (503,044) (313,866) (5,139,616) (1,500,437)Franked dividends (25,329) (21,627) (25,329) (21,627)
7,220,853 4,093,683 1,798,923 2,018,524 Prior year tax adjustments (22,012) (400,699) (22,012) (396,310)
7,198,841 3,692,984 1,776,911 1,622,214
The tax rate used in the above 2015 and 2014 reconciliations is the corporate tax rate of 30% payable by Australian corporate entities on taxable profits under Australian tax law. There has been no change in the corporate tax rate when compared with the previous reporting period.
Consolidated Company
2015 $
2014 $
2015 $
2014 $
Income tax expense/(credit) recognised directly in equity:Current tax: Share issue expenses deductible over 5 years (470,822) (457,223) (470,822) (457,223)
Deferred tax:Arising on transactions with equity participants:Share issue expenses deductible over 5 years 393,699 (1,788,101) 393,699 (1,788,101)Total income tax recognised directly in equity (77,123) (2,245,324) (77,123) (2,245,324)Income tax expense/(credit) recognised in other comprehensive income:Deferred tax:Movement in revaluation of available-for-sale investments (21,885) 82,757 (21,885) 82,757 Reclassification from equity to profit and loss:Realised gain on sale of available-for-sale investments - (58,658) - (58,658)
(21,885) 24,099 (21,885) 24,099 Current tax liabilities:Income tax payable 2,332,676 702,117 2,332,676 702,117 Deferred tax balances are presented in the statement of financial position as follows:Deferred tax asset 4,115,928 3,959,616 4,033,628 3,704,761 Deferred tax liability – investment revaluation 100,369 122,254 100,369 122,254
42 Equity Trustees Annual Report 2015
For
per
sona
l use
onl
y
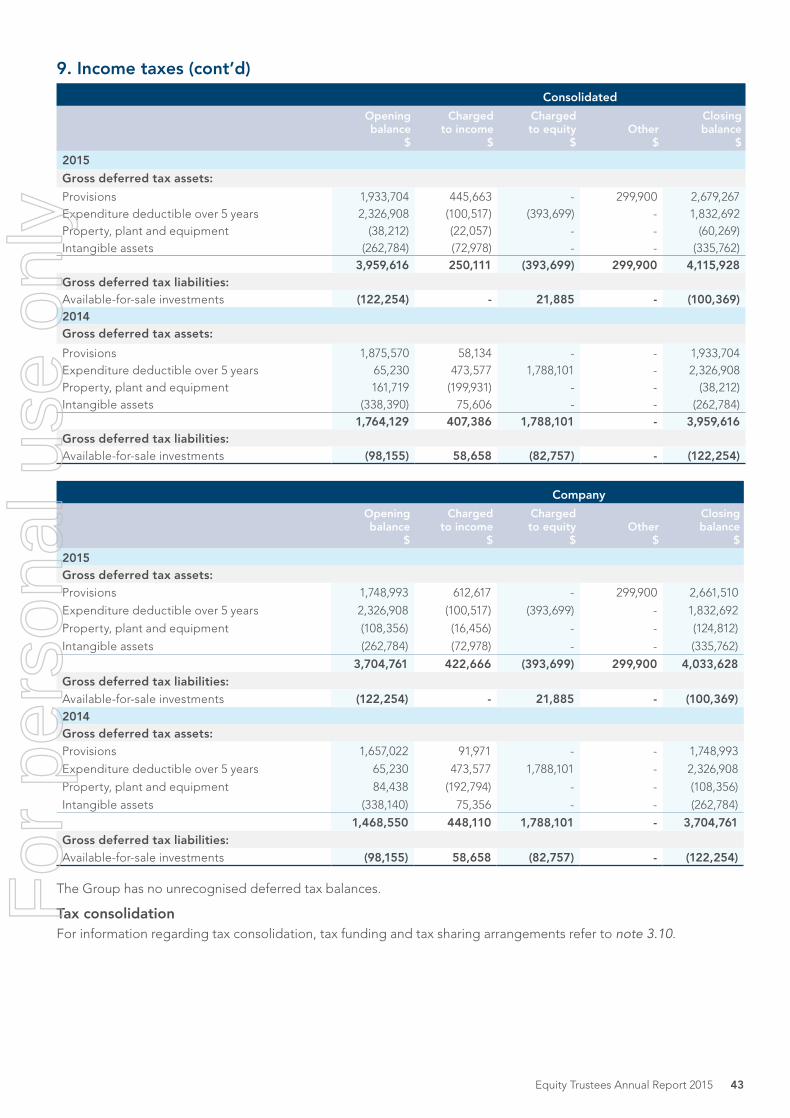
9. Income taxes (cont’d)
Consolidated
Opening balance
$
Charged to income
$
Charged to equity
$
Other
$
Closing balance
$
2015
Gross deferred tax assets:
Provisions 1,933,704 445,663 - 299,900 2,679,267 Expenditure deductible over 5 years 2,326,908 (100,517) (393,699) - 1,832,692 Property, plant and equipment (38,212) (22,057) - - (60,269)Intangible assets (262,784) (72,978) - - (335,762)
3,959,616 250,111 (393,699) 299,900 4,115,928 Gross deferred tax liabilities:Available-for-sale investments (122,254) - 21,885 - (100,369)2014Gross deferred tax assets:
Provisions 1,875,570 58,134 - - 1,933,704 Expenditure deductible over 5 years 65,230 473,577 1,788,101 - 2,326,908 Property, plant and equipment 161,719 (199,931) - - (38,212)Intangible assets (338,390) 75,606 - - (262,784)
1,764,129 407,386 1,788,101 - 3,959,616 Gross deferred tax liabilities:Available-for-sale investments (98,155) 58,658 (82,757) - (122,254)
Company
Opening balance
$
Charged to income
$
Charged to equity
$
Other
$
Closing balance
$
2015Gross deferred tax assets:Provisions 1,748,993 612,617 - 299,900 2,661,510
Expenditure deductible over 5 years 2,326,908 (100,517) (393,699) - 1,832,692
Property, plant and equipment (108,356) (16,456) - - (124,812)
Intangible assets (262,784) (72,978) - - (335,762)
3,704,761 422,666 (393,699) 299,900 4,033,628 Gross deferred tax liabilities:Available-for-sale investments (122,254) - 21,885 - (100,369)2014Gross deferred tax assets:Provisions 1,657,022 91,971 - - 1,748,993
Expenditure deductible over 5 years 65,230 473,577 1,788,101 - 2,326,908
Property, plant and equipment 84,438 (192,794) - - (108,356)
Intangible assets (338,140) 75,356 - - (262,784)
1,468,550 448,110 1,788,101 - 3,704,761 Gross deferred tax liabilities:Available-for-sale investments (98,155) 58,658 (82,757) - (122,254)
The Group has no unrecognised deferred tax balances.
Tax consolidationFor information regarding tax consolidation, tax funding and tax sharing arrangements refer to note 3.10.
Equity Trustees Annual Report 2015 43
For
per
sona
l use
onl
y

10. Key management personnel remuneration
Consolidated Company
2015 $
2014 $
2015 $
2014 $
The aggregate compensation made to key management personnel of the Company and the Group is set out below:
Short-term employee benefits 3,861,722 3,362,012 3,861,722 3,362,012
Post employment benefits (Superannuation) 280,462 207,424 280,462 207,424
Other long-term benefits 51,927 42,474 51,927 42,474
Share awards 813,143 370,791 813,143 370,791
5,007,254 3,982,701 5,007,254 3,982,701 Full details of the remuneration of key management personnel for the year ended 30 June 2015 are outlined in the Directors’ Report.
The share awards of key management personnel for the year ended 30 June 2015 are outlined in the Directors’ Report.
11. Auditor’s remuneration
Consolidated Company
Auditor – Deloitte Touche Tohmatsu2015
$2014
$2015
$2014
$
Corporate entities
Audit & Assurance Services
Audit and review of the consolidated financial statements 320,762 219,189 238,415 183,415
Audit services in accordance with regulatory requirements 95,074 70,820 50,571 49,457
Other Assurance Services 10,000 - 10,000 -
425,836 290,009 298,986 232,872
Other services
Tax compliance services in respect of Group corporate entities 10,291 10,300 10,291 10,300
Other services 154,635 27,150 154,635 27,150
Total remuneration for corporate entities 590,762 327,459 463,912 270,322
Auditor – Deloitte Touche Tohmatsu2015
$2014
$
Managed funds and superannuation funds
Audit & Assurance Services
Audit and review of managed and superannuation funds 1,419,316 1,040,436
Audit services in accordance with regulatory requirements 449,987 391,403
Other assurance services - -
1,869,303 1,431,839
Other services
Taxation compliance services and review of constitutions, disclosure documents and tax returns for the Group's managed funds
644,977 490,117
Other services 97,910 76,250
Total remuneration for managed funds and superannuation funds
2,612,190 1,998,206
The ‘Other services’ amounts paid to Deloitte Touche Tohmatsu are in accordance with the Company’s auditor independence policy as outlined in the Corporate Governance Statement.
The fees above for managed funds, charitable entities and superannuation funds are incurred by the individual managed funds, charitable entities and superannuation funds.
44 Equity Trustees Annual Report 2015
For
per
sona
l use
onl
y

12. Current trade and other receivables
Consolidated Company
2015 $
2014 $
2015 $
2014 $
Trade receivables 4,893,836 3,443,209 4,707,040 3,401,317
Allowance for doubtful debts (14,363) (12,972) (14,363) (12,972)
Other 4,771,514 3,206,039 3,694,462 3,880,170
9,650,987 6,636,276 8,387,139 7,268,515
The trade receivables disclosed above are classified as loans and receivables and are therefore measured at amortised cost.
The terms of payment for all trade receivables is 14 days from invoice date. All accounts receivable outstanding more than 30 days are monitored and actively managed. No interest is charged on the trade receivables. An allowance has been made for estimated irrecoverable amounts relating to outstanding trade receivables as determined by a specific review of outstanding accounts. Factors considered in this review include the nature of the debtor, the relationship with the debtor, length of time the debt has been outstanding and knowledge of the reason for the delay in payment.
Before accepting significant new clients the credit worthiness of these clients is assessed by either executive management or the Due Diligence Committee (DDC) depending on the type of client. Other new client credit worthiness is assessed by business managers as is appropriate to the size and nature of those clients and also whether the client has funds deposited with the Company/Group from which the Company/Group is permitted to withdraw payment of its fees.
Included within the Group’s trade receivable balance are debtors with a carrying amount of $506,164 (2014: $372,283) which are past due at the reporting date but these have not been provided for as there has not been a significant change in credit quality and the amounts are considered recoverable. The Group does not hold any collateral over these balances.
Other receivables include corpus commission, dividends and interest receivable. These receivables are with Australian Securities Exchange listed companies, Australian banks, Australian managed investment schemes and client accounts administered by the Company. These amounts are all considered recoverable.
Consolidated Company
Trade receivables ageing of past due but not impaired2015
$2014
$2015
$2014
$
Under 30 days 276,332 143,546 264,292 143,546
30-60 days 98,601 74,337 98,601 71,810
Over 60 days 131,231 154,400 128,471 152,442
506,164 372,283 491,364 367,798
Consolidated Company
Movement in the allowance for doubtful debts2015
$2014
$2015
$2014
$
Balance at beginning of the year (12,972) (82,383) (12,972) (78,183)
Impairment losses recognised on trade receivables (31,352) (27,977) (31,352) (23,217)
Amounts written off as uncollectible 2,810 2,173 2,810 2,173
Impairment losses reversed 27,151 95,215 27,151 86,255
Balance at end of year (14,363) (12,972) (14,363) (12,972) In determining the recoverability of a trade receivable, the Group considers any change in the credit quality of the trade receivable from the date credit was initially granted up to the reporting date. The concentration of credit risk is limited due to the customer base being large and unrelated. Accordingly, the Directors believe that there is no further credit provision required in excess of the allowance for doubtful debts.
Equity Trustees Annual Report 2015 45
For
per
sona
l use
onl
y
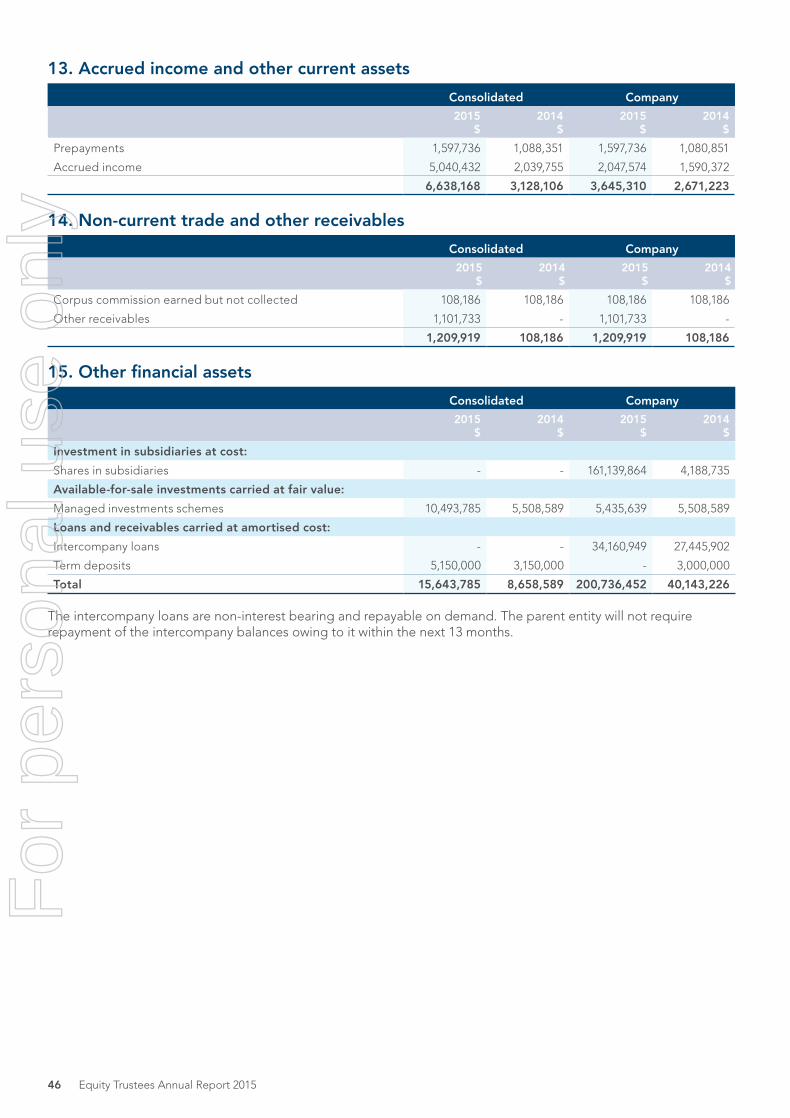
13. Accrued income and other current assets
Consolidated Company
2015 $
2014 $
2015 $
2014 $
Prepayments 1,597,736 1,088,351 1,597,736 1,080,851
Accrued income 5,040,432 2,039,755 2,047,574 1,590,372
6,638,168 3,128,106 3,645,310 2,671,223
14. Non-current trade and other receivables
Consolidated Company
2015 $
2014 $
2015 $
2014 $
Corpus commission earned but not collected 108,186 108,186 108,186 108,186
Other receivables 1,101,733 - 1,101,733 -
1,209,919 108,186 1,209,919 108,186
15. Other financial assets
Consolidated Company
2015 $
2014 $
2015 $
2014 $
Investment in subsidiaries at cost:
Shares in subsidiaries - - 161,139,864 4,188,735
Available-for-sale investments carried at fair value:
Managed investments schemes 10,493,785 5,508,589 5,435,639 5,508,589
Loans and receivables carried at amortised cost:
Intercompany loans - - 34,160,949 27,445,902
Term deposits 5,150,000 3,150,000 - 3,000,000
Total 15,643,785 8,658,589 200,736,452 40,143,226 The intercompany loans are non-interest bearing and repayable on demand. The parent entity will not require repayment of the intercompany balances owing to it within the next 13 months.
46 Equity Trustees Annual Report 2015
For
per
sona
l use
onl
y

16. Furniture, equipment and leasehold
Consolidated
Gross carrying amount
Computer hardware & equipment
at cost $
Leasehold improvements
at cost $
Office furniture & equipment
at cost $
Total $
Balance at 1 July 2013 2,380,625 1,233,023 817,352 4,431,000
Additions 571,374 16,567 27,146 615,087
Disposals (436,033) (10,767) - (446,800)
Balance at 1 July 2014 2,515,966 1,238,823 844,498 4,599,287
Additions 204,810 55,844 87,085 347,739
Disposals (263,006) (4,630) (12,723) (280,359)
Balance at 30 June 2015 2,457,770 1,290,037 918,860 4,666,667
Accumulated depreciation/amortisation and impairment
Balance at 1 July 2013 1,560,525 903,585 520,671 2,984,781
Disposals (425,941) (9,579) - (435,520)
Depreciation expense 387,671 91,976 68,499 548,146
Balance at 1 July 2014 1,522,255 985,982 589,170 3,097,407
Disposals (261,958) (4,630) (5,171) (271,759)
Depreciation expense 435,196 120,585 93,566 649,347
Balance at 30 June 2015 1,695,493 1,101,937 677,565 3,474,995
Net book value
As at 30 June 2014 993,711 252,841 255,328 1,501,880
As at 30 June 2015 762,277 188,100 241,295 1,191,672
Company
Gross carrying amount
Computer hardware & equipment
at cost $
Leasehold improvements
at cost $
Office furniture & equipment
at cost $
Total $
Balance at 1 July 2013 2,168,698 943,156 542,421 3,654,275
Additions 571,374 11,937 27,146 610,457
Disposals (256,530) - - (256,530)
Balance at 1 July 2014 2,483,542 955,093 569,567 4,008,202
Additions 204,811 54,154 87,085 346,050
Disposals (254,500) - - (254,500)
Balance at 30 June 2015 2,433,853 1,009,247 656,652 4,099,752
Accumulated depreciation/amortisation and impairment
Balance at 1 July 2013 1,365,904 618,190 310,784 2,294,878
Disposals (247,255) - - (247,255)
Depreciation expense 380,320 86,663 50,092 517,075
Balance at 1 July 2014 1,498,969 704,853 360,876 2,564,698
Disposals (253,853) - - (253,853)
Depreciation expense 426,460 117,354 76,825 620,639
Balance at 30 June 2015 1,671,576 822,207 437,701 2,931,484
Net book value
As at 30 June 2014 984,573 250,240 208,691 1,443,504
As at 30 June 2015 762,277 187,040 218,951 1,168,268
Equity Trustees Annual Report 2015 47
For
per
sona
l use
onl
y

16. Furniture, equipment and leasehold (cont’d)
Consolidated Company
Aggregate depreciation recognised as an expense during the year:
2015 $
2014 $
2015 $
2014 $
Computer hardware & equipment 435,196 387,671 426,460 380,320
Leasehold improvements 120,585 91,976 117,354 86,663
Office furniture and equipment 93,566 68,499 76,825 50,092
649,347 548,146 620,639 517,075
No depreciation was capitalised.
Depreciation expense is included in the line item ‘depreciation and amortisation expenses’ of the statement of profit or loss.
17. Intangible assets
Consolidated
Gross carrying amount
Computer software
$
Leasehold makegood
$
Management rights
$Total
$
Balance at 1 July 2013 7,956,379 234,000 30,271,561 38,461,940
Additions 3,462,925 - - 3,462,925
Disposals (1,788,399) - - (1,788,399)
Balance at 1 July 2014 9,630,905 234,000 30,271,561 40,136,466
Additions 2,406,989 - 51,752,000 54,158,989
Disposals (192,810) - - (192,810)
Balance at 30 June 2015 11,845,084 234,000 82,023,561 94,102,645
Accumulated amortisation and impairment
Balance at 1 July 2013 2,958,475 108,129 1,211,437 4,278,041
Amortisation expense 755,941 36,457 197,030 989,428
Disposals (257,828) - - (257,828)
Balance at 1 July 2014 3,456,588 144,586 1,408,467 5,009,641
Amortisation expense 1,119,323 27,290 1,345,651 2,492,264
Disposals (152,139) - - (152,139)
Balance at 30 June 2015 4,423,772 171,876 2,754,118 7,349,766
Net book value
As at 30 June 2014 6,174,317 89,414 28,863,094 35,126,825
As at 30 June 2015 7,421,312 62,124 79,269,443 86,752,879
48 Equity Trustees Annual Report 2015
For
per
sona
l use
onl
y

17. Intangible assets (cont’d)
Company
Gross carrying amount
Computer software
$
Leasehold makegood
$
Management rights
$Total
$
Balance at 1 July 2013 7,628,033 110,000 - 7,738,033
Additions 3,066,758 - - 3,066,758
Disposals (1,612,601) - - (1,612,601)
Balance at 1 July 2014 9,082,190 110,000 - 9,192,190
Additions 2,406,989 - - 2,406,989
Disposals (183,595) - - (183,595)
Balance at 30 June 2015 11,305,584 110,000 - 11,415,584
Accumulated amortisation and impairment
Balance at 1 July 2013 2,695,420 - - 2,695,420
Amortisation expense 705,869 31,167 - 737,036
Disposals (81,852) - - (81,852)
Balance at 1 July 2014 3,319,437 31,167 - 3,350,604
Amortisation expense 1,016,470 22,000 - 1,038,470
Disposals (146,963) - - (146,963)
Balance at 30 June 2015 4,188,944 53,167 - 4,242,111
Net book value
As at 30 June 2014 5,762,753 78,833 - 5,841,585
As at 30 June 2015 7,116,640 56,833 - 7,173,473 Amortisation expense is included in the line item ‘depreciation and amortisation expenses’ of the statement of profit or loss.
Significant intangible assetsThe Group holds the following significant management rights and customer contract intangibles. All these are externally generated intangibles.
Consolidated Company
2015 $
2014 $
2015 $
2014 $
Equity Trustees Wealth Services Limited – indefinite life 42,742,000 - - -
Equity Trustees Wealth Services Limited – fixed life 7,831,000 - - -
EquitySuper Master Trust – indefinite life 28,187,616 28,187,616 - -
Freedom of Choice – fixed life 332,773 418,215 - -
Equity Superannuation Management Pty Limited – fixed life 6,619 46,334 - -
Aged Care – fixed life 169,435 210,929 - -
79,269,443 28,863,094 - - The above indefinite life intangibles have been allocated for impairment testing purposes to the Trustee & Wealth Services (TWS) cash-generating unit. The carrying amount of the indefinite life intangibles allocated to the TWS cash-generating unit is $70,929,616 (2014: $28,187,616).
Details of the TWS cash-generating unit, the value-in-use calculation of the recoverable amount and key assumptions are contained in note 18.
Management has reviewed the useful life of the indefinite life intangibles and has determined that these indefinite life intangibles continue to have indefinite lives. In undertaking this review management has considered the economic, competitor and political environment in relation to the Trustee Company and Superannuation industries, the contractual rights and contractual relationships in relation to these indefinite life intangibles, and ability of the indefinite life intangibles to continue to have value into the foreseeable future.
Equity Trustees Annual Report 2015 49
For
per
sona
l use
onl
y
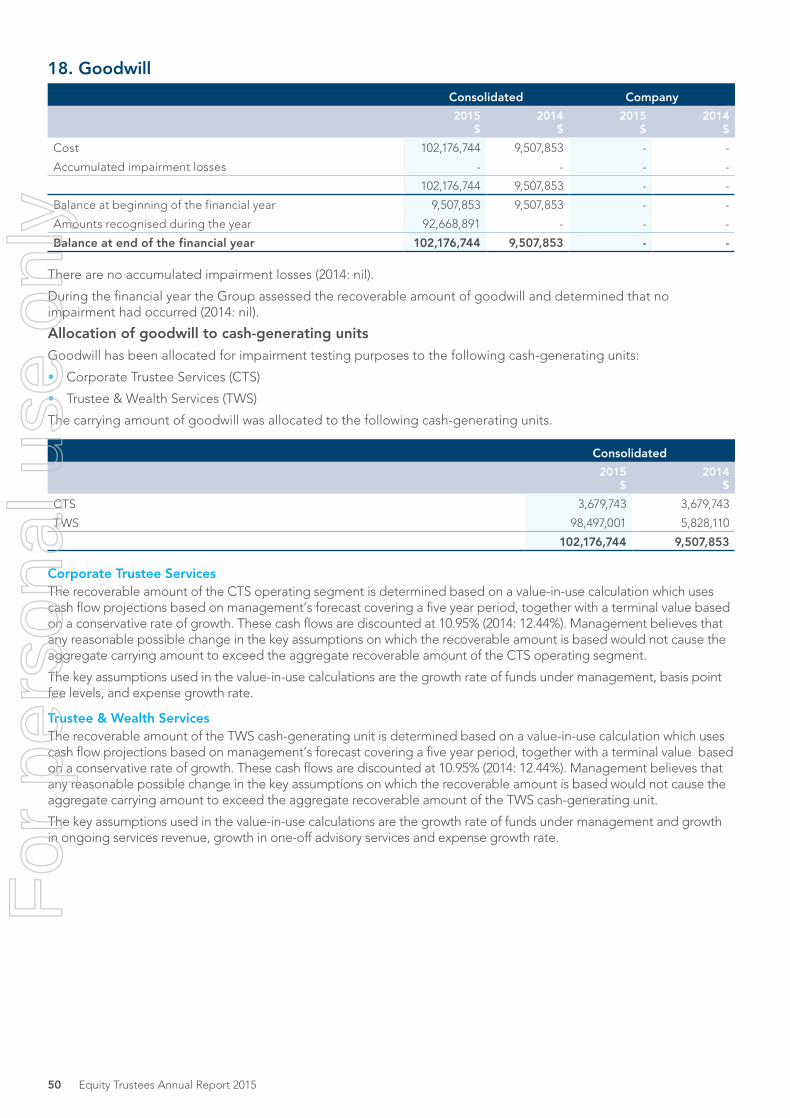
18. Goodwill
Consolidated Company
2015 $
2014 $
2015 $
2014 $
Cost 102,176,744 9,507,853 - -
Accumulated impairment losses - - - -
102,176,744 9,507,853 - -
Balance at beginning of the financial year 9,507,853 9,507,853 - -
Amounts recognised during the year 92,668,891 - - -
Balance at end of the financial year 102,176,744 9,507,853 - - There are no accumulated impairment losses (2014: nil).
During the financial year the Group assessed the recoverable amount of goodwill and determined that no impairment had occurred (2014: nil).
Allocation of goodwill to cash-generating units
Goodwill has been allocated for impairment testing purposes to the following cash-generating units:
• Corporate Trustee Services (CTS)
• Trustee & Wealth Services (TWS)
The carrying amount of goodwill was allocated to the following cash-generating units.
Consolidated
2015 $
2014 $
CTS 3,679,743 3,679,743
TWS 98,497,001 5,828,110
102,176,744 9,507,853 Corporate Trustee ServicesThe recoverable amount of the CTS operating segment is determined based on a value-in-use calculation which uses cash flow projections based on management’s forecast covering a five year period, together with a terminal value based on a conservative rate of growth. These cash flows are discounted at 10.95% (2014: 12.44%). Management believes that any reasonable possible change in the key assumptions on which the recoverable amount is based would not cause the aggregate carrying amount to exceed the aggregate recoverable amount of the CTS operating segment.
The key assumptions used in the value-in-use calculations are the growth rate of funds under management, basis point fee levels, and expense growth rate.
Trustee & Wealth Services The recoverable amount of the TWS cash-generating unit is determined based on a value-in-use calculation which uses cash flow projections based on management’s forecast covering a five year period, together with a terminal value based on a conservative rate of growth. These cash flows are discounted at 10.95% (2014: 12.44%). Management believes that any reasonable possible change in the key assumptions on which the recoverable amount is based would not cause the aggregate carrying amount to exceed the aggregate recoverable amount of the TWS cash-generating unit.
The key assumptions used in the value-in-use calculations are the growth rate of funds under management and growth in ongoing services revenue, growth in one-off advisory services and expense growth rate.
50 Equity Trustees Annual Report 2015
For
per
sona
l use
onl
y

19. Current trade and other payables
Consolidated Company
2015 $
2014 $
2015 $
2014 $
Trade payables 453,518 634,817 453,518 630,939
Goods and Services Tax payable 287,615 311,621 91,372 102,687
Other 434,141 211,386 413,014 199,504
1,175,274 1,157,824 957,904 933,130
The Group’s policy regarding trade payables is to pay all invoices by the due date. No interest charges have been incurred on trade payables.
20. Current provisions
Consolidated
Employee benefits
(note 24)$
Other
$Total
$
Balance at 1 July 2014 3,156,163 1,802,309 4,958,472
Additional provisions recognised - 1,108,804 1,108,804
Decrease arising from payments - (1,727,344) (1,727,344)
Decrease arising from re-measurement or settlement without cost - (74,965) (74,965)
Other movements 1,214,636 - 1,214,636
Balance at 30 June 2015 4,370,799 1,108,804 5,479,603
Company
Employee benefits
(note 24)$
Other $
Total $
Balance at 1 July 2014 2,816,847 1,745,165 4,562,012
Additional provisions recognised - 721,408 721,408
Decrease arising from payments - (1,670,200) (1,670,200)
Decrease arising from re-measurement or settlement without cost - (74,965) (74,965)
Other movements 1,553,952 - 1,553,952
Balance at 30 June 2015 4,370,799 721,408 5,092,207
Other provisions includes the Directors’ best estimate of amounts required to meet fringe benefit tax and other trade payment obligations that are owing.
21. Other current liabilities
Consolidated Company
At amortised cost:2015
$2014
$2015
$2014
$
Corpus commission collected but not earned 60,194 - 34,852 -
Other 53,082 135,318 53,082 119,243
113,276 135,318 87,934 119,243
Equity Trustees Annual Report 2015 51
For
per
sona
l use
onl
y

22. Non-current provisions
Consolidated
Makegood $
Employee benefits
(note 24) $
Total $
Balance at 1 July 2014 236,500 1,162,632 1,399,132
Additional provision recognised - 544,531 544,531
Other movements (2,500) - (2,500)
Balance at 30 June 2015 234,000 1,707,163 1,941,163
Company
Makegood $
Employee benefits
(note 24) $
Total $
Balance at 1 July 2014 110,000 944,401 1,054,401
Additional provision recognised - 762,762 762,762
Other movements - - -
Balance at 30 June 2015 110,000 1,707,163 1,817,163 The makegood provision represents the present value of the Directors’ best estimate of the future outflow of economic benefits that will be required to settle the Group’s obligations to makegood its leased premises at the end of the leases.
23. Other non-current liabilities
Consolidated Company
2015 $
2014 $
2015 $
2014 $
Amounts owing to controlled entity - - 100,010 100,010
Lease related liabilities 129,358 255,549 129,358 255,549
Corpus commission collected but not earned 34,995 34,995 34,995 34,995
164,353 290,544 264,363 390,554
24. Employee benefits
Consolidated Company
The aggregate employee benefits liability recognised and included in the financial statements is as follows:
2015 $
2014 $
2015 $
2014 $
Provision for employee benefits:
Current (note 20)
– Annual leave 1,931,019 1,336,446 1,931,019 1,094,410
– Long service leave 212,558 97,881 212,558 73,816
– Bonus 2,021,470 1,518,921 2,021,470 1,445,706
– Directors' retiring allowance 205,752 202,915 205,752 202,915
4,370,799 3,156,163 4,370,799 2,816,847
Non-current (note 22)
– Long service leave 1,707,163 1,162,632 1,707,163 944,401
6,077,962 4,318,795 6,077,962 3,761,248
The above employee benefit provisions are the Directors’ best estimate of the future outflow of economic benefits that will be required to settle these future payment obligations.
52 Equity Trustees Annual Report 2015
For
per
sona
l use
onl
y
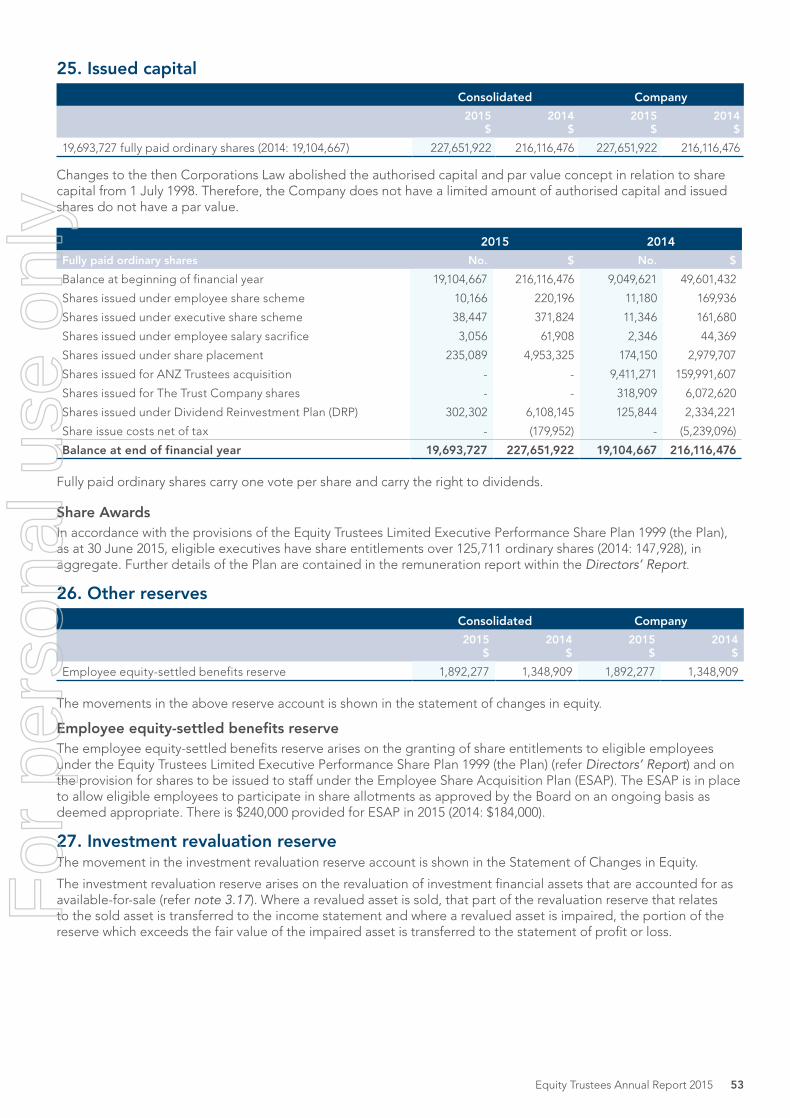
25. Issued capital
Consolidated Company
2015 $
2014 $
2015 $
2014 $
19,693,727 fully paid ordinary shares (2014: 19,104,667) 227,651,922 216,116,476 227,651,922 216,116,476
Changes to the then Corporations Law abolished the authorised capital and par value concept in relation to share capital from 1 July 1998. Therefore, the Company does not have a limited amount of authorised capital and issued shares do not have a par value.
2015 2014
Fully paid ordinary shares No. $ No. $
Balance at beginning of financial year 19,104,667 216,116,476 9,049,621 49,601,432
Shares issued under employee share scheme 10,166 220,196 11,180 169,936
Shares issued under executive share scheme 38,447 371,824 11,346 161,680
Shares issued under employee salary sacrifice 3,056 61,908 2,346 44,369
Shares issued under share placement 235,089 4,953,325 174,150 2,979,707
Shares issued for ANZ Trustees acquisition - - 9,411,271 159,991,607
Shares issued for The Trust Company shares - - 318,909 6,072,620
Shares issued under Dividend Reinvestment Plan (DRP) 302,302 6,108,145 125,844 2,334,221
Share issue costs net of tax - (179,952) - (5,239,096)
Balance at end of financial year 19,693,727 227,651,922 19,104,667 216,116,476 Fully paid ordinary shares carry one vote per share and carry the right to dividends.
Share AwardsIn accordance with the provisions of the Equity Trustees Limited Executive Performance Share Plan 1999 (the Plan), as at 30 June 2015, eligible executives have share entitlements over 125,711 ordinary shares (2014: 147,928), in aggregate. Further details of the Plan are contained in the remuneration report within the Directors’ Report.
26. Other reserves
Consolidated Company
2015 $
2014 $
2015 $
2014 $
Employee equity-settled benefits reserve 1,892,277 1,348,909 1,892,277 1,348,909 The movements in the above reserve account is shown in the statement of changes in equity.
Employee equity-settled benefits reserveThe employee equity-settled benefits reserve arises on the granting of share entitlements to eligible employees under the Equity Trustees Limited Executive Performance Share Plan 1999 (the Plan) (refer Directors’ Report) and on the provision for shares to be issued to staff under the Employee Share Acquisition Plan (ESAP). The ESAP is in place to allow eligible employees to participate in share allotments as approved by the Board on an ongoing basis as deemed appropriate. There is $240,000 provided for ESAP in 2015 (2014: $184,000).
27. Investment revaluation reserve The movement in the investment revaluation reserve account is shown in the Statement of Changes in Equity.
The investment revaluation reserve arises on the revaluation of investment financial assets that are accounted for as available-for-sale (refer note 3.17). Where a revalued asset is sold, that part of the revaluation reserve that relates to the sold asset is transferred to the income statement and where a revalued asset is impaired, the portion of the reserve which exceeds the fair value of the impaired asset is transferred to the statement of profit or loss.
Equity Trustees Annual Report 2015 53
For
per
sona
l use
onl
y

28. Earnings per share
Earnings per share Consolidated
2015 Cents per share
2014 Cents per share
Basic earnings per share 87.80 88.64
Diluted earnings per share 87.16 87.51
Basic earnings per share Consolidated
The earnings and weighted average number of ordinary shares used in the calculation of basic earnings per share are as follows:
2015 $
2014 $
Earnings 16,959,422 9,713,412
2015 No.
2014 No.
Weighted average number of ordinary shares for the purposes of basic earnings per share 19,315,827 10,958,664
Diluted earnings per share Consolidated
The earnings and weighted average number of ordinary shares used in the calculation of diluted earnings per share are as follows:
2015 $
2014 $
Earnings 16,959,422 9,713,412
2015 No.
2014 No.
Weighted average number of ordinary shares for the purposes of diluted earnings per share 19,457,450 11,100,294
There were no discontinued operations (2014: nil).
Consolidated
The weighted average number of ordinary shares for the purposes of diluted earnings per share reconciles to the weighted average number of ordinary shares used in the calculation of basic earnings per share as follows:
2015 No.
2014 No.
Weighted average number of ordinary shares used in the calculation of basic earnings per share
19,315,827 10,958,664
Shares deemed to be issued for no consideration in respect of employee share entitlements 141,623 141,630
Weighted average number of ordinary shares used in the calculation of diluted earnings per share
19,457,450 11,100,294
There have been no changes in accounting policies that have had an impact on earnings per share.
54 Equity Trustees Annual Report 2015
For
per
sona
l use
onl
y

29. Dividends
2015 2014
Cents per share $ Cents per share $
Recognised amounts
Fully paid ordinary shares
Interim dividend: Fully franked (Prior year: Fully franked) 46 8,865,316 46 4,442,641
Final dividend: Fully franked (Prior year: Fully franked) 48 9,193,004 50 4,534,808
18,058,320 8,977,449
Unrecognised amounts
Fully paid ordinary shares
Final dividend: Fully franked (Prior year: Fully franked) 48 9,453,256 48 9,190,937
Company
2015 $
2014 $
Franking account balance at 1 July 7,623,518 7,268,710
Tax paid 5,347,571 4,139,798
Franking credits received 35,632 62,488
Franking credits attached to interim and final dividends (7,739,280) (3,847,478)
Franking account balance at 30 June 5,267,441 7,623,518
Franking credits that will arise from income tax payable at reporting date 2,332,676 702,117
Franking credits that will arise from receipt of dividends recognised as receivables at reporting date
- 639
Franking credits to be attached to dividends declared but not recognised (4,051,395) (3,938,973)
Adjusted franking account balance 3,548,722 4,387,301
Equity Trustees Annual Report 2015 55
For
per
sona
l use
onl
y
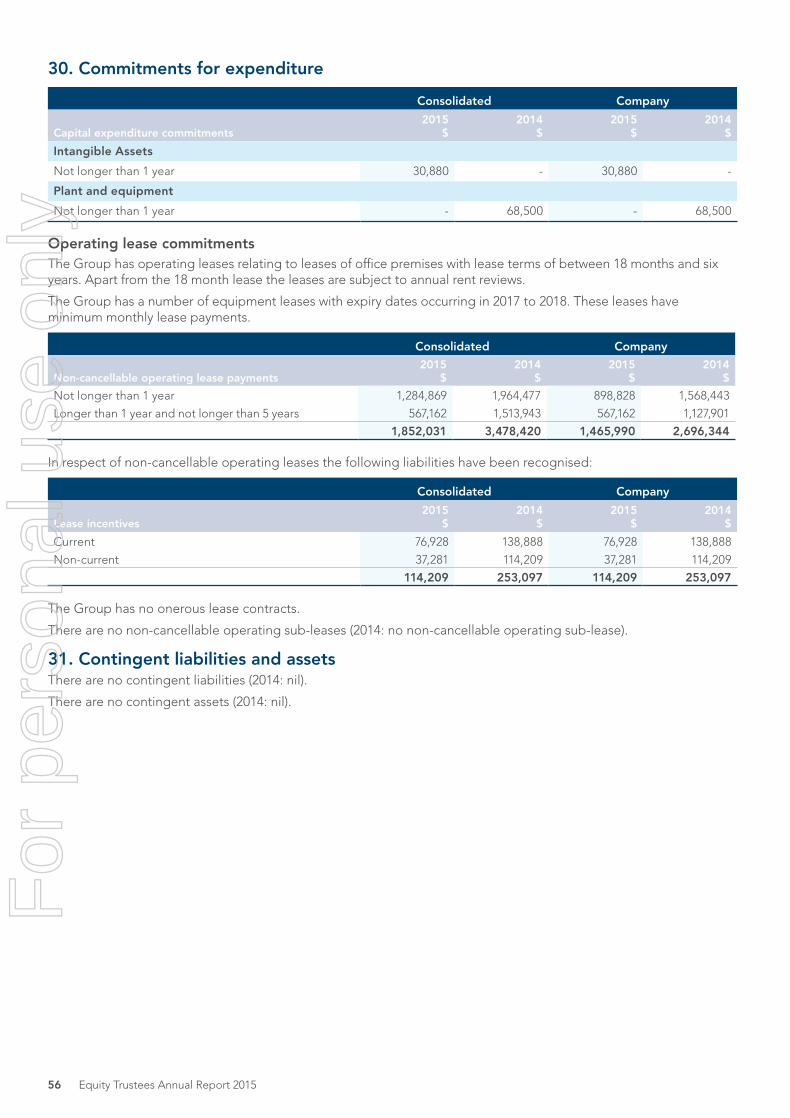
30. Commitments for expenditure
Consolidated Company
Capital expenditure commitments2015
$2014
$2015
$2014
$
Intangible Assets
Not longer than 1 year 30,880 - 30,880 -
Plant and equipment
Not longer than 1 year - 68,500 - 68,500 Operating lease commitmentsThe Group has operating leases relating to leases of office premises with lease terms of between 18 months and six years. Apart from the 18 month lease the leases are subject to annual rent reviews.
The Group has a number of equipment leases with expiry dates occurring in 2017 to 2018. These leases have minimum monthly lease payments.
Consolidated Company
Non-cancellable operating lease payments2015
$2014
$2015
$2014
$
Not longer than 1 year 1,284,869 1,964,477 898,828 1,568,443
Longer than 1 year and not longer than 5 years 567,162 1,513,943 567,162 1,127,901
1,852,031 3,478,420 1,465,990 2,696,344 In respect of non-cancellable operating leases the following liabilities have been recognised:
Consolidated Company
Lease incentives2015
$2014
$2015
$2014
$
Current 76,928 138,888 76,928 138,888
Non-current 37,281 114,209 37,281 114,209
114,209 253,097 114,209 253,097 The Group has no onerous lease contracts.
There are no non-cancellable operating sub-leases (2014: no non-cancellable operating sub-lease).
31. Contingent liabilities and assetsThere are no contingent liabilities (2014: nil).
There are no contingent assets (2014: nil).
56 Equity Trustees Annual Report 2015
For
per
sona
l use
onl
y

32. Subsidiaries
Name of entity Principal activity
Place of incorporation
and operation
Proportion of ownership interest and voting power
held by the Group
2015 2014
Parent entityEquity Trustees Limited Financial services AustraliaSubsidiariesEquity Trustees Wealth Services Limited Trustee services Australia 100% 0%Equity Investment Management Limited Superannuation
administrationAustralia 100% 100%
Equity Trustees Superannuation Limited Superannuation trustee services
Australia 100% 100%
EQT Aged Care Services Pty Ltd Aged care advice & placement
Australia 100% 100%
Non-trading subsidiariesEquity Nominees Limited Non-trading Australia 100% 100%Equity Superannuation Management Pty Limited Non-trading Australia 100% 100%Equity Superannuation Administration Pty Limited Non-trading Australia 100% 100%Super.com Pty Limited Non-trading Australia 100% 100%Super.com.au Pty Limited Non-trading Australia 100% 100%Holdfast Fund Services Pty Limited Non-trading Australia 100% 100%Apex Super Limited Non-trading Australia 100% 100%Simple Wrap Pty Ltd Non-trading Australia 100% 100%
Equity Trustees Limited is the head entity within the tax-consolidated group.
All the above subsidiaries are members of the tax-consolidated group.
Information about the composition of the Group at the end of the reporting period is as follows:
Principal activity
Place of incorporation and operation
Number of wholly-owned subsidiaries
2015 2014
Traditional trustee services Australia 1 0
Superannuation administration Australia 1 1
Superannuation trustee services Australia 1 1
Aged care advice & placement Australia 1 1
Non-trading Australia 8 8 Significant restrictionsThe Company has no significant restrictions (2014: The Company had cash and cash equivalents of $170m at balance date of which approximately $155m was used to acquire Equity Trustees Wealth Services Limited from ANZ Banking Group on settlement date 4 July 2014, with a further payment of approximately $1m made on agreement of the Completion Statements).
Equity Trustees Annual Report 2015 57
For
per
sona
l use
onl
y
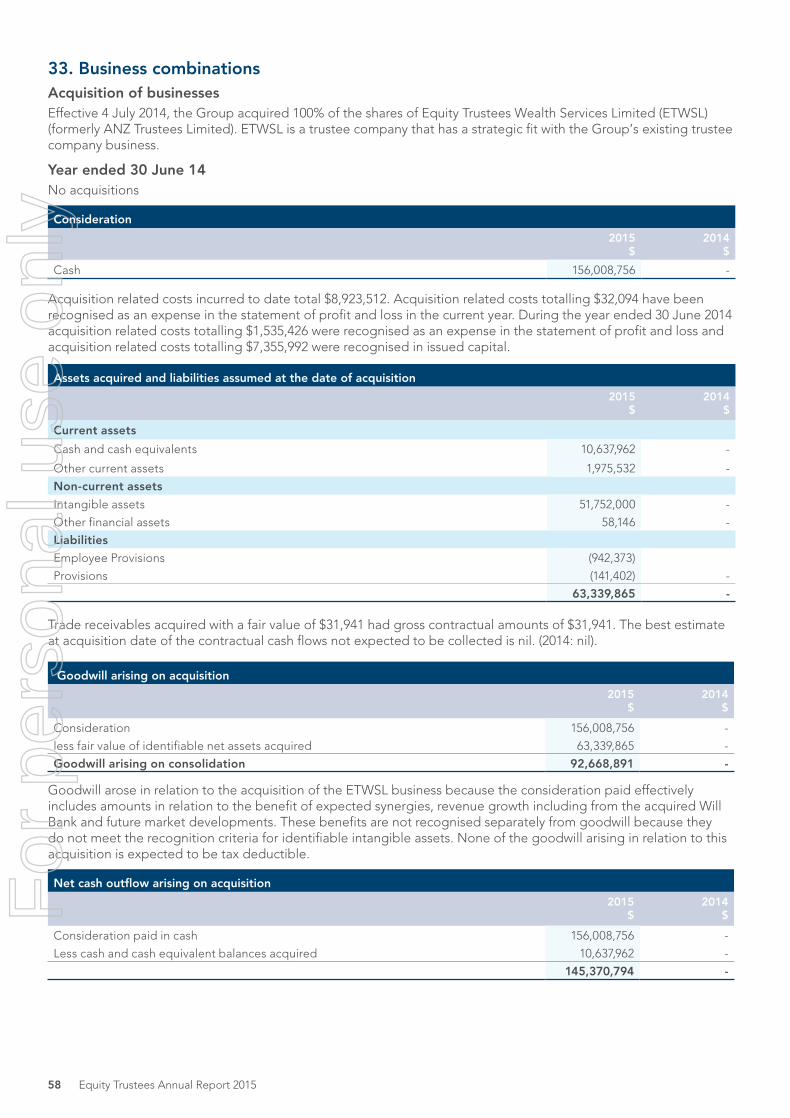
33. Business combinations Acquisition of businessesEffective 4 July 2014, the Group acquired 100% of the shares of Equity Trustees Wealth Services Limited (ETWSL) (formerly ANZ Trustees Limited). ETWSL is a trustee company that has a strategic fit with the Group’s existing trustee company business.
Year ended 30 June 14 No acquisitions
Consideration
2015 $
2014 $
Cash 156,008,756 -
Acquisition related costs incurred to date total $8,923,512. Acquisition related costs totalling $32,094 have been recognised as an expense in the statement of profit and loss in the current year. During the year ended 30 June 2014 acquisition related costs totalling $1,535,426 were recognised as an expense in the statement of profit and loss and acquisition related costs totalling $7,355,992 were recognised in issued capital.
Assets acquired and liabilities assumed at the date of acquisition
2015 $
2014 $
Current assets
Cash and cash equivalents 10,637,962 -
Other current assets 1,975,532 -
Non-current assets
Intangible assets 51,752,000 -
Other financial assets 58,146 -
Liabilities
Employee Provisions (942,373)
Provisions (141,402) -
63,339,865 - Trade receivables acquired with a fair value of $31,941 had gross contractual amounts of $31,941. The best estimate at acquisition date of the contractual cash flows not expected to be collected is nil. (2014: nil).
Goodwill arising on acquisition
2015 $
2014 $
Consideration 156,008,756 -
less fair value of identifiable net assets acquired 63,339,865 -
Goodwill arising on consolidation 92,668,891 -
Goodwill arose in relation to the acquisition of the ETWSL business because the consideration paid effectively includes amounts in relation to the benefit of expected synergies, revenue growth including from the acquired Will Bank and future market developments. These benefits are not recognised separately from goodwill because they do not meet the recognition criteria for identifiable intangible assets. None of the goodwill arising in relation to this acquisition is expected to be tax deductible.
Net cash outflow arising on acquisition
2015 $
2014 $
Consideration paid in cash 156,008,756 -
Less cash and cash equivalent balances acquired 10,637,962 -
145,370,794 -
58 Equity Trustees Annual Report 2015
For
per
sona
l use
onl
y

33. Business combinations (cont’d)Impact of acquisition on the results of the Group
The amount included in the profit after-tax for the year attributable to ETWSL entity is $8,328,926 (2014: nil). The revenue for the year includes $24,387,637 in respect of ETWSL entity (2014: nil). The profit after-tax and revenue for the year attributable to ETWSL entity are the statutory amounts included in the financial statements of the ETWSL legal entity and do not necessarily reflect the contribution of the acquired ETWSL business to the Trustee & Wealth Services segment as shown in note 34.
34. Segment informationInformation reported to the Group’s Managing Director (chief operating decision maker) for the purpose of resource allocation and assessment of performance is focused on the categories of services provided to customers. The principal categories of services are Trustee & Wealth Services and Corporate Trustee Services. No operating segments have been aggregated in arriving at the reportable segments of the Group. The Group’s reportable segments under AASB 8 are as follows:
Trustee & Wealth ServicesThe provision of personal financial and superannuation services, including in relation to personal estates and trusts, wealth management, asset management, aged care services, and portfolio services. Further details are included in the Directors’ Report.
Corporate Trustee ServicesResponsible Entity trustee services for managed funds on behalf of local and international managers and sponsors. Management and coordination of distribution and marketing for Equity Trustees co-branded retail and wholesale funds.
The following is an analysis of the Group’s revenue and results from continuing operations by reportable segment. There were no discontinued operations (2014: nil).
Consolidated
Segment revenue2015
$2014
$
Trustee & Wealth Services 59,883,745 31,317,124
Corporate Trustee Services 24,973,563 21,267,633
84,857,308 52,584,757
Unallocated - 2,349,842
Total revenue per statement of profit or loss 84,857,308 54,934,599
The revenue reported above represents revenue generated from external customers. There were no inter-segment sales (2014: nil).
No single customer accounts for 10% or more of the Group’s revenue.
Consolidated
Segment net profit before tax2015
$2014
$
Trustee & Wealth Services 16,206,390 6,981,534
Corporate Trustee Services 12,031,331 6,670,809
28,237,721 13,652,343
Unallocated (4,079,458) (245,947)
Total net profit before tax per statement of profit or loss 24,158,263 13,406,396
The accounting policies of the reportable segments are the same as the Group’s accounting policies described in note 3. Segment profit represents the contribution earned by each segment without the allocation of acquisition related expenditure or income tax. This is the measure reported to the chief operating decision maker for the purpose of resource allocation and assessment of segment performance.
Equity Trustees Annual Report 2015 59
For
per
sona
l use
onl
y

34. Segment information (cont’d)
Consolidated
Revenue by product and service2015
$2014
$
Trustee & Wealth Services 59,883,745 31,317,124
Corporate Trustee Services 24,973,563 21,267,633
84,857,308 52,584,757
For the purpose of monitoring performance the chief operating decision maker reviews balance sheet items for the Group as a whole. The Group’s assets and liabilities are not allocated to the reportable segments for management reporting purposes.
Geographic segmentThe Group operates only in Australia which is treated as one geographic segment.
35. Related party disclosures Parent Entity The parent entity of the Group is Equity Trustees Limited.
The ultimate Australian parent entity and ultimate parent entity is Equity Trustees Limited.
Equity interests in related parties Details of the percentage of ordinary shares held in subsidiaries are disclosed in note 32 to the financial statements.
The Company does not hold any interests in associates, joint ventures or other related parties.
Transactions with key management personnel
(a) Key management personnel remunerationDetails of key management personnel remuneration are disclosed in note 10 to the financial statements and in the Directors’ Report.
(b) Loans to key management personnelThe Group had nil key management personnel loans as at 30 June 2015 (2014: nil).
(c) Director and key management personnel equity holdingsDirector and key management personnel relevant interests in fully paid ordinary shares of Equity Trustees Limited are disclosed in the Directors’ Report.
(d) Entitlements to shares of Equity Trustees Limited issued under the Executive Performance Share Plan 1999.Details of entitlements to Equity Trustees Limited shares issued under the Executive Performance Share Plan 1999, are disclosed in the Directors’ Report.
(e) Vested shares awardsDetails of vested share awards are disclosed in the Directors’ Report.
60 Equity Trustees Annual Report 2015
For
per
sona
l use
onl
y

35. Related party disclosures (cont’d)(f) Other transactions with key management personnelSome Directors, key management personnel and their associates have investments in managed investment schemes for which the Company acts as responsible entity. These investments are made at arms length and in the ordinary course of business. Some Directors, key management personnel and their associates receive wealth management, superannuation and other financial services from the Group. These services are provided at arms length and in the ordinary course of business except the Directors, key management personnel and their associates are entitled to receive the normal available staff discount or other customary discount available in relation to size of business.
During the year Ms Williams was a director of Victorian Funds Management Corporation (VFMC), Defence Health (DH) and Guild Group Holdings Limited (GGHL) which, on behalf of VFMC, DH and GGHL clients, invests in various managed investment schemes, some of which have the Company as responsible entity. In her role as director of VFMC, DH and GGHL, Ms Williams was not actively involved in investment selections or the appointment of the Company as responsible entity to managed investment schemes in which VFMC, DH or GGHL invested.
Ms O’Donnell is a director and is on the Investment, Audit and Risk Committee of the Winston Churchill Memorial Trust which invests in a managed investment scheme, which has the Company as responsible entity. The investment in the managed investment scheme was undertaken before Ms O’Donnell became involved with the Trust. The Trust is advised by an independent investment manager. Ms O’Donnell does not participate in investment decisions relating to the managed investment scheme and was not actively involved in the appointment of the Company as responsible entity to the managed investment scheme.
There were no other related party transactions between the Group or the parent entity and key management personnel or their related entities apart from the above (2014: nil).
Transactions with subsidiariesBalances and transactions between the Company and its subsidiaries, which are related parties of the Company, have been eliminated on consolidation and are not disclosed in this note. Details of transactions between the Group and other related parties are disclosed below.
The Company had an interest free intercompany account with each of its controlled entities. The total amounts owed to the Company by its controlled entities are disclosed in note 15. The total amounts owed by the Company to its controlled entities are disclosed in note 23.
During the year, the parent entity received service charge revenue from Equity Trustees Wealth Services Limited, Equity Investment Management Limited and EQT Aged Care Services Limited. The aggregate amount of the service charge revenue is included in note 6.
The Company and its controlled entities have entered into a tax sharing arrangement, as disclosed in note 3.10.
During the year, controlled entities acted as trustee and administrator for the EquitySuper Master Trust (also incorporating Apex Super, Mutualsuper and Freedom of Choice sub-plans) and EquitySuper Pooled Superannuation Trust from which they received trustee and administration fees. These fees were contractually agreed with members.
During the year, a controlled entity received fees and commissions from the EquitySuper Master Trust for work undertaken on behalf of the EquitySuper Master Trust. Another controlled entity was the Trustee of the Trust.
During the year, a controlled entity, Equity Investment Management Limited, received administration and service charges from its subsidiary company, Equity Trustees Superannuation Limited.
All other transactions took place on normal commercial terms and conditions.
Investments in Managed Investment SchemesIncluded in the investment portfolio of the Company are investments in managed investment schemes where the Company acts as responsible entity. These investments are made on normal commercial terms and conditions.
Apart from the above there were no other transactions with related parties.
Equity Trustees Annual Report 2015 61
For
per
sona
l use
onl
y
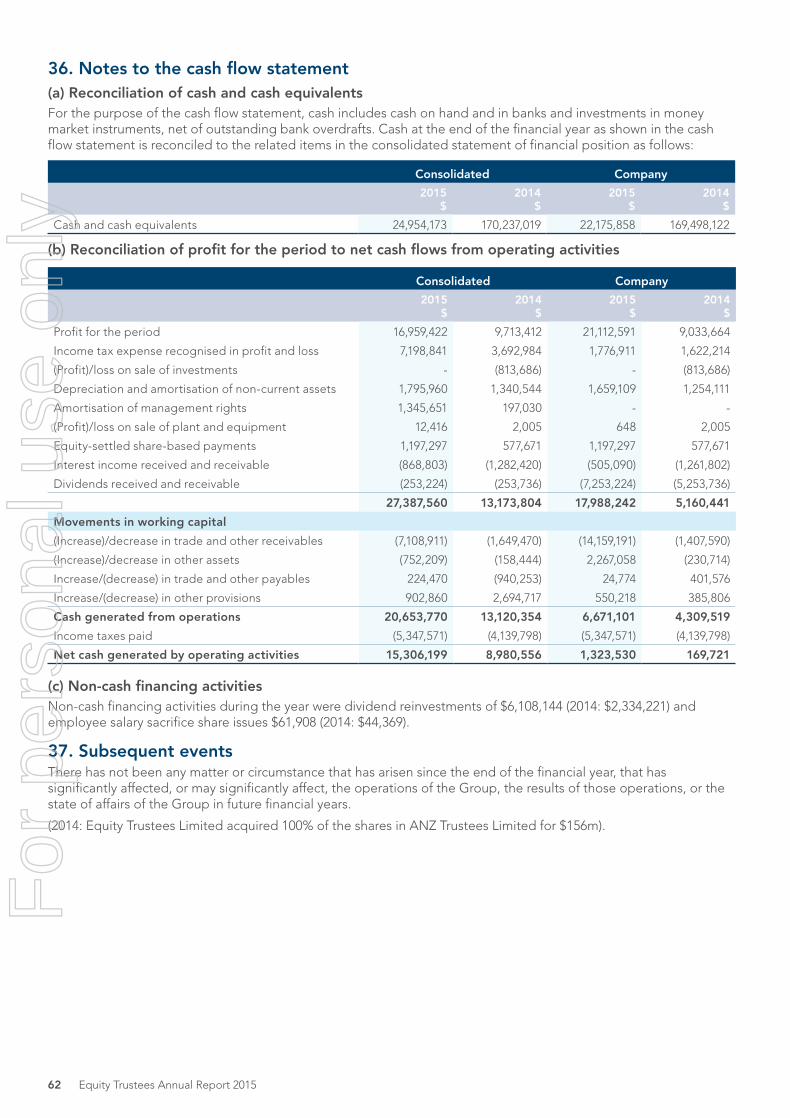
36. Notes to the cash flow statement (a) Reconciliation of cash and cash equivalentsFor the purpose of the cash flow statement, cash includes cash on hand and in banks and investments in money market instruments, net of outstanding bank overdrafts. Cash at the end of the financial year as shown in the cash flow statement is reconciled to the related items in the consolidated statement of financial position as follows:
Consolidated Company
2015 $
2014 $
2015 $
2014 $
Cash and cash equivalents 24,954,173 170,237,019 22,175,858 169,498,122
(b) Reconciliation of profit for the period to net cash flows from operating activities
Consolidated Company
2015 $
2014 $
2015 $
2014 $
Profit for the period 16,959,422 9,713,412 21,112,591 9,033,664
Income tax expense recognised in profit and loss 7,198,841 3,692,984 1,776,911 1,622,214
(Profit)/loss on sale of investments - (813,686) - (813,686)
Depreciation and amortisation of non-current assets 1,795,960 1,340,544 1,659,109 1,254,111
Amortisation of management rights 1,345,651 197,030 - -
(Profit)/loss on sale of plant and equipment 12,416 2,005 648 2,005
Equity-settled share-based payments 1,197,297 577,671 1,197,297 577,671
Interest income received and receivable (868,803) (1,282,420) (505,090) (1,261,802)
Dividends received and receivable (253,224) (253,736) (7,253,224) (5,253,736)
27,387,560 13,173,804 17,988,242 5,160,441
Movements in working capital
(Increase)/decrease in trade and other receivables (7,108,911) (1,649,470) (14,159,191) (1,407,590)
(Increase)/decrease in other assets (752,209) (158,444) 2,267,058 (230,714)
Increase/(decrease) in trade and other payables 224,470 (940,253) 24,774 401,576
Increase/(decrease) in other provisions 902,860 2,694,717 550,218 385,806
Cash generated from operations 20,653,770 13,120,354 6,671,101 4,309,519
Income taxes paid (5,347,571) (4,139,798) (5,347,571) (4,139,798)
Net cash generated by operating activities 15,306,199 8,980,556 1,323,530 169,721 (c) Non-cash financing activitiesNon-cash financing activities during the year were dividend reinvestments of $6,108,144 (2014: $2,334,221) and employee salary sacrifice share issues $61,908 (2014: $44,369).
37. Subsequent eventsThere has not been any matter or circumstance that has arisen since the end of the financial year, that has significantly affected, or may significantly affect, the operations of the Group, the results of those operations, or the state of affairs of the Group in future financial years.
(2014: Equity Trustees Limited acquired 100% of the shares in ANZ Trustees Limited for $156m).
62 Equity Trustees Annual Report 2015
For
per
sona
l use
onl
y

38. Financial instruments (a) Capital risk managementThe Group manages its capital to ensure that entities in the Group will be able to continue as going concerns while balancing achieving shareholder returns with prudential management of resources, achieving its long-term strategy and meeting the Net Tangible Asset (NTA) and cash flow projection/liquidity requirements currently imposed by regulatory authorities, as well as planning for future changes to these regulatory requirements.
The Group’s overall strategy for 2015 remains unchanged from 2014 but details of planned changes that will affect the 2016 and future years are outlined below. The Group has met its NTA and cash flow projection/liquidity regulatory requirements throughout the 2015 year, as well as the NTA regulatory requirements that applied for the 2014 year throughout that year.
The capital structure currently consists only of equity (refer note 25 for details regarding equity instruments issued). The Group operates only in Australia. It is subject to NTA and cash flow projection/liquidity requirements regulatory requirements under Australian Financial Services Licences (AFSL) and Registrable Superannuation Entity (RSE) Licence held by entities within the Group. There are no other externally imposed capital requirements (2014: nil).
Operating cash flows are used to maintain and expand the Group’s financial services activities including providing funds for acquiring suitable businesses that align with the existing financial services activities of the Group. Operating cash flows are also used to fund routine payments of tax and dividends.
The Group’s policy up to the end of the 2015 year has been to fund its activities, including business acquisitions, by using accumulated surplus operating cash flow and raising funds through the issue of ordinary shares in the head company, Equity Trustees Limited. This policy has been reviewed in light of the Group’s long-term strategy, prudential management of resources, dividend policy, market conditions, changing regulatory requirements in relation to its AFSLs and RSE licence and achieving shareholder returns.
Planned restructure for 2016 yearThe Group has commenced a staged corporate restructure which, subject to shareholder approval, will include a new, non-operating holding company. This restructure will be implemented during the year ending 30 June 2016.
The establishment of the new holding company, together with implementation of a number of other stages of the restructure project will deliver considerable benefits, including more efficient capital usage, licensing and business structures and greater funding flexibility. Further information in relation to the restructure will be provided to shareholders prior to the 2015 Annual General Meeting to be held on 27 November 2015, at which time shareholders will be asked to approve implementation of the new holding company arrangements.
In the context of the more efficient capital and funding structure the Company is seeking to achieve through the above restructure, ASIC has provided relief to allow the Group to hold a reduced level of NTA for regulatory purposes. This relief applies from 1 July 2015 until 31 December 2015. The minimum level of NTA required during this period is $32m, and is already accommodated within the Group’s existing and projected NTA. At 1 January 2016, the Directors expect that additional capital of $15m to $20m will be required and do not anticipate any difficulty raising this by debt, equity, guarantee or a combination of these.
(b) Significant accounting policiesDetails of the significant accounting policies and methods adopted (including the criteria for recognition, the bases of measurement and the bases for recognition of income and expenses) for each class of financial assets, financial liability and equity instrument are disclosed in note 3.
Equity Trustees Annual Report 2015 63
For
per
sona
l use
onl
y
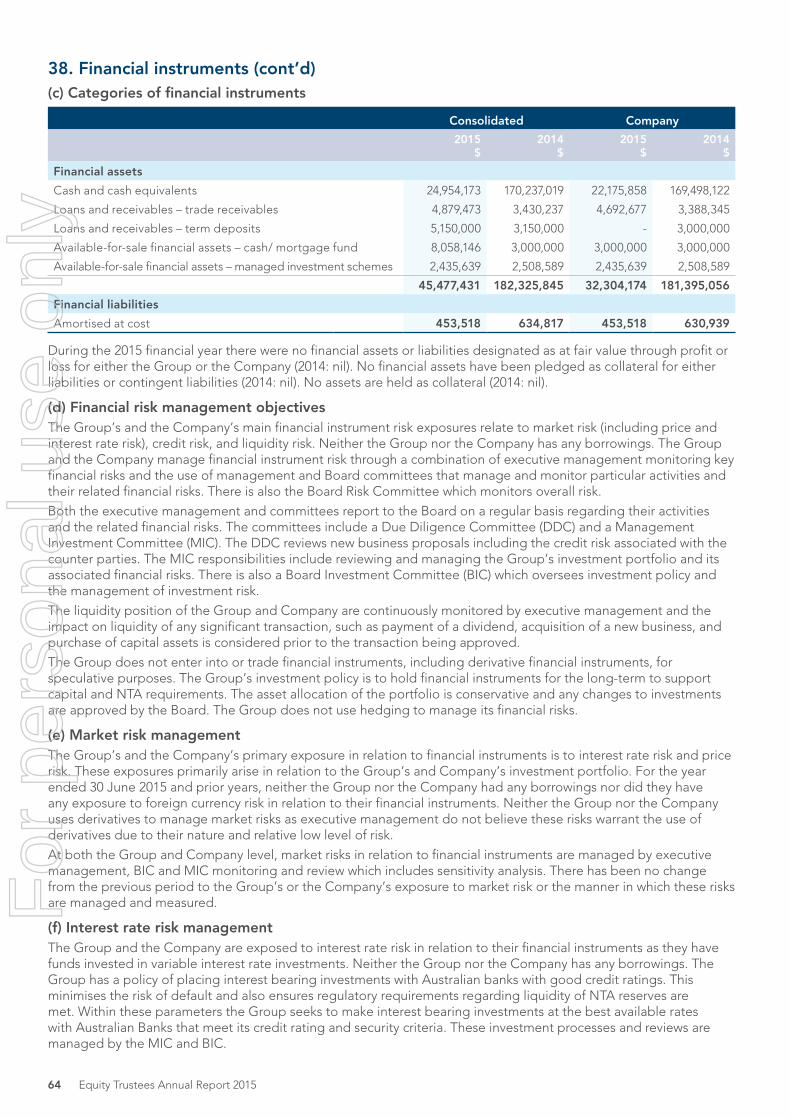
38. Financial instruments (cont’d)(c) Categories of financial instruments
Consolidated Company
2015 $
2014 $
2015 $
2014 $
Financial assets
Cash and cash equivalents 24,954,173 170,237,019 22,175,858 169,498,122
Loans and receivables – trade receivables 4,879,473 3,430,237 4,692,677 3,388,345
Loans and receivables – term deposits 5,150,000 3,150,000 - 3,000,000
Available-for-sale financial assets – cash/ mortgage fund 8,058,146 3,000,000 3,000,000 3,000,000
Available-for-sale financial assets – managed investment schemes 2,435,639 2,508,589 2,435,639 2,508,589
45,477,431 182,325,845 32,304,174 181,395,056
Financial liabilities
Amortised at cost 453,518 634,817 453,518 630,939
During the 2015 financial year there were no financial assets or liabilities designated as at fair value through profit or loss for either the Group or the Company (2014: nil). No financial assets have been pledged as collateral for either liabilities or contingent liabilities (2014: nil). No assets are held as collateral (2014: nil).
(d) Financial risk management objectivesThe Group’s and the Company’s main financial instrument risk exposures relate to market risk (including price and interest rate risk), credit risk, and liquidity risk. Neither the Group nor the Company has any borrowings. The Group and the Company manage financial instrument risk through a combination of executive management monitoring key financial risks and the use of management and Board committees that manage and monitor particular activities and their related financial risks. There is also the Board Risk Committee which monitors overall risk.
Both the executive management and committees report to the Board on a regular basis regarding their activities and the related financial risks. The committees include a Due Diligence Committee (DDC) and a Management Investment Committee (MIC). The DDC reviews new business proposals including the credit risk associated with the counter parties. The MIC responsibilities include reviewing and managing the Group’s investment portfolio and its associated financial risks. There is also a Board Investment Committee (BIC) which oversees investment policy and the management of investment risk.
The liquidity position of the Group and Company are continuously monitored by executive management and the impact on liquidity of any significant transaction, such as payment of a dividend, acquisition of a new business, and purchase of capital assets is considered prior to the transaction being approved.
The Group does not enter into or trade financial instruments, including derivative financial instruments, for speculative purposes. The Group’s investment policy is to hold financial instruments for the long-term to support capital and NTA requirements. The asset allocation of the portfolio is conservative and any changes to investments are approved by the Board. The Group does not use hedging to manage its financial risks.
(e) Market risk managementThe Group’s and the Company’s primary exposure in relation to financial instruments is to interest rate risk and price risk. These exposures primarily arise in relation to the Group’s and Company’s investment portfolio. For the year ended 30 June 2015 and prior years, neither the Group nor the Company had any borrowings nor did they have any exposure to foreign currency risk in relation to their financial instruments. Neither the Group nor the Company uses derivatives to manage market risks as executive management do not believe these risks warrant the use of derivatives due to their nature and relative low level of risk.
At both the Group and Company level, market risks in relation to financial instruments are managed by executive management, BIC and MIC monitoring and review which includes sensitivity analysis. There has been no change from the previous period to the Group’s or the Company’s exposure to market risk or the manner in which these risks are managed and measured.
(f) Interest rate risk managementThe Group and the Company are exposed to interest rate risk in relation to their financial instruments as they have funds invested in variable interest rate investments. Neither the Group nor the Company has any borrowings. The Group has a policy of placing interest bearing investments with Australian banks with good credit ratings. This minimises the risk of default and also ensures regulatory requirements regarding liquidity of NTA reserves are met. Within these parameters the Group seeks to make interest bearing investments at the best available rates with Australian Banks that meet its credit rating and security criteria. These investment processes and reviews are managed by the MIC and BIC.
64 Equity Trustees Annual Report 2015
For
per
sona
l use
onl
y

38. Financial instruments (cont’d)Interest rate sensitivity analysis A sensitivity analysis in relation to the Group’s and Company’s exposure to interest rate movements is set out below. Management has assessed the reasonably possible change in interest rates to be plus/minus 100 basis points for 2015 (2014: plus/minus 100 basis points) based on a review of market conditions. This assumes both long and short-term interest rates will have the same basis point movement.
The sensitivity analysis is calculated using the end of year balance of the financial instrument where this balance is representative of the balance throughout the year. If the end of year balance is not representative of the balance throughout the year, then the sensitivity analysis is calculated using the average balance (calculated on a quarterly basis) held throughout the year.
ConsolidatedCarrying amount at 30 June 2015 Interest rate risk
2015 $
-1% +1%
Profit $
Equity $
Profit $
Equity $
Cash and cash equivalents 24,954,173 (165,945) n/a 165,945 n/a
Loans and receivables – term deposits 5,150,000 (75,379) n/a 75,379 n/a
Available-for-sale financial assets – cash/mortgage fund
8,058,146 (55,376) n/a 55,376 n/a
38,162,319 (296,700) n/a 296,700 n/a
ConsolidatedCarrying amount at 30 June 2014 Interest rate risk
2014 $
-1% +1%
Profit $
Equity $
Profit $
Equity $
Cash and cash equivalents 170,237,019 (519,839) n/a 519,839 n/a
Loans and receivables – term deposits 3,150,000 (28,584) n/a 28,584 n/a
Available-for-sale financial assets – mortgage fund
3,000,000 (30,247) n/a 30,247 n/a
176,387,019 (578,670) n/a 578,670 n/a
CompanyCarrying amount at 30 June 2015 Interest rate risk
2015 $
-1% +1%
Profit $
Equity $
Profit $
Equity $
Cash and cash equivalents 22,175,858 (122,798) n/a 122,798 n/a
Loans and receivables – term deposits - (22,356) n/a 22,356 n/a
Available-for-sale financial assets – mortgage fund
3,000,000 (30,000) n/a 30,000 n/a
25,175,858 (175,154) n/a 175,154 n/a
CompanyCarrying amount at 30 June 2014 Interest rate risk
2014 $
-1% +1%
Profit $
Equity $
Profit $
Equity $
Cash and cash equivalents 169,498,122 (511,176) n/a 511,176 n/a
Loans and receivables – term deposits 3,000,000 (27,828) n/a 27,828 n/a
Available-for-sale financial assets – mortgage fund
3,000,000 (30,247) n/a 30,247 n/a
175,498,122 (569,251) n/a 569,251 n/a
Equity Trustees Annual Report 2015 65
For
per
sona
l use
onl
y

38. Financial instruments (cont’d)(g) Other price riskThe Group and the Company are exposed to other price risk from their investment in an Australian managed investment scheme. This investment is held for long-term investment purposes and supports the NTA requirement. It is not held for trading purposes and it is not actively traded.
The risk is primarily managed by maintaining prudent asset allocations within the investment portfolio, to minimise the impact of movements in equity prices on the overall portfolio whilst maintaining acceptable levels of returns, and by continuously monitoring the quality and performance of the investments. These investment processes and reviews are managed by the MIC and the BIC.
Price sensitivity analysisA sensitivity analysis in relation to the Group’s and Company’s exposure to other price movements is set out below. This sensitivity analysis has been determined based on the exposure to the investment in an Australian managed investment scheme that invests in Australian equities. Management has assessed the reasonably possible change in the Australian managed investment scheme as plus/minus 10% (2014: Australian managed investment scheme plus/minus 10%) based on a review of market conditions.
The sensitivity analysis is calculated using the end of year balance of the financial instrument as this balance is representative of the balance throughout the year (2014: calculated using the average balance (calculated on a quarterly basis) held throughout the year).
ConsolidatedCarrying amount at 30 June 2015
Plus/minus impact Other price risk
2015 $ %
Minus impact Plus impact
Profit $
Equity $
Profit $
Equity $
Available-for-sale investments:
Managed investment schemes 2,435,639 10% n/a (243,564) n/a 243,564
ConsolidatedCarrying amount at 30 June 2014
Plus/minus impact Other price risk
2014 $ %
Minus impact Plus impact
Profit $
Equity $
Profit $
Equity $
Available-for-sale investments:
Managed investment schemes 2,508,589 10% n/a (250,859) n/a 250,859
CompanyCarrying amount at 30 June 2015
Plus/minus impact Other price risk
2015 $ %
Minus impact Plus impact
Profit $
Equity $
Profit $
Equity $
Available-for-sale investments:
Managed investment schemes 2,435,639 10% n/a (243,564) n/a 243,564
CompanyCarrying amount at 30 June 2014
Plus/minus impact Other price risk
2014 $ %
Minus impact Plus impact
Profit $
Equity $
Profit $
Equity $
Available-for-sale investments:
Managed investment schemes 2,508,589 10% n/a (250,859) n/a 250,859
66 Equity Trustees Annual Report 2015
For
per
sona
l use
onl
y

38. Financial instruments (cont.)(h) Credit risk managementCredit risk refers to the risk that a counterparty will default on its contractual obligations resulting in financial loss to the Group. The Group and the Company have adopted a policy of only dealing with creditworthy counterparties as a means of mitigating the risk of financial loss from defaults. The main source of credit risk in relation to financial instruments is from outstanding accounts receivables and investments with banks and managed investment schemes.
Executive management and, where applicable, the DDC reviews significant new clients before the take on of these clients is approved. The review process includes establishing the credit worthiness of the client. Other new clients are reviewed by business managers for credit worthiness as is appropriate to the size and nature of the client. The MIC and BIC reviews and monitors the investments with banks and managed investment schemes including any credit risk issues.
Accounts receivable consists of a large number of customers. Ongoing evaluation is performed on the financial condition of outstanding accounts receivables by the applicable business managers.
The Group does not have any significant credit risk exposure to any single counterparty or any group of counterparties having similar characteristics (2014: $164m term deposits with ANZ Group). The credit risk on liquid funds is limited because the Group holds its liquid funds with counterparties that are banks with high credit-ratings assigned by international credit-rating agencies and in managed investment schemes which have a low risk of default.
As outlined in note 35, included in the investment portfolio of the Company and Group are investments in managed investment schemes where the Company acts as responsible entity. Although the Company has a prima facie credit exposure from these investments, this risk is not significant due to the existence of suitable controls including monitoring by the MIC of the quality and security of these investments.
The carrying amount of financial assets recorded in the financial statements, net of any allowances for losses, represents the Company’s and Group’s maximum exposure to credit risk without taking account of any collateral obtained.
(i) Fair value of financial instrumentsThis note provides information about how the Group determines fair values of various financial assets and financial liabilities.
Fair value of the Group’s financial assets and financial liabilities that are measured at fair value on a recurring basisSome of the Group’s financial assets are measured at fair value at the end of each reporting period.
Financial assets Fair value as at
Fair value
hierarchyValuation technique
Significant unobservable
inputs
Relationship unobservable
inputs to fair value
2015 2014
Consolidated
Managed investment schemes 2,435,639 2,508,589 Level 2 Daily published
prices
n/a n/a
Company
Managed investment schemes 2,435,639 2,508,589 Level 2 Daily published
prices
n/a n/a
There was no transfer between Level 1 and 2 (2014: $2,508,589 was transferred from level 1 to level 2). The Group classifies the investment in the managed investment scheme as level 2 in the fair value hierarchy on the basis that although there are quoted market prices, active markets with significant trading frequency and market volume did not exist.
Fair value of financial assets and financial liabilities that are not measured at fair value on a recurring basis The Directors consider that the carrying amount of financial assets and financial liabilities recorded in the financial statements approximates their fair values.
Equity Trustees Annual Report 2015 67
For
per
sona
l use
onl
y

38. Financial instruments (cont.)(j) Liquidity risk managementUltimate responsibility for liquidity risk management rests with the Board of Directors, who have put in place a suitable risk management framework to manage the Group’s and Company’s short, medium and long-term funding and liquidity management requirements.
The Group and Company manage liquidity risk by maintaining adequate reserves and banking facilities. The liquidity position of the Group and Company are continuously monitored by executive management and the impact on liquidity of any significant transaction, such as payment of a dividend, acquisition of a new business, and purchase of capital assets is considered prior to the transaction being approved.
Neither the Group nor the Company has any derivative financial instruments.
Liquidity and interest risk tableThe following tables detail the Company’s and the Group’s remaining contractual maturity for its non-derivative financial liabilities. The tables have been drawn up based on the undiscounted cash flows of financial liabilities based on the earliest date on which the Company/Group can be required to pay. None of the amounts in the table are interest bearing.
Weighted average effective interest rate
%
Less than1 month
$
1-3 months
$
3 months to 1 year
$1-5 years
$5+ years
$
Consolidated
2015
Non-interest bearing – trade creditors Nil 453,518 - - - -
Financial guarantee contracts Nil - - - - -
453,518 - - - -
2014
Non-interest bearing – trade creditors Nil 634,817 - - - -
Financial guarantee contracts Nil - - - - -
634,817 - - - -
Company
2015
Non-interest bearing – trade creditors Nil 453,518 - - - -
Financial guarantee contracts Nil - - - - -
453,518 - - - -
2014
Non-interest bearing – trade creditors Nil 630,939 - - - -
Financial guarantee contracts Nil - - - - -
630,939 - - - - At the year end it was not probable that the counterparty to the financial guarantee contracts will claim under the contracts. Consequently, the amount included above is nil (2014: nil). The maximum amount payable under these guarantees is $903,336 (2014: $933,232).
(k) Financing facilities
Consolidated Company
2015 $
2014 $
2015 $
2014 $
Bank overdraft facility
Amount used - - - -
Amount unused 1,000,000 1,000,000 1,000,000 1,000,000
1,000,000 1,000,000 1,000,000 1,000,000
68 Equity Trustees Annual Report 2015
For
per
sona
l use
onl
y

Equity Trustees Annual Report 2015 69
For
per
sona
l use
onl
y

Independent Auditor’s Reportto the Members of Equity Trustees Limited
Liability limited by a scheme approved under Professional Standards Legislation.
Member of Deloitte Touche Tohmatsu Limited
Deloitte Touche Tohmatsu ABN 74 490 121 060 550 Bourke Street Melbourne VIC 3000 GPO Box 78 Melbourne VIC 3001 Australia Tel: +61 3 9671 7000 Fax: +61 3 9671 7001 www.deloitte.com.au
Independent Auditor’s Report to the Members of Equity Trustees Limited
Report on the Financial Report
We have audited the accompanying financial report of Equity Trustees Limited, which comprises the statement of financial position as at 30 June 2015, the statement of profit or loss, the statement of profit and loss and other comprehensive income, the statement of cash flows and the statement of changes in equity for the year ended on that date, notes comprising a summary of significant accounting policies and other explanatory information, and the directors’ declaration of the consolidated entity, comprising the company and the entities it controlled at the year’s end as set out on pages 19 to 69.
Directors’ Responsibility for the Financial Report
The directors of the company are responsible for the preparation of the financial report that gives a true and fair view in accordance with Australian Accounting Standards and the Corporations Act 2001 and for such internal control as the directors determine is necessary to enable the preparation of the financial report that gives a true and fair view and is free from material misstatement, whether due to fraud or error. In Note 3, the directors also state, in accordance with Accounting Standard AASB 101 Presentation of Financial Statements, that the financial statements comply with International Financial Reporting Standards.
Auditor’s Responsibility
Our responsibility is to express an opinion on the financial report based on our audit. We conducted our audit in accordance with Australian Auditing Standards. Those standards require that we comply with relevant ethical requirements relating to audit engagements and plan and perform the audit to obtain reasonable assurance whether the financial report is free from material misstatement.
An audit involves performing procedures to obtain audit evidence about the amounts and disclosures in the financial report. The procedures selected depend on the auditor’s judgement, including the assessment of the risks of material misstatement of the financial report, whether due to fraud or error. In making those risk assessments, the auditor considers internal control, relevant to the company’s preparation of the financial report that gives a true and fair view, in order to design audit procedures that are appropriate in the circumstances, but not for the purpose of expressing an opinion on the effectiveness of the company’s internal control. An audit also includes evaluating the appropriateness of accounting policies used and the reasonableness of accounting estimates made by the directors, as well as evaluating the overall presentation of the financial report.
We believe that the audit evidence we have obtained is sufficient and appropriate to provide a basis for our audit opinion.
Auditor’s Independence Declaration In conducting our audit, we have complied with the independence requirements of the Corporations Act 2001. We confirm that the independence declaration required by the Corporations Act 2001, which has been given to the directors of Equity Trustees Limited, would be in the same terms if given to the directors as at the time of this auditor’s report.
70 Equity Trustees Annual Report 2015
For
per
sona
l use
onl
y
Opinion In our opinion:
(a) the financial report of Equity Trustees Limited is in accordance with the Corporations Act 2001, including:
(i) giving a true and fair view of the company’s and consolidated entity’s financial position as at 30 June 2015 and of their performance for the year ended on that date; and
(ii) complying with Australian Accounting Standards and the Corporations Regulations 2001; and
(b) the financial statements also comply with International Financial Reporting Standards as disclosed in Note 3.
Report on the Remuneration Report
We have audited the Remuneration Report as set out on pages 7 to 15 of the directors’ report for the year ended 30 June 2015. The directors of the company are responsible for the preparation and presentation of the Remuneration Report in accordance with section 300A of the Corporations Act 2001. Our responsibility is to express an opinion on the Remuneration Report, based on our audit conducted in accordance with Australian Auditing Standards.
Opinion
In our opinion the Remuneration Report of Equity Trustees Limited for the year ended 30 June 2015, complies with section 300A of the Corporations Act 2001.
DELOITTE TOUCHE TOHMATSU
Neil Brown Partner Chartered Accountants
Melbourne, 27 August 2015
Page 2
Equity Trustees Annual Report 2015 71
For
per
sona
l use
onl
y

Statement of ShareholdingsThe Company’s shares are listed on the Australian Securities Exchange.
The issued capital of the Company as at 30 September 2015 comprising 19,779,248 fully paid ordinary shares is held by 2,815 shareholders as follows:
Size of holding Holders of ordinary shares
1 – 1,000* 1,292
1,001 – 5,000 1,106
5,001 – 10,000 237
10,001 – 100,000 164
100,001 and over 16
2,815
*Number of shareholders holding less than a marketable parcel ($500) based on the market price of $22.75 as at 30 September 2015 was 59.
Twenty largest shareholders as at 30 September 2015 No. of shares %
1. National Nominees Limited 2,395,949 12.11
2. J P Morgan Nominees Australia Limited 2,274,143 11.50
3. HSBC Custody Nominees (Australia) Limited 1,640,228 8.29
4. Australian Foundation Investment Company Limited 1,488,232 7.52
5. Citicorp Nominees PTY Limited 969,468 4.90
6. Milton Corporation Limitied 490,205 2.48
7. Superdeck PTY LTD <D K C & E Groves S/Fund A/C> 301,711 1.53
8. Mirrabooka Investments Limited 300,000 1.52
9. CS Fourth Nominees PTY LTD 254,277 1.29
10. RBC Investor Services Australia Nominees PTY Limited <BKCUST A/C> 178,704 0.90
11. BKI Investment Company Limited 162,961 0.82
12. Equity Nominees Limited <No 2 Account> 162,017 0.82
13. EST MR Vernon Thomas Hauser 139,562 0.71
14. BNP Paribas Noms PTY LTD <DRP> 138,776 0.70
15. Mr Leonard Clive Keyte 132,495 0.67
16. Zero Nominees PTY LTD 113,496 0.57
17. Medical Research Foundation for Women and Babies 86,772 0.44
18. HSBC Custody Nominees (Australia) Limited – A/C 3 85,166 0.43
19. Mr Peter John McCleave 71,710 0.36
20. KJE Superannuation PTY LTD <KJE Superannuation S/F A/C> 71,389 0.36
Substantial shareholdersAt 30 September 2015, substantial shareholder notices had been received from the following shareholders:
Shares held
Australian Foundation Investment Company Limited 1,456,435
BT Investment Management Ltd 1,404,897
Westpac Banking Corporation Ltd 1,404,897
AustralianSuper Pty Ltd 1,010,752
Bennelong Fund Management Group Pty Ltd 985,016
72 Equity Trustees Annual Report 2015
For
per
sona
l use
onl
y

Company SecretaryPhilip B Maddox, LLB, BA, GDipAppFin (Finsia)
Chief Financial Officer Terry Ryan, BBus, FCA, F Fin
AuditorDeloitte Touche Tohmatsu 550 Bourke Street Melbourne, Victoria 3000
Share RegistryComputershare Investor Services Pty Ltd Yarra Falls, 452 Johnston Street Abbotsford, Victoria 3067
Registered OfficeLevel 2, 575 Bourke Street Melbourne, Victoria 3000 Phone (03) 8623 5000 Fax (03) 8623 5200 Email [email protected]
Annual General Meeting11.00am, Friday 27 November 2015 Level 2, RACV Club 501 Bourke Street, Melbourne
For
per
sona
l use
onl
y

Equity Trustees Limited
ABN 46 004 031 298 Australian Financial Services Licence No 240975
Level 2, 575 Bourke Street, Melbourne, Victoria 3000
GPO Box 2307, Melbourne, Victoria 3001
Phone 1300 133 472 Fax 03 8623 5200
Email [email protected] Web eqt.com.au
For
per
sona
l use
onl
y

Shareholder review
For
per
sona
l use
onl
y

Board of DirectorsJA (Tony) Killen OAM, BA, FAICD, FAIM (Chairman, Non-executive)
Robin BO Burns, DipAcc, FAICD (Managing Director)
David F Groves, BCom, MCom, CA, FAICD (Deputy Chairman, Non-executive)
Alice JM Williams, BCom, FCPA, FAICD, ASFA AIF, CFA (Non-executive)
The Hon Jeffrey G Kennett AC, HonDBus (Ballarat), Hon LL D (Deakin) (Non-executive)
Anne M O’Donnell, BA (Bkg & Fin), MBA, FAICD, SF Fin (Non-executive)
Kevin J Eley, CA, F FIN, FAICD (Non-executive)
Michael J O’Brien, BCom, FIAA, CFA, GAICD (Non-executive)
Company SecretaryPhilip B Maddox, LLB, BA, GDipAppFin (Finsia)
Chief Financial Officer Terry Ryan, BBus, FCA, F Fin
AuditorDeloitte Touche Tohmatsu 550 Bourke Street Melbourne, Victoria 3000
Share RegistryComputershare Investor Services Pty Ltd Yarra Falls, 452 Johnston Street Abbotsford, Victoria 3067
Registered OfficeLevel 2, 575 Bourke Street Melbourne, Victoria 3000 Phone (03) 8623 5000 Fax (03) 8623 5200 Email [email protected]
Annual General Meeting11am, Friday 27 November 2015 Level 2, RACV Club 501 Bourke Street, Melbourne
For
per
sona
l use
onl
y

Equity Trustees Shareholder Review 2015 1
Contents
0302
040506
10
1415
08
12
About Equity Trustees
History
From the Chairman
Results at a Glance
Board of Directors
From the Managing Director
Corporate Trustee Services
Trustee & Wealth Services
Group Leadership Team
Information for Shareholders
Company SecretaryPhilip B Maddox, LLB, BA, GDipAppFin (Finsia)
Chief Financial Officer Terry Ryan, BBus, FCA, F Fin
AuditorDeloitte Touche Tohmatsu 550 Bourke Street Melbourne, Victoria 3000
Share RegistryComputershare Investor Services Pty Ltd Yarra Falls, 452 Johnston Street Abbotsford, Victoria 3067
Registered OfficeLevel 2, 575 Bourke Street Melbourne, Victoria 3000 Phone (03) 8623 5000 Fax (03) 8623 5200 Email [email protected]
Annual General Meeting11am, Friday 27 November 2015 Level 2, RACV Club 501 Bourke Street, Melbourne
For
per
sona
l use
onl
y

2 Equity Trustees Shareholder Review 2015
History
On 10 December 1888, Equity Trustees was established by a specific Act of Victorian Parliament.
By 1931, our revenue had grown 1000-fold and Joel Fox now employed a staff of 90. The company moved to new chambers at 472 Bourke Street; the site of Melbourne’s old Synagogue.
The acquisition of Lifetime Planning and Tender Living Care meant Equity Trustees could offer complementary aged care advice and placement services for elderly clients.
During WWII and into the 1950s, Equity Trustees began dealing with many widows and their children. This marked a change of focus for the company and we began promoting our services to support families during their toughest times.
Equity Trustees took on Responsible Entity, distribution and relationship management for leading Australian and international investment managers.
Acquired Wealthpac, later renaming it EquitySuper.
Sir Robert G. Menzies appointed to the Board (until he became Prime Minister in 1939).
Acquired ANZ Trustees, which positioned Equity Trustees in the ASX 300.
By 1880, the Victorian gold rush in the 1850’s provided the foundation for Melbourne to become the largest and richest city in the British Empire outside Britain. The production of great wealth led to a need for secure management of individual and family wealth at the time, and into the future. The Victorian Government of the day aimed to meet this need through passing a series of Acts allowing the creation of independent trustees. As a result, on 10 December 1888 Equity Trustees was established under the name Equity Trustees Executors and Agency Company Limited. The Company’s founder, Joel Fox, served for nearly 50 years as manager, and later on the Board. A trustee company by the name of The Trustees Executors and Agency Company Limited (TEA) was established 10 years before in 1878 by William Templeton; TEA later became ANZ Trustees, and in July 2014, when Equity Trustees acquired ANZ Trustees, the two historic companies combined to form one of Australia’s oldest and largest listed independent trustee companies.
Our purpose remains the same – providing independent and impartial trustee and executor services, partnering with clients and their advisers, helping with the financial and emotional challenges arising from the preservation, growth and inter-generational management of wealth.
1888
1931 20111950
2000
2003
19362014
For
per
sona
l use
onl
y
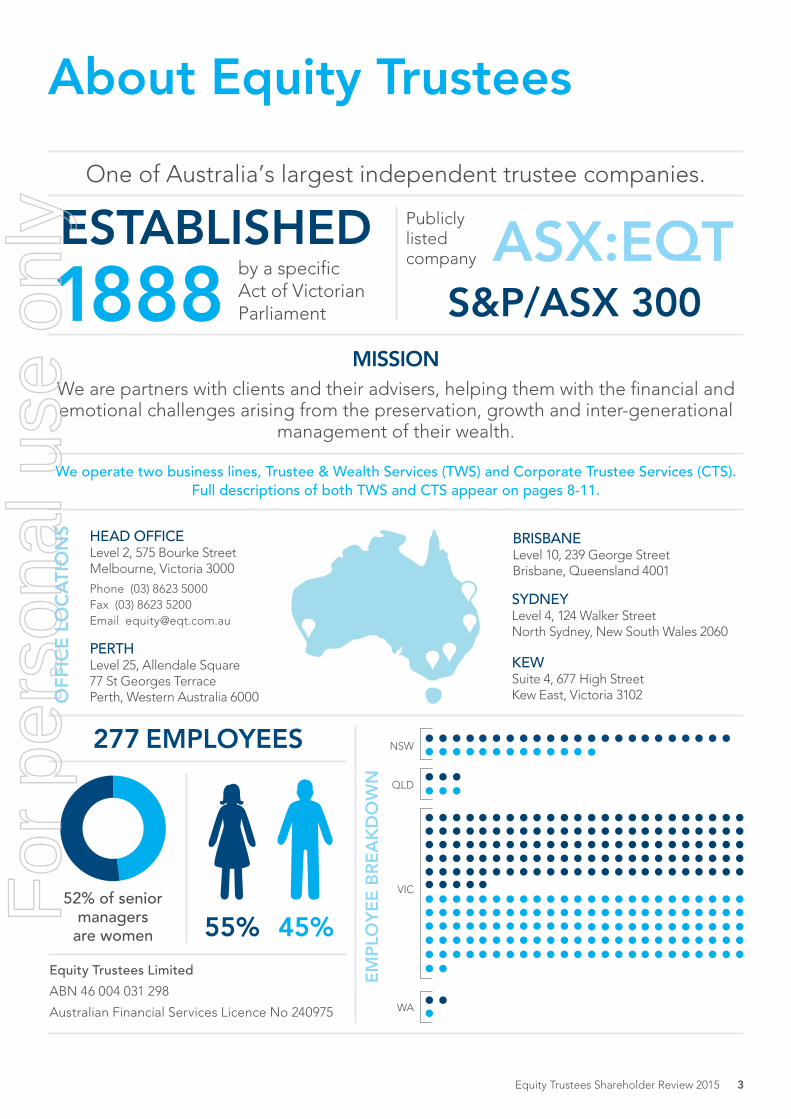
Equity Trustees Shareholder Review 2015 3
About Equity Trustees
Publicly listed company
ESTABliSHED ASX:EQT1888
One of Australia’s largest independent trustee companies.
by a specific Act of Victorian Parliament
SydneyLevel 4, 124 Walker Street North Sydney, New South Wales 2060
NSW
QLD
VIC
WA
KewSuite 4, 677 High Street Kew East, Victoria 3102
head officeLevel 2, 575 Bourke Street Melbourne, Victoria 3000
Phone (03) 8623 5000 Fax (03) 8623 5200 Email [email protected]
PerthLevel 25, Allendale Square 77 St Georges Terrace Perth, Western Australia 6000
BriSBaneLevel 10, 239 George Street Brisbane, Queensland 4001
OFF
iCE
lO
CA
TiO
nS
EM
plO
yE
E B
RE
Ak
DO
wn
277 EMplOyEES
equity trustees limited
ABN 46 004 031 298
Australian Financial Services Licence No 240975
MiSSiOnWe are partners with clients and their advisers, helping them with the financial and emotional challenges arising from the preservation, growth and inter-generational
management of their wealth.
we operate two business lines, trustee & wealth Services (twS) and corporate trustee Services (ctS). full descriptions of both twS and ctS appear on pages 8-11.
S&p/ASX 300
52% of senior managers
are women 55% 45%For
per
sona
l use
onl
y

4 Equity Trustees Shareholder Review 2015
From the ChairmanJA (Tony) killen OAMA year of achievementLast year on this page I discussed the strategic rationale and expected positive impact from the acquisition of ANZ Trustees (now ETWSL). A year on we have successfully integrated the two businesses. Many parts of the Company, especially in TWS, were heavily involved in the process – we estimate 70,000 hours work was dedicated to the various tasks. It is gratifying to be able to report that notwithstanding the distractions of the merger project, both TWS and CTS were able to generate organic revenue growth of 15% for the year, an outstanding achievement.
Results and Dividend Operating profit after-tax was $21.2m, more than doubling last year’s result. The operating margin increased from 27% to 35%.
The net result after non-operating items of expense associated with the integration was $17m, up 75% on the prior year.
A Final Dividend of 48 cps, fully franked, has been declared taking total dividends for the year to 94 cps, the same as last year. Factors influencing the Board’s decision on the level of Dividends included the underlying EPS, and the coming need to raise additional capital and retain liquid assets to meet regulatory obligations. At the current share price, the yield on the stock is approximately 4.25% before franking. Grossed up for franking credits the yield is approximately 6.25%.
Long-term shareholders have enjoyed sustained returns well ahead of the accumulated index return of our peers in the ASX 300, as illustrated in the graph on page 7. The strong interest in the stock from institutional shareholders evidenced in last year’s capital raising, continues.
Corporate initiativesWe have embarked on a corporate reconstruction designed to improve capital efficiency, enhance the range of future funding opportunities available to the Company and to rationalise the various licences employed within the Group.The details of the proposals are contained in separate documentation sent to shareholders, who will be asked to approve resolutions to give effect to the changes at a special Scheme Meeting held immediately after the Company’s Annual General Meeting on 27 November 2015.
We have also initiated a significant project to review our risk management framework, and build the risk and compliance model and culture that will best protect the long-term interests of the Company. Contemplated for some time, the project has been geared up following the successful integration of ETWSL and will absorb considerable resources during FY2016. Enhancements
in capability and resourcing have been made in other support units, to reflect the Company’s increased scale, reach and aspirations.
The BoardAs part of the ongoing development of the Board, and an important input to its succession planning requirements, this year we completed an audit of director skills and experience, professional and technical qualifications and behavioural attributes. This was completed with the help of an external consultant well experienced in the field. The audit not only enables us to satisfy governance and fit and proper obligations under our own policies, and in compliance with various regulatory requirements; it has also provided a concrete basis for discussion between the Chairman and individual directors during the course of individual performance appraisals.
It is pleasing to report that the results of this Skills Matrix assessment demonstrate the Board as currently constituted, has an appropriate mix of skills, experience, expertise and diversity to enable it to discharge its responsibilities, to serve the interests of all shareholders and to add value to the Company.
This year we have made some changes to our Committee structures. I have assumed the Chair of a newly established committee of the Board, the Risk Committee, which in its initial phase will comprise all non-executive directors, with the expectation this will reduce as the Committee settles into a regular agenda. David Groves and Anne O’Donnell joined the Remuneration Committee (I stepped down and Alice Williams is now Chair); David also joined the Investment Committee, (now Chaired by Mick O’Brien); and Kevin Eley became Audit & Compliance Committee Chair. These changes provide some rejuvenation of the Board as well as development opportunities for a number of the directors.
Our management and employeesThe Company owes a significant vote of thanks to our employees for their achievements this year; on behalf of shareholders and the Board I want to formally record our appreciation.
The Board believes that the Company is in a good position to benefit from the opportunities ahead and to provide attractive and appropriate outcomes or rewards to all our stakeholders – clients, shareholders and employees together.
Mr JA (Tony) Killen OAM Chairman
For
per
sona
l use
onl
y

Equity Trustees Shareholder Review 2015 5
From theManaging DirectorRobin Burns
Operating highlightsIn 2015, the Company’s operating highlights included:
• ETWSL integration completed below budget, at the short end of the expected timetable and achieved the synergy goals
• Strong organic revenue growth, and operating profit more than doubled
• Substantial work to improve and enhance operational capability and resources
• Business development initiatives implemented in prior periods are now generating results
• Commencement of projects to pursue long-term strategic goals, such as the Group operating and capital re-structure
• Work began on a number of important culture and values projects, to reinforce the attributes that have underpinned success over a long period, and embed the model for long-term success for a new generation of staff, clients and external partners
Activities and directionsBoth revenue units generated organic revenue growth in excess of 14%. Although a small number of revenue lines did not meet our targets for the year, these shortfalls were more than offset by the strength of others.
Over recent periods we have invested substantially in initiatives to build distribution capacity for the TWS division. Whilst we have had very good client retention and cross-selling between some of our core activities for many years, we lacked distribution capability to build our client base. Given the amount of wealth to be advised on and transitioned between generations over coming years, and the need for professional advice and support in doing so, this lack of capacity would have been a material disadvantage. The distribution deficiency has been addressed and new client numbers for our core private wealth services are now growing steadily; this will flow into future revenue and earnings.
In the CTS division our new client development model has worked well in a very competitive sector and the growth in assets and client relationships reflects this. As noted in previous reports, the size of this industry sector is, however, far below that of private wealth services and our market share is already substantial. Hence, although it remains a highly viable and valuable business for us and is expected to continue to grow, CTS is more vulnerable to major client loss, external factors and targeted competition.
As a wholesale business CTS generates higher margins than TWS, but both units are operating at very acceptable levels and overall the Company is robust, with a total operating margin of 35%.
Over the last few years we have substantially re-positioned the Company’s business and operating model. We have been through two major acquisition processes and the largest single project in our history, in the integration of ETWSL. We also embarked on significant re-building of capability and functionality in support units, which continues. This all occurred during an unprecedented wave of regulatory change impacting many of our business activities, requiring expenditure of time, resources and money to implement.
The next stage of development will focus on leveraging access to external distribution and cross-selling, and the revenue synergy opportunities following integration. We will continue to pursue efficiencies and implement a more effective and flexible structure.
The financial services industry is now, by some measures, the largest in Australia and continues to grow. Our products and services are directed at meeting the needs of clients in defined and profitable segments within that very large industry and the prospects for our future growth are strong.
We continue to focus on what we have been traditionally good at – and believe it will also be very profitable for us in the future.
Our challenges are in the execution and implementation – converting the opportunity into results. I believe we have demonstrated that our operational competency and expertise justify confidence that we can achieve these goals.
It has again been a very active and full year for our executives and staff, although this will no doubt also be the reality for our business into the future as the pace of change will be a constant factor. I add my voice to the Chairman’s in recording thanks and appreciation to our team for their enthusiasm, hard work and support during the year.
Mr robin BurnsManaging Director
Creating a base for long-term success
For
per
sona
l use
onl
y

6 Equity Trustees Shareholder Review 2015
Results at a Glance
104%75%
Operating profit (after-tax)
Net profit (after-tax)
Operating margin up
Operating revenue up
Organic revenue
growth of
to
to 94c35%
$84.9m
8%
59%
15%
Full year fully franked dividend per share
TwS AnD CTS EXpERiEnCED
STROnG ORGAniC REVEnUE GROwTH
OpERATinG REVEnUE Up 59% TO $84.9M
2012
2014
2015
2011
2013
$39.2m
$43.0m
$46.8m
$53.3m
$84.9m
etwSl 27.6%$23.4m
eQt 72.4%
$61.5m
This financial year has been one focussed on achieving the initial goals from the most significant acquisition Equity Trustees has ever undertaken, and building a platform for growth into the future. The integration of ANZ Trustees surpassed expectations; it was completed more efficiently and at less cost than original estimates and resulted in a productive and strong ongoing relationship with ANZ.
Equity Trustees comprises two distinct and focused operating divisions – Trustee & Wealth Services (TWS) which now includes Equity Trustees Wealth Services Limited (ETWSL – formerly known as ANZ Trustees) and Corporate Trustee Services (CTS).
2015$84.9m
The margins are consistent with the nature of each of the businesses and their markets. More detail on these divisions, the services they offer, markets they target and the highlights of how they achieved their results is provided in the next few pages.
(total revenue $59.9m – up 89%)
with a margin of 27%(total revenue $24.9m – up 17%)
with a margin of 48%TwS
$16.2mCTS$12m
Profit contriBution
For
per
sona
l use
onl
y

Equity Trustees Shareholder Review 2015 7
For detailed financial breakdown of Equity Trustees performance, please refer to our 2015 Annual Report and Shareholder Presentation, available on our website.
SUSTAinED SHAREHOlDER RETURn
OpERATinG REVEnUE MOVEMEnT COMpARED TO pRiOR yEAR
assumes all dividends are reinvested.400
350
300
250
200
150
100
50
06/05 06/06 06/07
Base (100) taken at 1 July 2005
S&P/ASX 300 Accumulation Index
EQT total shareholder
06/08 06/09 06/10 06/11 06/12 06/13 06/14 06/150
1 July 2005 to 30 June 2015 1 July 2005 to 30 June 2015
EQT total shareholder return +212% S&P/ASX 300 Accum. Index return +96%
TWS
CTS
Other
2015
2014
ETWSL
$4.7m (+14.9%)
$53.3m
$23.4m (+100%)
$3.1m (+14.8%)
$84.9m (+59%)
$0.4m
Operating profit (after-tax) for the year was up 104% on the year before, and our position is further strengthened when considering the long term analysis – comparison of Equity Trustees total shareholder return over a 10 year period against an accumulated index return of our peers in the ASX top 300 highlights our superior result – a cumulative return for Equity Trustees of 212% compared to 96% for the aggregated group (see graph below).
For
per
sona
l use
onl
y

8 Equity Trustees Shareholder Review 2015
Trustee & wealth Services
hiGhliGhtS
Solid operating revenue growth, up
FUM/A up 81% to
90%
$7.8b
$59.3mto
fuM/a 2015 Breakdown
n Superannuation
n Philanthropy
n Trusts & Estates
n Wealth Advice
SUCCESSFUl inTEGRATiOn = nATiOnAl pRESEnCE
Profit contribution
$16.2m$2.4b
$1.9b$1.6b
$1.9b
2015$7.8b
The Equity Trustees’ TWS business provides a range of private client and related services and has experienced the biggest growth and transformation this financial year. ANZ Trustees (ETWSL) was fully absorbed into TWS and added $23.3m to the operating revenue of $36m achieved organically by TWS, creating a combined 90% boost to the operating revenue for the division of $59.3m.
A breakdown of the contributions of each of the service offerings showed that the biggest increases in FUM/A post-integration were in the Trusts & Estates and Wealth Advice units, where client retention from the acquired base was impressive. Client retention was well supported by our asset Management team, which produced strong performance. Our external referral relationships resulted in 110% increase in new estate planning clients, and these referral networks are continuing to expand.
Our philanthropy business now manages more than 450 philanthropic funds and foundations, and achieved a significant increase, while our private client advice services yielded an increase of 20% in revenue on the previous year.
The integration of the ETWSL business was the major focus for this business in FY15, a project that was achieved more quickly than expected (by 30 June 2015) and for less than was budgeted. The new financial year turns the focus for this business to pursuing initiatives that will lead to revenue synergy growth from the existing client base, and our referral agreement with the ANZ Banking Group Limited. It will also include expanding our capability via business-generating personnel along the eastern seaboard, and our Perth office which opened in April 2015, positioning Equity Trustees as a national enterprise.
FOCUS FOR Fy16
Generate revenue synergy
create new businessinvest in capabilities
+ pERTH
For
per
sona
l use
onl
y

Equity Trustees Shareholder Review 2015 9
PerforMance
Service offerinGS
2015
2014
2013
2012
2011 3.0
2.9
3.3
4.3
7.8
OpERATinG REVEnUE ($M) FUM/A AT 30 JUnE 2015 ($B)
TWS ETWSL
2015
2014
2013
2012
2011
31.3
23.336.0
27.8
27.0
24.3
59.3
PhilanthropyHelping individuals, families, charitable trusts, companies, and charities to grow and share their wealth to support the community
through establishing or managing a philanthropic fund to complement existing financial objectives and estate planning. Equity Trustees acts as sole or joint trustee for more than 450 charitable trusts and foundations, distributing more than $70m annually to charities and charitable causes.
aged care advisory servicesHighly reputable, trusted, and experienced advisory services giving individuals transitioning to aged care – and their families – peace of
mind through placement and property service advice, and aged care financial advice focussed on structuring finances to make care more affordable and protect a family’s future. Equity Trustees services in this area include planning that takes into consideration increasing support challenges that come with ageing.
estates and trustsAssisting individuals and families manage the transfer of wealth between generations through developing estate plans including
wills, appointment of executors and guardians, establishment of testamentary trusts, powers of attorney, and reviews of superannuation benefit nominations. Equity Trustees has been entrusted with executor appointments of deceased estates for generations, and acted as trustee, providing confidence and peace of mind through our efficient, impartial and expert service.
employer and personal superannuationProviding employer services, personal superannuation, and managed accounts in superannuation, including
corporate trustee services and governance framework to public offer super funds. Equity Trustees offers a range of corporate and personal superannuation products through our own EquitySuper fund, a number of co-branded funds, and the Freedom of Choice and simpleWRAP platforms.
For
per
sona
l use
onl
y

10 Equity Trustees Shareholder Review 2015
Corporate Trustee Services
2015
2014
2013
2012
2011 19.2
21.1
29.0
35.6
45.42015
2014
2013
2012
2011
21.3
24.4
18.6
15.6
14.6
14.8%$24.4m
with
FUnDS MAnAGERS
PerforMance
OpERATinG REVEnUE ($M) FUM/A AT 30 JUnE 2015 ($B)
hiGhliGhtS
We act as RE/fiduciary to
199 82
fuM/a 2015 Breakdown
n Global Equities
n Global Fixed Interest
n Australian Equities
n Australian Fixed Interest
n Other
$21.7b
$9.9b
$2.7b
$3.5b2015
$45.4b
7.6%
Equity Trustees’ CTS business achieved excellent growth with operating revenue up 14.8% to $24.4m and a 28% increase in FUM/A, to a total of $45.4b. It remains in a strong position to capitalise on the flow of opportunities arising from considerable achievements of the two key teams in the business. The division pursued a number of new service lines as a fiduciary – in addition to our historical focus on ‘pure’ Responsible Entity (RE) activity.
FUM/A up 28% to
$45.4bProfit contribution
$12m FOCUS FOR Fy16
expanded product range
Build market share
Solid operating revenue growth, up
to
For
per
sona
l use
onl
y
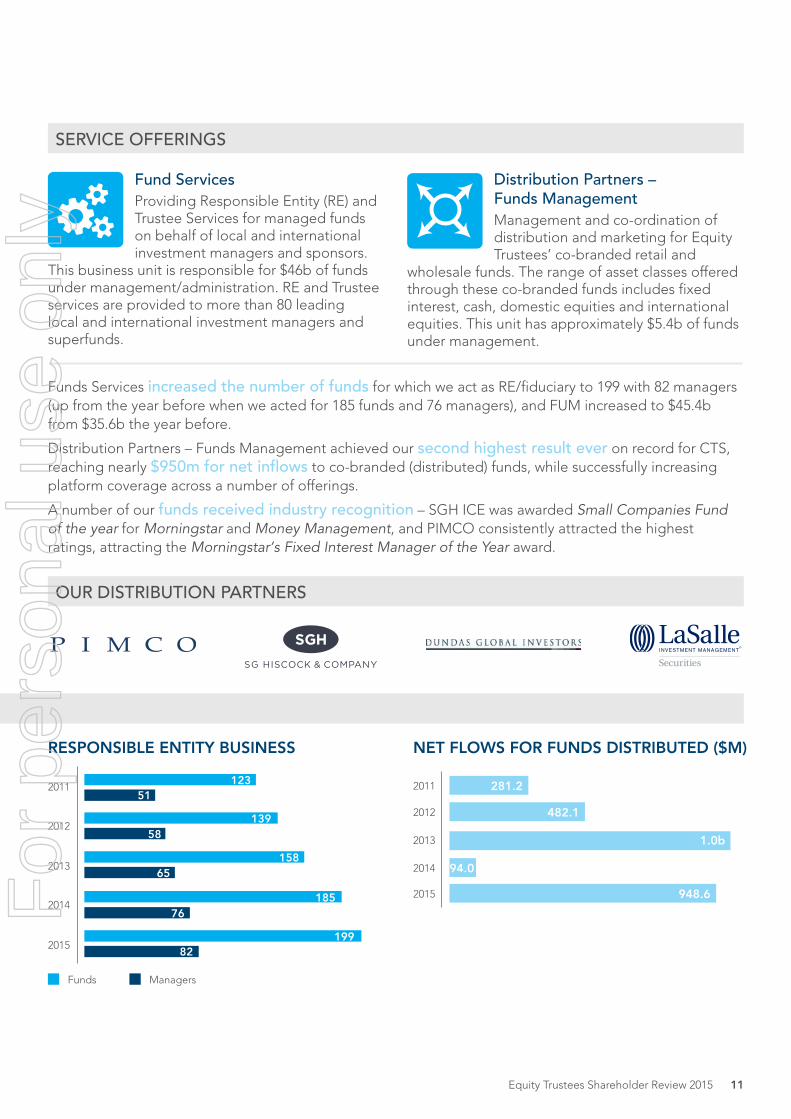
Equity Trustees Shareholder Review 2015 11
nET FlOwS FOR FUnDS DiSTRiBUTED ($M)RESpOnSiBlE EnTiTy BUSinESS
2015
2014
2013
2012
2011
948.6
1.0b
482.1
281.2
94.0
Funds Managers
2015
2014
2013
2012
2011123
51
58
65
76
82
139
158
185
199
PerforMance
Funds Services increased the number of funds for which we act as RE/fiduciary to 199 with 82 managers (up from the year before when we acted for 185 funds and 76 managers), and FUM increased to $45.4b from $35.6b the year before.
Distribution Partners – Funds Management achieved our second highest result ever on record for CTS, reaching nearly $950m for net inflows to co-branded (distributed) funds, while successfully increasing platform coverage across a number of offerings.
A number of our funds received industry recognition – SGH ICE was awarded Small Companies Fund of the year for Morningstar and Money Management, and PIMCO consistently attracted the highest ratings, attracting the Morningstar’s Fixed Interest Manager of the Year award.
Service offerinGS
our diStriBution PartnerS
fund ServicesProviding Responsible Entity (RE) and Trustee Services for managed funds on behalf of local and international investment managers and sponsors.
This business unit is responsible for $46b of funds under management/administration. RE and Trustee services are provided to more than 80 leading local and international investment managers and superfunds.
distribution Partners – funds ManagementManagement and co-ordination of distribution and marketing for Equity Trustees’ co-branded retail and
wholesale funds. The range of asset classes offered through these co-branded funds includes fixed interest, cash, domestic equities and international equities. This unit has approximately $5.4b of funds under management.
For
per
sona
l use
onl
y

12 Equity Trustees Shareholder Review 2015
Board of Directors’ profilesBa, faicd, faiM
Chairman – Appointed 30 August 2007
Non-Executive Director – Appointed September 2002
Chairman of the Board Risk Committee since May 2015
Tony is Chairman of listed company Templeton Global Growth Fund Ltd and Chairman of CCI Asset Management Ltd. He is also a non-executive director of Victoria Golf Club Limited and Catholic Church Insurance Ltd.
Tony is a former Group Managing Director and Chief Executive Officer of AXA Asia Pacific Holdings Ltd, having had a 36 year career with the National Mutual/AXA group. He was also Chairman of Australia’s largest not-for-profit health services provider, Sisters of Charity Health Service Ltd. Tony was also a non-executive director of listed company IRESS Market Technology Ltd and Chairman of Sisters of Charity Community Care Ltd.
In 2011, Mr Killen was awarded the Medal of the Order of Australia.
dipacc, faicd
Executive Director – Appointed March 2010
Member of the Board Investment Committee from July 2013.
Robin was appointed Managing Director of Equity Trustees on 1 March 2010. Before joining Equity Trustees he was, from 2002, Chief Executive Officer of Equipsuper Pty Ltd, the trustee company for the Equipsuper multi-employer superannuation fund. Robin is a non-executive director of the Financial Services Council.
Robin previously worked for AXA Asia Pacific, where he held the positions of General Manager, Corporate Affairs and Chief Executive, Risk Insurance and for the stockbroking firm Prudential-Bache Securities (Australia), where he was Managing Director, having joined the firm as Chief Financial Officer.
Robin has 29 years of experience in the financial services industry. He gained his initial professional qualification as a chartered accountant in the UK in 1981.
Bcom, Mcom, ca, faicd
Deputy Chairman – Appointed December 2007
Non-Executive Director since November 2000.
Member of the Audit & Compliance Committee since January 2002. Chairman from January 2003 to January 2015. Member of the Remuneration, Human Resources & Nominations Committee and Board Investment Committee since January 2015. Member of the Board Risk Committee since May 2015.
David is a director of Pipers Brook Vineyard Pty Ltd and Tasman Sea Salt Pty Ltd. Since March 2015, he has been a member of the Australian Rugby Foundation Advisory Board.
David is a former director of Tassal Group Limited, GrainCorp Limited, Mason Stewart Publishing, Camelot Resources NL and a former executive with Macquarie Bank Limited and its antecedent, Hill Samuel Australia.
Bcom, fcPa, faicd, aSfa aif, cfa
Non-Executive Director – Appointed September 2007
Member of the Remuneration, Human Resources & Nominations Committee since July 2011. Appointed Chairman in August 2011. Member of the Board Investment Committee from July 2013.
Member of the Board Risk Committee since May 2015. Member of Audit & Compliance Committee between September 2007 and February 2012.
Alice has over 25 years’ senior management and Board level experience in the corporate and Government sectors specialising in investment management, corporate advisory and equity fundraising.
Other non-executive directorships include; Djerriwarrh Investments Ltd, Defence Health, Guild Group Holdings Limited, Port of Melbourne Corporation, Cooper Energy, Barristers’ Chambers Ltd and the Foreign Investment Review Board. Alice is also a member of the Djerriwarrh Investment Committee.
Alice was formerly a director of Australian Accounting Standards Board, State Trustees, NM Rothschild and Sons (Australia) Limited, Director of Strategy and Planning for Ansett Australia Holdings Limited, Victorian Funds Management Corporation and a Vice President at JP Morgan Australia.
JA (TOny) killEn OAM
CHAiRMAn
ROBin BO BURnS
MAnAGinG DiRECTOR
DAViD F GROVES
DEpUTy CHAiRMAn
AliCE JM williAMS
DiRECTOR
For
per
sona
l use
onl
y

Equity Trustees Shareholder Review 2015 13
hondBus (Ballarat), hon ll d (deakin)
Non-Executive Director – Appointed September 2008
Member of the Remuneration, Human Resources & Nominations Committee since September 2008. Member of the Board Risk Committee since May 2015.
Jeff was an Officer in the Royal Australian Regiment, serving at home and overseas. He was a Member of the Victorian Parliament for 23 years, and was Premier of the State of Victoria from 1992 to 1999.
Jeff is Chairman of beyondblue: the national depression initiative and Chairman of The Torch, a program assisting incarcerated Indigenous men and women.
Jeff is Chairman of Primary Opinion Limited and a Director of Seven West Media Ltd.
He is also Chairman of Open Windows Australia Proprietary Limited, Chairman of CT Management Group Pty Ltd, Chairman of Amtek Corporation Pty Ltd and Chairman of LEDified Lighting Corporation Pty Ltd.
Jeff is Patron of The Royal District Nursing Service and Sovereign Hill Ballarat and associated with many other community organisations.
In 2005, he was awarded the Companion of the Order of Australia.
Ba (Bkg & fin), MBa, faicd, Sf fin
Non-Executive Director – Appointed September 2010
Member of the Audit & Compliance Committee since December 2010.
Member of the Remuneration, Human Resources & Nominations Committee since January 2015.
Member of the Board Risk Committee since May 2015.
Anne has some 35 years’ experience in the finance sector. She is an experienced executive and non-executive director in the listed, not-for-profit and mutual sectors.
Anne is a director of the Australian Institute of Company Directors, Community CPS Australia Ltd (trading as Beyond Bank Australia), Eastwoods Pty Ltd and The Winston Churchill Memorial Trust.
Anne is also an external member of the UBS Global Asset Management (Australia) Ltd Compliance Committee, Chair of the IP Australia Audit Committee, a member of the Investment, Audit & Risk Committee of the Winston Churchill Memorial Trust and a member of the Nominations Committee of Goodwin Aged Care Services Ltd.
Anne is the former Managing Director of Australian Ethical Investment Ltd. Anne was formerly a director of the Financial Services Council, The Centre for Australian Ethical Research Pty Ltd, the ANZ Staff Superannuation Fund and The Grain Growers Association Ltd.
ca, f fin, faicd
Non-Executive Director – Appointed November 2011Member of the Audit & Compliance Committee from November 2011 and appointed Chair in January 2015. Member of Board Risk Committee since May 2015.Kevin is a Chartered Accountant, a Fellow of the Financial Services Institute of Australia and a Fellow of the Australian Institute of Company Directors. He has over 30 years’ experience in management, financing and investment and has worked for a major international accounting firm, two investment banks and was CEO of HGL Limited where he remains as a non-executive director. Other current non-executive directorships include: Milton Corporation Limited, Hunter Hall International Limited and PO Valley Energy Limited. Kevin is also a member of the Milton Investment Committee.In the previous three years, Kevin sat on Kresta Holdings Limited Board and prior to that had numerous other listed company Board positions.
Bcom, fiaa, cfa, Gaicd
Non-Executive Director – Appointed August 2014Member of Audit & Compliance Committee from January 2015.Chairperson of the Board Investment Committee from January 2015.Member of the Board Risk Committee from May 2015.Mick is a Fellow of the Institute of Actuaries of Australia and holds the Chartered Financial Analyst designation.He is a non-executive director of Templeton Global Growth Fund Limited and Franklin Global Property Limited and a member of the Actuaries Institute Wealth Management Committee. Mick has broad wealth management experience in superannuation, investment management, insurance and advice, spanning over 30 years in both retail and institutional markets. Mick was formerly CEO and director of Invesco Australia Limited, director of Alliance Capital Management Australia and Chief Investment Officer of AXA Australia and New Zealand where he was also a director of all AXA’s Responsible Entities and Regulated Superannuation Entities.
THE HOn JEFFREy G
kEnnETT AC
DiRECTOR
AnnE M O’DOnnEll
DiRECTOR
kEVin J ElEy
DiRECTOR
MiCHAEl J O’BRiEn
DiRECTOR
For
per
sona
l use
onl
y

14 Equity Trustees Shareholder Review 2015
Group leadership Team
RyAn BESSEMERchief operations officer, operations & technologyPrince2, harvard leadership Program
Joined January 2011
ROBin BURnSManaging directordipacc, faicd
Joined March 2010
SOnyA ClAnCyexecutive General Manager, human resources, Marketing & communicationsBa, faicd, faiM, fahri
Joined September 2014
HARVEy kAlMAnexecutive General Manager, corporate trustee ServicesBec, Grad dip app fin & inv, Grad dip acc, advanced Management Program (columbia)
Joined January 2000
DR pAUl kASiAnhead of asset ManagementBSc (hons), Phd, MBa
Joined June 2013
pHilip MADDOXcompany Secretary & corporate counselBa, llB, Grad dip app fin & inv
Joined November 2001
GEOFFORy RiMMERexecutive General Manager, trustee & wealth ServicesBusiness Management – aiM, dipfinServ
Joined July 2012
TERRy RyAnchief financial officerBBus, fca, ffin
Joined January 2003
GEOFF wAlSHchief risk officer, enterprise riskBBus, MBa, Gaicd
Joined April 2015
For
per
sona
l use
onl
y
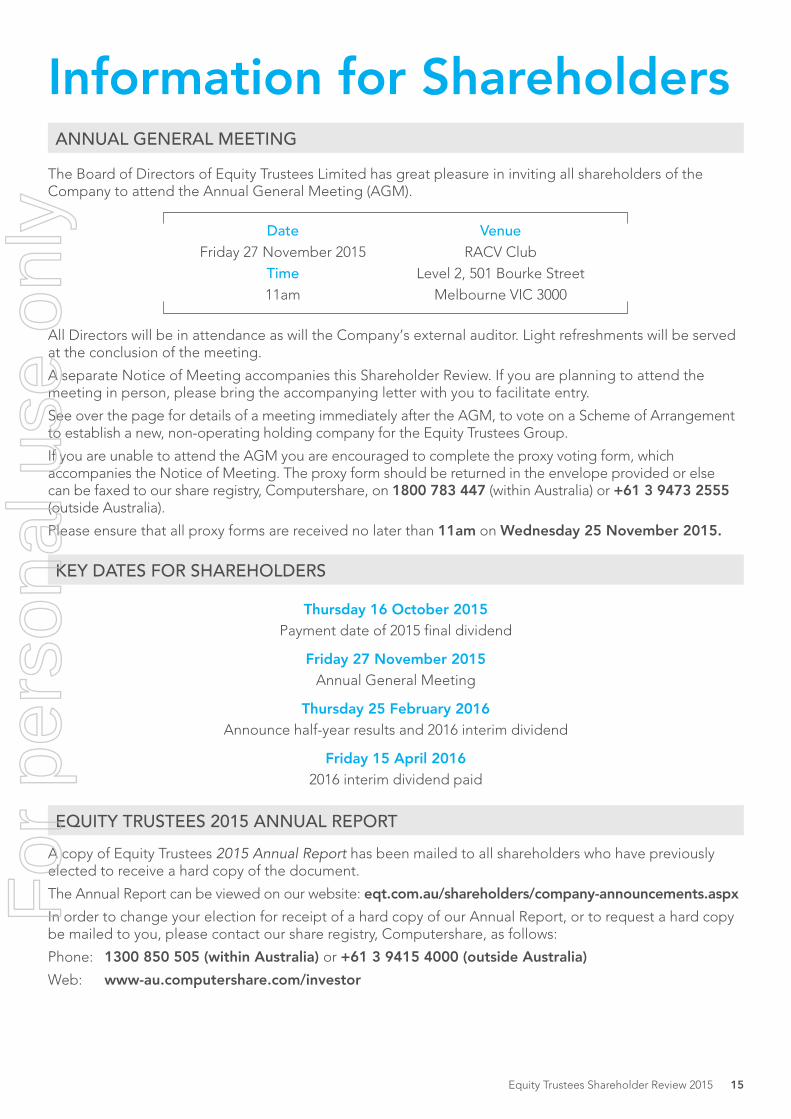
Equity Trustees Shareholder Review 2015 15
information for Shareholders
Thursday 16 October 2015Payment date of 2015 final dividend
Friday 27 november 2015Annual General Meeting
Thursday 25 February 2016Announce half-year results and 2016 interim dividend
Friday 15 April 20162016 interim dividend paid
All Directors will be in attendance as will the Company’s external auditor. Light refreshments will be served at the conclusion of the meeting.
A separate Notice of Meeting accompanies this Shareholder Review. If you are planning to attend the meeting in person, please bring the accompanying letter with you to facilitate entry.
See over the page for details of a meeting immediately after the AGM, to vote on a Scheme of Arrangement to establish a new, non-operating holding company for the Equity Trustees Group.
If you are unable to attend the AGM you are encouraged to complete the proxy voting form, which accompanies the Notice of Meeting. The proxy form should be returned in the envelope provided or else can be faxed to our share registry, Computershare, on 1800 783 447 (within Australia) or +61 3 9473 2555 (outside Australia).
Please ensure that all proxy forms are received no later than 11am on wednesday 25 november 2015.
dateFriday 27 November 2015
time11am
venueRACV Club
Level 2, 501 Bourke StreetMelbourne VIC 3000
annual General MeetinG
Key dateS for ShareholderS
eQuity truSteeS 2015 annual rePort
The Board of Directors of Equity Trustees Limited has great pleasure in inviting all shareholders of the Company to attend the Annual General Meeting (AGM).
A copy of Equity Trustees 2015 Annual Report has been mailed to all shareholders who have previously elected to receive a hard copy of the document.
The Annual Report can be viewed on our website: eqt.com.au/shareholders/company-announcements.aspx
In order to change your election for receipt of a hard copy of our Annual Report, or to request a hard copy be mailed to you, please contact our share registry, Computershare, as follows:
Phone: 1300 850 505 (within Australia) or +61 3 9415 4000 (outside Australia)
Web: www-au.computershare.com/investor
For
per
sona
l use
onl
y
16 Equity Trustees Shareholder Review 2015
ScheMe of arranGeMent to eStaBliSh non-oPeratinG holdinG coMPany
2015 corPorate Governance StateMent
The Scheme of Arrangement is the first step in a proposed corporate restructure, and involves the establishment of a new, non-operating holding company for the Equity Trustees Group. The Scheme Meeting will be held after the AGM (at midday or as soon after that time as the AGM has concluded).
Equity Trustees operates within a highly regulated industry and recognises that good governance principles and practices are imperative to our success.
Equity Trustees Directors are ultimately responsible for the corporate governance practices of the Equity Trustees Group. Our Board sets the tone of good governance.
In line with the ASX Corporate Governance Council’s Corporate Governance Principles and Recommendations, Equity Trustees produces an annual Corporate Governance Statement addressing each of the eight central principles:
1. Lay solid foundations for management and oversight
2. Structure the board to add value
3. Act ethically and responsibly
4. Safeguard integrity in corporate reporting
5. Make timely and balanced disclosure
6. Respect the rights of security holders
7. Recognise and manage risk
8. Remunerate fairly and responsibly.
The Equity Trustees 2015 Corporate Governance Statement sets out the corporate governance practices that were in operation throughout the financial year ending 30 June 2015, and is available at our website: eqt.com.au
A detailed Scheme Booklet which outlines the proposed restructure will be mailed to all shareholders.
dateFriday 27 November 2015
timeMidday (approx)
venueRACV Club
Level 2, 501 Bourke StreetMelbourne VIC 3000
For
per
sona
l use
onl
y

watch the video online
See our Managing Director round up the highlights of the 2015 financial year in an online video. Go to our home page and click the link to the Shareholder Engagement Video.
eqt.com.au
For
per
sona
l use
onl
y

Equity Trustees limited
ABN 46 004 031 298 Australian Financial Services Licence No 240975
Level 2, 575 Bourke Street, Melbourne, Victoria 3000
GPO Box 2307, Melbourne, Victoria 3001
Phone 1300 133 472 Fax 03 8623 5200
Email [email protected] Web eqt.com.au
For
per
sona
l use
onl
y