Embed Size (px)
Citation preview
Palaeontologia Electronica http://palaeo-electronica.org
Tychsen, Anders, and Harper, David A.T., 2004. Ordovician-silurian Distribution of Orthida (Palaeozoic Brachiopoda) in the Greater Iapetus Ocean Region. Palaeontologia Electronica 7(3):15p, 706KB; http://palaeo-electronica.org/paleo/2004_1/orthida/issue1_04.htm
ORDOVICIAN-SILURIAN DISTRIBUTION OF ORTHIDA(PALAEOZOIC BRACHIOPODA)
IN THE GREATER IAPETUS OCEAN REGION
Anders Tychsen and David A.T. Harper
ABSTRACT
Analysis of Orthida (Brachiopoda) spatio-temporal data from a new database indi-cates that five major developments controlled the faunal provincialism of the Orthida inthe Greater Iapetus Ocean during the Ordovician-Silurian. These developmentsinclude: 1) A diversification during the Early Ordovician; 2) a diversity reduction duringthe Middle Ordovician, followed by; 3) renewed diversification during the early Cara-doc; 4) the Hirnantian glaciation; and 5) a gradual homogenization of the faunas duringthe Silurian, despite some increasing endemism. The orthides of the peri-GondwananEuropean massifs may have formed a faunal association, distinct from the faunas ofthe Iapetan central area, whereas the general pattern of faunal associations appears tobe related to palaeolatitude and the relative positions of the palaeoplates. Theobserved faunal patterns generally support recent plate tectonic reconstructions.
Anders Tychsen. Geological Museum, University of Copenhagen, Øster Voldgade 5-7, DK-1350 Copen-hagen K, Denmark. [email protected] A.T. Harper. Geological Museum, University of Copenhagen, Øster Voldgade 5-7, DK-1350 Copen-hagen K, Denmark. [email protected]
KEY WORDS: Cluster analysis, diversity, endemism, faunal analysis, Iapetus, Orthida, palaeobiogeogra-phy, palaeobiodiversity, database, Palaeozoic.Copyright: Palaeontological Association. June 2004Submission: 10 February 2004. Acceptance: 10 May 2004.
INTRODUCTION
Computerized databases of palaeontologicalinformation provide the only practical means forinvestigating large-scale palaeobiological patternsand processes over long time intervals (Benton1999; Markwick and Lupia 2002). Furthermore,large palaeobiogeographical databases comprise a
complementary method for the reconstructions ofpalaeoplate positions and movements, especiallyfor the early Palaeozoic where continental palaeo-magnetic evidence is less secure (Lees et al.2002). Such models also allow for the comparisonof biofacies and the relationship between faunalassociations and physical factors, such as waterdepth and substrate type (Cocks and McKerrow
TYCHSEN, ANDERS, AND HARPER, DAVID A.T.: OCEANS OF ORTHIDS
2
1984; Bernasconi and Stanley 1994) across two ormore margins. The use of large databases to ana-lyze palaeodiversity, extinction and survival trendsis, however, problematic because it assumes anumber of conditions. For example it assumes thattaxonomic and spatial errors are random (Benton1999) and that sampling intensity is constant andindependent of rock-volume variations (Smith2001). If errors in taxonomic databases are ran-dom, this means that faunal signals cannot be cre-ated by the errors, however, they can be degradeddue to the random noise the errors generate in thedataset (Raup 1991).
Brachiopods are ideal for palaeobiogeograph-ical studies, because the animals were sessile,because most of them lived in relatively shallowwater, because their shells accumulated in largenumbers, and because they are commonly robust,with features that can survive transport, burial anddiagenesis. Furthermore, their taxonomy is rela-tively stable (Rudwick 1970; Williams and Harper2000).
Brachiopods were especially important ele-ments of the benthic fauna during the early-middlePalaeozoic. The orthide (Order Orthida: Schuchertand Cooper, 1932) brachiopods were, togetherwith the strophomenides, the first important rhyn-chonelliformean groups to diversify in great num-bers. During the Ordovician, the diversity and fossilabundance of the orthide and strophomenide bra-chiopods dominated benthic assemblages. Theorthides were particularly abundant during the Mid-dle-Late Ordovician, however, the order rangedthrough the entire Palaeozoic (Williams and Harper2000; Harper and Gallagher 2001). More than twohundred localities distributed globally have yieldedorthide brachiopods, especially sites in NorthAmerica, Europe, North Africa and China.
High orthide diversities were maintainedthrough most of the Ordovician, following an initialrapid diversification during the Early Ordovician.After a dramatic, approximately 50%, reduction inglobal orthide diversity during the Late Ordovicianextinction event, a steady decline in orthide diver-sity continued throughout the Silurian. The orderbriefly peaked during the Early Devonian, but grad-ually died out during the rest of the Palaeozoic.The last orthide is reported from around the Per-mian-Triassic boundary.
A general overview of the orthides from all themajor terranes of the Ordovician-Silurian Palaeo-zoic Greater Iapetus Ocean Region (GIOR)(including both the Rheic and Tornquist oceansand adjacent plates) (Mac Niocaill et al. 1997) intime and space is presented here based on data
from a new global database. Data are recorded atthe generic level of taxonomic resolution.
The orthide data have been evaluated using arange of statistical and graphical techniques. Themultivariate methods (Jongman et al. 1995; Etter1999) include Principal Coordinates Analysis (PCOor PCoA, MDS) (Davis 1986), Non-Metric MultiDimensional Scaling (NMDS) and UPGMA (pairedlinkage) cluster analysis (Krebs 1989), based onthe Dice similarity coefficients. Diversity curves aswell as the endemic properties of the orthide gen-era are also considered. The results have beenvalidated using similarity indices, which are calcu-lated differently than the Dice index, in order toassess the strengths of the faunal signals apparentfrom the analyses. The two validation indices werethe Simpson and the Raup-Crick indices (Raupand Crick 1979). These results are compared withplate tectonic models for the region (e.g., McKer-row et al. 1991; Cocks and Torsvik 2002; Torsvikand Rehnström 2003). Analyses were performedusing the statistical package Palaeontological Sta-tistics (PAST©, Ø. Hammer and D.A.T. Harper;Hammer et al. 2001) and Microsoft EXCEL(©Microsoft). Taken together, the results provide abroad overview of the history of the Iapetanorthides and their associated plates and terranes.
DATA
The data for this study are derived from TheOrthida Database, which contains information onthe more than 300 Orthida genera, recently revisedby Williams and Harper (2000). The database alsocontains information on other brachiopod orders,however, these are not used here. The data arecollected from published sources only and are ofvarying quality in their spatial and temporal resolu-tion.
The records of The Orthida Database that areprecise to a specific area such as a site, formation,country or a single plate which is well defined, andwhich have a temporal precision of epoch level orstage level, comprise a truncated dataset amount-ing to about 40% of the total dataset. The truncateddata are used here. Of these records, Europeanand North American data comprise about 67%,which indicates that there is a skewed distributionin the geographical distribution of orthide data,which should, however, not be relevant to thisstudy which primarily deals with areas of consistenthigh sampling intensity. The dataset does not uti-lize the range-through assumption, including onlygenera actually reported from the particular stageor epoch. The data quality and related problemsare discussed in further detail below.
TYCHSEN, ANDERS, AND HARPER, DAVID A.T.: OCEANS OF ORTHIDS
3
With respect to the temporal resolution of thedata, clearly older publications contain less precisetemporal data. This is primarily due to updates inthe chronostratigraphic framework since their pub-lication. This is also true for the age of rock forma-tions: For the Cambrian, only approximately 35%of the total dataset is at Epoch or better temporalresolution, while for the Devonian this proportion isover 50%.
The data used in this study are drawn fromthe Ordovician-Silurian sections of the truncateddataset from the GIOR plates. Using this focuseddataset allows a better temporal resolution thanwould have been possible with the total dataset.Although the total dataset results in higher totaldiversities, tests during construction of The OrthidaDatabase showed only minor changes in the over-all biogeographical patterns between the twodatasets (see also Sepkoski 1993).
METHODS
The use of ordination (Legendre and Leg-endre 1998) and cluster (classification) analysis(Krebs 1989) based on similarity index analysis toquantify faunal data originally stems from ecology(e.g., Lichstein et al. 2002). The methods havebeen applied to palaeontological data for sometime (Etter 1999). Ordination methods attempt toorder the sampled faunal data in a continuumaccording to a given set of guidelines. In the ordi-nation techniques applied here, the ordering is cal-culated based on values of the similarity betweenfaunas, which are in turn calculated using simplealgorithms (Jongman et al. 1995). In contrast tocluster analysis, ordination seeks to accentuate theintergradational aspects of the sample data (Etter1999). The dimensions of the multivariate taxaspace are therefore reduced meaningfully, graphi-cally displaying relationships between the sampledunits. Ordination provides a method of modellingthe pattern of the index value, and the results canbe compared to e.g., palaeomagnetic data to aidplate reconstructions.
Clustering or classification is a straightforwardmethod of visualizing association data, however,the confidence of the nodes are highly dependenton data quality, and levels of similarity for clusternodes is dependent on the similarity index used.The mean linkage (UPGMA) method is chosenhere, because clusters are joined based on theaverage distance between all members in the twogroups. Krebs (1989) noted that mean linkage issuperior to single and complete linkage methodsfor ecological purposes because the other two areextremes, either producing long or tight, compact
clusters respectively. There are, however, noguidelines as to which mean-linkage method is thebest (Swan and Sandilands 2001).
Mean-linkage and ordination (PCO andNMDS) analysis was performed on brachiopoddata from all Ordovician and Silurian epochs andstages. Irrespective of the specific choice of ordi-nation and cluster methods and the different waythese calculate faunal associations or taxon-spaceorganization of samples, using several methodsallows for consistent cross-validation of results(Harper et al. 1996). As a further check on results,analyses were performed at both epoch and stagelevels of temporal resolution. Here some examplesof the cluster analysis results in the form of dendro-grams are presented at epoch level of resolution.Likewise presented are examples of the ordinationdiagrams at stage level of resolution.
PLATE TECTONIC SETTING
A total of 11 plates from the entire GIOR wereincluded in the study. These were the GondwananSouth America and Africa (there are no Ordovicianorthide data from Antarctica), the peri-GondwananEuropean massifs: Bohemia (Perunica), Apulia,Iberia and Armorica and the core Iapetus Oceanterranes of Laurentia, Siberia, Baltica and Avalo-nia. Additionally the Precordillera was included(see below). We generally have used the newestdata available (e.g., Cocks and Torsvik 2002;Stampfli and Borel 2002) to outline the borders ofthese terranes with respect to the placement oforthide data on the various plates.
Most of these did not entail problems, how-ever, it is important to note that this study is basedon data from a global database, applied to aregional scale area. This means that some prob-lems such as the tectonic history of the “exotic”blocks of the Holy Cross Mountains (HCM) ofPoland have not been resolved in this study (Belkaet al. 2002; Cocks 2002). In such cases, the choiceof which plate to assign the orthide data to wasbased on a mixture of literature searches, the simi-larity of the orthide data from the area in questionto the faunas of the possible host plates and lastlythe reconstruction software used (PALEOMAP).Fortunately the problematic data usually accountsfor only a minor part of the total diversity, whichmeans that the analyses of the data were onlyslightly affected by their precise placement. In thecase of the HCM, orthide data include Balticendemics, however, also included are generaindicative of a Celtic influence. The data have herebeen placed within Baltica.
TYCHSEN, ANDERS, AND HARPER, DAVID A.T.: OCEANS OF ORTHIDS
4
In some cases, the spatial resolution of thedata was not good enough to place them on a defi-nite plate, however, as noted above these were notincluded. Most of the problematic data are relatedto the greater spatial and temporal uncertainties ofCambrian and Early Ordovician data compared tolater Ordovician and Silurian data.
Ireland posed another problem due to theexotic or suspect nature of some of the terranes ofthe island. The Central Terrane with the twosmaller eastern Grangegeeth and Bellewstown ter-ranes encompass most of the uncertainty. Thenorthern terranes of Ireland and the southern Lein-ster Terrane (Fortey et al. 2000) are, however,firmly established as belonging to Laurentia andAvalonia, respectively, during the Ordovician-Sil-urian. Data from the northern Irish terranes and thesouthern Leinster Terrane were included in theanalysis. Data from the Central Terrane, Grange-geeth and Bellewstown terranes were excluded onthe grounds that the history of especially the twominor terranes remains uncertain (Fortey et al.2000).
As a final example of currently debated issuesin present palaeoreconstructions, the Precordille-ran microcontinent (Fortey and Cocks 2003) ofArgentina is somewhat of a rogue phenomenon.The microcontinent includes the fossil faunas ofthe San Juan Formation and Las Aguaditas For-mation, from which much of the faunal datainvolved in reconstructing the wandering path ofthe terrane was taken. The Precordilleran terranemay originally have been derived from southeast-ern Laurentia (Thomas 1991; Astini et al. 1995),more specifically the Ouachita embayment of thesoutheastern USA (Gerbi 1999; Davis et al. 1997)and is recorded immediately south of the centralIapetus suture during the Late Cambrian-EarlyOrdovician between Gondwana and Laurentia(Cocks and Torsvik 2002). During the Ordovician-Silurian the microcontinent moved southward anddocked to the eastern bend of the South Americanplate (Fortey and Cocks 2003). This history istested with the limited orthide data available.
RESULTS
As noted previously, the data used here varyfrom temporal resolutions at stage to epoch level.This variance causes some temporal smearing,i.e., artificially high diversities for some stages. Theeffect is presumed random and the majority of therecords have a stage-level temporal precision.However, for the Early Ordovician temporal smear-ing is more serious. Especially for Baltica and Lau-rentia, diversity counts are problematic because
the records detailing these faunas often have atemporal resolution at the epoch level. Furthermorerecords detailing the faunal developments of theEarly Ordovician are often old, meaning that theoriginal correlations are uncertain. This has theeffect that some genera belonging to the Arenigare also reported for the Tremadoc and vice versa,artificially increasing the diversity. A more detailedstudy of these data is planned, however, this prob-lem is the primary reason why the Early Ordoviciandata are only briefly described here.
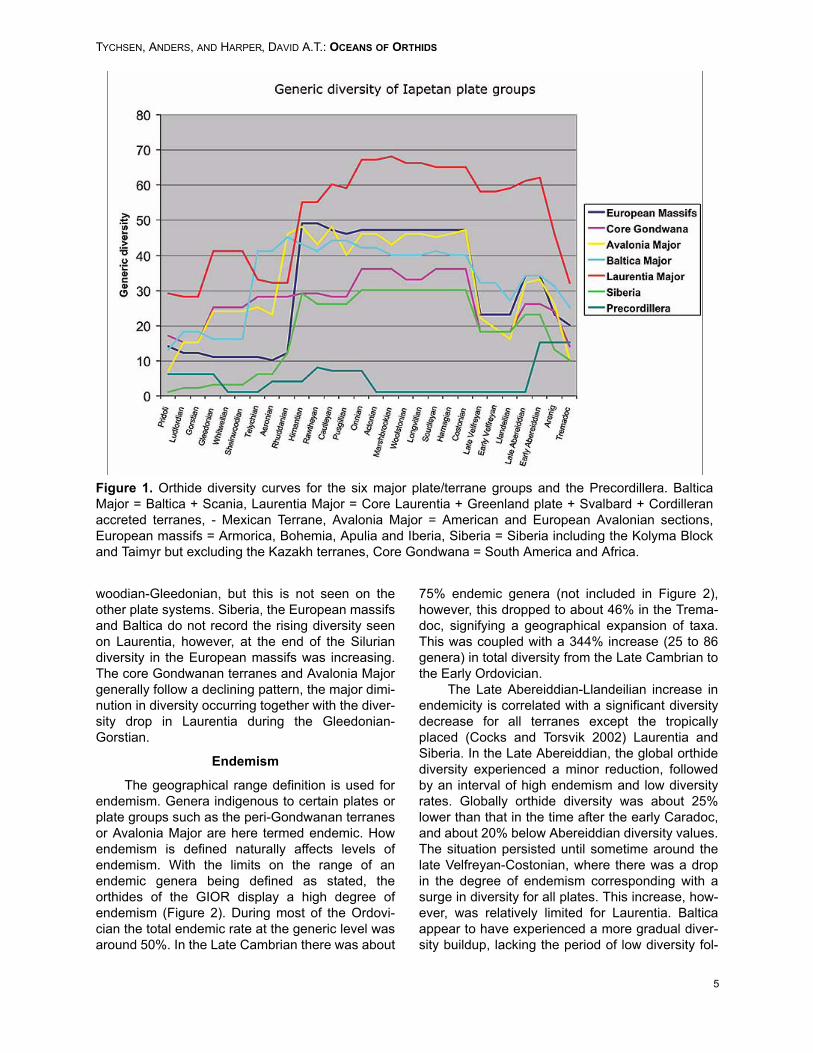
There are common trends in all the diversitycurves for the plates of the greater Iapetus region(Figure 1) despite the latitudinal difference in posi-tion from a lower latitude (Laurentia, Siberia), mid-latitude (Baltica, Avalonia depending on the time),higher latitude (European massifs) and polar(Gondwanan terranes, however, note that SouthAmerica reached fairly far north [Cocks and Torsvik2002]). The curves display a rapid diversityincrease from approximately the Tremadoc-Abere-iddian, followed by a diversity drop that lasted untilthe Costonian, where renewed diversification israpid, especially on Avalonia Major and the Euro-pean massifs (Figure 1).
The rest of the Caradoc and the Ashgill isgenerally marked by high diversities, with indica-tions of a decline in diversity beginning in Ashgillon Laurentia Major and the Core Gondwanan ter-ranes. This pattern is expressed to a lesser degreeon Siberia and Avalonia Major. The European mas-sifs and Baltica appear unaffected during this inter-val. At the Hirnantian-Rhuddanian transition, allplate groups except Baltica and Avalonia experi-enced dramatic reductions in diversity.
The European massifs suffered the worst,dropping from about 50 to only 10 genera. Avaloniaexperienced only a minor diversity decrease withinthis interval, however, displayed a similar reductionduring the Rhuddanian-Aeronian (Figure 1). Balticadeviates further from this pattern – similar to Avalo-nia there is a small diversity decrease in the Hir-nantian-Rhuddanian, but the dramatic reductiondoes not occur until the Telychian-Sheinwoodian.This is coeval with a facies change in the Scandi-navian area from marine to terrestrial facies (Wors-ley et al. 1983). The orthides of Baltica didexperience a reduction in diversity during theOrdovician-Silurian transition, however, already bythe Rhuddanian new diversifications were charac-terizing the emptied niches, so that the net resultwas a faunal turnover, not a permanent reductionin diversity.
The development after the extinction eventshows the most contrasts. Laurentia experiencedrenewed diversity increases from the Shein-
TYCHSEN, ANDERS, AND HARPER, DAVID A.T.: OCEANS OF ORTHIDS
5
woodian-Gleedonian, but this is not seen on theother plate systems. Siberia, the European massifsand Baltica do not record the rising diversity seenon Laurentia, however, at the end of the Siluriandiversity in the European massifs was increasing.The core Gondwanan terranes and Avalonia Majorgenerally follow a declining pattern, the major dimi-nution in diversity occurring together with the diver-sity drop in Laurentia during the Gleedonian-Gorstian.
Endemism
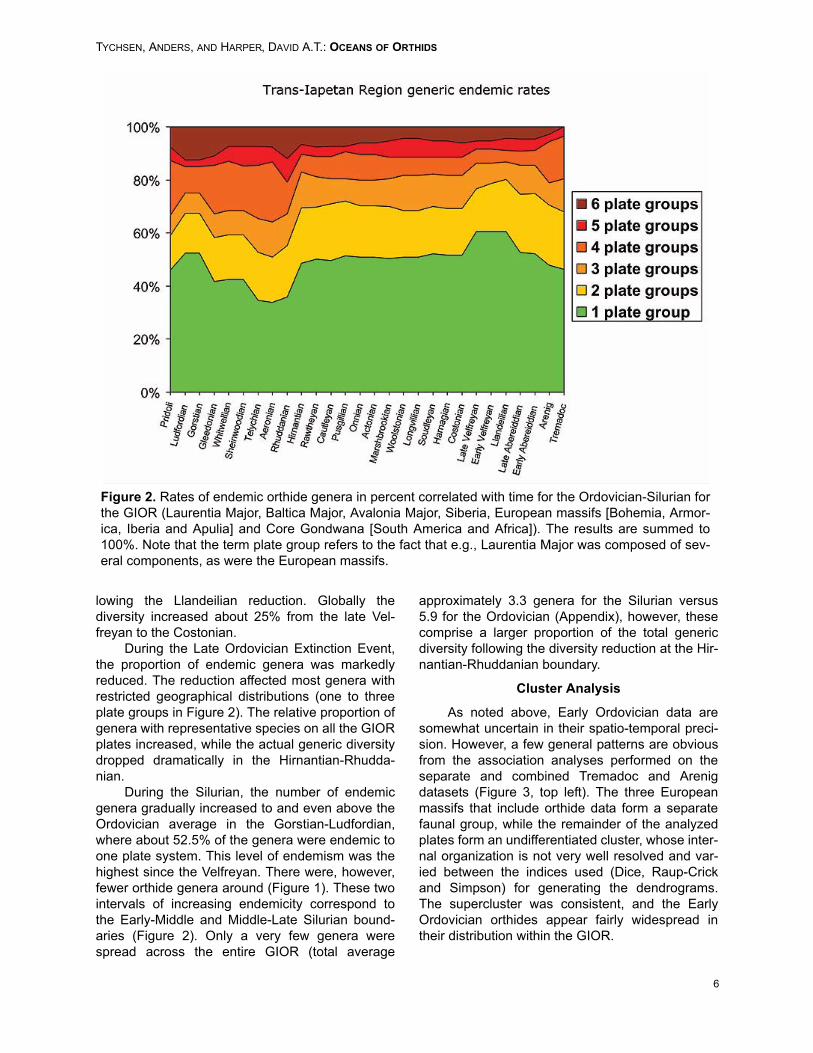
The geographical range definition is used forendemism. Genera indigenous to certain plates orplate groups such as the peri-Gondwanan terranesor Avalonia Major are here termed endemic. Howendemism is defined naturally affects levels ofendemism. With the limits on the range of anendemic genera being defined as stated, theorthides of the GIOR display a high degree ofendemism (Figure 2). During most of the Ordovi-cian the total endemic rate at the generic level wasaround 50%. In the Late Cambrian there was about
75% endemic genera (not included in Figure 2),however, this dropped to about 46% in the Trema-doc, signifying a geographical expansion of taxa.This was coupled with a 344% increase (25 to 86genera) in total diversity from the Late Cambrian tothe Early Ordovician.
The Late Abereiddian-Llandeilian increase inendemicity is correlated with a significant diversitydecrease for all terranes except the tropicallyplaced (Cocks and Torsvik 2002) Laurentia andSiberia. In the Late Abereiddian, the global orthidediversity experienced a minor reduction, followedby an interval of high endemism and low diversityrates. Globally orthide diversity was about 25%lower than that in the time after the early Caradoc,and about 20% below Abereiddian diversity values.The situation persisted until sometime around thelate Velfreyan-Costonian, where there was a dropin the degree of endemism corresponding with asurge in diversity for all plates. This increase, how-ever, was relatively limited for Laurentia. Balticaappear to have experienced a more gradual diver-sity buildup, lacking the period of low diversity fol-
Figure 1. Orthide diversity curves for the six major plate/terrane groups and the Precordillera. BalticaMajor = Baltica + Scania, Laurentia Major = Core Laurentia + Greenland plate + Svalbard + Cordilleranaccreted terranes, - Mexican Terrane, Avalonia Major = American and European Avalonian sections,European massifs = Armorica, Bohemia, Apulia and Iberia, Siberia = Siberia including the Kolyma Blockand Taimyr but excluding the Kazakh terranes, Core Gondwana = South America and Africa.
TYCHSEN, ANDERS, AND HARPER, DAVID A.T.: OCEANS OF ORTHIDS
6
lowing the Llandeilian reduction. Globally thediversity increased about 25% from the late Vel-freyan to the Costonian.
During the Late Ordovician Extinction Event,the proportion of endemic genera was markedlyreduced. The reduction affected most genera withrestricted geographical distributions (one to threeplate groups in Figure 2). The relative proportion ofgenera with representative species on all the GIORplates increased, while the actual generic diversitydropped dramatically in the Hirnantian-Rhudda-nian.
During the Silurian, the number of endemicgenera gradually increased to and even above theOrdovician average in the Gorstian-Ludfordian,where about 52.5% of the genera were endemic toone plate system. This level of endemism was thehighest since the Velfreyan. There were, however,fewer orthide genera around (Figure 1). These twointervals of increasing endemicity correspond tothe Early-Middle and Middle-Late Silurian bound-aries (Figure 2). Only a very few genera werespread across the entire GIOR (total average
approximately 3.3 genera for the Silurian versus5.9 for the Ordovician (Appendix), however, thesecomprise a larger proportion of the total genericdiversity following the diversity reduction at the Hir-nantian-Rhuddanian boundary.
Cluster Analysis
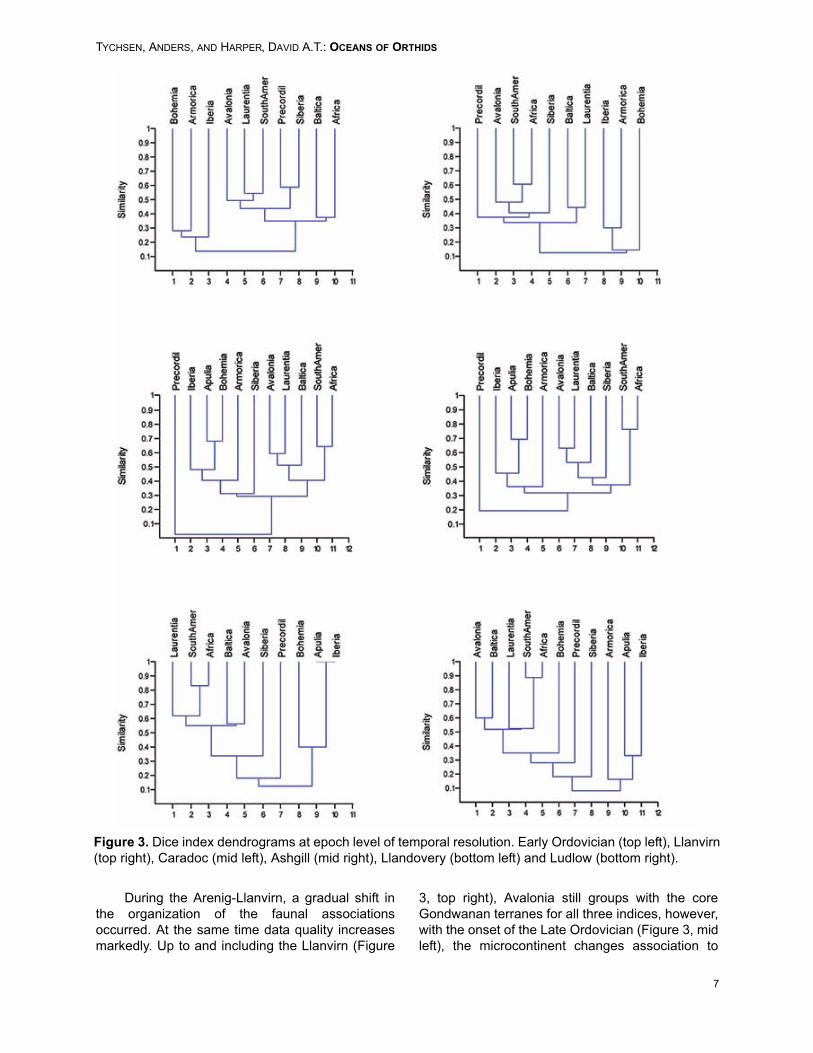
As noted above, Early Ordovician data aresomewhat uncertain in their spatio-temporal preci-sion. However, a few general patterns are obviousfrom the association analyses performed on theseparate and combined Tremadoc and Arenigdatasets (Figure 3, top left). The three Europeanmassifs that include orthide data form a separatefaunal group, while the remainder of the analyzedplates form an undifferentiated cluster, whose inter-nal organization is not very well resolved and var-ied between the indices used (Dice, Raup-Crickand Simpson) for generating the dendrograms.The supercluster was consistent, and the EarlyOrdovician orthides appear fairly widespread intheir distribution within the GIOR.
Figure 2. Rates of endemic orthide genera in percent correlated with time for the Ordovician-Silurian forthe GIOR (Laurentia Major, Baltica Major, Avalonia Major, Siberia, European massifs [Bohemia, Armor-ica, Iberia and Apulia] and Core Gondwana [South America and Africa]). The results are summed to100%. Note that the term plate group refers to the fact that e.g., Laurentia Major was composed of sev-eral components, as were the European massifs.
TYCHSEN, ANDERS, AND HARPER, DAVID A.T.: OCEANS OF ORTHIDS
7
During the Arenig-Llanvirn, a gradual shift inthe organization of the faunal associationsoccurred. At the same time data quality increasesmarkedly. Up to and including the Llanvirn (Figure
3, top right), Avalonia still groups with the coreGondwanan terranes for all three indices, however,with the onset of the Late Ordovician (Figure 3, midleft), the microcontinent changes association to
Figure 3. Dice index dendrograms at epoch level of temporal resolution. Early Ordovician (top left), Llanvirn(top right), Caradoc (mid left), Ashgill (mid right), Llandovery (bottom left) and Ludlow (bottom right).
TYCHSEN, ANDERS, AND HARPER, DAVID A.T.: OCEANS OF ORTHIDS
8
associate with Baltica and Laurentia. Baltica andLaurentia differentiate by the Llanvirn, suggestingthat Baltica had then drifted enough northwards toattain a faunal composition different from theGondwanan. The peri-Gondwanan terranes of Ibe-ria, Armorica and Bohemia retained their individualfaunal composition. Siberia appears oddly placedin the Llanvirnian dendrogram, however, analysisof the orthide data indicates that Siberia sharedfaunal elements with both Laurentia and the Gond-wanan terranes, which gives the placement in thedendrogram.
By the Caradoc (Figure 3, mid left), a clear dif-ferentiation into three faunal associations hademerged, largely defined by latitudinal placement.The peri-Gondwanan terranes retain their indepen-dent status, and the core Iapetan terranes of Bal-tica, Avalonia and Laurentia have separated fromSouth America and Africa. This pattern is essen-tially the same for the Ashgill (Figure 3, mid right).
Siberia is grouped somewhat differentlydepending on the index used, either with the Gond-wanan core or with the Laurentia-Baltica-Avaloniagroup. The position of the Precordillera in the clus-ter and ordination analysis is tentative because ofthe small amount of genera available for analysis.
By the Llandovery (Figure 3, bottom left), theassociations have been altered. The core Iapetanterranes now form part of a well-isolated clusterwith the core Gondwanan terranes. The Europeanmassifs association is retained, however, markeddiversity reductions have severely diminishedorthide stock on Apulia and Iberia. This pattern isretained later into the Silurian (Figure 3, bottomright). Siberia continues its intermittent placement.Siberia branches off the larger associations nearthe base of the dendrograms, and the affinities ofthe Precordillera are somewhat uncertain duringthis interval. However, it is clearly not Laurentia-related.
Ordination Analysis
While there are differences between theNMDS and PCO results, these are mostly in thedetail. The differences are fairly well correlated withthe signal strength in the faunal data, i.e., the differ-ences were largest in the diagrams for the tempo-ral intervals of the lowest diversity, e.g., theTremadoc. The individual PCO-eigenvectors (PCOcan be expressed as a distance-based method likeNMDS or as an eigenanalysis) generally did notaccount for much of the variance in the datasets,typically around 20-40% of the variance wasaccounted for by the 1st axis, while the 2nd
accounted for about half of the first axis. This sug-gests that there is no single gradient that fully
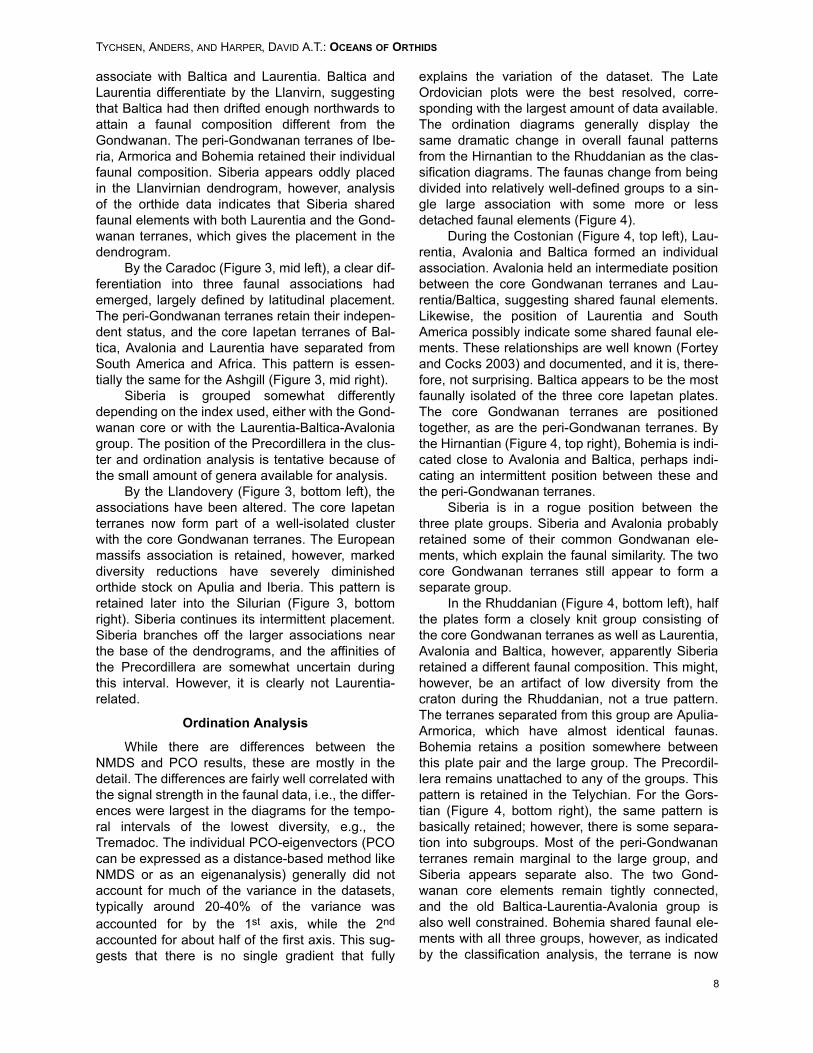
explains the variation of the dataset. The LateOrdovician plots were the best resolved, corre-sponding with the largest amount of data available.The ordination diagrams generally display thesame dramatic change in overall faunal patternsfrom the Hirnantian to the Rhuddanian as the clas-sification diagrams. The faunas change from beingdivided into relatively well-defined groups to a sin-gle large association with some more or lessdetached faunal elements (Figure 4).
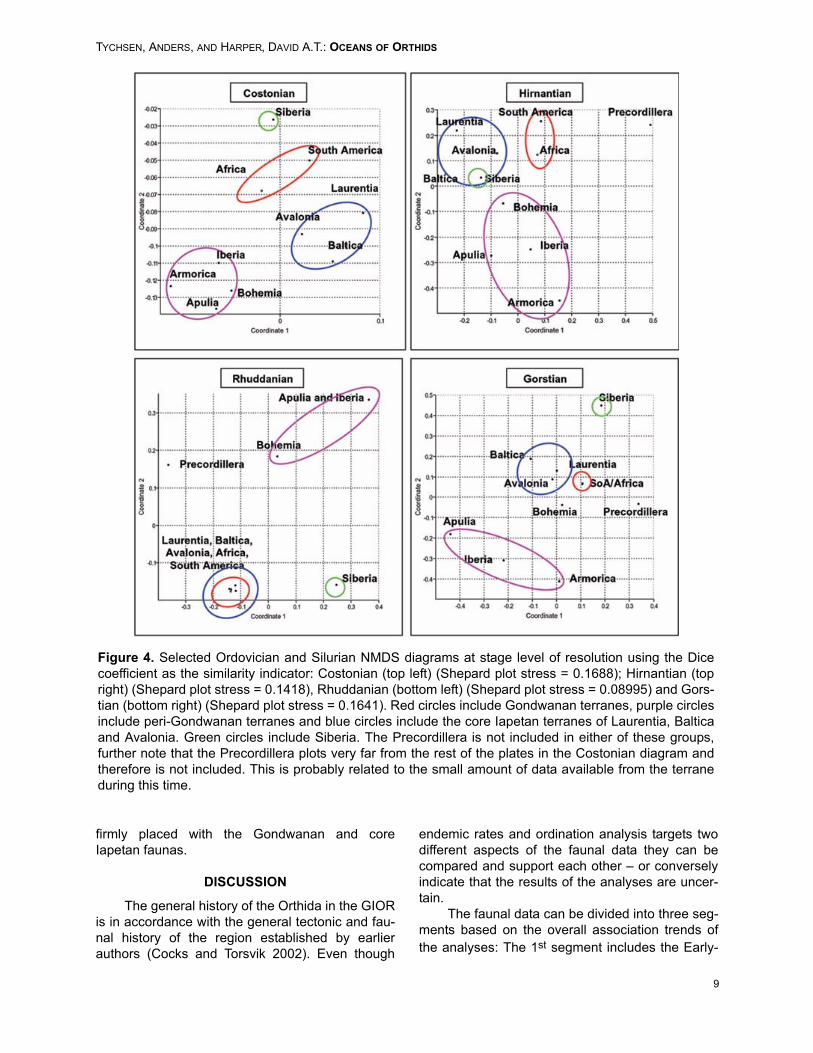
During the Costonian (Figure 4, top left), Lau-rentia, Avalonia and Baltica formed an individualassociation. Avalonia held an intermediate positionbetween the core Gondwanan terranes and Lau-rentia/Baltica, suggesting shared faunal elements.Likewise, the position of Laurentia and SouthAmerica possibly indicate some shared faunal ele-ments. These relationships are well known (Forteyand Cocks 2003) and documented, and it is, there-fore, not surprising. Baltica appears to be the mostfaunally isolated of the three core Iapetan plates.The core Gondwanan terranes are positionedtogether, as are the peri-Gondwanan terranes. Bythe Hirnantian (Figure 4, top right), Bohemia is indi-cated close to Avalonia and Baltica, perhaps indi-cating an intermittent position between these andthe peri-Gondwanan terranes.
Siberia is in a rogue position between thethree plate groups. Siberia and Avalonia probablyretained some of their common Gondwanan ele-ments, which explain the faunal similarity. The twocore Gondwanan terranes still appear to form aseparate group.
In the Rhuddanian (Figure 4, bottom left), halfthe plates form a closely knit group consisting ofthe core Gondwanan terranes as well as Laurentia,Avalonia and Baltica, however, apparently Siberiaretained a different faunal composition. This might,however, be an artifact of low diversity from thecraton during the Rhuddanian, not a true pattern.The terranes separated from this group are Apulia-Armorica, which have almost identical faunas.Bohemia retains a position somewhere betweenthis plate pair and the large group. The Precordil-lera remains unattached to any of the groups. Thispattern is retained in the Telychian. For the Gors-tian (Figure 4, bottom right), the same pattern isbasically retained; however, there is some separa-tion into subgroups. Most of the peri-Gondwananterranes remain marginal to the large group, andSiberia appears separate also. The two Gond-wanan core elements remain tightly connected,and the old Baltica-Laurentia-Avalonia group isalso well constrained. Bohemia shared faunal ele-ments with all three groups, however, as indicatedby the classification analysis, the terrane is now
TYCHSEN, ANDERS, AND HARPER, DAVID A.T.: OCEANS OF ORTHIDS
9
firmly placed with the Gondwanan and coreIapetan faunas.
DISCUSSION
The general history of the Orthida in the GIORis in accordance with the general tectonic and fau-nal history of the region established by earlierauthors (Cocks and Torsvik 2002). Even though
endemic rates and ordination analysis targets twodifferent aspects of the faunal data they can becompared and support each other – or converselyindicate that the results of the analyses are uncer-tain.
The faunal data can be divided into three seg-ments based on the overall association trends ofthe analyses: The 1st segment includes the Early-
Figure 4. Selected Ordovician and Silurian NMDS diagrams at stage level of resolution using the Dicecoefficient as the similarity indicator: Costonian (top left) (Shepard plot stress = 0.1688); Hirnantian (topright) (Shepard plot stress = 0.1418), Rhuddanian (bottom left) (Shepard plot stress = 0.08995) and Gors-tian (bottom right) (Shepard plot stress = 0.1641). Red circles include Gondwanan terranes, purple circlesinclude peri-Gondwanan terranes and blue circles include the core Iapetan terranes of Laurentia, Balticaand Avalonia. Green circles include Siberia. The Precordillera is not included in either of these groups,further note that the Precordillera plots very far from the rest of the plates in the Costonian diagram andtherefore is not included. This is probably related to the small amount of data available from the terraneduring this time.
TYCHSEN, ANDERS, AND HARPER, DAVID A.T.: OCEANS OF ORTHIDS
10
Middle Ordovician, where the old Gondwana mar-ginal terranes of Baltica and later Avaloniachanged faunal content to develop a more mixedcomposition between the equatorial terranes andthe polar to high latitude Gondwanan terranes. Atthe same time there was a dramatic diversificationand geographical expansion among the orthides(Harper and Gallagher 2001; Harper and MacNiocaill 2002), which was truncated by an Abereid-dian-Llandeilian diversity reduction and anincrease in endemism. This diversity reduction mayhave been the result of a contraction in availableliving space caused by a regression during theArenig (Barnes et al. 1996). From the Early Ordovi-cian, the European massifs formed their own faunalassociation, with Armorica and Iberia forming a tightlink, which is in accordance with the conclusions ofCocks and Torsvik (2002); these authors includedIberia with Armorica, except the South PortugueseZone where the oldest rocks are of Middle Devonianage (Cocks 2000). Note that the faunal associationof the European massifs may not be restricted tothese, as the analysis presented here does notinclude all the plates in the neighborhood of theEuropean massifs.
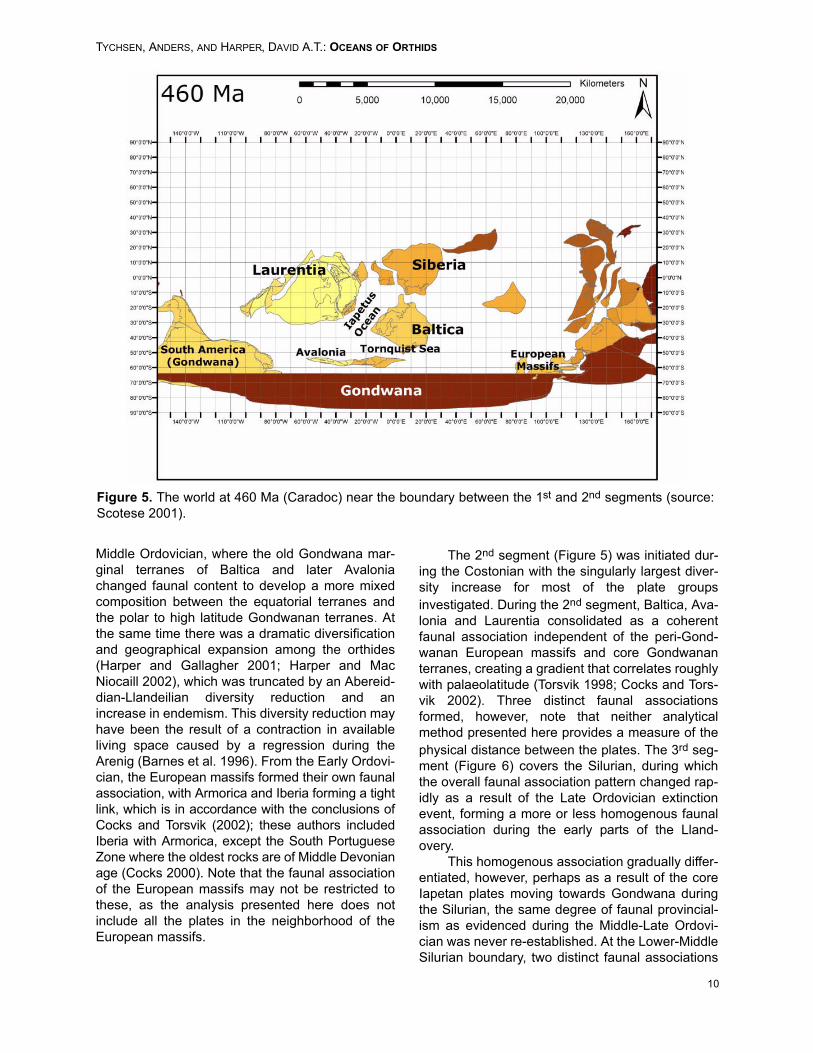
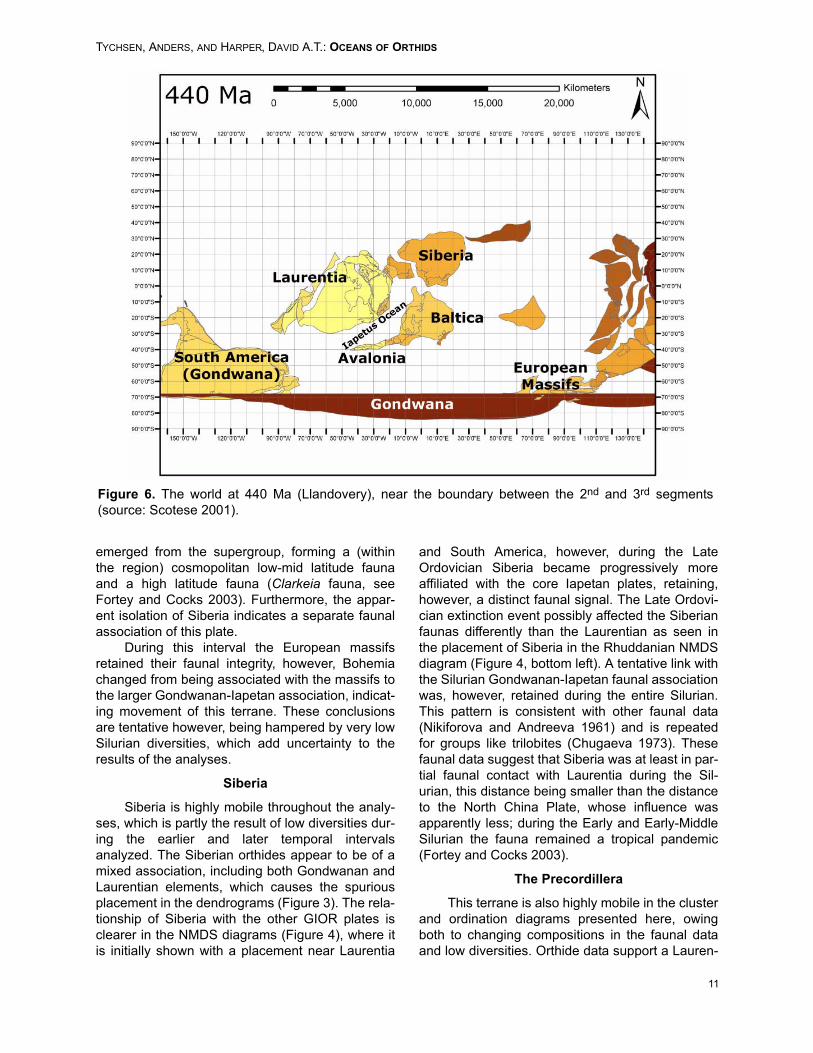
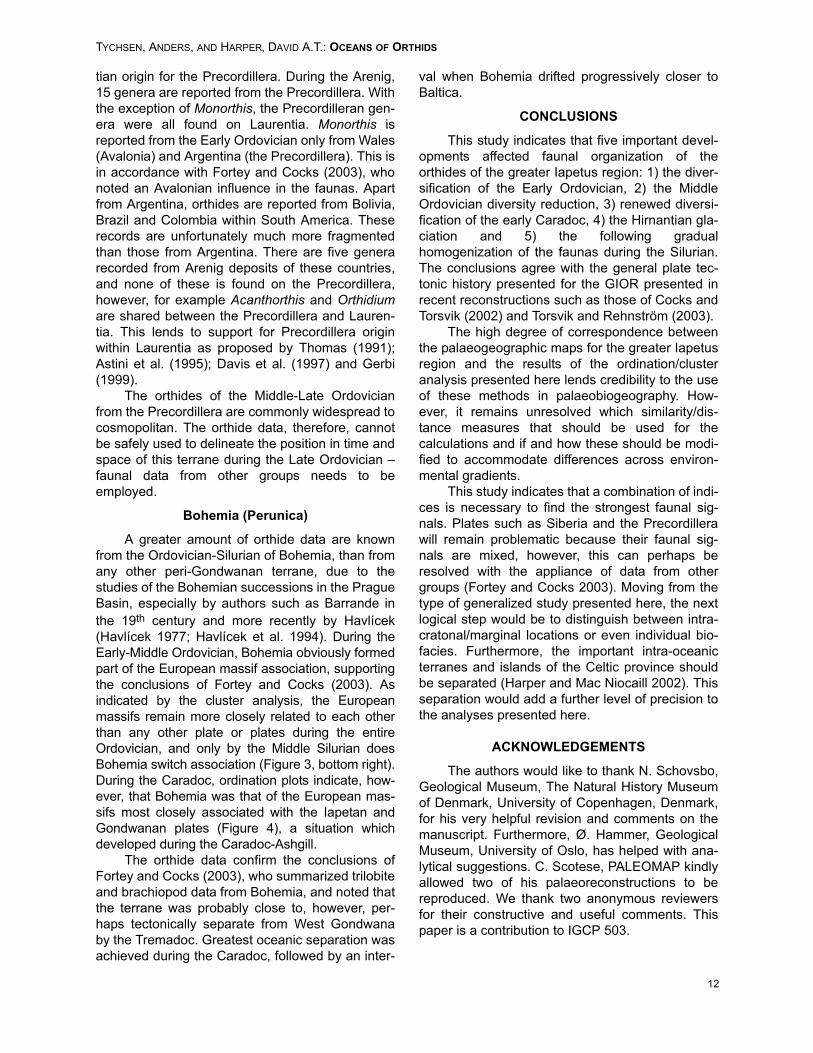
The 2nd segment (Figure 5) was initiated dur-ing the Costonian with the singularly largest diver-sity increase for most of the plate groupsinvestigated. During the 2nd segment, Baltica, Ava-lonia and Laurentia consolidated as a coherentfaunal association independent of the peri-Gond-wanan European massifs and core Gondwananterranes, creating a gradient that correlates roughlywith palaeolatitude (Torsvik 1998; Cocks and Tors-vik 2002). Three distinct faunal associationsformed, however, note that neither analyticalmethod presented here provides a measure of thephysical distance between the plates. The 3rd seg-ment (Figure 6) covers the Silurian, during whichthe overall faunal association pattern changed rap-idly as a result of the Late Ordovician extinctionevent, forming a more or less homogenous faunalassociation during the early parts of the Lland-overy.
This homogenous association gradually differ-entiated, however, perhaps as a result of the coreIapetan plates moving towards Gondwana duringthe Silurian, the same degree of faunal provincial-ism as evidenced during the Middle-Late Ordovi-cian was never re-established. At the Lower-MiddleSilurian boundary, two distinct faunal associations
Figure 5. The world at 460 Ma (Caradoc) near the boundary between the 1st and 2nd segments (source:Scotese 2001).
TYCHSEN, ANDERS, AND HARPER, DAVID A.T.: OCEANS OF ORTHIDS
11
emerged from the supergroup, forming a (withinthe region) cosmopolitan low-mid latitude faunaand a high latitude fauna (Clarkeia fauna, seeFortey and Cocks 2003). Furthermore, the appar-ent isolation of Siberia indicates a separate faunalassociation of this plate.
During this interval the European massifsretained their faunal integrity, however, Bohemiachanged from being associated with the massifs tothe larger Gondwanan-Iapetan association, indicat-ing movement of this terrane. These conclusionsare tentative however, being hampered by very lowSilurian diversities, which add uncertainty to theresults of the analyses.
Siberia
Siberia is highly mobile throughout the analy-ses, which is partly the result of low diversities dur-ing the earlier and later temporal intervalsanalyzed. The Siberian orthides appear to be of amixed association, including both Gondwanan andLaurentian elements, which causes the spuriousplacement in the dendrograms (Figure 3). The rela-tionship of Siberia with the other GIOR plates isclearer in the NMDS diagrams (Figure 4), where itis initially shown with a placement near Laurentia
and South America, however, during the LateOrdovician Siberia became progressively moreaffiliated with the core Iapetan plates, retaining,however, a distinct faunal signal. The Late Ordovi-cian extinction event possibly affected the Siberianfaunas differently than the Laurentian as seen inthe placement of Siberia in the Rhuddanian NMDSdiagram (Figure 4, bottom left). A tentative link withthe Silurian Gondwanan-Iapetan faunal associationwas, however, retained during the entire Silurian.This pattern is consistent with other faunal data(Nikiforova and Andreeva 1961) and is repeatedfor groups like trilobites (Chugaeva 1973). Thesefaunal data suggest that Siberia was at least in par-tial faunal contact with Laurentia during the Sil-urian, this distance being smaller than the distanceto the North China Plate, whose influence wasapparently less; during the Early and Early-MiddleSilurian the fauna remained a tropical pandemic(Fortey and Cocks 2003).
The Precordillera
This terrane is also highly mobile in the clusterand ordination diagrams presented here, owingboth to changing compositions in the faunal dataand low diversities. Orthide data support a Lauren-
Figure 6. The world at 440 Ma (Llandovery), near the boundary between the 2nd and 3rd segments(source: Scotese 2001).
TYCHSEN, ANDERS, AND HARPER, DAVID A.T.: OCEANS OF ORTHIDS
12
tian origin for the Precordillera. During the Arenig,15 genera are reported from the Precordillera. Withthe exception of Monorthis, the Precordilleran gen-era were all found on Laurentia. Monorthis isreported from the Early Ordovician only from Wales(Avalonia) and Argentina (the Precordillera). This isin accordance with Fortey and Cocks (2003), whonoted an Avalonian influence in the faunas. Apartfrom Argentina, orthides are reported from Bolivia,Brazil and Colombia within South America. Theserecords are unfortunately much more fragmentedthan those from Argentina. There are five generarecorded from Arenig deposits of these countries,and none of these is found on the Precordillera,however, for example Acanthorthis and Orthidiumare shared between the Precordillera and Lauren-tia. This lends to support for Precordillera originwithin Laurentia as proposed by Thomas (1991);Astini et al. (1995); Davis et al. (1997) and Gerbi(1999).
The orthides of the Middle-Late Ordovicianfrom the Precordillera are commonly widespread tocosmopolitan. The orthide data, therefore, cannotbe safely used to delineate the position in time andspace of this terrane during the Late Ordovician –faunal data from other groups needs to beemployed.
Bohemia (Perunica)
A greater amount of orthide data are knownfrom the Ordovician-Silurian of Bohemia, than fromany other peri-Gondwanan terrane, due to thestudies of the Bohemian successions in the PragueBasin, especially by authors such as Barrande inthe 19th century and more recently by Havlícek(Havlícek 1977; Havlícek et al. 1994). During theEarly-Middle Ordovician, Bohemia obviously formedpart of the European massif association, supportingthe conclusions of Fortey and Cocks (2003). Asindicated by the cluster analysis, the Europeanmassifs remain more closely related to each otherthan any other plate or plates during the entireOrdovician, and only by the Middle Silurian doesBohemia switch association (Figure 3, bottom right).During the Caradoc, ordination plots indicate, how-ever, that Bohemia was that of the European mas-sifs most closely associated with the Iapetan andGondwanan plates (Figure 4), a situation whichdeveloped during the Caradoc-Ashgill.
The orthide data confirm the conclusions ofFortey and Cocks (2003), who summarized trilobiteand brachiopod data from Bohemia, and noted thatthe terrane was probably close to, however, per-haps tectonically separate from West Gondwanaby the Tremadoc. Greatest oceanic separation wasachieved during the Caradoc, followed by an inter-
val when Bohemia drifted progressively closer toBaltica.
CONCLUSIONS
This study indicates that five important devel-opments affected faunal organization of theorthides of the greater Iapetus region: 1) the diver-sification of the Early Ordovician, 2) the MiddleOrdovician diversity reduction, 3) renewed diversi-fication of the early Caradoc, 4) the Hirnantian gla-ciation and 5) the following gradualhomogenization of the faunas during the Silurian.The conclusions agree with the general plate tec-tonic history presented for the GIOR presented inrecent reconstructions such as those of Cocks andTorsvik (2002) and Torsvik and Rehnström (2003).
The high degree of correspondence betweenthe palaeogeographic maps for the greater Iapetusregion and the results of the ordination/clusteranalysis presented here lends credibility to the useof these methods in palaeobiogeography. How-ever, it remains unresolved which similarity/dis-tance measures that should be used for thecalculations and if and how these should be modi-fied to accommodate differences across environ-mental gradients.
This study indicates that a combination of indi-ces is necessary to find the strongest faunal sig-nals. Plates such as Siberia and the Precordillerawill remain problematic because their faunal sig-nals are mixed, however, this can perhaps beresolved with the appliance of data from othergroups (Fortey and Cocks 2003). Moving from thetype of generalized study presented here, the nextlogical step would be to distinguish between intra-cratonal/marginal locations or even individual bio-facies. Furthermore, the important intra-oceanicterranes and islands of the Celtic province shouldbe separated (Harper and Mac Niocaill 2002). Thisseparation would add a further level of precision tothe analyses presented here.
ACKNOWLEDGEMENTS
The authors would like to thank N. Schovsbo,Geological Museum, The Natural History Museumof Denmark, University of Copenhagen, Denmark,for his very helpful revision and comments on themanuscript. Furthermore, Ø. Hammer, GeologicalMuseum, University of Oslo, has helped with ana-lytical suggestions. C. Scotese, PALEOMAP kindlyallowed two of his palaeoreconstructions to bereproduced. We thank two anonymous reviewersfor their constructive and useful comments. Thispaper is a contribution to IGCP 503.
TYCHSEN, ANDERS, AND HARPER, DAVID A.T.: OCEANS OF ORTHIDS
13
APPENDIX
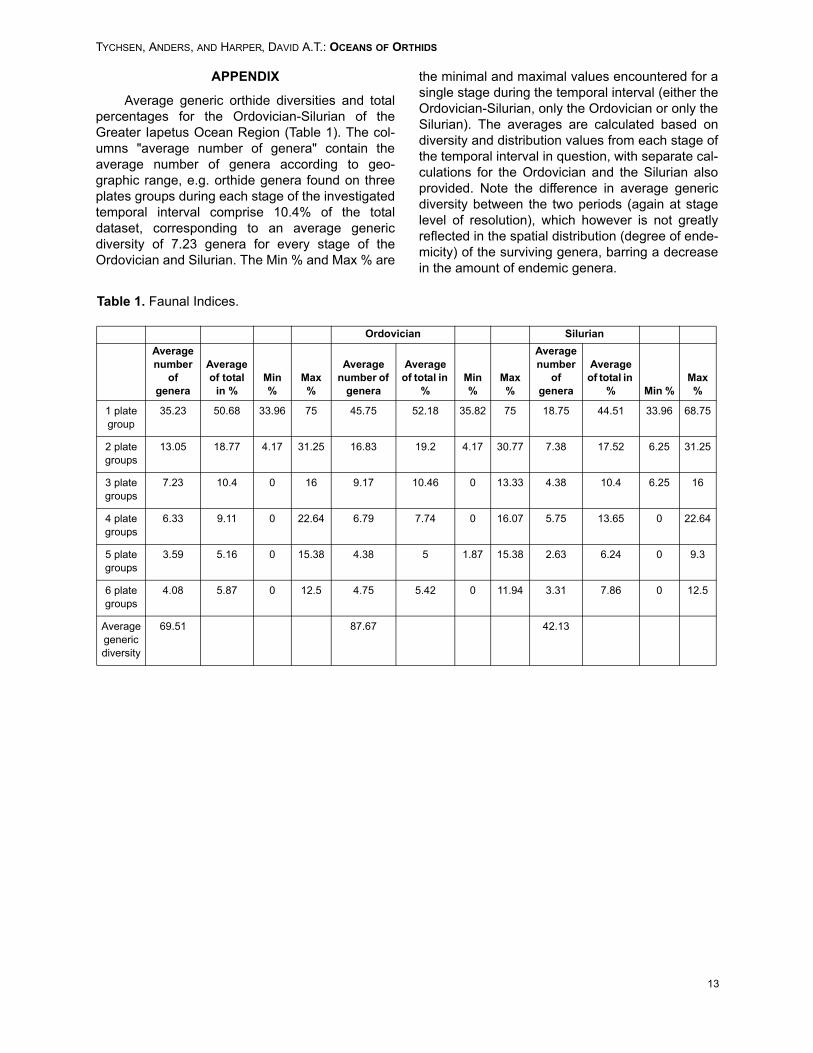
Average generic orthide diversities and totalpercentages for the Ordovician-Silurian of theGreater Iapetus Ocean Region (Table 1). The col-umns "average number of genera" contain theaverage number of genera according to geo-graphic range, e.g. orthide genera found on threeplates groups during each stage of the investigatedtemporal interval comprise 10.4% of the totaldataset, corresponding to an average genericdiversity of 7.23 genera for every stage of theOrdovician and Silurian. The Min % and Max % are
the minimal and maximal values encountered for asingle stage during the temporal interval (either theOrdovician-Silurian, only the Ordovician or only theSilurian). The averages are calculated based ondiversity and distribution values from each stage ofthe temporal interval in question, with separate cal-culations for the Ordovician and the Silurian alsoprovided. Note the difference in average genericdiversity between the two periods (again at stagelevel of resolution), which however is not greatlyreflected in the spatial distribution (degree of ende-micity) of the surviving genera, barring a decreasein the amount of endemic genera.
Table 1. Faunal Indices.
Ordovician Silurian Average number
of genera
Average of total
in % Min %
Max %
Average number of
genera
Average of total in
%Min %
Max %
Average number
of genera
Average of total in
% Min %Max %
1 plate group
35.23 50.68 33.96 75 45.75 52.18 35.82 75 18.75 44.51 33.96 68.75
2 plate groups
13.05 18.77 4.17 31.25 16.83 19.2 4.17 30.77 7.38 17.52 6.25 31.25
3 plate groups
7.23 10.4 0 16 9.17 10.46 0 13.33 4.38 10.4 6.25 16
4 plate groups
6.33 9.11 0 22.64 6.79 7.74 0 16.07 5.75 13.65 0 22.64
5 plate groups
3.59 5.16 0 15.38 4.38 5 1.87 15.38 2.63 6.24 0 9.3
6 plate groups
4.08 5.87 0 12.5 4.75 5.42 0 11.94 3.31 7.86 0 12.5
Average generic diversity
69.51 87.67 42.13
TYCHSEN, ANDERS, AND HARPER, DAVID A.T.: OCEANS OF ORTHIDS
14
REFERENCES
Astini, R.A., Benedetto, J.L., and Vaccari, N.E. 1995.The early Paleozoic evolution of the Argentine Pre-cordillera as a Laurentian rifted, drifted and collidedterrane – a geodynamic model. Bulletin of the Geo-logical Society of America, 107:253-273.
Barnes, C.R., Fortey, R.A., and Williams, S.H. 1996. ThePattern of Global Bio-Events during the OrdovicianPeriod, p. 139-172. In Walliser, O.H. (ed.), GlobalEvents and Event Stratigraphy in the Phanerozoic.Springer Verlag.
Belka, Z., Valverde-Vaquero, P.W., Dörr, W., Ahrendt, H.,Wemmer, K., Franke, W., and Schäfer, J. 2002.Accretion of first Gondwana-derived terranes at themargin of Baltica. Palaeozoic amalgamation of Cen-tral Europe. Geological Society of London SpecialPublications, 201:19-36.
Bernasconi, M.P. and Stanley, D.J. 1994. Molluscan Bio-facies and their environmental implication, Nile DeltaLagoons, Egypt. Journal of Coastal Research,10:440-465.
Benton, M.J. 1999. The History of Life: Large Databasesin Palaeontology, p. 249-283. In Harper, D.A.T. (ed.),Numerical Palaeobiology: Computer-based Model-ling and Analysis of Fossils and Their Distributions.John Wiley and Sons.
Chugaeva, M.N. 1973. Trilobites, p. 1-286. In Chugaeva,M.N., Ivanova, V.A., Oradovskaya, M.N., andYakolev, Y.N. (eds.), Biostratigraphy of the LowerPart of the Ordovician in the Northeast USSR, andBiogeography of the Uppermost Lower Ordovician.Trudy Geologiceskii Instituta Moscow, 213.
Cocks, L.R.M. and McKerrow, W.S. 1984. Review of thedistribution of the commoner animals in Lower Sil-urian marine benthic communities. Palaeontology,27:663-670.
Cocks, L.R.M. 2000. The Early Palaeozoic geography ofEurope. Journal of the Geological Society of London,157:1-10.
Cocks, L.R.M. 2002. Key Lower Palaeozoic faunas fromnear the Trans-European Suture Zone. GeologicalSociety of London Special Publications, 201:37-46.
Cocks, L.R.M. and Torsvik, T.H. 2002. Earth geographyfrom 500 to 400 million years ago. A faunal andpalaeomagnetic review. Journal of the GeologicalSociety of London, 159:631-644.
Davis, J.C. 1986. Statistics and Data Analysis in Geol-ogy. John Wiley and Sons.
Davis, J.S., McClelland, W.M., Roeske, S.M., Gerbi, C.,and Moores, E.M. 1997. The early to middle Paleo-zoic tectonic history of the SW Precordillera Terraneand Laurentia-Gondwana interactions. GeologicalSociety of America Abstracts with Programs, 29:380.
Etter, W. 1999. Community Analysis, p. 285-360. InHarper, D.A.T. (ed.), Numerical Palaeobiology. Com-puter-based Modelling and Analysis of Fossils andTheir Distributions. John Wiley and Sons.
Fortey, R.A., Harper, D.A.T., Ingham, J.K., Owen, A.W.,Parkes, M.A., Rushton, A.W.A., and Woodcock, N.H.2000. A revised correlation of Ordovician rocks in theBritish Isles. Geological Society of London SpecialReport, 24:1-83.
Fortey, R.A. and Cocks, L.R.M. 2003. Palaeontologicalevidence bearing on global Ordovician-Silurian conti-nental reconstructions. Earth Science Reviews,61:245-307.
Gerbi, C. 1999. Further constraints on the Early Paleo-zoic tectonic history of the western margin of the Pre-cordillera terrane, Argentina. Unpublished MSc.Thesis. University of California, Davis, California.
Hammer, Ø., Harper, D.A.T., and Ryan, P.D. 2001. PAST.Paleontological Statistics Software Package for Edu-cation and Data Analysis. Palaeontologia Electronica4:9 pp.
Harper, D.A.T., Mac Niocaill, C., and Williams, S.H.1996. The palaeogeography of Early OrdovicianIapetus terranes. An integration of faunal and palaeo-magnetic constraints. Palaeogeography, Palaeocli-matology, Palaeoecology, 121:297-312.
Harper, D.A.T. and Gallagher, E. 2001. Diversity, dispar-ity and distributional patterns amongst the orthidebrachiopod groups. Journal of the Czech GeologicalSociety, 46:87-93.
Harper, D.A.T. and Mac Niocaill, C. 2002. Early Ordovi-cian rhynchonelliformean brachiopod diversity. Com-paring some platforms, margins and intra-oceanicsites around the Iapetus Ocean, p. 25-34. In Crame,J.A. and Owen, A.W. (eds.), Palaeobiogeographyand Biodiversity Change. The Ordovician and Meso-zoic-Cenozoic Radiations. Geological Society Spe-cial Publication 194.
Havlícek , V. 1977: Brachiopods of the order Orthida inCzechoslovakia. Rozpravy Ústredního Ústavu Geo-logického 44:1-327.
Havlícek, V., Vanek, J., and Fakta, O. 1994. Perunicamicrocontinent in the Ordovician (its position withinthe Mediterranean Province, series division, benthicand pelagic associations). Sbornik geologickych vedGeologie, 46:23-56.
Jongman, R.H.G., ter Braak, C.J.F., and van Tongeren,O.F.R. 1995. Data Analysis in Community and Land-scape Ecology. Cambridge University Press.
Krebs, C.J. 1989. Ecological Methodology. HarperCollinsPublishers.
Lees, D., Fortey, R.A., and Cocks, L.R.M. 2002. Quanti-fying paleogeography using biogeography. A testcase for the Ordovician and Silurian of Avaloniabased on brachiopods and trilobites. Paleobiology,28:263-279.
Legendre, P. and Legendre, L. 1998. Numerical Ecology(second English edition). Elsevier Science.
Lichstein, J.W., Simons, T.R., Shriner, S.A., and Fran-zreb, K.E. 2002. Spatial Autocorrelation and autore-gressive models in Ecology. Ecological Monographs,72:445-463.
Mac Niocaill, C., van der Pluijm, B.A., and van der Voo,R. 1997. Ordovician paleogeography and the evolu-tion of the Iapetus Ocean. Geology, 25:159-162.
TYCHSEN, ANDERS, AND HARPER, DAVID A.T.: OCEANS OF ORTHIDS
15
Markwick, P.J. and Lupia, R. 2002. Palaeontologicaldatabases for palaeobiogeography, palaeoecologyand biodiversity. A question of scale, p. 169-178. InCrame, J.A. and Owen, A.W. (eds.), Palaeobiogeog-raphy and Biodiversity Change. The Ordovician andMesozoic-Cenozoic Radiations. Geological SocietySpecial Publication 194.
McKerrow, W.S., Dewey, J.F., and Scotese, C.R. 1991.The Ordovician and Silurian development of theIapetus Ocean. Palaeontology Special Paper,44:165-178.
Nikiforova, O.I. and Andreeva, O.N. 1961. Stratigraphyof the Ordovician and Silurian of the Siberian plat-form and its palaeontological basis (Brachiopods),Biostratigrafiya Sibirskov Platformy. Gostoptekhizdat.
Raup, D.M. and Crick, R.E. 1979. Measurement of fau-nal similarity in paleontology. Journal of Paleontol-ogy, 53:1213-1227.
Raup, D.M. 1991. The future of analytical paleobiology,p. 207-216. In Gillinsky, N. L. and Signor, P.W. (eds.),Analytical palaeobiology. The Paleontological Soci-ety.
Rudwick, M.J.S. 1970. Living and fossil brachiopods.Hutchinson.
Schuchert, C. and Cooper, G. A. 1932. Synopsis of thebrachiopod genera of the suborders Orthoidea andPentameroidea, with notes on the Telotremata.American Journal of Science (series 5), 22:241-255.
Scotese, C.R., 2001. Earth System History GeographicInformation System v. 02b, PALEOMAP Project,Arlington, Texas.
Sepkoski, J.J. 1993. Ten years in the library. New dataconfirm paleontological patterns. Paleobiology,19:43-51.
Smith, A.B. 2001. Large-scale heterogeneity of the fossilrecord: Implications for Phanerozoic biodiversitystudies. Philosophical Transactions of the RoyalSociety of London, B356:351-367.
Stampfli, G.M. and Borel, G.D. 2002. A plate tectonicmodel for the Paleozoic and Mesozoic constrainedby dynamic plate boundaries and restored syntheticoceanic ishchrons. Earth and Planetary Science Let-ters, 196:17-33.
Swan, A.R.H. and Sandilands, M. 2001. Introduction toGeological Data Analysis (third edition). BlackwellScientific Publications.
Thomas, W.A. 1991. The Appalachian-Ouachita riftedmargin of southeastern North America. Bulletin of theGeological Society of America, 103:415-431.
Torsvik, T.H. 1998. Palaeozoic palaeogeography. ANorth Atlantic viewpoint. Geologiska FöreningensFörhandlinger, 120:109-118.
Torsvik, T.H. and Rehnström, E.F. 2003. The TornquistSea and Baltica-Avalonia docking. Tectonophysics,362:67-82.
Williams, A. and Harper, D.A.T. 2000. Orthida, p. 714-782. In Kaesler, R.L. (ed.), Treatise on InvertebratePaleontology, Part H, Brachiopoda, Revised, v. 3.Geological Society of America and University of Kan-sas Press, Lawrence, Boulder, Colorado andLawrence, Kansas.
Worsley, D., Aarhus, N., Bassett, M.G., Howe, M.P.A.,Mørk, A., and Olaussen, S. 1983. The Silurian suc-cession of the Oslo Region. Norges geologiskeundersøkelse 384:1-57. Universitetsforlaget.