Embed Size (px)
Citation preview

Ore Reserves and Mineral Resources Report 2020

Re-imagining mining to improve people’s lives
Mining has a smarter, safer future.Using more precise technologies, less energy and less water, we are reducing our physical footprint for every ounce, carat and kilogram
of precious metal or mineral.
We are combining smart innovation with the utmost consideration for our people, their families, local communities, our customers and the
world at large – to better connect precious resources in the ground to all of us who need and value them.
And we are working together to develop better jobs, better education and better businesses, building brighter and healthier futures around our
operations in our host countries and ultimately for billions of people around the world who depend on our products every day.
01 Introduction02 Locations at a glance04 Feature: Woodsmith Project
Ore Reserves and Mineral Resources Summary
06 Estimated Ore Reserves08 Estimated Mineral Resources
Ore Reserve and Mineral Resource estimates
10 Diamonds16 Copper20 Platinum Group Metals25 Iron Ore28 Coal35 Nickel37 Manganese38 Crop Nutrients
39 Definitions40 Reserve and Resource Reconciliation Overview48 Competent Persons List52 Glossary
54 Other Anglo American publications
Contents
Our reporting suiteYou can find this report and others, including the Integrated Annual Report and the Sustainability Report, on our corporate website.
Social Channels
FutureSmart Mining™In order to deliver on our purpose we are changing the way we mine through smart innovation across technology, digitalisation and sustainability.
For more information, see: www.angloamerican.com/investors/ annual-reporting
@angloamericanAngloAmerican Anglo American
angloamerican angloamericanplc
To discover more about the future of mining see: www.angloamerican.com/futuresmart/ futuresmart-mining
Integrated Annual Report 2020
Integrated Annual Report 2020

The Ore Reserve and Mineral Resource estimates presented in this report were prepared in accordance with the Anglo American plc Group Ore Reserves and Mineral Resources Reporting Policy.
This policy stipulates that the Australasian Code for Reporting of Exploration Results, Mineral Resources and Ore Reserves 2012 edition (the JORC Code) be used as a minimum standard. Some Anglo American plc subsidiaries have a primary listing in South Africa where public reporting is carried out in accordance with the South African Code for Reporting of Exploration Results, Mineral Resources and Mineral Reserves (the SAMREC Code). The SAMREC Code is similar to the JORC Code and the Ore Reserve and Mineral Resource terminology appearing in this report follows the definitions in both the JORC (2012) and SAMREC (2016) Codes. Ore Reserves in the context of this report have the same meaning as ‘Mineral Reserves’ as defined by the SAMREC Code and the CIM (Canadian Institute of Mining, Metallurgy and Petroleum) Definition Standards on Mineral Resources and Mineral Reserves.
The information on Ore Reserves and Mineral Resources was prepared by or under the supervision of Competent Persons as defined in the JORC or SAMREC Codes. All Competent Persons have sufficient experience relevant to the style of mineralisation and type of deposit under consideration and to the activity which they are undertaking. All the Competent Persons consent to the inclusion in this report of the information in the form and context in which it appears. The names of the Competent Persons (CPs) along with their Recognised Professional Organisation (RPO) affiliation and years of relevant experience are listed in this report.
Anglo American Group companies are subject to a comprehensive programme of reviews aimed at providing assurance in respect of Ore Reserve and Mineral Resource estimates. The reviews are conducted by suitably qualified Competent Persons from within the Anglo American Group or by independent consultants. The frequency and depth of the reviews is a function of the perceived risks and/or uncertainties associated with a particular Ore Reserve and Mineral Resource. The overall value of the entity and time that has elapsed since an independent third-party review are also considered. Those operations/projects that were subjected to independent third-party reviews during the year are indicated in footnotes to the tables.
Both the JORC and SAMREC Codes require due consideration of reasonable prospects for eventual economic extraction for Mineral Resource definition. These include long-range commodity price forecasts which are prepared by in-house specialists largely using estimates of future supply and demand and long term economic outlooks. The calculation of Mineral Resource and Ore Reserve estimates are based on long term prices determined at the beginning of the second quarter of each year. Ore Reserves are dynamic and more likely to be affected by fluctuations in the prices of commodities, uncertainties in production costs, processing costs and other mining, infrastructure, legal, environmental, social and governmental factors which may impact the financial condition and prospects of the Group. Mineral Resource estimates also change and tend to be most influenced by new information pertaining to the understanding of the deposit and secondly by conversion to Ore Reserves. Unless stated otherwise, Mineral Resources are additional to (i.e. exclusive of) those resources converted to Ore Reserves and are reported on a dry tonnes basis.
Mineral Resource classification defines the confidence associated with different parts of the Mineral Resource. The confidence that is assigned refers collectively to the reliability of the Grade and Tonnage estimates. This reliability includes consideration for the fidelity of the base data, the geological continuity predicated by the level of understanding of the geology, the likely precision of the grade estimates and understanding of grade variability, as well as
various other factors (in particular density) that may influence the confidence that can be assigned to the Mineral Resource. Most business units have developed commodity-specific scorecard-based approaches to the classification of their Mineral Resources.
The appropriate Mineral Resource classification is determined by the appointed Competent (or Qualified) Persons. The choice of appropriate category of Mineral Resource depends upon the quantity, distribution and quality of geoscientific information available and the level of confidence in these data.
The estimates of Ore Reserves and Mineral Resources are stated as at 31 December 2020. The figures in the tables have been rounded, and if used to derive totals and averages, minor differences may result.
The Ore Reserves and Mineral Resources Report 2020 should be considered the only valid source of Ore Reserve and Mineral Resource information for the Anglo American Group exclusive of Kumba Iron Ore and Anglo American Platinum Limited, which publish their own independent Annual Reports.
It is accepted that mine design and planning may include some Inferred Mineral Resources. Inferred Mineral Resources in the Life of Mine Plan (LOM Plan) are described as ‘Inferred (in LOM Plan)’ separately from the remaining Inferred Mineral Resources described as ‘Inferred (ex. LOM Plan)’, as required. These resources are declared without application of Modifying Factors. Reserve Life reflects the scheduled extraction period in years for the total Ore Reserves in the approved Life of Mine Plan.
The Ownership (Attributable) Percentage that Anglo American holds in each operation and project is presented beside the name of each entity and is the Group’s effective ownership interest. Operations and projects which fall below the internal threshold for reporting (25% attributable interest) are not reported. Operations or projects which were disposed of during 2020 and hence not reported are: Elizabeth Bay and Douglas Bay (Diamonds).
In South Africa, the Minerals and Petroleum Resources Development Act, Number 28 of 2002 (MPRDA) that was implemented on 1 May 2004, (subsequently amended by the Minerals and Petroleum Resources Development Amendment Act 49 of 2008) effectively transferred custodianship of the previously privately held mineral rights to the State.
A Prospecting Right is a right issued in terms of the MPRDA that is valid for up to five years, with the possibility of a further extension of three years.
A Mining Right is a right issued in terms of the MPRDA and is valid for up to 30 years, with the possibility of a further extension of 30 years. The Minister of Mineral Resources will grant a renewal of the Mining Right if the terms and conditions of the Mining Right have been complied with and the applicant is not in contravention of any relevant provisions of the MPRDA.
In preparing the Ore Reserve and Mineral Resource statement for South African assets, Anglo American plc has adopted the following reporting principles in respect of Prospecting Rights and Mining Rights:
– Where applications for Mining Rights and Prospecting Rights have been submitted and these are still being processed by the relevant regulatory authorities, the relevant Ore Reserves and Mineral Resources have been included in the statement.
– Where applications for Mining Rights and Prospecting Rights have been initially refused by the regulatory authorities, but are the subject of ongoing legal process and discussions with the relevant authorities and where Anglo American plc has reasonable expectations that the rights will be granted in due course, the relevant Mineral Resources have been included in the statement (any associated comments appear in the footnotes).
Anglo American plc Ore Reserves and Mineral Resources Report 2020 01
Ore Reserves and Mineral Resources
Introduction

Our operations and selected projects around the world
Anglo American is a leading global mining company and our products are the essential ingredients in almost every aspect of modern life. Our portfolio of world class competitive operations, development projects and
undeveloped resources provides many of the metals and minerals that enable a cleaner, greener, more sustainable world and that meet the fast growing consumer-driven demands of developed and maturing economies.
For more information see:www.angloamerican.com/where-we-operate
Locations at a glance
Diamonds Operations
Copper Projects
Platinum Group Metals
Iron Ore
Metallurgical Coal
Thermal Coal
Nickel And Manganese
Crop Nutrients
Business Units Key Asset Key
02 Anglo American plc Ore Reserves and Mineral Resources Report 2020
Ore Reserves and Mineral Resources
North America1 diamond operation
1 coal project
Australia4 coal operations
1 manganese operation
Southern Africa8 diamond operations
9 PGM operations
2 iron ore operations
7 coal operations
1 manganese operation
South America3 copper operations
1 copper project
1 iron ore operation
1 coal operation
2 nickel operations
United Kingdom1 polyhalite project

Coal1 Capcoal2 Dawson3 Grosvenor 3 Moranbah North
Manganese4 GEMCO
8
6
7
1
4
32
5
4
31
2
Copper1 Collahuasi2 El Soldado3 Los Bronces4 Quellaveco
Iron Ore5 Serra do Sapo
(Minas-Rio)
Coal6 Cerrejón
Nickel7 Barro Alto8 Niquelândia
Diamonds1 Gahcho Kué
Coal 2 Trend and Roman Mountain
19
21
18
1
3
42
10
11
12
13
14
1617
9
15
5
Diamonds1 Venetia2 Damtshaa3 Jwaneng4 Letlhakane5 Orapa6 Mining Area 17 Orange River8 Atlantic 1
Coal20 Goedehoop20 Greenside20 Isibonelo 20 Khwezela
(Landau and Kleinkopje)20 Mafube20 Rietvlei20 Zibulo
Manganese21 Hotazel Mines
Platinum Group Metals9 Amandelbult Complex
(Tumela and Dishaba)10 Mogalakwena11 Mototolo Complex12 Twickenham13 Unki14 Bokoni15 Kroondal Marikana16 Modikwa17 Siphumelele 3 shaft
Iron Ore18 Kolomela
19 Sishen
8
2
76
20
For more information:Select asset above
1
North America
Southern Africa
South America
Australia
Anglo American plc Ore Reserves and Mineral Resources Report 2020 03

The Woodsmith Project is the largest known high grade polyhalite deposit in the world. Polyhalite (K2Ca2Mg(SO4)4 2H2O), is a hydrated calcium, magnesium and potassium sulphate evaporite mineral. When crushed and granulated it is branded as POLY4, a slow-release, low chloride fertiliser that contains four of the six key nutrients required for plant growth. The product is suitable for organic use that can boost crop yields, aiding in more sustainable farming.
Anglo American acquired Sirius Minerals plc and its wholly owned Woodsmith project in March 2020. The mine site and much of the project infrastructure sits within the North York Moors National Park. To minimise environmental impact both in construction and operations, a number of innovative and stringent engineering solutions have been incorporated into the design of the mine. The deposit is located 1,550 m below surface and will be accessed by two deep shafts with headframes housed below ground level to ensure there is no visual impact on the surrounding area. Mining will be on a room and pillar layout utilising Continuous Miners with the ore hoisted to the Mineral Transport System level located 340 m below surface. A 37 km-long conveyor will transport the ore along a tunnel, currently under construction, from the mine site to the Material Handling Facility in Teesside, from where it will largely be exported.
The resource is part of the Late Permian evaporite succession on the western edge of the Zechstein Basin. The full Zechstein sequence was deposited over 5–7 million years and represents multiple influxes and subsequent evaporation of seawater in a topographic low with restricted connection to the Zechstein sea. The polyhalite deposit itself sits within the EZ2 Fordon Evaporite sequence, a significant basin-infilling cycle. This sequence varies between 30 and 200 m thick across the project area, thickening to the east, towards the centre of the basin. The polyhalite itself appears to be formed by syn-sedimentary metasomatism or back-reaction of pre-existing sulphates; gypsum/anhydrite, with potassium and magnesium-enriched marine brines.
The deposit is a stratiform sedimentary unit displaying significant lateral continuity. It is composed of two high grade seams; the Shelf Seam and the Basin Seam. The Shelf Seam exists on the basin margin and thickens in the central part of the project area, this forms the Indicated Resource. It is bounded by intergrown halite-anhydrite-polyhalite below and anhydrite above. The Basin Seam is deeper and bound by halite. Both seams pinch out to the west, the Basin seam against the Basin Ramp, and the Shelf seam further west towards the edge of the palaeo-coastline.
On a smaller scale, the deposit is modelled as a series of laterally continuous intervals within the Shelf Seam, potentially representing discrete variations within the seawater chemistry of the Zechstein Sea at the time. Three zones of high grade polyhalite are distinguished, separated by anhydrite-dominated bands. The grade is measured by QXRD analysis, to unequivocally establish the mineral phases, and correlated against spectral gamma from wireline geophysical surveys and ICP-OES. This novel approach allows the mineralogical grade to be determined, as well as the elemental composition which could otherwise be complicated by exotic evaporite mineral species. The mineralogy and texture within evaporites can be complex, with primary depositional and secondary overprinting effects common throughout. Polyhalite is found alongside numerous other evaporite sulphate, chloride and borate minerals ranging from gangue-level to trace-level.
The Exclusive Mineral Resource is approximately 2,000 Mt of Indicated and Inferred Resources at a grade of 84.1% polyhalite. The mining block is constrained by faults to the north and south. Evaporites tend to anneal causing faults to ‘sole-out’ so only the regional, large-scale offsets have thus far been identified from seismic lines. The Probable Ore Reserve is approximately 290 Mt at a grade of 88.8% polyhalite. Refer to the Crop Nutrients section for more details.
Construction at the Woodsmith project as at October 2020.
04 Anglo American plc Ore Reserves and Mineral Resources Report 2020
Ore Reserves and Mineral Resources
Woodsmith Project North Yorkshire, UK

Shelf
E11
Base of the Brotherton Formation & Grauer Salzton (Z3)
Anhydrite and Halite
Marginal/TransitionPolyhalite, Halite andAnhydrite Mix
Basin Fill Halite
Bittern Salts: Sylvite,Kieserite & Kainite
SM3 SM11
Transition zonenot fully understood
Sporadic bittern salt development
SM2 SM1
Transition Zone Basin
Basinal/Lower Polyhalite
Shelf/Upper Polyhalite
Upper Anhydrite
Kirkham Abbey Dolomitic Limestone
Basal Anhydrite
Lower/Black Halite
Woodsmith project location with lease boundary, North Yorkshire, UK.
West-East schematic cross section of Shelf and Basin Seams at the Woodsmith project.
Anglo American plc Ore Reserves and Mineral Resources Report 2020 05
Area of Interest
Mineral Transport System
Polyhalite Mineral Resource area
Woodsmith project drill holes
Historical drill holes not drilledto depth of polyhalite resource
Historical drill holes drilled through evaporite sequence
Woodsmith
London
LiverpoolDublin
Birmingham
ManchesterLeeds
Belfast
GlasgowEdinburgh
Mine Site
IntermediateShaft
Teesside Port and MaterialHandling Facility
Scarborough
Whitby
North York MoorsNational Park
Middlesbrough
5km N

Estimated Ore Reserves(1)
as at 31 December 2020
Detailed Proved and Probable estimates appear on the referenced pages in the Ore Reserves and Mineral Resources Report 2020.
Total Proved and Probable
Diamond(3) Operations – DBCi(See page 10 for details) Ownership %
Mining Method
LOM(2)
(years)Saleable Carats
(Mct)Treated Tonnes
(Mt)Recovered Grade
(cpht)
Gahcho Kué Kimberlite 43.4 OP 10 45.3 29.2 155.3
Diamond(3) Operations – DBCM(See page 11 for details) Ownership %
Mining Method
LOM(2)
(years)Saleable Carats
(Mct)Treated Tonnes
(Mt)Recovered Grade
(cpht)
Venetia (OP) Kimberlite 62.9 OP 25 8.9 8.1 109.8
Venetia (UG) Kimberlite UG 71.5 91.7 78.0
Diamond(3) Operations – Debswana(See pages 12 & 13 for details) Ownership %
Mining Method
LOM(2)
(years)Saleable Carats
(Mct)Treated Tonnes
(Mt)Recovered Grade
(cpht)
Damtshaa Kimberlite 42.5 OP 1 0.1 0.2 22.6
Jwaneng Kimberlite 42.5 OP 16 146.3 116.4 125.7
Letlhakane TMR 42.5 n/a 24 6.3 27.3 23.1
Orapa Kimberlite 42.5 OP 16 144.2 110.6 130.3
Diamond(3) Operations – Namdeb(See page 14 for details) Ownership %
Mining Method
LOM(2)
(years)Saleable Carats
(kct)Treated Tonnes
(kt)Recovered Grade
(cpht)
Mining Area 1 Beaches 42.5 OC 2 48 1,037 4.63
Orange River Fluvial Placers 42.5 OC 2 55 5,516 1.00
Saleable Carats(kct)
Area
k (m2)
Recovered Grade
(cpm2)
Atlantic 1 Marine Placers 42.5 MM 34 6,697 112,100 0.06
Copper Operations(See page 16 for details) Ownership %
Mining Method
Reserve Life(2)
(years)Contained Copper
(kt)ROM Tonnes
(Mt)Grade(%TCu)
Collahuasi Sulphide (direct feed) 44.0 OP 68 26,588 2,721.7 0.98
Low Grade Sulphide (incl. stockpile) 6,988 1,454.3 0.48
El Soldado Sulphide 50.1 OP 7 400 52.2 0.77
Los Bronces Sulphide – Flotation 50.1 OP 37 7,334 1,324.4 0.55
Sulphide – Dump Leach 1,403 505.0 0.28
Platinum(4) Operations(See pages 20 & 21 for details) Ownership %
Mining Method
Reserve Life(2)
(years)Contained Metal
(4E Moz)ROM Tonnes
(Mt)Grade
(4E g/t)
Amandelbult Complex MR & UG2 Reefs 78.9 UG >20 16.0 110.8 4.49
Mogalakwena Platreef (incl. stockpiles) 78.9 OP >20 117.2 1,267.9 2.88
Mototolo Complex UG2 Reef 78.9 UG 16 2.9 25.7 3.47
Unki Main Sulphide Zone 78.9 UG 20 5.4 51.0 3.30
Non-Managed MR & UG2 Reefs 45.5 UG n/a 8.1 69.0 3.64
Kumba Iron Ore Operations(See page 25 for details) Ownership %
Mining Method
Reserve Life(2)
(years)Saleable Product
(Mt)Grade
(%Fe)
Kolomela Hematite (incl. ROM stockpile) 53.2 OP 12 150 64.5
Sishen Hematite (incl. ROM stockpile) 53.2 OP 15 430 64.7
Iron Ore Brazil Operations(See page 27 for details) Ownership %
Mining Method
Reserve Life(2)
(years)Saleable Product(5)
(Mt)Grade(5)
(%Fe)
Serra do Sapo Friable Itabirite and Hematite 100 OP 55 612 67.1
Itabirite 867 67.1
Operations = Mines in steady-state or projects in ramp-up phase. TMR = Tailings Mineral Resource. Mining method: OP = Open Pit, UG = Underground, OC = Open Cast/Cut, MM = Marine Mining. Mct = Million carats. Mt = Million tonnes. kct = thousand carats. kt = thousand tonnes. k (m2) = thousand square metres. Diamond Recovered Grade is quoted as carats per hundred metric tonnes (cpht) or as carats per square metre (cpm2). Values reported as 0.0 represent estimates less than 0.05.TCu = Total Copper. 4E is the sum of Platinum, Palladium, Rhodium and Gold.Moz = Million troy ounces. g/t = grams per tonne. ROM = Run of Mine. MR = Merensky Reef.Non-Managed = Kroondal, Modikwa mines and Siphumelele 3 shaft.
06 Anglo American plc Ore Reserves and Mineral Resources Report 2020
Ore Reserves and Mineral Resources

Total Proved and Probable
Coal Operations – Australia(See page 28 for details) Ownership %
Mining Method
Reserve Life(2)
(years)Saleable Tonnes(6)
(Mt)
Saleable Quality
Capcoal (OC)* Metallurgical – Coking 78.6 OC 18 32.2 5.5 CSN Metallurgical – Other 46.5 6,850 kcal/kg Thermal – Export 9.1 5,990 kcal/kg
Capcoal (UG)* Metallurgical – Coking 70.0 UG 1 6.1 8.5 CSN
Dawson Metallurgical – Coking 51.0 OC 17 73.8 7.0 CSN Thermal – Export 63.6 6,680 kcal/kg
Grosvenor Metallurgical – Coking 88.0 UG 17 78.8 8.5 CSN
Moranbah North Metallurgical – Coking 88.0 UG 19 139.1 7.5 CSN
Coal Operations – Colombia(See page 28 for details) Ownership %
Mining Method
Reserve Life(2)
(years)Saleable Tonnes(6)
(Mt)
Saleable Quality
Cerrejón Thermal – Export 33.3 OC 13 345.8 6,210 kcal/kg
Coal Operations – South Africa(See pages 29 & 32 for details) Ownership %
Mining Method
Reserve Life(2)
(years)Saleable Tonnes(6)
(Mt)
Saleable Quality
Goedehoop Thermal – Export 100 UG 5 11.5 6,310 kcal/kg
Goedehoop – MRD Thermal – Domestic n/a 3 6.0 3,020 kcal/kg
Greenside Thermal – Export 100 UG 6 18.1 5,920 kcal/kg
Greenside – MRD Thermal – Export n/a 3 3.0 4,680 kcal/kg
Isibonelo Synfuel 100 OC 6 27.1 4,670 kcal/kg
Landau+ Thermal – Export 100 OC 8 17.4 5,990 kcal/kg
Mafube Thermal – Export 50.0 OC 11 35.9 5,400 kcal/kg
Rietvlei Thermal – Domestic 34.0 OC 3 4.6 5,020 kcal/kg
Zibulo Thermal – Export 73.0 UG&OC 9 27.9 6,500 kcal/kg
Thermal – Domestic 19.3 5,310 kcal/kg
Nickel Operations(See page 35 for details) Ownership %
Mining Method
Reserve Life(2)
(years)Contained Nickel
(kt)ROM Tonnes
(Mt)Grade
(%Ni)
Barro Alto Saprolite 100 OP 20 702 54.7 1.28
Niquelândia Saprolite 100 OP 17 74 5.6 1.32
Samancor Manganese Operations (See page 37 for details) Ownership %
Mining Method
Reserve Life(2)
(years) Tonnes
(Mt)Grade(%Mn)
GEMCO(7) ROM 40.0 OP 5 47 43.4
Sands 5.2 40.0
Mamatwan 29.6 OP 15 48 36.7
Wessels 29.6 UG 45 61 41.2
Operations = Mines in steady-state or projects in ramp-up phase. MRD = Mineral Residue Deposit. Mining method: OP = Open Pit, UG = Underground, OC = Open Cast/Cut. * Capcoal comprises open cast operations at Lake Lindsay and Oak Park, with an underground longwall operation at Grasstree. + Kleinkopje and Landau operate under an integrated management structure, forming Khwezela Colliery.
(1) Estimated Ore Reserves are the sum of Proved and Probable Ore Reserves (on an exclusive basis, i.e. Mineral Resources are reported as additional to Ore Reserves unless stated otherwise). Please refer to the detailed Ore Reserve estimates tables for the individual Proved and Probable Reserve estimates. The Ore Reserve estimates are reported in accordance with the Australasian Code for Reporting of Exploration Results, Mineral Resources and Ore Reserves (The JORC Code, 2012) as a minimum standard. Ore Reserve estimates for operations in South Africa are reported in accordance with The South African Code for the Reporting of Exploration Results, Mineral Resources and Mineral Reserves (The SAMREC Code, 2016), unless stated otherwise. The figures reported represent 100% of the Ore Reserves. Anglo American plc ownership is stated separately. Rounding of figures may cause computational discrepancies.
(2) Reserve Life = The scheduled extraction period in years for the total Ore Reserves in the approved Life of Mine Plan. LOM = Life of Mine (years) is based on scheduled Probable Reserves including some Inferred Resources considered for Life of Mine planning.
(3) DBCi = De Beers Canada, DBCM = De Beers Consolidated Mines, Debswana = Debswana Diamond Company, Namdeb = Namdeb Holdings. Reported Diamond Reserves are based on a Bottom Cut-Off (BCO) which refers to the bottom screen size aperture and varies between 1.00 mm and 3.00 mm (nominal square mesh). Specific BCO’s applied to derive estimates are included in the detailed Diamond Reserve tables.
(4) Details of the individual Managed and Non-Managed operations appear in the Platinum Group Metals section of this report. Ownership percentage for Non-Managed operations is weighted by Contained Metal (4E Moz) contributions from each operation.
(5) Iron Ore Brazil Saleable Product tonnes are reported on a wet basis (average moisture content is 9.5 wt% of the wet mass) with grade stated on a dry basis. (6) Total Saleable Tonnes represents the product tonnes quoted as metric tonnes on a product moisture basis. The coal quality for Coal Reserves is quoted as either kilocalories
per kilogram (kcal/kg) or Crucible Swell Number (CSN). Kilocalories per kilogram represent Calorific Value (CV) on a Gross As Received (GAR) basis. CV is rounded to the nearest 10 kcal/kg and CSN to the nearest 0.5 index. Metallurgical – Coking: High-, medium- or low-volatile semi-soft, soft or hard coking coal primarily for blending and use in the steel industry. Metallurgical – Other: Semi-soft, soft, hard, semi-hard or anthracite coal, other than Coking Coal, such as pulverised coal injection (PCI) or other general metallurgical coal for the export or domestic market with a wider range of properties than Coking Coal. Thermal – Export: Low- to high-volatile thermal coal primarily for export in the use of power generation; quality measured by calorific value (CV). Thermal – Domestic: Low- to high-volatile thermal coal primarily for domestic consumption in power generation. Synfuel: Coal specifically for the domestic production of synthetic fuel and chemicals.
(7) GEMCO Ore Reserve manganese grades are reported as expected product and should be read together with their respective mass yields, ROM: 61%, Sands: 22%.
Anglo American plc Ore Reserves and Mineral Resources Report 2020 07
Ore Reserves and Mineral ResourcesEstimated Ore Reserves continued

Total Measured and Indicated Total Inferred(2)
Diamond(3) Operations – DBCi(See page 10 for details) Ownership %
Mining Method
Carats(Mct)
Tonnes(Mt)
Grade(cpht)
Carats(Mct)
Tonnes(Mt)
Grade(cpht)
Gahcho Kué Kimberlite 43.4 OP 2.4 1.9 127.1 19.4 13.7 142.4
Diamond(3) Operations – DBCM(See page 11 for details) Ownership %
Mining Method
Carats(Mct)
Tonnes(Mt)
Grade(cpht)
Carats(Mct)
Tonnes(Mt)
Grade(cpht)
Venetia (OP) Kimberlite 62.9 OP – – – 1.3 5.4 24.4
Venetia (UG) Kimberlite UG – – – 59.6 69.9 85.3
Voorspoed Kimberlite 62.9 OP 0.5 1.9 26.9 3.5 18.5 19.0
Diamond(3) Operations – Debswana(See pages 12 & 13 for details) Ownership %
Mining Method
Carats(Mct)
Tonnes(Mt)
Grade(cpht)
Carats(Mct)
Tonnes(Mt)
Grade(cpht)
Damtshaa Kimberlite 42.5 OP 5.5 25.4 21.6 4.9 20.1 24.5
Jwaneng Kimberlite 42.5 OP 57.8 70.4 82.1 69.5 83.5 83.2
TMR & ORT n/a – – – 21.6 27.7 78.0
Letlhakane TMR & ORT 42.5 n/a 1.2 0.0 5,413.6 14.8 55.5 26.7
Orapa Kimberlite 42.5 OP 286.5 284.8 100.6 66.4 78.0 85.2
Diamond(3) Operations – Namdeb(See page 14 for details) Ownership %
Mining Method
Carats(kct)
Tonnes (kt)
Grade(cpht)
Carats(kct)
Tonnes (kt)
Grade(cpht)
Mining Area 1 Beaches 42.5 OC 347 37,593 0.92 3,112 193,585 1.61
Orange River Fluvial Placers 42.5 OC 117 27,120 0.43 220 65,537 0.34
Carats
(kct)
Area
k (m2)
Grade
(cpm2) Carats
(kct)
Area
k (m2)
Grade
(cpm2)
Atlantic 1 Marine Placers 42.5 MM 12,295 170,181 0.07 67,633 972,728 0.07
Midwater Marine 42.5 MM 1,192 7,396 0.16 1,031 11,334 0.09
Copper Operations(See page 17 for details) Ownership %
Mining Method
Contained Copper(kt)
Tonnes(Mt)
Grade(%TCu)
Contained Copper(kt)
Tonnes(Mt)
Grade(%TCu)
Collahuasi Oxide and Mixed 44.0 OP 479 68.6 0.70 289 49.8 0.58
Sulphide (direct feed) 8,879 964.9 0.92 26,839 3,012.1 0.89
Low Grade Sulphide (in situ & stockpile) 1,858 395.6 0.47 8,483 1,835.7 0.46
El Soldado Sulphide 50.1 OP 795 140.7 0.56 26 6.7 0.39
Los Bronces Sulphide – Flotation 50.1 OP 11,130 2,494.7 0.45 4,795 1,074.6 0.45
Sulphide – Dump Leach – – – 9 3.7 0.24
Platinum(4) Operations(See pages 22 & 24 for details) Ownership %
Mining Method
Contained Metal (4E Moz)
Tonnes(Mt)
Grade (4E g/t)
Contained Metal (4E Moz)
Tonnes(Mt)
Grade (4E g/t)
Amandelbult Complex MR & UG2 Reefs & Tailings 78.9 UG 54.5 347.3 4.88 23.1 114.7 6.25
Mogalakwena Platreef (incl. stockpiles) 78.9 OP 120.3 1,639.9 2.28 33.7 595.7 1.76
Mototolo Complex MR & UG2 Reefs 78.9 UG 46.0 344.0 4.16 26.8 198.2 4.21
Twickenham MR & UG2 Reefs 78.9 UG 60.7 335.7 5.62 56.0 313.9 5.55
Unki Main Sulphide Zone 78.9 UG 16.3 118.4 4.28 5.0 38.6 4.07
Non-Managed MR & UG2 Reefs 39.0 UG 120.7 687.9 5.45 99.6 602.1 5.14
Kumba Iron Ore Operations(See page 25 for details) Ownership %
Mining Method
Tonnes(Mt)
Grade(%Fe)
Tonnes(Mt)
Grade(%Fe)
Kolomela Hematite (in situ & stockpile) 53.2 OP 113.2 62.6 30.1 63.9
Sishen Hematite (in situ & stockpile) 53.2 OP 530.8 53.7 30.7 51.5
Iron Ore Brazil Operations(See page 27 for details) Ownership %
Mining Method
Tonnes(5)
(Mt)Grade(5)
(%Fe)Tonnes(5)
(Mt)Grade(5)
(%Fe)
Serra do Sapo Friable Itabirite and Hematite 100 OP 239.1 32.9 67.6 36.8
Itabirite 1,415.0 30.9 452.4 30.8
Operations = Mines in steady-state or projects in ramp-up phase. TMR = Tailings Mineral Resource. ORT = Old Recovery Tailings. Mining method: OP = Open Pit, UG = Underground, OC = Open Cast/Cut, MM = Marine Mining. Mct = Million carats. Mt = Million tonnes. kct = thousand carats. kt = thousand tonnes. k (m2) = thousand square metres. Diamond Grade is quoted as carats per hundred metric tonnes (cpht) or as carats per square metre (cpm2). Values reported as 0.0 represent estimates less than 0.05.TCu = Total Copper. 4E is the sum of Platinum, Palladium, Rhodium and Gold.Moz = Million troy ounces. g/t = grams per tonne. MR = Merensky Reef.Non-Managed = Bokoni, Kroondal, Marikana, Modikwa mines and Siphumelele 3 shaft.
08 Anglo American plc Ore Reserves and Mineral Resources Report 2020
Ore Reserves and Mineral Resources
Estimated Mineral Resources(1)
as at 31 December 2020
Detailed Measured, Indicated and Inferred estimates appear on the referenced pages in the Ore Reserves and Mineral Resources Report 2020.

Total Measured and Indicated Total Inferred(2)
Coal Operations – Australia(See page 30 for details) Ownership %
Mining Method
MTIS(6)
(Mt)Coal Quality
(kcal/kg)MTIS(6)
(Mt)Coal Quality
(kcal/kg)
Capcoal (OC)* 78.6 OC 144.8 6,940 175.7 6,810
Capcoal (UG)* 70.0 UG 81.1 6,810 5.6 6,550
Dawson 51.0 OC 757.1 6,710 455.8 6,760
Grosvenor 88.0 UG 248.4 6,470 68.1 6,320
Moranbah North 88.0 UG 138.5 6,680 60.2 6,530
Coal Operations – Colombia(See page 30 for details) Ownership %
Mining Method
MTIS(6)
(Mt)Coal Quality
(kcal/kg)MTIS(6)
(Mt)Coal Quality
(kcal/kg)
Cerrejón 33.3 OC 4,150.3 6,560 601.7 6,360
Coal Operations – South Africa(See pages 31 & 32 for details) Ownership %
Mining Method
MTIS(6)
(Mt)Coal Quality
(kcal/kg)MTIS(6)
(Mt)Coal Quality
(kcal/kg)
Goedehoop 100 UG&OC 218.0 5,230 2.9 5,820
Greenside 100 UG 10.9 5,640 4.5 5,550
Greenside – MRD n/a 3.1 3,860 – –
Isibonelo 100 OC 7.2 4,850 – –
Kleinkopje+ 100 OC 33.8 6,020 0.5 6,190
Kleinkopje – MRD+ n/a 5.9 3,790 – –
Landau+ 100 OC 11.4 5,200 5.6 5,120
Mafube 50.0 OC 63.6 5,020 2.6 5,180
Rietvlei 34.0 OC 30.6 5,070 – –
Zibulo 73.0 UG 405.4 4,920 154.4 4,750
Nickel Operations(See page 35 for details) Ownership %
Mining Method
Contained Nickel(kt)
Tonnes(Mt)
Grade(%Ni)
Contained Nickel(kt)
Tonnes(Mt)
Grade(%Ni)
Barro Alto Saprolite 100 OP 112 9.4 1.19 99 7.9 1.25
Ferruginous Laterite 89 7.0 1.26 49 4.2 1.18
Niquelândia Saprolite 100 OP 51 4.1 1.24 – – –
Ferruginous Laterite – – – 35 3.2 1.10
Samancor Manganese Operations(See page 37 for details) Ownership %
Mining Method
Tonnes(Mt)
Grade(%Mn)
Tonnes(Mt)
Grade(%Mn)
GEMCO(7)(8) ROM 40.0 OP 118 43.7 15 40.9
Sands 6.7 20.8 2.3 20.0
Mamatwan(7) 29.6 OP 77 34.9 0.5 37.4
Wessels(7) 29.6 UG 119 41.8 23 41.0
Operations = Mines in steady-state or projects in ramp-up phase. MRD = Mineral Residue Deposit. Mining method: OP = Open Pit, UG = Underground, OC = Open Cast/Cut. * Capcoal comprises open cast operations at Lake Lindsay and Oak Park, with an underground longwall operation at Grasstree. + Kleinkopje and Landau operate under an integrated management structure, forming Khwezela Colliery.
(1) Estimated Mineral Resources are presented on an exclusive basis, i.e. Mineral Resources are reported as additional to Ore Reserves unless stated otherwise. Please refer to the detailed Mineral Resource estimates tables for the individual Measured, Indicated and Inferred Resource estimates. The Mineral Resource estimates are reported in accordance with the Australasian Code for Reporting of Exploration Results, Mineral Resources and Ore Reserves (The JORC Code, 2012) as a minimum standard. The Mineral Resource estimates for operations in South Africa are reported in accordance with The South African Code for the Reporting of Exploration Results, Mineral Resources and Mineral Reserves (The SAMREC Code, 2016), unless stated otherwise. The figures reported represent 100% of the Mineral Resources. Anglo American plc ownership is stated separately. Rounding of figures may cause computational discrepancies.
(2) Total Inferred is the sum of ‘Inferred (in LOM Plan)’, the Inferred Resources within the scheduled Life of Mine Plan (LOM Plan) and ‘Inferred (ex. LOM Plan)’, the portion of Inferred Resources with reasonable prospects for eventual economic extraction not considered in the Life of Mine Plan (LOM Plan) as relevant. Due to the uncertainty attached to Inferred Mineral Resources, it cannot be assumed that all or part of an Inferred Mineral Resource will necessarily be upgraded to an Indicated or Measured Mineral Resource after continued exploration.
(3) DBCi = De Beers Canada, DBCM = De Beers Consolidated Mines, Debswana = Debswana Diamond Company, Namdeb = Namdeb Holdings. Estimated Diamond Resources are presented on an exclusive basis, i.e. Diamond Resources are quoted as additional to Diamond Reserves. Reported Diamond Resources are based on a Bottom Cut-Off (BCO) which refers to the bottom screen size aperture and varies between 1.00 mm and 3.00 mm (nominal square mesh). Specific BCO’s applied to derive estimates are included in the detailed Diamond Resource tables.
(4) Details of the individual Managed and Non-Managed operations appear in the Platinum Group Metals section of this report. Ownership percentage for Non-Managed is weighted by Contained Metal (4E Moz) contributions from each operation. Merensky Reef, UG2 Reef and Main Sulphide Zone Mineral Resources are estimated over a ‘Resource Cut’ which takes cognisance of the mining method, potential economic viability and geotechnical aspects in the hangingwall or footwall of the reef.
(5) Iron Ore Brazil Mineral Resource tonnes and grade are reported on a dry basis.(6) Coal Resources are quoted on a Mineable Tonnes In Situ (MTIS) basis in million tonnes, which are in addition to those Coal Resources that have been modified to produce the
reported Coal Reserves. Coal Resources are reported on an in situ moisture basis. The coal quality for Coal Resources is quoted on an in situ heat content as kilocalories per kilogram (kcal/kg), representing Calorific Value (CV) on a Gross As Received (GAR) basis. CV is rounded to the nearest 10 kcal/kg.
(7) Manganese Mineral Resources are quoted on an inclusive basis and must not be added to the Ore Reserves.(8) GEMCO ROM Mineral Resource tonnes are stated as in situ, manganese grades are given as per washed ore samples and should be read together with their respective mass
recovery expressed as yield, ROM: 48%. GEMCO Sands Mineral Resource tonnes and manganese grades are as in situ.
Anglo American plc Ore Reserves and Mineral Resources Report 2020 09
Ore Reserves and Mineral ResourcesEstimated Mineral Resources continued

De Beers CanadaThe Diamond Reserve and Diamond Resource estimates are reported in accordance with the Canadian Institute of Mining, Metallurgy and Petroleum (CIM) Definition Standards on Mineral Resources and Mineral Reserves. The reported estimates represent 100% of the Diamond Reserves and Diamond Resources. Diamond Resources are reported as additional to Diamond Reserves. Rounding of figures may cause computational discrepancies. The mines, located in Canada, are operated under De Beers Canada Incorporated (DBCi).
De Beers Canada – OperationsLOM
BCO (mm)
Treated Tonnes Recovered Grade Saleable Carats
Diamond Reserves Ownership % Classification 2020 2019 2020 2019 2020 2019
Gahcho Kué (OP) 43.4 10 1.00 Mt Mt cpht cpht Mct MctKimberlite Proved – – – – – –
Probable 29.2 32.6 155.3 160.2 45.3 52.1Total 29.2 32.6 155.3 160.2 45.3 52.1
De Beers Canada – Operations BCO (mm)
Tonnes Grade Carats
Diamond Resources Ownership % Classification 2020 2019 2020 2019 2020 2019
Gahcho Kué (OP) 43.4 1.00 Mt Mt cpht cpht Mct MctKimberlite Measured – – – – – –
Indicated 1.9 2.2 127.1 125.9 2.4 2.8Measured and Indicated 1.9 2.2 127.1 125.9 2.4 2.8
Inferred (in LOM Plan) 1.1 1.3 154.0 161.9 1.7 2.0Inferred (ex. LOM Plan) 12.6 12.3 141.5 140.7 17.8 17.3
Total Inferred 13.7 13.6 142.4 142.6 19.4 19.4Diamond Resources are reported as additional to Diamond Reserves.
De Beers Canada – Projects BCO (mm)
Tonnes Grade Carats
Diamond Resources Ownership % Classification 2020 2019 2020 2019 2020 2019
Chidliak 85.0 1.18 Mt Mt cpht cpht Mct MctKimberlite Measured – – – – – –
Indicated – – – – – –Measured and Indicated – – – – – –
Inferred 12.5 12.5 178.2 178.2 22.2 22.2Snap Lake (UG) 85.0 1.14 cpht cpht
Kimberlite Measured – – – – – –Indicated 7.7 7.7 197.3 197.3 15.1 15.1
Measured and Indicated 7.7 7.7 197.3 197.3 15.1 15.1Inferred 10.8 10.8 187.2 187.2 20.2 20.2
Diamond Resources are reported as additional to Diamond Reserves.
Mining method: OP = Open Pit, UG = Underground. LOM = Life of Mine (years) is based on scheduled Probable Reserves including some Inferred Resources considered for Life of Mine planning. Reported Diamond Reserves and Resources are based on a Bottom Cut-Off (BCO) which refers to the bottom screen size aperture and varies between 1.00 mm and 3.00 mm (nominal square mesh). Unless stated otherwise, tonnage is quoted as dry metric tonnes. Estimates of Diamond Reserve tonnes reflect the tonnage planned to be treated. Values reported as 0.0 represent estimates less than 0.05. Recovered Grade is quoted as carats per hundred metric tonnes (cpht).
Due to the uncertainty attached to Inferred Diamond Resources, it cannot be assumed that all or part of an Inferred Diamond Resource will necessarily be upgraded to an Indicated or Measured Diamond Resource after continued exploration.
Gahcho Kué is held by an unincorporated Joint Venture between DBCi (51%) and Mountain Province Diamonds Incorporated (49%). Chidliak and Snap Lake are wholly owned by DBCi.
Explanatory notesGahcho Kué: The decrease in Saleable Carats is primarily due to production. Estimates are based on both micro-diamonds (75 micron BCO) and macro-diamonds. The Stockpile Probable Reserves at a 1.00 mm BCO of 0.9 Mct (0.5 Mt at 161.3 cpht) are excluded from the table. Chidliak: The Diamond Resources have been reviewed and continue to be reported per the Peregrine Diamonds Preliminary Economic Assessment. Snap Lake: The mine was placed on care and maintenance at the end of 2015 and allowed to flood in Q1 2017. Closure activities are underway. Estimates are based on both micro-diamonds (150 micron BCO) and macro-diamonds.
Life of mine information
OperationsLOM Plan(years)
LOM PlanFinal Year
Mining LeaseLast Year
% Inferred carats in LOM Plan
DBCi – Gahcho Kué 10 20302023 & 2026* 3%
* Application to renew the Mining Leases will be submitted at the appropriate time. There is a reasonable expectation that such renewal will not be withheld.
Aspects of the Diamond Reserve estimates were reviewed by independent consultants during 2020 at Gahcho Kué.
10 Anglo American plc Ore Reserves and Mineral Resources Report 2020
Ore Reserves and Mineral Resources
Diamondsestimates as at 31 December 2020

De Beers Consolidated MinesThe Diamond Reserve and Diamond Resource estimates are reported in accordance with The South African Code for the Reporting of Exploration Results, Mineral Resources and Mineral Reserves (The SAMREC Code, 2016 Edition). The reported estimates represent 100% of the Diamond Reserves and Diamond Resources. Diamond Resources are reported as additional to Diamond Reserves. Rounding of figures may cause computational discrepancies. The mines, located in South Africa, are operated under De Beers Consolidated Mines Proprietary Limited (DBCM). DBCM is indirectly owned, through DBCM Holdings, by De Beers plc (74%) and its broad-based black economic empowerment partner Ponahalo Investments Proprietary Limited (26%).
Treated Tonnes Recovered Grade Saleable CaratsDe Beers Consolidated Mines – Operations BCO (mm)Diamond Reserves Ownership % LOM Classification 2020 2019 2020 2019 2020 2019
Venetia 62.9 25 1.00 Mt Mt cpht cpht Mct MctKimberlite (OP) Proved – – – – – –
Probable 8.1 9.9 109.8 114.3 8.9 11.3Total 8.1 9.9 109.8 114.3 8.9 11.3
Kimberlite (UG) Proved – – – – – –Life Extension Project Probable 91.7 98.6 78.0 79.7 71.5 78.5
Total 91.7 98.6 78.0 79.7 71.5 78.5
De Beers Consolidated Mines – Operations BCO (mm)
Tonnes Grade Carats
Diamond Resources Ownership % Classification 2020 2019 2020 2019 2020 2019
Venetia 62.9 1.00 Mt Mt cpht cpht Mct MctKimberlite (OP) Measured – – – – – –
Indicated – – – – – –Measured and Indicated – – – – – –
Inferred (in LOM Plan) 2.0 2.1 25.7 24.9 0.5 0.5Inferred (ex. LOM Plan) 3.4 3.4 23.6 23.5 0.8 0.8
Total Inferred 5.4 5.6 24.4 24.0 1.3 1.3Kimberlite (UG) Measured – – – – – –Life Extension Project Indicated – – – – – –
Measured and Indicated – – – – – –Inferred (in LOM Plan) 36.5 36.5 85.2 85.2 31.1 31.1
Inferred (ex. LOM Plan) 33.4 33.4 85.3 85.3 28.5 28.5Total Inferred 69.9 69.9 85.3 85.3 59.6 59.6
Voorspoed (OP) 62.9 1.47 cpht cphtKimberlite Measured – – – – – –
Indicated 1.9 1.9 26.9 26.9 0.5 0.5Measured and Indicated 1.9 1.9 26.9 26.9 0.5 0.5
Inferred 18.5 18.5 19.0 19.0 3.5 3.5
Diamond Resources are reported as additional to Diamond Reserves.
Mining method: OP = Open Pit, UG = Underground. LOM = Life of Mine (years) is based on scheduled Probable Reserves including some Inferred Resources considered for Life of Mine planning. Reported Diamond Reserves and Resources are based on a Bottom Cut-Off (BCO) which refers to the bottom screen size aperture and varies between 1.00 mm and 3.00 mm (nominal square mesh). Unless stated otherwise, tonnage is quoted as dry metric tonnes. Estimates of Diamond Reserve tonnes reflect the tonnage planned to be treated. Values reported as 0.0 represent estimates less than 0.05. Recovered Grade is quoted as carats per hundred metric tonnes (cpht).
Due to the uncertainty attached to Inferred Diamond Resources, it cannot be assumed that all or part of an Inferred Diamond Resource will necessarily be upgraded to an Indicated or Measured Diamond Resource after continued exploration.
Explanatory notesVenetia: The Life of Mine (LOM) is stated as 25 years which reflects the full duration of the current Venetia consolidated OP and UG Life of Mine Plan. The current Mining Right expires in 2038. Venetia Mine will apply to extend the Mining Right at the appropriate time in the future. Drilling and sampling for both the OP and the UG is underway.Venetia (OP): The decrease in Saleable Carats is due to production and an inward shift of the modelled pipe boundary which is largely offset by a change in the pit design. The resource estimates remain unchanged but will be updated on completion of the drilling and sampling campaign. The LOM Plan includes the K01, K02 and K03 pipes. The estimates are based on both micro-diamonds (104 micron BCO) and macro-diamonds. The Stockpile Probable Reserves at a 1.00 mm BCO of 1.2 Mct (1.0 Mt at 112.1 cpht) are excluded from the table. Venetia (UG): The project is expected to treat approximately 131 Mt of material containing an estimated 95 Mct. Scheduled Inferred Resources (39.3 Mt) constitute 25% (23.6 Mct) of the estimated carats. The decrease in Saleable Carats is primarily due to revision of the OP mine design and optimisation of the UG draw strategy to accommodate the updated waste ingress curve. Drilling and sampling to support the first five years of the underground project is underway. The resource estimates remain unchanged but will be updated on completion of the drilling and sampling campaign.Voorspoed: Production ceased in Q4 2018 and mine closure processes are underway. Economic assumptions will be re-assessed in 2021.
Life of mine information
OperationsLOM Plan(years)
LOM PlanFinal Year
Mining RightLast Year
% Inferred carats in LOM Plan
DBCM – Venetia 25 2045 2038* 22%+
* Application to renew the Mining Right will be submitted at the appropriate time. There is a reasonable expectation that such renewal will not be withheld.
+ The current Venetia LOM Plan contains 2% low geoscientific confidence material which has not been classified as Diamond Resource.
Aspects of the Diamond Reserve and Diamond Resource estimates were reviewed by independent consultants during 2020 at Venetia.
Anglo American plc Ore Reserves and Mineral Resources Report 2020 11
Ore Reserves and Mineral ResourcesDiamonds continued

Debswana Diamond CompanyThe Diamond Reserve and Diamond Resource estimates are reported in accordance with The South African Code for the Reporting of Exploration Results, Mineral Resources and Mineral Reserves (The SAMREC Code, 2016 Edition). The reported estimates represent 100% of the Diamond Reserves and Diamond Resources. Diamond Resources are reported as additional to Diamond Reserves. Rounding of figures may cause computational discrepancies. In Botswana the mines are owned in equal share by De Beers plc and the Government of the Republic of Botswana through the Debswana Diamond Company joint venture. Two resource types are processed, Kimberlite (mined from in situ material) and Tailings Mineral Resource (TMR).
Debswana – Operations LOM
BCO (mm)
Treated Tonnes Recovered Grade Saleable Carats
Classification 2020 2019 2020 2019 2020 2019Diamond Reserves Ownership %
Damtshaa (OP) 42.5 1 1.65 Mt Mt cpht cpht Mct MctKimberlite Proved – – – – – –
Probable 0.2 23.2 22.6 18.0 0.1 4.2Total 0.2 23.2 22.6 18.0 0.1 4.2
Jwaneng (OP) 42.5 16 1.47 cpht cphtKimberlite Proved – – – – – –
Probable 116.4 120.9 125.7 126.1 146.3 152.4Total 116.4 120.9 125.7 126.1 146.3 152.4
Orapa (OP) 42.5 16 1.65 cpht cphtKimberlite Proved – – – – – –
Probable 110.6 121.9 130.3 112.2 144.2 136.8Total 110.6 121.9 130.3 112.2 144.2 136.8
Debswana – Operations BCO (mm)
Tonnes Grade Carats
Diamond Resources Ownership % Classification 2020 2019 2020 2019 2020 2019
Damtshaa (OP) 42.5 1.65 Mt Mt cpht cpht Mct MctKimberlite Measured – – – – – –
Indicated 25.4 3.7 21.6 22.7 5.5 0.8Measured and Indicated 25.4 3.7 21.6 22.7 5.5 0.8
Inferred (in LOM Plan) – 7.7 – 24.8 – 1.9Inferred (ex. LOM Plan) 20.1 14.3 24.5 23.9 4.9 3.4
Total Inferred 20.1 22.0 24.5 24.2 4.9 5.3Jwaneng (OP) 42.5 1.47 cpht cpht
Kimberlite Measured – – – – – –Indicated 70.4 70.4 82.1 82.1 57.8 57.8
Measured and Indicated 70.4 70.4 82.1 82.1 57.8 57.8Inferred (in LOM Plan) 3.3 0.0 101.0 50.0 3.3 0.0
Inferred (ex. LOM Plan) 80.2 74.2 82.5 85.0 66.2 63.1Total Inferred 83.5 74.2 83.2 85.0 69.5 63.1
Orapa (OP) 42.5 1.65 cpht cphtKimberlite Measured – – – – – –
Indicated 284.8 285.9 100.6 100.3 286.5 286.7Measured and Indicated 284.8 285.9 100.6 100.3 286.5 286.7
Inferred (in LOM Plan) – – – – – –Inferred (ex. LOM Plan) 78.0 77.7 85.2 85.2 66.4 66.2
Total Inferred 78.0 77.7 85.2 85.2 66.4 66.2
Diamond Resources are reported as additional to Diamond Reserves.
Debswana – Projects BCO (mm)
Tonnes Grade Carats
Diamond Resources Ownership % Classification 2020 2019 2020 2019 2020 2019
Letlhakane 42.5 1.65 Mt Mt cpht cpht Mct MctKimberlite Measured – – – – – –
Indicated 22.3 22.3 31.7 31.7 7.1 7.1Measured and Indicated 22.3 22.3 31.7 31.7 7.1 7.1
Inferred 18.7 18.7 27.8 27.8 5.2 5.2
Mining method: OP = Open Pit, UG = Underground. LOM = Life of Mine (years) is based on scheduled Probable Reserves including some Inferred Resources considered for Life of Mine planning. Reported Diamond Reserves and Resources are based on a Bottom Cut-Off (BCO) which refers to the bottom screen size aperture and varies between 1.00 mm and 3.00 mm (nominal square mesh). Unless stated otherwise, tonnage is quoted as dry metric tonnes. Estimates of Diamond Reserve tonnes reflect the tonnage planned to be treated. Values reported as 0.0 represent estimates less than 0.05. Recovered Grade is quoted as carats per hundred metric tonnes (cpht).
Due to the uncertainty attached to Inferred Diamond Resources, it cannot be assumed that all or part of an Inferred Diamond Resource will necessarily be upgraded to an Indicated or Measured Diamond Resource after continued exploration.
12 Anglo American plc Ore Reserves and Mineral Resources Report 2020
Ore Reserves and Mineral ResourcesDiamonds continued

Debswana – Operations LOM
BCO (mm)
Treated Tonnes Recovered Grade Saleable Carats
Classification 2020 2019 2020 2019 2020 2019Diamond Reserves Ownership %
Letlhakane 42.5 24 1.15 Mt Mt cpht cpht Mct MctTMR Proved – – – – – –
Probable 27.3 29.2 23.1 22.5 6.3 6.6Total 27.3 29.2 23.1 22.5 6.3 6.6
Debswana – Operations BCO (mm)
Tonnes Grade Carats
Diamond Resources Ownership % Classification 2020 2019 2020 2019 2020 2019
Jwaneng 42.5 1.47 Mt Mt cpht cpht Mct MctTMR & ORT Measured – – – – – –
Indicated – – – – – –Measured and Indicated – – – – – –
Inferred (in LOM Plan) 27.6 29.6 46.0 46.0 12.7 13.6Inferred (ex. LOM Plan) 0.1 0.1 8,342.1 8,342.1 8.9 8.9
Total Inferred 27.7 29.7 78.0 76.0 21.6 22.5Letlhakane 42.5 1.15 cpht cpht
TMR & ORT Measured – – – – – –Indicated 0.0 0.0 5,413.6 5,442.1 1.2 1.0
Measured and Indicated 0.0 0.0 5,413.6 5,442.1 1.2 1.0Inferred (in LOM Plan) 55.5 48.3 26.7 27.1 14.8 13.1
Inferred (ex. LOM Plan) – 7.7 – 23.6 – 1.8Total Inferred 55.5 56.0 26.7 26.6 14.8 14.9
Debswana – Projects BCO (mm)
Tonnes Grade Carats
Diamond Resources Ownership % Classification 2020 2019 2020 2019 2020 2019
Orapa 42.5 1.15 Mt Mt cpht cpht Mct MctTMR & ORT Measured – – – – – –
Indicated 189.3 189.3 67.7 68.0 128.1 128.8Measured and Indicated 189.3 189.3 67.7 68.0 128.1 128.8
Inferred (in LOM Plan) – – – – – –Inferred (ex. LOM Plan) – – – – – –
Total Inferred – – – – – –
Diamond Resources are reported as additional to Diamond Reserves. LOM = Life of Mine (years) is based on scheduled Probable Reserves including some Inferred Resources considered for Life of Mine planning. Reported Diamond Reserves and Resources are based on a Bottom Cut-Off (BCO) which refers to the bottom screen size aperture and varies between 1.00 mm and 3.00 mm (nominal square mesh). Unless stated otherwise, tonnage is quoted as dry metric tonnes. Estimates of Diamond Reserve tonnes reflect the tonnage planned to be treated. Values reported as 0.0 represent estimates less than 0.05. Recovered Grade is quoted as carats per hundred metric tonnes (cpht).
Due to the uncertainty attached to Inferred Diamond Resources, it cannot be assumed that all or part of an Inferred Diamond Resource will necessarily be upgraded to an Indicated or Measured Diamond Resource after continued exploration.
Explanatory notesDamtshaa: In response to market conditions, a decision was made to place the mine on extended Care and Maintenance at the end of Q1 2021, resulting in reallocation of Diamond Reserve to Diamond Resource. The Stockpile Probable Reserves at a 1.65 mm BCO of 0.0 Mct (0.05 Mt at 27.7 cpht) are excluded from the table. The BK/9 and BK/12 Stockpile Resource estimates at a 1.65 mm BCO of 0.0 Mct (0.05 Mt at 28.9 cpht) Indicated and 0.2 Mct (2.0 Mt at 9.0 cpht) Inferred (ex. LOM Plan) are excluded from the table.Jwaneng – Kimberlite: The decrease in Saleable Carats is primarily due to production and re-classification of blocks along the margins of the pipe. The estimates are based on both micro-diamonds (104 micron BCO) and macro-diamonds. The Life of Mine Plan approved in 2020 includes the Cut-8 estimates of 66 Mt of material to be treated containing an estimated 80 Mct and the Cut-9 estimates of 42 Mt of material to be treated containing an estimated 51 Mct. The Stockpile Probable Reserves at a 1.47 mm BCO of 1.2 Mct (1.0 Mt at 118.3 cpht) are excluded from the table. The DK/2 Stockpile Resource estimates at a 1.47 mm BCO of 7.5 Mct (16.0 Mt at 46.9 cpht) Inferred (in LOM Plan) and 0.4 Mct (0.7 Mt at 62.4 cpht) Inferred (ex. LOM Plan) are excluded from the table.Jwaneng – TMR & ORT: The Jwaneng Tailings Mineral Resource (TMR) is reported as Inferred (in LOM Plan) and Old Recovery Tailings (ORT) is reported as Inferred (ex. LOM Plan).Letlhakane – Kimberlite: Open pit operations remain dormant as planned. The remaining Diamond Resources are reported as a project for potential underground mining. DK/1 and DK/2 Stockpile Resource estimates at a 1.65 mm BCO of 0.2 Mct (1.3 Mt at 13.8 cpht) Inferred (ex. LOM Plan) are excluded from the table. Letlhakane – TMR & ORT: The decrease in Saleable Carats is due to production. The ORT Probable Reserves at a 1.15 mm BCO of 0.2 Mct (0.0 Mt at 5,400.0 cpht) are excluded from the table. The Letlhakane Tailings Mineral Resource (TMR) is reported as Inferred (in LOM Plan) and Old Recovery Tailings (ORT) is reported as Indicated.
Orapa – Kimberlite: The increase in Saleable Carats is due to closure of Plant 1 and treatment of all material through the more efficient Plant 2. The estimates are based on both micro-diamonds (104 micron BCO) and macro-diamonds. The Stockpile Probable Reserves at a 1.65 mm BCO of 0.9 Mct (1.0 Mt at 92.7 cpht) are excluded from the table. The AK/1 Stockpile Resource estimates at a 1.65 mm BCO of 15.7 Mct (41.0 Mt at 38.3 cpht) Inferred (in LOM Plan) are excluded from the table. Orapa – TMR & ORT: The ORT Probable Reserves at a 1.15 mm BCO of 0.3 Mct (0.0 Mt at 30,000.0 cpht) are excluded from the table. The Orapa TMR and ORT Diamond Resources estimates are combined in the tables: TMR estimates: 1.15 mm BCO: 113.4 Mct (189.2 Mt at 59.9 cpht) Indicated Resources. ORT estimates: 1.15 mm BCO: 14.7 Mct (0.1 Mt at 23,753.2 cpht) Indicated Resources.
Life of mine information
OperationsLOM Plan(years)
LOM PlanFinal Year
Mining RightLast Year
% Inferred carats in LOM Plan
Debswana – Damtshaa 1 2021 2029 –
Debswana – Jwaneng 16 2036 2029* 13%
Debswana – Letlhakane (TMR) 24 2044 2029* 69%
Debswana – Orapa 16 2036 2029* 9%
* Application to renew the Mining Right will be submitted at the appropriate time. There is a reasonable expectation that such renewal will not be withheld.
Aspects of the Diamond Reserve and Diamond Resource estimates were reviewed by independent consultants during 2020 at Damtshaa, Letlhakane and Orapa. Aspects of the Diamond Reserve estimates were reviewed by independent consultants during 2020 at Jwaneng.
Anglo American plc Ore Reserves and Mineral Resources Report 2020 13
Ore Reserves and Mineral ResourcesDiamonds continued

Namdeb HoldingsThe Diamond Reserve and Diamond Resource estimates are reported in accordance with The South African Code for the Reporting of Exploration Results, Mineral Resources and Mineral Reserves (The SAMREC Code, 2016 Edition). The reported estimates represent 100% of the Diamond Reserves and Diamond Resources. Diamond Resources are reported as additional to Diamond Reserves. Rounding of figures may cause computational discrepancies. As of 1 October 2011 Namdeb Holdings (Pty) Ltd (NDBH), a 50/50 joint venture between De Beers plc and the Government of the Republic of Namibia, holds the licences for both the land and sea operations. In addition, NDBH holds 100% ownership of the operating companies, Namdeb Diamond Corporation (Pty) Ltd and De Beers Marine Namibia (Pty) Ltd.
Namdeb Holdings – Terrestrial Operations BCO (mm)
Treated Tonnes Recovered Grade Saleable Carats
Diamond Reserves Ownership % LOM Classification 2020 2019 2020 2019 2020 2019
Mining Area 1 (OC) 42.5 2 2.00 kt kt cpht cpht kct kctBeaches Proved – – – – – –
Probable 1,037 818 4.63 5.38 48 44Total 1,037 818 4.63 5.38 48 44
Orange River (OC) 42.5 2 3.00 cpht cphtFluvial Placers Proved – – – – – –
Probable 5,516 7,180 1.00 1.20 55 86Total 5,516 7,180 1.00 1.20 55 86
Namdeb Holdings – Offshore Operations BCO (mm)
Area Recovered Grade Saleable Carats
Diamond Reserves Ownership % LOM Classification 2020 2019 2020 2019 2020 2019
Atlantic 1 (MM) 42.5 34 1.47 k (m2) k (m2) cpm2 cpm2 kct kctMarine Placers Proved – – – – – –
Probable 112,100 107,792 0.06 0.06 6,697 6,209Total 112,100 107,792 0.06 0.06 6,697 6,209
Namdeb Holdings – Terrestrial Operations BCO (mm)
Tonnes Grade Carats
Diamond Resources Ownership % Classification 2020 2019 2020 2019 2020 2019
Mining Area 1 (OC) 42.5 2.00 kt kt cpht cpht kct kctBeaches Measured – – – – – –
Indicated 37,593 38,196 0.92 0.75 347 287Measured and Indicated 37,593 38,196 0.92 0.75 347 287
Inferred (in LOM Plan) 8,729 7,292 5.17 8.24 451 601Inferred (ex. LOM Plan) 184,856 187,532 1.44 1.32 2,661 2,481
Total Inferred 193,585 194,824 1.61 1.58 3,112 3,082Orange River (OC) 42.5 3.00 cpht cpht
Fluvial Placers Measured – – – – – –Indicated 27,120 27,898 0.43 0.42 117 117
Measured and Indicated 27,120 27,898 0.43 0.42 117 117Inferred (in LOM Plan) 6,420 3,195 0.64 1.00 41 32
Inferred (ex. LOM Plan) 59,117 62,424 0.30 0.31 179 195Total Inferred 65,537 65,619 0.34 0.35 220 227
Namdeb Holdings – Offshore Operations BCO (mm)
Area Grade Carats
Diamond Resources Ownership % Classification 2020 2019 2020 2019 2020 2019
Atlantic 1 (MM) 42.5 1.47 k (m2) k (m2) cpm2 cpm2 kct kctMarine Placers Measured – – – – – –
Indicated 170,181 133,579 0.07 0.08 12,295 11,127Measured and Indicated 170,181 133,579 0.07 0.08 12,295 11,127
Inferred (in LOM Plan) 382,428 395,690 0.09 0.09 35,138 35,589Inferred (ex. LOM Plan) 590,300 599,306 0.06 0.06 32,495 34,041
Total Inferred 972,728 994,996 0.07 0.07 67,633 69,630Midwater (MM) 42.5 2.00 cpm2 cpm2
Marine Measured – – – – – –Indicated 7,396 7,396 0.16 0.16 1,192 1,192
Measured and Indicated 7,396 7,396 0.16 0.16 1,192 1,192Inferred 11,334 11,334 0.09 0.09 1,031 1,031
Diamond Resources are reported as additional to Diamond Reserves.
Mining method: OC = Open Cast, MM = Marine Mining. LOM = Life of Mine (years) is based on scheduled Probable Reserves including some Inferred Resources considered for Life of Mine planning. Reported Diamond Reserves and Resources are based on a Bottom Cut-Off (BCO) which refers to the bottom screen size aperture and varies between 1.00 mm and 3.00 mm (nominal square mesh). Unless stated otherwise, tonnage is quoted as dry metric tonnes. Estimates of Diamond Reserve tonnes reflect the tonnage planned to be treated. Values reported as 0.0 represent estimates less than 0.05. Recovered Grade is quoted as carats per hundred metric tonnes (cpht) or as carats per square metre (cpm2). Area estimates are quoted in k (m2) = thousand square metres.
Due to the uncertainty attached to Inferred Diamond Resources, it cannot be assumed that all or part of an Inferred Diamond Resource will necessarily be upgraded to an Indicated or Measured Diamond Resource after continued exploration.
Namdeb Land consists of Midwater, Mining Area 1 and Orange River. Orange River consists of the Auchas, Daberas, Obib and Sendelingsdrif operations. Namdeb Marine (Debmarine Namibia) consists of Atlantic 1.
The Elizabeth Bay and Douglas Bay operations and associated marine assets have been sold, and are therefore no longer reported.
14 Anglo American plc Ore Reserves and Mineral Resources Report 2020
Ore Reserves and Mineral ResourcesDiamonds continued

The mv SS Nujoma, Debmarine Namibia’s exploration and resource development sampling vessel.
Explanatory notesMining Area 1: The increase in Saleable Carats is due to a revision of estimates based on a revised geological model. The Life of Mine includes a material portion of scheduled tonnes with low geoscientific confidence, which will be continuously evaluated and upgraded to Inferred Resources wherever possible. Incremental Inferred Resource development is dependent on beach accretion access for drilling and sampling. Beach accretion is a process through which an existing beach is built seaward to allow mining to extend into areas previously under water. The Overburden Stockpile Resource estimates at a 2.00 mm BCO of 15 kct (4,420 kt at 0.34 cpht) Inferred (ex. LOM Plan) and the DMS and Recovery Tailings Resource estimates at a 2.00 mm BCO of 448 kct (40,089 kt at 1.12 cpht) Inferred (ex. LOM Plan) are excluded from the table.Orange River: The decrease in Saleable Carats is primarily due to production. Atlantic 1: The increase in Saleable Carats is due to resource additions from new sampling information and revised economic assumptions, which increases the Life of Mine. The Life of Mine Plan includes a material proportion of Inferred Resources.Bogenfels: The operation remains on care and maintenance. Inferred Resource estimates are as follows: Deflation deposits: 1.40 mm BCO: 524 kct (7,913 kt at 6.62 cpht) Inferred. Pocket beaches: 2.00 mm BCO: 228 kct (3,042 kt at 7.50 cpht) Inferred.Midwater: Production from Midwater ceased in 2018. The Midwater Resource comprises the offshore portion of the Diamond Area No. 1 (DA1) Mining Licences 43 and 44, as well as the offshore licence ML 128C, at water depths greater than 30 m.
Life of mine information
OperationsLOM Plan(years)
LOM PlanFinal Year
Mining LicenceLast Year
% Inferred carats in LOM Plan
Namdeb Holdings Terrestrial – Mining Area 1* 2 2022 2035 80%+
Namdeb Holdings Terrestrial – Orange River* 2 2022 2035 43%
Namdeb Holdings Offshore – Atlantic 1 34 2054 2035++ 80%+++
* Mining Area 1 and Orange River operate under an integrated management structure.+ The current Mining Area 1 LOM Plan contains 11% low geoscientific confidence material
which has not been classified as Diamond Resource.++ Application to renew the Mining Right will be submitted at the appropriate time. There
is a reasonable expectation that such renewal will not be withheld.+++ Due to the high costs associated with resource development and the large size of the
Atlantic 1 licence, only a small portion of the Indicated Resources are converted to Diamond Reserves.
Aspects of the Diamond Reserve estimates were reviewed by independent consultants during 2020 at the Offshore operations. Aspects of the Diamond Resource estimates were reviewed by independent consultants during 2020 at the Terrestrial and Offshore operations.
Anglo American plc Ore Reserves and Mineral Resources Report 2020 15
Ore Reserves and Mineral ResourcesDiamonds continued

CopperThe Ore Reserve and Mineral Resource estimates are reported in accordance with the Australasian Code for Reporting of Exploration Results, Mineral Resources and Ore Reserves (The JORC Code, 2012) as a minimum standard. The reported estimates represent 100% of the Ore Reserves and Mineral Resources. Rounding of figures may cause computational discrepancies for totals.
Copper – Operations Ore Reserves
ReserveLife
ROM Tonnes Grade Contained Metal
Ownership % Classification 2020 2019 2020 2019 2020 2019
Collahuasi (OP) 44.0 68 Mt Mt %TCu %TCu kt ktSulphide Proved 477.0 466.3 1.04 1.06 4,961 4,942Flotation Copper Probable 2,244.7 2,168.2 0.96 0.96 21,627 20,766(direct feed) Total 2,721.7 2,634.5 0.98 0.98 26,588 25,708
%Mo %MoProved 0.021 0.021 100 98
Molybdenum Probable 0.029 0.027 646 585Total 0.027 0.026 746 683
%TCu %TCuLow Grade Sulphide Proved 15.4 20.0 0.34 0.59 52 118Flotation Copper Probable 1,150.6 130.0 0.46 0.56 5,321 723
Total 1,166.0 149.9 0.46 0.56 5,373 841%Mo %Mo
Proved 0.006 0.013 1 3Molybdenum Probable 0.011 0.012 129 15
Total 0.011 0.012 130 18%TCu %TCu
Low Grade Sulphide Proved – – – – – –Flotation Stockpile Copper Probable 288.4 270.7 0.56 0.57 1,615 1,543
Total 288.4 270.7 0.56 0.57 1,615 1,543%Mo %Mo
Proved – – – –Molybdenum Probable 0.013 0.013 37 35
Total 0.013 0.013 37 35El Soldado (OP) 50.1 7 %TCu %TCu
Sulphide Proved 21.8 30.4 0.86 0.90 188 273Flotation Probable 30.4 28.8 0.70 0.66 212 189
Total 52.2 59.2 0.77 0.78 400 462Los Bronces (OP) 50.1 37 %TCu %TCu
Sulphide Proved 724.1 797.8 0.59 0.60 4,272 4,787Flotation Copper Probable 600.3 567.5 0.51 0.50 3,062 2,838
Total 1,324.4 1,365.3 0.55 0.56 7,334 7,624%Mo %Mo
Proved 0.015 0.015 109 120Molybdenum Probable 0.014 0.015 84 85
Total 0.015 0.015 193 205%TCu %TCu
Sulphide Proved 406.9 501.4 0.27 0.27 1,099 1,354Dump Leach Probable 98.1 129.5 0.31 0.30 304 388
Total 505.0 630.9 0.28 0.28 1,403 1,742
Mining method: OP = Open Pit. Reserve Life = The scheduled extraction period in years for the total Ore Reserves in the approved Life of Mine Plan. TCu = Total Copper.
El Soldado and Los Bronces are operated by Anglo American Sur S.A. Its shareholders are Anglo American through Inversiones Anglo American Sur S.A. and Anglo American Clarent (UK) Ltd; Mitsubishi, through MC Resource Development Ltd. and Codelco and Mitsui, through Inversiones Mineras Becrux SpA.
Explanatory notesCopper Reserves: Ore Reserves are quoted above the following cut-off grades (%TCu): Collahuasi – 0.3%, El Soldado – 0.2%, Los Bronces (Flotation) – 0.2%, Los Bronces (Dump Leach) – 0.15%. Collahuasi – Flotation: Ore Reserves increase slightly, primarily due to conversion of Mineral Resources to Ore Reserves.Collahuasi – Low Grade Sulphide: Ore Reserves increase due to conversion of Mineral Resources to Ore Reserves based on the approval of additional tailings storage capacity. This results in an increase in Reserve Life. El Soldado: Ore Reserves decrease primarily due to production and the reallocation of Ore Reserves to Mineral Resources enabled by an updated pit design related to tailings storage capacity. The current approved Life of Mine Plan is based on extension of the current Environmental Permit to 2027. There is a reasonable expectation that this permit will be extended. Estimates include mineralised void-fill material from the collapse of previously mined underground stope volumes of ~77 kt Cu (8.3 Mt at 0.92 %TCu) Probable Ore Reserves. Los Bronces – Flotation: Ore Reserves decrease slightly, primarily due to production. Los Bronces – Dump Leach: Ore Reserves decrease primarily due to the incorporation of new information from drilling and production. Los Bronces – Ore Reserves: Estimates exclude Flotation material containing ~426 kt Cu (67.6 Mt at 0.63 %TCu) and Dump Leach material containing ~128 kt Cu (51.3 Mt at 0.25 %TCu) within the Andina exploitation concession area that is incorporated into the Los Bronces Life of Mine Plan as per agreements between Anglo American Sur S.A. and Codelco’s División Andina.
Mineral TenureLos Bronces: The pit design is in accordance with the limits approved in the EIA-LBDP (RCA N° 3159/2007) and permit (DIA Fase 7, RCA N°498/2015) obtained in late 2015. However, six pit development phases fall outside the Environmental Permits and approach environmentally sensitive areas. The updated pit design is consistent with the principles applied in previous Ore Reserve Statements. There is reasonable expectation that the Ore Reserves within these phases will be permitted and extracted, following permit application processes commencing in 2023.
Audits related to the generation of the Ore Reserve estimates were carried out by independent consultants at Los Bronces.
16 Anglo American plc Ore Reserves and Mineral Resources Report 2020
Ore Reserves and Mineral Resources
Copper estimates as at 31 December 2020

Copper – Operations Mineral Resources
Tonnes Grade Contained Metal
Ownership % Classification 2020 2019 2020 2019 2020 2019
Collahuasi (OP) 44.0 Mt Mt %TCu %TCu kt ktOxide and Mixed Measured 36.3 37.1 0.66 0.67 240 249Leach Indicated 32.3 32.9 0.74 0.73 239 240
Measured and Indicated 68.6 70.0 0.70 0.70 479 489Inferred (in LOM Plan) – – – – – –
Inferred (ex. LOM Plan) 49.8 50.6 0.58 0.57 289 289Total Inferred 49.8 50.6 0.58 0.57 289 289
%TCu %TCuSulphide Measured 1.6 26.6 1.07 0.61 17 162Flotation Indicated 963.2 930.9 0.92 0.97 8,862 9,030(direct feed) Copper Measured and Indicated 964.9 957.6 0.92 0.96 8,879 9,193
Inferred (in LOM Plan) 553.6 613.6 0.94 0.91 5,204 5,584Inferred (ex. LOM Plan) 2,458.5 2,411.0 0.88 0.88 21,634 21,217
Total Inferred 3,012.1 3,024.7 0.89 0.89 26,839 26,801%Mo %Mo
Measured 0.010 0.028 0 7Indicated 0.033 0.037 318 344
Molybdenum Measured and Indicated 0.033 0.037 318 352Inferred (in LOM Plan) 0.016 0.017 89 104
Inferred (ex. LOM Plan) 0.022 0.023 541 555Total Inferred 0.021 0.022 629 659
%TCu %TCuLow Grade Sulphide Measured 8.2 266.8 0.46 0.46 38 1,227Flotation Indicated 387.4 1,041.9 0.47 0.45 1,821 4,689(in situ & stockpile) Copper Measured and Indicated 395.6 1,308.7 0.47 0.45 1,858 5,917
Inferred (in LOM Plan) 362.5 117.6 0.43 0.53 1,559 624Inferred (ex. LOM Plan) 1,473.2 1,612.3 0.47 0.46 6,924 7,416
Total Inferred 1,835.7 1,729.9 0.46 0.46 8,483 8,040%Mo %Mo
Measured 0.013 0.011 1 29Indicated 0.015 0.011 58 115
Molybdenum Measured and Indicated 0.015 0.011 59 144Inferred (in LOM Plan) 0.004 0.006 15 7
Inferred (ex. LOM Plan) 0.012 0.010 177 161Total Inferred 0.010 0.010 191 168
El Soldado (OP) 50.1 %TCu %TCuSulphide Measured 108.1 99.4 0.60 0.60 649 597Flotation Indicated 32.6 36.9 0.45 0.44 146 161
Measured and Indicated 140.7 136.4 0.56 0.56 795 758Inferred (in LOM Plan) 1.0 1.0 0.43 0.43 4 4
Inferred (ex. LOM Plan) 5.7 6.0 0.38 0.38 22 23Total Inferred 6.7 7.0 0.39 0.39 26 27
Los Bronces (OP) 50.1 %TCu %TCuSulphide Measured 966.7 967.8 0.44 0.43 4,254 4,162Flotation Indicated 1,528.0 1,350.3 0.45 0.45 6,876 6,076
Copper Measured and Indicated 2,494.7 2,318.1 0.45 0.44 11,130 10,238Inferred (in LOM Plan) 132.7 121.7 0.49 0.49 650 597
Inferred (ex. LOM Plan) 941.9 1,110.9 0.44 0.44 4,144 4,888Total Inferred 1,074.6 1,232.6 0.45 0.44 4,795 5,484
%Mo %MoMeasured 0.008 0.008 77 77Indicated 0.009 0.009 138 122
Molybdenum Measured and Indicated 0.009 0.009 215 199Inferred (in LOM Plan) 0.013 0.013 17 16
Inferred (ex. LOM Plan) 0.011 0.012 104 133Total Inferred 0.011 0.012 121 149
%TCu %TCuSulphide Measured – – – – – –Dump Leach Indicated – – – – – –
Measured and Indicated – – – – – –Inferred (in LOM Plan) 3.7 6.8 0.24 0.25 9 17
Inferred (ex. LOM Plan) – – – – – –Total Inferred 3.7 6.8 0.24 0.25 9 17
Mineral Resources are reported as additional to Ore Reserves.
Mining method: OP = Open Pit. TCu = Total Copper.
Due to the uncertainty attached to Inferred Mineral Resources, it cannot be assumed that all or part of an Inferred Mineral Resource will necessarily be upgraded to an Indicated or Measured Resource after continued exploration.
Explanatory notesCopper Resources: An optimised pit shell is used as the basis for the test of reasonable prospects for eventual economic extraction. Mineralised material outside the optimised pit shell is not included in the Mineral Resource statement. Mineral Resources are quoted above the following cut-off grades (%TCu): Collahuasi – 0.3%, El Soldado – 0.2%, Los Bronces (Flotation) – 0.2%, Los Bronces (Dump Leach) – 0.15%. Collahuasi – Low Grade Sulphide: Mineral Resources decrease due to conversion of Mineral Resources to Ore Reserves based on the approval of additional tailings storage capacity. This is partially offset by additional information from new drilling.
El Soldado: Estimates include mineralised void-fill material from the collapse of previously mined underground stope volumes of ~9 kt Cu (0.8 Mt at 1.11 %TCu) classified as Indicated Resources.Potential underground Mineral Resources of ~40 kt Cu (4.6 Mt at 0.87 %TCu) are excluded from the 2020 estimate.Los Bronces – Sulphide (Flotation): Estimates include material containing ~185 kt Cu (58.7 Mt at 0.31 %TCu) within the Los Bronces exploitation concession area scheduled to be mined by Codelco’s División Andina.Los Bronces – Dump Leach: Mineral Resources decrease primarily due to additional information from new drilling.
Anglo American plc Ore Reserves and Mineral Resources Report 2020 17
Ore Reserves and Mineral ResourcesCopper continued
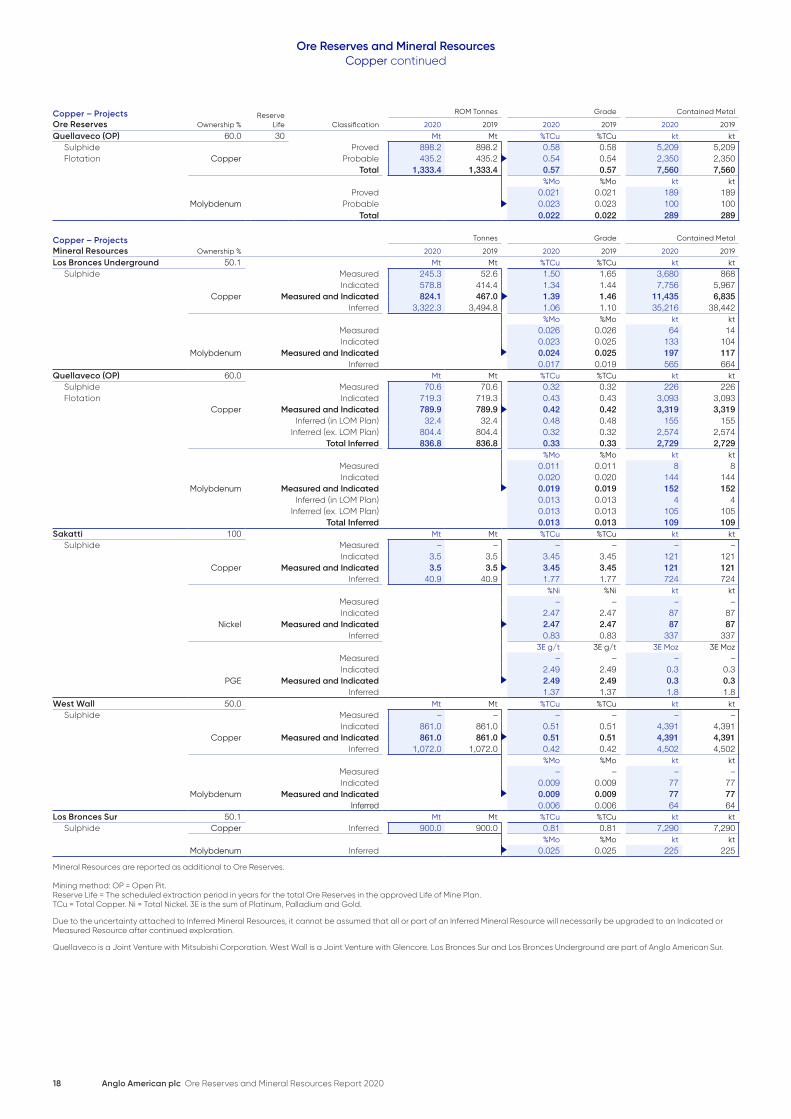
Copper – Projects Ore Reserves
ReserveLife
ROM Tonnes Grade Contained Metal
Ownership % Classification 2020 2019 2020 2019 2020 2019
Quellaveco (OP) 60.0 30 Mt Mt %TCu %TCu kt ktSulphide Proved 898.2 898.2 0.58 0.58 5,209 5,209Flotation Copper Probable 435.2 435.2 0.54 0.54 2,350 2,350
Total 1,333.4 1,333.4 0.57 0.57 7,560 7,560%Mo %Mo kt kt
Proved 0.021 0.021 189 189Molybdenum Probable 0.023 0.023 100 100
Total 0.022 0.022 289 289
Copper – ProjectsMineral Resources
Tonnes Grade Contained Metal
Ownership % 2020 2019 2020 2019 2020 2019
Los Bronces Underground 50.1 Mt Mt %TCu %TCu kt ktSulphide Measured 245.3 52.6 1.50 1.65 3,680 868
Indicated 578.8 414.4 1.34 1.44 7,756 5,967Copper Measured and Indicated 824.1 467.0 1.39 1.46 11,435 6,835
Inferred 3,322.3 3,494.8 1.06 1.10 35,216 38,442%Mo %Mo kt kt
Measured 0.026 0.026 64 14Indicated 0.023 0.025 133 104
Molybdenum Measured and Indicated 0.024 0.025 197 117Inferred 0.017 0.019 565 664
Quellaveco (OP) 60.0 Mt Mt %TCu %TCu kt ktSulphide Measured 70.6 70.6 0.32 0.32 226 226Flotation Indicated 719.3 719.3 0.43 0.43 3,093 3,093
Copper Measured and Indicated 789.9 789.9 0.42 0.42 3,319 3,319Inferred (in LOM Plan) 32.4 32.4 0.48 0.48 155 155
Inferred (ex. LOM Plan) 804.4 804.4 0.32 0.32 2,574 2,574Total Inferred 836.8 836.8 0.33 0.33 2,729 2,729
%Mo %Mo kt ktMeasured 0.011 0.011 8 8Indicated 0.020 0.020 144 144
Molybdenum Measured and Indicated 0.019 0.019 152 152Inferred (in LOM Plan) 0.013 0.013 4 4
Inferred (ex. LOM Plan) 0.013 0.013 105 105Total Inferred 0.013 0.013 109 109
Sakatti 100 Mt Mt %TCu %TCu kt ktSulphide Measured – – – – – –
Indicated 3.5 3.5 3.45 3.45 121 121Copper Measured and Indicated 3.5 3.5 3.45 3.45 121 121
Inferred 40.9 40.9 1.77 1.77 724 724%Ni %Ni kt kt
Measured – – – –Indicated 2.47 2.47 87 87
Nickel Measured and Indicated 2.47 2.47 87 87Inferred 0.83 0.83 337 337
3E g/t 3E g/t 3E Moz 3E MozMeasured – – – –Indicated 2.49 2.49 0.3 0.3
PGE Measured and Indicated 2.49 2.49 0.3 0.3Inferred 1.37 1.37 1.8 1.8
West Wall 50.0 Mt Mt %TCu %TCu kt ktSulphide Measured – – – – – –
Indicated 861.0 861.0 0.51 0.51 4,391 4,391Copper Measured and Indicated 861.0 861.0 0.51 0.51 4,391 4,391
Inferred 1,072.0 1,072.0 0.42 0.42 4,502 4,502%Mo %Mo kt kt
Measured – – – –Indicated 0.009 0.009 77 77
Molybdenum Measured and Indicated 0.009 0.009 77 77 Inferred 0.006 0.006 64 64
Los Bronces Sur 50.1 Mt Mt %TCu %TCu kt ktSulphide Copper Inferred 900.0 900.0 0.81 0.81 7,290 7,290
%Mo %Mo kt ktMolybdenum Inferred 0.025 0.025 225 225
Mineral Resources are reported as additional to Ore Reserves.
Mining method: OP = Open Pit.Reserve Life = The scheduled extraction period in years for the total Ore Reserves in the approved Life of Mine Plan. TCu = Total Copper. Ni = Total Nickel. 3E is the sum of Platinum, Palladium and Gold.
Due to the uncertainty attached to Inferred Mineral Resources, it cannot be assumed that all or part of an Inferred Mineral Resource will necessarily be upgraded to an Indicated or Measured Resource after continued exploration.
Quellaveco is a Joint Venture with Mitsubishi Corporation. West Wall is a Joint Venture with Glencore. Los Bronces Sur and Los Bronces Underground are part of Anglo American Sur.
18 Anglo American plc Ore Reserves and Mineral Resources Report 2020
Ore Reserves and Mineral ResourcesCopper continued

Copper-bearing sulphide veins and disseminated copper sulphide mineralisation hosted within Intermineral Porphyry from the Hypogene Zone, Quellaveco Project.
Explanatory notesLos Bronces Underground: The reported Mineral Resources include mineralisation within a volume defined using a $50/t Net Smelter Return (NSR) value. The test for reasonable prospects of eventual economic extraction considers a selective underground operation. Mineral Resources increase due to an updated resource model based on new drilling information. Quellaveco – Ore Reserves: A minimum cut-off of 0.30 %TCu is applied to determine Ore Reserves.Quellaveco – Mineral Resources: Mineral Resources are quoted above a 0.20 %TCu cut-off within an optimised pit shell. The resource model has been updated taking additional drilling information into consideration; however impact to the estimates were not considered material and estimates have remained unchanged. The structural model and geotechnical domains are being finalised and updated estimates are expected during 2021. Sakatti: Mineral Resources quoted are based on a predominantly underground Cut & Fill mining method and fall within a volume defined using a $45/t Net Smelter Return (NSR) value. This equates to approximately a 1% Copper Equivalent (CuEq) cut-off. Sakatti co-product estimated average grades:Indicated Resources – Cobalt 0.11%, Platinum 0.98 g/t, Palladium 1.18 g/t and Gold 0.33 g/t. CuEq average grade 11.41%.Inferred Resources – Cobalt 0.04%, Platinum 0.61 g/t, Palladium 0.43 g/t and Gold 0.33 g/t. CuEq average grade 4.68%. An exploration permit and a permit from the Environmental Ministry for the exploration work at Sakatti was awarded during July 2020 enabling a three-year drilling programme, which commenced in November 2020. Environmental and social impact assessment (ESIA) was completed in December 2020 and environmental permitting commenced in January 2021.West Wall: Mineral Resources are quoted above a 0.20 %TCu cut-off within an optimised pit shell. Los Bronces Sur: The test for reasonable prospects of eventual economic extraction is based on an underground operation.
Audits related to the generation of the Mineral Resource estimates were carried out by independent consultants during 2020 at Los Bronces operation, Los Bronces Underground and Los Bronces Sur projects.
Anglo American plc Ore Reserves and Mineral Resources Report 2020 19
Ore Reserves and Mineral ResourcesCopper continued
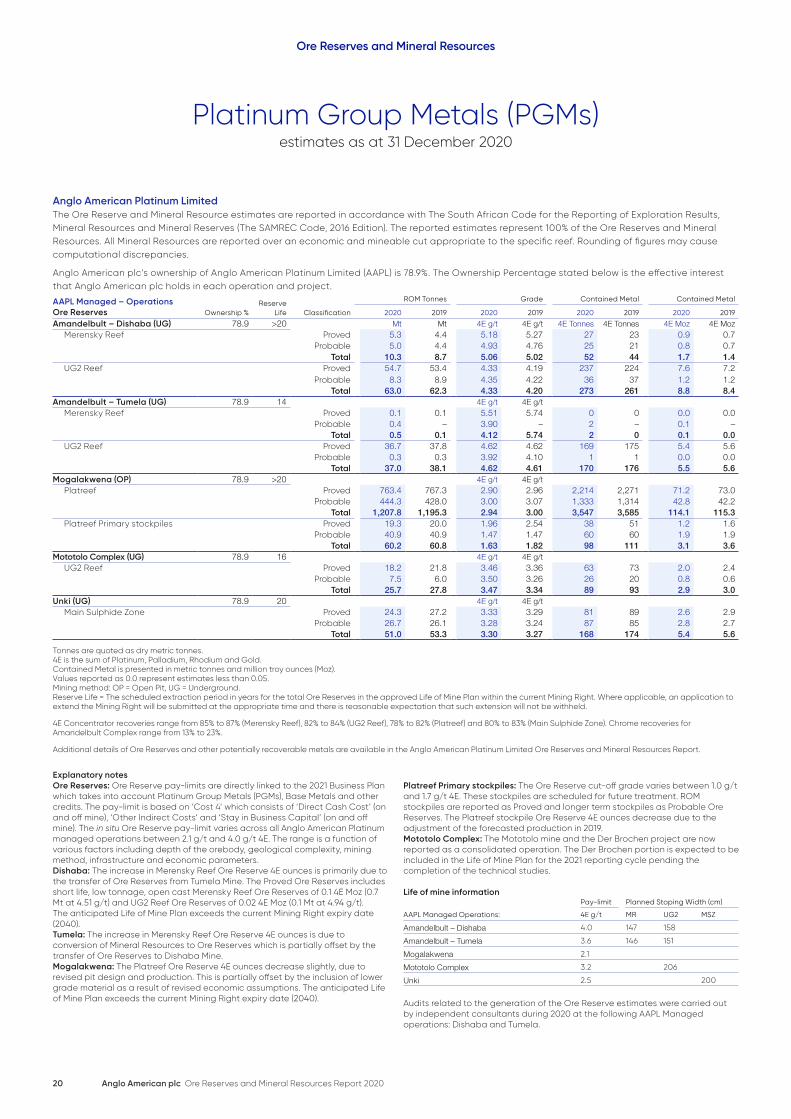
Anglo American Platinum LimitedThe Ore Reserve and Mineral Resource estimates are reported in accordance with The South African Code for the Reporting of Exploration Results, Mineral Resources and Mineral Reserves (The SAMREC Code, 2016 Edition). The reported estimates represent 100% of the Ore Reserves and Mineral Resources. All Mineral Resources are reported over an economic and mineable cut appropriate to the specific reef. Rounding of figures may cause computational discrepancies.
Anglo American plc’s ownership of Anglo American Platinum Limited (AAPL) is 78.9%. The Ownership Percentage stated below is the effective interest that Anglo American plc holds in each operation and project.
AAPL Managed – Operations ReserveLife
ROM Tonnes Grade Contained Metal Contained Metal
Ore Reserves Ownership % Classification 2020 2019 2020 2019 2020 2019 2020 2019
Amandelbult – Dishaba (UG) 78.9 >20 Mt Mt 4E g/t 4E g/t 4E Tonnes 4E Tonnes 4E Moz 4E MozMerensky Reef Proved 5.3 4.4 5.18 5.27 27 23 0.9 0.7
Probable 5.0 4.4 4.93 4.76 25 21 0.8 0.7Total 10.3 8.7 5.06 5.02 52 44 1.7 1.4
UG2 Reef Proved 54.7 53.4 4.33 4.19 237 224 7.6 7.2Probable 8.3 8.9 4.35 4.22 36 37 1.2 1.2
Total 63.0 62.3 4.33 4.20 273 261 8.8 8.4Amandelbult – Tumela (UG) 78.9 14 4E g/t 4E g/t
Merensky Reef Proved 0.1 0.1 5.51 5.74 0 0 0.0 0.0Probable 0.4 – 3.90 – 2 – 0.1 –
Total 0.5 0.1 4.12 5.74 2 0 0.1 0.0UG2 Reef Proved 36.7 37.8 4.62 4.62 169 175 5.4 5.6
Probable 0.3 0.3 3.92 4.10 1 1 0.0 0.0Total 37.0 38.1 4.62 4.61 170 176 5.5 5.6
Mogalakwena (OP) 78.9 >20 4E g/t 4E g/tPlatreef Proved 763.4 767.3 2.90 2.96 2,214 2,271 71.2 73.0
Probable 444.3 428.0 3.00 3.07 1,333 1,314 42.8 42.2Total 1,207.8 1,195.3 2.94 3.00 3,547 3,585 114.1 115.3
Platreef Primary stockpiles Proved 19.3 20.0 1.96 2.54 38 51 1.2 1.6Probable 40.9 40.9 1.47 1.47 60 60 1.9 1.9
Total 60.2 60.8 1.63 1.82 98 111 3.1 3.6Mototolo Complex (UG) 78.9 16 4E g/t 4E g/t
UG2 Reef Proved 18.2 21.8 3.46 3.36 63 73 2.0 2.4Probable 7.5 6.0 3.50 3.26 26 20 0.8 0.6
Total 25.7 27.8 3.47 3.34 89 93 2.9 3.0Unki (UG) 78.9 20 4E g/t 4E g/t
Main Sulphide Zone Proved 24.3 27.2 3.33 3.29 81 89 2.6 2.9Probable 26.7 26.1 3.28 3.24 87 85 2.8 2.7
Total 51.0 53.3 3.30 3.27 168 174 5.4 5.6
Tonnes are quoted as dry metric tonnes.4E is the sum of Platinum, Palladium, Rhodium and Gold.Contained Metal is presented in metric tonnes and million troy ounces (Moz). Values reported as 0.0 represent estimates less than 0.05.Mining method: OP = Open Pit, UG = Underground. Reserve Life = The scheduled extraction period in years for the total Ore Reserves in the approved Life of Mine Plan within the current Mining Right. Where applicable, an application to extend the Mining Right will be submitted at the appropriate time and there is reasonable expectation that such extension will not be withheld.
4E Concentrator recoveries range from 85% to 87% (Merensky Reef), 82% to 84% (UG2 Reef), 78% to 82% (Platreef) and 80% to 83% (Main Sulphide Zone). Chrome recoveries for Amandelbult Complex range from 13% to 23%.
Additional details of Ore Reserves and other potentially recoverable metals are available in the Anglo American Platinum Limited Ore Reserves and Mineral Resources Report.
Explanatory notesOre Reserves: Ore Reserve pay-limits are directly linked to the 2021 Business Plan which takes into account Platinum Group Metals (PGMs), Base Metals and other credits. The pay-limit is based on ‘Cost 4’ which consists of ‘Direct Cash Cost’ (on and off mine), ‘Other Indirect Costs’ and ‘Stay in Business Capital’ (on and off mine). The in situ Ore Reserve pay-limit varies across all Anglo American Platinum managed operations between 2.1 g/t and 4.0 g/t 4E. The range is a function of various factors including depth of the orebody, geological complexity, mining method, infrastructure and economic parameters. Dishaba: The increase in Merensky Reef Ore Reserve 4E ounces is primarily due to the transfer of Ore Reserves from Tumela Mine. The Proved Ore Reserves includes short life, low tonnage, open cast Merensky Reef Ore Reserves of 0.1 4E Moz (0.7 Mt at 4.51 g/t) and UG2 Reef Ore Reserves of 0.02 4E Moz (0.1 Mt at 4.94 g/t). The anticipated Life of Mine Plan exceeds the current Mining Right expiry date (2040).Tumela: The increase in Merensky Reef Ore Reserve 4E ounces is due to conversion of Mineral Resources to Ore Reserves which is partially offset by the transfer of Ore Reserves to Dishaba Mine. Mogalakwena: The Platreef Ore Reserve 4E ounces decrease slightly, due to revised pit design and production. This is partially offset by the inclusion of lower grade material as a result of revised economic assumptions. The anticipated Life of Mine Plan exceeds the current Mining Right expiry date (2040).
Platreef Primary stockpiles: The Ore Reserve cut-off grade varies between 1.0 g/t and 1.7 g/t 4E. These stockpiles are scheduled for future treatment. ROM stockpiles are reported as Proved and longer term stockpiles as Probable Ore Reserves. The Platreef stockpile Ore Reserve 4E ounces decrease due to the adjustment of the forecasted production in 2019.Mototolo Complex: The Mototolo mine and the Der Brochen project are now reported as a consolidated operation. The Der Brochen portion is expected to be included in the Life of Mine Plan for the 2021 reporting cycle pending the completion of the technical studies.
Life of mine information Pay-limit Planned Stoping Width (cm)
AAPL Managed Operations: 4E g/t MR UG2 MSZ
Amandelbult – Dishaba 4.0 147 158
Amandelbult – Tumela 3.6 146 151
Mogalakwena 2.1
Mototolo Complex 3.2 206
Unki 2.5 200
Audits related to the generation of the Ore Reserve estimates were carried out by independent consultants during 2020 at the following AAPL Managed operations: Dishaba and Tumela.
20 Anglo American plc Ore Reserves and Mineral Resources Report 2020
Ore Reserves and Mineral Resources
Platinum Group Metals (PGMs) estimates as at 31 December 2020

Non-Managed – Operations ReserveLife
ROM Tonnes Grade Contained Metal Contained Metal
Ore Reserves Ownership % Classification 2020 2019 2020 2019 2020 2019 2020 2019
Kroondal (UG) 39.5 4 Mt Mt 4E g/t 4E g/t 4E Tonnes 4E Tonnes 4E Moz 4E MozUG2 Reef Proved 9.3 12.1 2.50 2.62 23 32 0.7 1.0
Probable – – – – – – – –Total 9.3 12.1 2.50 2.62 23 32 0.7 1.0
Modikwa (UG) 39.5 23 4E g/t 4E g/tUG2 Reef Proved 15.9 13.5 4.33 4.45 69 60 2.2 1.9
Probable 29.2 32.5 4.14 4.12 121 134 3.9 4.3Total 45.1 46.0 4.21 4.22 190 194 6.1 6.2
Siphumelele 3 shaft (UG) 78.9 10 4E g/t 4E g/tUG2 Reef Proved 14.7 17.1 2.62 2.52 38 43 1.2 1.4
Probable – – – – – – – –Total 14.7 17.1 2.62 2.52 38 43 1.2 1.4
Tonnes are quoted as dry metric tonnes.4E is the sum of Platinum, Palladium, Rhodium and Gold.Contained Metal is presented in metric tonnes and million troy ounces (Moz). Values reported as 0.0 represent estimates less than 0.05.Mining method: UG = Underground. Reserve Life = The scheduled extraction period in years for the total Ore Reserves in the approved Life of Mine Plan within the current Mining Right.
Information for Non-Managed operations are provided by the Joint Venture partners; for additional details please refer to the applicable Annual Reports.
Explanatory notes Sibanye-Stillwater provided revised Ore Reserve estimates for Kroondal and Siphumelele 3 shaft post the finalisation of the 2020 Ore Reserves and Mineral Resources Report. This revision is not considered material and is not reflected in the tables above. For additional details please refer to the Sibanye-Stillwater Annual Report. Kroondal: The UG2 Ore Reserve 4E ounces decrease primarily due to production. The Proved Ore Reserves includes open cast UG2 Ore Reserves of 0.2 4E Moz (1.7 Mt at 3.27 g/t). Siphumelele 3 shaft: Siphumelele 3 shaft is being mined on a royalty basis by Sibanye-Stillwater from the Kroondal Mine infrastructure. The UG2 Ore Reserve 4E ounces decrease due to production which is partially offset by revised economic assumptions.
Anglo American plc Ore Reserves and Mineral Resources Report 2020 21
Ore Reserves and Mineral ResourcesPlatinum Group Metals (PGMs) continued

AAPL Managed – Operations Tonnes Grade Contained Metal Contained Metal
Mineral Resources Ownership % Classification 2020 2019 2020 2019 2020 2019 2020 2019
Amandelbult – Dishaba (UG) 78.9 Mt Mt 4E g/t 4E g/t 4E Tonnes 4E Tonnes 4E Moz 4E MozMerensky Reef Measured 8.0 9.4 7.11 7.01 57 66 1.8 2.1
Indicated 10.6 10.4 6.92 6.88 73 71 2.4 2.3Measured and Indicated 18.5 19.8 7.00 6.94 130 137 4.2 4.4
Inferred (in LOM Plan) 1.1 1.0 6.33 6.62 7 7 0.2 0.2Inferred (ex. LOM Plan) 11.6 12.0 6.27 6.26 72 75 2.3 2.4
Total Inferred 12.6 13.0 6.28 6.29 79 82 2.6 2.6UG2 Reef Measured 19.2 19.5 5.25 5.27 101 103 3.2 3.3
Indicated 22.8 22.7 5.78 5.79 132 131 4.2 4.2Measured and Indicated 42.0 42.1 5.54 5.55 233 234 7.5 7.5
Inferred (in LOM Plan) 0.0 0.0 5.71 5.70 0 0 0.0 0.0Inferred (ex. LOM Plan) 8.9 9.0 5.54 5.55 49 50 1.6 1.6
Total Inferred 8.9 9.0 5.54 5.55 49 50 1.6 1.6Amandelbult – Tumela (UG) 78.9 4E g/t 4E g/t
Merensky Reef Measured 23.0 24.8 6.74 6.82 155 169 5.0 5.4Indicated 46.2 46.5 7.04 7.04 325 327 10.5 10.5
Measured and Indicated 69.2 71.3 6.94 6.96 480 496 15.4 16.0Inferred (in LOM Plan) – – – – – – – –
Inferred (ex. LOM Plan) 44.6 45.8 7.04 7.02 314 321 10.1 10.3Total Inferred 44.6 45.8 7.04 7.02 314 321 10.1 10.3
UG2 Reef Measured 102.4 105.6 5.40 5.40 553 571 17.8 18.3Indicated 44.1 44.3 5.52 5.52 243 244 7.8 7.9
Measured and Indicated 146.5 149.9 5.44 5.44 796 815 25.6 26.2Inferred (in LOM Plan) – – – – – – – –
Inferred (ex. LOM Plan) 47.4 47.0 5.77 5.77 273 271 8.8 8.7Total Inferred 47.4 47.0 5.77 5.77 273 271 8.8 8.7
Amandelbult 78.9 4E g/t 4E g/tTailings Measured 63.0 63.0 0.79 0.79 50 50 1.6 1.6
Indicated 8.1 8.1 0.82 0.82 7 7 0.2 0.2Measured and Indicated 71.1 71.1 0.79 0.79 57 57 1.8 1.8
Inferred 1.2 1.2 0.91 0.91 1 1 0.0 0.0Mogalakwena (OP) 78.9 4E g/t 4E g/t
Platreef Measured 246.4 221.1 2.17 2.18 535 482 17.2 15.5Indicated 1,389.7 1,375.7 2.30 2.31 3,196 3,178 102.8 102.2
Measured and Indicated 1,636.0 1,596.8 2.28 2.29 3,731 3,660 119.9 117.7Inferred (in LOM Plan) – 0.6 – 3.76 – 2 – 0.1
Inferred (ex. LOM Plan) 595.7 595.4 1.76 1.76 1,048 1,048 33.7 33.7Total Inferred 595.7 596.0 1.76 1.76 1,048 1,050 33.7 33.8
Platreef stockpiles Measured 3.9 4.4 3.22 3.20 12 14 0.4 0.4Indicated – – – – – – – –
Measured and Indicated 3.9 4.4 3.22 3.20 12 14 0.4 0.4Inferred (in LOM Plan) – – – – – – – –
Inferred (ex. LOM Plan) – – – – – – – –Total Inferred – – – – – – – –
Mototolo Complex (UG) 78.9 4E g/t 4E g/tMerensky Reef Measured 40.9 – 4.75 – 194 – 6.3 –
Indicated 58.2 – 4.54 – 264 – 8.5 –Measured and Indicated 99.1 – 4.63 – 458 – 14.7 –
Inferred 73.7 – 4.52 – 333 – 10.7 –UG2 Reef Measured 108.0 7.5 3.99 3.81 431 29 13.9 0.9
Indicated 136.8 6.5 3.95 4.29 540 28 17.4 0.9Measured and Indicated 244.8 14.0 3.97 4.03 971 57 31.2 1.8
Inferred (in LOM Plan) – – – – – – – –Inferred (ex. LOM Plan) 124.4 – 4.02 – 500 – 16.1 –
Total Inferred 124.4 – 4.02 – 500 – 16.1 –Twickenham (UG) 78.9 4E g/t 4E g/t
Merensky Reef Measured 48.4 48.4 4.75 4.75 230 230 7.4 7.4Indicated 87.3 87.3 4.97 4.97 434 434 14.0 14.0
Measured and Indicated 135.7 135.7 4.89 4.89 664 664 21.3 21.3Inferred 165.7 165.7 5.26 5.26 872 872 28.0 28.0
UG2 Reef Measured 54.6 54.6 6.29 6.29 344 344 11.1 11.1Indicated 145.4 145.4 6.05 6.05 879 879 28.3 28.3
Measured and Indicated 200.0 200.0 6.12 6.12 1,223 1,223 39.3 39.3Inferred 148.2 148.2 5.88 5.88 871 871 28.0 28.0
Unki (UG) 78.9 4E g/t 4E g/tMain Sulphide Zone Measured 7.5 7.9 4.09 4.12 31 33 1.0 1.1
Indicated 110.8 112.3 4.29 4.29 475 482 15.3 15.5Measured and Indicated 118.4 120.2 4.28 4.28 506 515 16.3 16.5
Inferred (in LOM Plan) 0.0 0.0 3.41 3.41 0 0 0.0 0.0Inferred (ex. LOM Plan) 38.5 47.7 4.07 4.22 157 201 5.0 6.5
Total Inferred 38.6 47.8 4.07 4.22 157 201 5.0 6.5
Mineral Resources are reported as additional to Ore Reserves.
Tonnes are quoted as dry metric tonnes. 4E is the sum of Platinum, Palladium, Rhodium and Gold. Contained Metal is presented in metric tonnes and million troy ounces (Moz). Values reported as 0.0 represent estimates less than 0.05. Mining method: OP = Open Pit, UG = Underground.
Due to the uncertainty attached to Inferred Mineral Resources, it cannot be assumed that all or part of an Inferred Mineral Resource will necessarily be upgraded to an Indicated or Measured Resource after continued exploration.
Additional details of Mineral Resources and other potentially recoverable metals are available in the Anglo American Platinum Limited Ore Reserves and Mineral Resources Report.
22 Anglo American plc Ore Reserves and Mineral Resources Report 2020
Ore Reserves and Mineral ResourcesPlatinum Group Metals (PGMs) continued

Bulk ore sorter, Mogalakwena mine.
Explanatory notesDishaba: The Measured Resources include low tonnage open cast Merensky Reef Resources of 0.1 4E Moz (0.3 Mt at 6.13 g/t) and UG2 Reef Resources of 0.1 4E Moz (0.5 Mt at 5.07 g/t).Mogalakwena: A 1.0 g/t 4E cut-off grade is used to define Platreef Mineral Resources (excluding both oxidised and calc-silicate materials for which a 3.0 g/t 4E cut-off is applied). The Platreef Mineral Resource 4E ounces increase due to the reallocation of Ore Reserves to Mineral Resources resulting from a revised pit design. Platreef Stockpiles: The Mineral Resource 4E ounces decrease due to depletion of the surface stockpile.Mototolo Complex: The Mototolo mine and the Der Brochen project have been reported as a consolidated operation. The Der Brochen Mineral Resource 4E ounces are transferred for both the Merensky Reef and UG2 Reef. The net change in Mineral Resources for the complex is negligible. Tailings: At Amandelbult Complex dormant tailings storage facilities have been evaluated and are reported separately as Tailings Mineral Resources.Tumela: The Measured Resources include low tonnage open cast Merensky Reef Resources of 0.1 4E Moz (0.3 Mt at 7.91 g/t) and UG2 Reef Resources of 0.2 4E Moz (1.3 Mt at 5.45 g/t).Unki: The Mineral Resource 4E ounces decrease primarily due to the disposal of the KV and SR Claims.
Resource Cut definition for UG operations The Mineral Resources are estimated over a variable ‘Resource Cut’ targeting a minimum planned mining width which takes cognisance of the extraction method, potential economic viability and geotechnical aspects in the hangingwall or footwall of the reef.
Minimum ‘Resource Cut’ Width (cm)
AAPL Managed Operations: MR UG2 MSZ
Amandelbult – Dishaba 120 120
Amandelbult – Tumela 120 120
Mototolo Complex 90 180
Twickenham 105 95
Unki 120/180*
* The current mining areas at Unki East and West are estimated over a ‘Resource Cut’ of 180 cm and the remaining area estimated over a ‘Resource Cut’ of 120 cm.
Audits related to the generation of the Mineral Resource estimates were carried out by independent consultants during 2020 at the following AAPL Managed operations: Dishaba and Tumela.
Anglo American plc Ore Reserves and Mineral Resources Report 2020 23
Ore Reserves and Mineral ResourcesPlatinum Group Metals (PGMs) continued
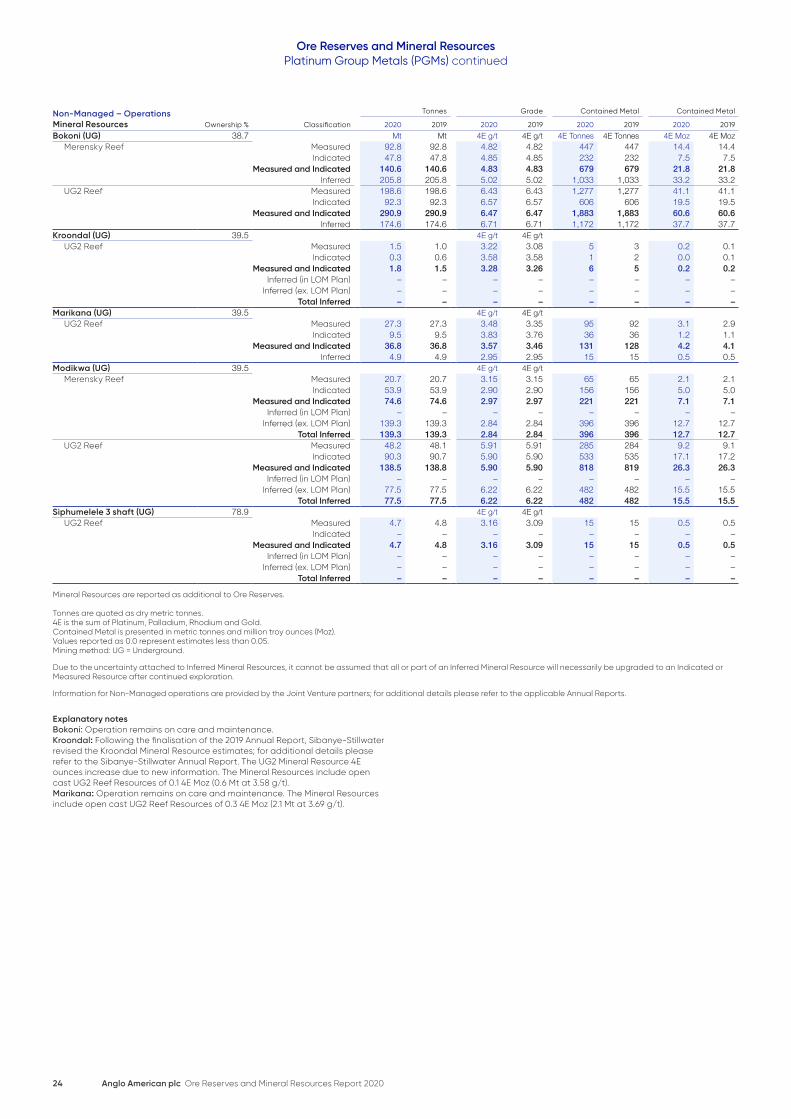
Non-Managed – Operations Tonnes Grade Contained Metal Contained Metal
Mineral Resources Ownership % Classification 2020 2019 2020 2019 2020 2019 2020 2019
Bokoni (UG) 38.7 Mt Mt 4E g/t 4E g/t 4E Tonnes 4E Tonnes 4E Moz 4E MozMerensky Reef Measured 92.8 92.8 4.82 4.82 447 447 14.4 14.4
Indicated 47.8 47.8 4.85 4.85 232 232 7.5 7.5Measured and Indicated 140.6 140.6 4.83 4.83 679 679 21.8 21.8
Inferred 205.8 205.8 5.02 5.02 1,033 1,033 33.2 33.2UG2 Reef Measured 198.6 198.6 6.43 6.43 1,277 1,277 41.1 41.1
Indicated 92.3 92.3 6.57 6.57 606 606 19.5 19.5Measured and Indicated 290.9 290.9 6.47 6.47 1,883 1,883 60.6 60.6
Inferred 174.6 174.6 6.71 6.71 1,172 1,172 37.7 37.7Kroondal (UG) 39.5 4E g/t 4E g/t
UG2 Reef Measured 1.5 1.0 3.22 3.08 5 3 0.2 0.1Indicated 0.3 0.6 3.58 3.58 1 2 0.0 0.1
Measured and Indicated 1.8 1.5 3.28 3.26 6 5 0.2 0.2Inferred (in LOM Plan) – – – – – – – –
Inferred (ex. LOM Plan) – – – – – – – –Total Inferred – – – – – – – –
Marikana (UG) 39.5 4E g/t 4E g/tUG2 Reef Measured 27.3 27.3 3.48 3.35 95 92 3.1 2.9
Indicated 9.5 9.5 3.83 3.76 36 36 1.2 1.1Measured and Indicated 36.8 36.8 3.57 3.46 131 128 4.2 4.1
Inferred 4.9 4.9 2.95 2.95 15 15 0.5 0.5Modikwa (UG) 39.5 4E g/t 4E g/t
Merensky Reef Measured 20.7 20.7 3.15 3.15 65 65 2.1 2.1Indicated 53.9 53.9 2.90 2.90 156 156 5.0 5.0
Measured and Indicated 74.6 74.6 2.97 2.97 221 221 7.1 7.1Inferred (in LOM Plan) – – – – – – – –
Inferred (ex. LOM Plan) 139.3 139.3 2.84 2.84 396 396 12.7 12.7Total Inferred 139.3 139.3 2.84 2.84 396 396 12.7 12.7
UG2 Reef Measured 48.2 48.1 5.91 5.91 285 284 9.2 9.1Indicated 90.3 90.7 5.90 5.90 533 535 17.1 17.2
Measured and Indicated 138.5 138.8 5.90 5.90 818 819 26.3 26.3Inferred (in LOM Plan) – – – – – – – –
Inferred (ex. LOM Plan) 77.5 77.5 6.22 6.22 482 482 15.5 15.5Total Inferred 77.5 77.5 6.22 6.22 482 482 15.5 15.5
Siphumelele 3 shaft (UG) 78.9 4E g/t 4E g/tUG2 Reef Measured 4.7 4.8 3.16 3.09 15 15 0.5 0.5
Indicated – – – – – – – –Measured and Indicated 4.7 4.8 3.16 3.09 15 15 0.5 0.5
Inferred (in LOM Plan) – – – – – – – –Inferred (ex. LOM Plan) – – – – – – – –
Total Inferred – – – – – – – –
Mineral Resources are reported as additional to Ore Reserves.
Tonnes are quoted as dry metric tonnes.4E is the sum of Platinum, Palladium, Rhodium and Gold.Contained Metal is presented in metric tonnes and million troy ounces (Moz). Values reported as 0.0 represent estimates less than 0.05. Mining method: UG = Underground.
Due to the uncertainty attached to Inferred Mineral Resources, it cannot be assumed that all or part of an Inferred Mineral Resource will necessarily be upgraded to an Indicated or Measured Resource after continued exploration.
Information for Non-Managed operations are provided by the Joint Venture partners; for additional details please refer to the applicable Annual Reports.
Explanatory notesBokoni: Operation remains on care and maintenance.Kroondal: Following the finalisation of the 2019 Annual Report, Sibanye-Stillwater revised the Kroondal Mineral Resource estimates; for additional details please refer to the Sibanye-Stillwater Annual Report. The UG2 Mineral Resource 4E ounces increase due to new information. The Mineral Resources include open cast UG2 Reef Resources of 0.1 4E Moz (0.6 Mt at 3.58 g/t).Marikana: Operation remains on care and maintenance. The Mineral Resources include open cast UG2 Reef Resources of 0.3 4E Moz (2.1 Mt at 3.69 g/t).
24 Anglo American plc Ore Reserves and Mineral Resources Report 2020
Ore Reserves and Mineral ResourcesPlatinum Group Metals (PGMs) continued

Kumba Iron OreThe Ore Reserve and Mineral Resource estimates are reported in accordance with The South African Code for the Reporting of Exploration Results, Mineral Resources and Mineral Reserves (The SAMREC Code, 2016 Edition). The reported estimates represent 100% of the Ore Reserves and Mineral Resources. Rounding of figures may cause computational discrepancies.
Anglo American plc’s interest in Kumba Iron Ore Limited is 69.7%. The Ownership Percentage stated below is the effective interest that Anglo American plc holds in each operation.
Kumba Iron Ore – OperationsOre Reserves
ReserveLife
ROM Tonnes Grade Saleable Product
Ownership % Classification 2020 2019 2020 2019 2020 2019
Kolomela (OP) 53.2 12 Mt Mt %Fe %Fe Mt %Fe Mt %FeHematite Proved 104.0 103.9 62.8 63.5 101.1 64.4 101.3 64.4
Probable 42.5 55.4 61.6 64.0 41.3 64.6 54.3 64.2Total 146.5 159.3 62.5 63.7 142.4 64.5 155.5 64.3
Stockpile %Fe %FeProved – – – – – – – –
Probable 11.5 13.1 57.4 55.4 7.6 64.5 7.5 64.5Total 11.5 13.1 57.4 55.4 7.6 64.5 7.5 64.5
Sishen (OP) 53.2 15 %Fe %FeHematite Proved 348.9 299.8 58.8 58.5 268.4 65.1 229.7 63.7
Probable 209.4 207.3 56.6 56.2 151.2 64.1 148.5 64.2Total 558.2 507.1 58.0 57.6 419.6 64.7 378.1 63.9
Stockpile %Fe %FeProved – – – – – – – –
Probable 13.7 12.2 54.6 58.7 10.2 63.8 9.5 64.6Total 13.7 12.2 54.6 58.7 10.2 63.8 9.5 64.6
Kumba Iron Ore – OperationsMineral Resources
Tonnes Grade
Ownership % Classification 2020 2019 2020 2019
Kolomela (OP) 53.2 Mt Mt %Fe %FeHematite Measured 40.1 34.1 63.2 63.2
Indicated 66.4 77.9 63.1 62.4Measured and Indicated 106.5 112.0 63.1 62.6
Inferred (in LOM Plan) 1.5 4.5 65.8 66.1Inferred (ex. LOM Plan) 28.7 29.3 63.8 62.7
Total Inferred 30.1 33.7 63.9 63.2Stockpile %Fe %Fe
Measured – – – –Indicated 6.7 4.2 55.1 55.7
Measured and Indicated 6.7 4.2 55.1 55.7Inferred (in LOM Plan) – – – –
Inferred (ex. LOM Plan) – – – –Total Inferred – – – –
Sishen (OP) 53.2 %Fe %FeHematite Measured 149.6 107.3 57.0 56.4
Indicated 355.8 266.3 53.2 54.8Measured and Indicated 505.4 373.7 54.3 55.3
Inferred (in LOM Plan) 12.2 11.0 56.6 57.1Inferred (ex. LOM Plan) 18.5 13.4 48.1 48.2
Total Inferred 30.7 24.5 51.5 52.2Stockpile %Fe %Fe
Measured – – – –Indicated 25.4 22.2 41.1 43.9
Measured and Indicated 25.4 22.2 41.1 43.9Inferred (in LOM Plan) – – – –
Inferred (ex. LOM Plan) – – – –Total Inferred – – – –
Mineral Resources are reported as additional to Ore Reserves.
Mining method: OP = Open Pit. Reserve Life = The scheduled extraction period in years for the total Ore Reserves in the approved Life of Mine Plan. The tonnage is quoted as dry metric tonnes and abbreviated as Mt for million tonnes.
The Mineral Resources are constrained by a Resource Shell and iron cut-off grade, which define the spatial limits of eventual economic extraction.
Due to the uncertainty attached to Inferred Mineral Resources, it cannot be assumed that all or part of an Inferred Mineral Resource will necessarily be upgraded to an Indicated or Measured Resource after continued exploration.
No audits related to the generation of the Ore Reserve and Mineral Resource estimates were carried out by independent consultants during 2020.
Iron Ore estimates as at 31 December 2020
Anglo American plc Ore Reserves and Mineral Resources Report 2020 25
Ore Reserves and Mineral Resources

Explanatory notesKolomela – Ore Reserves: Ore Reserves are reported above a cut-off of 50.0 %Fe inclusive of dilution. The decrease is primarily due to production and the revised pit design at Klipbankfontein. Sishen – Ore Reserves: Ore Reserves are reported above a cut-off of 40.0 %Fe inclusive of dilution. The increase is primarily due to the outcome of the pit optimisation conducted in 2020, which considered more favourable long term forward-looking economic assumptions. Steeper pit slope design angles based on geotechnical studies and optimised haul road designs also contribute to the current changes. Kolomela – Mineral Resources: Mineral Resources are reported above a cut-off of 50.0 %Fe in situ. The decrease is due to updates to the geological model, which considered additional information from drilling and the conversion of more medium-grade Mineral Resources to Ore Reserves. Sishen – Mineral Resources: Mineral Resources are reported above a cut-off of 40.0 %Fe in situ. The increase is primarily due to expansion of the resource shell based on the pit optimisation conducted in 2020, which considered more favourable long term forward-looking economic parameters. Steeper pit slope design angles based on geotechnical studies also contribute to the current changes.
Mineral TenureAll Ore Reserves and Mineral Resources (in addition to Ore Reserves) quoted are held under notarially executed and registered Mining and Prospecting Rights granted to Sishen Iron Ore Company (Pty) Ltd (SIOC) in terms of the Mineral and Petroleum Resources Development Act No. 28 of 2002 (MPRDA).
For additional details please refer to the Kumba Iron Ore Limited Ore Reserve (and Saleable Product) and Mineral Resource Report 2020.
26 Anglo American plc Ore Reserves and Mineral Resources Report 2020
Ore Reserves and Mineral ResourcesIron Ore continued

Iron Ore BrazilThe Ore Reserve and Mineral Resource estimates are reported in accordance with the Australasian Code for Reporting of Exploration Results, Mineral Resources and Ore Reserves (The JORC Code, 2012) as a minimum standard. The reported estimates represent 100% of the Ore Reserves and Mineral Resources. Rounding of figures may cause computational discrepancies.
Iron Ore Brazil – OperationsOre Reserves
ReserveLife
ROM Tonnes Grade Saleable Product
Ownership % Classification 2020 2019 2020 2019 2020 2019
Serra do Sapo (OP) 100 55 Mt Mt %Fe %Fe Mt %Fe Mt %FeFriable Itabirite and Hematite Proved 170.4 – 41.0 – 90.6 67.1 – –
Probable 1,090.5 1,311.2 37.0 37.5 521.7 67.1 636.8 67.5Total 1,260.9 1,311.2 37.5 37.5 612.3 67.1 636.8 67.5
Itabirite Proved 42.5 – 31.7 – 17.1 67.1 – –Probable 2,189.6 1,970.4 30.9 30.9 850.3 67.1 764.1 67.5
Total 2,232.1 1,970.4 30.9 30.9 867.3 67.1 764.1 67.5
Iron Ore Brazil – OperationsMineral Resources
Tonnes Grade
Ownership % Classification 2020 2019 2020 2019
Serra do Sapo (OP) 100 Mt Mt %Fe %FeFriable Itabirite and Hematite Measured 122.3 151.0 32.0 31.7
Indicated 116.8 131.2 33.8 32.3Measured and Indicated 239.1 282.2 32.9 32.0
Inferred (in LOM Plan) 37.4 41.3 37.3 38.2Inferred (ex. LOM Plan) 30.2 44.1 36.1 34.7
Total Inferred 67.6 85.4 36.8 36.4Itabirite Measured 391.3 447.2 30.3 30.3
Indicated 1,023.7 808.3 31.1 31.0Measured and Indicated 1,415.0 1,255.5 30.9 30.8
Inferred (in LOM Plan) 95.5 74.1 30.6 30.9Inferred (ex. LOM Plan) 356.9 470.5 30.9 31.1
Total Inferred 452.4 544.6 30.8 31.1
Mineral Resources are reported as additional to Ore Reserves.
Iron Ore Brazil – ProjectsMineral Resources
Tonnes Grade
Ownership % Classification 2020 2019 2020 2019
Itapanhoacanga 100 Mt Mt %Fe %FeFriable Itabirite and Hematite Measured 31.0 31.0 40.6 40.6
Indicated 117.5 117.5 41.3 41.3Measured and Indicated 148.6 148.6 41.1 41.1
Inferred 114.5 114.5 40.4 40.4Compact Itabirite Measured 23.2 23.2 33.6 33.6
Indicated 73.4 73.4 34.5 34.5Measured and Indicated 96.6 96.6 34.3 34.3
Inferred 57.0 57.0 34.5 34.5
Mining method: OP = Open Pit. Reserve Life = The scheduled extraction period in years for the total Ore Reserves in the approved Life of Mine Plan.The ROM tonnage is quoted as dry metric tonnes and abbreviated as Mt for million tonnes.
Due to the uncertainty attached to Inferred Mineral Resources, it cannot be assumed that all or part of an Inferred Mineral Resource will necessarily be upgraded to an Indicated or Measured Resource after continued exploration.
Explanatory notesMinas-Rio: Minas-Rio comprises the Serra do Sapo operation and the Itapanhoacanga project. Licences to exploit the principal portion of the Serra do Sapo orebody have been granted.Serra do Sapo – Ore Reserves: Ore Reserves are reported above a cut-off of 25.0 %Fe inclusive of dilution. Saleable Product tonnes are reported on a wet basis (average moisture content is 9.5 wt%) with grade stated on a dry basis. Proved Ore Reserves are declared for the first seven years of production. The overall increase in Ore Reserves is primarily due to the conversion of Mineral Resources to Ore Reserves resulting from additional drilling information which increases the Reserve Life. This is partially offset by production and revised economic assumptions. Preconcentration methods are being considered for the economic processing of lower grade ores. Studies for application of such technology at Serra do Sapo are expected to be completed in H1 2021. Extraction of lower grade Compact Itabirite ores is expected to commence after 2030.Serra do Sapo – Mineral Resources: Mineral Resources are reported above a cut-off of 25.0 %Fe in situ. In situ tonnes and grade are reported on a dry basis. Friable Itabirite and Hematite includes Friable Itabirite, Semi-Friable Itabirite, High Alumina Friable Itabirite, Soft Hematite and Canga.Itapanhoacanga: Mineral Resources are reported above a cut-off of 25.0 %Fe in situ. In situ tonnes and grade are reported on a dry basis.Friable Itabirite and Hematite includes Friable Itabirite, Semi-Compact Itabirite, Soft Hematite and Hard Hematite.
No audits related to the generation of the Ore Reserve and Mineral Resource estimates were carried out by independent consultants during 2020.
Anglo American plc Ore Reserves and Mineral Resources Report 2020 27
Ore Reserves and Mineral ResourcesIron Ore continued
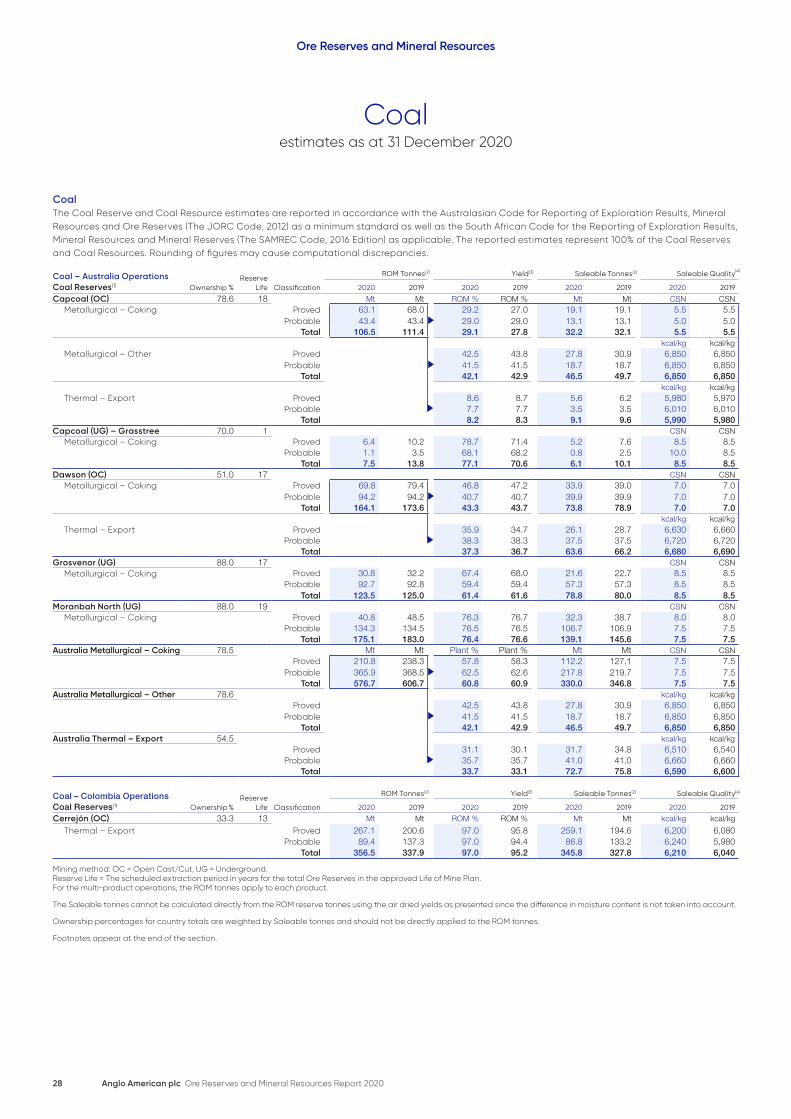
Coal The Coal Reserve and Coal Resource estimates are reported in accordance with the Australasian Code for Reporting of Exploration Results, Mineral Resources and Ore Reserves (The JORC Code, 2012) as a minimum standard as well as the South African Code for the Reporting of Exploration Results, Mineral Resources and Mineral Reserves (The SAMREC Code, 2016 Edition) as applicable. The reported estimates represent 100% of the Coal Reserves and Coal Resources. Rounding of figures may cause computational discrepancies.
Coal – Australia Operations ReserveLife
ROM Tonnes(2) Yield(3) Saleable Tonnes(2) Saleable Quality
Coal Reserves(1) Ownership % Classification 2020 2019 2020 2019 2020 2019 2020 2019
Capcoal (OC) 78.6 18 Mt Mt ROM % ROM % Mt Mt CSN CSNMetallurgical – Coking Proved 63.1 68.0 29.2 27.0 19.1 19.1 5.5 5.5
Probable 43.4 43.4 29.0 29.0 13.1 13.1 5.0 5.0Total 106.5 111.4 29.1 27.8 32.2 32.1 5.5 5.5
kcal/kg kcal/kgMetallurgical – Other Proved 42.5 43.8 27.8 30.9 6,850 6,850
Probable 41.5 41.5 18.7 18.7 6,850 6,850Total 42.1 42.9 46.5 49.7 6,850 6,850
kcal/kg kcal/kgThermal – Export Proved 8.6 8.7 5.6 6.2 5,980 5,970
Probable 7.7 7.7 3.5 3.5 6,010 6,010Total 8.2 8.3 9.1 9.6 5,990 5,980
Capcoal (UG) – Grasstree 70.0 1 CSN CSNMetallurgical – Coking Proved 6.4 10.2 78.7 71.4 5.2 7.6 8.5 8.5
Probable 1.1 3.5 68.1 68.2 0.8 2.5 10.0 8.5Total 7.5 13.8 77.1 70.6 6.1 10.1 8.5 8.5
Dawson (OC) 51.0 17 CSN CSNMetallurgical – Coking Proved 69.8 79.4 46.8 47.2 33.9 39.0 7.0 7.0
Probable 94.2 94.2 40.7 40.7 39.9 39.9 7.0 7.0Total 164.1 173.6 43.3 43.7 73.8 78.9 7.0 7.0
kcal/kg kcal/kgThermal – Export Proved 35.9 34.7 26.1 28.7 6,630 6,660
Probable 38.3 38.3 37.5 37.5 6,720 6,720Total 37.3 36.7 63.6 66.2 6,680 6,690
Grosvenor (UG) 88.0 17 CSN CSNMetallurgical – Coking Proved 30.8 32.2 67.4 68.0 21.6 22.7 8.5 8.5
Probable 92.7 92.8 59.4 59.4 57.3 57.3 8.5 8.5Total 123.5 125.0 61.4 61.6 78.8 80.0 8.5 8.5
Moranbah North (UG) 88.0 19 CSN CSNMetallurgical – Coking Proved 40.8 48.5 76.3 76.7 32.3 38.7 8.0 8.0
Probable 134.3 134.5 76.5 76.5 106.7 106.9 7.5 7.5Total 175.1 183.0 76.4 76.6 139.1 145.6 7.5 7.5
Australia Metallurgical – Coking 78.5 Mt Mt Plant % Plant % Mt Mt CSN CSNProved 210.8 238.3 57.8 58.3 112.2 127.1 7.5 7.5
Probable 365.9 368.5 62.5 62.6 217.8 219.7 7.5 7.5Total 576.7 606.7 60.8 60.9 330.0 346.8 7.5 7.5
Australia Metallurgical – Other 78.6 kcal/kg kcal/kgProved 42.5 43.8 27.8 30.9 6,850 6,850
Probable 41.5 41.5 18.7 18.7 6,850 6,850Total 42.1 42.9 46.5 49.7 6,850 6,850
Australia Thermal – Export 54.5 kcal/kg kcal/kgProved 31.1 30.1 31.7 34.8 6,510 6,540
Probable 35.7 35.7 41.0 41.0 6,660 6,660Total 33.7 33.1 72.7 75.8 6,590 6,600
Coal – Colombia Operations ReserveLife
ROM Tonnes Yield Saleable Tonnes Saleable Quality
Coal Reserves(1) Ownership % Classification 2020 2019 2020 2019 2020 2019 2020 2019
Cerrejón (OC) 33.3 13 Mt Mt ROM % ROM % Mt Mt kcal/kg kcal/kg
Thermal – Export Proved 267.1 200.6 97.0 95.8 259.1 194.6 6,200 6,080Probable 89.4 137.3 97.0 94.4 86.8 133.2 6,240 5,980
Total 356.5 337.9 97.0 95.2 345.8 327.8 6,210 6,040
Mining method: OC = Open Cast/Cut, UG = Underground. Reserve Life = The scheduled extraction period in years for the total Ore Reserves in the approved Life of Mine Plan. For the multi-product operations, the ROM tonnes apply to each product.
The Saleable tonnes cannot be calculated directly from the ROM reserve tonnes using the air dried yields as presented since the difference in moisture content is not taken into account.
Ownership percentages for country totals are weighted by Saleable tonnes and should not be directly applied to the ROM tonnes.
Footnotes appear at the end of the section.
(4)
(2) (3) (2) (4)
Coal estimates as at 31 December 2020
28 Anglo American plc Ore Reserves and Mineral Resources Report 2020
Ore Reserves and Mineral Resources

Coal – South Africa Operations Reserve ROM Tonnes Yield Saleable Tonnes Saleable Quality
Coal Reserves(1) Ownership % Life Classification 2020 2019 2020 2019 2020 2019 2020 2019
Goedehoop (UG) 100 5 Mt Mt ROM % ROM % Mt Mt kcal/kg kcal/kgThermal – Export Proved 20.0 15.4 54.0 48.7 10.8 7.7 6,310 5,970
Probable 1.3 9.0 53.6 58.9 0.7 5.4 6,310 5,960Total 21.3 24.4 54.0 52.5 11.5 13.1 6,310 5,970
Greenside (UG) 100 6 kcal/kg kcal/kgThermal – Export Proved 25.8 21.3 69.9 69.6 18.0 15.3 5,920 5,950
Probable 0.1 14.2 68.6 67.0 0.0 9.9 5,880 5,890Total 25.9 35.5 69.9 68.6 18.1 25.2 5,920 5,930
Isibonelo (OC) 100 6 kcal/kg kcal/kgSynfuel Proved 21.9 26.1 100 100 21.9 26.1 4,660 4,640
Probable 5.2 8.8 100 100 5.2 8.8 4,700 4,620Total 27.1 34.9 100 100 27.1 34.9 4,670 4,630
Kleinkopje (OC) 100 – kcal/kg kcal/kgThermal – Export Proved – 27.5 – 49.1 – 13.9 – 6,260
Probable – 7.4 – 46.5 – 3.5 – 6,230Total – 35.0 – 48.5 – 17.4 – 6,250
Landau (OC) 100 8 kcal/kg kcal/kgThermal – Export Proved 31.3 1.6 45.3 37.2 14.9 0.6 5,990 6,230
Probable 5.9 37.9 39.6 52.0 2.5 20.4 5,980 5,630Total 37.2 39.5 44.4 51.4 17.4 21.0 5,990 5,650
kcal/kg kcal/kgThermal – Domestic Proved – 50.1 – 0.8 – 4,160
Probable – – – – – –Total – 2.0 – 0.8 – 4,160
Mafube (OC) 50.0 11 kcal/kg kcal/kgThermal – Export Proved 32.1 – 63.7 – 21.1 – 5,410 –
Probable 23.0 56.7 62.5 65.2 14.8 36.9 5,380 5,690Total 55.1 56.7 63.2 65.2 35.9 36.9 5,400 5,690
Rietvlei (OC) 34.0 3 kcal/kg kcal/kgThermal – Domestic Proved 4.6 11.4 100 100 4.6 11.4 5,020 4,880
Probable – 1.2 – 100 – 1.2 – 4,880Total 4.6 12.7 100 100 4.6 12.7 5,020 4,880
Zibulo 73.0 9 kcal/kg kcal/kgThermal – Export (UG) Proved 37.5 36.1 43.8 46.9 16.4 17.0 6,500 6,230
Probable 20.8 28.9 43.0 42.1 9.0 12.2 6,500 6,230Total 58.3 64.9 43.5 44.8 25.4 29.3 6,500 6,230
kcal/kg kcal/kgThermal – Domestic (UG) Proved 29.5 27.0 11.1 9.8 5,350 4,970
Probable 30.5 28.7 6.3 8.3 5,290 4,940Total 29.9 27.7 17.4 18.0 5,330 4,960
kcal/kg kcal/kgThermal – Export (OC) Proved 7.4 2.6 34.3 43.1 2.5 1.1 6,500 6,200
Probable – 5.2 – 49.5 – 2.6 – 6,200Total 7.4 7.8 34.3 47.4 2.5 3.7 6,500 6,200
kcal/kg kcal/kgThermal – Domestic (OC) Proved 25.2 27.6 1.9 0.7 5,160 4,920
Probable – 24.0 – 1.3 – 4,910Total 25.2 25.2 1.9 2.0 5,160 4,910
South Africa Thermal – Export 77.0 Mt Mt Plant % Plant % Mt Mt kcal/kg kcal/kgProved 180.5 141.9 55.7 53.8 83.7 55.6 5,990 6,120
Probable 56.3 169.4 53.7 57.7 27.0 91.0 5,830 5,830Total 236.8 311.3 55.2 56.1 110.7 146.6 5,950 5,940
South Africa Thermal – Domestic 65.5 kcal/kg kcal/kgProved 47.4 64.6 17.5 22.7 5,240 4,890
Probable 30.5 36.2 6.3 10.8 5,290 4,930Total 42.9 54.3 23.8 33.5 5,260 4,900
South Africa – Synfuel 100 kcal/kg kcal/kgProved 100 100 21.9 26.1 4,660 4,640
Probable 100 100 5.2 8.8 4,700 4,620Total 100 100 27.1 34.9 4,670 4,630
Mining method: OC = Open Cast/Cut, UG = Underground. Reserve Life = The scheduled extraction period in years for the total Ore Reserves in the approved Life of Mine Plan. For the multi-product operations, the ROM tonnes apply to each product.
The Saleable tonnes cannot be calculated directly from the ROM reserve tonnes using the air dried yields as presented since the difference in moisture content is not taken into account.
Ownership percentages for country totals are weighted by Saleable tonnes and should not be directly applied to the ROM tonnes.
Footnotes appear at the end of the section.
(2) (3) (2) (4)
Anglo American plc Ore Reserves and Mineral Resources Report 2020 29
Ore Reserves and Mineral ResourcesCoal continued

Coal – Australia Operations MTIS Coal Quality
Coal Resources(5) Ownership % Classification 2020 2019 2020 2019
Capcoal (OC) 78.6 Mt Mt kcal/kg kcal/kgMeasured 46.1 46.1 6,910 6,910Indicated 98.7 98.7 6,960 6,960
Measured and Indicated 144.8 144.8 6,940 6,940Inferred (in LOM Plan) 29.7 29.7 6,710 6,710
Inferred (ex. LOM Plan) 146.0 146.0 6,830 6,830Total Inferred 175.7 175.7 6,810 6,810
Capcoal (UG) – Grasstree 70.0 Measured 61.1 61.1 6,840 6,840Indicated 20.1 20.1 6,730 6,730
Measured and Indicated 81.1 81.1 6,810 6,810Inferred (in LOM Plan) – – – –
Inferred (ex. LOM Plan) 5.6 5.6 6,550 6,550Total Inferred 5.6 5.6 6,550 6,550
Dawson (OC) 51.0 Measured 301.9 301.9 6,730 6,730Indicated 455.1 455.1 6,700 6,700
Measured and Indicated 757.1 757.1 6,710 6,710Inferred (in LOM Plan) 5.4 5.4 6,750 6,750
Inferred (ex. LOM Plan) 450.4 450.4 6,760 6,760Total Inferred 455.8 455.8 6,760 6,760
Grosvenor (UG) 88.0 Measured 169.9 169.9 6,460 6,460Indicated 78.5 78.5 6,490 6,490
Measured and Indicated 248.4 248.4 6,470 6,470Inferred (in LOM Plan) 13.0 13.0 6,400 6,400
Inferred (ex. LOM Plan) 55.1 55.1 6,300 6,300Total Inferred 68.1 68.1 6,320 6,320
Moranbah North (UG) 88.0 Measured 92.3 92.3 6,740 6,740Indicated 46.2 46.2 6,560 6,560
Measured and Indicated 138.5 138.5 6,680 6,680Inferred (in LOM Plan) 38.6 38.6 6,540 6,540
Inferred (ex. LOM Plan) 21.6 21.6 6,520 6,520Total Inferred 60.2 60.2 6,530 6,530
Australia – Mine Leases 64.8 Measured 671.4 671.4 6,690 6,690Indicated 698.6 698.6 6,700 6,700
Measured and Indicated 1,370.0 1,370.0 6,690 6,690Inferred (in LOM Plan) 86.6 86.6 6,590 6,590
Inferred (ex. LOM Plan) 678.8 678.8 6,730 6,730Total Inferred 765.4 765.4 6,710 6,710
Coal – Colombia Operations MTIS Coal Quality
Coal Resources(5) Ownership % Classification 2020 2019 2020 2019
Cerrejón (OC) 33.3 Mt Mt kcal/kg kcal/kgMeasured 2,978.6 3,020.0 6,550 6,550Indicated 1,171.7 1,136.3 6,570 6,580
Measured and Indicated 4,150.3 4,156.3 6,560 6,560Inferred (in LOM Plan) 7.1 14.1 6,510 6,090
Inferred (ex. LOM Plan) 594.7 619.6 6,360 6,370Total Inferred 601.7 633.7 6,360 6,360
Coal Resources are reported as additional to Coal Reserves.
Mining method: OC = Open Cast/Cut, UG = Underground. Ownership percentages for country totals are weighted by Total MTIS.
Due to the uncertainty attached to Inferred Coal Resources, it cannot be assumed that all or part of an Inferred Coal Resource will necessarily be upgraded to an Indicated or Measured Coal Resource after continued exploration.
Footnotes appear at the end of the section.
(5)
(6) (6)
(7)
(8)
(7)
(8)
(7)
(8)
(7)
(8)
(7)
(8)
(7)
(8)
(5)
(6) (6)
(7)
(8)
30 Anglo American plc Ore Reserves and Mineral Resources Report 2020
Ore Reserves and Mineral ResourcesCoal continued

Coal – South Africa Operations MTIS Coal Quality
Coal Resources(5) Ownership % Classification 2020 2019 2020 2019
Goedehoop 100 Mt Mt kcal/kg kcal/kgUG Measured 184.0 202.5 5,230 5,360
Indicated 5.5 25.0 5,600 5,100Measured and Indicated 189.4 227.5 5,240 5,330
Inferred (in LOM Plan) – – – –Inferred (ex. LOM Plan) 2.9 6.0 5,820 4,710
Total Inferred 2.9 6.0 5,820 4,710OC Measured 25.5 – 5,120 –
Indicated 3.0 – 5,780 –Measured and Indicated 28.5 – 5,190 –
Inferred (in LOM Plan) – – – –Inferred (ex. LOM Plan) – – – –
Total Inferred – – – –Greenside (UG) 100 Measured 9.4 10.3 5,660 5,610
Indicated 1.5 – 5,510 –Measured and Indicated 10.9 10.3 5,640 5,610
Inferred (in LOM Plan) 2.5 0.2 5,540 5,590Inferred (ex. LOM Plan) 2.0 – 5,570 –
Total Inferred 4.5 0.2 5,550 5,590Isibonelo 100
UG Measured – 5.4 – 4,880Indicated – 18.2 – 5,360
Measured and Indicated – 23.6 – 5,250Inferred (in LOM Plan) – – – –
Inferred (ex. LOM Plan) – – – –Total Inferred – – – –
OC Measured 3.8 – 4,820 –Indicated 3.4 – 4,880 –
Measured and Indicated 7.2 – 4,850 –Inferred (in LOM Plan) – – – –
Inferred (ex. LOM Plan) – – – –Total Inferred – – – –
Kleinkopje (OC) 100 Measured 28.8 0.5 6,020 6,430Indicated 5.0 1.5 6,010 6,180
Measured and Indicated 33.8 2.1 6,020 6,250Inferred (in LOM Plan) – 3.1 – 5,740
Inferred (ex. LOM Plan) 0.5 – 6,190 –Total Inferred 0.5 3.1 6,190 5,740
Landau (OC) 100 Measured 8.4 34.2 5,210 5,020Indicated 3.0 16.7 5,180 5,020
Measured and Indicated 11.4 50.9 5,200 5,020Inferred (in LOM Plan) 2.7 0.6 5,050 6,340
Inferred (ex. LOM Plan) 2.9 5.4 5,190 6,320Total Inferred 5.6 5.9 5,120 6,320
Mafube (OC) 50.0 Measured 58.2 68.6 5,030 5,080Indicated 5.5 2.1 4,960 5,150
Measured and Indicated 63.6 70.7 5,020 5,080Inferred (in LOM Plan) 1.7 – 5,210 –
Inferred (ex. LOM Plan) 0.9 – 5,110 –Total Inferred 2.6 – 5,180 –
Rietvlei (OC) 34.0 Measured 25.4 17.4 5,070 5,020Indicated 5.2 3.8 5,070 5,040
Measured and Indicated 30.6 21.2 5,070 5,020Inferred (in LOM Plan) – – – –
Inferred (ex. LOM Plan) – – – –Total Inferred – – – –
Zibulo (UG) 73.0 Measured 243.5 259.0 4,970 4,960Indicated 161.9 164.4 4,840 4,790
Measured and Indicated 405.4 423.5 4,920 4,890Inferred (in LOM Plan) – – – –
Inferred (ex. LOM Plan) 154.4 163.1 4,750 4,730Total Inferred 154.4 163.1 4,750 4,730
South Africa – Mine Leases 78.5 Measured 586.9 597.9 5,140 5,130Indicated 194.0 231.8 4,920 4,900
Measured and Indicated 780.9 829.7 5,080 5,060Inferred (in LOM Plan) 6.9 3.8 5,270 5,820
Inferred (ex. LOM Plan) 163.6 174.5 4,790 4,770Total Inferred 170.5 178.3 4,810 4,800
Coal Resources are reported as additional to Coal Reserves.
Mining method: OC = Open Cast/Cut, UG = Underground. Ownership percentages for country totals are weighted by Total MTIS.
Due to the uncertainty attached to Inferred Coal Resources, it cannot be assumed that all or part of an Inferred Coal Resource will necessarily be upgraded to an Indicated or Measured Coal Resource after continued exploration.
Footnotes appear at the end of the section.
(5)
(6) (6)
(7)
(8)
(7)
(8)
(7)
(8)
(7)
(8)
(7)
(8)
(7)
(8)
(7)
(8)
(7)
(8)
(7)
(8)
(7)
(8)
(7)
(8)
Anglo American plc Ore Reserves and Mineral Resources Report 2020 31
Ore Reserves and Mineral ResourcesCoal continued

Coal – South Africa MRD Operations Reserve ROM Tonnes(2) Yield Saleable Tonnes Saleable Quality(4)
Coal Reserves(1) Ownership % Life Classification 2020 2019 2020 2019 2020 2019 2020 2019
Goedehoop – MRD 100 3 Mt Mt ROM % ROM % Mt Mt kcal/kg kcal/kg
Thermal – Domestic Proved – – – – – – – –Probable 6.0 4.5 100 94.2 6.0 4.5 3,020 2,840
Total 6.0 4.5 100 94.2 6.0 4.5 3,020 2,840Greenside – MRD 100 3 kcal/kg kcal/kg
Thermal – Export Proved – – – – – – – –Probable 5.1 5.9 58.8 48.3 3.0 2.9 4,680 5,120
Total 5.1 5.9 58.8 48.3 3.0 2.9 4,680 5,120Kleinkopje – MRD 100 – kcal/kg kcal/kg
Thermal – Domestic Proved – – – – – – – –Probable – 8.6 – 84.1 – 7.2 – 4,560
Total – 8.6 – 84.1 – 7.2 – 4,560
Coal – South Africa MRD Operations MTIS Coal Quality
Coal Resources(5) Ownership % Classification 2020 2019 2020 2019
Greenside – MRD 100 Mt Mt kcal/kg kcal/kgMeasured 3.1 2.9 3,860 3,860Indicated – – – –
Measured and Indicated 3.1 2.9 3,860 3,860Inferred (in LOM Plan) – – – –
Inferred (ex. LOM Plan) – – – –Total Inferred – – – –
Kleinkopje – MRD 100 Measured 5.9 – 3,790 –Indicated – 2.4 – 2,700
Measured and Indicated 5.9 2.4 3,790 2,700Inferred (in LOM Plan) – – – –
Inferred (ex. LOM Plan) – – – –Total Inferred – – – –
Landau – MRD 100 Measured – – – –Indicated – 22.4 – 2,580
Measured and Indicated – 22.4 – 2,580Inferred – – – –
Coal Resources are reported as additional to Coal Reserves.
MRD = Mineral Residue Deposit.
Due to the uncertainty attached to Inferred Coal Resources, it cannot be assumed that all or part of an Inferred Coal Resource will necessarily be upgraded to an Indicated or Measured Coal Resource after continued exploration.
Coal – Australia Projects Reserve ROM Tonnes(2) Yield Saleable Tonnes(2) Saleable Quality
Coal Reserves(1) Ownership % Life Classification 2020 2019 2020 2019 2020 2019 2020 2019
Capcoal (UG) – Aquila 70.0 6 Mt Mt ROM % ROM % Mt Mt CSN CSNMetallurgical – Coking Proved 31.5 31.8 67.2 66.0 22.1 22.3 9.0 9.0
Probable 13.4 13.4 65.2 64.2 9.1 9.1 9.0 9.0Total 44.9 45.2 66.6 65.5 31.2 31.4 9.0 9.0
Coal – Canada Projects Reserve ROM Tonnes(2) Yield Saleable Tonnes(2) Saleable Quality(4)
Coal Reserves(1) Ownership % Life Classification 2020 2019 2020 2019 2020 2019 2020 2019
Trend (OC) 100 7 Mt Mt ROM % ROM % Mt Mt CSN CSN
Metallurgical – Coking Proved – – – – – – – –Probable 11.6 11.6 69.5 69.5 8.3 8.3 7.0 7.0
Total 11.6 11.6 69.5 69.5 8.3 8.3 7.0 7.0Roman Mountain (OC) 100 15 CSN CSN
Metallurgical – Coking Proved – – – – – – – –Probable 36.8 36.8 67.0 67.0 25.8 25.8 7.0 7.0
Total 36.8 36.8 67.0 67.0 25.8 25.8 7.0 7.0Canada Metallurgical – Coking 100 Mt Mt Plant % Plant % Mt Mt CSN CSN
Proved – – – – – – – –Probable 48.4 48.4 67.6 67.6 34.1 34.1 7.0 7.0
Total 48.4 48.4 67.6 67.6 34.1 34.1 7.0 7.0
Mining method: OC = Open Cast/Cut, UG = Underground. Reserve Life = The scheduled extraction period in years for the total Ore Reserves in the approved Life of Mine Plan. For the multi-product operations, the ROM tonnes apply to each product.
The Saleable tonnes cannot be calculated directly from the ROM reserve tonnes using the air dried yields as presented since the difference in moisture content is not taken into account.
Ownership percentages for country totals are weighted by Saleable tonnes and should not be directly applied to the ROM tonnes.
Footnotes appear at the end of the section.
(3) (2)
(5)
(6) (6)
(7)
(8)
(7)
(8)
(3) (4)
(3)
32 Anglo American plc Ore Reserves and Mineral Resources Report 2020
Ore Reserves and Mineral ResourcesCoal continued

Coal – Australia Projects MTIS Coal Quality
Coal Resources(5) Ownership % Classification 2020 2019 2020 2019
Capcoal (UG) – Aquila 70.0 Mt Mt kcal/kg kcal/kgMeasured 22.2 22.2 6,740 6,740Indicated 15.8 15.8 6,550 6,550
Measured and Indicated 38.0 38.0 6,660 6,660Inferred (in LOM Plan) 1.4 1.4 6,580 6,580
Inferred (ex. LOM Plan) 2.5 2.5 6,650 6,650Total Inferred 3.8 3.8 6,630 6,630
Moranbah South 50.0 Measured 481.9 481.9 6,270 6,270Indicated 222.5 222.5 6,420 6,420
Measured and Indicated 704.4 704.4 6,320 6,320Inferred 28.0 28.0 6,700 6,700
Theodore 51.0 Measured – – – –Indicated 258.5 258.5 6,260 6,260
Measured and Indicated 258.5 258.5 6,260 6,260Inferred 106.0 106.0 6,160 6,160
Australia – Projects 51.1 Measured 504.1 504.1 6,290 6,290Indicated 496.8 496.8 6,340 6,340
Measured and Indicated 1,000.9 1,000.9 6,320 6,320Inferred (in LOM Plan) 1.4 1.4 6,580 6,580
Inferred (ex. LOM Plan) 136.4 136.4 6,280 6,280Total Inferred 137.8 137.8 6,280 6,280
Coal – Canada Projects MTIS Coal Quality
Coal Resources(5) Ownership % Classification 2020 2019 2020 2019
Belcourt Saxon 100 Mt Mt kcal/kg kcal/kgMeasured 166.7 166.7 6,500 6,500Indicated 4.3 4.3 6,500 6,500
Measured and Indicated 171.0 171.0 6,500 6,500Inferred 0.2 0.2 6,500 6,500
Trend (OC) 100 Measured 20.1 20.1 7,010 7,010Indicated 6.5 6.5 6,900 6,900
Measured and Indicated 26.5 26.5 6,980 6,980Inferred (in LOM Plan) 0.0 0.0 7,600 7,600
Inferred (ex. LOM Plan) 2.6 2.6 6,370 6,370Total Inferred 2.6 2.6 6,370 6,370
Roman Mountain (OC) 100 Measured 1.9 1.9 7,870 7,870Indicated 2.4 2.4 7,940 7,940
Measured and Indicated 4.3 4.3 7,910 7,910Inferred (in LOM Plan) 0.5 0.5 7,920 7,920
Inferred (ex. LOM Plan) 1.7 1.7 7,960 7,960Total Inferred 2.2 2.2 7,950 7,950
Canada – Projects 100 Measured 188.6 188.6 6,570 6,570Indicated 13.1 13.1 6,960 6,960
Measured and Indicated 201.8 201.8 6,600 6,600Inferred (in LOM Plan) 0.5 0.5 7,920 7,920
Inferred (ex. LOM Plan) 4.4 4.4 6,980 6,980Total Inferred 4.8 4.8 7,080 7,080
Coal Resources are reported as additional to Coal Reserves.
Coal – South Africa Projects MTIS Coal Quality
Coal Resources(5) Ownership % Classification 2020 2019 2020 2019
Elders 73.0 Mt Mt kcal/kg kcal/kgMeasured 136.2 86.4 5,190 5,190Indicated 20.7 3.6 4,940 4,900
Measured and Indicated 156.9 89.9 5,160 5,180Inferred 7.7 11.5 4,970 4,930
SACE Life Extension 100 Measured – 67.0 – 5,560Indicated – 8.0 – 5,720
Measured and Indicated – 75.1 – 5,580Inferred – 32.6 – 5,670
South Rand 73.0 Measured 79.5 79.5 4,860 4,860Indicated 171.8 171.8 4,850 4,850
Measured and Indicated 251.3 251.3 4,850 4,850Inferred 233.5 233.5 4,590 4,590
Waterberg (OC) 100 Measured 576.4 – 2,710 –Indicated 732.7 – 2,700 –
Measured and Indicated 1,309.1 – 2,700 –Inferred 640.8 – 2,860 –
Waterberg (UG) 100 Measured 44.2 – 4,730 –Indicated 35.8 – 4,790 –
Measured and Indicated 80.0 – 4,760 –Inferred 81.5 – 4,490 –
South Africa – Projects 93.6 Measured 836.3 232.9 3,430 5,180Indicated 961.0 183.4 3,210 4,890
Measured and Indicated 1,797.3 416.3 3,310 5,050Inferred 963.5 277.6 3,430 4,730
Values reported as 0.0 represent estimates less than 0.05.
Mining method: OC = Open Cast/Cut, UG = Underground. Ownership percentages for country totals are weighted by Total MTIS.
Due to the uncertainty attached to Inferred Coal Resources, it cannot be assumed that all or part of an Inferred Coal Resource will necessarily be upgraded to an Indicated or Measured Coal Resource after continued exploration.
Footnotes appear at the end of the section.
(5)
(6) (6)
(7)
(8)
(7)
(8)
(5)
(6) (6)
(7)
(8)
(7)
(8)
(7)
(8)
(5)
(6) (6)
Anglo American plc Ore Reserves and Mineral Resources Report 2020 33
Ore Reserves and Mineral ResourcesCoal continued

Table footnotes(1) Coal Reserves are quoted on a ROM (Run of Mine) basis in million tonnes, which
represents the tonnes delivered to the plant. Saleable Reserve tonnes represent the estimated product tonnes. Coal Reserves (ROM and Saleable) are reported on the applicable moisture basis.
(2) ROM tonnes are quoted on an As Delivered moisture basis and Saleable tonnes on a Product moisture basis.
(3) Yield – ROM % represents the ratio of Saleable Reserve tonnes to ROM reserve tonnes and is quoted on a constant moisture basis or on an air dried to air dried basis, whereas Plant % is based on the ‘Feed to Plant’ tonnes.
(4) The coal quality for Coal Reserves is quoted as either kilocalories per kilogram (kcal/kg) or Crucible Swell Number (CSN). Kilocalories per kilogram represent Calorific Value (CV) on a Gross As Received (GAR) basis. CV is rounded to the nearest 10 kcal/kg and CSN to the nearest 0.5 index.
(5) Coal Resources are quoted on a Mineable Tonnes In Situ (MTIS) basis in million tonnes, which are additional to those Coal Resources that have been modified to produce the reported Coal Reserves. Coal Resources are reported on an in situ moisture basis.
(6) The coal quality for Coal Resources is quoted on an in situ heat content as kilocalories per kilogram (kcal/kg), representing Calorific Value (CV) rounded to the nearest 10 kcal/kg.
(7) Inferred (in LOM Plan) refers to Inferred Coal Resources that are included in the Life of Mine extraction schedule of the respective operations and are not reported as Coal Reserves.
(8) Inferred (ex. LOM Plan) refers to Inferred Coal Resources outside the Life of Mine Plan but within the mine lease area.
Metallurgical – Coking refers to a high-, medium- or low-volatile semi-soft, soft or hard coking coal primarily for blending and use in the steel industry; quality measured as Crucible Swell Number (CSN).Metallurgical – Other refers to semi-soft, soft, hard, semi-hard or anthracite coal, other than Coking Coal, such as pulverised coal injection (PCI) or other general metallurgical coal for the export or domestic market with a wider range of properties than Coking Coal; quality measured by calorific value (CV). Thermal – Export refers to low- to high-volatile thermal coal primarily for export in the use of power generation; quality measured by calorific value (CV). Thermal – Domestic refers to low- to high-volatile thermal coal primarily for domestic consumption in power generation; quality measured by calorific value (CV). Synfuel refers to a coal specifically for the domestic production of synthetic fuel and chemicals; quality measured by calorific value (CV). Capcoal comprises open cast operations at Lake Lindsay and Oak Park, an underground longwall operation at Grasstree and the Aquila Longwall Project. Lake Lindsay, Grasstree and the Aquila Project are owned by the Capcoal Joint Venture and Oak Park is owned by the Roper Creek Joint Venture. Due to the differing ownership structure, the attributable shareholding of Capcoal OC (Lake Lindsay and Oak Park) is determined annually using the proportion of the Saleable tonnes in the individual pits. The calculated ownership percentage therefore varies each year due to differing production schedules.Jellinbah and Lake Vermont are not reported as Anglo American’s shareholding is below the internal threshold for reporting (25% attributable interest). Peace River Coal consists of Trend and Roman Mountain operations. The Belcourt Saxon Project is a wholly owned entity of Peace River Coal. Kleinkopje and Landau mines operate as Khwezela Colliery under one management structure. Estimates for the following operations were updated by depletion (geological models and Coal Resource estimates not updated): Capcoal (OC), Capcoal (UG) – Grasstree, Dawson, Grosvenor, Moranbah North and Capcoal (UG) - Aquila.
Mineral Tenure Dawson: Renewal application has been lodged for three of the nine Exploration Permits for Coal (EPC 988). There is a reasonable expectation that such approval will not be withheld.Grosvenor: On 18 December, 2020, Anglo American completed the equalisation of ownership across its integrated metallurgical coal operations at Moranbah North and Grosvenor in Queensland, Australia. The ownership structure of Moranbah North has been replicated at Grosvenor, through the sale of a 12% interest in the Grosvenor mine to the same consortium of Japanese companies which hold an equivalent interest at Moranbah North (being Nippon Steel Corporation, Mitsui & Co., Ltd, Nippon Steel Trading Corporation, Shinsho Corporation and JFE Mineral Co., Ltd). As at the date of this report, indicative Ministerial approval for the transfer of the resource authorities for the Grosvenor mine has been secured with final approval pending.Moranbah North: The Teviot Brook area is actively under exploration and contains sufficient identified Coal Resources for the purposes of the current Moranbah North Life of Mine Plan commencing in approximately 2022. Mining Lease for Teviot Brook (ML700042) was granted in Q4 2020, with finalisation of post approval requirements underway.Theodore: MDL216 was successfully renewed in 2020, granting an additional five years of tenure. Cerrejón: Coal Reserves are estimated for the area defined by the current approved Mining Right which expires in 2033. In order to exploit the Coal Resources, a renewal will be applied for at the appropriate time. Elders: The Mining Right has been approved.Isibonelo: The cession of the Zimele Block into the Mining Right has been completed and subsequently incorporated into the Life of Mine plan.
Explanatory notesAustralia – Operations:All operations are reported by depletion, therefore Coal Reserve decreases are due to production.Grosvenor: Possible changes to Coal Reserves from mine layout revisions due to the May 2020 gas ignition event will be declared in the 2021 Reserve Statement.
Colombia – Operations:Cerrejón: Coal Reserves increase due to conversion of Coal Resources to Coal Reserves resulting from a revised mine design. This is partially offset by production.
South Africa – Operations:SRK consulting (South Africa) (Pty) Ltd and Ukwazi Mining Studies (South Africa) (Pty) Ltd have been commissioned to compile a SAMREC compliant Competent Person Report for all assets, with the exception of South Rand which is reported unchanged. Due to an offset in the submission dates of the various reports, there may be differences between the reported figures and the independent Competent Person Reports.Saleable Reserves: The reported Saleable Reserve product type is subject to prevailing market conditions and may be sold in accordance with the current environment.Goedehoop: Coal Reserves decrease primarily due to production, partially offset by the inclusion of additional areas to the mine plan. Coal Resources decrease primarily due to transfer to the existing Elders project on completion of the agreement on Joint Venture ownership. Open cast Coal Resources are reported following an external review.Greenside: Coal Reserves decrease due to the reallocation of Coal Reserves to Coal Resources and production. Isibonelo: Coal Reserves decrease due to revised mine design, exclusion of the S5B seam from the mine plan and production. Underground Coal Resources have been removed due to a pending sale transaction. Kleinkopje: Mining and MRD operations have been placed on Care and Maintenance, resulting in reallocation of Coal Reserves to Coal Resources.Landau: Coal Resources decrease due to exclusion of areas no longer meeting the reasonable prospect of eventual economic extraction requirements. Landau MRD: Coal Resources removed due to unfavourable market conditions.Rietvlei: Coal Reserves decrease due to the reallocation of Coal Reserves to Coal Resources resulting from changes to contractual supply agreement and production.Zibulo: Coal Reserves decrease primarily due to production and revised mine design.
Australia – Projects:Capcoal (UG) – Aquila: Scheduled production at Aquila Project will replace production from Capcoal (UG) - Grasstree Mine when it ceases operations in 2022.
Canada – Projects: Trend and Roman Mountain: The mines were placed on care and maintenance at the end of 2014. The Mineral Resources are considered to have reasonable prospects for eventual economic extraction based on current long term economic assumptions.
South Africa – Projects:Elders: Coal Resources increase primarily due to transfer from the Goedehoop operation on completion of the agreement on Joint Venture ownership, now wholly owned by Anglo American Inyosi Coal.SACE Life Extension: Coal Resources have been removed due to environmental permitting considerations.South Rand: The project is part of a disposal process; transfer of the Mineral Rights is pending.Waterberg: First time reporting of Coal Resources following agreement with Joint Venture partner.
Audits related to the generation of the Coal Reserve estimates were carried out by independent consultants during 2020 at the following operations: Goedehoop, Greenside, Isibonelo, Landau, Mafube and Zibulo.
Audits related to the generation of the Coal Resource estimates were carried out by independent consultants during 2020 at the following operations and projects: Elders, Goedehoop, Greenside, Isibonelo, Kleinkopje, Landau, Mafube, Waterberg and Zibulo.
34 Anglo American plc Ore Reserves and Mineral Resources Report 2020
Ore Reserves and Mineral ResourcesCoal continued

NickelThe Ore Reserve and Mineral Resource estimates are reported in accordance with the Australasian Code for Reporting of Exploration Results, Mineral Resources and Ore Reserves (The JORC Code, 2012) as a minimum standard. The reported estimates represent 100% of the Ore Reserves and Mineral Resources. Rounding of figures may cause computational discrepancies for totals.
Nickel – OperationsOre Reserves
ReserveLife
ROM Tonnes Grade Contained Nickel
Ownership % Classification 2020 2019 2020 2019 2020 2019
Barro Alto (OP) 100 20 Mt Mt %Ni %Ni kt ktSaprolite Proved 13.1 16.7 1.39 1.39 182 232
Probable 41.6 39.9 1.25 1.25 520 499Total 54.7 56.6 1.28 1.29 702 731
Niquelândia (OP) 100 17 %Ni %Ni
Saprolite Proved – – – – – –Probable 5.6 8.3 1.32 1.25 74 104
Total 5.6 8.3 1.32 1.25 74 104
Nickel – OperationsMineral Resources
Tonnes Grade Contained Nickel
Ownership % Classification 2020 2019 2020 2019 2020 2019
Barro Alto (OP) 100 Mt Mt %Ni %Ni kt ktSaprolite Measured 1.6 0.6 1.24 1.36 20 8
Indicated 7.9 5.7 1.18 1.19 93 68Measured and Indicated 9.4 6.3 1.19 1.21 112 76
Inferred (in LOM Plan) 5.8 8.8 1.31 1.30 76 114Inferred (ex. LOM Plan) 2.1 7.5 1.09 1.23 23 92
Total Inferred 7.9 16.3 1.25 1.27 99 206Ferruginous Laterite Measured – – – – – –
Indicated 7.0 4.1 1.26 1.21 89 49Measured and Indicated 7.0 4.1 1.26 1.21 89 49
Inferred (in LOM Plan) – – – – – –Inferred (ex. LOM Plan) 4.2 4.7 1.18 1.20 49 56
Total Inferred 4.2 4.7 1.18 1.20 49 56Niquelândia (OP) 100 %Ni %Ni
Saprolite Measured – – – – – –Indicated 4.1 2.3 1.24 1.29 51 30
Measured and Indicated 4.1 2.3 1.24 1.29 51 30Inferred (in LOM Plan) – – – – – –
Inferred (ex. LOM Plan) – – – – – –Total Inferred – – – – – –
Ferruginous Laterite Measured – – – – – –Indicated – – – – – –
Measured and Indicated – – – – – –Inferred (in LOM Plan) – – – – – –
Inferred (ex. LOM Plan) 3.2 – 1.10 – 35 –Total Inferred 3.2 – 1.10 – 35 –
Mineral Resources are reported as additional to Ore Reserves. Nickel – Projects Mineral Resources
Tonnes Grade Contained Nickel
Ownership % Classification 2020 2019 2020 2019 2020 2019
Jacaré 100 Mt Mt %Ni %Ni kt ktFerruginous Laterite Measured 6.3 6.3 1.15 1.15 72 72
Indicated 53.8 53.8 1.21 1.21 651 651Measured and Indicated 60.1 60.1 1.21 1.21 723 723
Inferred 125.0 125.0 1.17 1.17 1,462 1,462Saprolite Measured – – – – – –
Indicated 39.6 39.6 1.49 1.49 590 590Measured and Indicated 39.6 39.6 1.49 1.49 590 590
Inferred 81.9 81.9 1.39 1.39 1,138 1,138
Mining method: OP = Open Pit. Reserve Life = The scheduled extraction period in years for the total Ore Reserves in the approved Life of Mine Plan.
Due to the uncertainty attached to Inferred Mineral Resources, it cannot be assumed that all or part of an Inferred Mineral Resource will necessarily be upgraded to an Indicated or Measured Resource after continued exploration.
Nickel estimates as at 31 December 2020
Anglo American plc Ore Reserves and Mineral Resources Report 2020 35
Ore Reserves and Mineral Resources

Explanatory notesBarro Alto – Ore Reserves: The Ore Reserves are derived from a mine plan which targets a smelter feed of between 12.5–19.0 %Fe (limited to 16.5 %Fe in the first two years) and a SiO2/(MgO+CaO) ratio of 1.82. The decrease is primarily due to production which is partially offset by the conversion of Mineral Resources to Ore Reserves resulting from additional drilling. There is a material amount of Inferred Resources in the current LOM Plan; however work is ongoing to reduce the proportion of Inferred in the LOM Plan. A stockpile of ~200 kt Ni (14.9 Mt at 1.34 %Ni) Probable Reserves is excluded from the table. The stockpile material is used for blending when the appropriate smelter feed chemistry can be achieved.Niquelândia – Ore Reserves: The Niquelândia Mine is adjacent to the Codemin Ferro-Nickel smelter which is fed with ore from Barro Alto. Plans exist to blend with Niquelândia ore to achieve an appropriate smelter feed chemistry. Ore Reserves are derived from a mine plan which targets a smelter feed between 13.0–19.0 %Fe (limited to 15.3 %Fe in first five years) and a SiO2/(MgO+CaO) ratio of 1.75. The decrease is primarily due to reallocation of Ore Reserves to Mineral Resources resulting from a revised mine scheduling strategy.Barro Alto – Saprolite Mineral Resources: Mineral Resources are quoted above a 0.9 %Ni cut-off. The decrease is primarily due to conversion of Mineral Resources to Ore Reserves, additional drilling information and model refinement. A stockpile of ~60 kt Ni (4.7 Mt at 1.28 %Ni) Indicated Resources is excluded from the table. Barro Alto – Ferruginous Laterite Mineral Resources: Material that is scheduled for stockpiling or has already been mined and stockpiled. The increase is primarily due to revised model interpretation and revised economic assumptions.A stockpile of ~20 kt Ni (1.5 Mt at 1.33 %Ni) Indicated Resources is excluded from the table.Niquelândia – Saprolite Mineral Resources: Mineral Resources are quoted above a 0.9 %Ni cut-off. The increase is due to reallocation of Ore Reserves to Mineral Resources resulting from a revised mine scheduling strategy.Niquelândia – Ferruginous Laterite Mineral Resources: First time reporting resulting from model re-interpretation.Jacaré: The Mineral Resources are reported within a pit shell developed for the Concept Study. A minimum mineralised width of 1 m must be present to allow material to be categorised as higher grade Saprolite Mineral Resource (1.5 m for Low Grade Saprolite and Ferruginous Laterite). The Saprolite Resources are a combination of higher grade Mineral Resources (>1.3 %Ni) that are expected to feed a pyrometallurgical treatment facility and lower grade Mineral Resources (1.3–0.9 %Ni) that could be used to neutralise the acid in the proposed hydrometallurgical treatment of the Ferruginous Laterite material while still recovering Nickel in the process. The Ferruginous Laterite has an average Cobalt grade of 0.19 %Co which can be recovered as by-product in the hydrometallurgical process. The estimates have been reviewed and meet the reasonable prospects of eventual economic extraction requirements. The Plano de Aproveitamento Econômico (PAE) is in progress and pending approval by Brazil’s Agência Nacional de Mineração (ANM).
No audits related to the generation of the Ore Reserve and Mineral Resource estimates were carried out by independent consultants during 2020.
36 Anglo American plc Ore Reserves and Mineral Resources Report 2020
Ore Reserves and Mineral ResourcesNickel continued

Samancor ManganeseThe Ore Reserve and Mineral Resource estimates are reported in accordance with the Australasian Code for Reporting of Exploration Results, Mineral Resources and Ore Reserves (The JORC Code, 2012). Rounding of figures may cause computational discrepancies. The reported estimates represent 100% of the Ore Reserves and Mineral Resources on an inclusive basis (source: South32).
Samancor Manganese – Operations ReserveLife
Tonnes Grade Yield
Ore Reserves Ownership % Classification 2020 2019 2020 2019 2020 2019
GEMCO (OP) 40.0 5 Mt Mt %Mn %Mn % %ROM Proved 38 40 43.3 43.5 62 61
Probable 8.7 13 43.6 42.5 58 61Total 47 53 43.4 43.3 61 61
Sands Proved – – – – – –Probable 5.2 6.8 40.0 40.0 22 22
Total 5.2 6.8 40.0 40.0 22 22Hotazel Manganese Mines 29.6 %Mn %Mn
Mamatwan (OP) 15 Proved 17 18 37.0 37.0Probable 31 33 36.5 36.5
Total 48 51 36.7 36.6Wessels (UG) 45 Proved 2.0 – 42.8 –
Probable 59 78 41.1 42.4Total 61 78 41.2 42.4
Samancor Manganese – Operations Tonnes Grade Yield
Mineral Resources Ownership % Classification 2020 2019 2020 2019 2020 2019
GEMCO (OP) 40.0 Mt Mt %Mn %Mn % %ROM Measured 75 71 45.2 45.7 49 49
Indicated 43 53 41.0 41.9 47 48Measured and Indicated 118 124 43.7 44.1 48 49
Inferred 15 22 40.9 39.9 49 48Sands Measured – – – – – –
Indicated 6.7 8.1 20.8 20.8 – –Measured and Indicated 6.7 8.1 20.8 20.8 – –
Inferred 2.3 2.3 20.0 20.0 – –Hotazel Manganese Mines 29.6 %Mn %Mn
Mamatwan (OP) Measured 31 32 35.0 35.0Indicated 46 52 34.9 34.7
Measured and Indicated 77 84 34.9 34.8Inferred 0.5 0.5 37.4 37.4
Wessels (UG) Measured 21 – 42.5 –Indicated 98 136 41.6 42.5
Measured and Indicated 119 136 41.8 42.5Inferred 23 7.7 41.0 44.1
The Measured and Indicated Mineral Resources are inclusive of those Mineral Resources modified to produce the Ore Reserves.
Mining method: OP = Open Pit, UG = Underground.Reserve Life = The scheduled extraction period in years for the total Ore Reserves in the approved life of operations plan. The tonnage is quoted as dry metric tonnes.
Due to the uncertainty attached to Inferred Mineral Resources, it cannot be assumed that all or part of an Inferred Mineral Resource will necessarily be upgraded to an Indicated or Measured Resource after continued exploration.
Samancor Manganese is a Joint Venture with South32. Estimates are prepared and signed-off under the South32 reporting policy.
Explanatory notesGEMCO – Ore Reserves: ROM Ore Reserve estimates are reported at a cut-off of ≥40.0 %Mn washed product. Sands Ore Reserve estimates are reported with no cut-off applied. Ore Reserve tonnes are stated as delivered to process plant; manganese grades are reported as expected product and should be read together with their respective mass yields. Ore Reserves decrease primarily due to production.Mamatwan – Ore Reserves: Ore Reserves for all zones are reported at a cut-off of ≥35.0 %Mn.Wessels – Ore Reserves: Ore Reserves for the Lower Body and Upper Body ore types are reported at a cut-off of ≥37.5 %Mn. Ore Reserves decrease primarily due to reclassification of Mineral Resources.GEMCO – Mineral Resources: ROM Mineral Resources are reported at a cut-off of ≥35.0 %Mn washed product. Sands Mineral Resources are reported with no cut-off applied. ROM Mineral Resource tonnes are stated as in situ; manganese grades are given as per washed ore samples and should be read together with their respective mass recovery expressed as yield. Sands Mineral Resource tonnes and manganese grades are reported as in situ.
Mamatwan – Mineral Resources: Mineral Resources within the M, C and N Zones are reported with no cut-off applied and X Zones are reported at a cut-off of ≥35.0 %Mn. The Top Cut (balance I&O) Mineral Resources are reported at a cut-off of ≥28.0 %Mn. Wessels – Mineral Resources: Mineral Resources within the Lower Body and Upper Body ore types are reported at a cut-off of ≥37.5 %Mn.
For additional details please refer to the South32 Annual Report 2020.
Manganese estimates as at 31 December 2020
Anglo American plc Ore Reserves and Mineral Resources Report 2020 37
Ore Reserves and Mineral Resources

Crop NutrientsThe Ore Reserve and Mineral Resource estimates are reported in accordance with the Australasian Code for Reporting of Exploration Results, Mineral Resources and Ore Reserves (The JORC Code, 2012) as a minimum standard. The reported estimates represent 100% of the Ore Reserves and Mineral Resources. Rounding of figures may cause computational discrepancies for totals.
Crop Nutrients – Projects ReserveLife
ROM Tonnes Grade
Ore Reserves Ownership % Classification 2020 2019 2020 2019
Woodsmith (UG) 100 27 Mt Mt %Pht %PhtShelf Proved – – – –
Probable 290.0 – 88.8 –Total 290.0 – 88.8 –
Crop Nutrients – Projects Tonnes Grade
Mineral Resources Ownership % Classification 2020 2019 2020 2019
Woodsmith (UG) 100 Mt Mt %Pht %PhtShelf Measured – – – –
Indicated 230.0 – 81.5 –Measured and Indicated 230.0 – 81.5 –
Inferred (in LOM Plan) 290.0 – 86.1 –Inferred (ex. LOM Plan) 520.0 – 80.2 –
Total Inferred 810.0 – 82.3 –Basin Measured – – – –
Indicated – – – –Measured and Indicated – – – –
Inferred (in LOM Plan) – – – –Inferred (ex. LOM Plan) 960.0 – 86.3 –
Total Inferred 960.0 – 86.3 –
Mineral Resources are reported as additional to Ore Reserves.
Mining method: UG = Underground. Reserve Life = The scheduled extraction period in years for the total Ore Reserves in the approved life of operations plan. The tonnage is quoted as dry metric tonnes.%Pht - weight percent Polyhalite.
Due to the uncertainty attached to Inferred Mineral Resources, it cannot be assumed that all or part of an Inferred Mineral Resource will necessarily be upgraded to an Indicated or Measured Resource after continued exploration.
Explanatory notesAnglo American has completed the acquisition of Sirius Minerals Plc which has been developing a major new polyhalite project in the United Kingdom. Anglo American is continuing to develop what is known as the Woodsmith project to access the world’s largest known deposit of polyhalite, an evaporite mineral consisting of hydrous sulphate of potassium, calcium and magnesium. As such, polyhalite is a natural mineral fertiliser containing four of the six nutrients necessary for plant growth.Ore Reserves and Mineral Resources have been assessed and continue to be reported per the Sirius Minerals declaration, but on an exclusive reporting basis.
In 2021 an update of the Life of Mine plan will be completed to reflect the current status of the operation and the results of technical work undertaken by Anglo American. This will include a review of the geological interpretation of the Basin Seam, reasonable prospects for eventual economic extraction assumptions and the Life of Mine Plan. The outcome of these studies may result in changes to the Life of Mine Plan, Reserve Life, Ore Reserves and Mineral Resources.
No audits related to the generation of the Ore Reserve and Mineral Resource estimates were carried out by independent consultants during 2020 but the estimates themselves have been derived and reported by Competent Persons who are independent of Anglo American.
Crop Nutrients estimates as at 31 December 2020
38 Anglo American plc Ore Reserves and Mineral Resources Report 2020
Ore Reserves and Mineral Resources

Ore ReservesAn ‘Ore Reserve’ is the economically mineable part of a Measured and/or Indicated Mineral Resource. It includes diluting materials and allowances for losses, which may occur when the material is mined or extracted and is defined by studies at Pre-Feasibility or Feasibility level as appropriate that include application of Modifying Factors. Such studies demonstrate that, at the time of reporting, extraction could reasonably be justified. ‘Modifying Factors’ are (realistically assumed) considerations used to convert Mineral Resources to Ore Reserves. These include, but are not restricted to, mining, processing, metallurgical, infrastructure, economic, marketing, legal, environmental, social and governmental factors. Ore Reserves are sub-divided in order of increasing confidence into Probable Ore Reserves and Proved Ore Reserves.
A ‘Proved Ore Reserve’ is the economically mineable part of a Measured Mineral Resource. A Proved Ore Reserve implies a high degree of confidence in the Modifying Factors.
A ‘Probable Ore Reserve’ is the economically mineable part of an Indicated, and in some circumstances, a Measured Mineral Resource. The confidence in the Modifying Factors applying to a Probable Ore Reserve is lower than that applying to a Proved Ore Reserve. A Probable Ore Reserve has a lower level of confidence than a Proved Ore Reserve but is of sufficient quality to serve as the basis for a decision on the development of the deposit.
Mineral ResourcesA ‘Mineral Resource’ is a concentration or occurrence of solid material of economic interest in or on the Earth’s crust in such form, grade (or quality), and quantity that there are reasonable prospects for eventual economic extraction. The location, quantity, grade (or quality), continuity and other geological characteristics of a Mineral Resource are known, estimated or interpreted from specific geological evidence and knowledge, including sampling. Mineral Resources are sub-divided, in order of increasing geological confidence, into Inferred, Indicated and Measured categories.
A ‘Measured Mineral Resource’ is that part of a Mineral Resource for which quantity, grade (or quality), densities, shape and physical characteristics are estimated with confidence sufficient to allow the application of Modifying Factors to support detailed mine planning and final evaluation of the economic viability of the deposit. Geological evidence is derived from detailed and reliable exploration, sampling and testing gathered through appropriate techniques from locations such as outcrops, trenches, pits, workings and drill holes, and is sufficient to confirm geological and grade (or quality) continuity between points of observation where data and samples are gathered.
A Measured Mineral Resource has a higher level of confidence than that applying to either an Indicated Mineral Resource or an Inferred Mineral Resource. It may be converted to a Proved Ore Reserve or under certain circumstances to a Probable Ore Reserve.
An ‘Indicated Mineral Resource’ is that part of a Mineral Resource for which quantity, grade (or quality), densities, shape and physical characteristics are estimated with sufficient confidence to allow the application of Modifying Factors in sufficient detail to support mine planning and evaluation of the economic viability of the deposit. Geological evidence is derived from adequately detailed and reliable exploration, sampling and testing gathered through appropriate techniques from locations such as outcrops, trenches, pits, workings and drill holes, and is sufficient to assume geological and grade (or quality) continuity between points of observation where data and samples are gathered.
An Indicated Mineral Resource has a lower level of confidence than that applying to a Measured Mineral Resource and may only be converted to a Probable Ore Reserve.
An ‘Inferred Mineral Resource’ is that part of a Mineral Resource for which quantity and grade (or quality) are estimated on the basis of limited geological evidence and sampling. Geological evidence is sufficient to imply but not verify geological and grade (or quality) continuity. It is based on exploration, sampling and testing information gathered through appropriate techniques from locations such as outcrops, trenches, pits, workings and drill holes.
An Inferred Mineral Resource has a lower level of confidence than that applying to an Indicated Mineral Resource and must not be converted to an Ore Reserve. It is reasonably expected that the majority of Inferred Mineral Resources could be upgraded to Indicated Mineral Resources with continued exploration.
Mineralisation‘Mineralisation’ is a concentration (or occurrence) of material of possible economic interest, in or on the Earth’s crust, for which the quantity and quality cannot be estimated with sufficient confidence to be defined as a Mineral Resource. Mineralisation is not classified as a Mineral Resource or Ore Reserve. The data and information relating to it must be sufficient to allow a considered and balanced judgement of its significance.
Common terminologyGradeThe relative quantity, percentage or quality of a metal or mineral/diamond content estimated to be contained within a deposit.
Cut-off (grade)A grade (see grade units) above which the Mineral Resource or Ore Reserve is reported as being potentially economic.
Run of Mine (ROM)The mined material delivered from the mine to the processing plant is called Run of Mine, or ROM. This is the raw unprocessed mineralised material and includes mineralised rock and varying amounts of internal and external contamination (either unmineralised rock or mineralised material below the cut-off grade). Contamination is usually introduced by the mining process to ensure all the mineralised material is mined or to provide a minimum mining height. ROM material can have highly variable moisture content and maximum particle size.
Inferred (in LOM Plan)/Inferred (ex. LOM Plan)Inferred (in LOM Plan): Inferred Resources within the scheduled Life of Mine Plan (LOM Plan). Inferred (ex. LOM Plan): the portion of Inferred Resources with reasonable prospects for eventual economic extraction not considered in the Life of Mine Plan (LOM Plan).
Reserve LifeThe scheduled extraction period in years for the total Ore Reserves in the approved Life of Mine Plan.
Life of Mine Plan (LOM/LOM Plan)A design and costing study of an existing operation in which appropriate assessments have been made of realistically assumed geological, mining, processing, metallurgical, economic, infrastructure, marketing, legal, environmental, social, governmental, engineering, operational and all other Modifying Factors, which are considered in sufficient detail to demonstrate at the time of reporting that extraction is reasonably justified.
Reasonable Prospects for Eventual Economic Extraction (RPEEE)Assessment of RPEEE implies the judgement (albeit preliminary) by the Competent Person in respect of technical and economic factors likely to influence the prospect of economic extraction. The test should be applied at an appropriate and reasonable scale including consideration of geological, mining, metallurgical, processing, economic, marketing, legal, governmental, infrastructure, environmental and socio-political factors.
Definitions
Anglo American plc Ore Reserves and Mineral Resources Report 2020 39
Ore Reserves and Mineral Resources

TotalNegativePositive
Detailed 2019 and 2020 information appears on pages 10-38. Rounding of figures may cause computational discrepancies.
Reserve and Resource reconciliation overview 2019–2020(1)(2)
2019 Conversion
▲ 0.5
▼ 6.8 ▼ 0.0▲ 0.0
▼ 0.1 ▼ 0.446.2
53.0
Economic Assumptions
NewInformation
Production Model Refinement
Methodology Transfer New Technology
Stockpiles Reconciliation Adjustment
Acquisitions Disposals 2020
De Beers Canada 2019–2020 Diamond Reserves reconciliationSaleable Carats (Mct) – Operations (including Stockpiles) (100% basis)
35
40
45
50
55
2019 Conversion Economic Assumptions
NewInformation
Depletion Model Refinement
Methodology Transfer New Technology
Stockpiles Reconciliation Adjustment
Acquisitions Disposals 2020
De Beers Canada 2019–2020 Exclusive Diamond Resources reconciliationCarats (Mct) – Operations (100% basis)
19
20
22
21
23
21.8
22.2
▼0.4
▲0.1 ▲0.2
▼0.1 ▼0.1
2019 Production Conversion Economic Assumptions
NewInformation
Model Refinement
Methodology Transfer New Technology
Stockpiles Reconciliation Adjustment
Acquisitions Disposals 2020
De Beers Consolidated Mines 2019–2020 Diamond Reserves reconciliationSaleable Carats (Mct) – Operations (including Stockpiles) (100% basis)
75
80
85
90
95
▼2.9▼1.7 ▼0.1
81.5
89.8
▼3.5
2019 Depletion Conversion Economic Assumptions
NewInformation
Model Refinement
Methodology Transfer New Technology
Stockpiles Reconciliation Adjustment
Acquisitions Disposals 2020
De Beers Consolidated Mines 2019–2020 Exclusive Diamond Resources reconciliationCarats (Mct) – Operations (100% basis)
▼0.064.965.0
67
66
65
64
63
40 Anglo American plc Ore Reserves and Mineral Resources Report 2020
Ore Reserves and Mineral Resources

TotalNegativePositive
Detailed 2019 and 2020 information appears on pages 10-38. Rounding of figures may cause computational discrepancies.
2019 Production Conversion Economic Assumptions
NewInformation
Model Refinement
Methodology Transfer New Technology
Stockpiles Reconciliation Adjustment
Acquisitions Disposals 2020
Debswana Diamond Company 2019–2020 Diamond Reserves reconciliationSaleable Carats (Mct) – Operations, TMRs, ORTs and Stockpiles (100% basis)
280
290
300
310
320
299.5
306.6▲11.1
▼2.0
▲0.4
▼13.4
▼3.3
2019 Depletion Conversion Economic Assumptions
NewInformation
Model Refinement
Methodology Transfer New Technology
Stockpiles Reconciliation Adjustment
Acquisitions Disposals 2020
Debswana Diamond Company 2019–2020 Exclusive Diamond Resources reconciliationCarats (Mct) – Operations, TMRs, ORTs and Stockpiles (100% basis)
660
670
680
690
700
▼2.8
▲2.9▲4.5
▲3.3▲2.0
▼0.2692.6
682.9
2019 Production Conversion Economic Assumptions
NewInformation
Model Refinement
Methodology Transfer New Technology
Stockpiles Reconciliation Adjustment
Acquisitions Disposals 2020
Namdeb Holdings 2019–2020 Terrestrial Diamond Reserves reconciliationSaleable Carats (kct) – Operations (100% basis)
0
50
100
150
103.0
130.0
▼28.0▼5.0
▼1.0▲3.0
▲4.0
2019 Depletion Conversion Economic Assumptions
NewInformation
Model Refinement
Methodology Transfer New Technology
Stockpiles Reconciliation Adjustment
Acquisitions Disposals 2020
Namdeb Holdings 2019–2020 Terrestrial Exclusive Diamond Resources reconciliationCarats (kct) – Operations, TMRs and Stockpiles (Disposal reflects the sale of the Elizabeth Bay and Douglas Bay operations) (100% basis)
4,500
5,000
5,500
6,000
6,500
7,000
7,500
▼259.0▼2.0
▼2.0
▼2,460.0
▲153.0▲184.0 ▲2.0
▲5.0 ▲13.0
5,011.0
7,377.0
Anglo American plc Ore Reserves and Mineral Resources Report 2020 41
Ore Reserves and Mineral ResourcesReserve and Resource reconciliation overview continued

TotalNegativePositive
Detailed 2019 and 2020 information appears on pages 10-38. Rounding of figures may cause computational discrepancies.
2019 Production Conversion Economic Assumptions
NewInformation
Model Refinement
Methodology Transfer New Technology
Stockpiles Reconciliation Adjustment
Acquisitions Disposals 2020
Namdeb Holdings 2019–2020 O�shore Diamond Reserves reconciliationSaleable Carats (kct) – Operations (100% basis)
0
3,500
7,000 6,697.06,209.0
▲962.0
▲629.0▼59.0
▼1,044.0
1,750
5,250
2019 Depletion Conversion Economic Assumptions
NewInformation
Model Refinement
Methodology Transfer New Technology
Stockpiles Reconciliation Adjustment
Acquisitions Disposals 2020
Namdeb Holdings 2019–2020 O�shore Exclusive Diamond Resources reconciliationCarats (kct) – Operations (100% basis)
80,000
81,000
82,000
84,000
83,000
82,151.0
82,980.0
▼686.0
▼1,150.0
▼192.0
▲1,030.0 ▲169.0
2019 Production Conversion Economic Assumptions
NewInformation
Model Refinement
Methodology Transfer New Technology
Stockpiles Reconciliation Adjustment
Acquisitions Disposals 2020
Copper 2019–2020 Ore Reserves reconciliationContained Copper (kt) – Operations (including Stockpiles) (100% basis)
36,000
38,000
40,000
44,000
42,000
42,712.3
37,920.8
▲6,022.5
▼220.2 ▼0.2
▲50.4 ▲54.2 ▲107.9
▼1,223.2
2019 Depletion Conversion Economic Assumptions
NewInformation
Model Refinement
Methodology Transfer New Technology
Stockpiles Reconciliation Adjustment
Acquisitions Disposals 2020
Copper 2019–2020 Exclusive Mineral Resources reconciliationContained Copper (kt) – Operations (including Stockpiles) (100% basis)
68,000
60,000
62,000
64,000
66,000
63,620.2
67,291.5▼0.7
▼6,133.8
▼0.7
▼0,000.0
▲6.1
▲2,416.6 ▲41.2
42 Anglo American plc Ore Reserves and Mineral Resources Report 2020
Ore Reserves and Mineral ResourcesReserve and Resource reconciliation overview continued

TotalNegativePositive
Detailed 2019 and 2020 information appears on pages 10-38. Rounding of figures may cause computational discrepancies.
2019 Production Conversion Economic Assumptions
NewInformation
Model Refinement
Methodology Transfer New Technology
Stockpiles Reconciliation Adjustment
Acquisitions Disposals 2020
Platinum 2019–2020 Ore Reserves reconciliationContained Metal (4E Moz) – All Reefs, Stockpiles and MSZ (100% basis)
▼3.4
▼1.4
▼0.0149.6
151.5
▲2.8 ▲0.1
146
148
150
152
2019 Depletion Conversion Economic Assumptions
NewInformation
Model Refinement
Methodology Transfer New Technology
Stockpiles Reconciliation Adjustment
Acquisitions Disposals 2020
Platinum 2019–2020 Exclusive Mineral Resources reconciliationContained Metal (4E Moz) – All Reefs, Tailings, Stockpiles and MSZ (Disposal reflects the sale of the KV and SR Claims at Unki Mine) (100% basis)
550
575
600
625
675
650
▼0.0 ▼1.5 ▼0.8
▲2.3
▲71.7▼0.2 ▼1.4
662.7
592.8
2019 Production Conversion Economic Assumptions
NewInformation
Model Refinement
Methodology Transfer New Technology
Stockpiles Reconciliation Adjustment
Acquisitions Disposals 2020
Kumba Iron Ore 2019–2020 Ore Reserves reconciliationROM Tonnes (Mt) – Operations (including Stockpiles) (100% basis)
580
640
700
760
▼43.2
▼0.1
▲22.9
▲52.0 ▲0.7▲5.9 729.9
691.7
2019 Depletion Conversion Economic Assumptions
NewInformation
Model Refinement
Methodology Transfer New Technology
Stockpiles Reconciliation Adjustment
Acquisitions Disposals 2020
Kumba Iron Ore 2019–2020 Exclusive Mineral Resources reconciliationTonnes (Mt) – Operations (including Stockpiles) (100% basis)
704.8
570.3
▼10.0
▼5.6
–79.4
▲5.6 ▲1.1
▲54.4
▲89.0
500
600
700
800
Anglo American plc Ore Reserves and Mineral Resources Report 2020 43
Ore Reserves and Mineral ResourcesReserve and Resource reconciliation overview continued

TotalNegativePositive
Detailed 2019 and 2020 information appears on pages 10-38. Rounding of figures may cause computational discrepancies.
2019 Production Conversion Economic Assumptions
NewInformation
Model Refinement
Methodology Transfer New Technology
Stockpiles Reconciliation Adjustment
Acquisitions Disposals 2020
Minas-Rio 2019–2020 Ore Reserves reconciliationROM Tonnes (Mt) – Operation (100% basis)
3,493.0
3,281.6▼8.7
▲129.0
▲86.4▲45.6 ▲4.0
▼44.8
3,000
3,200
3,400
3,600
2019 Depletion Conversion Economic Assumptions
NewInformation
Model Refinement
Methodology Transfer New Technology
Stockpiles Reconciliation Adjustment
Acquisitions Disposals 2020
Minas-Rio 2019–2020 Exclusive Mineral Resources reconciliationTonnes (Mt) – Operation and Project (Serra do Sapo and Itapanhoacanga) (100% basis)
▼129.0
▼43.9
2,590.8
2,584.4 ▲132.8
▲46.42,584.4
2,300
2,400
2,500
2,600
2,700
2019 Production Conversion Economic Assumptions
NewInformation
Model Refinement
Methodology Transfer New Technology
Stockpiles Reconciliation Adjustment
Acquisitions Disposals 2020
Coal Australia 2019–2020 Coal Reserves reconciliationROM Tonnes (Mt) – Operations (100% basis)
▼30.1
▲0.0 576.7
606.7
500
550
600
650
450
2019 Depletion Conversion Economic Assumptions
NewInformation
Model Refinement
Methodology Transfer New Technology
Stockpiles Reconciliation Adjustment
Acquisitions Disposals 2020
Coal Australia 2019–2020 Exclusive Coal Resources reconciliationMTIS Tonnes (Mt) – Operations (100% basis)
2,135.42,135.4
500
1,000
1,500
2,000
2,500
44 Anglo American plc Ore Reserves and Mineral Resources Report 2020
Ore Reserves and Mineral ResourcesReserve and Resource reconciliation overview continued

TotalNegativePositive
Detailed 2019 and 2020 information appears on pages 10-38. Rounding of figures may cause computational discrepancies.
2019 Production Conversion Economic Assumptions
NewInformation
Model Refinement
Methodology Transfer New Technology
Stockpiles Reconciliation Adjustment
Acquisitions Disposals 2020
Coal South Africa 2019–2020 Coal Reserves reconciliationROM Tonnes (Mt) – Operations and MRDs (100% basis)
100
250
200
150
300
350
▼40.9 ▼1.1▼9.5
▲2.0▲0.8 ▲2.3
330.3
▼40.6▲4.6 247.9
2019 Depletion Conversion Economic Assumptions
NewInformation
Model Refinement
Methodology Transfer New Technology
Stockpiles Reconciliation Adjustment
Acquisitions Disposals 2020
Coal South Africa 2019–2020 Exclusive Coal Resources reconciliationMTIS Tonnes (Mt) – Operations and MRDs (100% basis)
800
900
1,000
1,200
1,100
▼1.5
▲39.3 ▲2.3
▲7.3
▲8.3 ▲2.3 ▲5.0
▲14.2▲21.5
▼173.9
960.4
1,035.7
2019 Production Conversion Economic Assumptions
NewInformation
Model Refinement
Methodology Transfer New Technology
Stockpiles Reconciliation Adjustment
Acquisitions Disposals 2020
Nickel 2019–2020 Ore Reserves reconciliationContained Nickel (kt) – Operations (including Stockpiles) (100% basis)
500
700
900
1,100
▲27.3 976.71,007.7
▼46.1 ▼13.7 ▼2.3 ▼4.6
▲8.6
2019 Depletion Conversion Economic Assumptions
NewInformation
Model Refinement
Methodology Transfer New Technology
Stockpiles Reconciliation Adjustment
Acquisitions Disposals 2020
Nickel 2019–2020 Exclusive Mineral Resources reconciliationContained Nickel (kt) – Operations (including Stockpiles) (100% basis)
350
450
400
500
550
▼3.2
▲14.0 ▲4.7▲17.0
▼0.0▼9.4
▼0.1491.9
515.0
Anglo American plc Ore Reserves and Mineral Resources Report 2020 45
Ore Reserves and Mineral ResourcesReserve and Resource reconciliation overview continued

TotalNegativePositive
Detailed 2019 and 2020 information appears on pages 10-38. Rounding of figures may cause computational discrepancies.
2019 Production Conversion Economic Assumptions
NewInformation
Model Refinement
Methodology Transfer New Technology
Stockpiles Reconciliation Adjustment
Acquisitions Disposals 2020
Crop Nutrients 2019–2020 Ore Reserves reconciliationROM Tonnes (Mt) (100% basis)
0
200
400
290.0▲290.0
100
300
2019 Depletion Conversion Economic Assumptions
NewInformation
Model Refinement
Methodology Transfer New Technology
Stockpiles Reconciliation Adjustment
Acquisitions Disposals 2020
Crop Nutrients 2019–2020 Exclusive Mineral Resources reconciliationTonnes (Mt) (100% basis)
0
1,500
2,500
2,000.0▲2,000.02,000
500
1,000
46 Anglo American plc Ore Reserves and Mineral Resources Report 2020
Ore Reserves and Mineral ResourcesReserve and Resource reconciliation overview continued
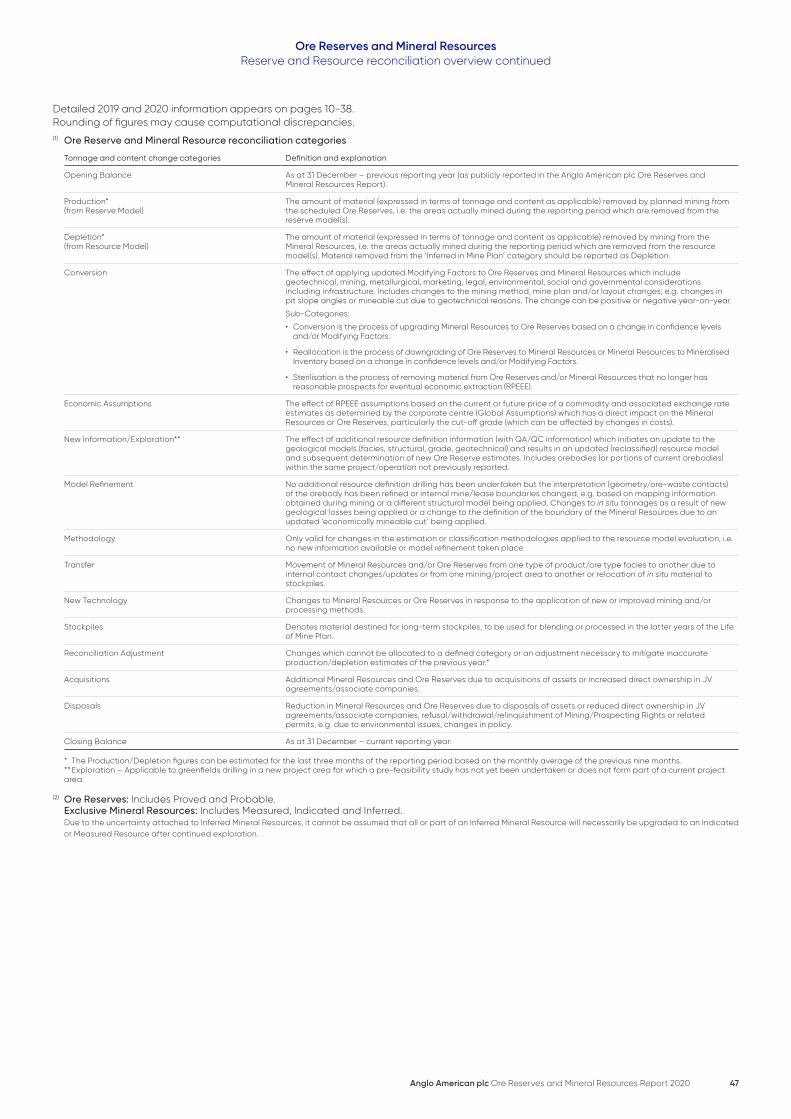
Detailed 2019 and 2020 information appears on pages 10-38. Rounding of figures may cause computational discrepancies.(1) Ore Reserve and Mineral Resource reconciliation categories
Tonnage and content change categories Definition and explanation
Opening Balance As at 31 December – previous reporting year (as publicly reported in the Anglo American plc Ore Reserves and Mineral Resources Report).
Production*(from Reserve Model)
The amount of material (expressed in terms of tonnage and content as applicable) removed by planned mining from the scheduled Ore Reserves, i.e. the areas actually mined during the reporting period which are removed from the reserve model(s).
Depletion*(from Resource Model)
The amount of material (expressed in terms of tonnage and content as applicable) removed by mining from the Mineral Resources, i.e. the areas actually mined during the reporting period which are removed from the resource model(s). Material removed from the ‘Inferred in Mine Plan’ category should be reported as Depletion.
Conversion The effect of applying updated Modifying Factors to Ore Reserves and Mineral Resources which include geotechnical, mining, metallurgical, marketing, legal, environmental, social and governmental considerations including infrastructure. Includes changes to the mining method, mine plan and/or layout changes, e.g. changes in pit slope angles or mineable cut due to geotechnical reasons. The change can be positive or negative year-on-year.
Sub-Categories:
• Conversion is the process of upgrading Mineral Resources to Ore Reserves based on a change in confidence levels and/or Modifying Factors.
• Reallocation is the process of downgrading of Ore Reserves to Mineral Resources or Mineral Resources to Mineralised Inventory based on a change in confidence levels and/or Modifying Factors.
• Sterilisation is the process of removing material from Ore Reserves and/or Mineral Resources that no longer has reasonable prospects for eventual economic extraction (RPEEE).
Economic Assumptions The effect of RPEEE assumptions based on the current or future price of a commodity and associated exchange rate estimates as determined by the corporate centre (Global Assumptions) which has a direct impact on the Mineral Resources or Ore Reserves, particularly the cut-off grade (which can be affected by changes in costs).
New Information/Exploration** The effect of additional resource definition information (with QA/QC information) which initiates an update to the geological models (facies, structural, grade, geotechnical) and results in an updated (reclassified) resource model and subsequent determination of new Ore Reserve estimates. Includes orebodies (or portions of current orebodies) within the same project/operation not previously reported.
Model Refinement No additional resource definition drilling has been undertaken but the interpretation (geometry/ore-waste contacts) of the orebody has been refined or internal mine/lease boundaries changed, e.g. based on mapping information obtained during mining or a different structural model being applied. Changes to in situ tonnages as a result of new geological losses being applied or a change to the definition of the boundary of the Mineral Resources due to an updated ‘economically mineable cut’ being applied.
Methodology Only valid for changes in the estimation or classification methodologies applied to the resource model evaluation, i.e. no new information available or model refinement taken place.
Transfer Movement of Mineral Resources and/or Ore Reserves from one type of product/ore type facies to another due to internal contact changes/updates or from one mining/project area to another or relocation of in situ material to stockpiles.
New Technology Changes to Mineral Resources or Ore Reserves in response to the application of new or improved mining and/or processing methods.
Stockpiles Denotes material destined for long-term stockpiles, to be used for blending or processed in the latter years of the Life of Mine Plan.
Reconciliation Adjustment Changes which cannot be allocated to a defined category or an adjustment necessary to mitigate inaccurate production/depletion estimates of the previous year.*
Acquisitions Additional Mineral Resources and Ore Reserves due to acquisitions of assets or increased direct ownership in JV agreements/associate companies.
Disposals Reduction in Mineral Resources and Ore Reserves due to disposals of assets or reduced direct ownership in JV agreements/associate companies, refusal/withdrawal/relinquishment of Mining/Prospecting Rights or related permits, e.g. due to environmental issues, changes in policy.
Closing Balance As at 31 December – current reporting year.
* The Production/Depletion figures can be estimated for the last three months of the reporting period based on the monthly average of the previous nine months.** Exploration – Applicable to greenfields drilling in a new project area for which a pre-feasibility study has not yet been undertaken or does not form part of a current project area.
(2) Ore Reserves: Includes Proved and Probable. Exclusive Mineral Resources: Includes Measured, Indicated and Inferred. Due to the uncertainty attached to Inferred Mineral Resources, it cannot be assumed that all or part of an Inferred Mineral Resource will necessarily be upgraded to an Indicated or Measured Resource after continued exploration.
Anglo American plc Ore Reserves and Mineral Resources Report 2020 47
Ore Reserves and Mineral ResourcesReserve and Resource reconciliation overview continued

Competent Persons (CP) ListOre Reserves
Name RPO Years
De Beers Canada – Operations
Gahcho Kué Karen Woo APEGA 9
De Beers Consolidated Mines – Operations
Venetia (OP) Willis Zvineyi Saungweme ECSA 11
Venetia (UG) Alfred Breed SAIMM 14
Debswana Diamond Company – Operations
Damtshaa, Letlhakane, Orapa, including TMRs Khumo Moswela SAIMM 14
Jwaneng including TMR Khumo Nnyenyiwa SAIMM 12
Namdeb Holdings – Terrestial Operations
Mining Area 1 and Orange River Paramasivam Saravanakumar AUSIMM 16
Namdeb Holdings – Offshore Operations
Atlantic 1 Edmund Nel IMSSA 18
Copper – Operations
Collahuasi Andrés Alberto Pérez Toledo AusIMM 28
El Soldado Rodrigo Cifuentes AusIMM 20
Los Bronces Andrés Fierro-Jones CMC 16
Copper – Projects
Quellaveco Scott Buchanan AusIMM 10
Platinum South Africa – Operations
Dishaba Mine and Tumela Mine Johan Laubscher SAIMM 8
Kroondal Platinum Mine and Siphumelele Mine 3 Brian Smith(1) SAGC 34
Modikwa Platinum Mine Jurie de Kock(1) SAIMM 39
Mogalakwena Mine Marlon van Heerden SAIMM 13
Mototolo Complex Raymond Makgato SACNASP 13
Platinum Zimbabwe – Operations
Unki Mine Clever Dick SAIMM 17
RPO = Registered Professional Organisation. Years = Years of Relevant Experience in the commodity and style of mineralisation.(1) Not employed by Anglo American Platinum Limited.
48 Anglo American plc Ore Reserves and Mineral Resources Report 2020
Ore Reserves and Mineral Resources

Name RPO Years
Kumba Iron Ore – Operations
Kolomela Neil Rossouw ECSA 10Sishen Derek Esterhuysen ECSA 12
Iron Ore Brazil – OperationsSerra do Sapo José Caetano Neto AusIMM 14
Coal Australia – Operations
Capcoal (OC) and Dawson Innocent Mashiri AusIMM 11
Capcoal (UG), Grosvenor, Moranbah North Johnson Lee AusIMM 15
Coal Australia – Projects
Capcoal (UG) – Aquila Johnson Lee AusIMM 15
Coal Canada – Projects
Trend and Roman Mountain Bernard Colman AusIMM 36
Coal Colombia – Operations
Cerrejón Shahzad Chaudari AusIMM 17
Coal South Africa – Operations
Goedehoop, Greenside, Isibonelo, Kleinkopje, Landau, Zibulo, including MRDs Norman McGeorge(2) ECSA 33
Mafube Jacobus Lotheringen(2) ECSA 18
Rietvlei Leonardt Raaths(2) SAIMM 31
Nickel – Operations
Barro Alto and Niquelândia Bruno Silveira Conceição AusIMM 9
Samancor Manganese – Operations
GEMCO Ursula Sandilands AusIMM 23
Mamatwan and Wessels Alexander Ralph Maier ECSA 11
Crop Nutrients – Projects
Woodsmith Timothy McGurk(3) IMMM 10
RPO = Registered Professional Organisation. Years = Years of Relevant Experience in the commodity and style of mineralisation.(2) Not employed by Anglo American Coal.(3) Not employed by Anglo American Crop Nutrients.
Anglo American plc Ore Reserves and Mineral Resources Report 2020 49
Ore Reserves and Mineral Resources Competent Persons list – Ore Reserves continued

Competent Persons (CP) ListMineral Resources
Name RPO Years
De Beers Canada – OperationsGahcho Kué Kevin Earl Gostlin NAPEG 14
De Beers Canada – Projects
Chidliak and Snap Lake Pamela Ellemers APGO 26
De Beers Consolidated Mines – Operations
Venetia (OP and UG) Emmanuel Mushongahande SACNASP 20Voorspoed Petrus Jordaan SACNASP 23
Debswana Diamond Company – Operations
Damtshaa, Letlhakane, Orapa, including TMRs Olefile Mashabila SACNASP 14Jwaneng including TMR Phenyo Maoto SACNASP 16
Namdeb Holdings – Terrestrial OperationsBogenfels, Mining Area 1 and Orange River Jana Jacob SACNASP 22
Namdeb Holdings – Offshore Operations
Atlantic 1 Godfrey Ngaisiue SACNASP 17
Midwater Jana Jacob SACNASP 22
Copper – Operations
Collahuasi Ronald Reycardo Orbezo Lozano AusIMM 14
El Soldado Raúl Ahumada AusIMM 32Los Bronces César Ulloa AusIMM 16
Copper – ProjectsLos Bronces Sur César Ulloa AusIMM 16
Los Bronces Underground Iván Vela CMC 34
Quellaveco Hugo Rios AusIMM 19
Sakatti Janne Siikaluoma AusIMM 13
West Wall Raul Tarnovschi CMC 23
Platinum South Africa – OperationsBokoni Platinum Mine Raymond Makgato SACNASP 13Dishaba Mine and Tumela Mine Kavita Mohanlal SACNASP 17
Kroondal and Marikana Platinum Mines, Siphumelele Mine 3 Nicole Wansbury(1) SACNASP 15
Modikwa Platinum Mine Martha Hlangwane SACNASP 15
Mogalakwena Mine Phuthela Myeni SACNASP 10
Mototolo Complex and Twickenham Platinum Mine Iain Colquhoun SACNASP 23
Platinum South Africa – Tailings DamsAmandelbult Kavita Mohanlal SACNASP 17
Platinum Zimbabwe – Operations
Unki Mine Kavita Mohanlal SACNASP 17
RPO = Registered Professional Organisation. Years = Years of Relevant Experience in the commodity and style of mineralisation.(1) Not employed by Anglo American Platinum Limited.
50 Anglo American plc Ore Reserves and Mineral Resources Report 2020
Ore Reserves and Mineral Resources

Name RPO Years
Kumba Iron Ore – Operations
Kolomela Hannes Viljoen SACNASP 13Sishen Nomawezo Mbele SACNASP 6
Iron Ore Brazil – OperationsSerra do Sapo Fernando Rosa Guimarães AusIMM 12
Iron Ore Brazil – ProjectsItapanhoacanga Fernando Rosa Guimarães AusIMM 12
Coal Australia – Operations
Capcoal OC and UG Andrew Laws AusIMM 25
Dawson Sue de Klerk AusIMM 17
Grosvenor and Moranbah North Toni Ayliffe AusIMM 20
Coal Australia – Projects
Capcoal Aquila and Moranbah South Andrew Laws AusIMM 25
Theodore Jamie Walters AusIMM 14
Coal Canada – ProjectsBelcourt Saxon, Roman Mountain, Trend David Lortie APEGBC 27
Coal Colombia – OperationsCerrejón Germán Hernández GSSA 31
Coal South Africa – Operations
Goedehoop, Greenside, Isibonelo, Kleinkopje, Landau, Zibulo, including MRDs Lesley Sharon Jeffrey(2) SACNASP 35
Mafube Lesley Sharon Jeffrey(2) SACNASP 35
Rietvlei Katherine Black(2) SACNASP 13
Coal South Africa – Projects
Elders Johan Christo Swart(2) SACNASP 35
South Rand Lilly Lemekoana SACNASP 12
Waterberg Lesley Sharon Jeffrey(2) SACNASP 35
Nickel – OperationsBarro Alto and Niquelândia Cláudia Mara Sperandio Neves AusIMM 15
Nickel – ProjectsJacaré Cláudia Mara Sperandio Neves AusIMM 15
Samancor Manganese – Operations
GEMCO David Hope & Joshua Harvey AusIMM 14 & 18
Mamatwan and Wessels Livhuwani Lautze & Farisani Thomas Rambuda SACNASP 6 & 11
Crop Nutrients – ProjectsWoodsmith Mike Armitage(3) GSL 10
RPO = Registered Professional Organisation. Years = Years of Relevant Experience in the commodity and style of mineralisation.(2) Not employed by Anglo American Coal.(3) Not employed by Anglo American Crop Nutrients.
Anglo American plc Ore Reserves and Mineral Resources Report 2020 51
Ore Reserves and Mineral Resources Competent Persons list – Mineral Resources continued

Mass unitscarat: carat is a unit of mass equal to 0.2 gramskt: kilotonne; metric system unit of mass equal to 1,000
metric tonnesMoz: million troy ounces (a kilogram is equal to
32.1507 ounces; a troy ounce is equal to 31.1035 grams)Mt: million tonnes, metric system unit of mass equal to
1,000 kilotonnesMTIS: Mineable Tonnes In Situ; quoted in million tonnes,
adjusted for geological loss and derated for any previous mining
mtpa: million tonnes per annumTonnes: metric system unit of mass equal to 1,000 kilograms
Grade units (expressed on a moisture-free basis)Au: Gold (g/t)cpht: carats per hundred metric tonnescpm2: carats per square metreCSN: Crucible Swell Number (CSN is rounded to the nearest
0.5 index)CuEq: Copper equivalent gradeCV: Calorific Value (CV is rounded to the nearest 10 kcal/
kg)kcal/kg: kilocalories per kilogramg/t: grams per tonnekct: thousand caratsMct: million caratsTCu: Total Copper (%)4E PGE: the sum of Platinum, Palladium, Rhodium and Gold
grades in grams per tonne (g/t)3E PGE: the sum of Platinum, Palladium and Gold grades
in grams per tonne (g/t)% Cu: weight percent Copper% Fe: weight percent Iron% Mn: weight percent Manganese% Mo: weight percent Molybdenum% Ni: weight percent Nickel% Pht: weight percent Polyhalite
Mining methodsMM: Marine Mining – Mining diamonds deposited on the
continental shelf using mining vessels equipped with specialised underwater mining tools such as suction drills and crawlers.
OC: Open Cast/Cut – A surface mining method performed on orebodies with shallow-dipping tabular geometries. Beach Accretion is a form of Open Cast mining and is a process through which an existing beach is built seaward to extend into areas previously submerged by sea water. The accretion is accomplished by sand build-up derived from current mining activities.
OP: Open Pit – A surface mining method in which both ore and waste are removed during the excavation of a pit. The pit geometry is related to the orebody shape, but tends to have a conical form, closing with depth.
UG: Underground – A class of subsurface mining methods, where the ore is accessed either through a vertical shaft or decline. Ore and waste are moved within subsurface excavations, which may be located on several different elevations. The nature of the underground excavations is dependent on the geometry and size of the mineralisation.
Processing methodsDump Leach: A process similar to Heap Leaching, but usually
applied to lower grade material. Rather than constructing a heap of material with a controlled grain size, the material grain sizes are as mined, similar to the situation found within a waste rock dump. This material is then irrigated with a leach solution that dissolves the valuable minerals, allowing recovery from the drained leach solution.
Flotation: A process for concentrating minerals based on their surface properties. Finely ground mineral is slurried with water and specific reagents that increase the water repellent nature of the valuable mineral and agitated with air. The water repellent mineral grains cling to froth bubbles that concentrate the mineral at the top of the flotation cell, from where it is mechanically removed.
Heap Leach: A process in which mineral-bearing rock is crushed and built into a designed heap. The heap is irrigated with a leach solution that dissolves the desirable mineral and carries it into a drain system from which solution is pumped and the mineral/elements of interest are recovered.
Professional organisations APEGA: The Association of Professional Engineers and
Geoscientists of AlbertaAPEGBC: The Association of Professional Engineers and
Geoscientists of British ColumbiaAPGO: Association of Professional Geoscientists of Ontario AusIMM: The Australasian Institute of Mining and MetallurgyCMC: Chilean Mining Commission (Comisión Calificadora
de Competencias en Recursos y Reservas Mineras)ECSA: Engineering Council of South AfricaGSL: The Geological Society of LondonGSSA: Geological Society of South AfricaIMMM: Institute of Materials, Minerals and MiningIMSSA: The Institute of Mine Surveyors of South AfricaNAPEG: Northwest Territories and Nunavut Association of
Professional Engineers and Geoscientists SACNASP: South African Council for Natural Scientific ProfessionsSAGC: South African Geomatics CouncilSAIMM: South African Institute of Mining and Metallurgy
Glossary
52 Anglo American plc Ore Reserves and Mineral Resources Report 2020
Ore Reserves and Mineral Resources

Resource typesAeolian: Diamond deposits created and enriched during
transport of sediment through wind action (aeolian processes) resulting in the formation of wind-blown dunes, ripples and sand sheets within which localised enrichment of diamonds may occur.
Banded Iron Formation:
A chemical sedimentary rock consisting of silica and iron oxide. The rock texture is characteristically laminated or banded.
Beaches: Diamond deposits enriched through marine processes and preserved along the marine shoreline within a series of fossil terraces.
Canga: An iron rich rock formed where material weathered from an original iron ore deposit has been cemented by iron minerals.
Colluvium: Loose, unconsolidated material that accumulates above the weathering iron orebodies.
Deflation: Diamond deposits enriched through wind-driven removal of light particles resulting in concentration of diamonds.
Ferruginous Laterite:
An especially iron-rich laterite.
Fluvial Placer: Diamond deposits formed and preserved within fossil sand and gravel terraces located adjacent to contemporary fluvial (river) systems.
Fresh Rock: Mineable material that has not been significantly modified by surface weathering processes.
Hematite: An iron oxide mineral with the chemical formula Fe2O3.Itabirite: Itabirite is a banded quartz hematite schist. Friable
Itabirite is the extensively weathered equivalent leading to disaggregation of the individual mineral grains comprising the rock.
Kimberlite: A potassic ultrabasic volcanic rock, emplaced as either pipes, dykes or sills, which sometimes contain diamonds.
Laterite: A clay-like soil horizon rich in iron and aluminium oxides that formed by the weathering of igneous rocks under tropical conditions.
Magnetite: An iron oxide mineral with the chemical formula Fe3O4.Main Sulphide Zone (MSZ):
The MSZ is a Platinum Group Metals (PGMs) and Base Metals (BMs) layer within the uppermost pyroxenite unit of the ultramafic succession of the Great Dyke. The MSZ reef is a tabular zone with disseminated sulphides, consisting of an upper zone enriched with BMs and a lower zone enriched with PGMs.
Marine: Submerged diamond deposits enriched through fluvial (river), beach and marine reworking processes.
Merensky Reef (MR):
The Merensky Reef is located within the Upper Critical Zone of the Bushveld Complex and ranges in width from a few millimetres to ~9 m but normally expected to vary between 0.2 m to 2.5 m. The Merensky Reef occurs at the interface between the Merensky Pyroxenite and the underlying anorthosite to norite. The Merensky Reef is characterised by the occurrence of one or more narrow chromitite stringers and frequently includes a coarse-grained pegmatoidal feldspathic pyroxenite.
MRD: Mineral Residue Deposit is material discarded from the beneficiation process. This material may be re-treated to produce a saleable product or sold as is, where there are reasonable prospects for eventual economic extraction.
ORT: Old Recovery Tailings are heavy minerals discarded from the Recovery Section of the Ore Processing Plant. In some cases these tailings can be re-treated.
Oxide: Oxide ores are those found within close proximity to the surface and whose mineralogy is dominated by oxidised species, including oxides and sulphates. Frequently, silicate minerals have broken down partially or completely to clay-rich species.
Platreef (PR): The Platreef dips to the west and strikes North-West/South-East within the Northern Limb of the Bushveld Complex; ranging in width from ~40 m to ~200 m. The upper portion is predominantly top-loaded with Platinum Group Metals (PGMs) and this mineralisation is often but not always associated with Base Metal (BM) mineralisation. The Platreef is characterised as a multi-pulse mafic magmatic horizon predominantly pyroxenitic in composition typified by an extensive assimilation of footwall lithologies.
Pocket Beach: Diamond deposits formed due to interactions of ocean (longshore) currents with specific shoreline topographic features that facilitate the concentration of diamonds.
Porphyry (Copper):
Large copper deposits hosted by intermediate felsic rocks. These deposits form close to large-scale subduction zones.
Saprolite: Clay-rich rock formed by decomposition of pre-existing rocks within a surface weathering environment.
Stockpile: Stockpile resources comprise material that is mined together with the principal ore, but for economic or technical reasons is not processed. This material is stockpiled in preparation for processing when economic or technical conditions are more favourable.
Sulphide: Sulphide ores contain sulphide minerals that have not been subjected to surface oxidation.
Tailings: Material left over after the process of separating the valuable fraction of the mineralised material from the uneconomic fraction (gangue) of the ROM. In some cases tailings can be re-treated to extract by-products.
TMR: Tailings Mineral Resource is Coarse Processed Kimberlite discarded from the Ore Processing Plant. In some cases these tailings can be re-treated.
UG2 Reef (UG2): The UG2 Reef is located between 20 m and 400 m below the Merensky Reef and is the second chromitite unit within the Upper Group. The UG2 Reef is typically a massive chromitite unit and ranges in width from 0.3 m to 3.0 m but normally expected to vary between 0.6 m to 2.0 m. The hanging wall of the UG2 Reef is characterised by a feldspathic pyroxenite unit that may include several narrow chromitite stringers and the footwall of the UG2 Reef typically by a coarse-grained pegmatoidal feldspathic pyroxenite.
Coal productsMetallurgical – Coking:
High-, medium- or low-volatile semi-soft, soft or hard coking coal primarily for blending and use in the steel industry; quality measured as Crucible Swell Number (CSN).
Metallurgical – Other:
Semi-soft, soft, hard, semi-hard or anthracite coal, other than Coking Coal, such as pulverised coal injection (PCI) or other general metallurgical coal for the export or domestic market with a wider range of properties than Coking Coal; quality measured by calorific value (CV).
Thermal – Export:
Low- to high-volatile thermal coal primarily for export in the use of power generation; quality measured by calorific value (CV).
Thermal – Domestic:
Low- to high-volatile thermal coal primarily for domestic consumption for power generation; quality measured by calorific value (CV).
Synfuel: Coal specifically for the domestic production of synthetic fuel and chemicals; quality measured by calorific value (CV).
Anglo American plc Ore Reserves and Mineral Resources Report 2020 53
Ore Reserves and Mineral Resources Glossary continued

Other Anglo American publications
• Integrated Annual Report • Sustainability Report • Tax and Economic Contribution Report • Transformation Report • Our Code of Conduct • The Safety, Health and Environment (SHE) Way • The Social Way • The Socio-Economic Assessment Toolbox (SEAT) • Notice of 2021 AGM • www.facebook.com/angloamerican • www.twitter.com/angloamerican • www.linkedin.com/company/anglo-american • www.youtube.com/angloamerican • www.flickr.com/angloamerican • www.slideshare.com/angloamerican
Financial and other reports may be found at: www.angloamerican.com/reporting
©Anglo American plc 2021. All rights reserved.
54 Anglo American plc Ore Reserves and Mineral Resources Report 2020
Ore Reserves and Mineral Resources

Anglo American plc 20 Carlton House Terrace London SW1Y 5AN United Kingdom
Tel +44 (0)20 7968 8888 Fax +44 (0)20 7968 8500 Registered number 03564138
www.angloamerican.com
Find us on Facebook Follow us on Twitter