Embed Size (px)
Citation preview
Part 4(I) OWRD Water Quantity Final Report May 6, 2005
Oregon Plan for Salmon and Watersheds
OREGON COASTAL COHO ASSESSMENT Water Quantity
Prepared by Water Resources Department
Policy for Evaluation of Conservation Efforts (PECE Policy) Conservation efforts and regulatory programs that address insufficient streamflows as a factor for decline for the Oregon Coastal coho Evolutionarily Significant Unit (ESU) are briefly described below in response to the PECE Policy. The certainty that conservation efforts will be implemented and are effective is addressed in greater detail in subsequent report materials. Certainty that the conservation effort will be implemented. 1. Describe the staffing, funding level, funding source and other resources necessary (and available) to implement the conservation effort or other regulatory program. Monitoring and distributing water for instream water rights is accomplished through Oregon Water Resources Department (WRD) watermasters and their assistant watermasters. Funding for watermasters is provided through state General Funds while assistant watermasters are funded by county and other funds. The Oregon Coastal coho ESU coincides with four watermaster districts:
• District 1 is composed of watersheds from the Necanicum River south to the Yachats River,
• District 2 includes the Siuslaw River drainage, • District 15 includes the Umpqua River drainage; and • District 19 includes drainages of the Mid-South Coast from Siltcoos River south
to the Sixes River. Districts 1 and 2 do not currently have assistant watermasters. District 15 has one county funded assistant watermaster, and District 19 has a part-time assistant watermaster funded by other funds. Watermasters and their assistants work with water users and other organizations to enforce existing instream water rights from junior and illegal users and to promote voluntary streamflow restoration in streams of the Oregon Coastal coho ESU. Two Field Services staff in the Salem headquarters office are also responsible for providing outreach and information to water users and conservation interests, along with processing instream transfers, leases, and allocations of conserved water. These headquarters staff are funded largely through General Funds with some contribution from Federal Funds.
Part 4(I) OWRD Water Quantity Final Report May 6, 2005
2
2. Describe the legal authority to implement and the commitment to proceed with the conservation effort or regulatory program. Watermasters regulate the distribution of water by priority date. The authority of watermasters to regulate water use is set forth in Oregon statute under ORS 540.045. Instream water rights (ISWRs) were codified in ORS 537.334 to 537.354 and given the same status and protections as other water rights. Under ORS 537.348, water rights may be transferred to instream uses, either permanently or temporarily, through instream leases, instream transfers, and allocations of conserved water. Under Oregon Administrative Rule (OAR) Chapter 690, Division 33, issuance of a new water right within the Oregon Coastal coho ESU is subject to additional public interest standards specifically to protect the habitat of sensitive, threatened, or endangered fish, such as coho (even when not federally listed). New water rights are also subject to water availability standards pursuant to the Oregon Water Resources Commission’s (WRC) Water Allocation Policy under OAR Chapter 690, Division 410, to ensure that existing water rights including instream rights, can likely be satisfied before new water rights are issued.. 3. Describe the legal procedural requirements (e.g., environmental review), if any exist, necessary to implement the effort or the regulatory program. Environmental review of and fish-protective conditions in new water rights that would affect the habitat of sensitive, threatened, or endangered fish is mandated by Oregon Administrative Rule. Protection of instream water rights and tools for voluntary streamflow restoration in streams within the Oregon Coastal coho ESU are guided by Oregon Revised Statutes. Watermasters have the authority to order the cessation of water uses that are interfering with senior water rights, including instream uses. 4. Describe the authorizations (e.g., permits, landowner permission), if applicable, necessary to implement the conservation effort or regulatory program. Describe the level of certainty that these authorizations will be obtained. WRD authority to regulate water distribution on behalf of instream water rights exists under Oregon statute; no other permits or authorizations are necessary. Streamflow restoration efforts are guided by Oregon statute and include issuance of new instream water rights and also on voluntary participation by water right holders who may lease or otherwise transfer their water rights to instream uses, or conserve water through more efficient water systems, a part of which then are dedicated to instream flows.
Part 4(I) OWRD Water Quantity Final Report May 6, 2005
3
Certainty of participation is dependent on landowner/water right holder willingness and interest. Water right holders/landowners must obtain approval from WRD to lease, transfer, or allocate conserved water instream. Since WRD promotes streamflow restoration under the Oregon Plan, the level of certainty that this authorization will be granted is high, provided there is no injury to existing water right holders. Once WRD approves a water right lease, transfer, or conserved water allocation instream, authority of watermasters to regulate water use provides high level of certainty that restoration water will be protected instream by priority date. 5. Describe the type and level of voluntary participation necessary to implement the conservation effort or regulatory program. Describe the level of certainty that this level of voluntary participation will be achieved. WRD authority to regulate water distribution on behalf of instream water rights exists under Oregon statute. Voluntary participation by water users is not necessary but is encouraged by watermasters. Streamflow restoration efforts are guided by statute but rely on voluntary participation by water right holders. Certainty of participation is dependent on landowner/water right holder willingness and interest. Water right holders/landowners must obtain approval from WRD to lease, transfer, or allocate conserved water instream. Since WRD promotes streamflow restoration under the Oregon Plan, level of certainty that this authorization will be granted is high, provided there is no injury to existing water right holders. Once WRD approves a water right lease, transfer, or allocation instream, authority of watermasters to regulate water use provides high level of certainty that restoration water will be protected instream. 6. Are necessary regulatory mechanisms (e.g., laws, regulations, ordinances) to implement the conservation effort or regulatory program in place? Necessary regulatory mechanisms are in place to implement conservation efforts and regulatory programs. Annual reports of regulatory activity by stream reach and watermaster district are provided to the Water Resources Commission and available at http://www1.wrd.state.or.us/files/Publications/staff_reports. These regulatory data are compiled at the end of each water year (October 1 through September 30). Regulatory activities by WRD watermasters include any action that causes a change in use or maintenance or a field inspection that confirms that no change is needed to comply with the water right, statute, or order of WRD. This definition of regulatory activities reflects the broad spectrum of activities conducted by watermasters. During times of water shortage, watermasters distribute water according to priority date of water rights on a stream system. Shutting off junior users is one way of “regulating” water use, but water users “regulated” in this way may still be in compliance and, in fact, usually are.
Part 4(I) OWRD Water Quantity Final Report May 6, 2005
4
Typical regulatory actions may include:
• Where necessary, watermasters issue notices of violation to unauthorized users. • During the irrigation season, watermasters may contact water users in person, by
telephone, or by mail to notify water users to cease diverting water because of streamflow conditions.
• Watermasters regularly spot-check water diversions for compliance with headgate notices and other regulatory notifications.
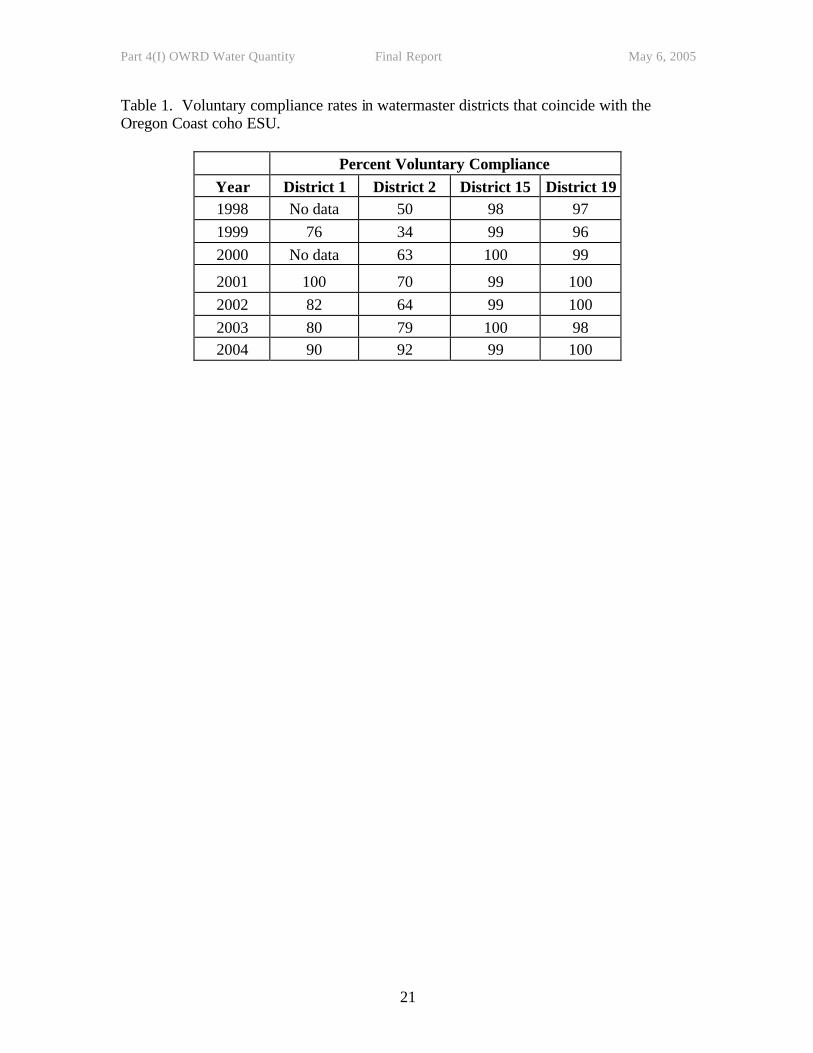
The Oregon Coastal coho ESU coincides with four watermaster districts (Districts 1, 2, 15, and 19). Average voluntary compliance in 2004 within these districts was 95%. Voluntary compliance rates from 1998 through 2004 for each of these districts are provided in Table 1. Note that these data reflect compliance within the entire watermaster distric t so may include areas outside of the coho ESU. For example, District 19 includes portions of the lower Rogue River drainage. 7. Is there a high level of certainty that Oregon will obtain the funding necessary to implement the conservation effort or regulatory program? Watermasters are funded through General Funds so there is a high level of certainty that these positions will continue to be funded. These positions are a high priority for WRD and are directly related to core program functions and the Department's mission so the certainty of continued funding is high. Other WRD field staff responsible for conservation and regulatory programs are also funded largely through General Funds with some Federal Funds. There is a lower certainty of continued funding of these positions due to potential General Fund reduction and potential loss of Federal Funds. Assistant watermasters are funded through county support and other funds so there is a lower certainty of continued funding of those positions. 8. Is an implementation schedule (including incremental completion dates) for the conservation effort established? If so, provide the schedule. WRD has performance measures and targets adopted by the Oregon Progress Board and the Legislative Assembly that set forth reporting requirements and target performance levels related to the monitoring and protection of instream water rights (ISWRs) and for flow restoration efforts statewide. One performance measure is the ratio of streams regulated to protect instream water rights to all streams regulated. The Department’s target is that 35% of all streams regulated are regulated on behalf of instream water rights. This level of effort is significant since it is much higher than the percent of instream water rights to all existing rights. In 2004, the Department exceeded this target statewide with 44% of the streams regulated on behalf of instream water rights. The Department does not currently track this performance measure at the Coastal coho ESU scale. However, within the four watermaster districts that include the coho ESU, 54% of all streams regulated were regulated on behalf of instream water rights in 2004. This level of effort on behalf of instream water rights exceeds the current statewide target of 35%.
Part 4(I) OWRD Water Quantity Final Report May 6, 2005
5
Another performance measure is the percent of watersheds that need flow restoration for fish that had water put instream through WRD administered programs. In 2003, the Department met its target for this measure with flow restoration transactions occurring in 16% of all high priority flow restoration watersheds statewide. The Department does not currently track this performance measure at the Coastal coho ESU scale. However, performance for this measure could be tracked at the coho ESU scale in the future. The target for this measure could also apply on this smaller geographic scale. Annual reports of the Department’s performance for these measures are available at http://www.wrd.state.or.us/OWRD/LAW/performance.shtml#Performance. Detailed regulatory activity by stream reach and watermaster district is also reported annually to the Water Resources Commission and available at http://www1.wrd.state.or.us/files/Publications/staff_reports. WRD is also compiling an inventory of significant water diversions in high priority flow restoration watersheds in Oregon’s coastal basins. Significant diversions are defined as all diversions of permitted and certificated water rights with conditions requiring measurement and reporting and diversions greater than 5 cfs or greater than 10 percent of the lowest monthly 50% exceedance flow on a stream. With the inventory complete, staff are performing field assessments of each significant diversion, evaluating compliance with water measurement, fish screening, and fish passage conditions of permits. This field assessment is scheduled for completion in April 2005 when it will be presented to the Water Resources Commission. Certainty that the conservation effort will be effective. 1. Describe the nature and extent of threats (factors for decline) being addressed by the conservation effort or regulatory program and explain how the conservation effort or regulatory program reduces the threats.
WRD regulatory and restoration programs are administered to achieve the following overarching biological objectives: 1) protect and maintain existing streamflows in areas providing significant salmon habitat value and 2) restore streamflows in areas providing (or which could provide) significant salmon habitat value.
Maintaining streamflows occurs through the following regulatory programs:
a) Establishment of instream water rights; b) Water distribution and regulation by priority date of water rights of record,
including instream water rights; c) Protection of instream water rights from injury during review of water right
transfers; and d) Public interest review, water right conditions, and water allocation policy in
considering new out of stream water uses. Restoring streamflows occurs through the following conservation programs:
a) Voluntary instream lease agreements;
Part 4(I) OWRD Water Quantity Final Report May 6, 2005
6
b) Voluntary instream transfers; and c) Allocations of conserved water.
2. Describe explicit incremental objectives for the conservation effort or regulatory program and dates for achieving them. Incremental objectives for conservation efforts and regulatory programs are governed by performance measures and Commission directives. As described above, WRD has performance measures and targets adopted by the Oregon Progress Board and the Legislative Assembly that set forth reporting requirements and target performance levels related to the monitoring and protection of instream water rights (ISWRs) and for flow restoration efforts statewide. One performance measure is the ratio of streams regulated to protect instream water rights to all streams regulated. The Department’s target is that 35% of all streams are regulated on behalf of instream water rights. This level of effort is significant since it is much higher than the percent of instream water rights to all existing rights. In 2004, the Department exceeded this target with 44% of the streams regulated statewide on behalf of instream water rights. The Department does not currently track this performance measure at the Coastal coho ESU scale. However, within the four watermaster districts that include the coho ESU, 54% of all streams regulated were regulated on behalf of instream water rights in 2004. This level of effort on behalf of instream water rights exceeds the current statewide target of 35%. Another performance measure is the percent of watersheds that need flow restoration for fish that had water put instream through WRD administered programs. In 2003, the Department met its target for this measure with flow restoration transactions occurring in 16% of all high priority flow restoration watersheds statewide. Annual reports of the Department’s performance for these measures are available at http://www.wrd.state.or.us/OWRD/LAW/performance.shtml#Performance. Detailed regulatory activity by stream reach and watermaster district is also reported annually to the Water Resources Commission and available at http://www1.wrd.state.or.us/files/Publications/staff_reports. WRD also compiled an inventory of significant water diversions in high priority flow restoration watersheds in Oregon’s coastal basins. With the inventory complete, staff are performing field assessments of each significant diversion, evaluating compliance with water measurement, fish screening, and fish passage conditions of permits. This field assessment is scheduled for completion in April 2005 when it will be presented to the Water Resources Commission. 3. Describe the steps necessary to implement the conservation effort in detail. Steps necessary to implement the conservation efforts and regulatory programs to address insufficient streamflow are identified annually by watermasters. To implement our Oregon Plan efforts, at the beginning of each year, watermasters identify four or five actions they will pursue in their high priority streamflow restoration watersheds. These high priority watersheds were identified jointly with the Oregon Department of Fish and
Part 4(I) OWRD Water Quantity Final Report May 6, 2005
7
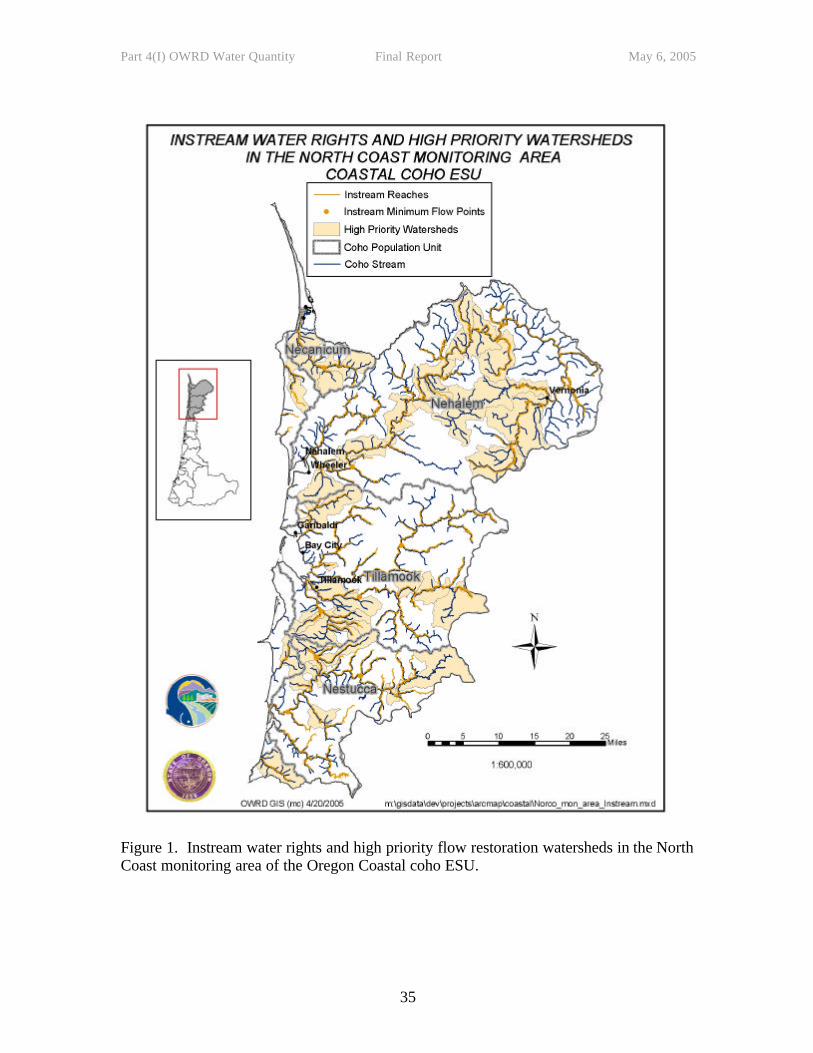
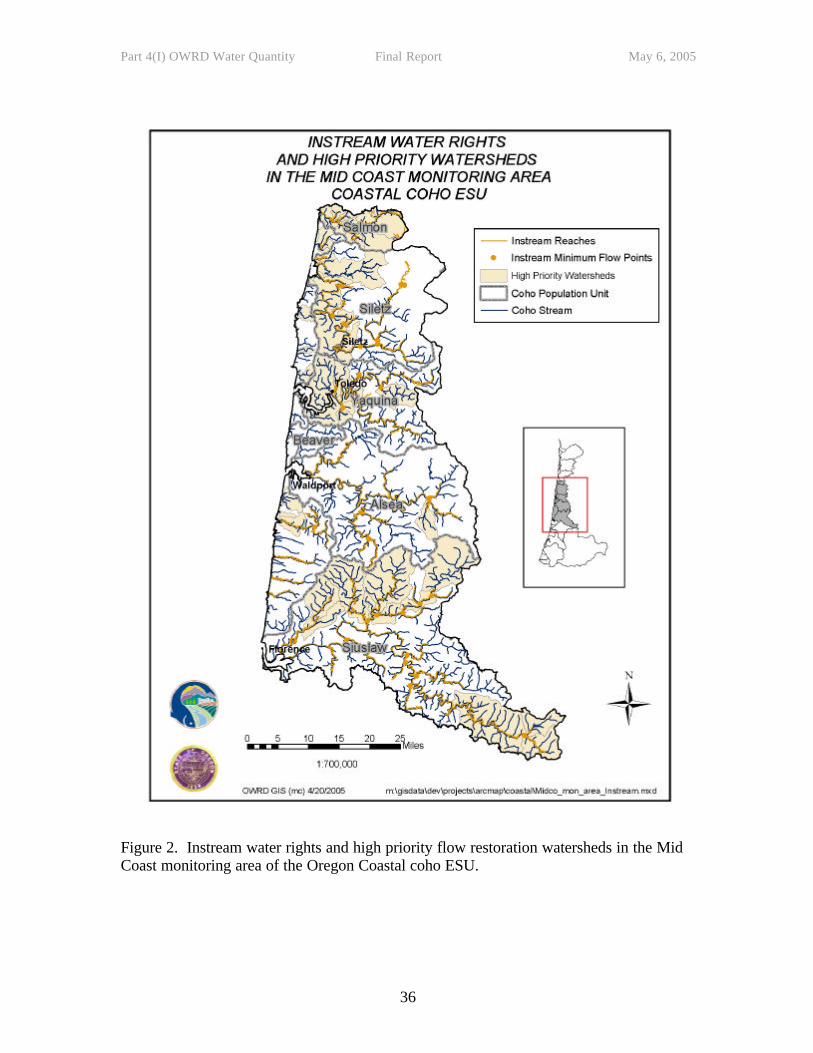
Wildlife (ODFW) and overlay subbasins with the greatest biological needs with those with greatest restoration opportunity. The combined priorities identify the best chance to succeed in areas that generate the greatest return. At the end of each year, watermasters describe the progress they made on their action plans, their successes, and barriers to their success. This adaptive management approach allows greater flexibility for field staff to prioritize their Oregon Plan efforts and focus limited staff resources on efforts with the greatest potential benefit for fish. Within the Oregon Coastal coho ESU, there are 153 high priority flow restoration watersheds with 49 in the North Coast, 41 in the Mid-Coast, 34 in the Mid-South Coast, and 29 in the Umpqua monitoring areas. The locations of high priority watersheds in each monitoring area are shown in Figures 1 through 4. It is important to note that ODFW biologists considered multiples species present in a stream and did not solely consider the needs of coho when identifying and prioritizing flow restoration watersheds. Therefore, the locations of these high priority watersheds within the Oregon Coastal coho ESU include, but are not solely dependent on, the flow restoration needs of coho. 4. Describe quantifiable, scientifically valid parameters that will determine achievement of objectives, and standards for these parameters by which progress will be measured. Increases in streamflow can be quantified by streamflow measurements made by WRD staff. Biological benefits of increased flows are evaluated by ODFW. See also responses 2 & 5 of this section. 5. Describe provisions for monitoring and reporting progress on implementation (based on compliance with the implementation schedule) and effectiveness (based on evaluation of quantifiable parameters) of the conservation effort or regulatory program. Monitoring and reporting of efforts occurs in a number of ways: 1) As described above, WRD has performance measures and targets adopted by the Oregon Progress Board and the Legislative Assembly that set forth reporting requirements and target performance levels related to the monitoring and protection of ISWRs and for flow restoration efforts statewide. One performance measure is the ratio of streams regulated to protect instream water rights to all streams regulated. Another performance measure is the percent of watersheds that need flow restoration for fish that had water put instream through WRD administered programs. WRD must report is progress under each of these measures annually. Annual reports of the Department’s performance for these measures are available at http://www.wrd.state.or.us/OWRD/LAW/performance.shtml#Performance. 2) Surface water regulation activity by stream reach and watermaster district is reported annually to the Water Resources Commission and available at http://www1.wrd.state.or.us/files/Publications/staff_reports.
Part 4(I) OWRD Water Quantity Final Report May 6, 2005
8
3) To prioritize their efforts under the Oregon Plan, watermasters develop annual action plans identifying key activities they will perform in high priority flow restoration watersheds. These plans are reviewed at the end of each year and used to develop the subsequent year’s action plan. 4) Staff are completing field assessments of significant diversion within the Oregon Coastal coho ESU. This field assessment is scheduled for completion in April 2005 when it will be presented to the Water Resources Commission. 5) As required by Oregon Revised Statute (ORS) 537.099, WRD monitors and reports “water use” by instream water rights (ISWRs) in regular reports to the Water Resources Commission. There have been up to 35 continuous recording streamflow gages operated by WRD or the US Geological Survey (USGS) that measure streamflows at instream water right locations within the Oregon Coastal coho ESU. Published streamflow data for these sites is available on the Department’s website at: www.wrd.state.or.us/surface_water/index.shtml. 6. Describe how principles of adaptive management are incorporated. As mentioned above, at the beginning of each year, watermasters identify four or five actions they will pursue in their high priority streamflow restoration watersheds. These high priority watersheds were identified jointly with the ODFW and overlay subbasins with the greatest biological needs with those with greatest restoration opportunity. The combined priorities identify the best chance to succeed in areas that generate the greatest return. At the end of each year, watermasters describe the progress they made on their action plans, their successes, and barriers to their success. This adaptive management approach allows greater flexibility for field staff to prioritize their Oregon Plan efforts and focus limited staff resources on efforts with the greatest potential benefit for fish.
Part 4(I) OWRD Water Quantity Final Report May 6, 2005
9
INTRODUCTION This report presents analyses of the extent to which water diversions impact summer streamflow and the extent to which insufficient summer flow is a factor for decline for the Oregon Coastal coho Evolutionarily Significant Unit (ESU). Regulatory programs and restoration efforts related to streamflow protection and restoration are also described. REGULATORY MEASURES The Water Resources Commission (WRC) is the seven member citizen body established by statute to set water policy for the state. ORS 536.022 to 536.026. The WRC has adopted policies to protect instream flows under OAR 690-410-030. Regulatory programs that protect instream flows necessary for fish habitat and passage are described below. Enforcing Water Law The WRD administers Oregon’s water laws, which are based on the doctrine of prior appropriation. This means that the first person to obtain a water right on a stream is the last to be shut off in times of low streamflows. In water-short times, the water right holder with the oldest date of priority can demand the water specified in their water right regardless of the needs of junior users. If there is water in excess of the needs of this senior right holder, the person with the next oldest priority date can take as much as necessary to satisfy needs under that right, and so on down the line until all needs are met, or until no water is available. One of WRD’s primary functions is the distribution and regulation of water use for the protection of senior water rights, including instream water rights. Watermasters have the responsibility for ensuring the distribution of water according to the system of prior appropriation and based on the rights of record. The authority to regulate water use is set forth in Oregon statute (ORS 540.045) and rules (OAR Chapter 690, Division 250) and is the primary regulatory mechanism for providing certainty of implementation and effectiveness of streamflow protection and restoration efforts. WRD has performance measures and targets adopted by the Oregon Progress Board and the Legislative Assembly that set forth reporting requirements and target performance levels related to the monitoring and protection of instream water rights (ISWRs). One such performance measures is the ratio of streams regulated to protect instream water rights to all streams regulated. The Department’s goal is for 35% of all stream regulation to be on behalf of instream water rights. This level of effort is significant since it is much higher than the percent of instream water rights to all existing rights. In 2004, the Department exceeded this target with 44% of the streams regulated statewide on behalf of instream water rights. The Department does not currently track this performance measure at the Coastal coho ESU scale. However, within the four watermaster districts that include the coho ESU, 54% of all streams regulated were regulated on behalf of instream water rights in 2004. This level of effort on behalf of instream water rights exceeds the current statewide target of 35%.
Part 4(I) OWRD Water Quantity Final Report May 6, 2005
10
Annual reports of the Department’s performance for this measure and other measures are available at http://www.wrd.state.or.us/OWRD/LAW/performance.shtml#Performance. Detailed regulatory activity by stream reach and watermaster district is also reported annually to the Water Resources Commission and available at http://www1.wrd.state.or.us/files/Publications/staff_reports . In 1997, at the onset of the Oregon Plan, watermasters worked with ODFW district biologists to establish priorities for water distribution and regulation on core area streams. Water right distribution lists were updated, where necessary, and information on the locations of diversions gathered through stream surveys were used to identify unauthorized uses. There are four watermaster districts within the Oregon Coastal coho ESU. These watermasters and their assistants regularly monitor streams within their districts, particularly those with instream water rights or minimum streamflows. Under the Oregon Plan, watermasters have also trained volunteers to perform streamflow measurements on coastal streams. The volunteers’ flow measurements aid watermasters in distributing water as necessary to protect instream water rights. If there is not adequate streamflow to meet the instream need, or if other water users or agencies bring concerns or complaints to the watermaster, the watermaster begins an investigation and takes appropriate actions such as curtailing the diversion of junior users. When voluntary compliance with the watermaster’s request is not achieved, then more formal phases of enforcement begin. Regulatory actions taken include issuing notices of violation to unauthorized users, shutting off junior users as necessary to deliver water to more senior users, contact via telephone or mail notifying water users to cease diverting water because of streamflow conditions, and spot-checking for compliance with headgate notices and other regulatory notifications. Regulatory actions also include identifying and eliminating unpermitted water use, use of water in excess of or contrary to the terms of a water right, and continued use of water after water use has been curtailed by the watermaster. Instream Water Rights Instream water rights were established by Oregon statute in 1987. The Instream Water Right law allows ODFW, the Department of Environmental Quality (DEQ), and the Parks and Recreation (OPRD) to apply for instream water rights for the purpose of fish protection, minimizing the effects of pollution, or maintaining recreational uses, respectively (ORS 537.332). The law gives instream water rights the same status as other water rights. Once issued, these instream water rights are held by WRD as trustee for the people of the State of Oregon. Instream water rights establish flow levels to stay in a stream on a monthly or half-month basis and are usually set for a certain stream reach. ISWRs can be issued for up to the estimated average natural flow of the stream even if this flow is not currently present – or at even higher flows if there is a documented reason such as addressing a fish passage barrier. Since ISWRs are based on natural streamflow rather than existing or actual flows, they may appropriate all of the remaining water in a stream and result in limited opportunity for additional out-of-stream uses of water.
Part 4(I) OWRD Water Quantity Final Report May 6, 2005
11
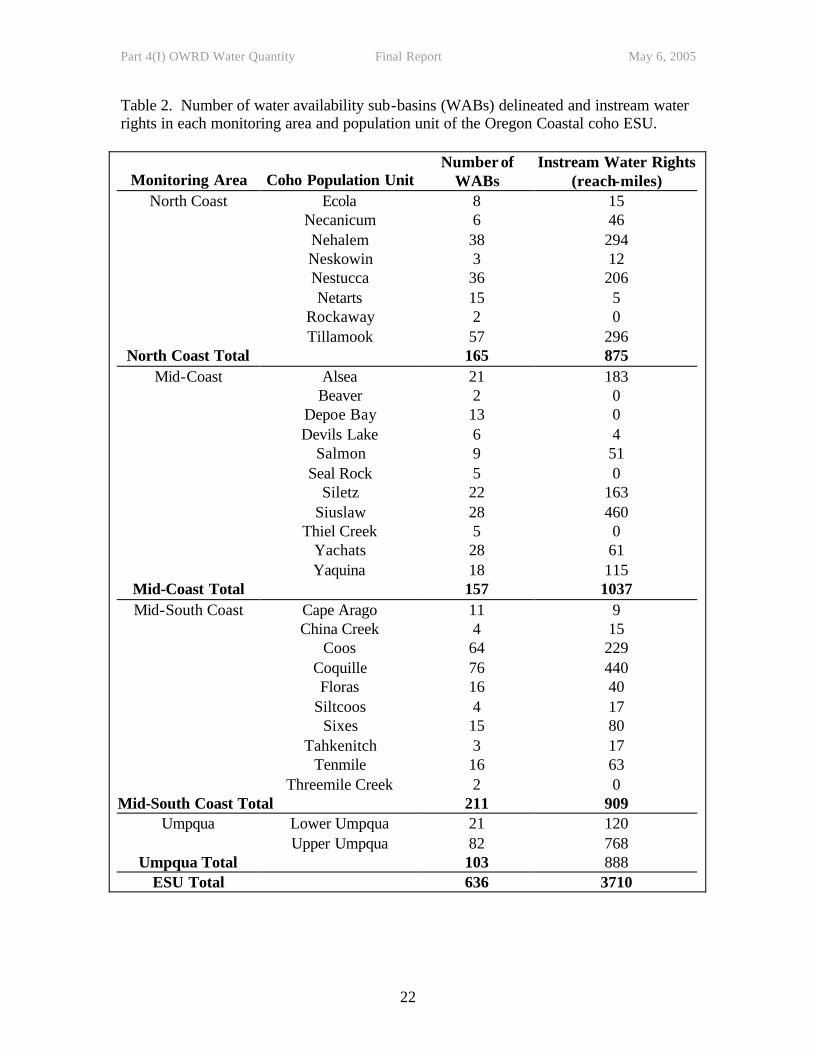
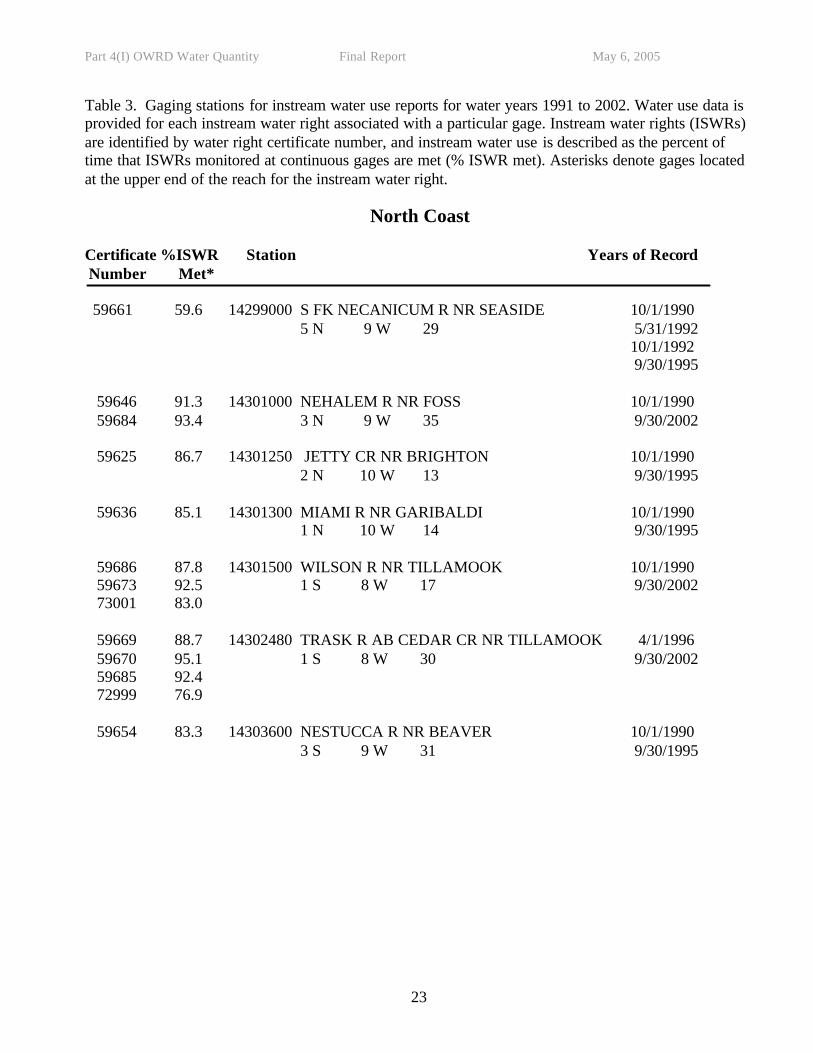
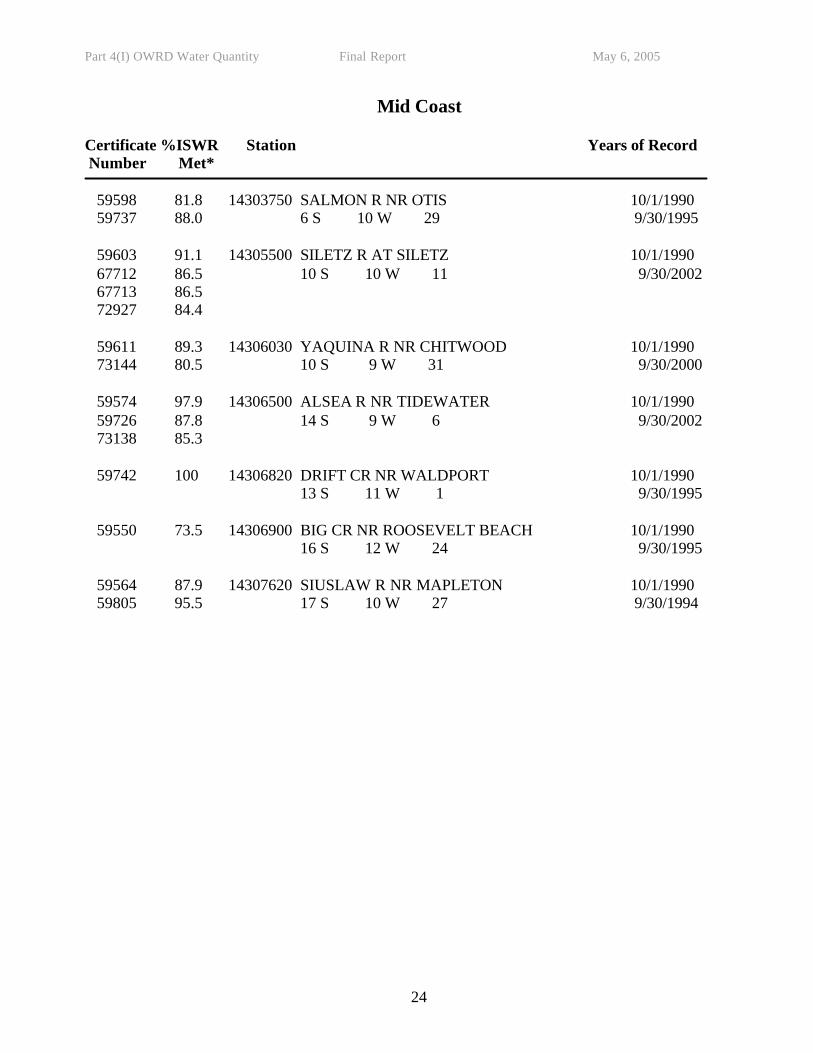
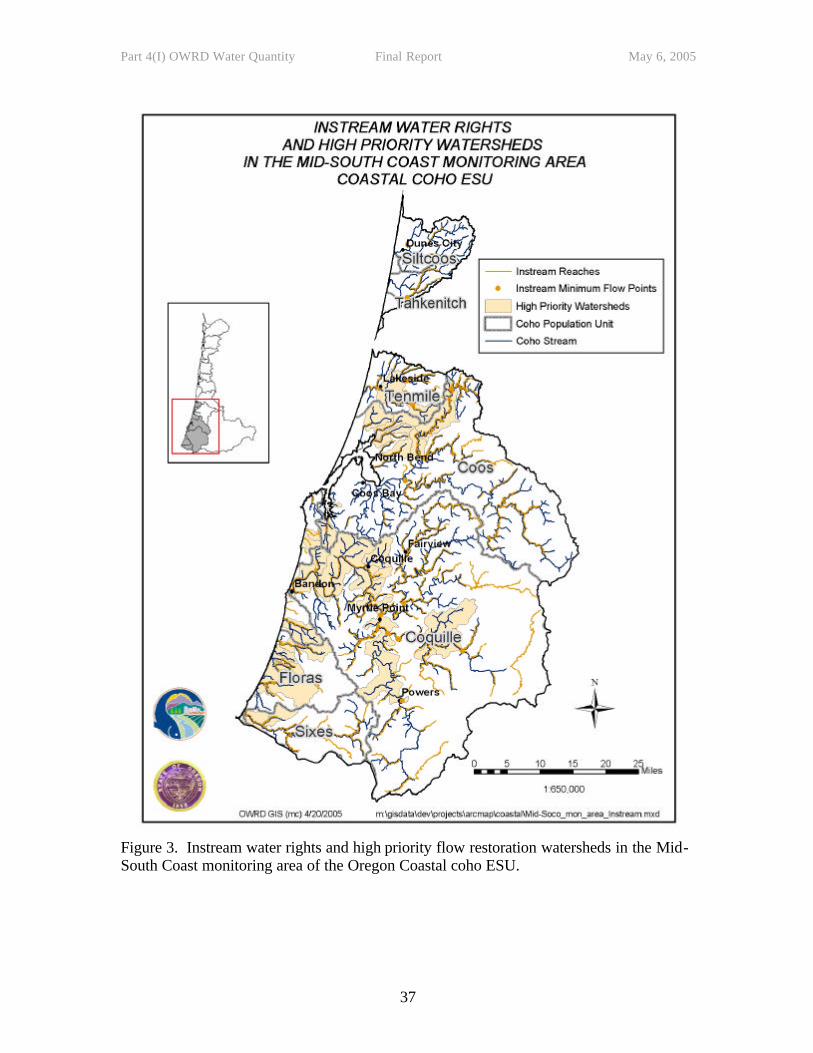
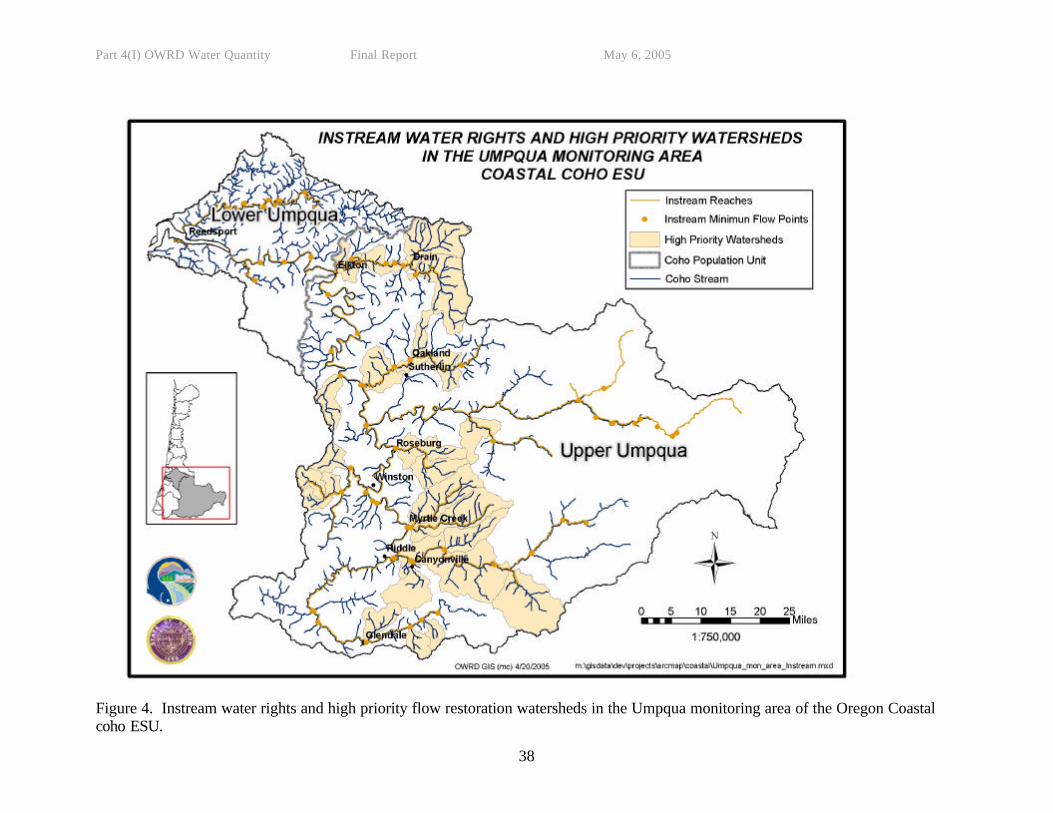
Approximately 800 ISWRs exist in the coastal Oregon basins. Within the Oregon Coastal coho ESU, over 3,700 miles of stream are protected by an instream water right. The distribution of instream water rights and instream minimum flow points for each Coastal coho monitoring area and population unit is shown in Figures 1 through 4. Table 2 summarizes the miles of instream water rights in each monitoring area and population unit. Each summer as streamflows drop, watermasters regulate junior users to provide water to more senior users. When streamflow measurements indicate that the quantity of water in a stream is less than the instream water right, the Department requires junior water right holders to stop or curtail their use. Depending on the priority date of the instream water right, flows are either stabilized or may improve where instream water rights are in place. In many instances, the instream water right is junior relative to other rights on the stream. Under Oregon law, an instream water right cannot affect a use of water with a senior priority date. Therefore, instream water rights do not guarantee minimum streamflows in stream reaches. Since ISWRs are treated like other water rights, they are protected from injury. Water right holders must obtain approval from WRD to change the type of water use, place of use, or point of diversion on a stream. Water rights statutes do not allow a water right change, or “transfer,” if the proposed change results in injury to another existing water right, including instream water rights. Under OAR 690-380-0100(3), injury “means a proposed transfer would result in another, existing water right not receiving previously available water to which it is legally entitled.” For example, if a senior water right proposed to move its point of diversion upstream within an ISWR reach, the ISWR would be injured because the ISWR reach would receive less water than it previously received. Similarly, a change in place of use downstream may injure an ISWR through loss of return flow to the ISWR reach. ODFW district biologists provide WRD comments on potential injury issues, and WRD includes fish screening and passage conditions as recommended by ODFW in the approval of changes in points of diversions. Monitoring “Water Use” by ISWRs ORS 537.099 requires that government entities holding water rights report water use on an annual basis. This requirement applies to WRD as the holder in trust of ISWRs. WRD monitors and reports “water use” by instream water rights in regular reports to the Water Resources Commission. There have been up to 35 continuous recording streamflow gages operated by WRD or the US Geological Survey (USGS) that measure streamflows at instream water right locations within the Oregon Coastal coho ESU. The locations of these continuous streamflow gages and years of data available for each site are provided in Table 3. Published streamflow data for these sites is available on the Department’s website at: www.wrd.state.or.us/surface_water/index.shtml. In addition to continuous gaging stations, WRD collects miscellaneous streamflow measurements and gage height data at staff gages to measure instream water use. Watermasters use continuous streamflow gages measurements, miscellaneous measurements, and staff gage readings to distribute water to ISWRs according to priority date of the water rights of record on a stream.
Part 4(I) OWRD Water Quantity Final Report May 6, 2005
12
For the purposes of the water use report, streamflow measurements at both continuous and miscellaneous measurement sites that fall below the instream water right indicate the instream water right is not being “met.” This characterization should be used with caution because, in many instances, the instream water right is junior relative to other rights on the stream. ISWRs have the same status as other water rights and are not guarantees that a certain quantity of water will be present in the stream. Within the Oregon Coastal coho ESU, the percent of time that ISWRs monitored at continuous gaging stations are “met” is provided in Table 3. Of the 54 ISWRs measured at continuous gaging stations from 1991 to 2002, 39 were met more than 80% of the time. Issuance of New Water Rights for Out-of-Stream Uses New appropriations of surface water or hydraulically connected ground water are evaluated using the Water Resources Commission’s Water Allocation Policy under OAR Chapter 690, Division 410. The Water Allocation Policy sets standards for evaluating whether water is available for new appropriations from Oregon streams. Direct appropriations from streams are evaluated on an 80% exceedance basis. This means that before a new water right may be issued WRD must conclude that water is available for appropriation 80% of the time. The amount of available water is calculated by subtracting from natural flow consumptive uses, scenic waterway flows, and instream water rights. Use of the 80% exceedance standard ensures that new appropriations will not further diminish water available to satisfy instream water rights and scenic waterway flows. As part of its Oregon Plan efforts, the Department updated its water availability model in 1997 to ensure that instream water right flows were included in the model. Issuance of new surface water rights in the Oregon Coast coho ESU is further constrained by additional public interest standards to protect the habitat of sensitive, threatened, and endangered species. OAR 690-033-0330. These rules were adopted in 1996 and require that all new water right applications in the coastal basins must undergo a review by an interagency team for adverse impacts to fish habitat. The purpose of this review is to only grant applications that can be conditioned to protect the habitat of sensitive, threatened, or endangered fish species. As a result, all new permits in coastal areas require barrier- free fish passage where there are fish present, to the specifications requested by ODFW. All new permits in coastal areas also require fish screening where fish are present, to the specifications requested by ODFW. All new permit applications for storage projects, whether large or small, are subject to a public interest review for impacts to sensitive, threatened, or endangered fish species habitat. OAR 690-033-0330. In addition to these measures, all water right certificates under House Bill 2153 (1993 amended by HB 2376 in 1995) issued for ponds on coastal streams contain conditions requiring fish passage, by-pass flows, and fish screens if the pond is in-channel and fish are present. Water Measurement In January 2000 the Water Resources Commission endorsed a strategy for statewide water measurement. This strategy included a program to inventory significant water diversions and conduct field assessments of these diversions. The Department’s strategy
Part 4(I) OWRD Water Quantity Final Report May 6, 2005
13
for increasing water measurement statewide has been to focus limited staff on the largest diversions and diversions with the greatest potential impact on streams. To complete the significant diversion inventory, WRD staff have initially focused their inventory work in high priority streamflow restoration watersheds. These watersheds were identified jointly with ODFW as the watersheds with the greatest biological needs and greatest restoration opportunity. To date, WRD has developed a statewide inventory, or list, of “significant diversions.” Significant diversions are defined as all diversions of permitted and certificated water rights with conditions requiring measurement and reporting and diversions greater than 5 cfs or greater than 10 percent of the lowest monthly 50% exceedance flow on a stream. With the inventory complete, WRD staff are currently doing a compliance assessment of the water measurement device at each identified significant diversion, focusing assessment efforts in high priority streamflow restoration watersheds. Watermasters will notify water users who are out of compliance with their permit condition to measure. If necessary, the watermaster will curtail diversion of water until it is brought into compliance with permit conditions. During their field assessment, watermasters will also note the presence or absence of a fish screen and fish passage and whether the right included screening and/or passage conditions. Voluntary Mechanisms for Reducing Impact from Water Withdrawals WRD also promotes tools for eliminating barriers to fish passage through its existing statutes and rules. For instance, the Department promotes the transfer of surface water points of diversion to ground water appropriations under ORS 540.531. These transfers provide several benefits to fish and riparian areas including minimizing disturbance of riparian areas and eliminating fish passage barriers. Other tools for eliminating fish barriers include water right substitutions. A water user may substitute use of a supplemental ground water right for use of a primary surface water right, provided that no other water rights are injured by the change (ORS 540.524). This provides an opportunity for water users with existing surface water rights and groundwater rights to eliminate points of diversion on surface waters, thereby providing benefits to fish and water quality. The Department can also condition approval of a point of diversion transfer to require a proper fish screen or by-pass device if requested by ODFW (ORS 540.525; OAR 690-015-0073). RESTORATION PROGRAMS The Water Resources Commission has adopted policies under OAR 690-410-030 to encourage streamflow restoration. Oregon law allows water right holders to sell, lease or donate water rights to be converted to instream water rights (ORS Chapters 537 and 540). Water rights may be transferred to instream uses, either permanently by an instream transfer or an allocation of conserved water or temporarily by a lease agreement or temporary transfer. These transferred rights become instream water rights with the priority date of the original right. These tools can be used to restore streamflows in reaches where water quantity limits fish recovery and are described in greater detail below.
Part 4(I) OWRD Water Quantity Final Report May 6, 2005
14
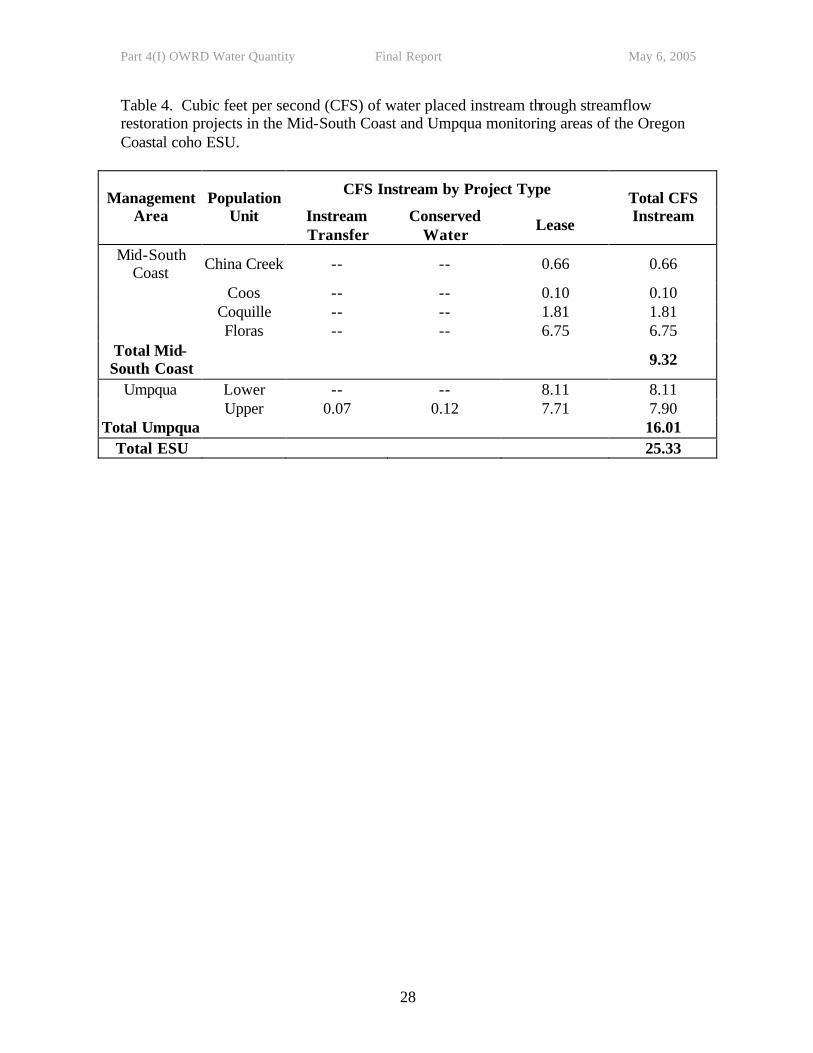
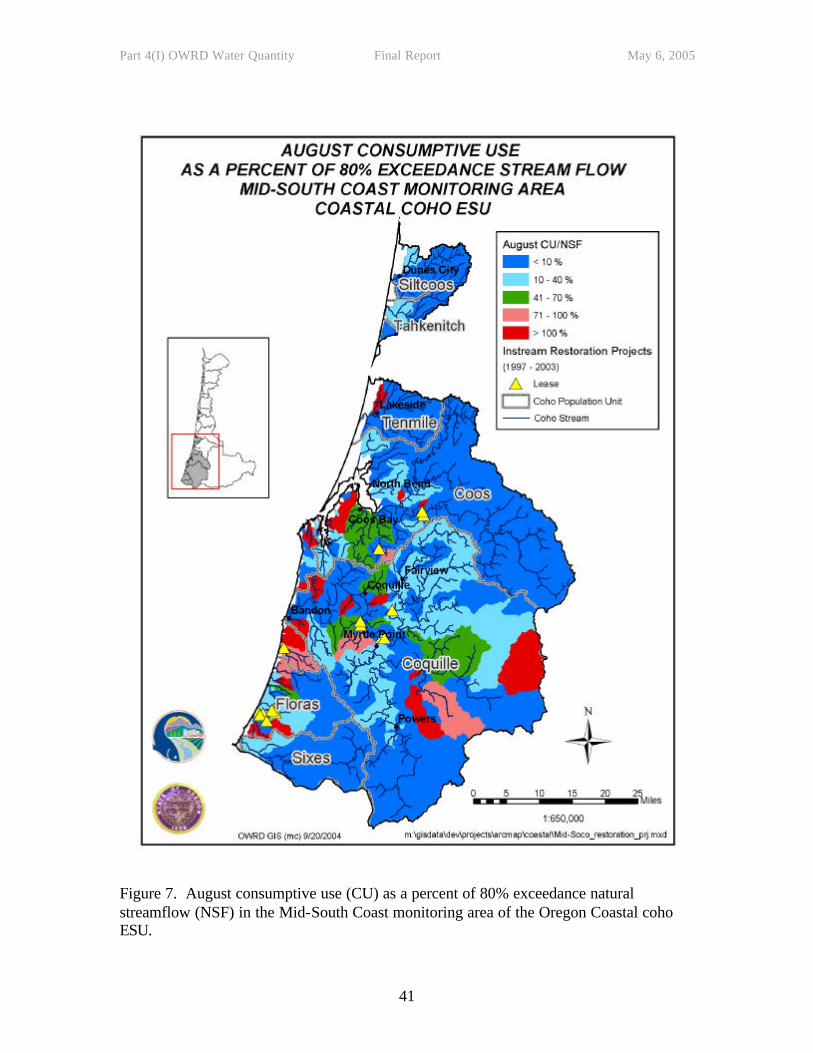
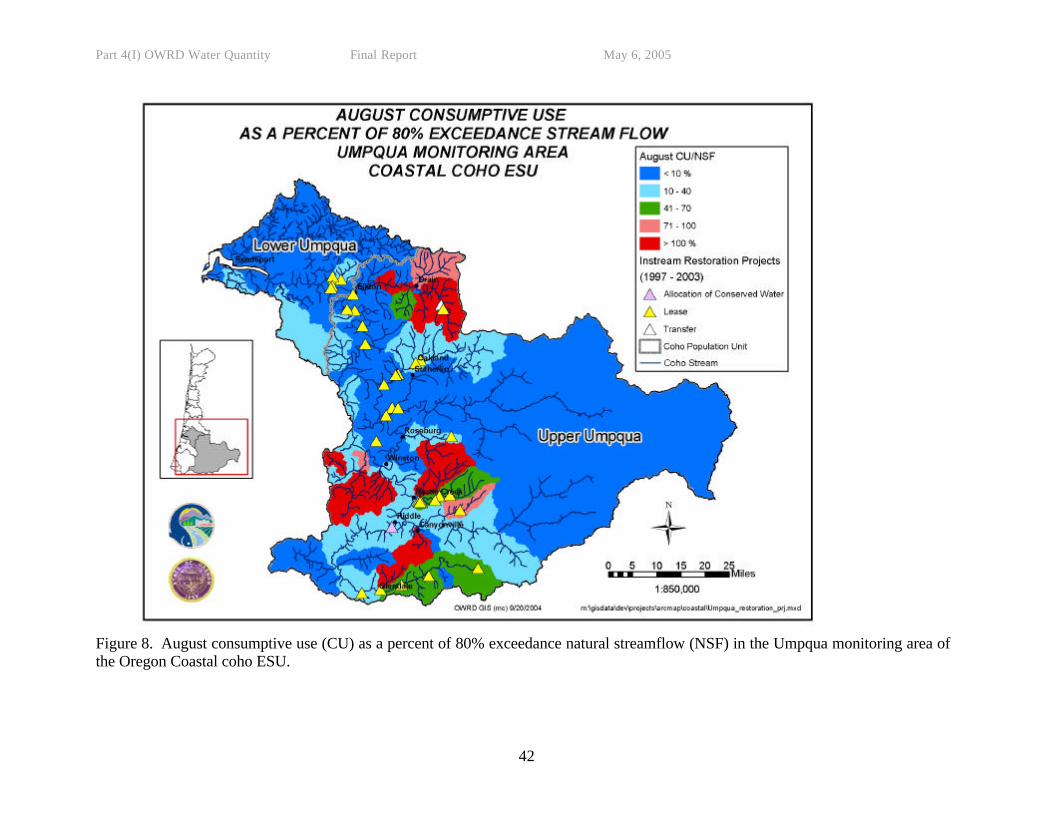
Since the onset of the Oregon Plan in 1997, 66 streamflow restoration projects have occurred in the Oregon Coastal coho ESU (Table 4). These projects have occurred in the Mid-South Coast and Umpqua management units and have totaled 25 cubic feet per second (CFS) of water instream, as shown in Figures 7 and 8. Of these projects, 99% have been instream leases. Instream Water Right Transfers Water rights may be transferred to instream uses, either permanently or temporarily. ORS 537.348; OAR Chapter 690, Division 77. Instream transfers must result in no injury to other water rights and be for a beneficial use of the water, such as fish habitat or flow augmentation for diluting contaminants or pollution. These transferred rights become instream water rights with the priority date of the original right. This water is protected instream and may not be diverted by any junior water users. Allocations of Conserved Water Oregon law allows a water right holder to create “conserved water” by reducing the amount of water diverted to satisfy an existing beneficial use through conservation measures (ORS 537.455 to 537.500). The allocation of conserved water program is a voluntary program intended to provide an incentive for water right holders to implement conservation measures. Water right holders participating in this program are able to utilize a portion of the conserved water for new uses but are required to permanently dedicate a minimum of 25% of the conserved water to instream use. In many cases, 100 % of the conserved water is permanently protected instream. The original water right is reissued to reflect the quantity of water being used after implementing the conservation measure and the priority date stays the same. Another water right certificate is issued for the instream use with either the same priority date, or a priority date of one minute after the original water right. Water Right Leasing Another option available to water right holders is to lease all or a portion of their water rights to instream purposes. ORS 537.348; OAR Chapter 690, Division 77. This option can be particularly attractive to water right holders who do not plan on exercising all or a portion of their right in a given year. Leasing a water right is a beneficial use, and thus may avoid forfeiture of a water right for non-use under ORS 540.610. The water right that is leased and converted to an instream water right during the term of the lease carries the priority date of the unexercised out-of-stream water right. Because the leased water is then treated as an instream water right, the WRD may regulate to protect it. This arrangement provides benefits both to water right holders and to instream values by providing water users with options that protect their water rights while leasing water for instream benefits. Split season use leases provide greater opportunities for streamflow restoration while allowing water right holders to put water to out of stream use for a portion of the year. ORS 537.348; OAR Chapter 690, Division 77. For example, a water right holder can irrigate all of his land for the first part of the season and then lease water
Part 4(I) OWRD Water Quantity Final Report May 6, 2005
15
for instream purposes in the late summer when increased streamflows are most needed. As such, split season use leases offer a tool for water right holders to respond to increasing demands for instream flow needs in ways that allow them to continue to make productive use of their land. Implementation of Streamflow Restoration Efforts WRD has partnered with ODFW to combine assessments of streamflow needs for fish with streamflow restoration potential—to produce priorities for streamflow restoration in river basins. This joint prioritization effort was completed in 1998 for the Oregon Coastal coho ESU. Priority flow restoration areas and the methods used to prioritize watersheds are provided at http://www.wrd.state.or.us/OWRD/mgmt_opsw.shtml. Watershed councils, soil and water conservation districts, conservation groups and others are encouraged to use these priorities to guide their flow restoration efforts. WRD watermasters also focus their flow restoration efforts and other Oregon Plan activities in these high priority areas. SCOPE OF ASSESSMENT The Oregon Coastal coho ESU is delineated as coho salmon populations south of the Columbia River and north of Cape Blanco. Impacts of water withdrawals on summer streamflows, trends in consumptive use since the onset of the Oregon Plan (1997), and water availability for new appropriations were considered at three scales: 1) coho salmon population unit (potentially independent and independent); 2) monitoring area; and 3) Oregon Coastal coho ESU. The 19 population units and four monitoring areas of the ESU are shown in Figures 1 through 4. DATA SOURCES The primary source of data for this assessment is the WRD surface water availability database. The methods used to estimate surface water availability, consumptive use, and natural exceedance streamflow in 1997 and 2004 are described in detail by Cooper (2002). Data can be accessed through the water availability report system (WARS) at www.wrd.state.or.us. WRD calculates exceedance flows, consumptive use, and water availability for selected watersheds called Water Availability Sub-basins (WABs). The number and delineation of these WABs depends on the location of gages and instream water rights and the physiography of affected streams. The number of WABs delineated within the Oregon Coastal coho ESU, monitoring areas, and population units is provided in Table 2. Water rights information for the Oregon Coast coho ESU, including instream water rights, was obtained from the WRD Water Rights Information System (WRIS) available at http://www.wrd.state.or.us/OWRD/WR/wris.shtml. WRD also maintains an internal database of streamflow restoration projects used in this report. Water use data for instream water rights in the Oregon Coast coho ESU were based on continuous streamflow gaging and miscellaneous measurements as reported to the Water
Part 4(I) OWRD Water Quantity Final Report May 6, 2005
16
Resources Commission in May 2004 and available at http://www1.wrd.state.or.us/files/Publications/staff_reports. Published streamflow data for these sites is available on the Department’s website at: http://www.wrd.state.or.us/OWRD/SW/index.shtml#Surface_Water_Data. ANALYTICAL METHODS Status Assessment of Estimated Consumptive Use Impacts on Natural Streamflow To assess water withdrawals as a potential limiting factor for Oregon Coastal coho, we compared estimated August consumptive use (CU) of water rights and the 80% natural exceedance streamflow (NSF) in watershed areas within the ESU. The source of data for this analysis is the WRD surface water availability database, as described above. This analysis represents a new way of using existing WRD data. While we will continue to explore other approaches to assessing the impact of water withdrawals on streamflows, the methods described here are based on the best available data at this time. CU as a percent of NSF was analyzed for August since this period generally exhibits high CU and low flows and, therefore, represents the period when low streamflows due to water withdrawals would be most pronounced and have the greatest potential impact on salmonids. For this assessment, natural streamflow is the modeled flow in a stream when there are no consumptive uses and there is no flow regulation. A consumptive use is any water use that causes a net reduction in streamflow and is usually associated with an evaporative or transpirative loss. Natural streamflow is typically described by statistics such as the mean daily flow, mean monthly flow, mean annual flow, or median monthly flow. For this assessment, we are interested in how often a rate of flow is present in a stream so the appropriate statistic is exceedance streamflow. An exceedance streamflow is the streamflow exceeded a given percent of the time. We chose the 80% exceedance natural streamflow for this analysis since the 80% exceedance flow provides a more conservative, or more protective, instream flow comparison than the median flow, or 50% exceedance flow. For example, the 50% exceedance flow at the mouth of the Sixes River is 37 cfs in August, and the 80% exceedance flow is 21 cfs. Thus, the percent CU of the exceedance flow is highest if the 80% exceedance value is used in this comparison. For the assessment of consumptive use impacts on streamflows, we estimated exceedance flows and consumptive use for watersheds or “WABs” delineated in the Oregon Coastal coho ESU, monitoring areas, and population units (Table 2). Exceedance flows are determined directly from gage records or by estimation through modeling. When determined from gage records the exceedance flows must be corrected to a common base period and corrected to natural streamflow. An exceedance flow is specific to the time period for which it is calculated. WRD selected 1958 to 1987 as a base period because it best represents the long-term average conditions for this century and it is the period for which the most streamflow information is available. All WRD exceedance flows represent the base period. The methods used to estimate exceedance streamflows in WABs are described in detail by Cooper (2002).
Part 4(I) OWRD Water Quantity Final Report May 6, 2005
17
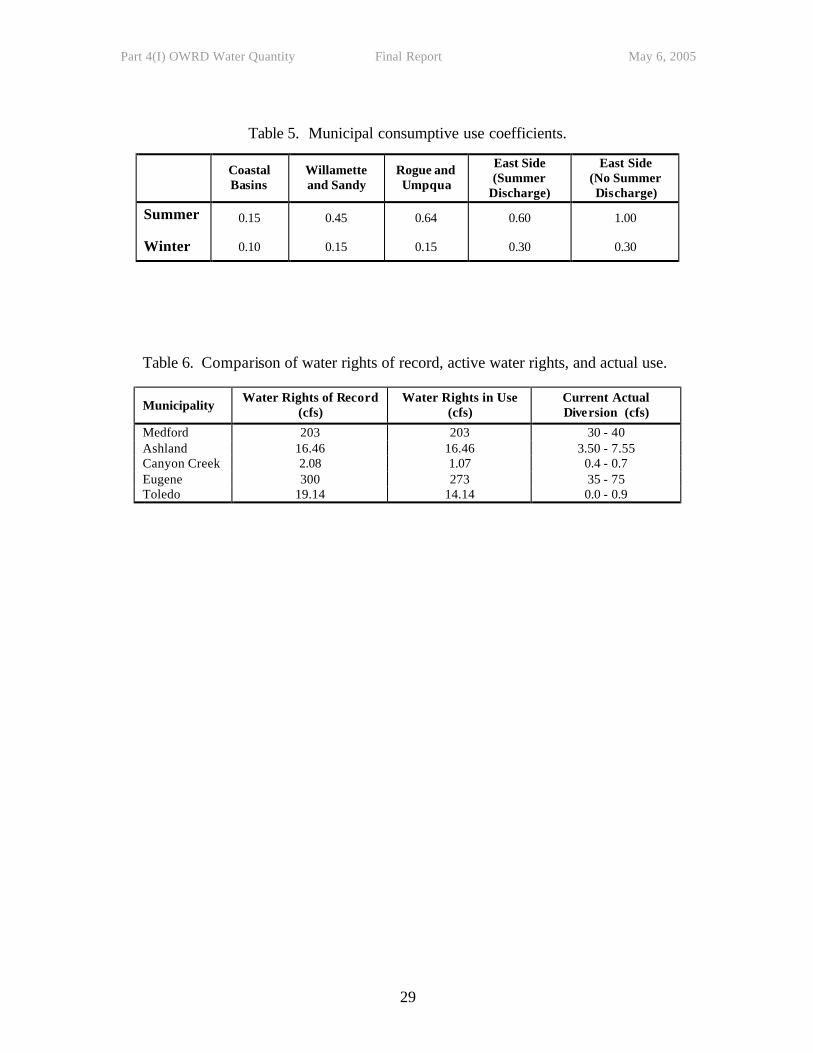
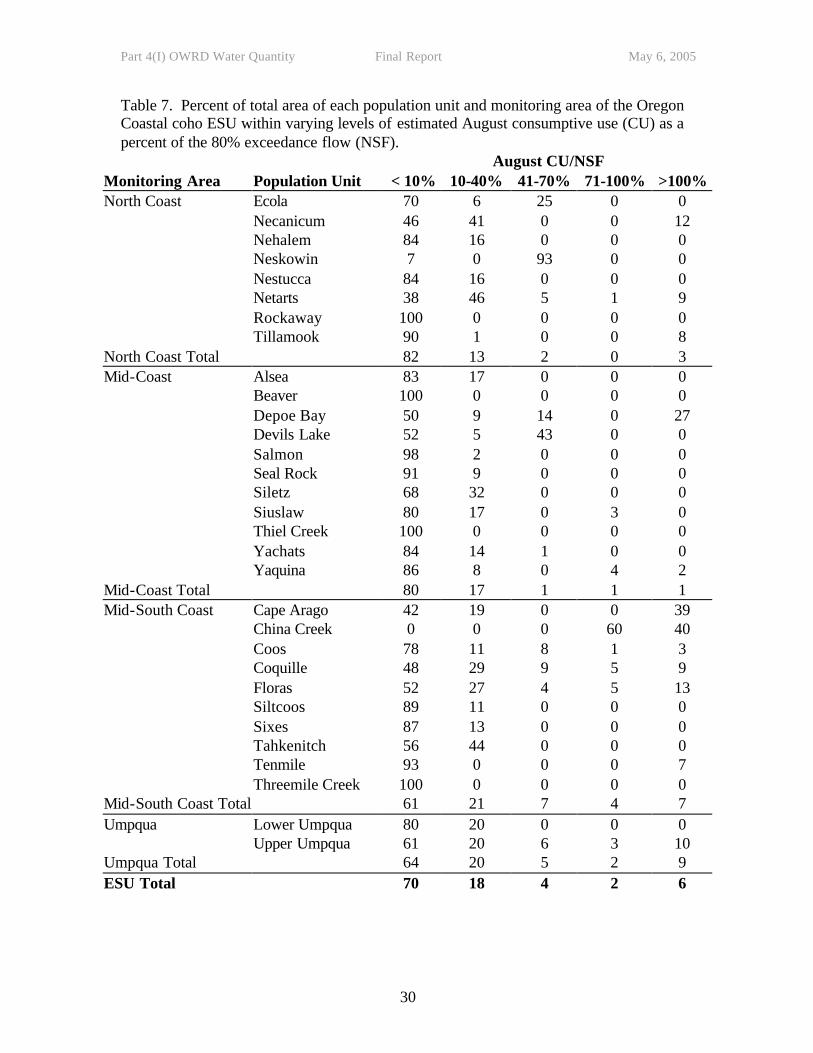
There are four major categories of consumptive use: irrigation, municipal, storage, and all others (e.g., domestic, livestock). Consumptive use from irrigation is based on estimates from the US Geological Survey (Broad and Collins, 1996, as referenced in Cooper, 2002). These uses are not 100% consumptive. Return flows are generally assumed in the watershed where diversion occurs. Consumptive use from other categories of use is based on the associated water rights. These uses are also less than 100% consumptive. Consumptive use is estimated by multiplying a consumptive use coefficient (e.g., for domestic use, the coefficient is 0.20) by the maximum diversion rate allowed for the water right. It is assumed that the non-consumed part of the diversion is returned to the stream from which it was diverted. The exception to this rule occurs where diversions are from one watershed to another. In this case, the use is considered 100% consumptive, and the consumptive use is the diversion rate. Consumptive use estimates in the water availability database include consumptive use from ground water rights issued since 1992 that were found to be hydraulically connected to surface water. Two different calculations of municipal consumptive use are made in the water availability database: 1) the actual use and 2) the expected demand. The actual use is used to correct gaged flows to natural flow. The expected demands are used in the water availability calculation. The expected demand may be larger than the actual use because it represents the potential demand under the water right. The actual consumptive use is obtained by multiplying a consumptive use coefficient by the actual diversion of the municipality. Municipalities are required to report to the WRD the amount of their diversion annually, so these data are readily available. Table 5 gives the consumptive use coefficients used in various areas around the state. These coefficients are based on actual municipal diversions and sewage outfalls. Expected demands are calculated by multiplying the full face value of the active water right for the municipality by the appropriate consumptive use coefficient from Table 5. As described above, the face value of a municipal water right may be larger than the actual diversion. There are many reasons for the discrepancy including municipal water use demand typically increases steadily over time due to population growth and municipalities often hold multiple water rights to ensure uninterrupted service in case of shortage or emergency. The expected demands for municipal use are based on water rights currently in use (i.e. water rights with facilities and infrastructure that would allow diversion and use). Water rights held as alternate sources are not considered in calculating expected demands. The expected demand is the consumptive part of the active water rights taken at their full face value (Table 6). August 80% exceedance flows and consumptive use calculations (Table 2) were made in March 2004. Since we were interested in identifying areas where consumptive use would have an impact along a stream drainage, CU estimates for each WAB were calculated as a polygon, not a drainage, by subtracting CU estimates of upstream WABs. This “un-nested” CU estimate was then compared to the 80% exceedance flow for the WAB drainage and reported as a percent of the 80% exceedance flow. August CU as a percent of the 80% exceedance flow (“August CU/NSF”) was summarized by percent area (Table
Part 4(I) OWRD Water Quantity Final Report May 6, 2005
18
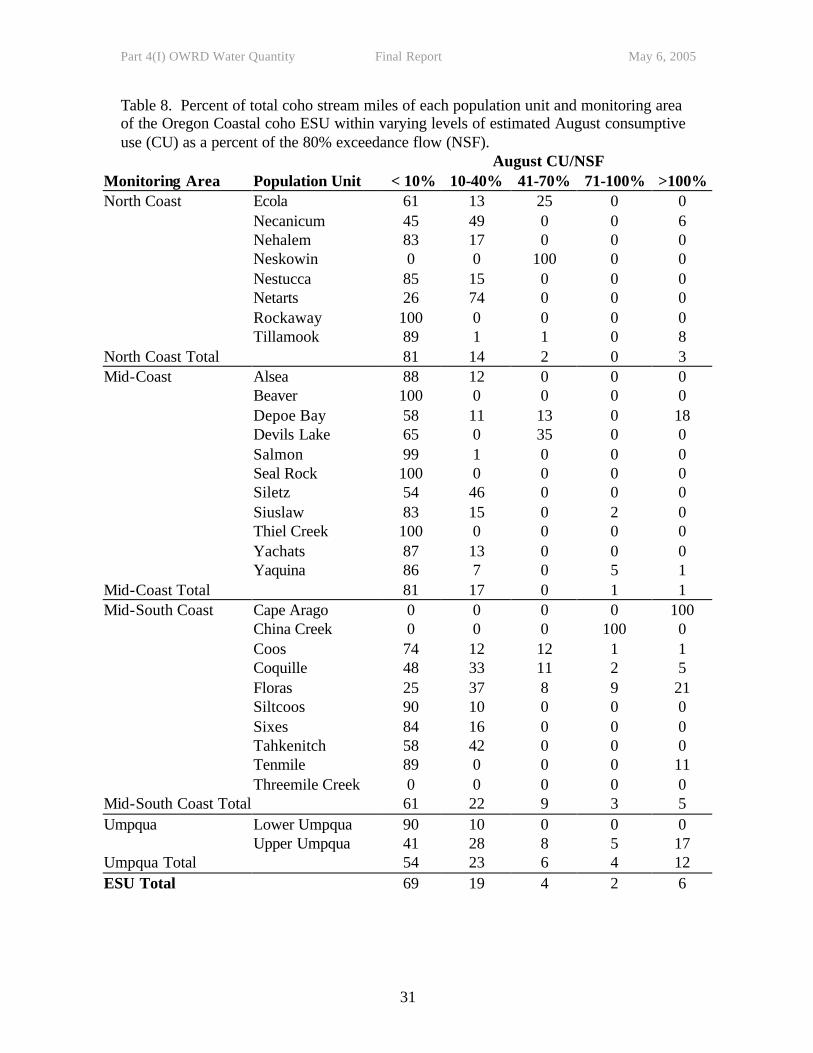
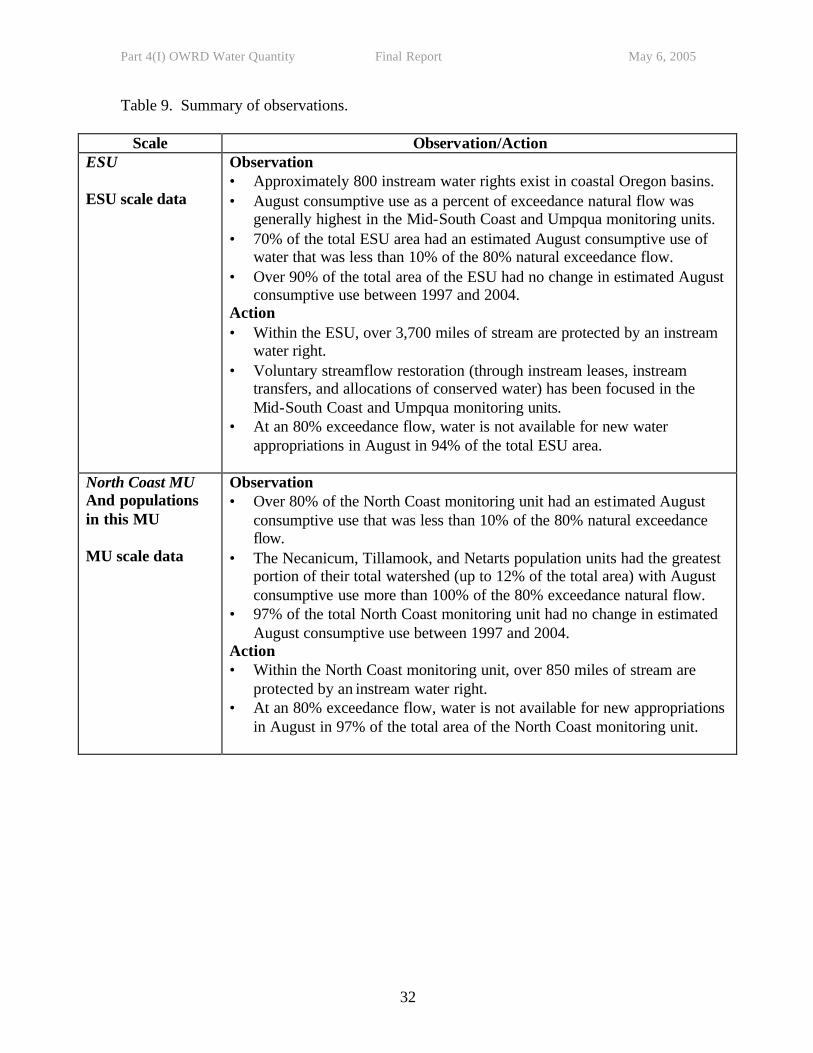
7) and by coho stream miles (Table 8) for each coho population unit, management area, and the ESU by overlaying this data with Geographic Information System (GIS) layers of coho streams and population units. Trends in Estimated Consumptive Use For the assessment of impact of water withdrawals as a limiting factor, we were interested in trends in consumptive use since the onset of the Oregon Plan in 1997 and expected trends in consumptive use from issuance of new water right permits in the future. To assess changes in CU since the onset of the Oregon Plan, we used the water availability reporting system to create a database of August consumptive use estimates for January 1, 1997. Similar to the status assessment of consumptive use impacts on streamflow, we obtained August consumptive use for “WABs” delineated for the Oregon Coastal coho ESU, monitoring areas, and population units (Table 7). CU estimates for each WAB in 1997 and in 2004 were calculated as a polygon by subtracting CU estimates of upstream WABs. The percent change from 1997 to 2004 in August CU for each area was calculated. We were also interested in assessing the potential for additional consumptive use impacts on streamflows from new water rights issued in the future. We used water availability data at the 80% exceedance flow from WARS to assess the likelihood that new water rights would be issued during a low flow period such as August. Water availability was calculated in March 2004 and reported in cfs of water available for new water uses. Water availability is the amount of water that can be appropriated from a given point on a given stream for new out-of-stream consumptive uses. It is obtained by subtracting existing instream water rights and out-of-stream consumptive uses from the subject exceedance natural flow. Water availability is typically calculated at pour points (i.e. mouths) of WABs or at the beginning of an ISWR within a WAB. In general, the calculation of water availability at one WAB cannot be considered in isolation from other WABs. Any upstream consumptive use subtracts from water availability at all points downstream as well as upstream. For water to be available at any given upstream point, it must be available at all points of calculation downstream. WRD limits appropriation from streams in the state to provide greater certainty that water will actually be available for “new” uses and to minimize the regulatory burden of Department staff. For direct flow diversion for other than water storage, WRD uses the 80% exceedance flow. We used the 80% exceedance flow for our assessment of future water right permitting in the ESU since this is the exceedance flow used to evaluate water availability for new water uses. RESULTS Observations for the assessment are summarized in Table 9.
Part 4(I) OWRD Water Quantity Final Report May 6, 2005
19
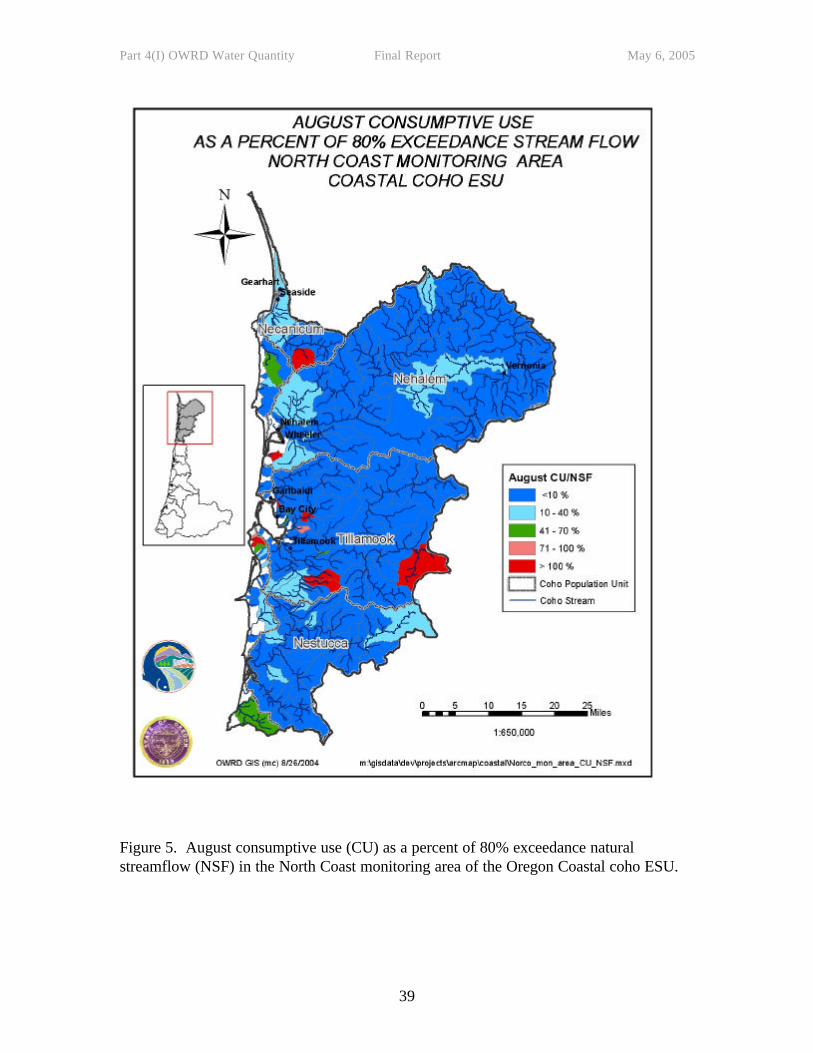
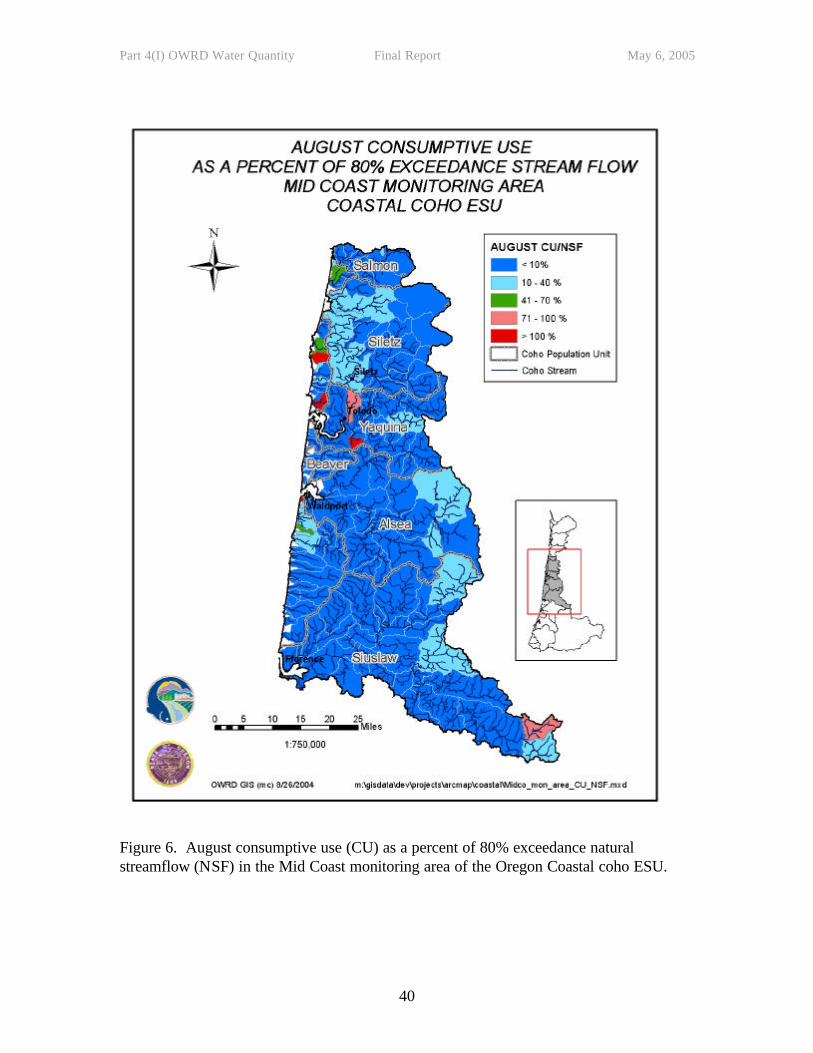
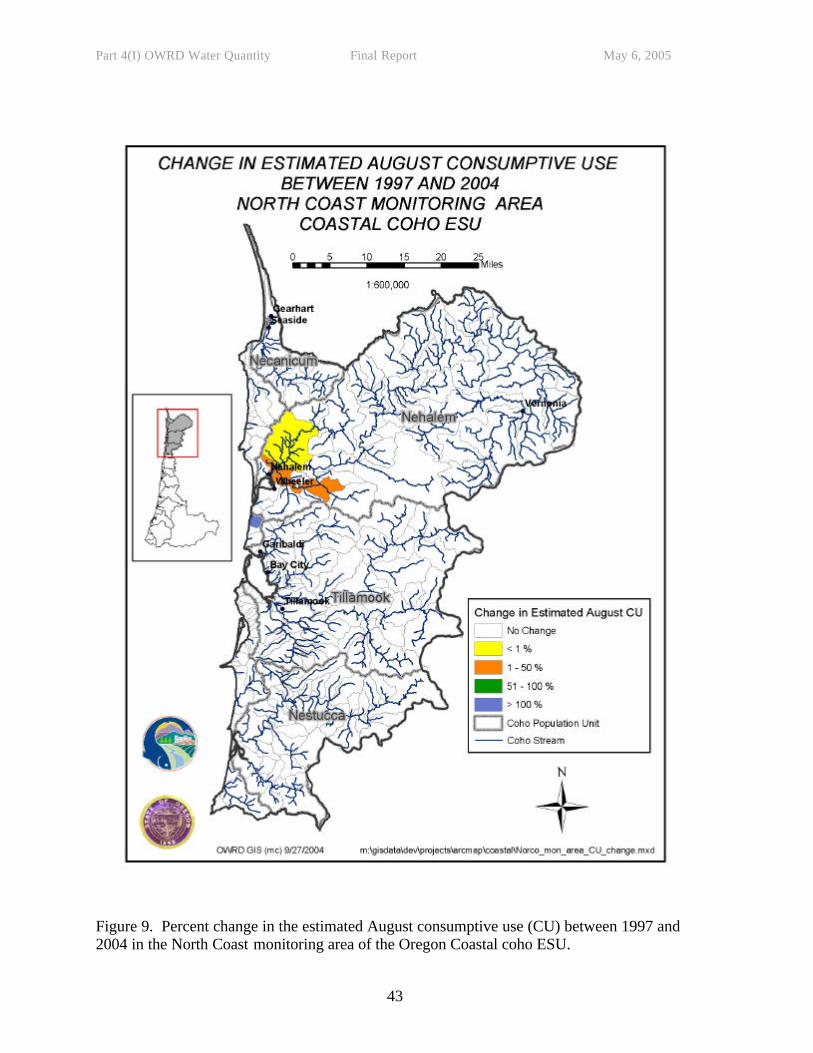
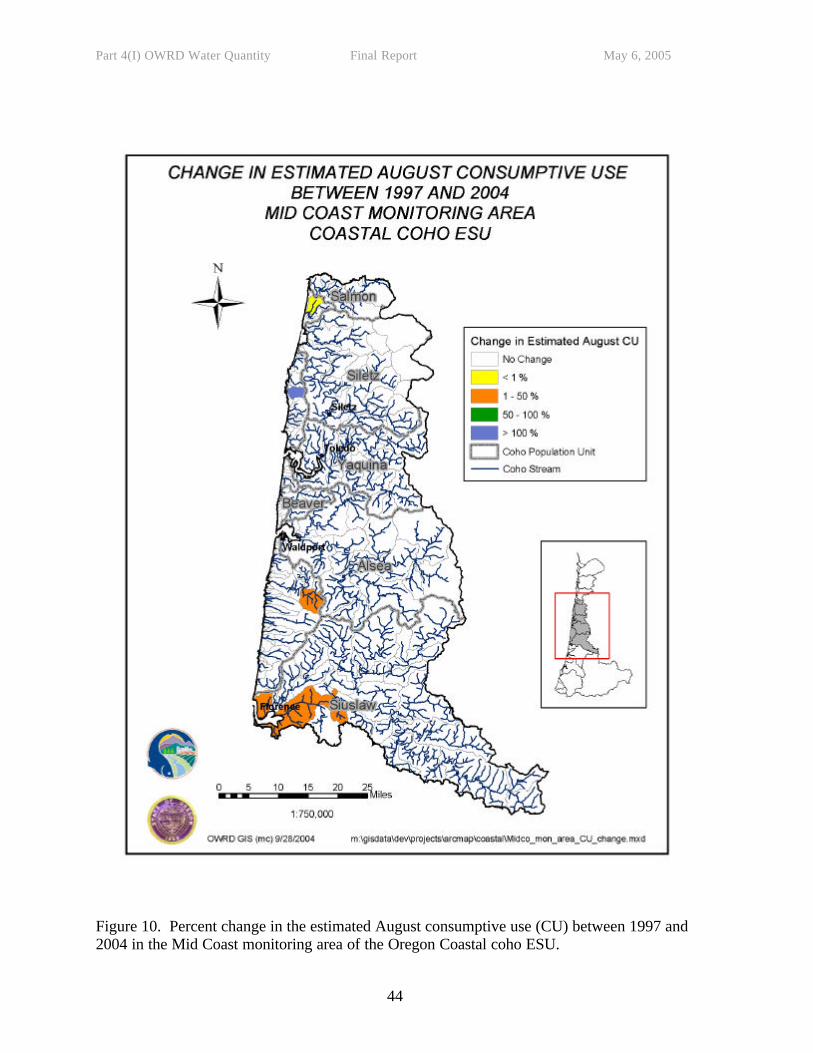
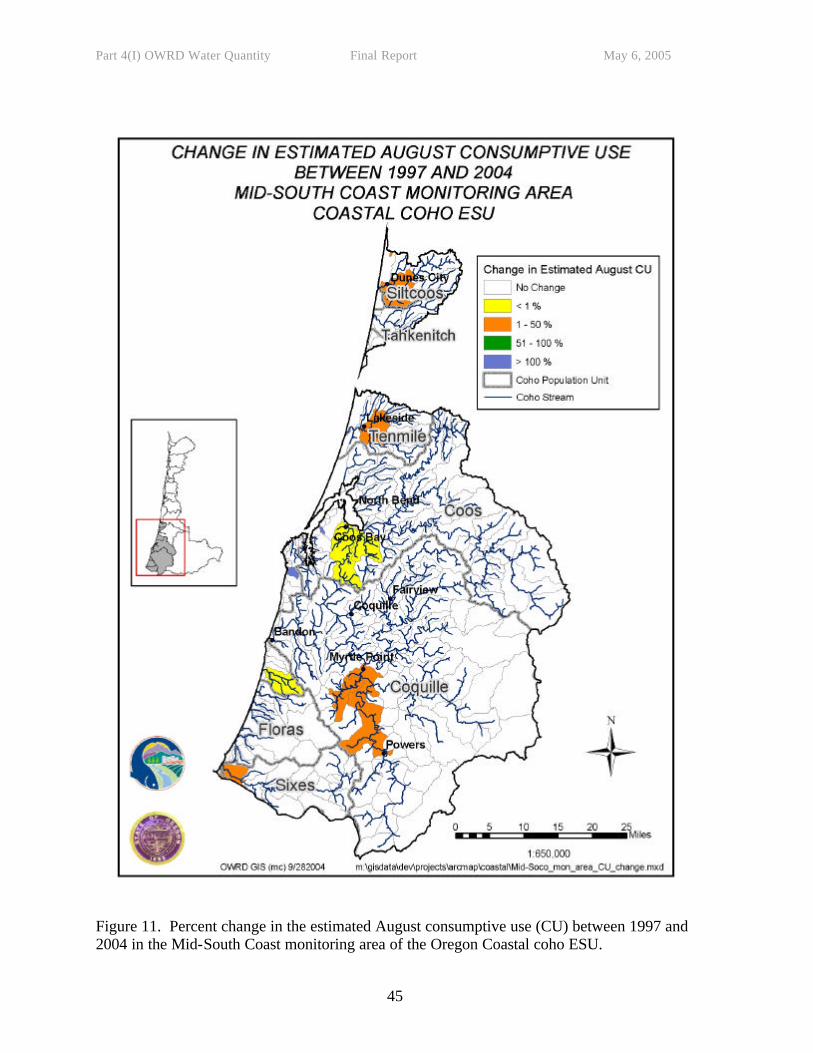
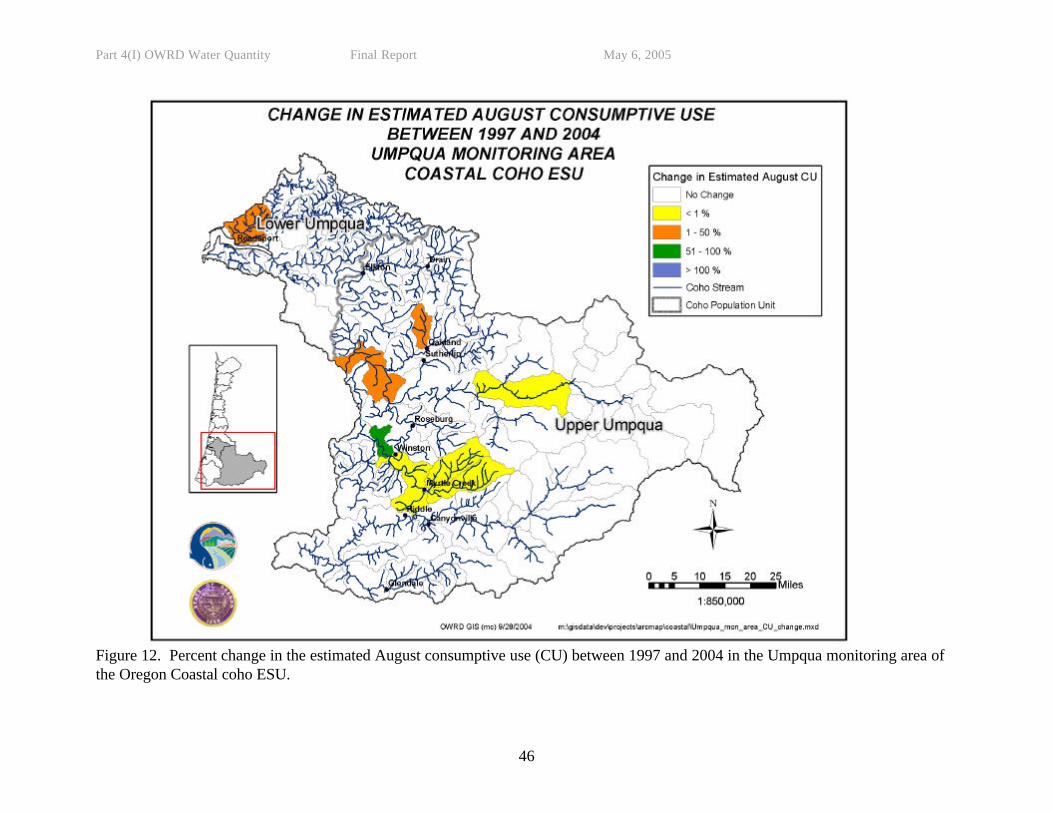
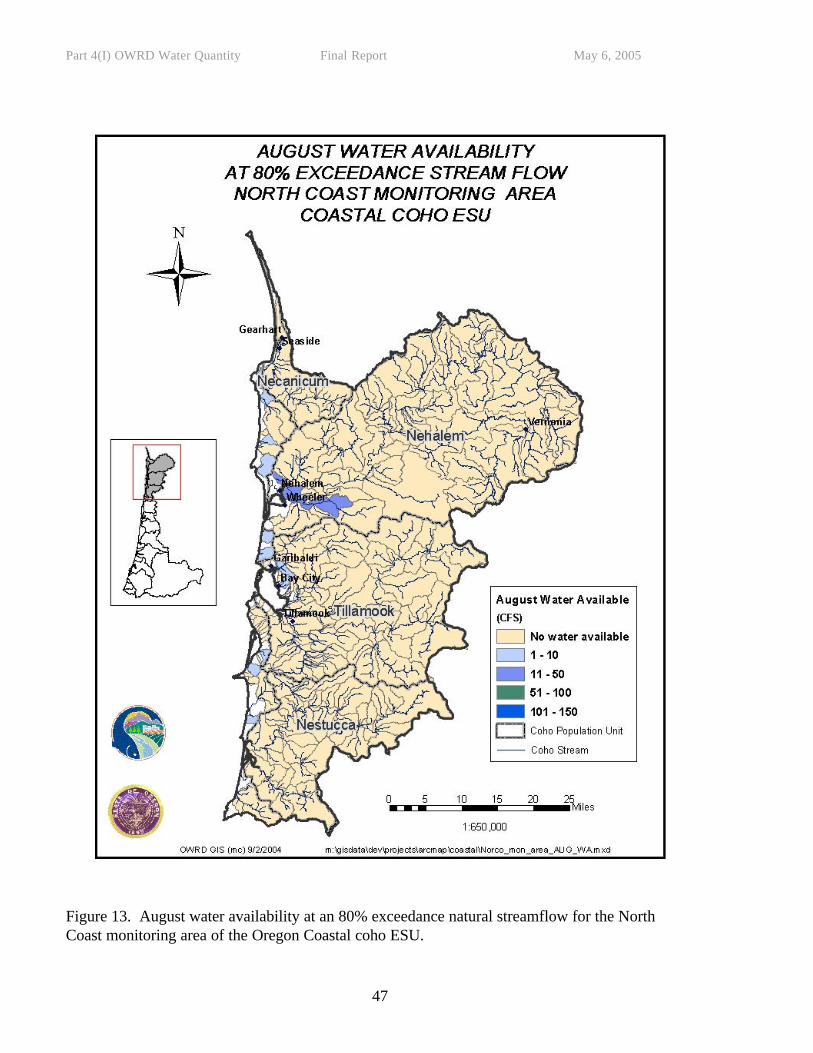
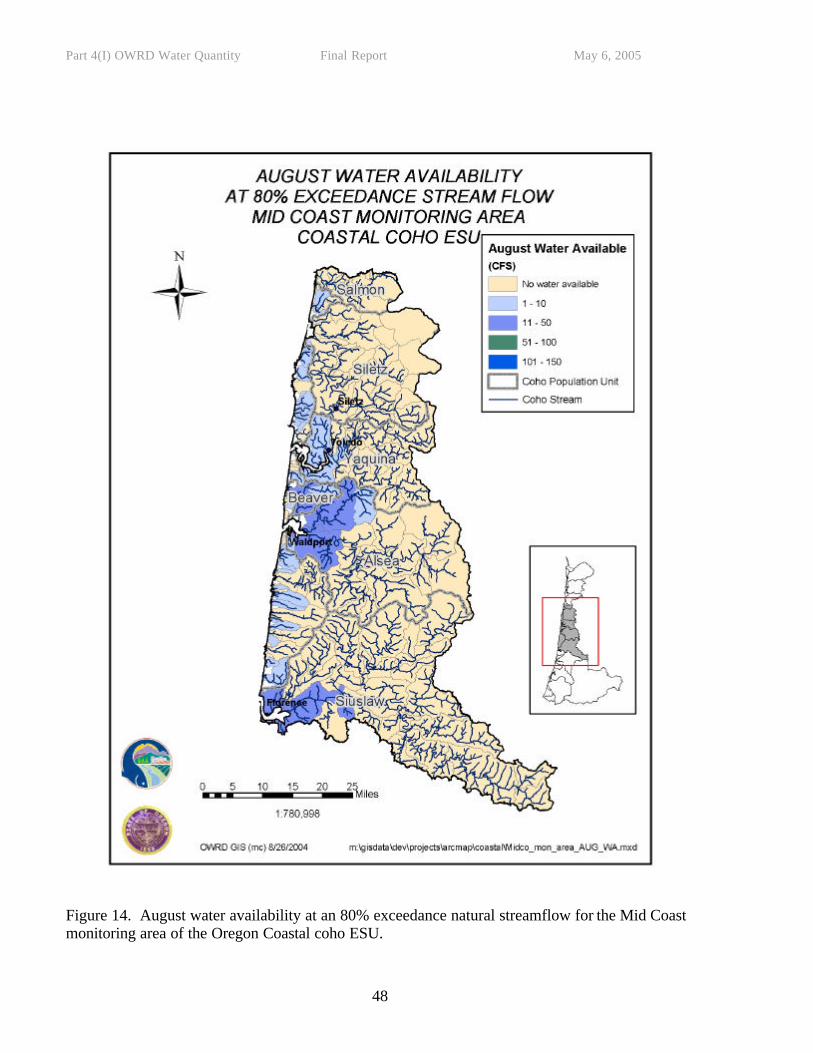
Status Assessment of Estimated Consumptive Use Impacts on Natural Streamflow Table 7 summarizes the percent of total area of each population unit and monitoring area by level of estimated August consumptive use as a percent of the 80% exceedance flow. Table 8 provides the percent of coho miles in each population unit and each monitoring area by level of August consumptive use as a percent of the 80% exceedance flow. Overall, 70% of the ESU area exhibited August consumptive use that was less than 10% of the 80% exceedance flow (Table 7). Figures 5 through 8 illustrate the range in August CU as a percent of the 80% exceedance flow for each of the four monitoring areas. In the North Coast and Mid-Coast monitoring areas, August CU was less than 10% of exceedance flows in 80% or more of those monitoring areas (Figures 5 and 6). August consumptive use as percent of exceedance flow was higher in the Mid-South Coast and Umpqua monitoring areas with only 60% of the total area having consumptive use less than 10% of the exceedance flow (Figures 7 and 9). Trends in Estimated Consumptive Use Figures 9 through 12 illustrate the percent change in estimated August CU from 1997 to 2004 in each monitoring area. Overall, 93% of the total area of the Oregon Coastal coho ESU had no change in estimated August CU between 1997 and 2004. 97% of the total area of the North Coast monitoring area had no change in estimated August CU (Figure 9). In the Mid-Coast monitoring area, 96% of the total area had no change in estimated August CU from 1997 to 2004 (Figure 10). In the Mid-South Coast monitoring area, 92% of the total monitoring area had no change in estimated August CU from 1997 to 2004 (Figure 11). 90% of the Umpqua monitoring unit had no change in estimated August CU from 1997 to 2004 (Figure 12). Water availability for August based on an 80% exceedance flow is provided for each monitoring area of the Oregon Coastal coho ESU in Figures 13 through 16. Water availability is only one factor used by WRD in water right permitting decisions; however, generally water must be available on an 80% exceedance for a water right to be issued for a given month. In addition to water availability, the water use must be consistent with administrative rules adopted by the Water Resources Commission that prescribe future allowable uses of water, must not result in injury, and must be consistent with other rules of the Water Resources Commission. For the purposes of this assessment, water availability at the 80% exceedance natural flow is used as proxy for the likelihood that new water uses would be permitted. For the North Coast monitoring unit, water is not available at an 80% exceedance flow in August for 97% of the total area (Figure 13). The maximum water available for new appropriations in August occurs in the lower watershed of the Nehalem population unit with up to 14 cfs potentially available for new uses. Overall, more water is potentially available in August in the Mid-Coast monitoring area than the North Coast monitoring area at an 80% exceedance. However, more than 80% of the total area of the Mid-Coast monitoring area would have no water available at an 80% exceedance flow in August (Figure 14). Similar to the North Coast, areas where water is potentially available for new water rights are limited to the lower portions of watersheds in the Mid-Coast. At an 80% exceedance flow, as much as 32 cfs and 47 cfs would be available from areas of the
Part 4(I) OWRD Water Quantity Final Report May 6, 2005
20
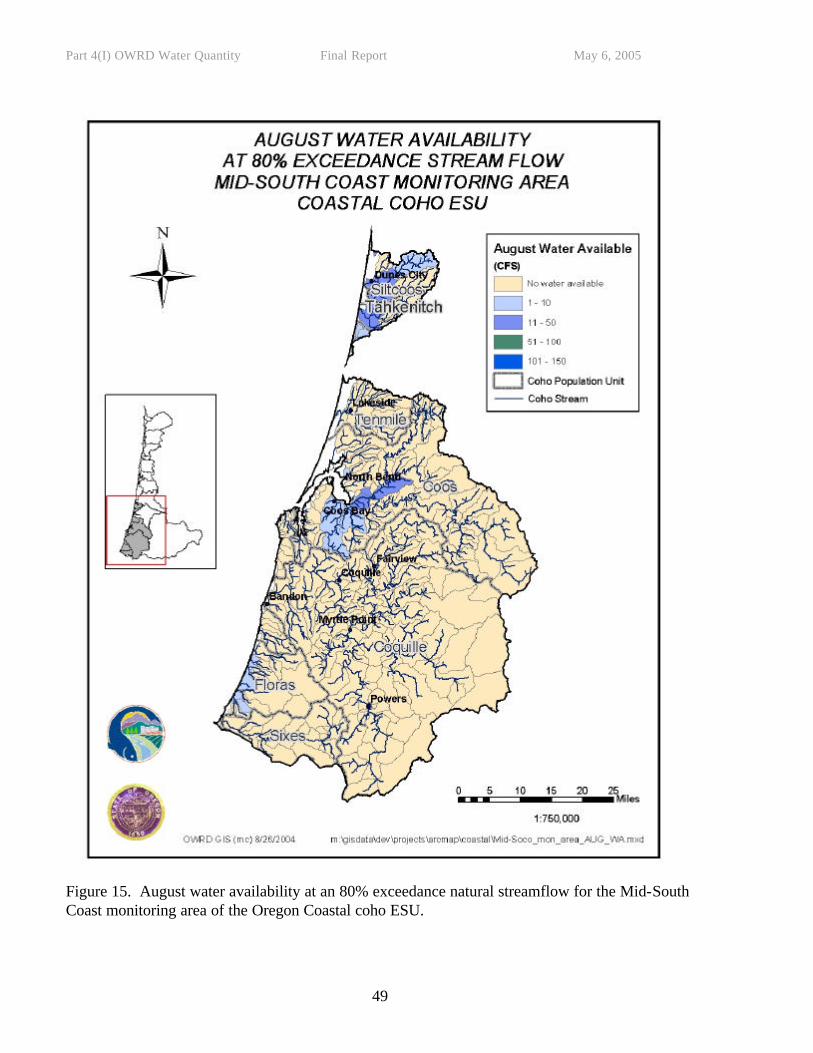
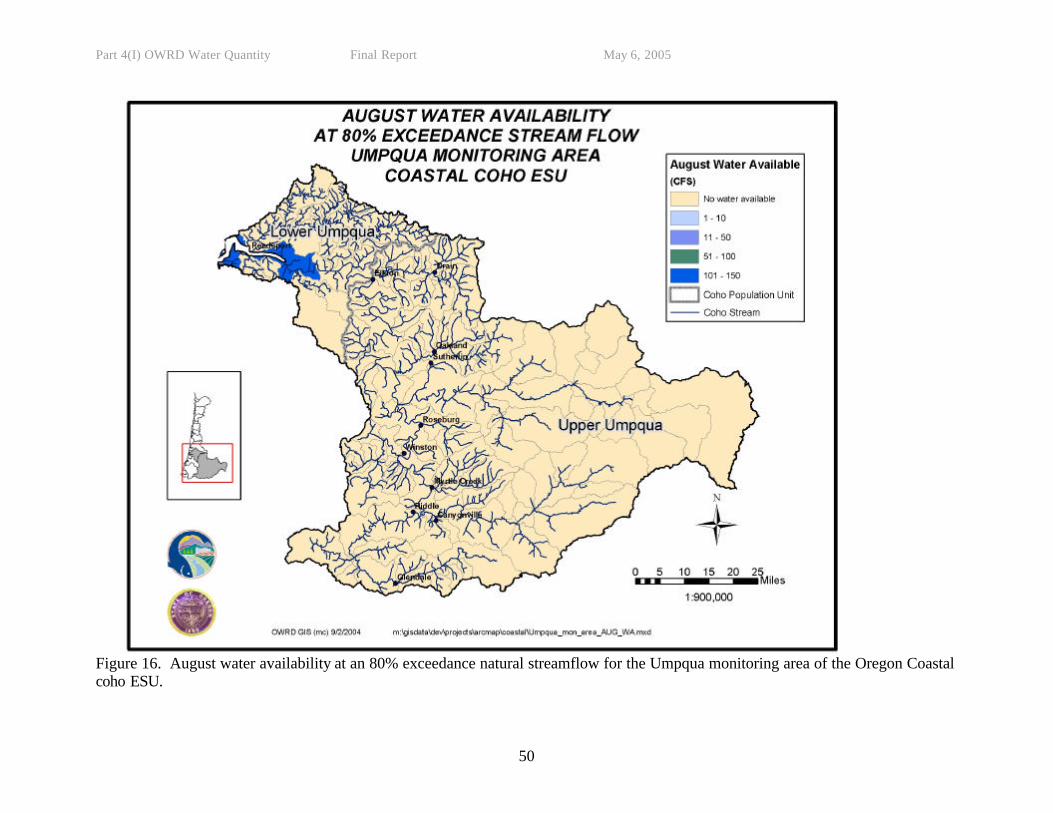
Alsea and Siuslaw population units, respectively, in August. 97% of the total area of the Mid-South Coast monitoring area has no water available in August for new appropriations (Figure 15). Up to 37cfs and 27 cfs in August could potentially be available in the lower watersheds of the Coos and Siltcoos population units, respectively. 94% of the total area of the Umpqua monitoring area had no water available for new water rights in August at an 80% exceedance (Figure 16). However, up to 149 cfs could potentially be available for new water rights in the Lower Umpqua population unit. DISCUSSION Our assessment indicates that impacts of water withdrawals on summer streamflows in the Oregon Coastal coho ESU are limited. 70% of the total ESU area exhibited consumptive use less than 10% of the 80% natural exceedance flow. August consumptive use as a percent of exceedance natural flow was generally highest in the Mid-South Coast and Umpqua monitoring units. However, streamflow restoration efforts since the onset of the Oregon Plan have focused in these two monitoring areas with 66 projects (Table 4) and 25 cfs of water placed instream (Figures 7 and 8). Our assessment of the change in summer consumptive use in the Oregon Coastal coho ESU suggests that consumptive use has not substantially changed since the onset of the Oregon Plan in 1997. Over 90% of the total ESU area had no change in estimated August consumptive use between 1997 and 2004. Using our water availability data as a proxy, we also found that consumptive use is not likely to increase significantly in the future. At an 80% exceedance flow, water is not available for new water appropriations in August in 94% of the total ESU area. Our assessment of estimated consumptive use impacts on streamflow and trends in estimated consumptive use combined with our analysis of the certainty that existing regulatory and restoration programs will be implemented and effective suggest that water diversions in summer are not a major factor for decline for the Oregon Coastal coho ESU. Additionally, our assessment indicates that voluntary flow restoration efforts (via leases, transfers, and conserved water allocations) should continue to be focused in the Mid-South Coast and Umpqua monitoring units.
Part 4(I) OWRD Water Quantity Final Report May 6, 2005
21
Table 1. Voluntary compliance rates in watermaster districts that coincide with the Oregon Coast coho ESU.
Percent Voluntary Compliance Year District 1 District 2 District 15 District 19 1998 No data 50 98 97 1999 76 34 99 96 2000 No data 63 100 99
2001 100 70 99 100 2002 82 64 99 100 2003 80 79 100 98 2004 90 92 99 100
Part 4(I) OWRD Water Quantity Final Report May 6, 2005
22
Table 2. Number of water availability sub-basins (WABs) delineated and instream water rights in each monitoring area and population unit of the Oregon Coastal coho ESU.
Monitoring Area Coho Population Unit Number of
WABs Instream Water Rights
(reach-miles) North Coast Ecola 8 15
Necanicum 6 46 Nehalem 38 294 Neskowin 3 12 Nestucca 36 206 Netarts 15 5 Rockaway 2 0 Tillamook 57 296
North Coast Total 165 875 Mid-Coast Alsea 21 183
Beaver 2 0 Depoe Bay 13 0 Devils Lake 6 4 Salmon 9 51 Seal Rock 5 0 Siletz 22 163 Siuslaw 28 460 Thiel Creek 5 0 Yachats 28 61 Yaquina 18 115
Mid-Coast Total 157 1037 Mid-South Coast Cape Arago 11 9
China Creek 4 15 Coos 64 229 Coquille 76 440 Floras 16 40 Siltcoos 4 17 Sixes 15 80 Tahkenitch 3 17 Tenmile 16 63 Threemile Creek 2 0
Mid-South Coast Total 211 909 Umpqua Lower Umpqua 21 120
Upper Umpqua 82 768 Umpqua Total 103 888
ESU Total 636 3710
Part 4(I) OWRD Water Quantity Final Report May 6, 2005
23
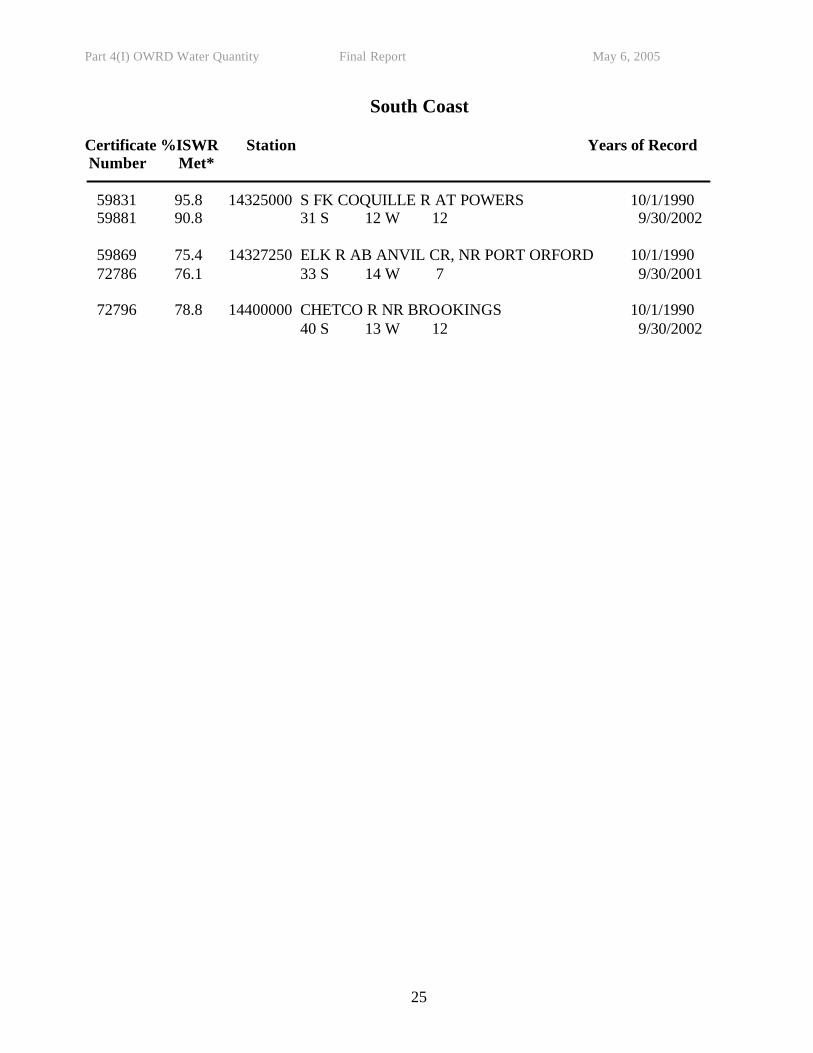
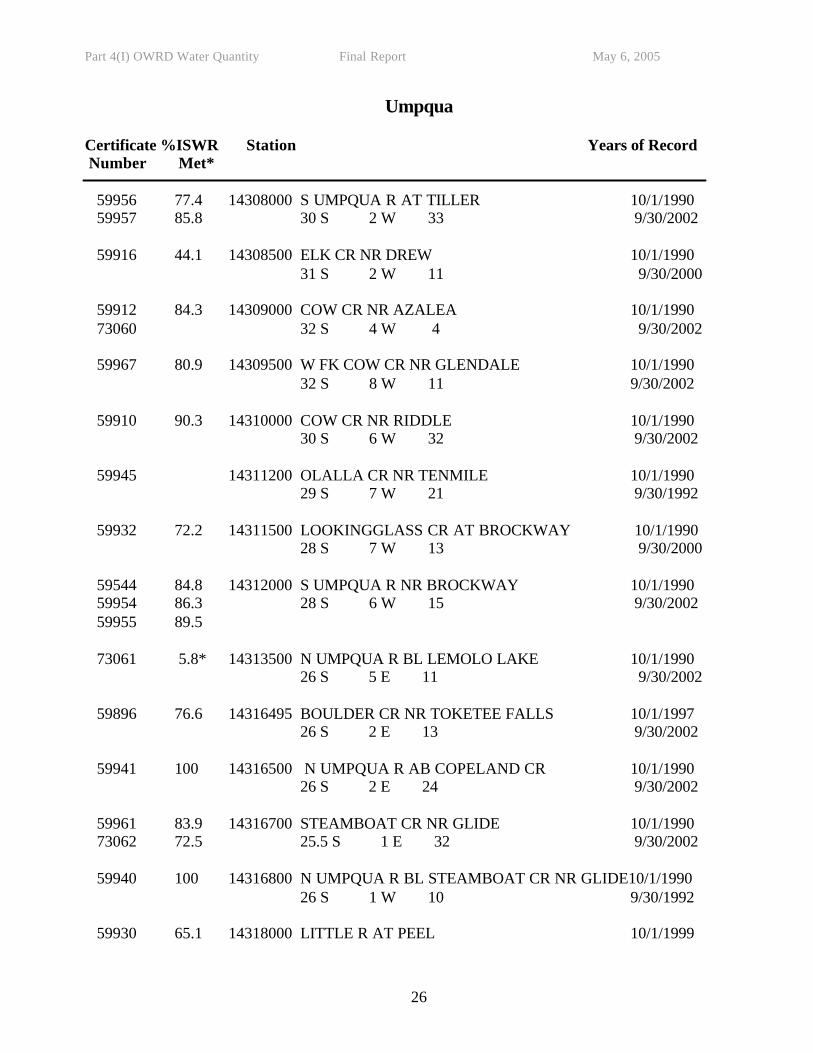
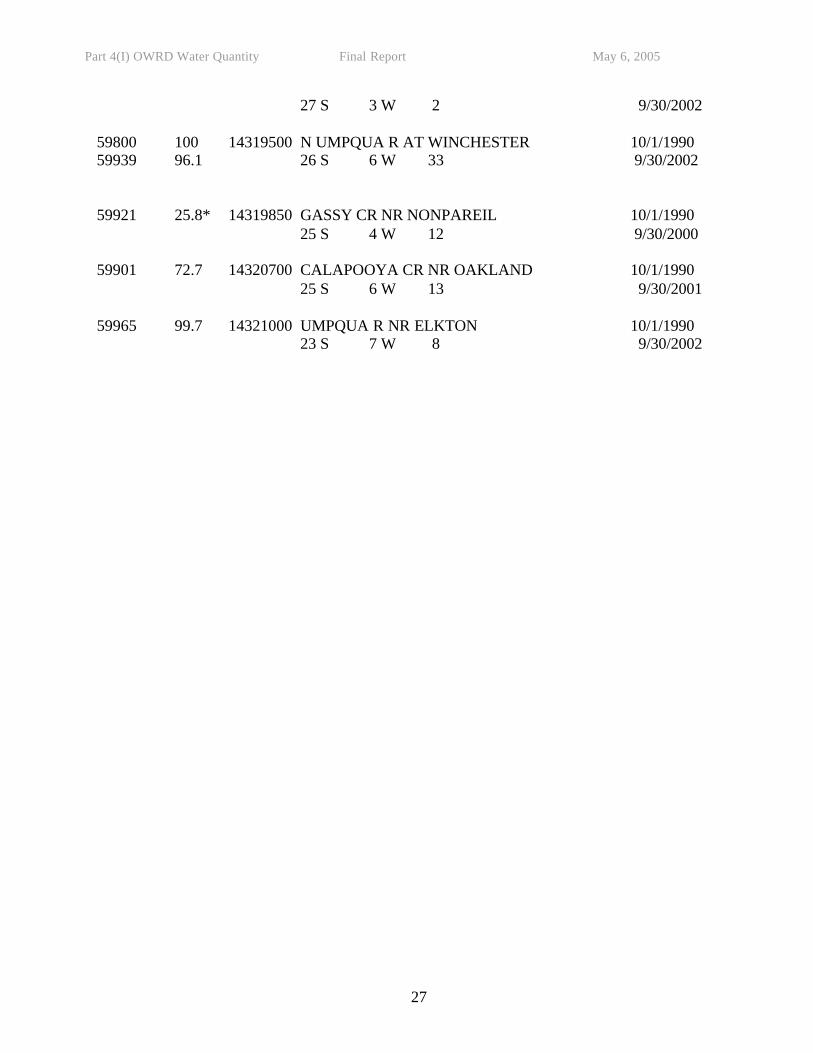
Table 3. Gaging stations for instream water use reports for water years 1991 to 2002. Water use data is provided for each instream water right associated with a particular gage. Instream water rights (ISWRs) are identified by water right certificate number, and instream water use is described as the percent of time that ISWRs monitored at continuous gages are met (% ISWR met). Asterisks denote gages located at the upper end of the reach for the instream water right.
North Coast
Certificate %ISWR Station Years of Record Number Met* 59661 59.6 14299000 S FK NECANICUM R NR SEASIDE 10/1/1990
5 N 9 W 29 5/31/1992 10/1/1992 9/30/1995
59646 91.3 14301000 NEHALEM R NR FOSS 10/1/1990 59684 93.4 3 N 9 W 35 9/30/2002
59625 86.7 14301250 JETTY CR NR BRIGHTON 10/1/1990
2 N 10 W 13 9/30/1995 59636 85.1 14301300 MIAMI R NR GARIBALDI 10/1/1990
1 N 10 W 14 9/30/1995 59686 87.8 14301500 WILSON R NR TILLAMOOK 10/1/1990 59673 92.5 1 S 8 W 17 9/30/2002 73001 83.0 59669 88.7 14302480 TRASK R AB CEDAR CR NR TILLAMOOK 4/1/1996 59670 95.1 1 S 8 W 30 9/30/2002 59685 92.4 72999 76.9 59654 83.3 14303600 NESTUCCA R NR BEAVER 10/1/1990
3 S 9 W 31 9/30/1995
Part 4(I) OWRD Water Quantity Final Report May 6, 2005
24
Mid Coast
Certificate %ISWR Station Years of Record Number Met* 59598 81.8 14303750 SALMON R NR OTIS 10/1/1990 59737 88.0 6 S 10 W 29 9/30/1995 59603 91.1 14305500 SILETZ R AT SILETZ 10/1/1990 67712 86.5 10 S 10 W 11 9/30/2002 67713 86.5 72927 84.4 59611 89.3 14306030 YAQUINA R NR CHITWOOD 10/1/1990 73144 80.5 10 S 9 W 31 9/30/2000 59574 97.9 14306500 ALSEA R NR TIDEWATER 10/1/1990 59726 87.8 14 S 9 W 6 9/30/2002 73138 85.3 59742 100 14306820 DRIFT CR NR WALDPORT 10/1/1990
13 S 11 W 1 9/30/1995 59550 73.5 14306900 BIG CR NR ROOSEVELT BEACH 10/1/1990
16 S 12 W 24 9/30/1995 59564 87.9 14307620 SIUSLAW R NR MAPLETON 10/1/1990 59805 95.5 17 S 10 W 27 9/30/1994
Part 4(I) OWRD Water Quantity Final Report May 6, 2005
25
South Coast
Certificate %ISWR Station Years of Record Number Met* 59831 95.8 14325000 S FK COQUILLE R AT POWERS 10/1/1990 59881 90.8 31 S 12 W 12 9/30/2002 59869 75.4 14327250 ELK R AB ANVIL CR, NR PORT ORFORD 10/1/1990 72786 76.1 33 S 14 W 7 9/30/2001 72796 78.8 14400000 CHETCO R NR BROOKINGS 10/1/1990
40 S 13 W 12 9/30/2002
Part 4(I) OWRD Water Quantity Final Report May 6, 2005
26
Umpqua
Certificate %ISWR Station Years of Record Number Met* 59956 77.4 14308000 S UMPQUA R AT TILLER 10/1/1990 59957 85.8 30 S 2 W 33 9/30/2002 59916 44.1 14308500 ELK CR NR DREW 10/1/1990
31 S 2 W 11 9/30/2000 59912 84.3 14309000 COW CR NR AZALEA 10/1/1990 73060 32 S 4 W 4 9/30/2002 59967 80.9 14309500 W FK COW CR NR GLENDALE 10/1/1990
32 S 8 W 11 9/30/2002 59910 90.3 14310000 COW CR NR RIDDLE 10/1/1990
30 S 6 W 32 9/30/2002 59945 14311200 OLALLA CR NR TENMILE 10/1/1990
29 S 7 W 21 9/30/1992 59932 72.2 14311500 LOOKINGGLASS CR AT BROCKWAY 10/1/1990
28 S 7 W 13 9/30/2000 59544 84.8 14312000 S UMPQUA R NR BROCKWAY 10/1/1990 59954 86.3 28 S 6 W 15 9/30/2002 59955 89.5 73061 5.8* 14313500 N UMPQUA R BL LEMOLO LAKE 10/1/1990
26 S 5 E 11 9/30/2002 59896 76.6 14316495 BOULDER CR NR TOKETEE FALLS 10/1/1997
26 S 2 E 13 9/30/2002 59941 100 14316500 N UMPQUA R AB COPELAND CR 10/1/1990
26 S 2 E 24 9/30/2002 59961 83.9 14316700 STEAMBOAT CR NR GLIDE 10/1/1990 73062 72.5 25.5 S 1 E 32 9/30/2002 59940 100 14316800 N UMPQUA R BL STEAMBOAT CR NR GLIDE10/1/1990
26 S 1 W 10 9/30/1992 59930 65.1 14318000 LITTLE R AT PEEL 10/1/1999
Part 4(I) OWRD Water Quantity Final Report May 6, 2005
27
27 S 3 W 2 9/30/2002 59800 100 14319500 N UMPQUA R AT WINCHESTER 10/1/1990 59939 96.1 26 S 6 W 33 9/30/2002 59921 25.8* 14319850 GASSY CR NR NONPAREIL 10/1/1990
25 S 4 W 12 9/30/2000 59901 72.7 14320700 CALAPOOYA CR NR OAKLAND 10/1/1990
25 S 6 W 13 9/30/2001 59965 99.7 14321000 UMPQUA R NR ELKTON 10/1/1990
23 S 7 W 8 9/30/2002
Part 4(I) OWRD Water Quantity Final Report May 6, 2005
28
Table 4. Cubic feet per second (CFS) of water placed instream through streamflow restoration projects in the Mid-South Coast and Umpqua monitoring areas of the Oregon Coastal coho ESU.
CFS Instream by Project Type Management Area
Population Unit Instream
Transfer Conserved
Water Lease
Total CFS Instream
Mid-South Coast China Creek -- -- 0.66 0.66
Coos -- -- 0.10 0.10 Coquille -- -- 1.81 1.81 Floras -- -- 6.75 6.75
Total Mid-South Coast 9.32
Umpqua Lower -- -- 8.11 8.11 Upper 0.07 0.12 7.71 7.90
Total Umpqua 16.01 Total ESU 25.33
Part 4(I) OWRD Water Quantity Final Report May 6, 2005
29
Table 5. Municipal consumptive use coefficients.
Coastal Basins
Willamette and Sandy
Rogue and Umpqua
East Side (Summer
Discharge)
East Side (No Summer Discharge)
Summer 0.15 0.45 0.64 0.60 1.00
Winter 0.10 0.15 0.15 0.30 0.30
Table 6. Comparison of water rights of record, active water rights, and actual use.
Municipality Water Rights of Record
(cfs) Water Rights in Use
(cfs) Current Actual Diversion (cfs)
Medford 203 203 30 - 40 Ashland 16.46 16.46 3.50 - 7.55 Canyon Creek 2.08 1.07 0.4 - 0.7 Eugene 300 273 35 - 75 Toledo 19.14 14.14 0.0 - 0.9
Part 4(I) OWRD Water Quantity Final Report May 6, 2005
30
Table 7. Percent of total area of each population unit and monitoring area of the Oregon Coastal coho ESU within varying levels of estimated August consumptive use (CU) as a percent of the 80% exceedance flow (NSF).
August CU/NSF Monitoring Area Population Unit < 10% 10-40% 41-70% 71-100% >100% North Coast Ecola 70 6 25 0 0 Necanicum 46 41 0 0 12 Nehalem 84 16 0 0 0 Neskowin 7 0 93 0 0 Nestucca 84 16 0 0 0 Netarts 38 46 5 1 9 Rockaway 100 0 0 0 0 Tillamook 90 1 0 0 8 North Coast Total 82 13 2 0 3 Mid-Coast Alsea 83 17 0 0 0 Beaver 100 0 0 0 0 Depoe Bay 50 9 14 0 27 Devils Lake 52 5 43 0 0 Salmon 98 2 0 0 0 Seal Rock 91 9 0 0 0 Siletz 68 32 0 0 0 Siuslaw 80 17 0 3 0 Thiel Creek 100 0 0 0 0 Yachats 84 14 1 0 0 Yaquina 86 8 0 4 2 Mid-Coast Total 80 17 1 1 1 Mid-South Coast Cape Arago 42 19 0 0 39 China Creek 0 0 0 60 40 Coos 78 11 8 1 3 Coquille 48 29 9 5 9 Floras 52 27 4 5 13 Siltcoos 89 11 0 0 0 Sixes 87 13 0 0 0 Tahkenitch 56 44 0 0 0 Tenmile 93 0 0 0 7 Threemile Creek 100 0 0 0 0 Mid-South Coast Total 61 21 7 4 7 Umpqua Lower Umpqua 80 20 0 0 0 Upper Umpqua 61 20 6 3 10 Umpqua Total 64 20 5 2 9 ESU Total 70 18 4 2 6
Part 4(I) OWRD Water Quantity Final Report May 6, 2005
31
Table 8. Percent of total coho stream miles of each population unit and monitoring area of the Oregon Coastal coho ESU within varying levels of estimated August consumptive use (CU) as a percent of the 80% exceedance flow (NSF).
August CU/NSF Monitoring Area Population Unit < 10% 10-40% 41-70% 71-100% >100% North Coast Ecola 61 13 25 0 0 Necanicum 45 49 0 0 6 Nehalem 83 17 0 0 0 Neskowin 0 0 100 0 0 Nestucca 85 15 0 0 0 Netarts 26 74 0 0 0 Rockaway 100 0 0 0 0 Tillamook 89 1 1 0 8 North Coast Total 81 14 2 0 3 Mid-Coast Alsea 88 12 0 0 0 Beaver 100 0 0 0 0 Depoe Bay 58 11 13 0 18 Devils Lake 65 0 35 0 0 Salmon 99 1 0 0 0 Seal Rock 100 0 0 0 0 Siletz 54 46 0 0 0 Siuslaw 83 15 0 2 0 Thiel Creek 100 0 0 0 0 Yachats 87 13 0 0 0 Yaquina 86 7 0 5 1 Mid-Coast Total 81 17 0 1 1 Mid-South Coast Cape Arago 0 0 0 0 100 China Creek 0 0 0 100 0 Coos 74 12 12 1 1 Coquille 48 33 11 2 5 Floras 25 37 8 9 21 Siltcoos 90 10 0 0 0 Sixes 84 16 0 0 0 Tahkenitch 58 42 0 0 0 Tenmile 89 0 0 0 11 Threemile Creek 0 0 0 0 0 Mid-South Coast Total 61 22 9 3 5 Umpqua Lower Umpqua 90 10 0 0 0 Upper Umpqua 41 28 8 5 17 Umpqua Total 54 23 6 4 12 ESU Total 69 19 4 2 6
Part 4(I) OWRD Water Quantity Final Report May 6, 2005
32
Table 9. Summary of observations.
Scale Observation/Action ESU ESU scale data
Observation • Approximately 800 instream water rights exist in coastal Oregon basins. • August consumptive use as a percent of exceedance natural flow was
generally highest in the Mid-South Coast and Umpqua monitoring units. • 70% of the total ESU area had an estimated August consumptive use of
water that was less than 10% of the 80% natural exceedance flow. • Over 90% of the total area of the ESU had no change in estimated August
consumptive use between 1997 and 2004. Action • Within the ESU, over 3,700 miles of stream are protected by an instream
water right. • Voluntary streamflow restoration (through instream leases, instream
transfers, and allocations of conserved water) has been focused in the Mid-South Coast and Umpqua monitoring units.
• At an 80% exceedance flow, water is not available for new water appropriations in August in 94% of the total ESU area.
North Coast MU And populations in this MU MU scale data
Observation • Over 80% of the North Coast monitoring unit had an estimated August
consumptive use that was less than 10% of the 80% natural exceedance flow.
• The Necanicum, Tillamook, and Netarts population units had the greatest portion of their total watershed (up to 12% of the total area) with August consumptive use more than 100% of the 80% exceedance natural flow.
• 97% of the total North Coast monitoring unit had no change in estimated August consumptive use between 1997 and 2004.
Action • Within the North Coast monitoring unit, over 850 miles of stream are
protected by an instream water right. • At an 80% exceedance flow, water is not available for new appropriations
in August in 97% of the total area of the North Coast monitoring unit.
Part 4(I) OWRD Water Quantity Final Report May 6, 2005
33
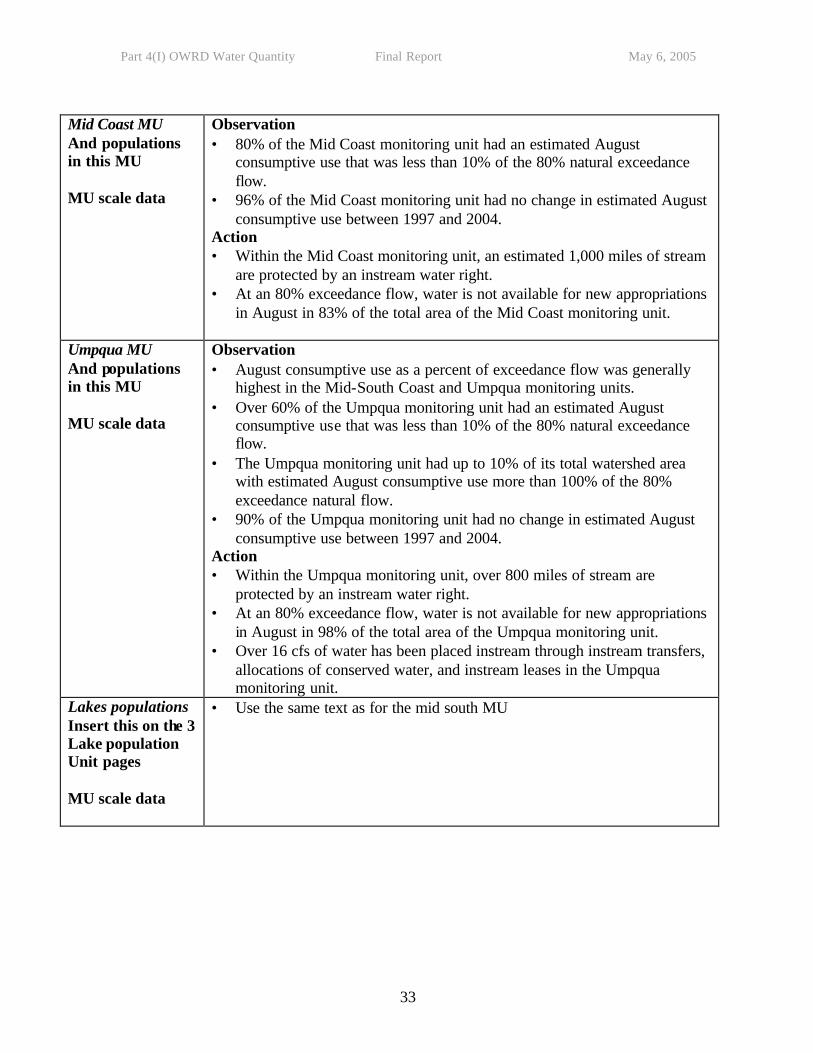
Mid Coast MU And populations in this MU MU scale data
Observation • 80% of the Mid Coast monitoring unit had an estimated August
consumptive use that was less than 10% of the 80% natural exceedance flow.
• 96% of the Mid Coast monitoring unit had no change in estimated August consumptive use between 1997 and 2004.
Action • Within the Mid Coast monitoring unit, an estimated 1,000 miles of stream
are protected by an instream water right. • At an 80% exceedance flow, water is not available for new appropriations
in August in 83% of the total area of the Mid Coast monitoring unit.
Umpqua MU And populations in this MU MU scale data
Observation • August consumptive use as a percent of exceedance flow was generally
highest in the Mid-South Coast and Umpqua monitoring units. • Over 60% of the Umpqua monitoring unit had an estimated August
consumptive use that was less than 10% of the 80% natural exceedance flow.
• The Umpqua monitoring unit had up to 10% of its total watershed area with estimated August consumptive use more than 100% of the 80% exceedance natural flow.
• 90% of the Umpqua monitoring unit had no change in estimated August consumptive use between 1997 and 2004.
Action • Within the Umpqua monitoring unit, over 800 miles of stream are
protected by an instream water right. • At an 80% exceedance flow, water is not available for new appropriations
in August in 98% of the total area of the Umpqua monitoring unit. • Over 16 cfs of water has been placed instream through instream transfers,
allocations of conserved water, and instream leases in the Umpqua monitoring unit.
Lakes populations Insert this on the 3 Lake population Unit pages MU scale data
• Use the same text as for the mid south MU
Part 4(I) OWRD Water Quantity Final Report May 6, 2005
34
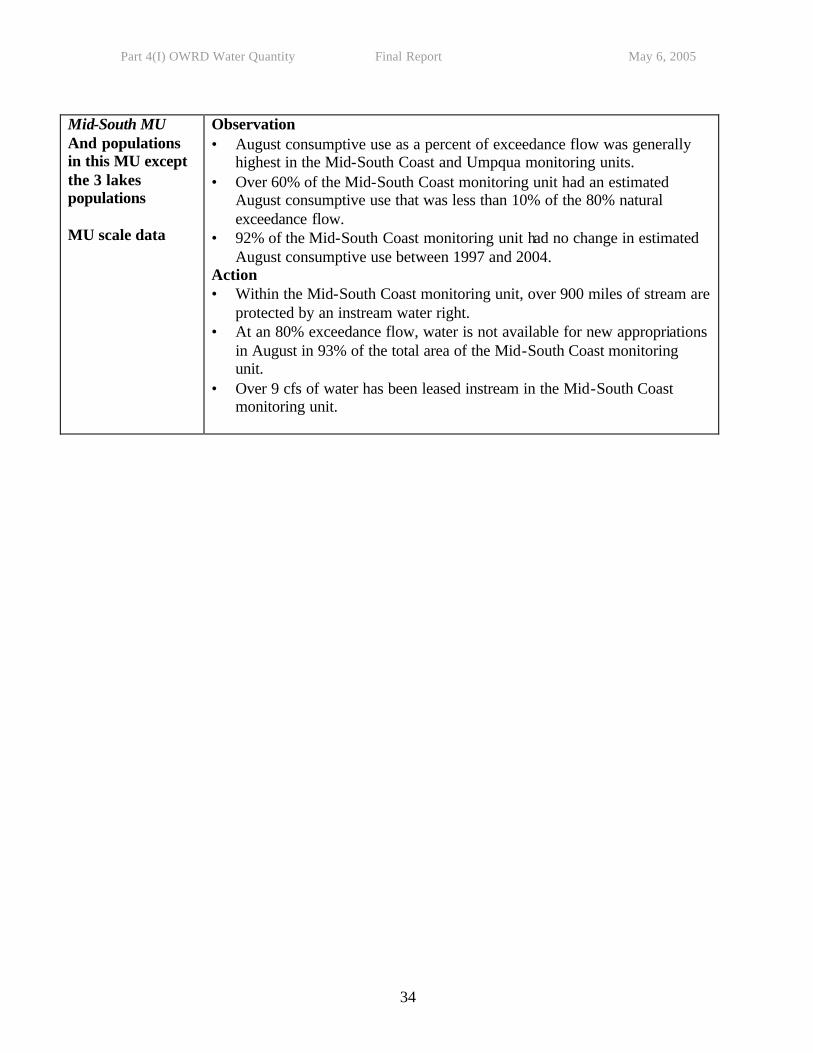
Mid-South MU And populations in this MU except the 3 lakes populations MU scale data
Observation • August consumptive use as a percent of exceedance flow was generally
highest in the Mid-South Coast and Umpqua monitoring units. • Over 60% of the Mid-South Coast monitoring unit had an estimated
August consumptive use that was less than 10% of the 80% natural exceedance flow.
• 92% of the Mid-South Coast monitoring unit had no change in estimated August consumptive use between 1997 and 2004.
Action • Within the Mid-South Coast monitoring unit, over 900 miles of stream are
protected by an instream water right. • At an 80% exceedance flow, water is not available for new appropriations
in August in 93% of the total area of the Mid-South Coast monitoring unit.
• Over 9 cfs of water has been leased instream in the Mid-South Coast monitoring unit.
Part 4(I) OWRD Water Quantity Final Report May 6, 2005
35
Figure 1. Instream water rights and high priority flow restoration watersheds in the North Coast monitoring area of the Oregon Coastal coho ESU.
Part 4(I) OWRD Water Quantity Final Report May 6, 2005
36
Figure 2. Instream water rights and high priority flow restoration watersheds in the Mid Coast monitoring area of the Oregon Coastal coho ESU.
Part 4(I) OWRD Water Quantity Final Report May 6, 2005
37
Figure 3. Instream water rights and high priority flow restoration watersheds in the Mid-South Coast monitoring area of the Oregon Coastal coho ESU.
Part 4(I) OWRD Water Quantity Final Report May 6, 2005
38
Figure 4. Instream water rights and high priority flow restoration watersheds in the Umpqua monitoring area of the Oregon Coastal coho ESU.
Part 4(I) OWRD Water Quantity Final Report May 6, 2005
39
Figure 5. August consumptive use (CU) as a percent of 80% exceedance natural streamflow (NSF) in the North Coast monitoring area of the Oregon Coastal coho ESU.
Part 4(I) OWRD Water Quantity Final Report May 6, 2005
40
Figure 6. August consumptive use (CU) as a percent of 80% exceedance natural streamflow (NSF) in the Mid Coast monitoring area of the Oregon Coastal coho ESU.
Part 4(I) OWRD Water Quantity Final Report May 6, 2005
41
Figure 7. August consumptive use (CU) as a percent of 80% exceedance natural streamflow (NSF) in the Mid-South Coast monitoring area of the Oregon Coastal coho ESU.
Part 4(I) OWRD Water Quantity Final Report May 6, 2005
42
Figure 8. August consumptive use (CU) as a percent of 80% exceedance natural streamflow (NSF) in the Umpqua monitoring area of the Oregon Coastal coho ESU.
Part 4(I) OWRD Water Quantity Final Report May 6, 2005
43
Figure 9. Percent change in the estimated August consumptive use (CU) between 1997 and 2004 in the North Coast monitoring area of the Oregon Coastal coho ESU.
Part 4(I) OWRD Water Quantity Final Report May 6, 2005
44
Figure 10. Percent change in the estimated August consumptive use (CU) between 1997 and 2004 in the Mid Coast monitoring area of the Oregon Coastal coho ESU.
Part 4(I) OWRD Water Quantity Final Report May 6, 2005
45
Figure 11. Percent change in the estimated August consumptive use (CU) between 1997 and 2004 in the Mid-South Coast monitoring area of the Oregon Coastal coho ESU.
Part 4(I) OWRD Water Quantity Final Report May 6, 2005
46
Figure 12. Percent change in the estimated August consumptive use (CU) between 1997 and 2004 in the Umpqua monitoring area of the Oregon Coastal coho ESU.
Part 4(I) OWRD Water Quantity Final Report May 6, 2005
47
Figure 13. August water availability at an 80% exceedance natural streamflow for the North Coast monitoring area of the Oregon Coastal coho ESU.
Part 4(I) OWRD Water Quantity Final Report May 6, 2005
48
Figure 14. August water availability at an 80% exceedance natural streamflow for the Mid Coast monitoring area of the Oregon Coastal coho ESU.
Part 4(I) OWRD Water Quantity Final Report May 6, 2005
49
Figure 15. August water availability at an 80% exceedance natural streamflow for the Mid-South Coast monitoring area of the Oregon Coastal coho ESU.
Part 4(I) OWRD Water Quantity Final Report May 6, 2005
50
Figure 16. August water availability at an 80% exceedance natural streamflow for the Umpqua monitoring area of the Oregon Coastal coho ESU.
Part 4(I) OWRD Water Quantity Final Report May 6, 2005
51
REFERENCES Broad, T., and Collins, C. 1996. Estimated water use and general hydrologic conditions for
Oregon 1985 and 1990. US Geological Survey Water Resources Investigations Report 96-4090, 166 p.
Cooper, R.E. 2002. Determining Surface Water Availability in Oregon. Water Resources
Department Open File Report SW02-002. http://www1.wrd.state.or.us/pdfs/reports/SW02-002.pdf