Embed Size (px)
Citation preview

Research Institute of Organic Agriculture [email protected], www.fibl.org
Organic Agriculture Worldwide 2016: Current Statistics
February 14, 2018Nuremberg, GermanyBIOFACH 2018Julia Lernoud and Helga Willer

www.fibl.org
The World of Organic Agriculture 2018www.organic-world.net
• The 19th edition of ‚The World of Organic Agriculture‘, was published by FiBL and IFOAM –Organics International in February 2018.
• Data tables and graphs• Country and continent reports• Articles about the global
market, standards, policy support
• Get your copy at the FiBL Stand in Hall 1/555 or the stand of IFOAM - Organics International (1/451)
• www.organic-world.net
www.fibl.org
Acknowledgements
• The Swiss State Secretariat of Economic Affairs SECO, Berne
• International Trade Centre ITC
• Nürnberg Messe, the organizers of the BioFach World Organic Trade Fair
• IFOAM – Organics International
• 200 experts from all parts of the world contributed to the FiBL survey 2018.
www.fibl.org
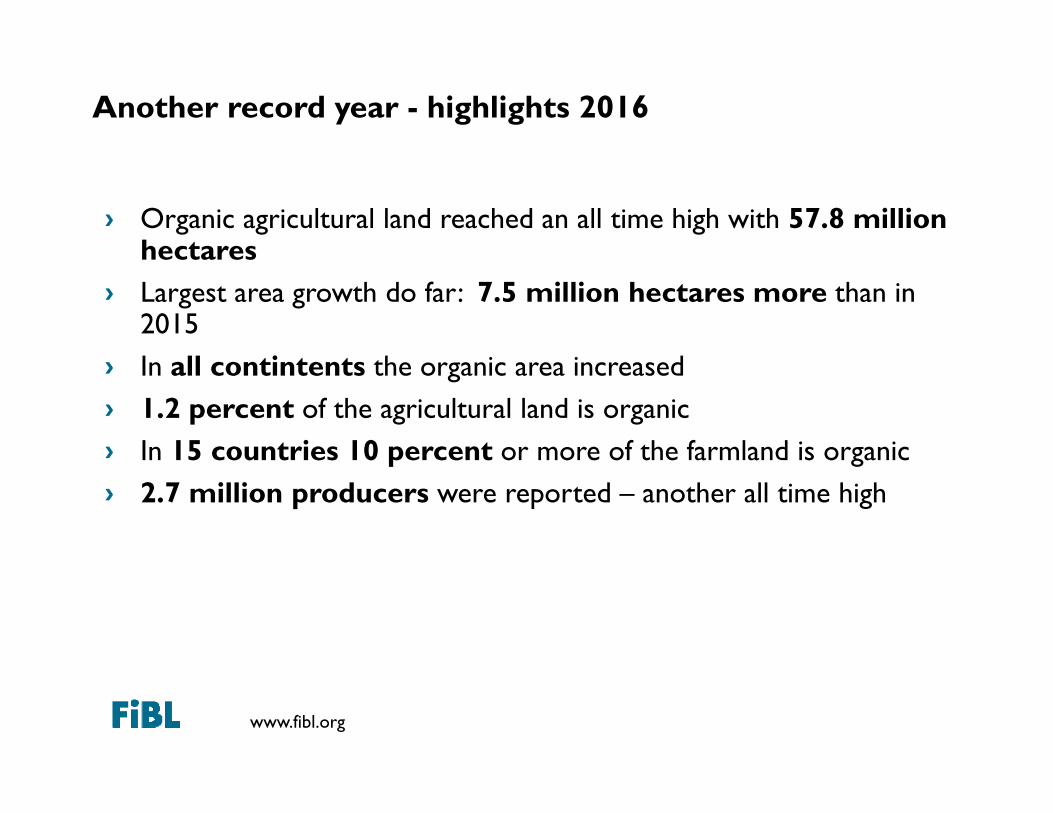
Another record year - highlights 2016
› Organic agricultural land reached an all time high with 57.8 millionhectares
› Largest area growth do far: 7.5 million hectares more than in 2015
› In all contintents the organic area increased› 1.2 percent of the agricultural land is organic› In 15 countries 10 percent or more of the farmland is organic› 2.7 million producers were reported – another all time high

www.fibl.org
Development of the number of countries with data on organic agriculture
7786
97
100
110121
122135
140155
161
161
162
164
170
172
179 178
020406080
100120140160180200
1999
2000
2001
2002
2003
2004
2005
2006
2007
2008
2009
2010
2011
2012
2013
2014
2015
2016C
ount
ries
Development of the number of countries with data on organic agricultureSource: FiBL-IFOAM-SOEL-Surveys 1999-2018
www.fibl.org
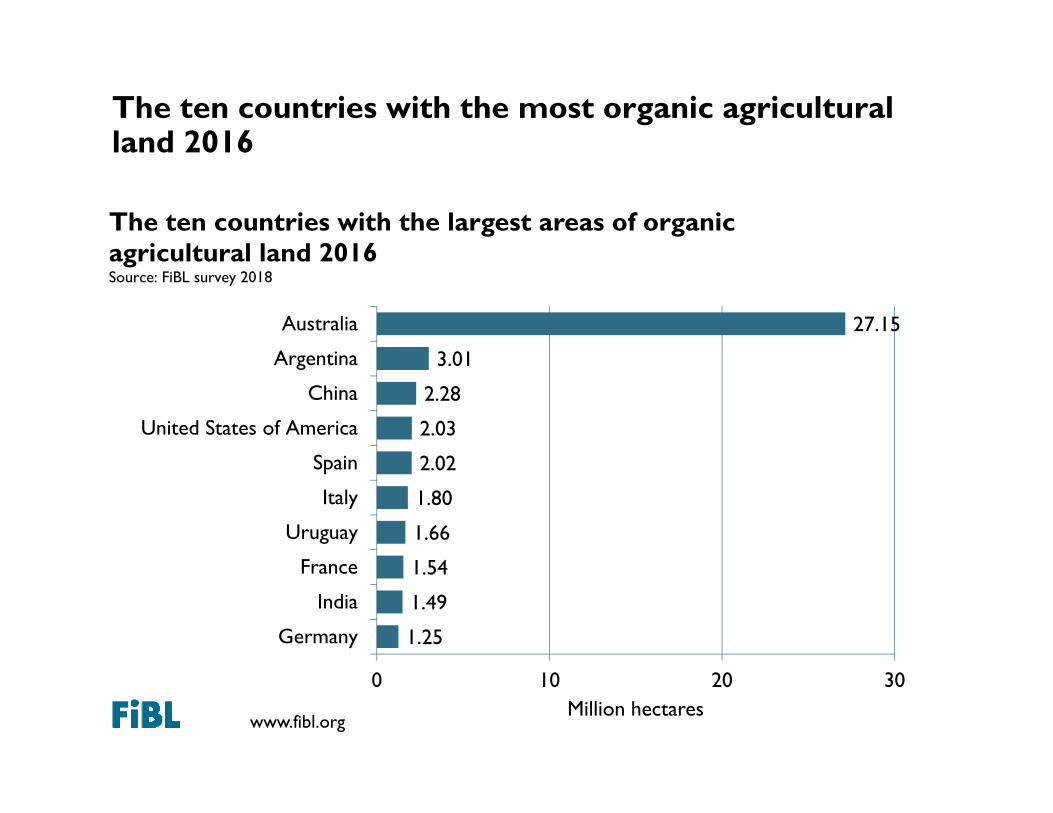
The ten countries with the most organic agricultural land 2016
1.25
1.49
1.54
1.66
1.80
2.02
2.03
2.28
3.01
27.15
0 10 20 30
Germany
India
France
Uruguay
Italy
Spain
United States of America
China
Argentina
Australia
Million hectares
The ten countries with the largest areas of organic agricultural land 2016Source: FiBL survey 2018
www.fibl.org
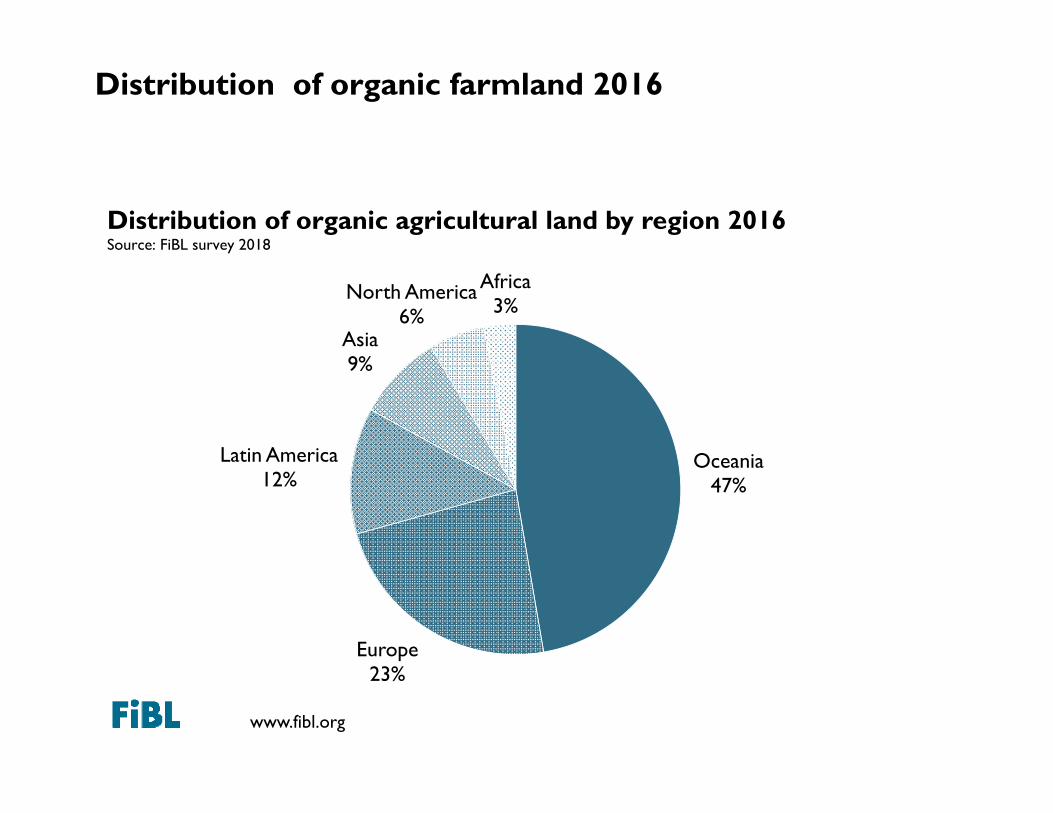
Distribution of organic farmland 2016
Oceania47%
Europe23%
Latin America12%
Asia9%
North America6%
Africa3%
Distribution of organic agricultural land by region 2016Source: FiBL survey 2018
www.fibl.org
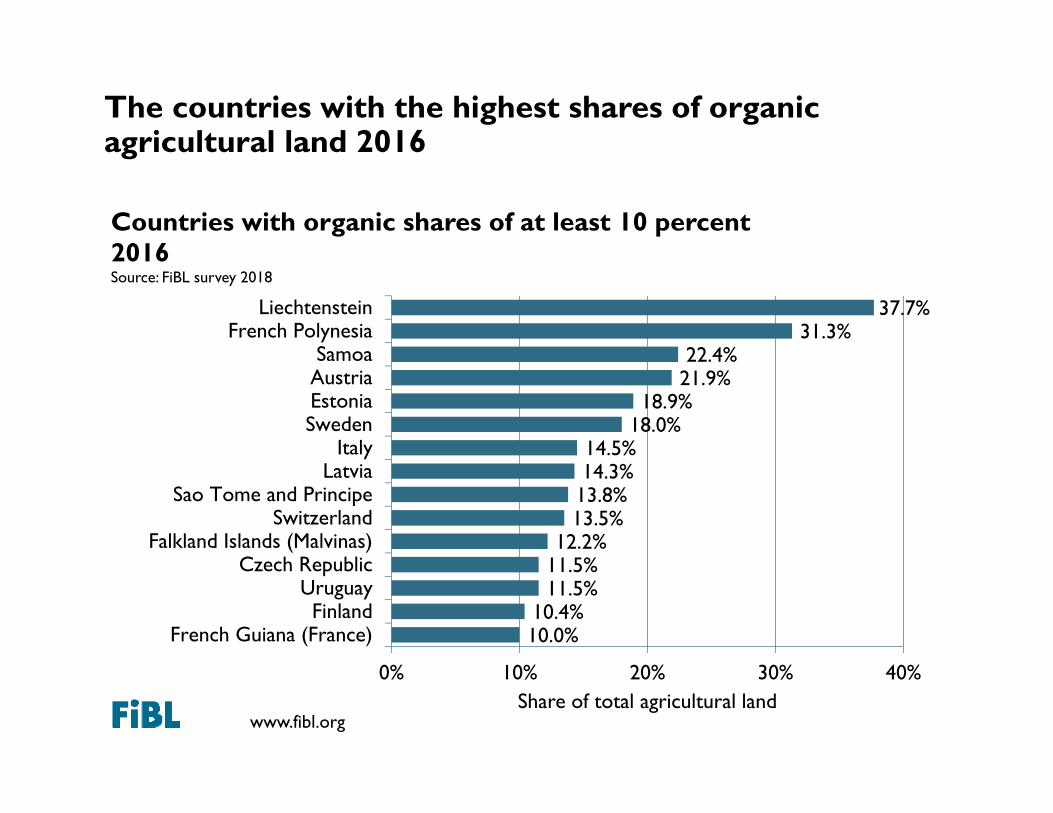
The countries with the highest shares of organic agricultural land 2016
10.0%10.4%
11.5%11.5%12.2%
13.5%13.8%14.3%14.5%
18.0%18.9%
21.9%22.4%
31.3%37.7%
0% 10% 20% 30% 40%
French Guiana (France)Finland
UruguayCzech Republic
Falkland Islands (Malvinas)Switzerland
Sao Tome and PrincipeLatvia
ItalySwedenEstoniaAustriaSamoa
French PolynesiaLiechtenstein
Share of total agricultural land
Countries with organic shares of at least 10 percent 2016Source: FiBL survey 2018

www.fibl.org
World: Growth of the organic farmland and organic share 1999-2016
9
11.0 15
.0 17.3 19
.9 25.8 30
.0
29.2
30.2
31.5 34
.5
36.3
35.7
37.5
37.6 43
.2
44.4 50
.3
57.8
0.3%
0.3% 0.
4%
0.4% 0.
5% 0.6%
0.6%
0.6% 0.
7%
0.7% 0.
8%
0.8%
0.8%
0.8% 0.
9%
0.9%
1.1% 1.
2%
0.0%
0.2%
0.4%
0.6%
0.8%
1.0%
1.2%
1.4%
0
10
20
30
40
50
60
70
1999
2000
2001
2002
2003
2004
2005
2006
2007
2008
2009
2010
2011
2012
2013
2014
2015
2016
Org
anic
sha
re in
per
cent
Mill
ion
hect
ares
Growth of the organic agricultural land and organic share 1999-2016Source: FiBL-IFOAM-SOEL surveys 1999-2018
Plus 15 % 2015/2016
www.fibl.org
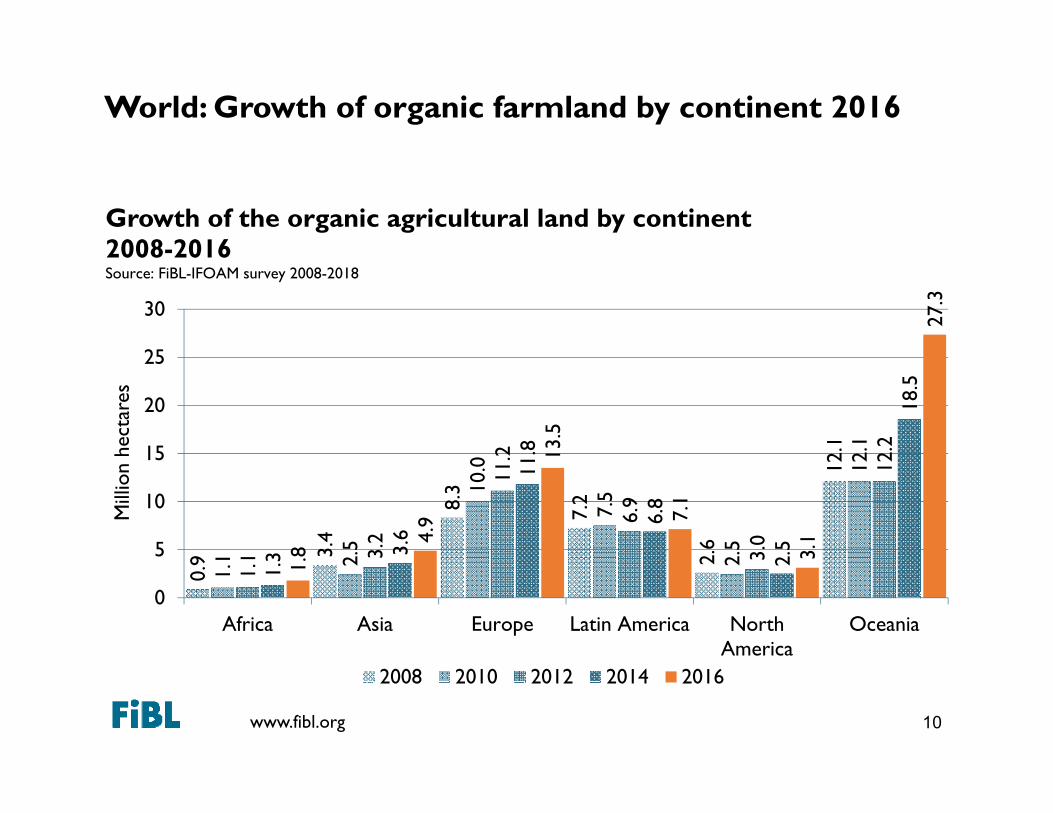
World: Growth of organic farmland by continent 2016
10
0.9 3.
4
8.3
7.2
2.6
12.1
1.1 2.
5
10.0
7.5
2.5
12.1
1.1 3.
2
11.2
6.9
3.0
12.2
1.3 3.
6
11.8
6.8
2.5
18.5
1.8
4.9
13.5
7.1
3.1
27.3
0
5
10
15
20
25
30
Africa Asia Europe Latin America NorthAmerica
Oceania
Mill
ion
hect
ares
Growth of the organic agricultural land by continent 2008-2016Source: FiBL-IFOAM survey 2008-2018
2008 2010 2012 2014 2016
www.fibl.org
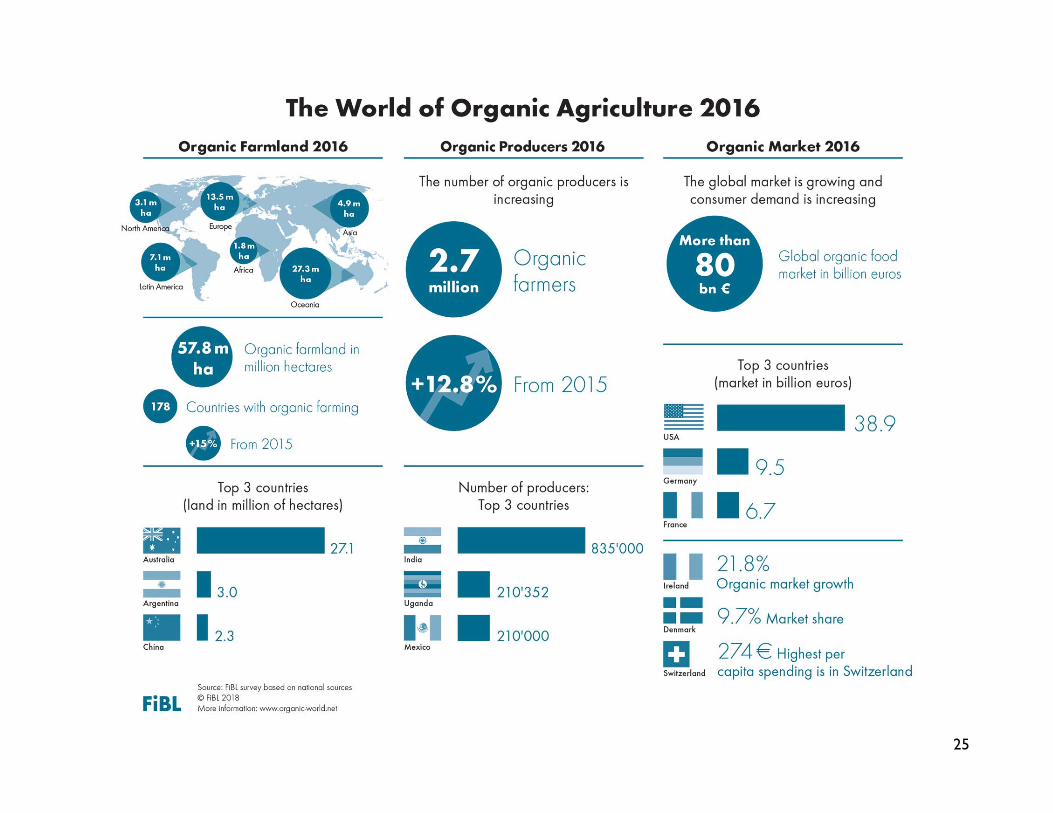
ORGANIC FARMLAND 2016
Oceania
Europe
Latin America
Asia
North America
Africa
0 5 10 15 20
1
2
3
4
5
Million hectares0% 20% 40% 0
10
20
30
40
50
60
70
2000 2004 2008 2012 2016
Mill
ion
hect
ares
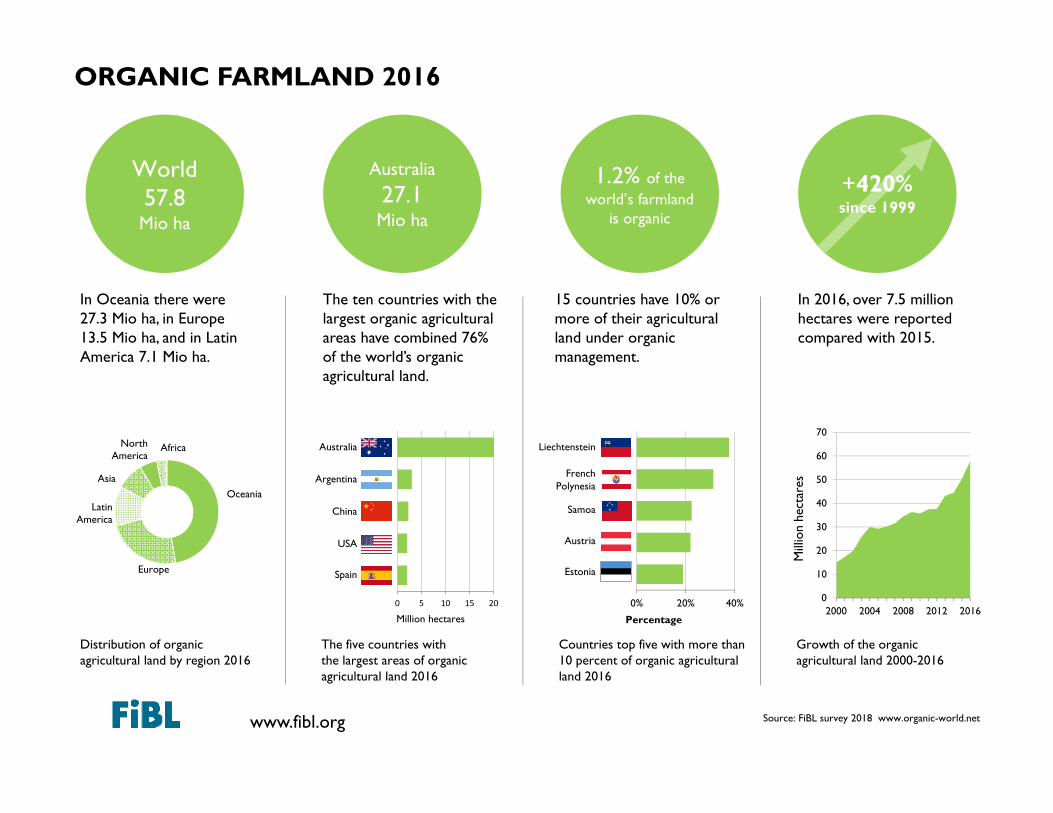
1.2% of the world’s farmland
is organic
World 57.8 Mio ha
Australia 27.1Mio ha
In Oceania there were 27.3 Mio ha, in Europe 13.5 Mio ha, and in Latin America 7.1 Mio ha.
The ten countries with the largest organic agricultural areas have combined 76% of the world’s organic agricultural land.
Source: FiBL survey 2018 www.organic-world.net
Distribution of organic agricultural land by region 2016
The five countries with the largest areas of organic agricultural land 2016
Countries top five with more than10 percent of organic agricultural land 2016
Growth of the organic agricultural land 2000-2016
Argentina
China
USA
Spain
Australia Liechtenstein
Estonia
Austria
Samoa
French Polynesia
+420% since 1999
Percentage
15 countries have 10% or more of their agricultural land under organic management.
In 2016, over 7.5 million hectares were reported compared with 2015.

www.fibl.org
ORGANIC LAND USE 2016
10.6 Mio ha
arable land
0.0 1.5 3.0 4.5
Textile crops
Dry pulses
Oilseeds
Green fodder
Cereals
Million hectares
Europe
Asia
North America
AfricaLatin
America
0.0 0.3 0.5 0.8 1.0
Trop. fruit
Grapes
Nuts
Olives
Coffee
Million hectares
Europe
Latin America
Africa
Asia
North America Oceania
39.3Mio ha of wild
collection
The organic wild collection areas are concentrated in Europe, Africa, Asia, and Latin America.
Europe
Africa
Asia
Latin America
0 5 10 15
1
2
3
4
5
Million hectares
38 Mio ha of grassland, and an almost 17% increase compared with 2015.
4.5 Mio ha, which is 2.8% of the world’s permanent cropland, and a 8% share of the organic agricultural land.
Arable land constitutes 18% of the world’s organic agricultural land, and 0.7% of the world’s arable crop land. It increased by 6.2% over 2015.
Oceania
Europe
Latin America
North America
0 5 10 15 20 25 30
1
2
3
4
5
Million hectares
Organic permanent grassland by region 2016
Organic arable land by region 2016 Organic permanent crops by region 2016 Organic wild collection by region 2016Organic wild collection: The five countries with the largest areas 2016
Organic permanent crops: Key crops 2016Organic arable land: Key crops 2016Organic permanet grassland: The fivecountries with the largest areas 2016
Source: FiBL survey 2018 www.organic‐world.net
Australia
Argentina
Uruguay
Spain
USA
Finland
Zambia
India
Namibia
Romania
63% grassland
+9% more
permanent crops
66% grassland
www.fibl.org
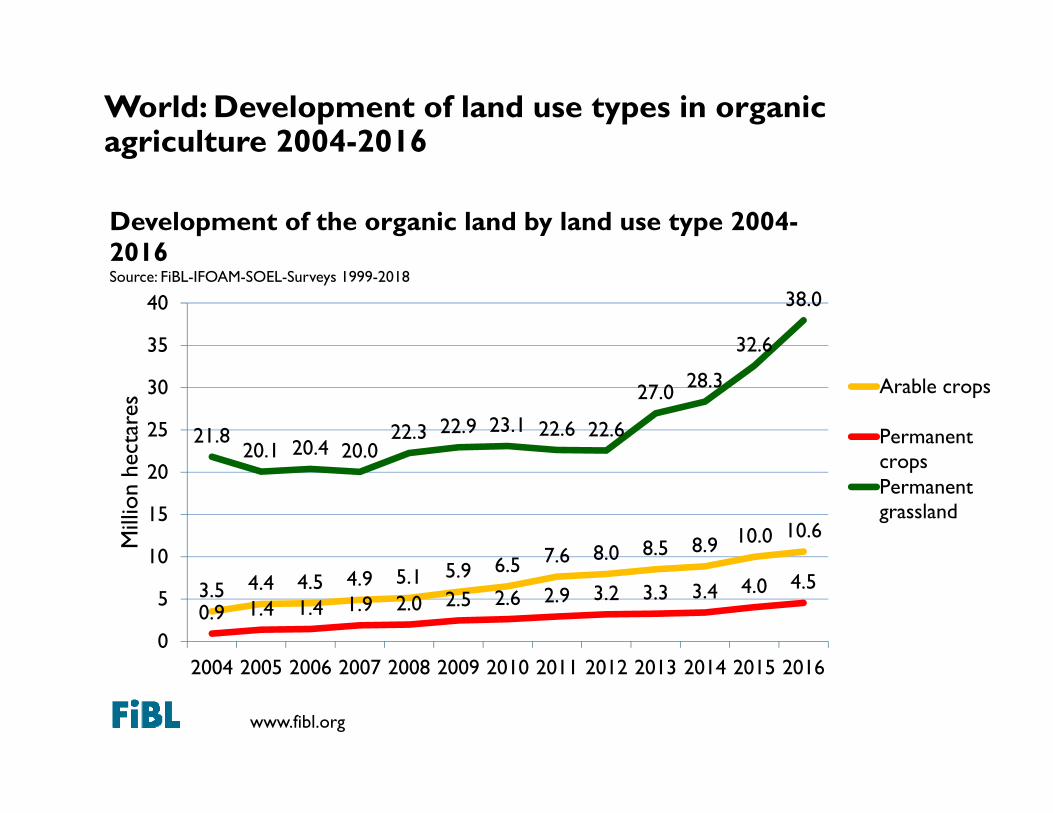
World: Development of land use types in organic agriculture 2004-2016
3.5 4.4 4.5 4.9 5.1 5.9 6.5 7.6 8.0 8.5 8.9 10.0 10.6
0.9 1.4 1.4 1.9 2.0 2.5 2.6 2.9 3.2 3.3 3.4 4.0 4.5
21.820.1 20.4 20.0
22.3 22.9 23.1 22.6 22.6
27.0 28.3
32.6
38.0
0
5
10
15
20
25
30
35
40
2004 2005 2006 2007 2008 2009 2010 2011 2012 2013 2014 2015 2016
Mill
ion
hect
ares
Development of the organic land by land use type 2004-2016Source: FiBL-IFOAM-SOEL-Surveys 1999-2018
Arable crops
PermanentcropsPermanentgrassland

www.fibl.org
World: Use of organic agricultural land 2016 (total: 57.8 million hectares)
Arable land crops18%
Permanent crops8%
Permanent grassland
66%
Other agr. Land2%
Distribution of main land use types and crop categories 2016Source: FiBL survey 2018; based on information from the private sector, certifiers, and governments.
Land use types 2015
0.500.53
1.292.76
4.09
0.0 1.5 3.0 4.5
Textile cropsDry pulses
OilseedsGreen fodders
Cereals
Million hectares
Key arable crops
0.360.38
0.570.75
0.93
0.0 0.5 1.0
Fruit, tropical/subtropGrapes
NutsOlivesCoffee
Million hectares
Key permanent crops
www.fibl.org
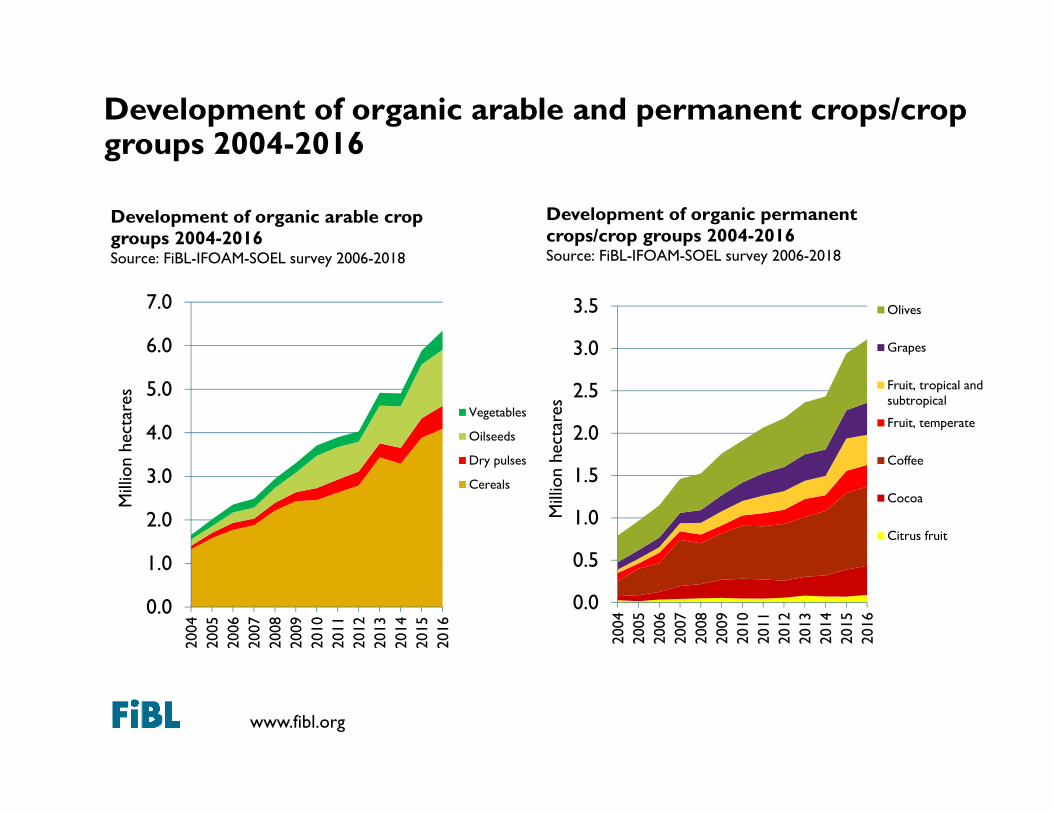
Development of organic arable and permanent crops/crop groups 2004-2016
0.0
1.0
2.0
3.0
4.0
5.0
6.0
7.0
2004
2005
2006
2007
2008
2009
2010
2011
2012
2013
2014
2015
2016
Mill
ion
hect
ares
Development of organic arable crop groups 2004-2016Source: FiBL-IFOAM-SOEL survey 2006-2018
Vegetables
Oilseeds
Dry pulses
Cereals
0.0
0.5
1.0
1.5
2.0
2.5
3.0
3.5
2004
2005
2006
2007
2008
2009
2010
2011
2012
2013
2014
2015
2016
Mill
ion
hect
ares
Development of organic permanent crops/crop groups 2004-2016Source: FiBL-IFOAM-SOEL survey 2006-2018
Olives
Grapes
Fruit, tropical andsubtropical
Fruit, temperate
Coffee
Cocoa
Citrus fruit
www.fibl.org
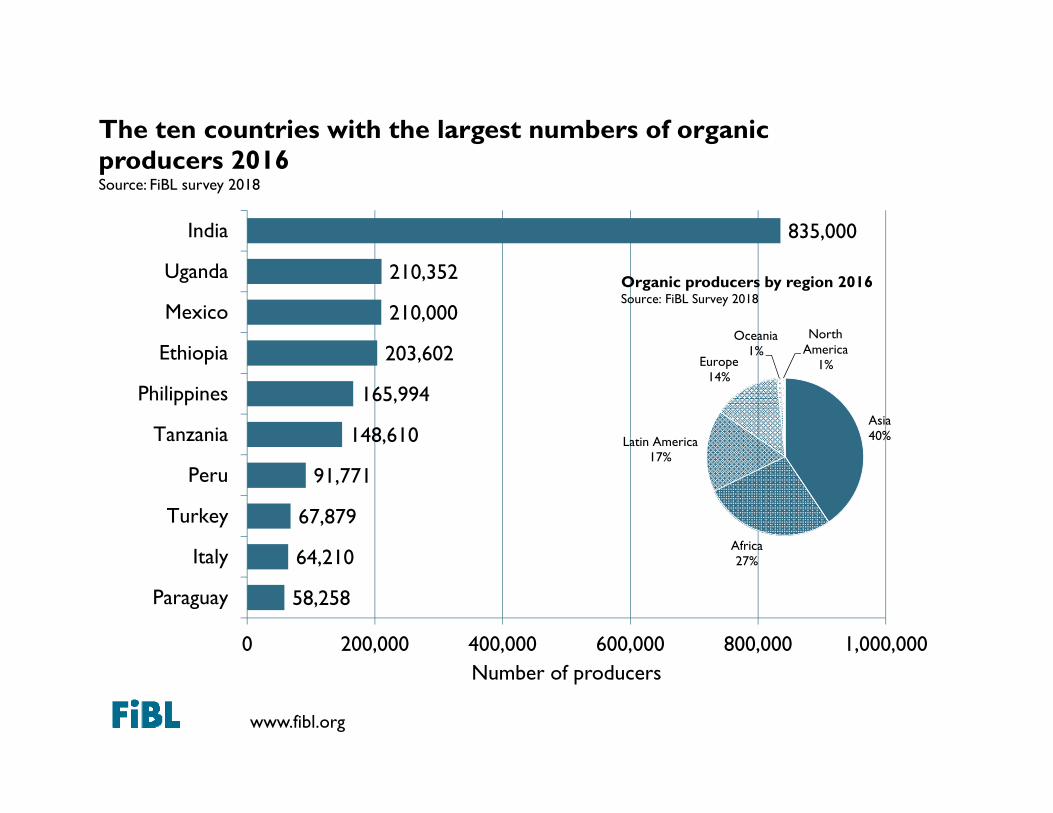
The ten countries with the largest numbers of organic producers 2012
58,258
64,210
67,879
91,771
148,610
165,994
203,602
210,000
210,352
835,000
0 200,000 400,000 600,000 800,000 1,000,000
Paraguay
Italy
Turkey
Peru
Tanzania
Philippines
Ethiopia
Mexico
Uganda
India
Number of producers
The ten countries with the largest numbers of organic producers 2016Source: FiBL survey 2018
Asia40%
Africa27%
Latin America17%
Europe14%
Oceania1%
North America
1%
Organic producers by region 2016Source: FiBL Survey 2018

www.fibl.org
World: Development of organic producers 1999-2016
17
0.2 0.30.4 0.4 0.4 0.5
0.70.9
1.21.4
1.81.6
1.81.9 2.0
2.32.4
2.7
0.0
0.5
1.0
1.5
2.0
2.5
3.0
1999
2000
2001
2002
2003
2004
2005
2006
2007
2008
2009
2010
2011
2012
2013
2014
2015
2016
Prod
ucer
s
Development of the number of organic producers 1999-2016Source: FiBL-IFOAM-SOEL-Surveys 1999-2018
www.fibl.org
ORGANIC PRODUCERS 2016
Asia
Africa
Latin America
Europe
Oceania North America
0 500000 1000000
1
2
3
4
5
Number of producers
0.0
0.5
1.0
1.5
2.0
2.5
3.0
2000 2004 2008 2012 2016
Prod
ucer
s
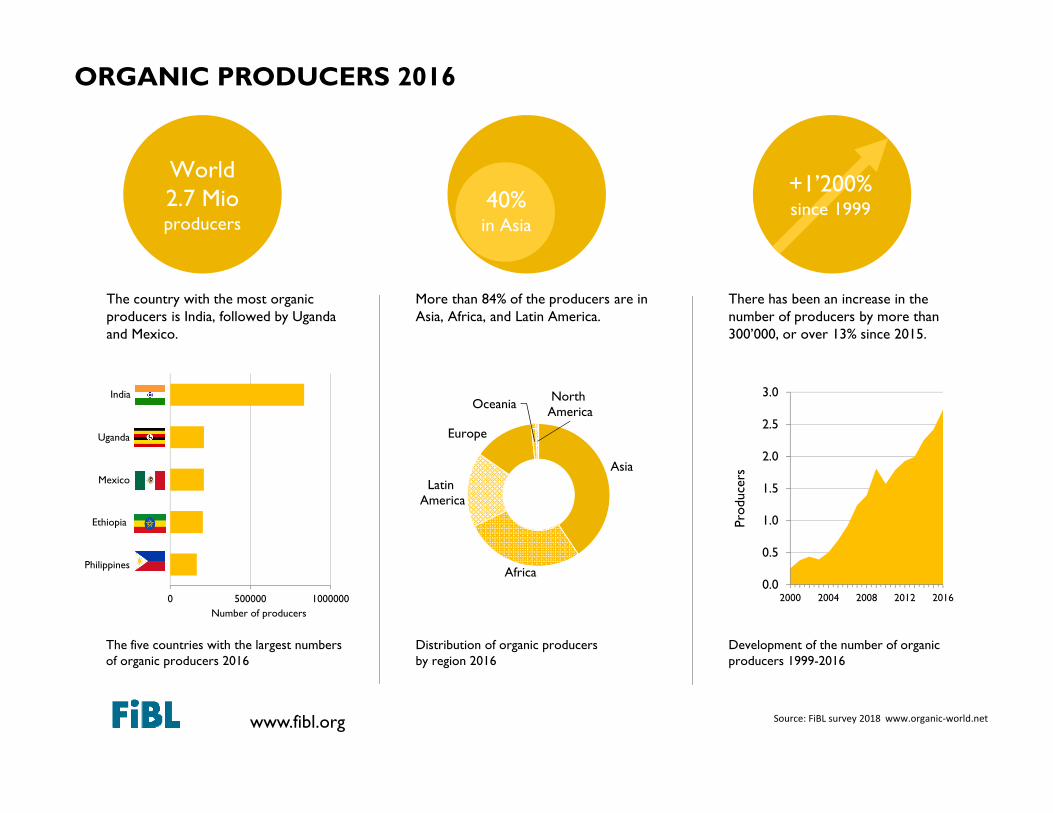
World 2.7 Mio producers
The country with the most organic producers is India, followed by Uganda and Mexico.
More than 84% of the producers are in Asia, Africa, and Latin America.
The five countries with the largest numbers of organic producers 2016
Distribution of organic producers by region 2016
Development of the number of organic producers 1999-2016
Source: FiBL survey 2018 www.organic‐world.net
India
Uganda
Mexico
Ethiopia
Philippines
40% in Asia
+1’200% since 1999
There has been an increase in the number of producers by more than 300’000, or over 13% since 2015.
www.fibl.org
WORLD: ORGANIC RETAIL SALES 2016
USA
GermanyFrance
China
CanadaItalyUK
Switzerland
Other
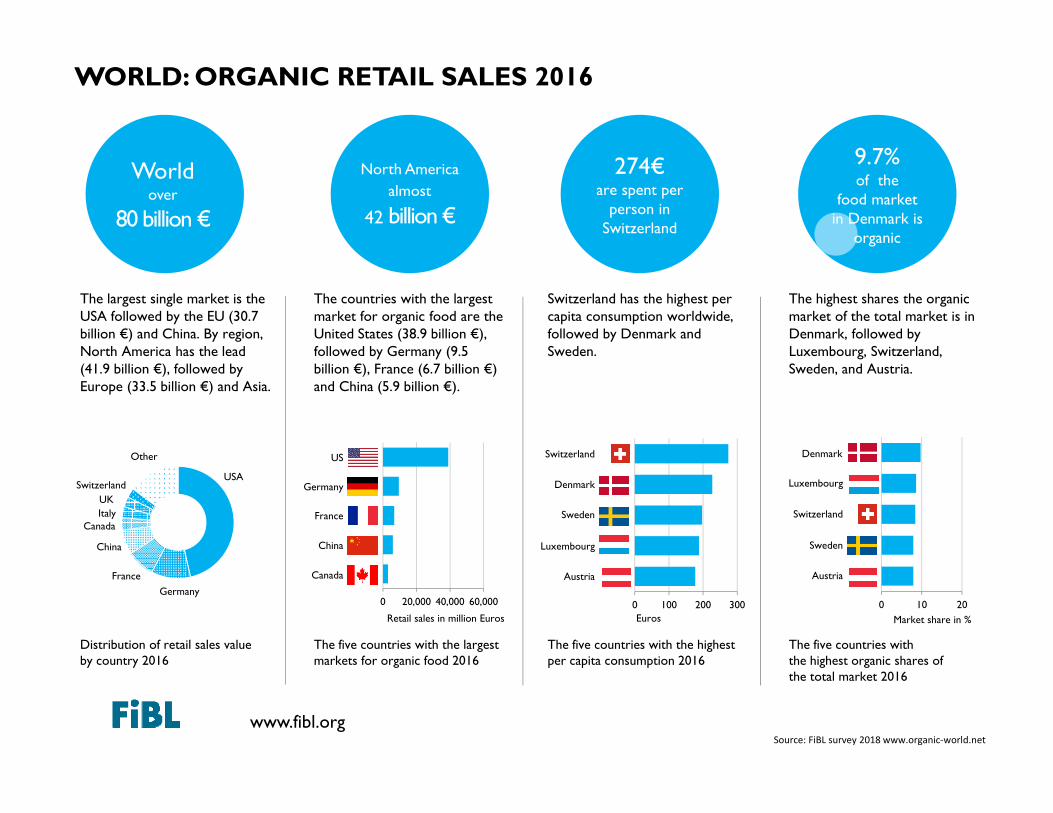
Worldover
80 billion €
North America almost
42 billion €
274€are spent per
person in Switzerland
0 20,000 40,000 60,000
1
2
3
4
5
Retail sales in million Euros0 100 200 300
1
2
3
4
5
Euros0 10 20
1
2
3
4
5
Market share in %
Distribution of retail sales value by country 2016
The five countries with the largest markets for organic food 2016
The five countries with the highest per capita consumption 2016
The five countries with the highest organic shares of the total market 2016
Source: FiBL survey 2018 www.organic‐world.net
Canada
China
France
Germany
US
Austria
Luxembourg
Sweden
Denmark
Switzerland Denmark
Luxembourg
Switzerland
Sweden
Austria
9.7% of the
food market in Denmark is
organic
The largest single market is the USA followed by the EU (30.7 billion €) and China. By region, North America has the lead (41.9 billion €), followed by Europe (33.5 billion €) and Asia.
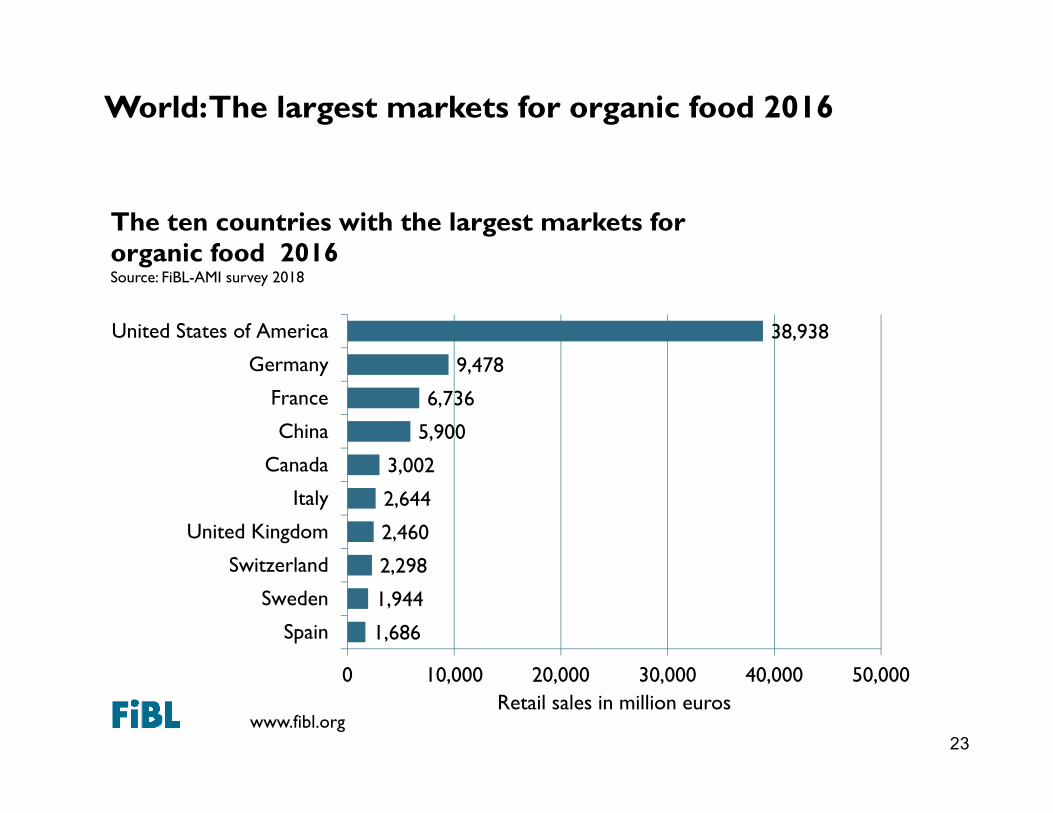
The countries with the largest market for organic food are the United States (38.9 billion €), followed by Germany (9.5 billion €), France (6.7 billion €) and China (5.9 billion €).
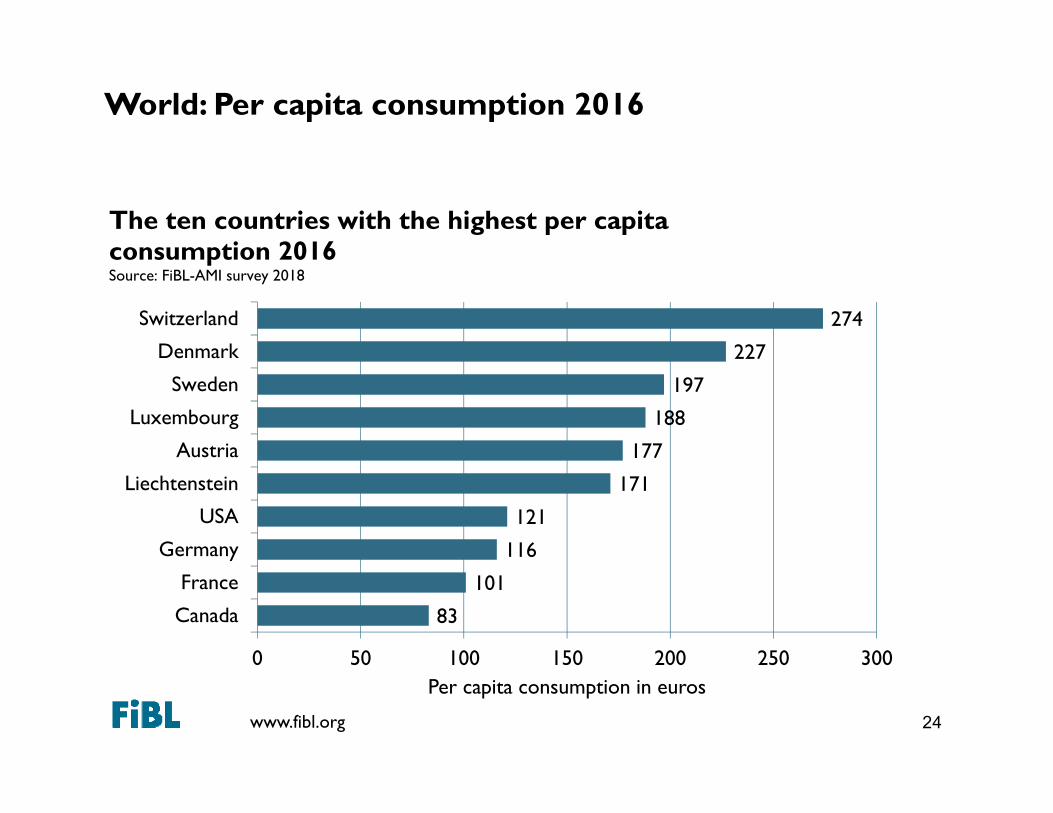
Switzerland has the highest per capita consumption worldwide, followed by Denmark and Sweden.
The highest shares the organic market of the total market is in Denmark, followed by Luxembourg, Switzerland, Sweden, and Austria.

www.fibl.org
World: Development of organic retail sales 1999-2016
20
10.2 15
.1
16.3 18.8
19.6
20.9 23.6 28
.0 31.1 34
.6 37.9 42
.3 44.9 50
.4 55.7 62
.2
75.9
84.7
0
10
20
30
40
50
60
70
80
90
1999
2000
2001
2002
2003
2004
2005
2006
2007
2008
2009
2010
2011
2012
2013
2014
2015
2016
Ret
ail s
ales
in b
illio
n eu
ros
Development of the organic retail sales 1999-2016Source: FiBL surveys 2002-2018Please note that for the years prior to 2005 data may not be complete
www.fibl.org
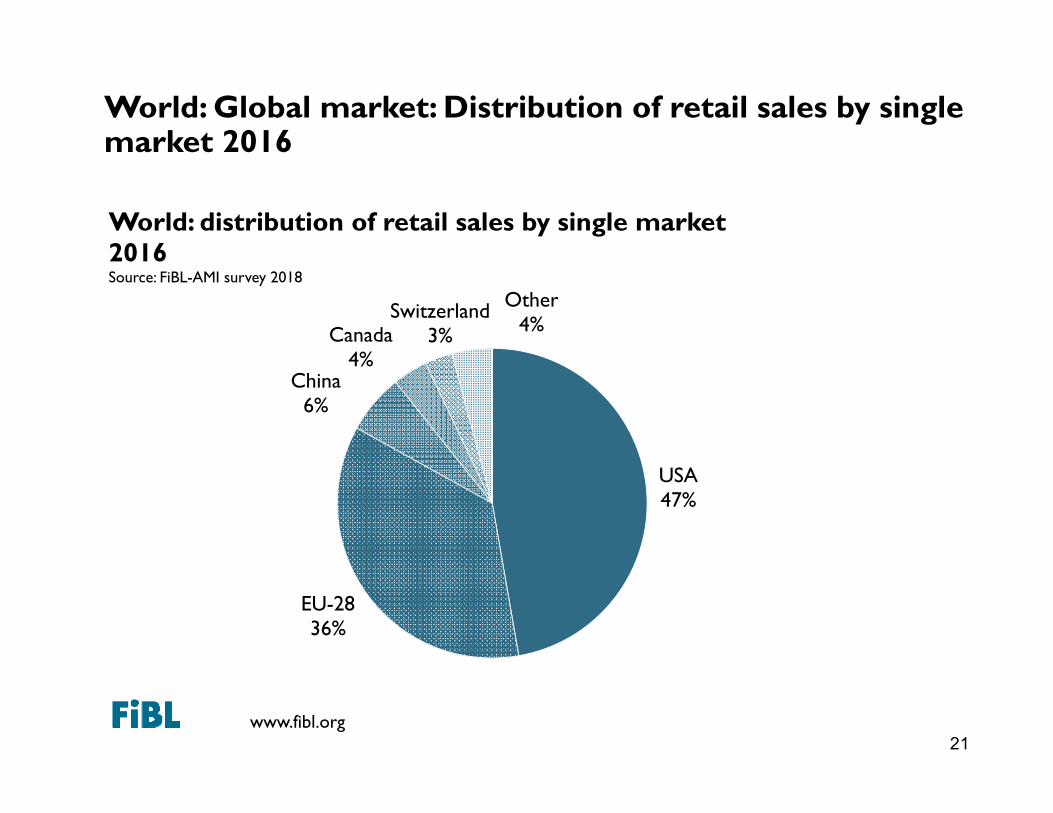
World: Global market: Distribution of retail sales by single market 2016
21
USA47%
EU-2836%
China6%
Canada4%
Switzerland3%
Other4%
World: distribution of retail sales by single market 2016Source: FiBL-AMI survey 2018
www.fibl.org
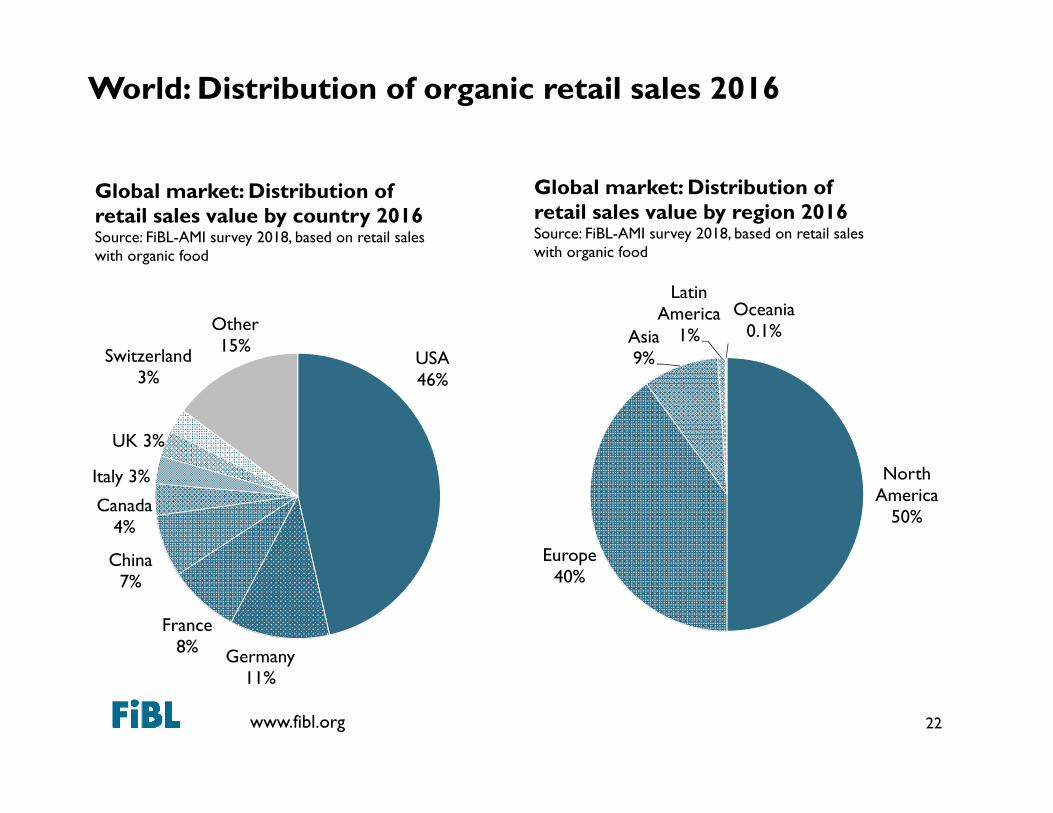
World: Distribution of organic retail sales 2016
22
USA46%
Germany11%
France8%
China7%
Canada4%
Italy 3%
UK 3%
Switzerland3%
Other15%
Global market: Distribution of retail sales value by country 2016Source: FiBL-AMI survey 2018, based on retail sales with organic food
North America
50%
Europe40%
Asia9%
Latin America
1%Oceania
0.1%
Global market: Distribution of retail sales value by region 2016Source: FiBL-AMI survey 2018, based on retail sales with organic food
www.fibl.org
World: The largest markets for organic food 2016
23
1,686
1,944
2,298
2,460
2,644
3,002
5,900
6,736
9,478
38,938
0 10,000 20,000 30,000 40,000 50,000
Spain
Sweden
Switzerland
United Kingdom
Italy
Canada
China
France
Germany
United States of America
Retail sales in million euros
The ten countries with the largest markets for organic food 2016Source: FiBL-AMI survey 2018
www.fibl.org
World: Per capita consumption 2016
24
83
101
116
121
171
177
188
197
227
274
0 50 100 150 200 250 300
Canada
France
Germany
USA
Liechtenstein
Austria
Luxembourg
Sweden
Denmark
Switzerland
Per capita consumption in euros
The ten countries with the highest per capita consumption 2016Source: FiBL-AMI survey 2018
www.fibl.org25
www.fibl.org
Resources
• «The World of Organic Agriculture» at www.organic-world.net
• Slides and infographics at www.organic-world.net• Twitter.com/fiblstatistics• Interactive maps at www.organic-world.net• Interactive data tables at statistics.fibl.org• Interactive map at www.ifoam-eu.org
26
www.fibl.org
Presentations at www.organic-world.net
27
www.fibl.org
Statistics.FiBL.org
28
www.fibl.org
www.twitter.com/fiblstatistics
29
www.fibl.org
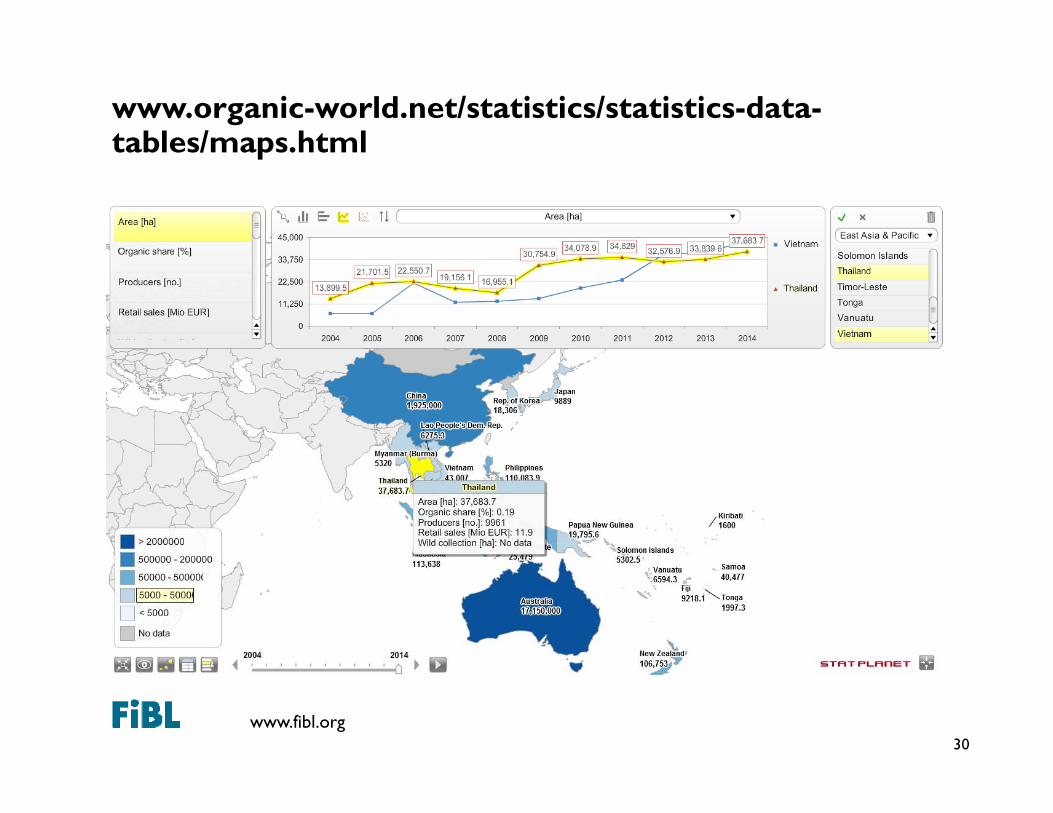
www.organic-world.net/statistics/statistics-data-tables/maps.html
30

www.fibl.org
Summary
• In 2016 organic farming continued to grow all time highs fororganic farmland, producers, market were reached.
• However, the development varies a lot between countries and regions.
• Other than in the past ten years, area growth is accelerating, however, particularly in Europe, production is still not keeping pace with the market development.
• For better monitoring of the development of the sector and to increase transparency, data collection and processing need to be improved in many countries, in particular for market and international trade data.
www.fibl.org
The World of Organic Agriculture 2018www.organic-world.net
• G et your copy at the stand• FiBL - Hall 1/555 or• IFOAM - Organics
International - Hall 1/451• www.organic-world.net
www.fibl.org
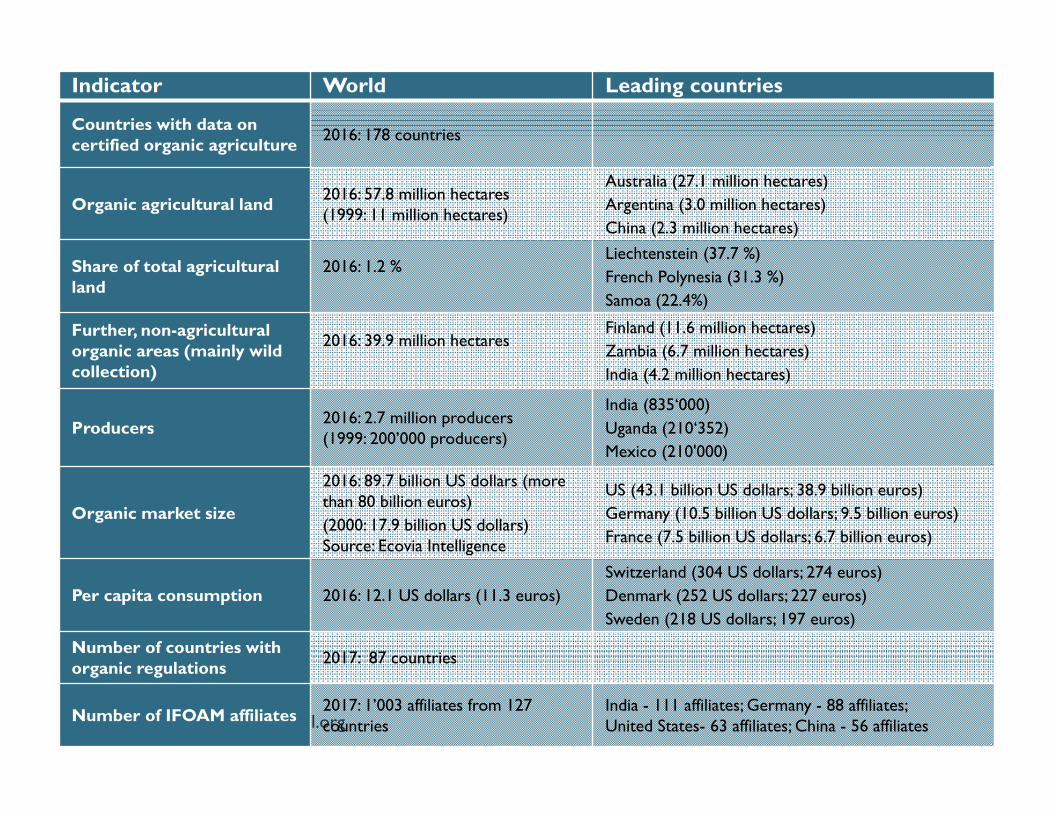
Indicator World Leading countries
Countries with data on certified organic agriculture 2016: 178 countries
Organic agricultural land 2016: 57.8 million hectares (1999: 11 million hectares)
Australia (27.1 million hectares)Argentina (3.0 million hectares)China (2.3 million hectares)
Share of total agricultural land
2016: 1.2 % Liechtenstein (37.7 %)French Polynesia (31.3 %)Samoa (22.4%)
Further, non-agricultural organic areas (mainly wild collection)
2016: 39.9 million hectares Finland (11.6 million hectares)Zambia (6.7 million hectares)India (4.2 million hectares)
Producers 2016: 2.7 million producers (1999: 200’000 producers)
India (835‘000)Uganda (210‘352)Mexico (210'000)
Organic market size
2016: 89.7 billion US dollars (more than 80 billion euros)(2000: 17.9 billion US dollars)Source: Ecovia Intelligence
US (43.1 billion US dollars; 38.9 billion euros)Germany (10.5 billion US dollars; 9.5 billion euros)France (7.5 billion US dollars; 6.7 billion euros)
Per capita consumption 2016: 12.1 US dollars (11.3 euros)Switzerland (304 US dollars; 274 euros) Denmark (252 US dollars; 227 euros)Sweden (218 US dollars; 197 euros)
Number of countries with organic regulations 2017: 87 countries
Number of IFOAM affiliates 2017: 1’003 affiliates from 127 countries
India - 111 affiliates; Germany - 88 affiliates;United States- 63 affiliates; China - 56 affiliates