Embed Size (px)
Citation preview
Chapter 15Infrared Spectroscopy and Mass Spectrometry
Organic ChemistrySecond Edition
David Klein
Copyright © 2015 John Wiley & Sons, Inc. All rights reserved. Klein, Organic Chemistry 2e
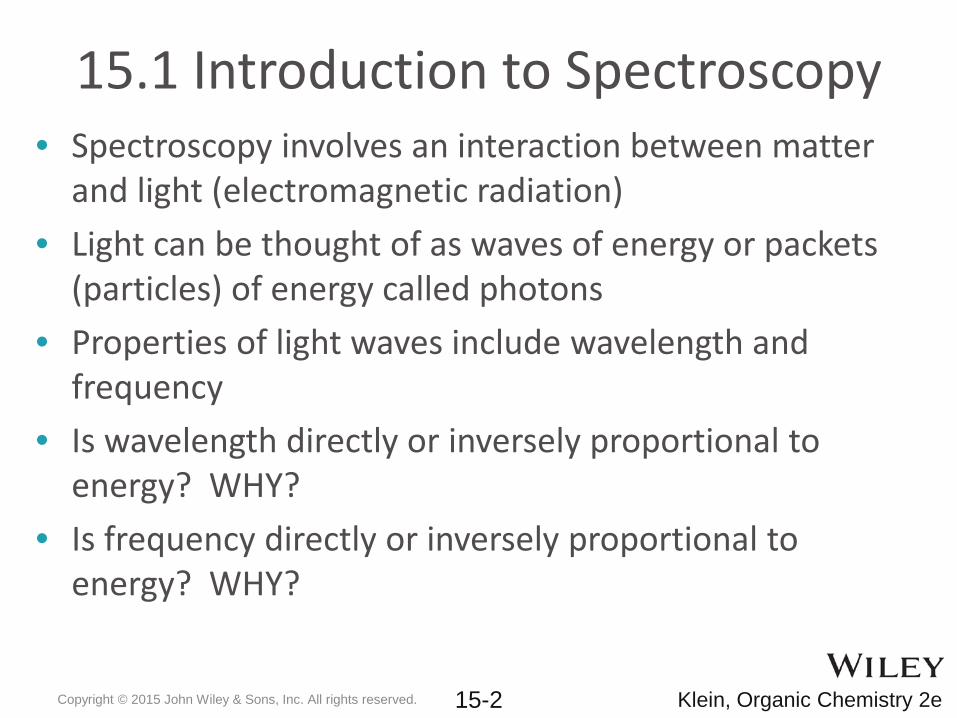
15.1 Introduction to Spectroscopy• Spectroscopy involves an interaction between matter
and light (electromagnetic radiation)• Light can be thought of as waves of energy or packets
(particles) of energy called photons• Properties of light waves include wavelength and
frequency• Is wavelength directly or inversely proportional to
energy? WHY?• Is frequency directly or inversely proportional to
energy? WHY?
Copyright © 2015 John Wiley & Sons, Inc. All rights reserved. 15-2 Klein, Organic Chemistry 2e
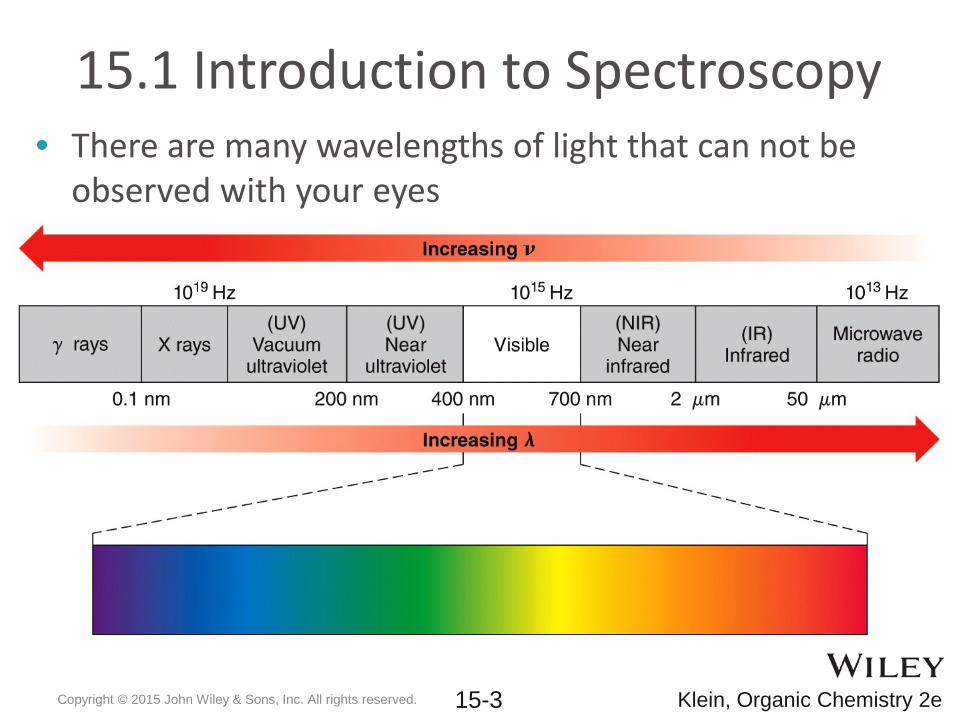
15.1 Introduction to Spectroscopy• There are many wavelengths of light that can not be
observed with your eyes
Copyright © 2015 John Wiley & Sons, Inc. All rights reserved. 15-3 Klein, Organic Chemistry 2e
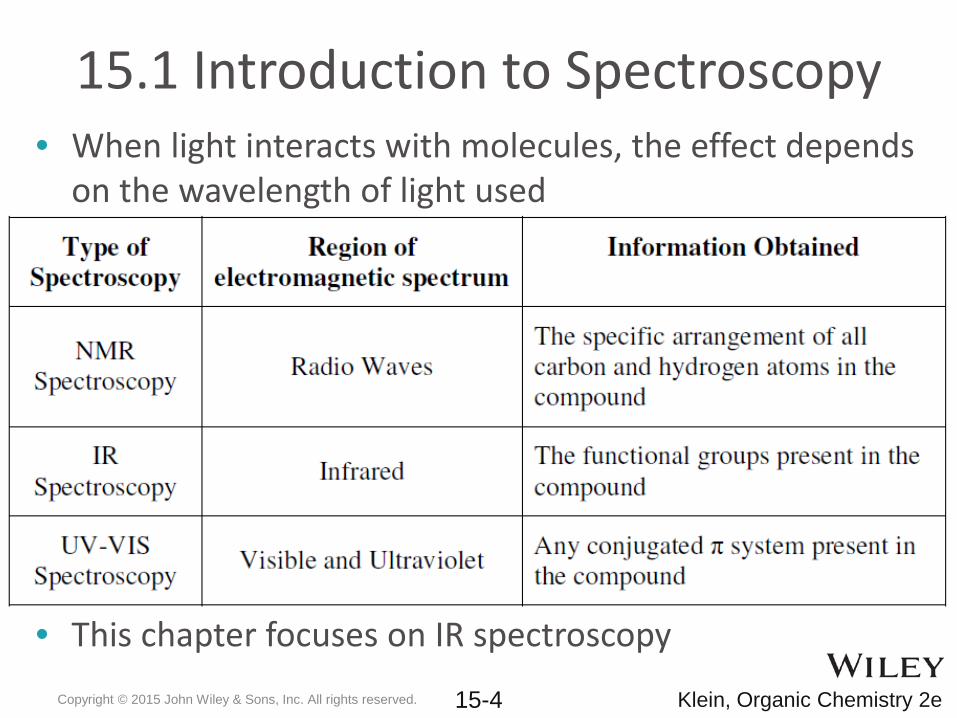
15.1 Introduction to Spectroscopy• When light interacts with molecules, the effect depends
on the wavelength of light used
• This chapter focuses on IR spectroscopyCopyright © 2015 John Wiley & Sons, Inc. All rights reserved. 15-4 Klein, Organic Chemistry 2e
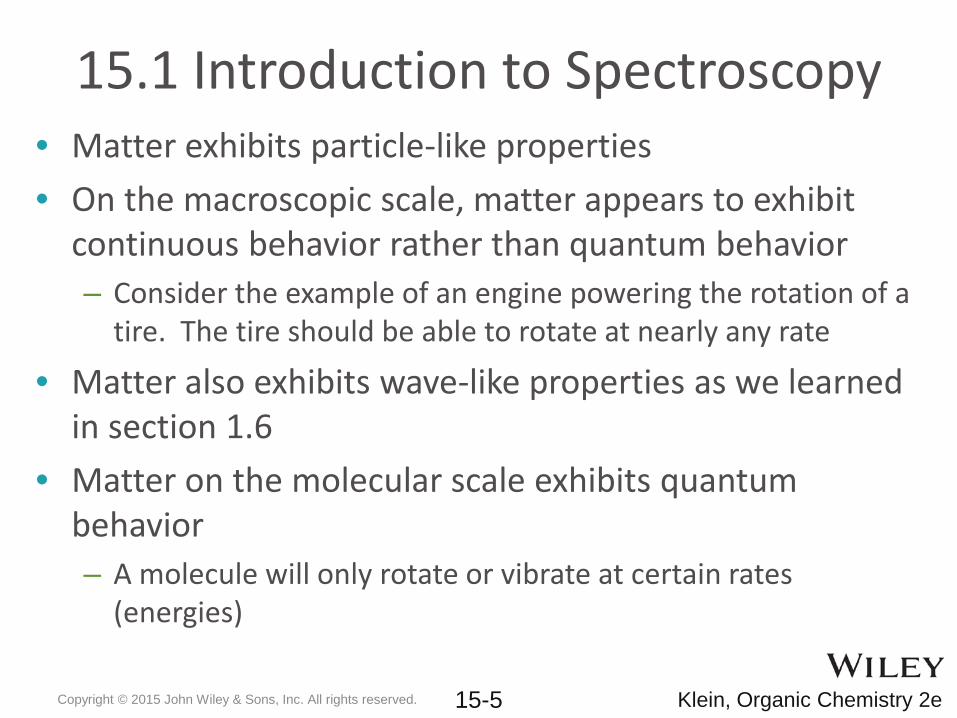
15.1 Introduction to Spectroscopy• Matter exhibits particle-like properties• On the macroscopic scale, matter appears to exhibit
continuous behavior rather than quantum behavior– Consider the example of an engine powering the rotation of a
tire. The tire should be able to rotate at nearly any rate
• Matter also exhibits wave-like properties as we learned in section 1.6
• Matter on the molecular scale exhibits quantum behavior– A molecule will only rotate or vibrate at certain rates
(energies)
Copyright © 2015 John Wiley & Sons, Inc. All rights reserved. 15-5 Klein, Organic Chemistry 2e
15.1 Introduction to Spectroscopy• For each of the types of molecular motion/energy
below, describe how it is quantized– Rotation
– Vibration
– Energy of electrons
Copyright © 2015 John Wiley & Sons, Inc. All rights reserved. 15-6 Klein, Organic Chemistry 2e
15.1 Introduction to Spectroscopy• For each different bond, vibrational energy levels are
separated by gaps (quantized)• If a photon of light strikes the molecule with the exact
amount of energy needed, a molecular vibration will occur
• Energy is eventually released from the molecule generally in the form of heat
• Infrared (IR) Light generally causes molecular vibration• HOW might IR light absorbed give you information
about a molecule’s structure
Copyright © 2015 John Wiley & Sons, Inc. All rights reserved. 15-7 Klein, Organic Chemistry 2e
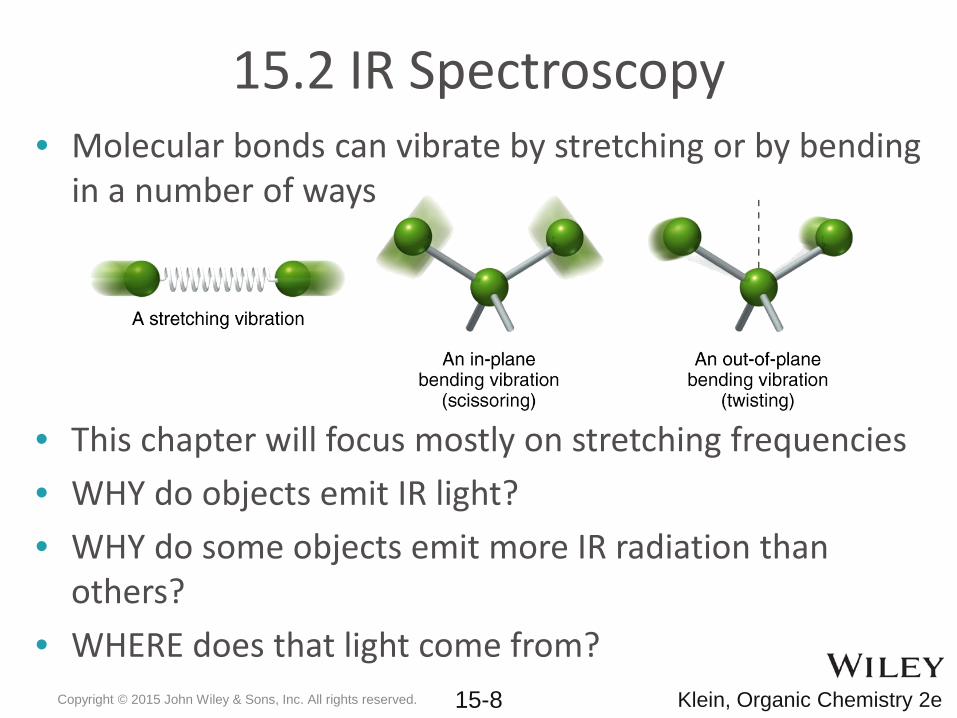
• Molecular bonds can vibrate by stretching or by bending in a number of ways
15.2 IR Spectroscopy
• This chapter will focus mostly on stretching frequencies• WHY do objects emit IR light?• WHY do some objects emit more IR radiation than
others?• WHERE does that light come from?
Copyright © 2015 John Wiley & Sons, Inc. All rights reserved. 15-8 Klein, Organic Chemistry 2e
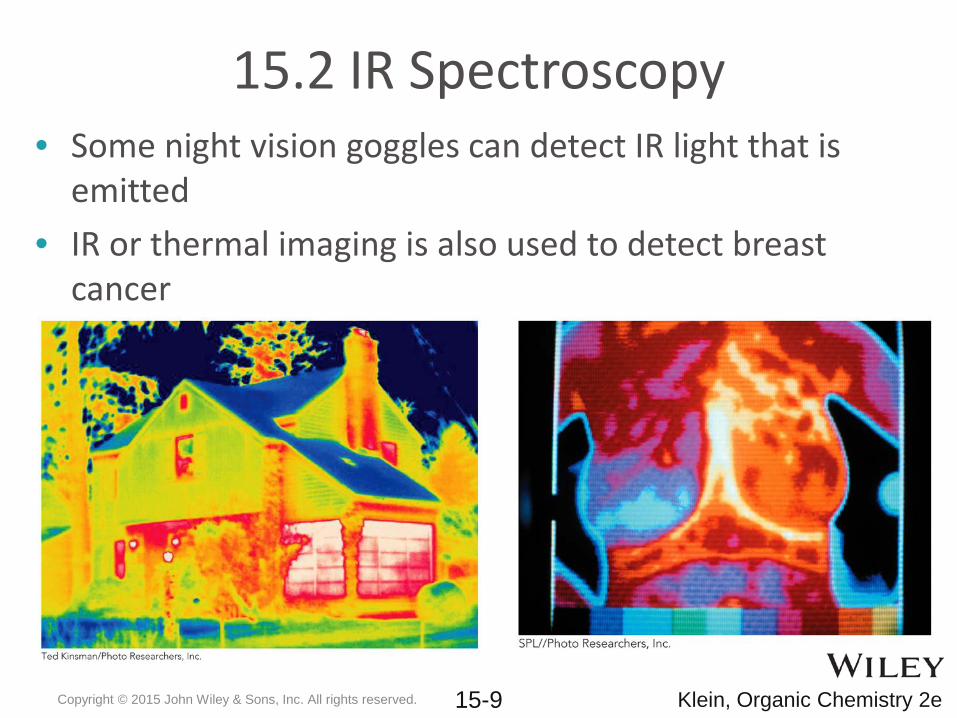
• Some night vision goggles can detect IR light that is emitted
• IR or thermal imaging is also used to detect breast cancer
15.2 IR Spectroscopy
Copyright © 2015 John Wiley & Sons, Inc. All rights reserved. 15-9 Klein, Organic Chemistry 2e
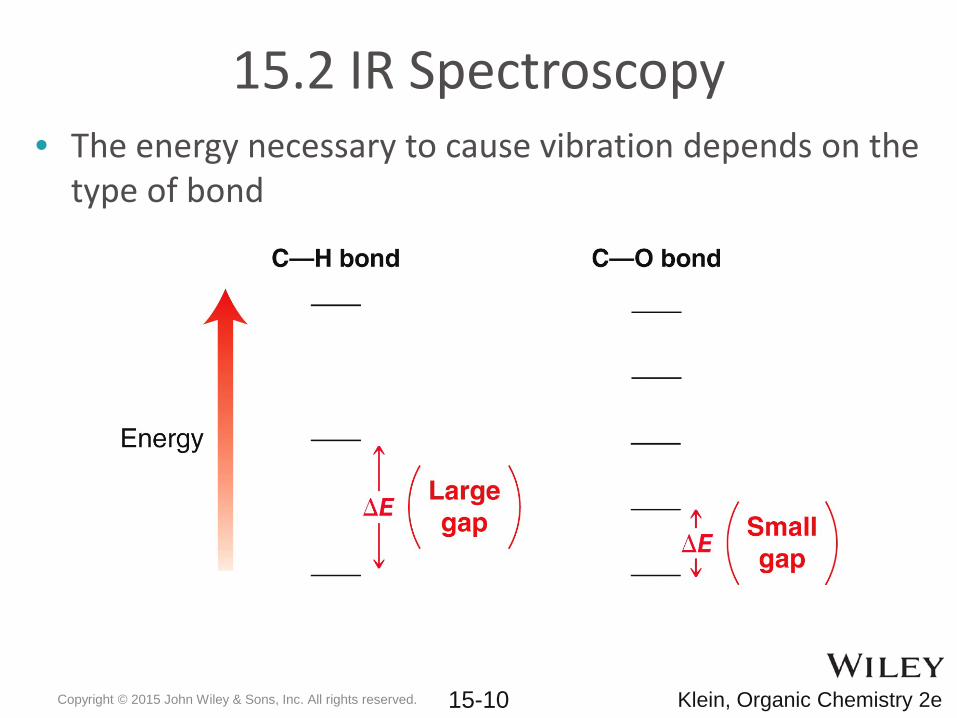
• The energy necessary to cause vibration depends on the type of bond
15.2 IR Spectroscopy
Copyright © 2015 John Wiley & Sons, Inc. All rights reserved. 15-10 Klein, Organic Chemistry 2e
• An IR spectrophotometer irradiates a sample with all frequencies of IR light
• The frequencies that are absorbed by the sample tell us the types of bonds (functional groups) that are present
• How do we measure the frequencies that are absorbed?
• Most commonly, samples are deposited neat on a salt (NaCl) plate. WHY is salt used?
• Alternatively, the compound may be dissolved in a solvent or embedded in a KBr pellet
15.2 IR Spectroscopy
Copyright © 2015 John Wiley & Sons, Inc. All rights reserved. 15-11 Klein, Organic Chemistry 2e
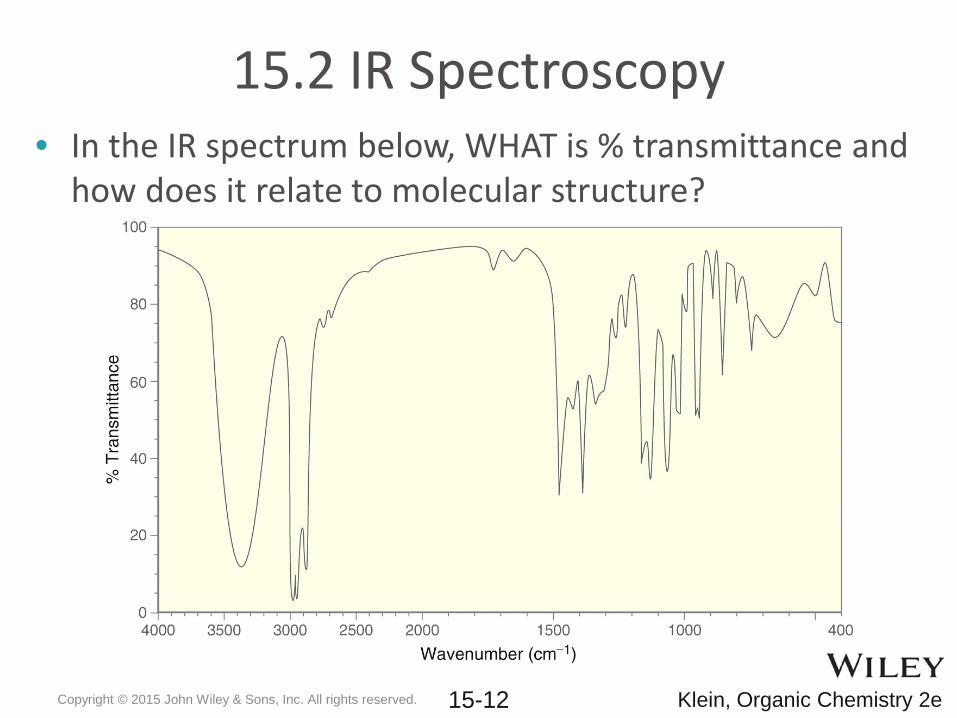
• In the IR spectrum below, WHAT is % transmittance and how does it relate to molecular structure?
15.2 IR Spectroscopy
Copyright © 2015 John Wiley & Sons, Inc. All rights reserved. 15-12 Klein, Organic Chemistry 2e
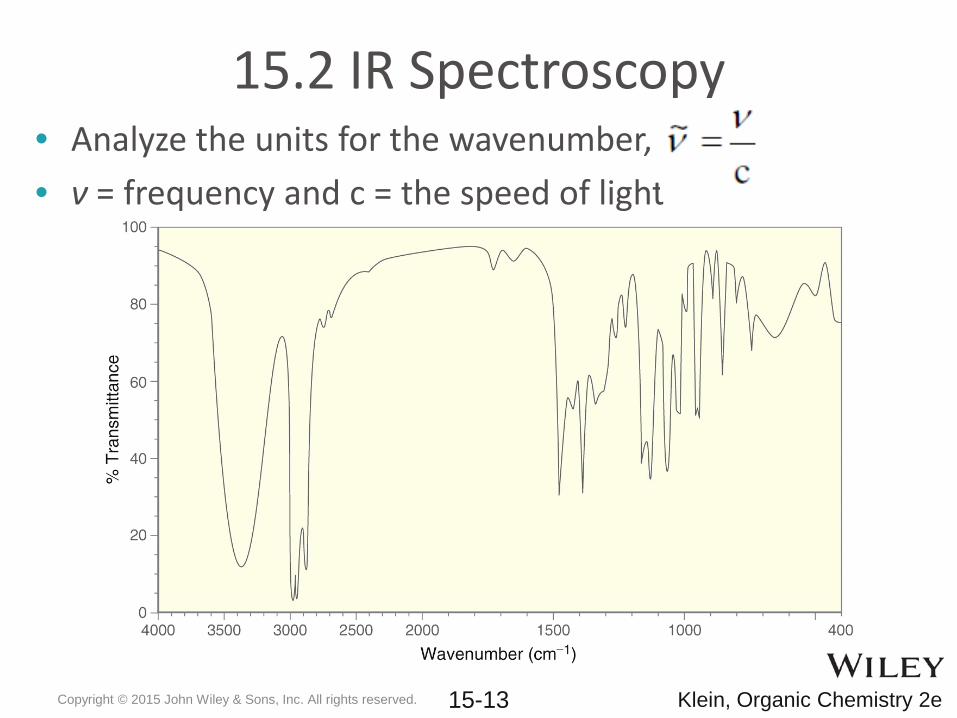
• Analyze the units for the wavenumber,• ν = frequency and c = the speed of light
15.2 IR Spectroscopy
Copyright © 2015 John Wiley & Sons, Inc. All rights reserved. 15-13 Klein, Organic Chemistry 2e
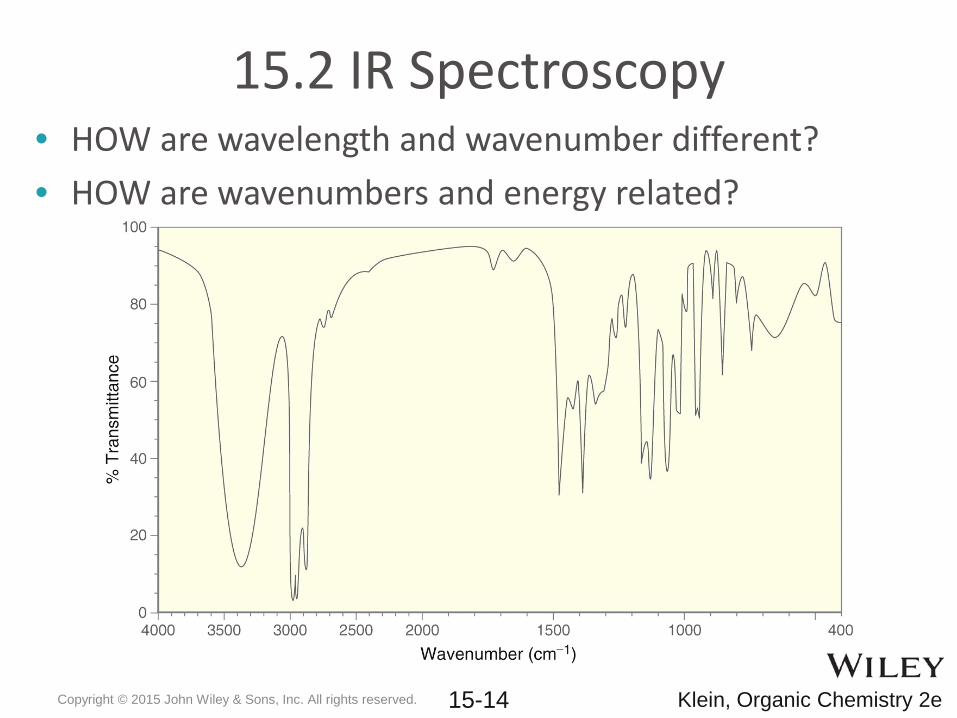
• HOW are wavelength and wavenumber different? • HOW are wavenumbers and energy related?
15.2 IR Spectroscopy
Copyright © 2015 John Wiley & Sons, Inc. All rights reserved. 15-14 Klein, Organic Chemistry 2e
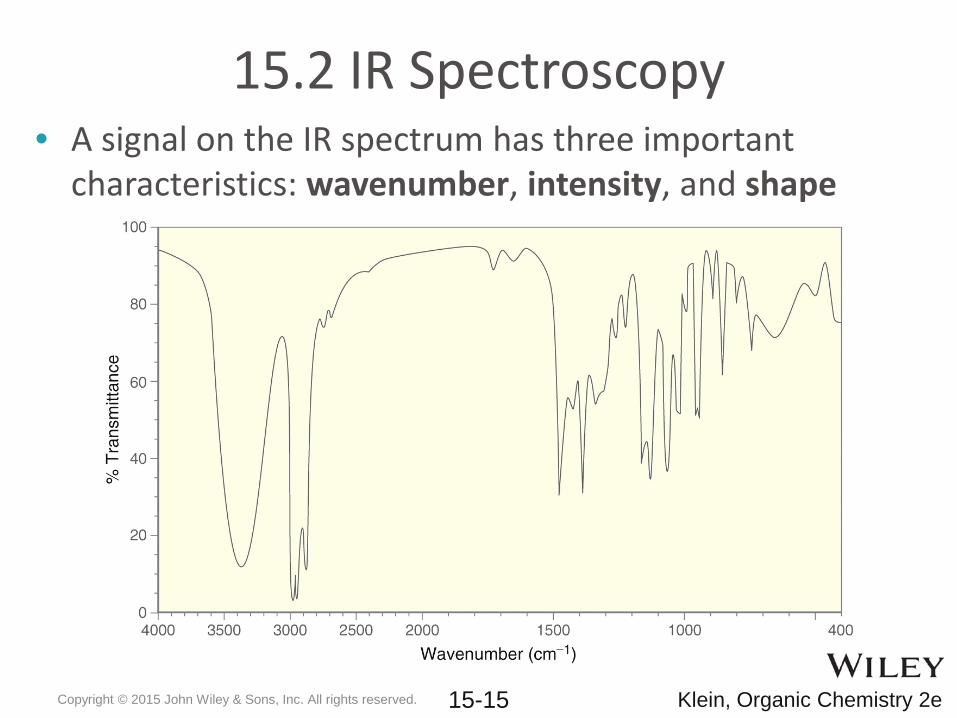
• A signal on the IR spectrum has three important characteristics: wavenumber, intensity, and shape
15.2 IR Spectroscopy
Copyright © 2015 John Wiley & Sons, Inc. All rights reserved. 15-15 Klein, Organic Chemistry 2e
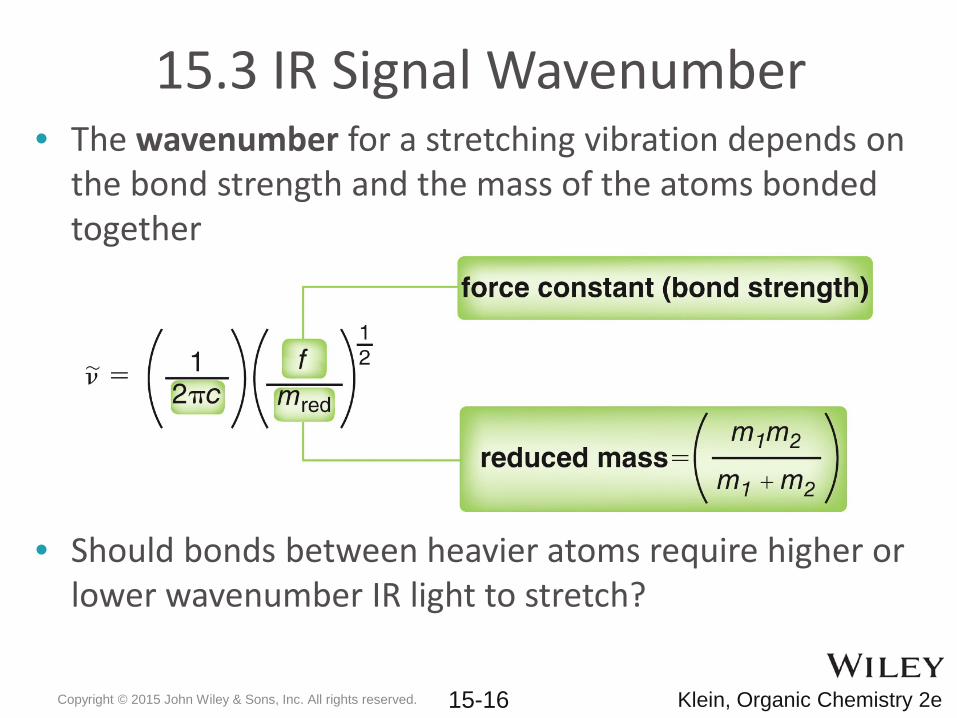
• The wavenumber for a stretching vibration depends on the bond strength and the mass of the atoms bonded together
• Should bonds between heavier atoms require higher or lower wavenumber IR light to stretch?
15.3 IR Signal Wavenumber
Copyright © 2015 John Wiley & Sons, Inc. All rights reserved. 15-16 Klein, Organic Chemistry 2e
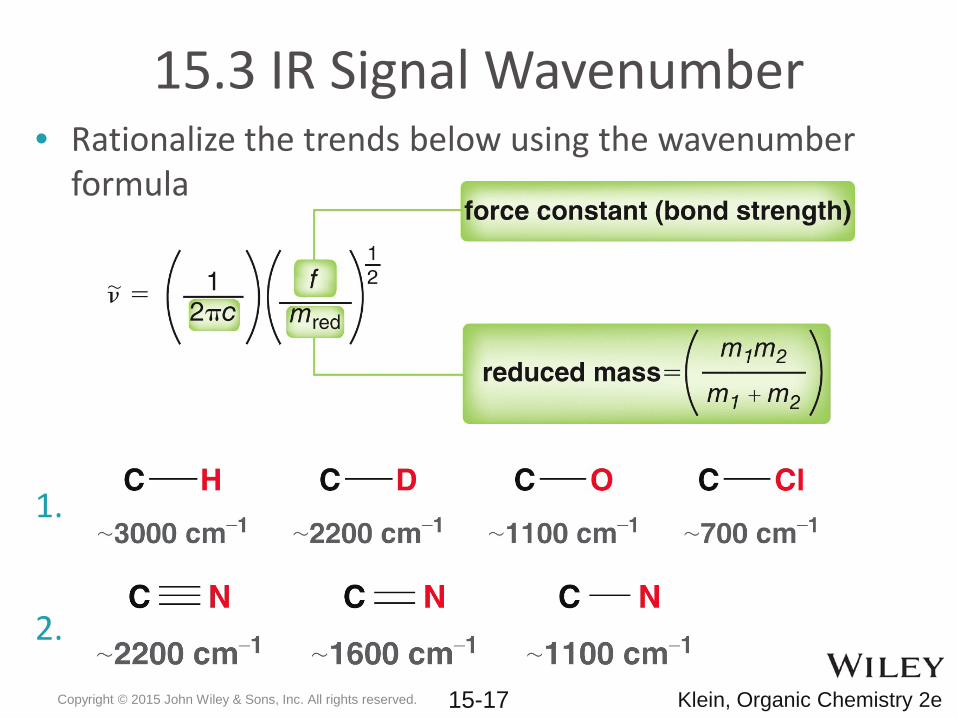
• Rationalize the trends below using the wavenumberformula
1.
2.
15.3 IR Signal Wavenumber
Copyright © 2015 John Wiley & Sons, Inc. All rights reserved. 15-17 Klein, Organic Chemistry 2e
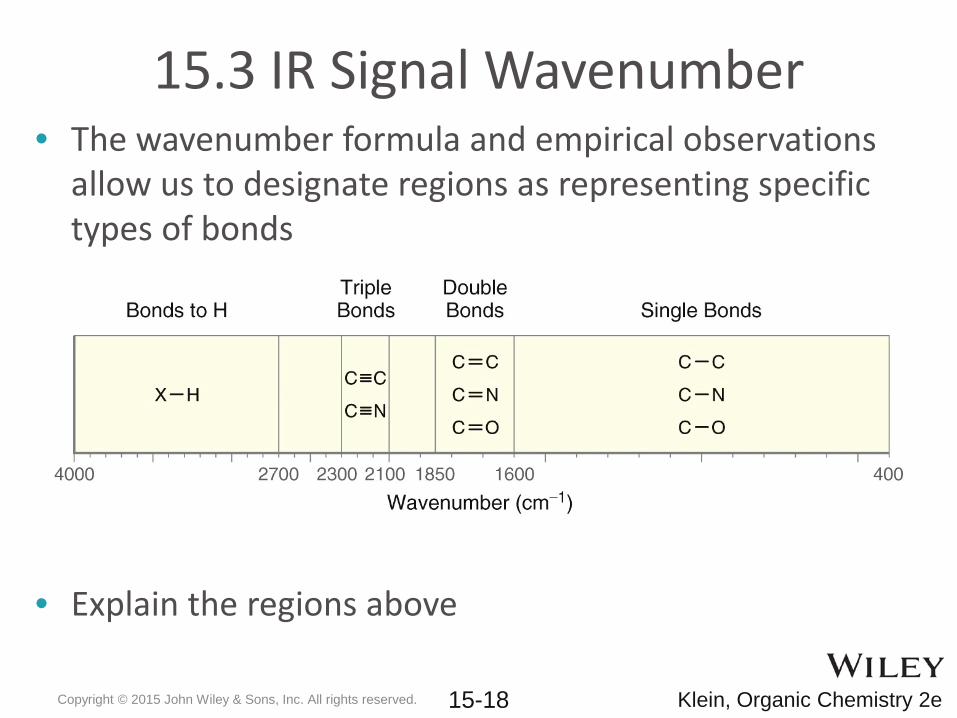
• The wavenumber formula and empirical observations allow us to designate regions as representing specific types of bonds
• Explain the regions above
15.3 IR Signal Wavenumber
Copyright © 2015 John Wiley & Sons, Inc. All rights reserved. 15-18 Klein, Organic Chemistry 2e
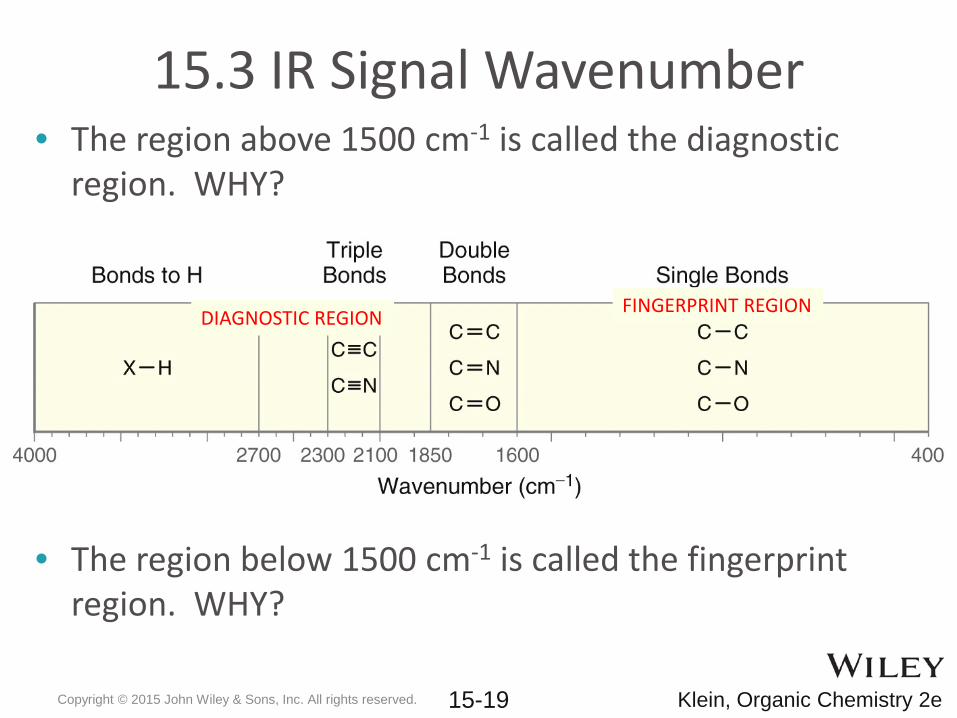
• The region above 1500 cm-1 is called the diagnostic region. WHY?
• The region below 1500 cm-1 is called the fingerprint region. WHY?
15.3 IR Signal Wavenumber
Copyright © 2015 John Wiley & Sons, Inc. All rights reserved. 15-19 Klein, Organic Chemistry 2e
DIAGNOSTIC REGION FINGERPRINT REGION
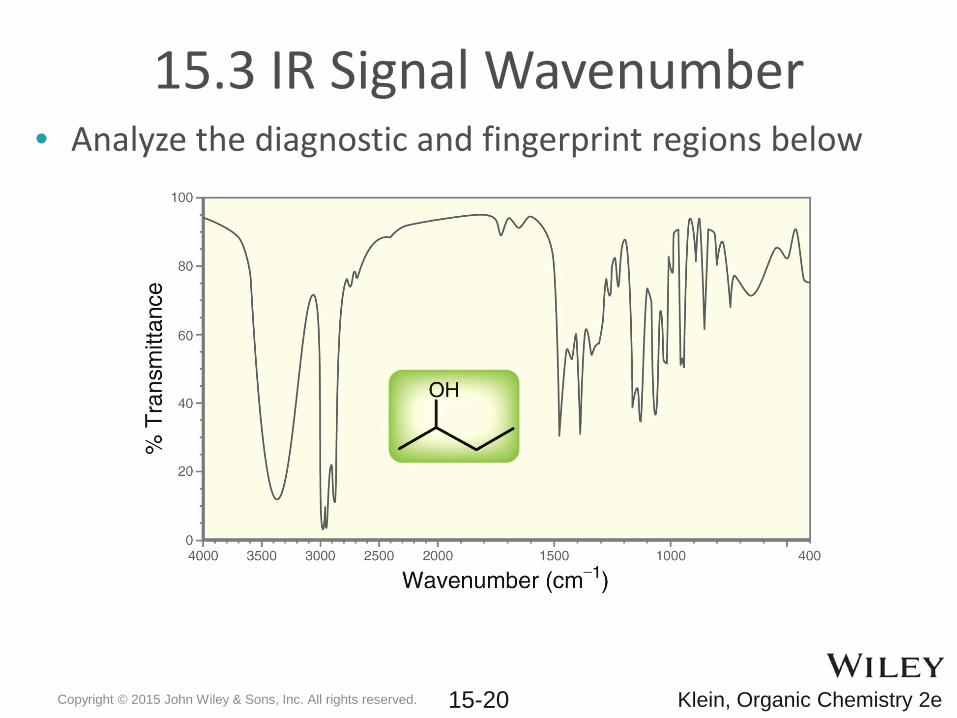
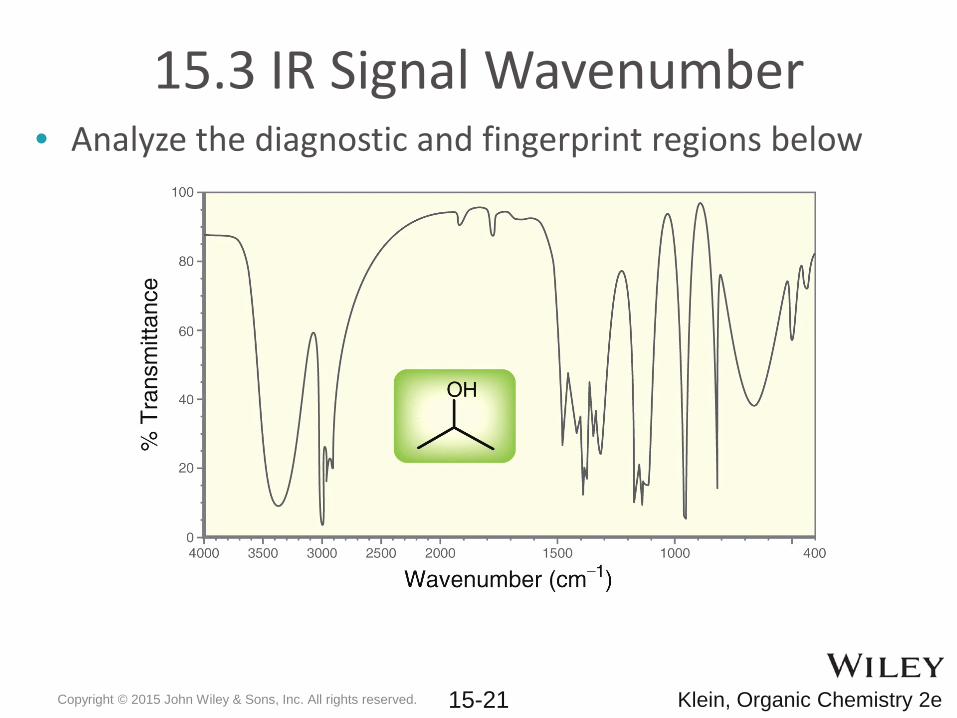
• Analyze the diagnostic and fingerprint regions below
15.3 IR Signal Wavenumber
Copyright © 2015 John Wiley & Sons, Inc. All rights reserved. 15-20 Klein, Organic Chemistry 2e
• Analyze the diagnostic and fingerprint regions below
15.3 IR Signal Wavenumber
Copyright © 2015 John Wiley & Sons, Inc. All rights reserved. 15-21 Klein, Organic Chemistry 2e
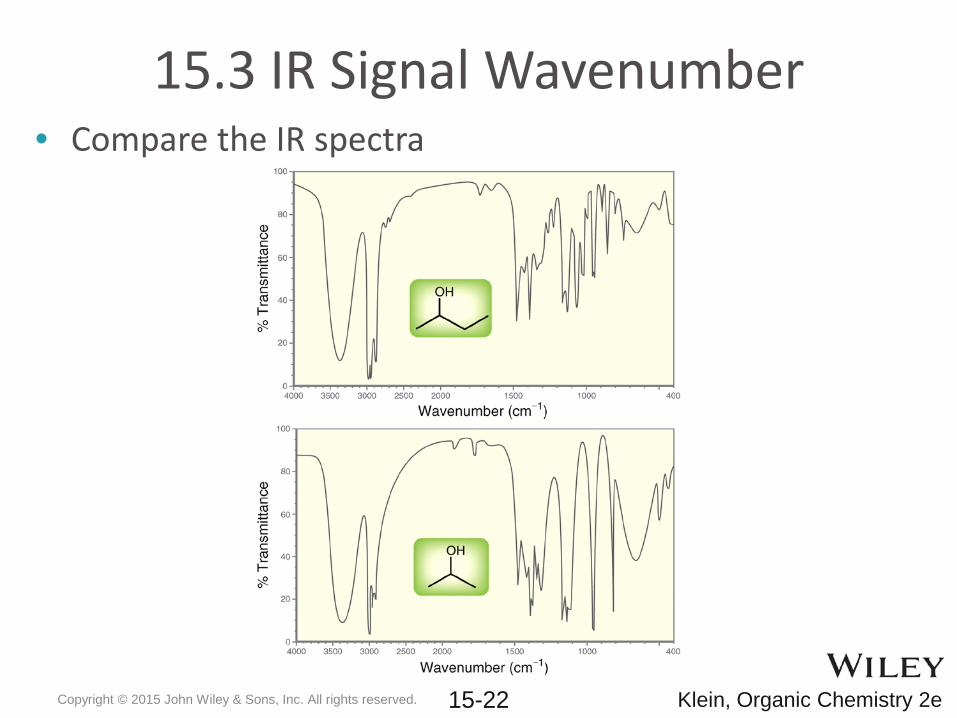
• Compare the IR spectra
15.3 IR Signal Wavenumber
Copyright © 2015 John Wiley & Sons, Inc. All rights reserved. 15-22 Klein, Organic Chemistry 2e
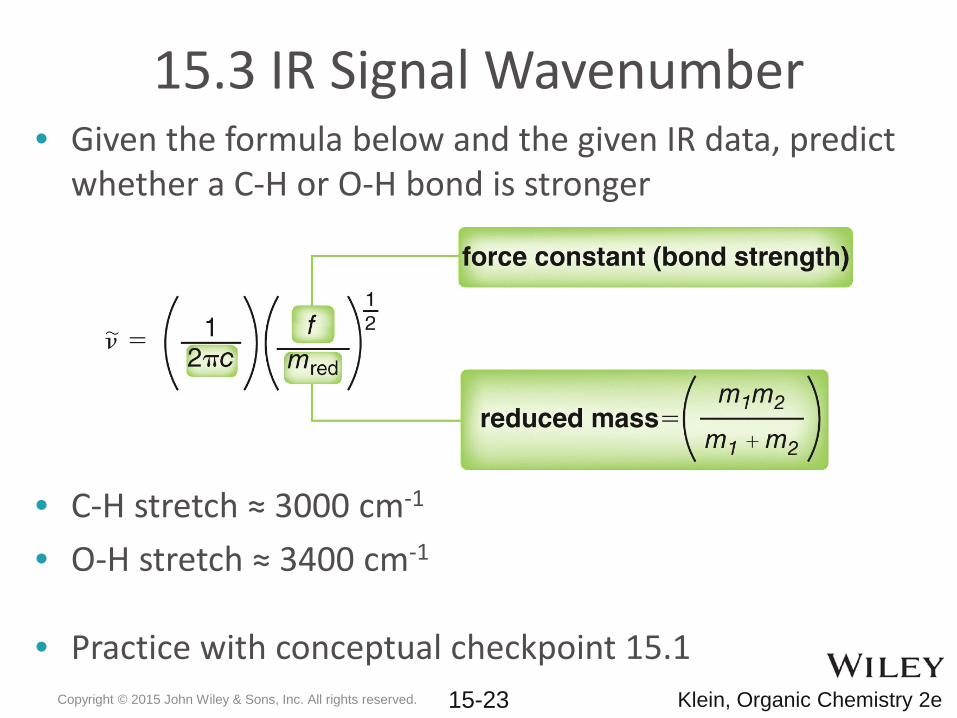
• Given the formula below and the given IR data, predict whether a C-H or O-H bond is stronger
• C-H stretch ≈ 3000 cm-1
• O-H stretch ≈ 3400 cm-1
• Practice with conceptual checkpoint 15.1
15.3 IR Signal Wavenumber
Copyright © 2015 John Wiley & Sons, Inc. All rights reserved. 15-23 Klein, Organic Chemistry 2e
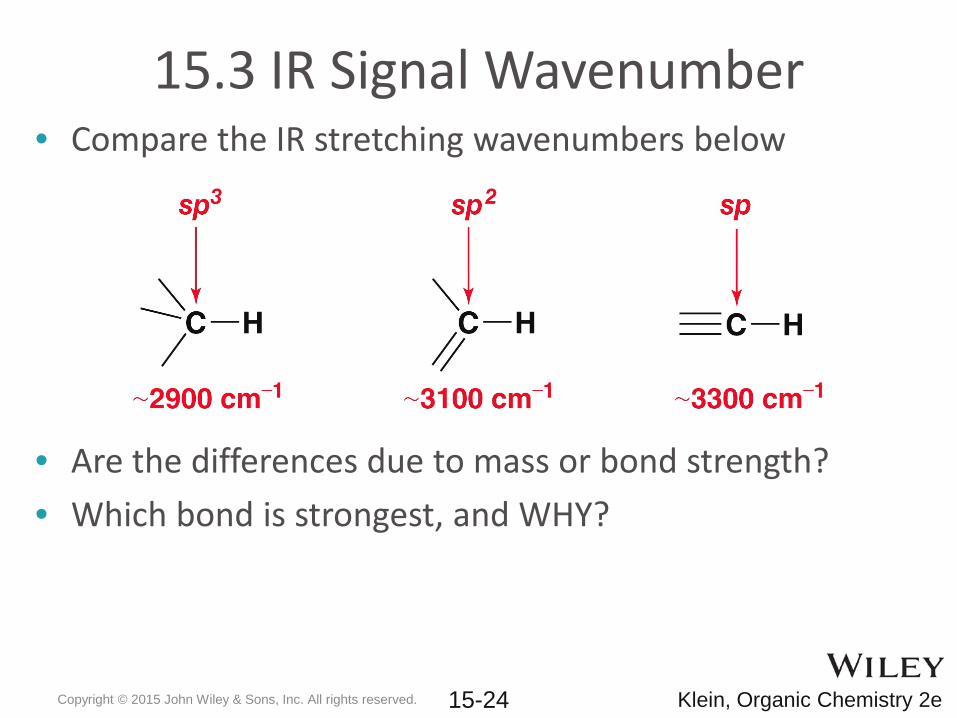
• Compare the IR stretching wavenumbers below
• Are the differences due to mass or bond strength?• Which bond is strongest, and WHY?
15.3 IR Signal Wavenumber
Copyright © 2015 John Wiley & Sons, Inc. All rights reserved. 15-24 Klein, Organic Chemistry 2e
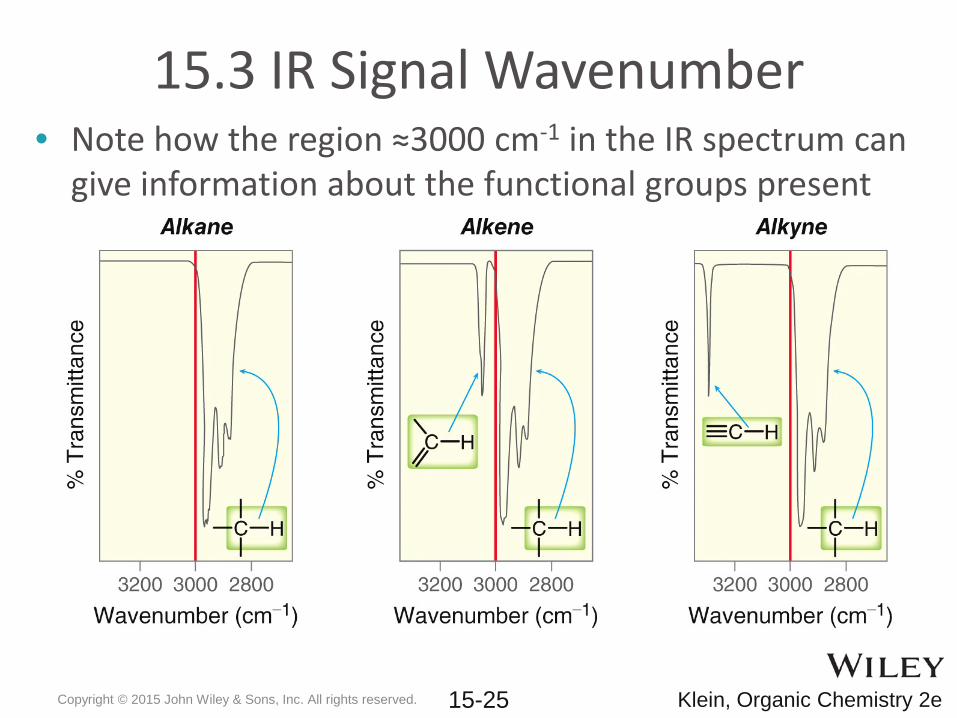
• Note how the region ≈3000 cm-1 in the IR spectrum can give information about the functional groups present
15.3 IR Signal Wavenumber
Copyright © 2015 John Wiley & Sons, Inc. All rights reserved. 15-25 Klein, Organic Chemistry 2e
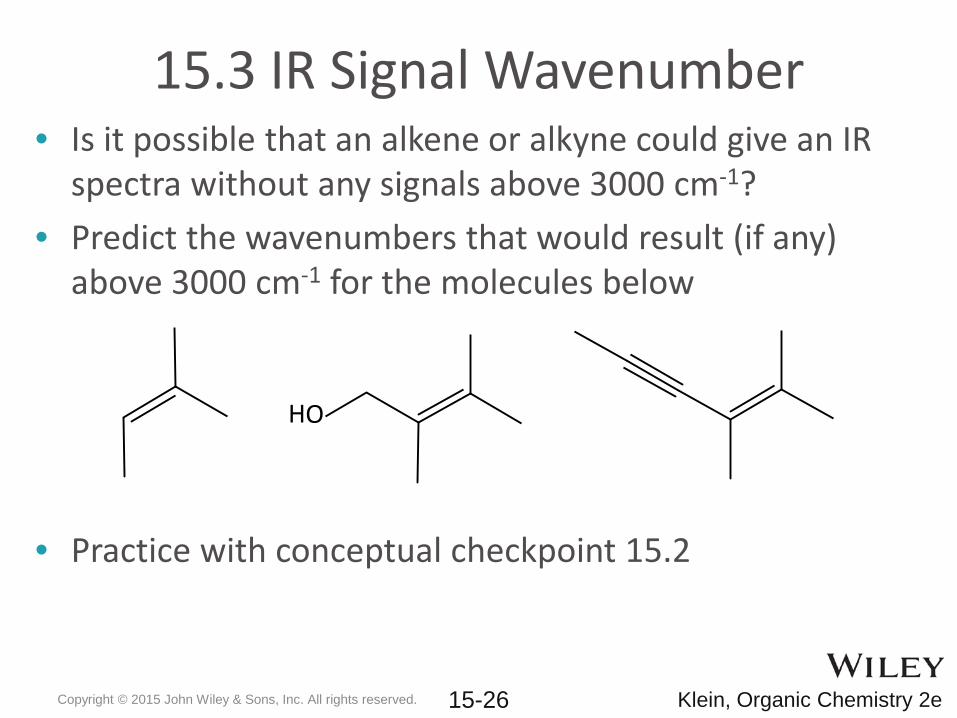
• Is it possible that an alkene or alkyne could give an IR spectra without any signals above 3000 cm-1?
• Predict the wavenumbers that would result (if any) above 3000 cm-1 for the molecules below
• Practice with conceptual checkpoint 15.2
15.3 IR Signal Wavenumber
HO
Copyright © 2015 John Wiley & Sons, Inc. All rights reserved. 15-26 Klein, Organic Chemistry 2e
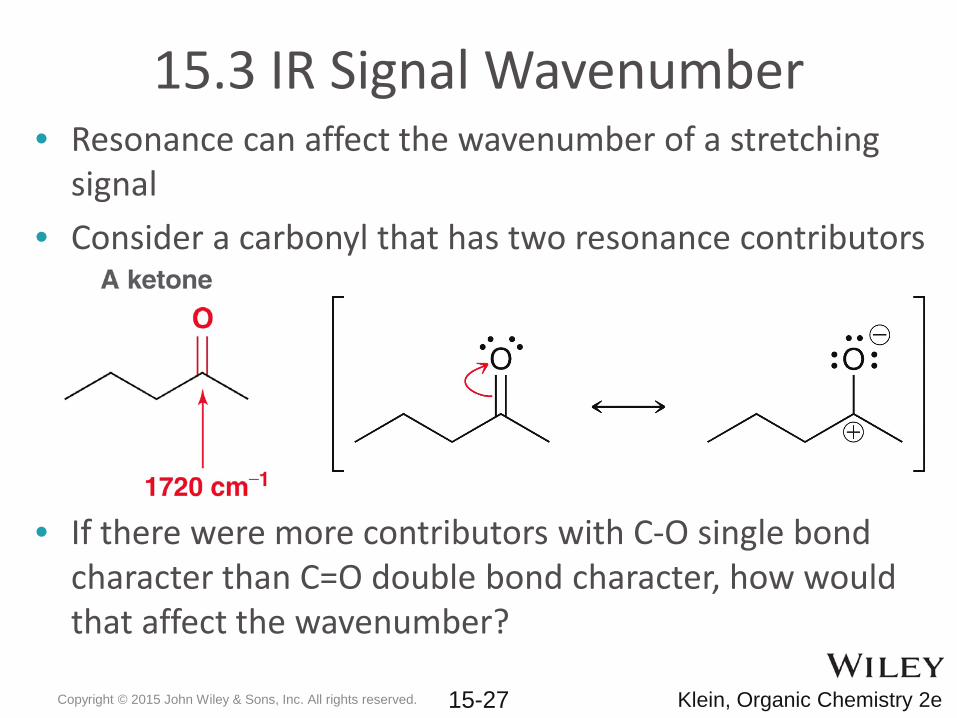
• Resonance can affect the wavenumber of a stretching signal
• Consider a carbonyl that has two resonance contributors
• If there were more contributors with C-O single bond character than C=O double bond character, how would that affect the wavenumber?
15.3 IR Signal Wavenumber
Copyright © 2015 John Wiley & Sons, Inc. All rights reserved. 15-27 Klein, Organic Chemistry 2e
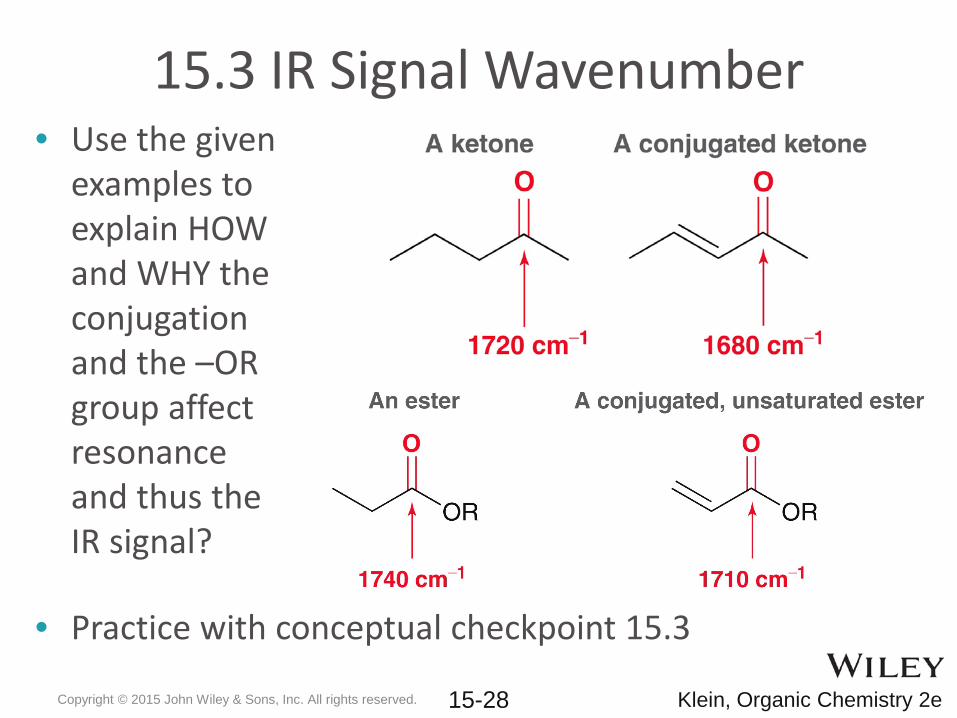
• Use the given examples to explain HOW and WHY the conjugation and the –OR group affect resonance and thus the IR signal?
15.3 IR Signal Wavenumber
• Practice with conceptual checkpoint 15.3
Copyright © 2015 John Wiley & Sons, Inc. All rights reserved. 15-28 Klein, Organic Chemistry 2e
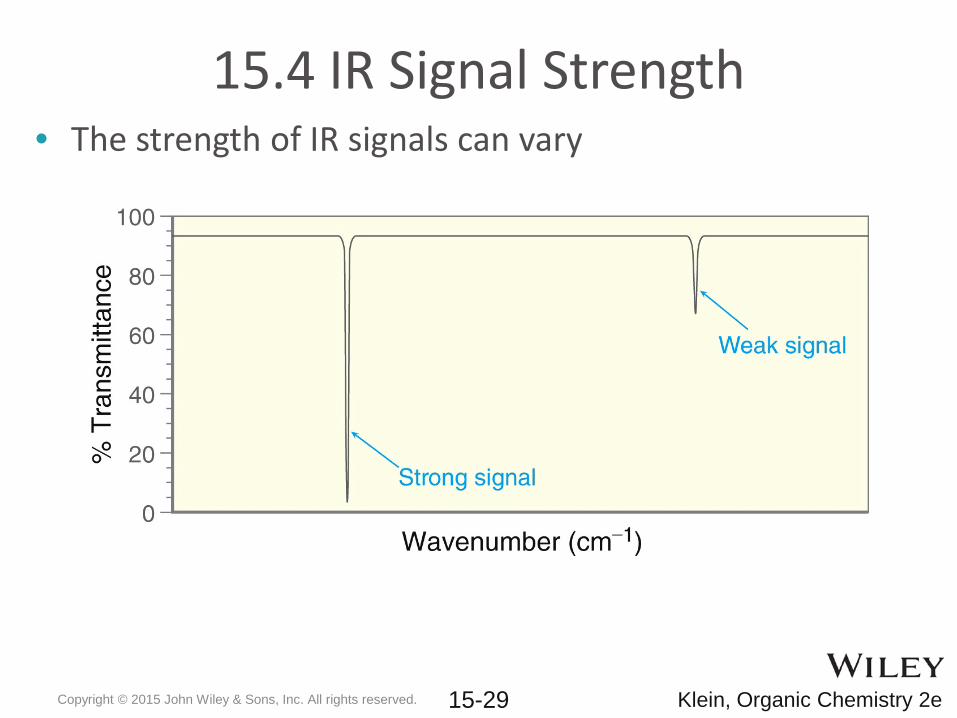
• The strength of IR signals can vary
15.4 IR Signal Strength
Copyright © 2015 John Wiley & Sons, Inc. All rights reserved. 15-29 Klein, Organic Chemistry 2e
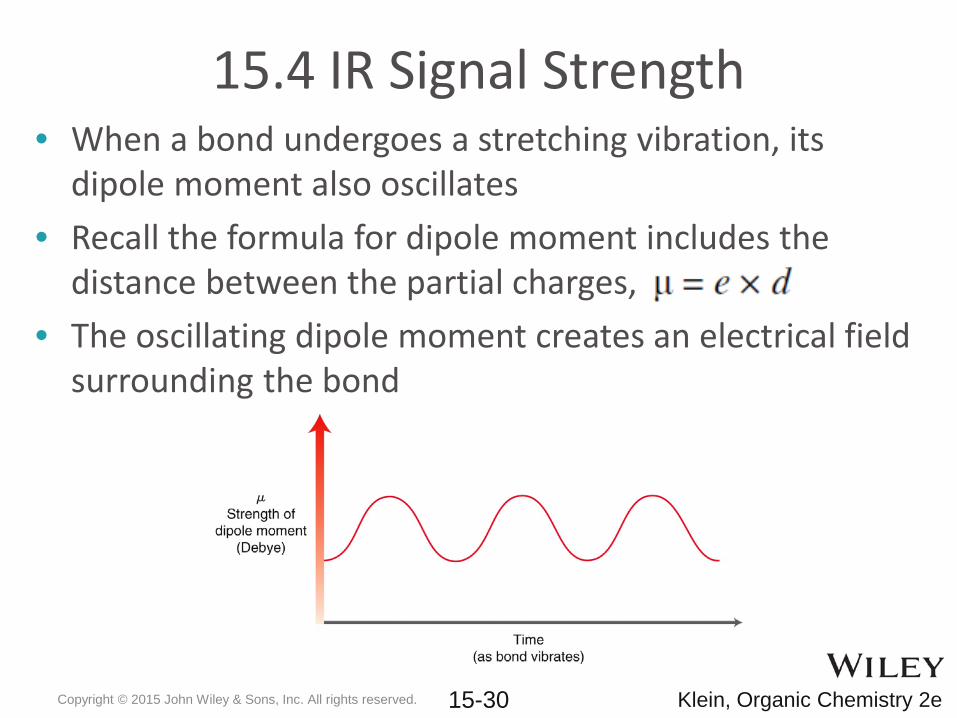
• When a bond undergoes a stretching vibration, its dipole moment also oscillates
• Recall the formula for dipole moment includes the distance between the partial charges,
• The oscillating dipole moment creates an electrical field surrounding the bond
15.4 IR Signal Strength
Copyright © 2015 John Wiley & Sons, Inc. All rights reserved. 15-30 Klein, Organic Chemistry 2e
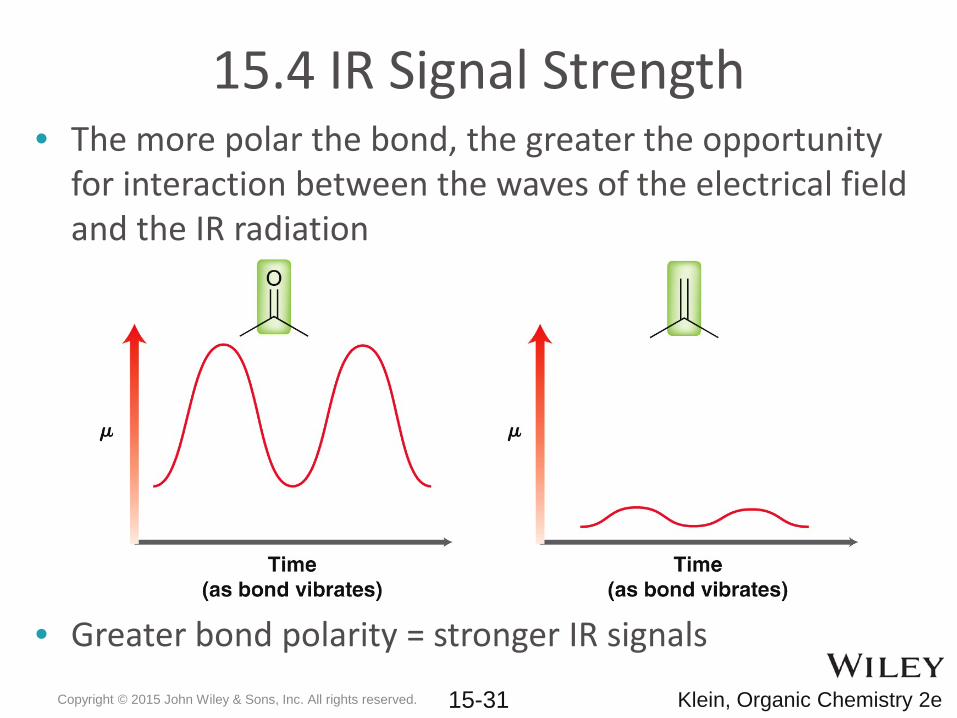
• The more polar the bond, the greater the opportunity for interaction between the waves of the electrical field and the IR radiation
• Greater bond polarity = stronger IR signals
15.4 IR Signal Strength
Copyright © 2015 John Wiley & Sons, Inc. All rights reserved. 15-31 Klein, Organic Chemistry 2e
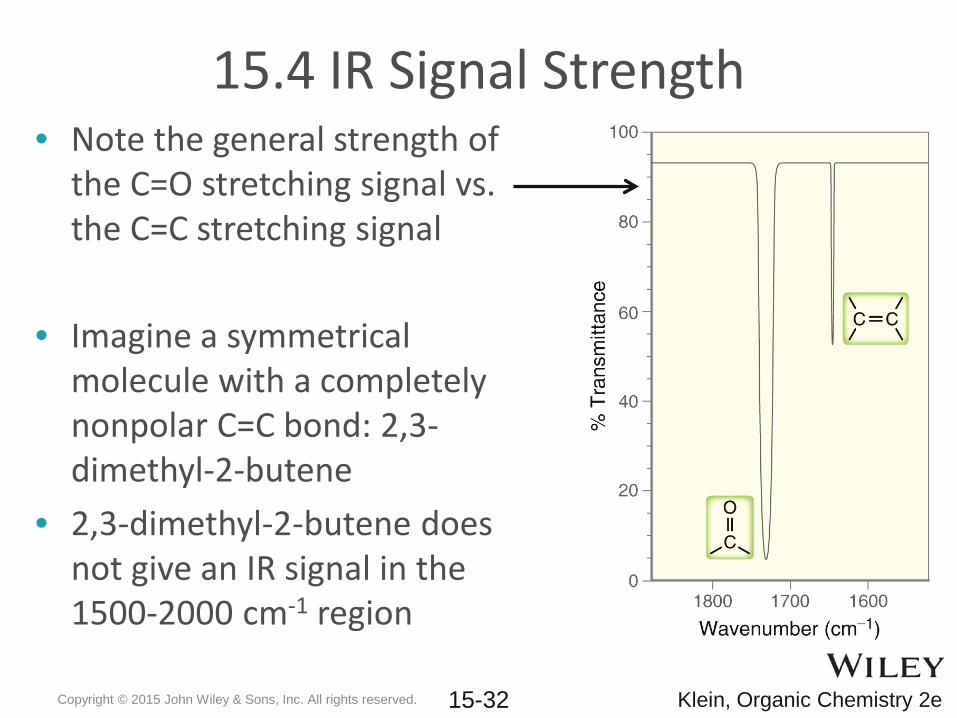
• Note the general strength of the C=O stretching signal vs. the C=C stretching signal
• Imagine a symmetrical molecule with a completely nonpolar C=C bond: 2,3-dimethyl-2-butene
• 2,3-dimethyl-2-butene does not give an IR signal in the 1500-2000 cm-1 region
15.4 IR Signal Strength
Copyright © 2015 John Wiley & Sons, Inc. All rights reserved. 15-32 Klein, Organic Chemistry 2e
• Stronger signals are also observed when there are multiple bonds of the same type vibrating
• Although C-H bonds are not very polar, they often give very strong signals, WHY?
• Because sample concentration can affect signal strength, the Intoxilyzer 5000 can be used to determine blood alcohol levels be analyzing the strength of C-H bond stretching in blood samples
• Practice with conceptual checkpoints 15.5 – 15.7
15.4 IR Signal Strength
Copyright © 2015 John Wiley & Sons, Inc. All rights reserved. 15-33 Klein, Organic Chemistry 2e
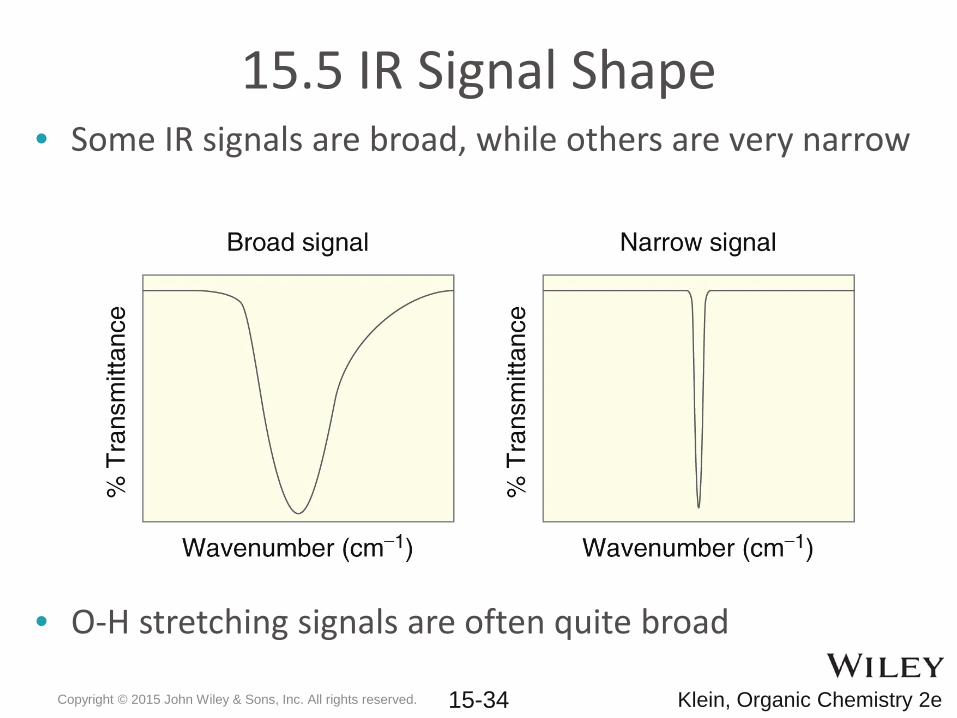
• Some IR signals are broad, while others are very narrow
• O-H stretching signals are often quite broad
15.5 IR Signal Shape
Copyright © 2015 John Wiley & Sons, Inc. All rights reserved. 15-34 Klein, Organic Chemistry 2e
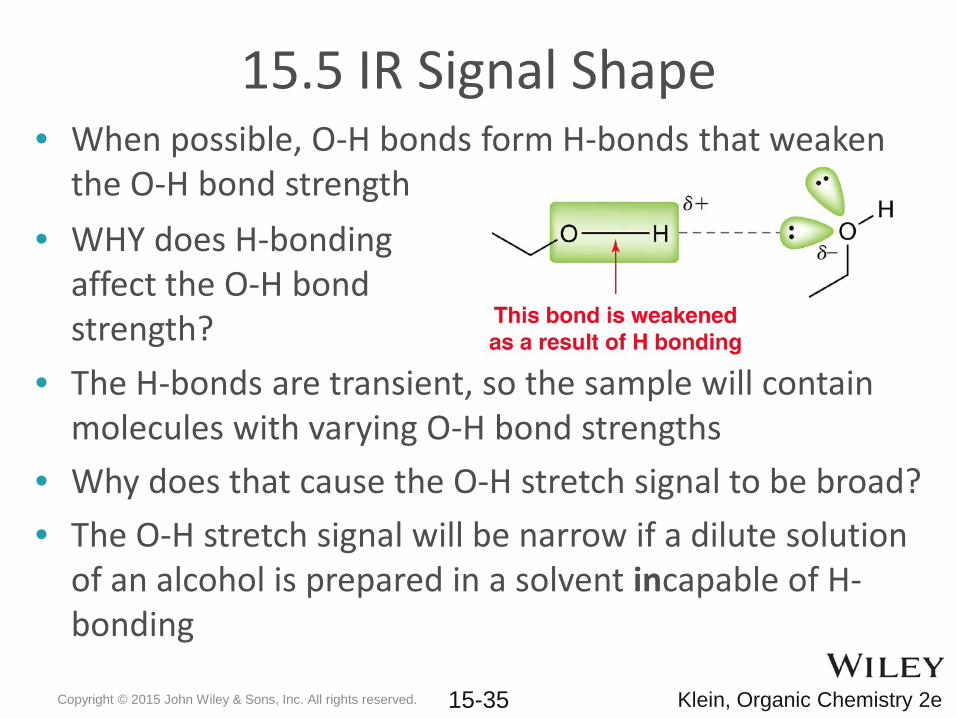
• When possible, O-H bonds form H-bonds that weaken the O-H bond strength
• The H-bonds are transient, so the sample will contain molecules with varying O-H bond strengths
• Why does that cause the O-H stretch signal to be broad?• The O-H stretch signal will be narrow if a dilute solution
of an alcohol is prepared in a solvent incapable of H-bonding
15.5 IR Signal Shape
• WHY does H-bonding affect the O-H bond strength?
Copyright © 2015 John Wiley & Sons, Inc. All rights reserved. 15-35 Klein, Organic Chemistry 2e
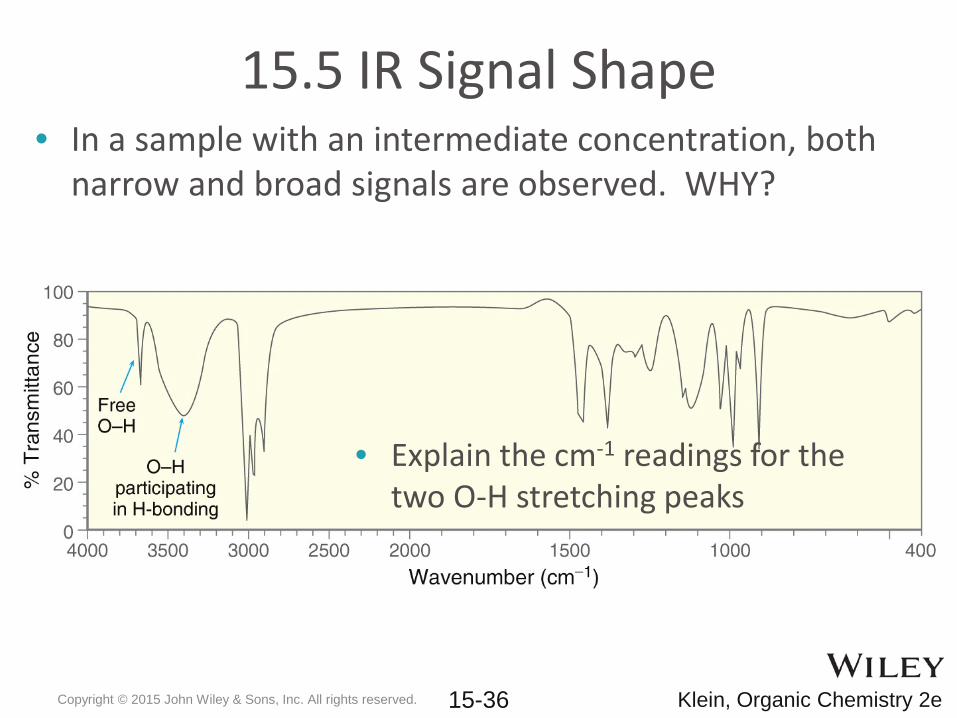
• In a sample with an intermediate concentration, both narrow and broad signals are observed. WHY?
15.5 IR Signal Shape
• Explain the cm-1 readings for the two O-H stretching peaks
Copyright © 2015 John Wiley & Sons, Inc. All rights reserved. 15-36 Klein, Organic Chemistry 2e

• Consider how broad the O-H stretch is for a carboxylic acid and how its wavenumber is around 3000 cm-1
rather than 3400 cm-1 for a typical O-H stretch
15.5 IR Signal Shape
Copyright © 2015 John Wiley & Sons, Inc. All rights reserved. 15-37 Klein, Organic Chemistry 2e
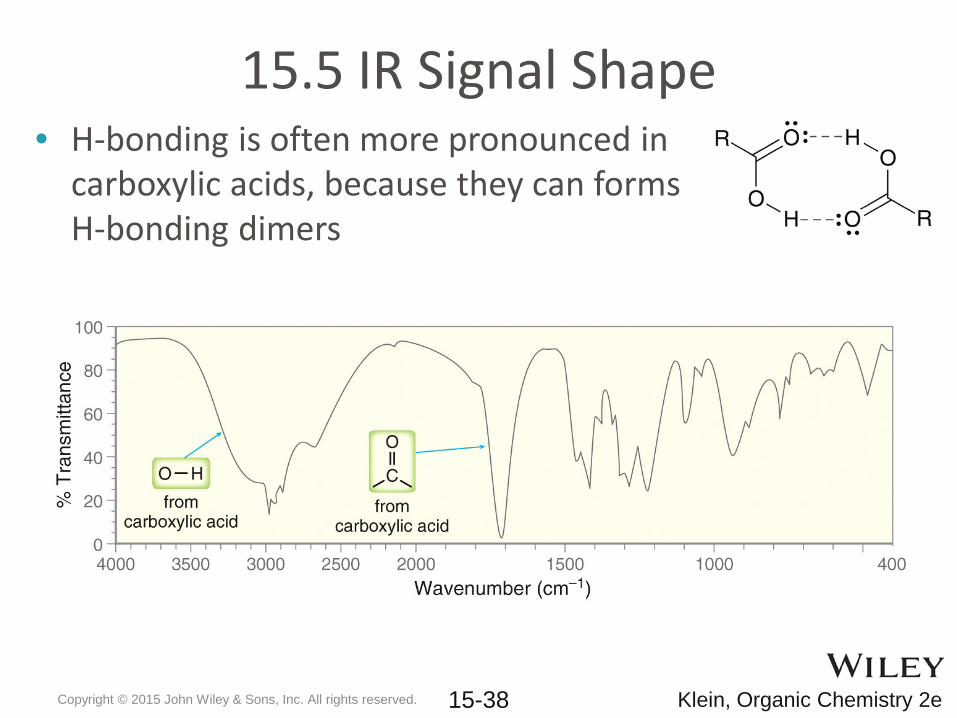
• H-bonding is often more pronounced in carboxylic acids, because they can forms H-bonding dimers
15.5 IR Signal Shape
Copyright © 2015 John Wiley & Sons, Inc. All rights reserved. 15-38 Klein, Organic Chemistry 2e
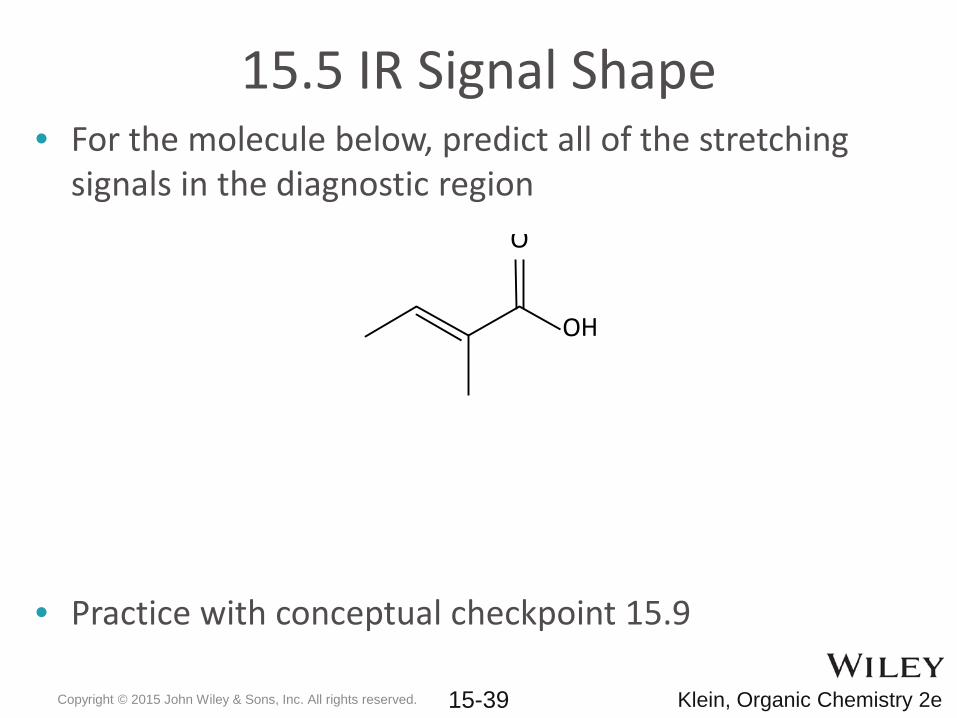
• For the molecule below, predict all of the stretching signals in the diagnostic region
• Practice with conceptual checkpoint 15.9
15.5 IR Signal Shape
O
OH
Copyright © 2015 John Wiley & Sons, Inc. All rights reserved. 15-39 Klein, Organic Chemistry 2e
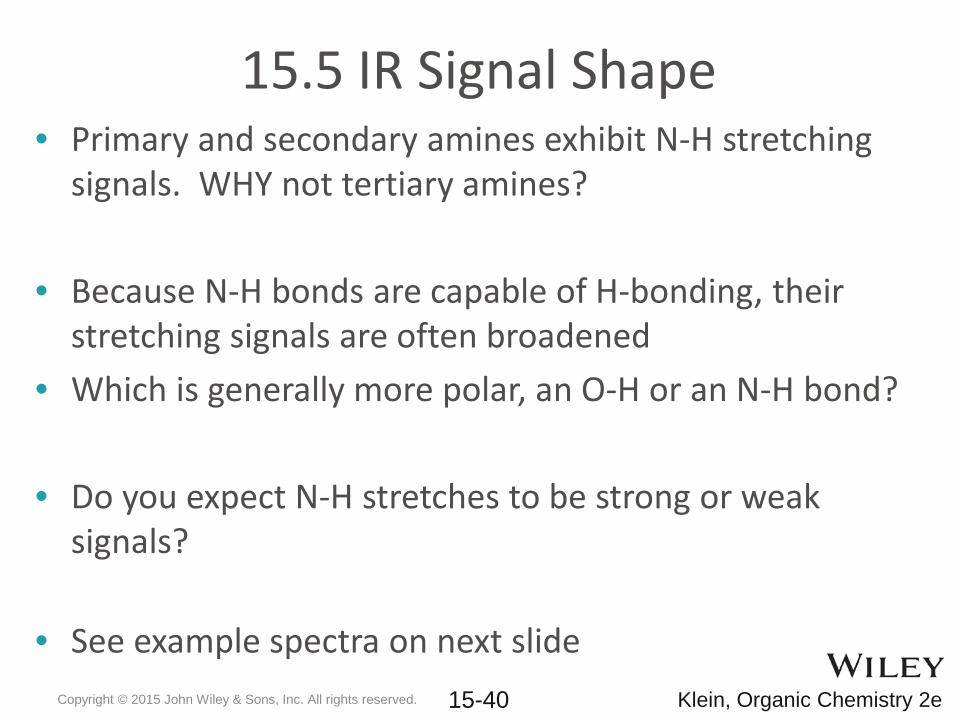
• Primary and secondary amines exhibit N-H stretching signals. WHY not tertiary amines?
• Because N-H bonds are capable of H-bonding, their stretching signals are often broadened
• Which is generally more polar, an O-H or an N-H bond?
• Do you expect N-H stretches to be strong or weak signals?
• See example spectra on next slide
15.5 IR Signal Shape
Copyright © 2015 John Wiley & Sons, Inc. All rights reserved. 15-40 Klein, Organic Chemistry 2e
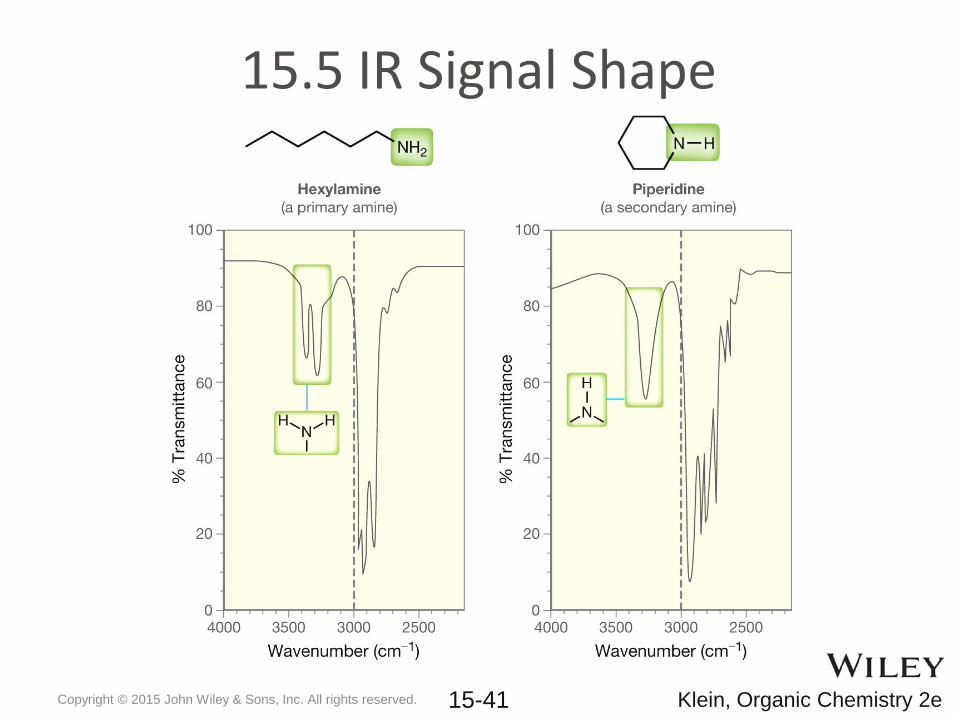
15.5 IR Signal Shape
Copyright © 2015 John Wiley & Sons, Inc. All rights reserved. 15-41 Klein, Organic Chemistry 2e
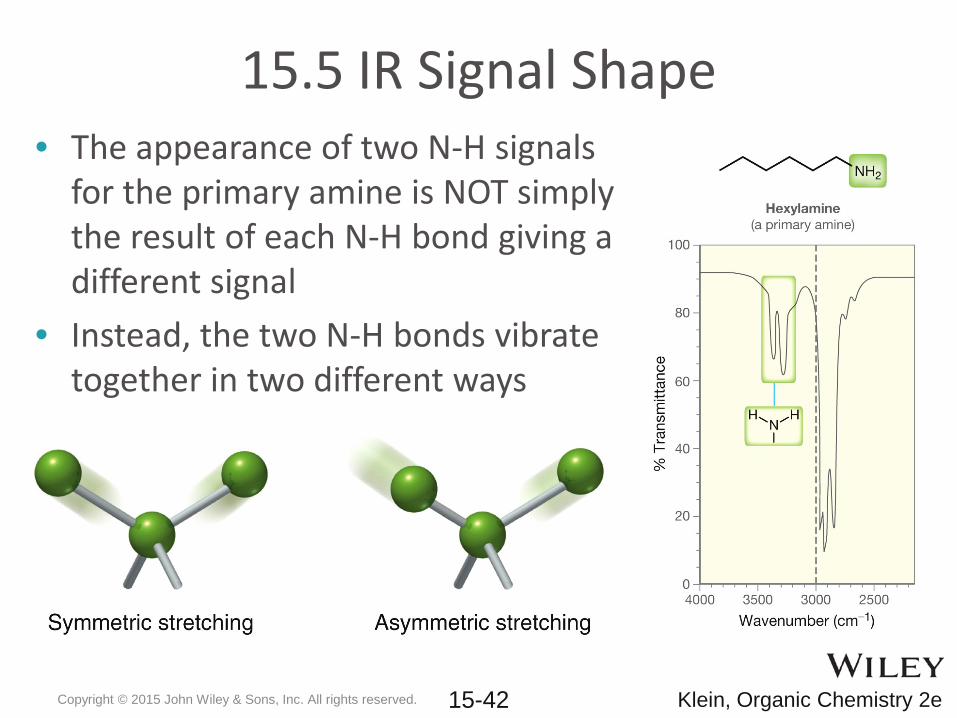
15.5 IR Signal Shape• The appearance of two N-H signals
for the primary amine is NOT simply the result of each N-H bond giving a different signal
• Instead, the two N-H bonds vibrate together in two different ways
Copyright © 2015 John Wiley & Sons, Inc. All rights reserved. 15-42 Klein, Organic Chemistry 2e
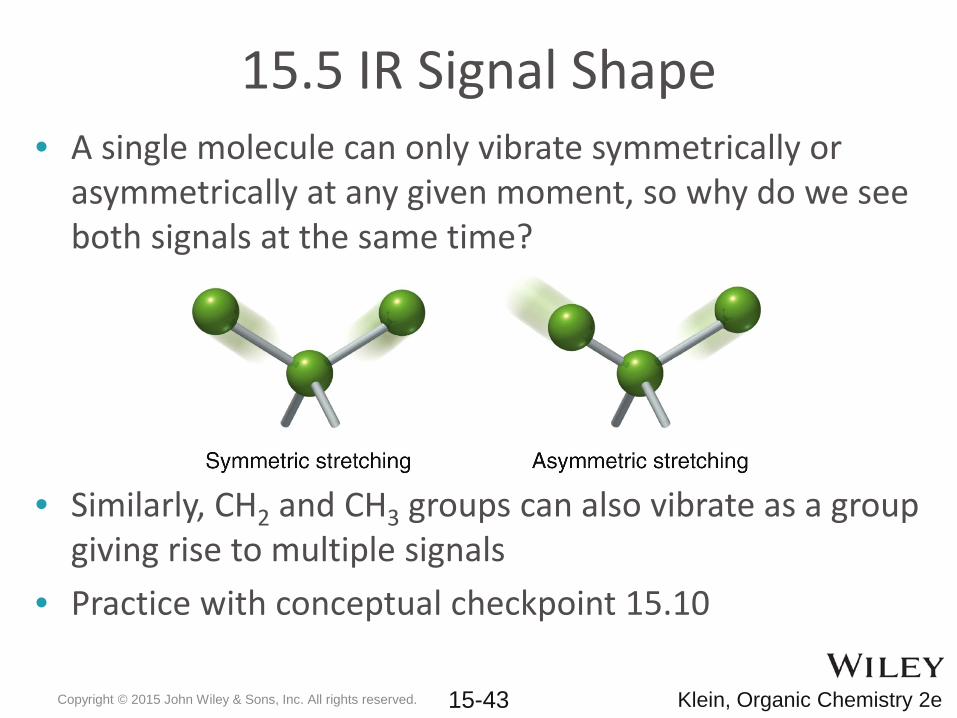
15.5 IR Signal Shape• A single molecule can only vibrate symmetrically or
asymmetrically at any given moment, so why do we see both signals at the same time?
• Similarly, CH2 and CH3 groups can also vibrate as a group giving rise to multiple signals
• Practice with conceptual checkpoint 15.10
Copyright © 2015 John Wiley & Sons, Inc. All rights reserved. 15-43 Klein, Organic Chemistry 2e
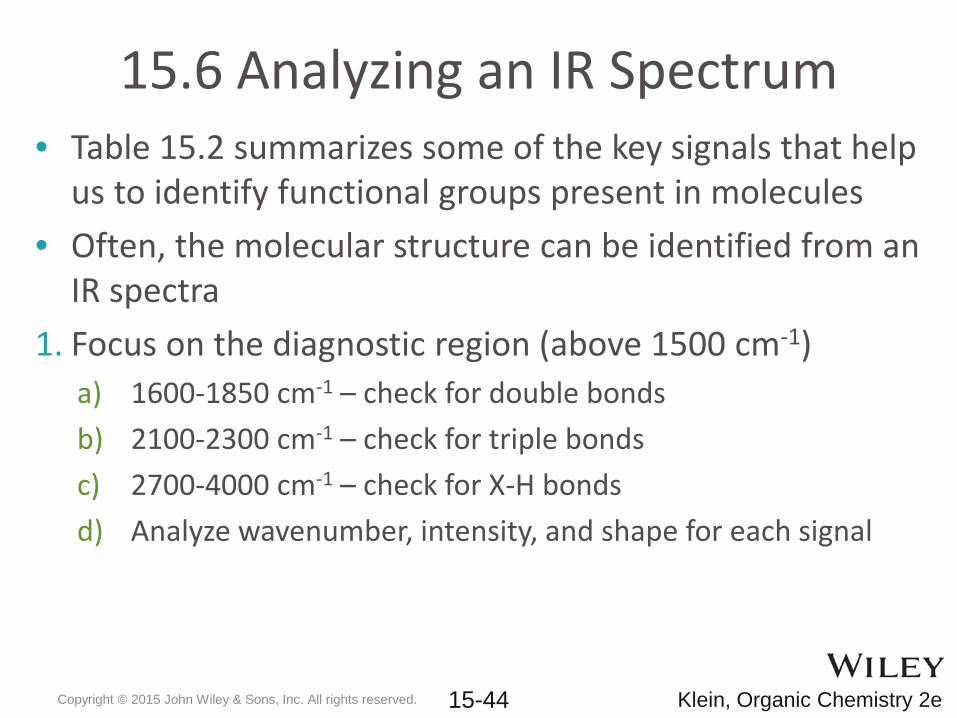
15.6 Analyzing an IR Spectrum• Table 15.2 summarizes some of the key signals that help
us to identify functional groups present in molecules• Often, the molecular structure can be identified from an
IR spectra1. Focus on the diagnostic region (above 1500 cm-1)
a) 1600-1850 cm-1 – check for double bondsb) 2100-2300 cm-1 – check for triple bondsc) 2700-4000 cm-1 – check for X-H bondsd) Analyze wavenumber, intensity, and shape for each signal
Copyright © 2015 John Wiley & Sons, Inc. All rights reserved. 15-44 Klein, Organic Chemistry 2e
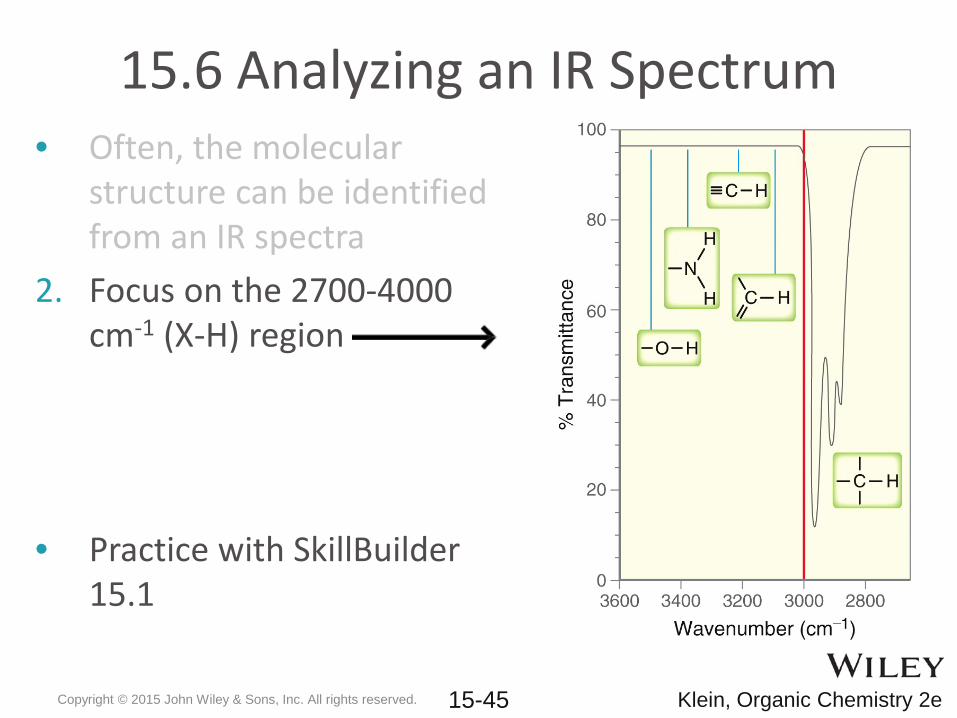
15.6 Analyzing an IR Spectrum• Often, the molecular
structure can be identified from an IR spectra
2. Focus on the 2700-4000 cm-1 (X-H) region
• Practice with SkillBuilder15.1
Copyright © 2015 John Wiley & Sons, Inc. All rights reserved. 15-45 Klein, Organic Chemistry 2e
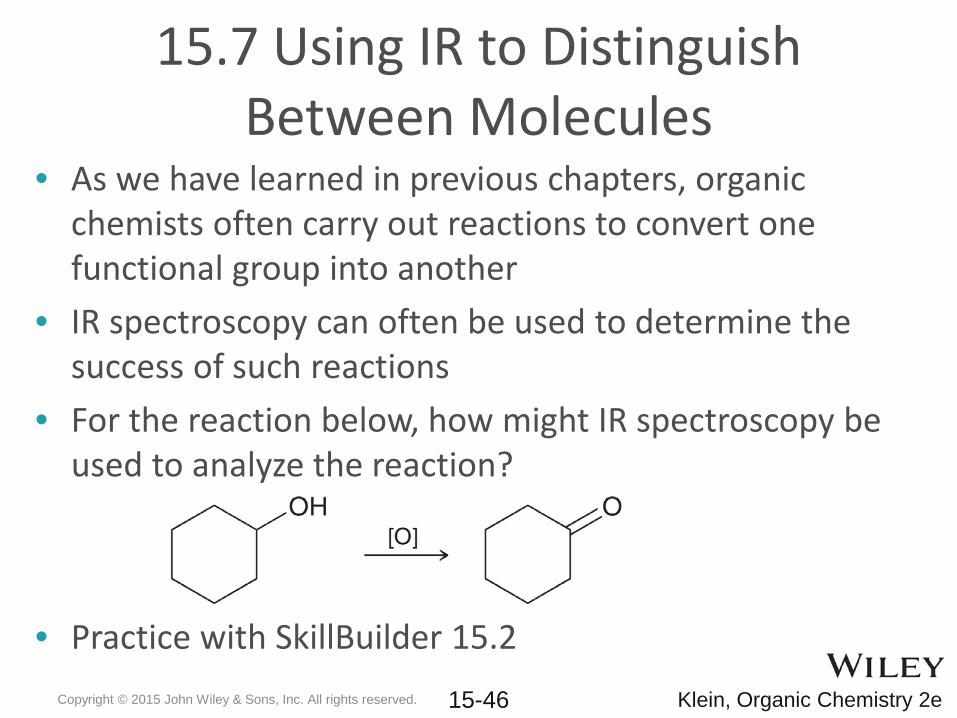
15.7 Using IR to Distinguish Between Molecules
• As we have learned in previous chapters, organic chemists often carry out reactions to convert one functional group into another
• IR spectroscopy can often be used to determine the success of such reactions
• For the reaction below, how might IR spectroscopy be used to analyze the reaction?
• Practice with SkillBuilder 15.2Copyright © 2015 John Wiley & Sons, Inc. All rights reserved. 15-46 Klein, Organic Chemistry 2e
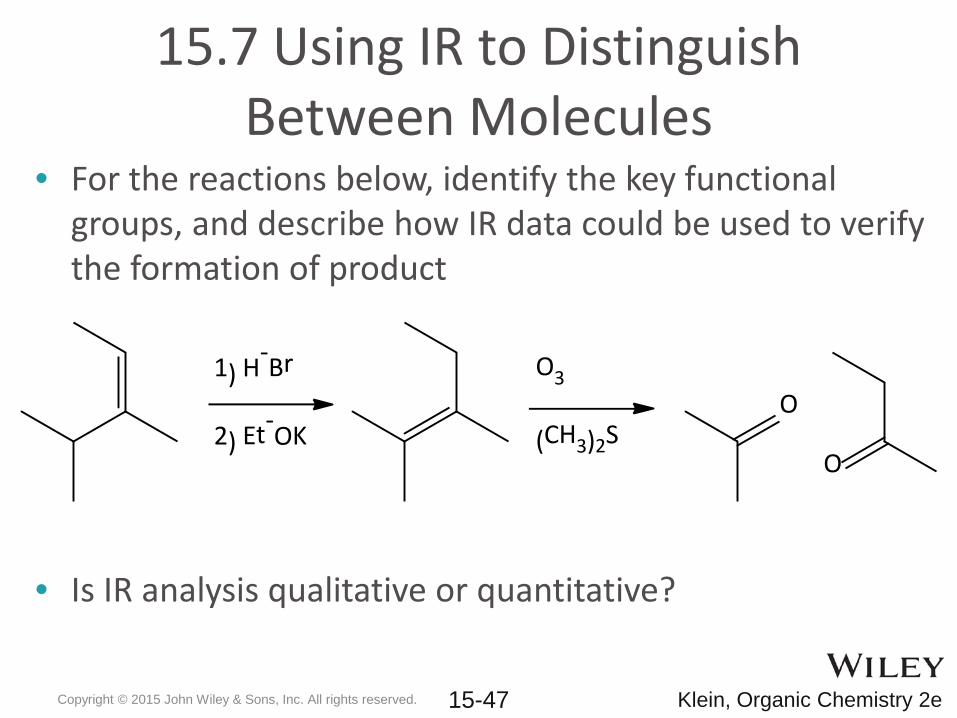
15.7 Using IR to Distinguish Between Molecules
• For the reactions below, identify the key functional groups, and describe how IR data could be used to verify the formation of product
• Is IR analysis qualitative or quantitative?
1) H-Br
2) Et-OK
O3
(CH3)2SO
O
Copyright © 2015 John Wiley & Sons, Inc. All rights reserved. 15-47 Klein, Organic Chemistry 2e
15.8 Into to Mass Spectrometry• Mass spectrometry is primarily used to determine the
molar mass and formula for a compound1. A compound is vaporized and then ionized2. The masses of the ions are detected and graphed
• Can you think of ways to get an organic molecule to ionize?
• Will the molecule need to absorb energy or release energy?
Copyright © 2015 John Wiley & Sons, Inc. All rights reserved. 15-48 Klein, Organic Chemistry 2e
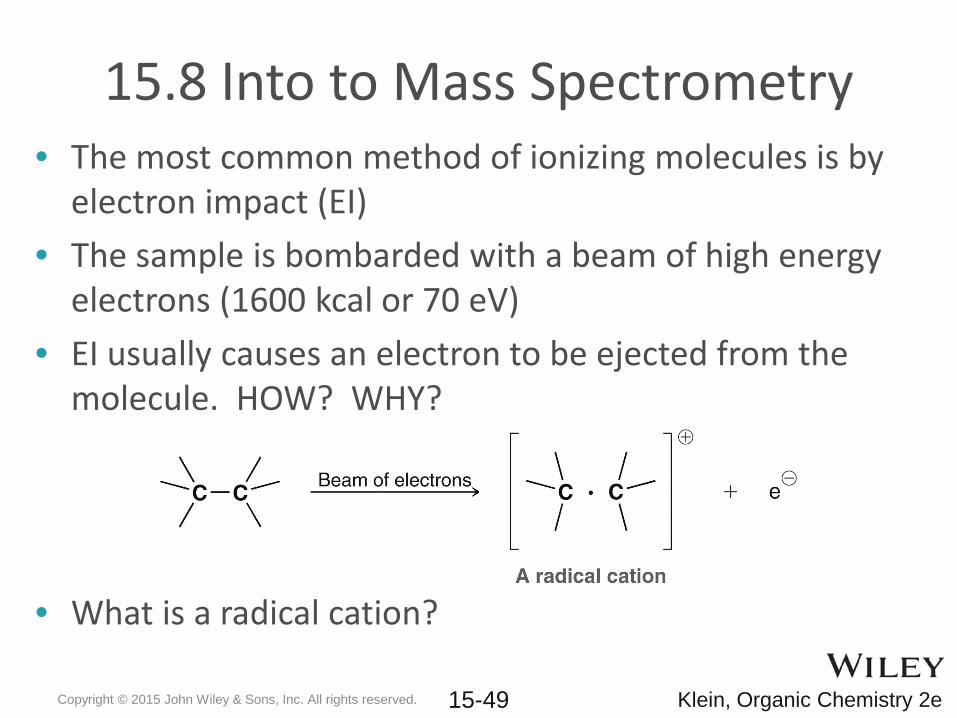
15.8 Into to Mass Spectrometry• The most common method of ionizing molecules is by
electron impact (EI)• The sample is bombarded with a beam of high energy
electrons (1600 kcal or 70 eV)• EI usually causes an electron to be ejected from the
molecule. HOW? WHY?
• What is a radical cation?
Copyright © 2015 John Wiley & Sons, Inc. All rights reserved. 15-49 Klein, Organic Chemistry 2e
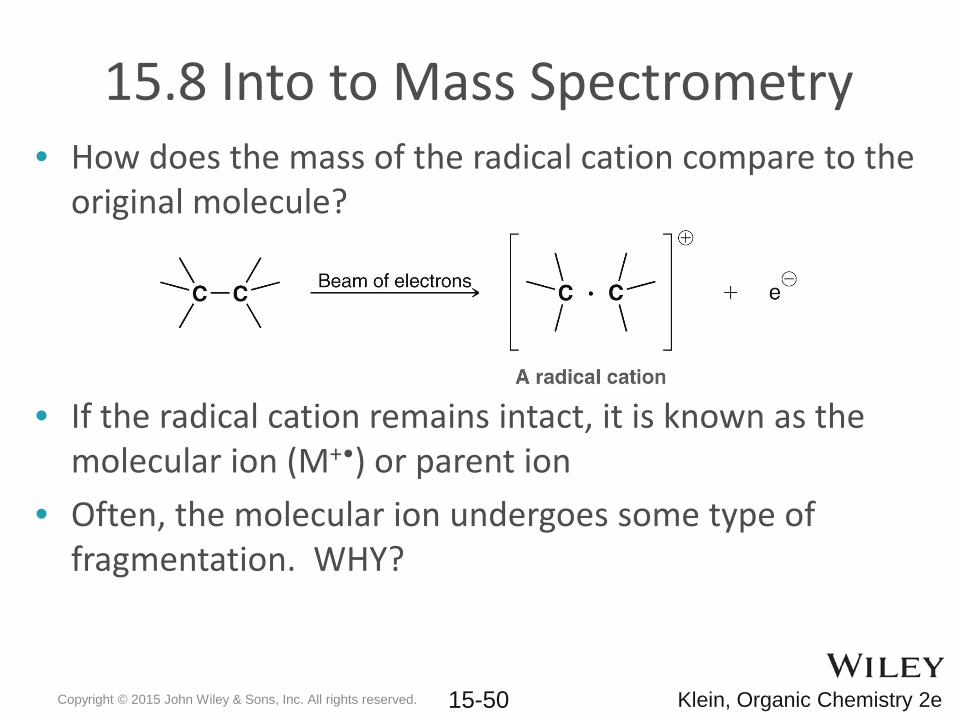
15.8 Into to Mass Spectrometry• How does the mass of the radical cation compare to the
original molecule?
• If the radical cation remains intact, it is known as the molecular ion (M+•) or parent ion
• Often, the molecular ion undergoes some type of fragmentation. WHY?
Copyright © 2015 John Wiley & Sons, Inc. All rights reserved. 15-50 Klein, Organic Chemistry 2e
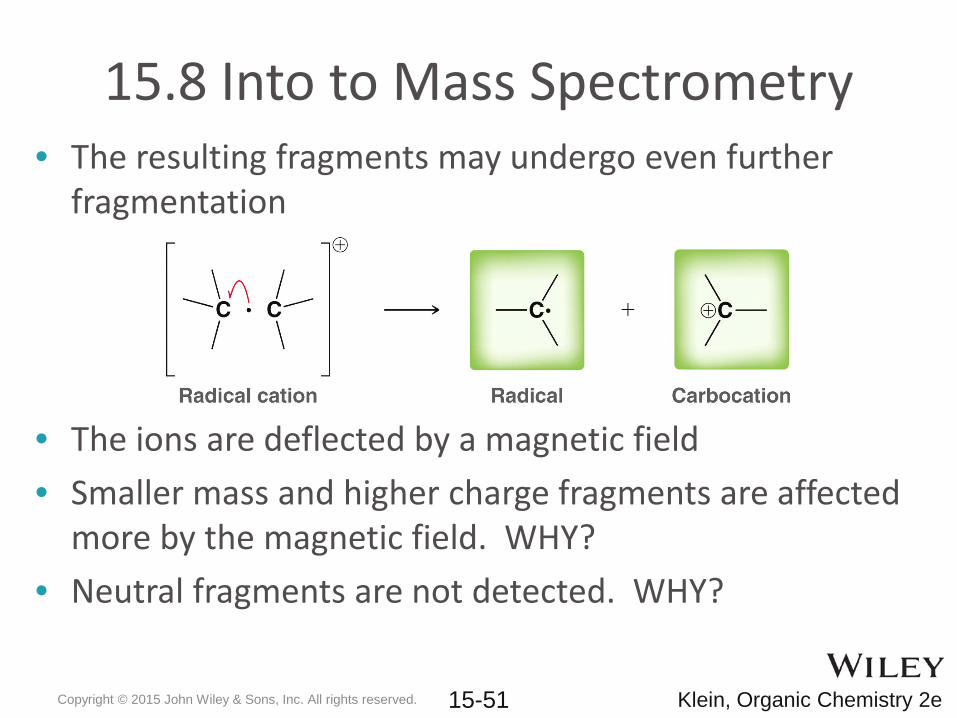
15.8 Into to Mass Spectrometry• The resulting fragments may undergo even further
fragmentation
• The ions are deflected by a magnetic field • Smaller mass and higher charge fragments are affected
more by the magnetic field. WHY?• Neutral fragments are not detected. WHY?
Copyright © 2015 John Wiley & Sons, Inc. All rights reserved. 15-51 Klein, Organic Chemistry 2e
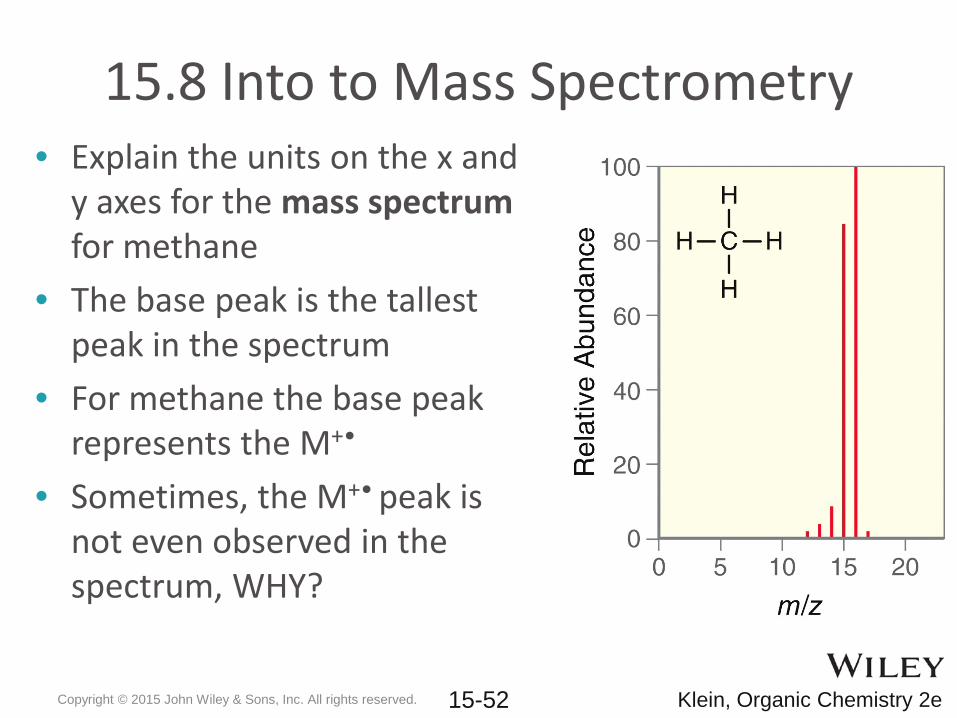
15.8 Into to Mass Spectrometry• Explain the units on the x and
y axes for the mass spectrumfor methane
• The base peak is the tallest peak in the spectrum
• For methane the base peak represents the M+•
• Sometimes, the M+• peak is not even observed in the spectrum, WHY?
Copyright © 2015 John Wiley & Sons, Inc. All rights reserved. 15-52 Klein, Organic Chemistry 2e
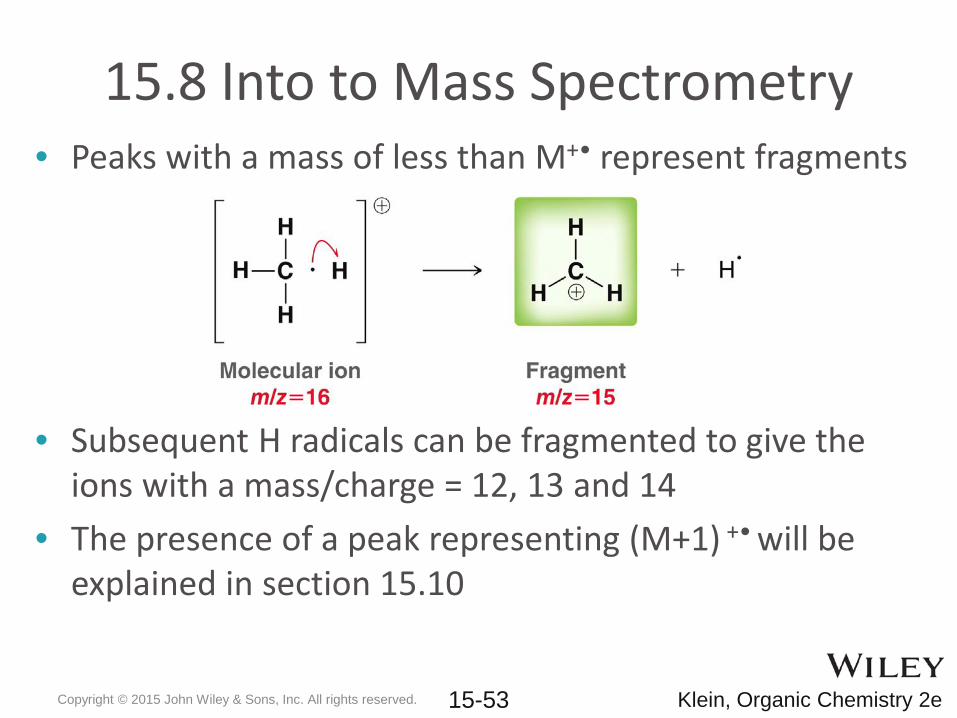
15.8 Into to Mass Spectrometry• Peaks with a mass of less than M+• represent fragments
• Subsequent H radicals can be fragmented to give the ions with a mass/charge = 12, 13 and 14
• The presence of a peak representing (M+1) +• will be explained in section 15.10
Copyright © 2015 John Wiley & Sons, Inc. All rights reserved. 15-53 Klein, Organic Chemistry 2e
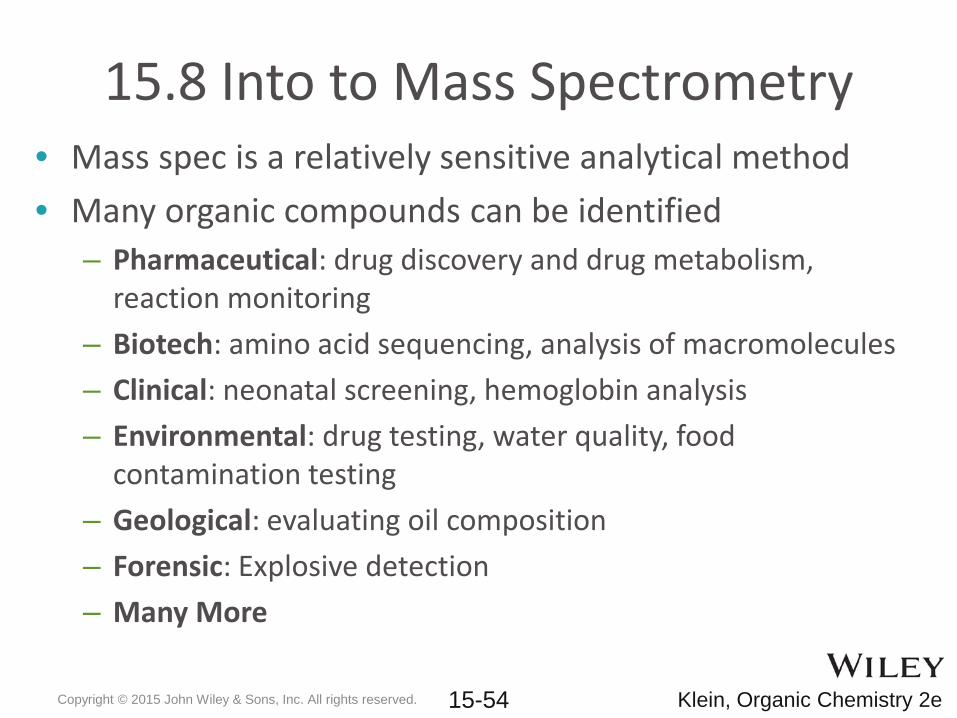
15.8 Into to Mass Spectrometry• Mass spec is a relatively sensitive analytical method• Many organic compounds can be identified
– Pharmaceutical: drug discovery and drug metabolism, reaction monitoring
– Biotech: amino acid sequencing, analysis of macromolecules– Clinical: neonatal screening, hemoglobin analysis– Environmental: drug testing, water quality, food
contamination testing– Geological: evaluating oil composition– Forensic: Explosive detection– Many More
Copyright © 2015 John Wiley & Sons, Inc. All rights reserved. 15-54 Klein, Organic Chemistry 2e
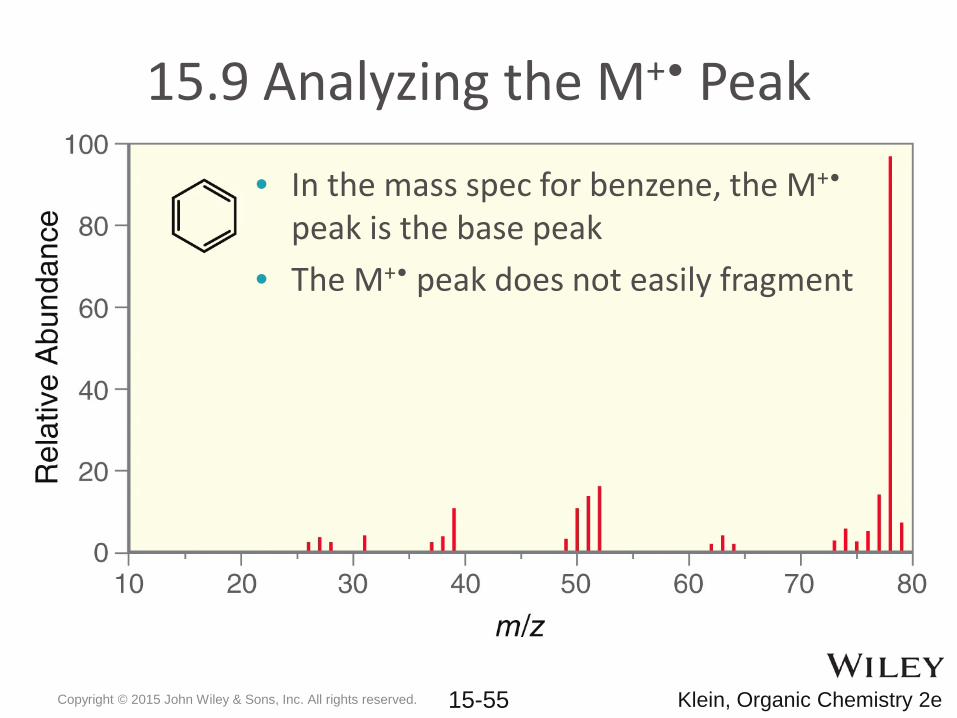
15.9 Analyzing the M+• Peak
• In the mass spec for benzene, the M+•
peak is the base peak• The M+• peak does not easily fragment
Copyright © 2015 John Wiley & Sons, Inc. All rights reserved. 15-55 Klein, Organic Chemistry 2e
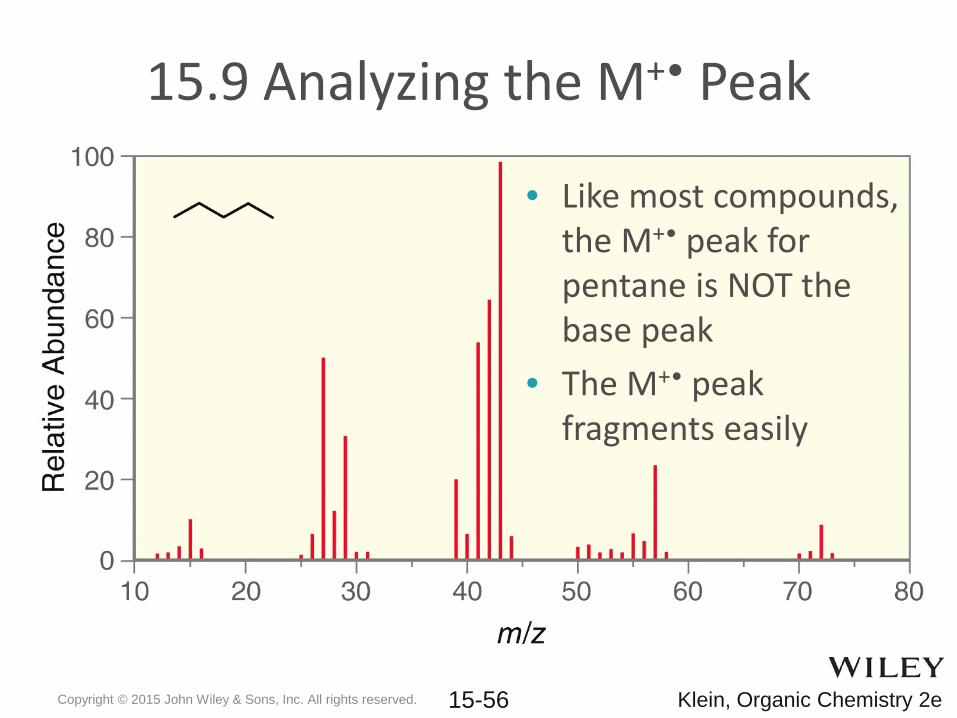
15.9 Analyzing the M+• Peak
• Like most compounds, the M+• peak for pentane is NOT the base peak
• The M+• peak fragments easily
Copyright © 2015 John Wiley & Sons, Inc. All rights reserved. 15-56 Klein, Organic Chemistry 2e
15.9 Analyzing the M+• Peak• The first step in analyzing a mass spec is to identify the
M+• peak– It will tell you the molar mass of the compound– An odd massed M+• peak MAY indicate an odd number of N
atoms in the molecule– An even massed M+• peak MAY indicate an even number of N
atoms or zero N atoms in the molecule
• Give an alternative explanation for a M+• peak with an odd mass
• Practice with conceptual checkpoint 15.19
Copyright © 2015 John Wiley & Sons, Inc. All rights reserved. 15-57 Klein, Organic Chemistry 2e
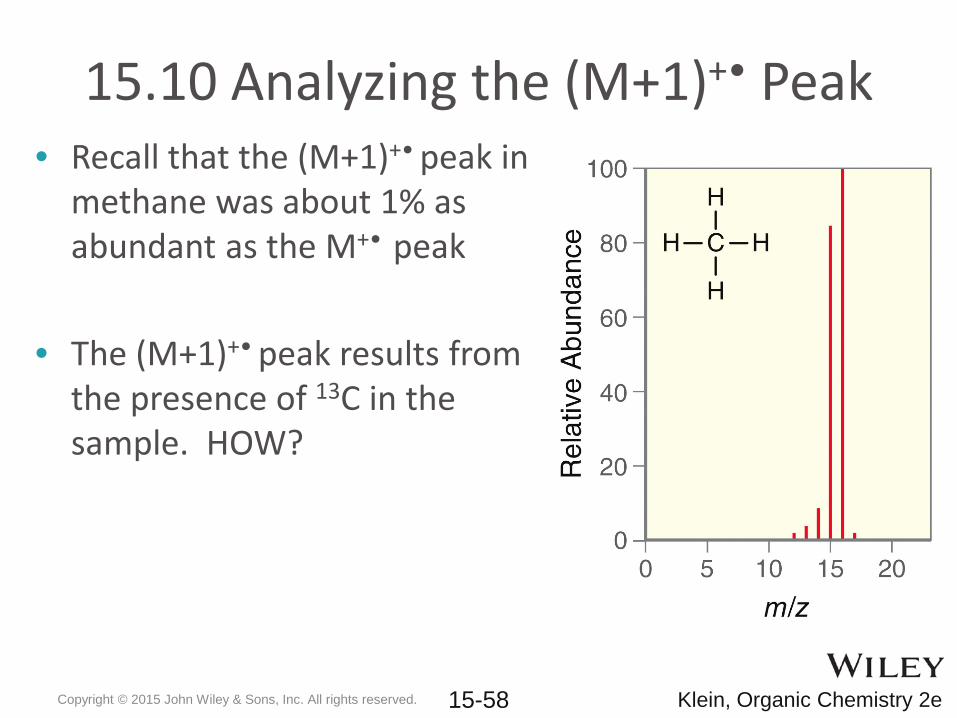
15.10 Analyzing the (M+1)+• Peak• Recall that the (M+1)+• peak in
methane was about 1% as abundant as the M+• peak
• The (M+1)+• peak results from the presence of 13C in the sample. HOW?
Copyright © 2015 John Wiley & Sons, Inc. All rights reserved. 15-58 Klein, Organic Chemistry 2e
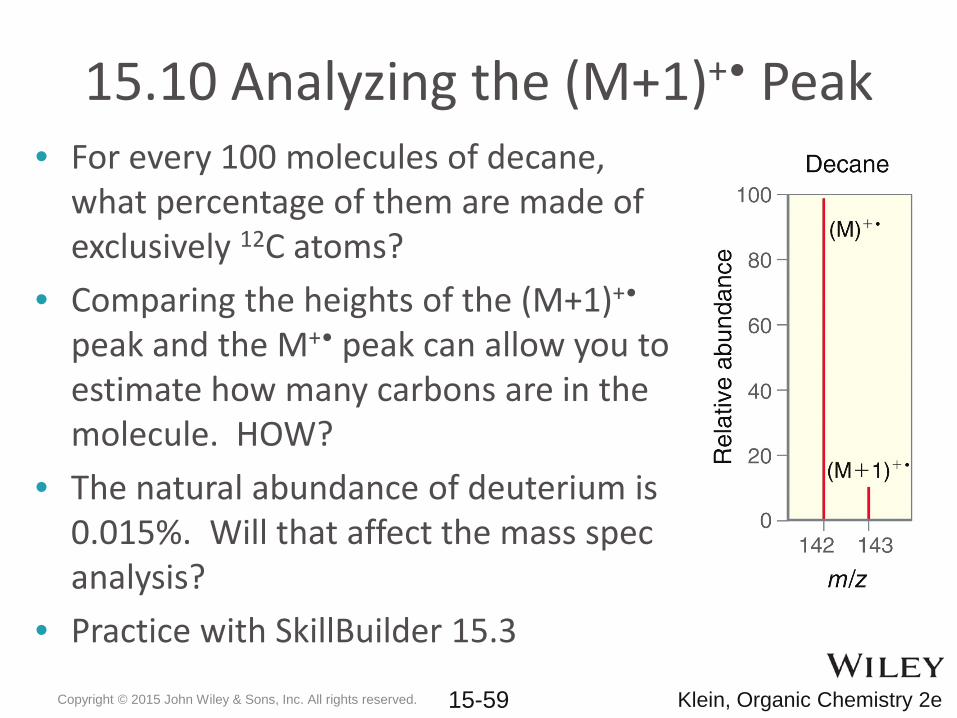
15.10 Analyzing the (M+1)+• Peak• For every 100 molecules of decane,
what percentage of them are made of exclusively 12C atoms?
• Comparing the heights of the (M+1)+•
peak and the M+• peak can allow you to estimate how many carbons are in the molecule. HOW?
• The natural abundance of deuterium is 0.015%. Will that affect the mass spec analysis?
• Practice with SkillBuilder 15.3
Copyright © 2015 John Wiley & Sons, Inc. All rights reserved. 15-59 Klein, Organic Chemistry 2e
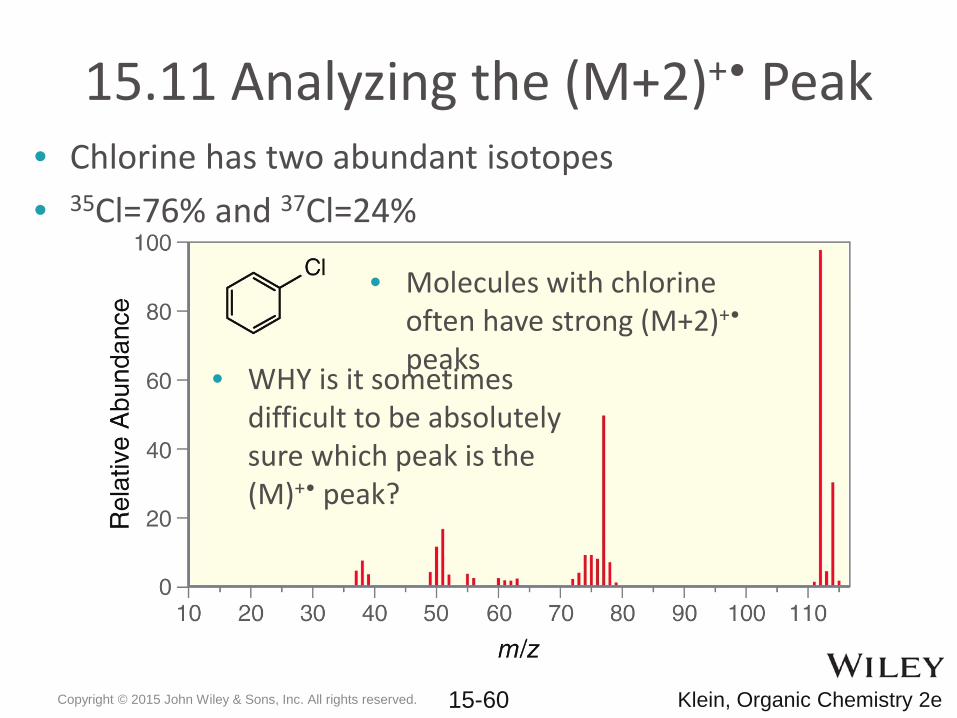
15.11 Analyzing the (M+2)+• Peak• Chlorine has two abundant isotopes• 35Cl=76% and 37Cl=24%
• Molecules with chlorine often have strong (M+2)+•
peaks• WHY is it sometimes difficult to be absolutely sure which peak is the (M)+• peak?
Copyright © 2015 John Wiley & Sons, Inc. All rights reserved. 15-60 Klein, Organic Chemistry 2e
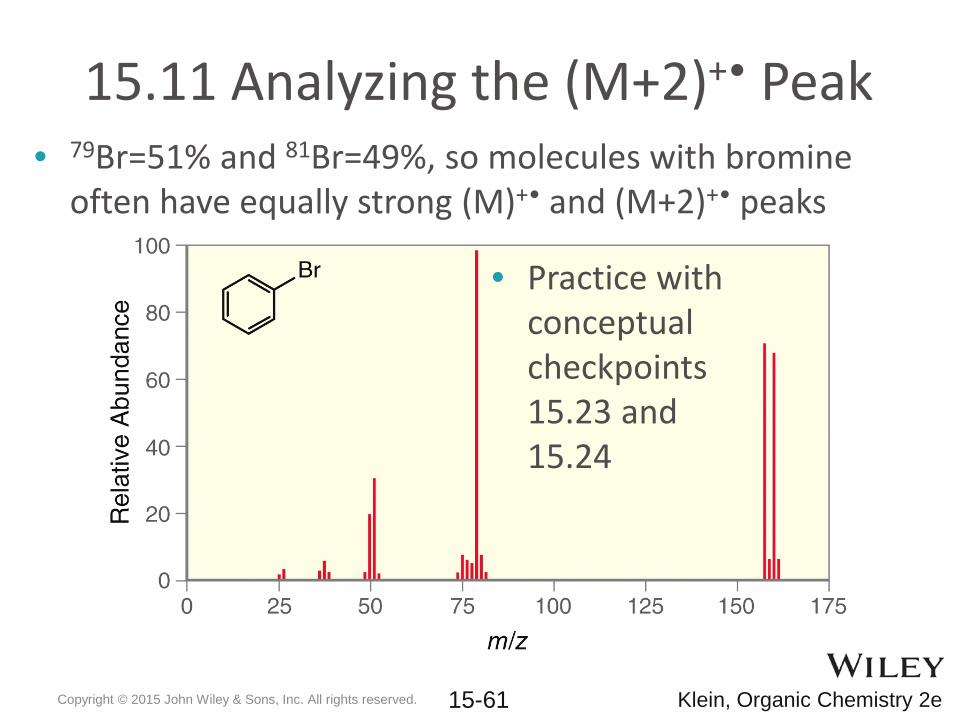
15.11 Analyzing the (M+2)+• Peak• 79Br=51% and 81Br=49%, so molecules with bromine
often have equally strong (M)+• and (M+2)+• peaks
• Practice with conceptual checkpoints 15.23 and 15.24
Copyright © 2015 John Wiley & Sons, Inc. All rights reserved. 15-61 Klein, Organic Chemistry 2e
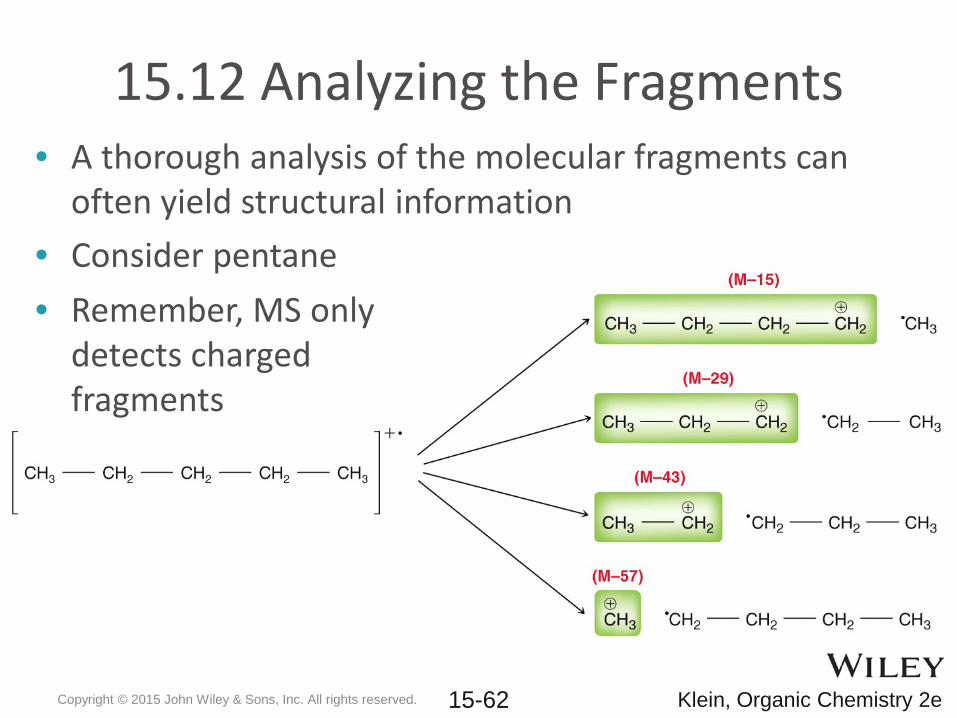
15.12 Analyzing the Fragments• A thorough analysis of the molecular fragments can
often yield structural information• Consider pentane• Remember, MS only
detects charged fragments
Copyright © 2015 John Wiley & Sons, Inc. All rights reserved. 15-62 Klein, Organic Chemistry 2e
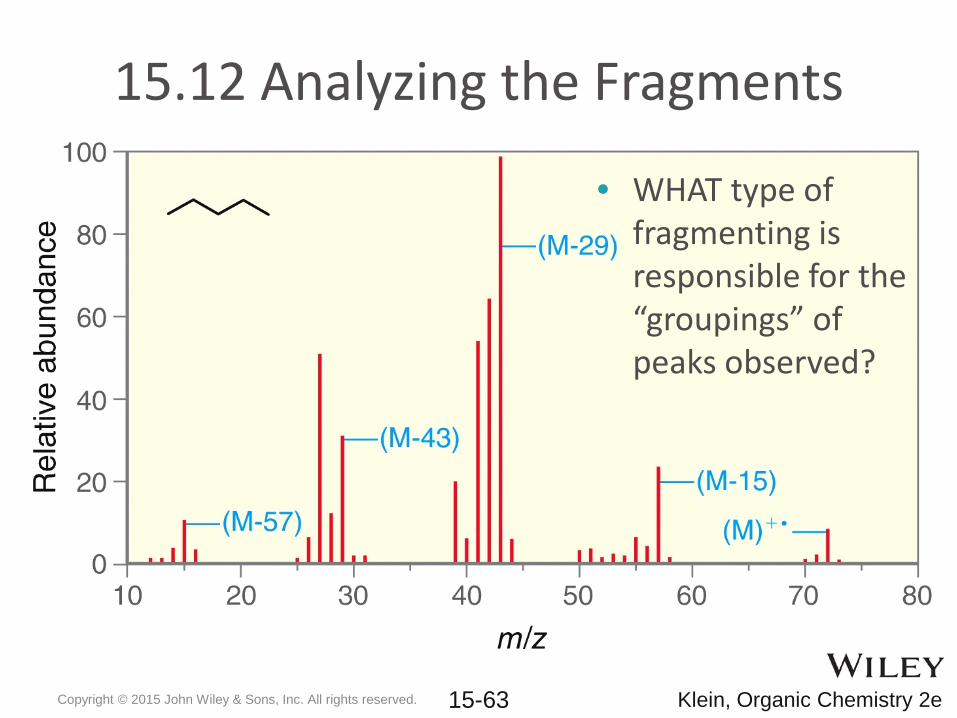
15.12 Analyzing the Fragments
• WHAT type of fragmenting is responsible for the “groupings” of peaks observed?
Copyright © 2015 John Wiley & Sons, Inc. All rights reserved. 15-63 Klein, Organic Chemistry 2e
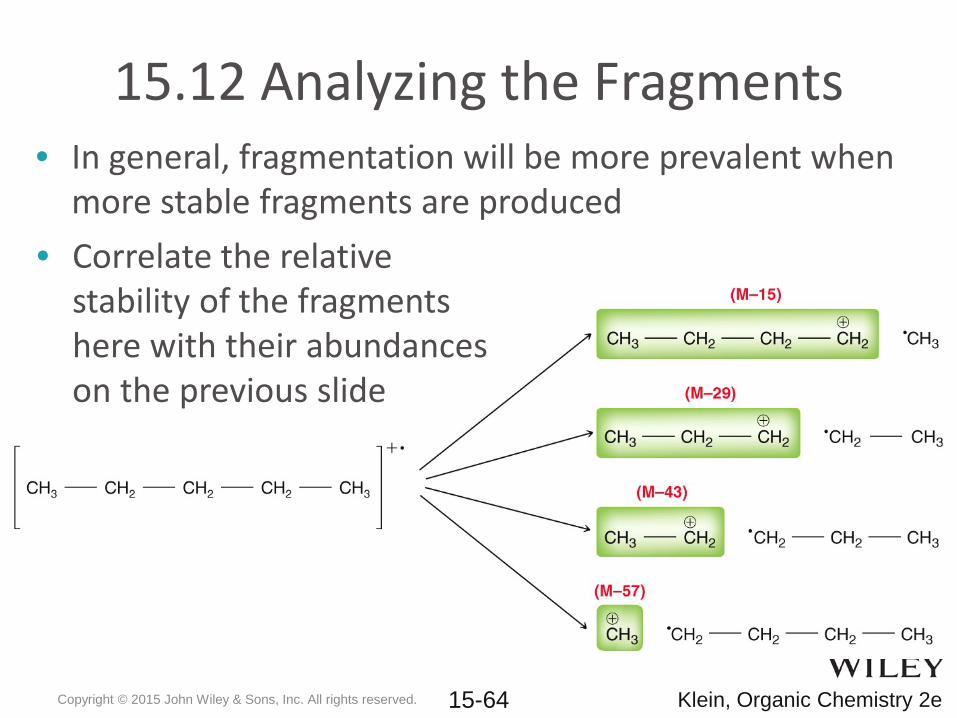
15.12 Analyzing the Fragments• In general, fragmentation will be more prevalent when
more stable fragments are produced• Correlate the relative
stability of the fragments here with their abundances on the previous slide
Copyright © 2015 John Wiley & Sons, Inc. All rights reserved. 15-64 Klein, Organic Chemistry 2e
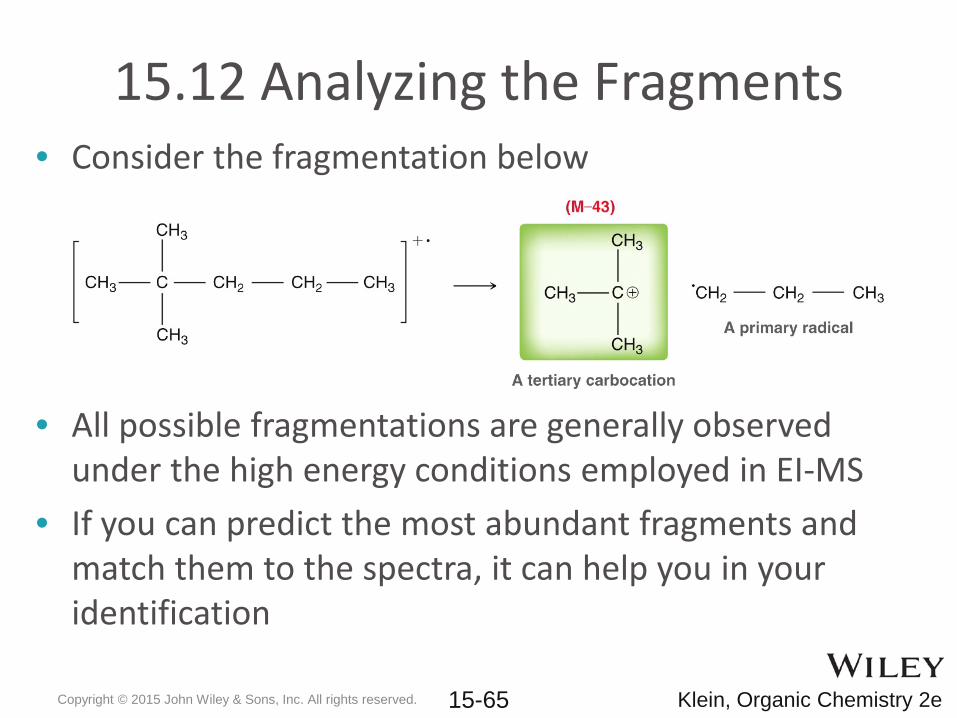
15.12 Analyzing the Fragments• Consider the fragmentation below
• All possible fragmentations are generally observed under the high energy conditions employed in EI-MS
• If you can predict the most abundant fragments and match them to the spectra, it can help you in your identification
Copyright © 2015 John Wiley & Sons, Inc. All rights reserved. 15-65 Klein, Organic Chemistry 2e
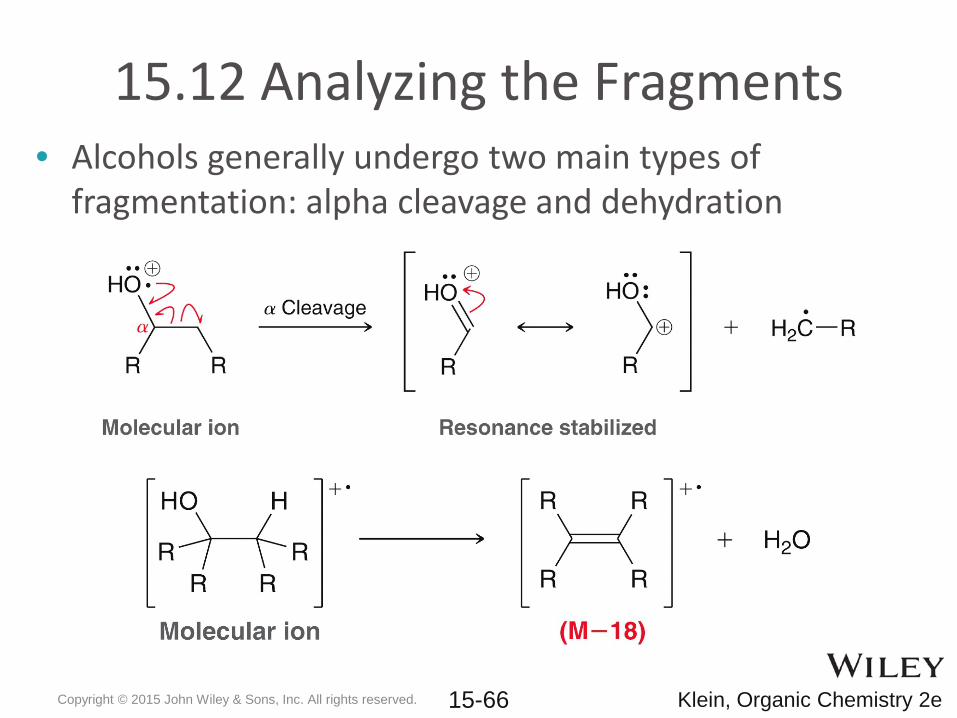
15.12 Analyzing the Fragments• Alcohols generally undergo two main types of
fragmentation: alpha cleavage and dehydration
Copyright © 2015 John Wiley & Sons, Inc. All rights reserved. 15-66 Klein, Organic Chemistry 2e
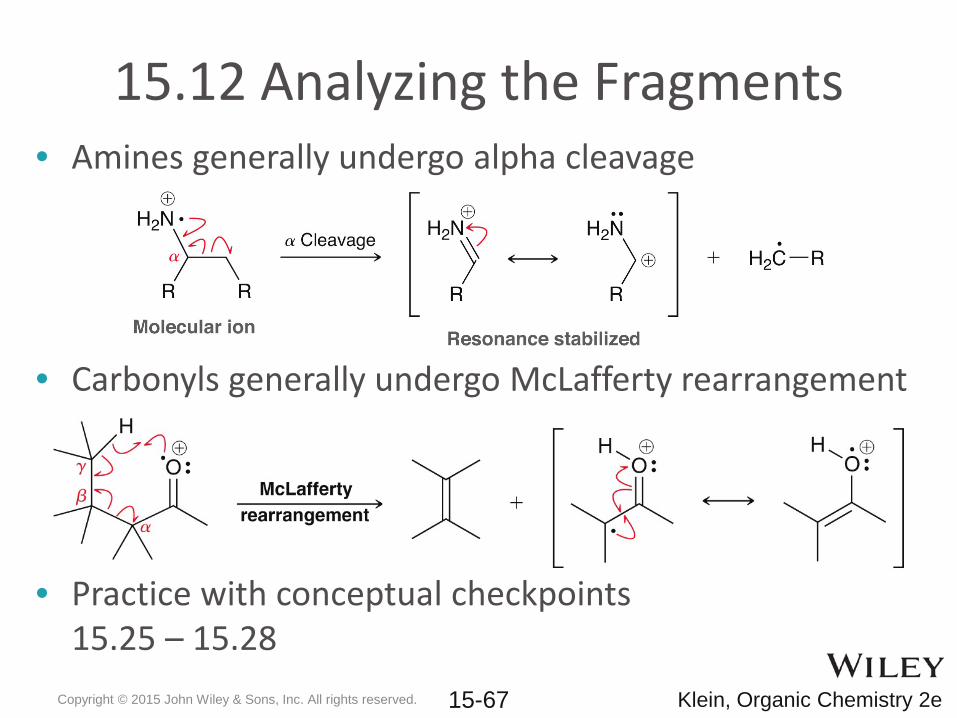
15.12 Analyzing the Fragments• Amines generally undergo alpha cleavage
• Carbonyls generally undergo McLafferty rearrangement
• Practice with conceptual checkpoints 15.25 – 15.28
Copyright © 2015 John Wiley & Sons, Inc. All rights reserved. 15-67 Klein, Organic Chemistry 2e
15.13 High Resolution Mass Spec• High Resolution Mass Spectrometry allows m/z to be
measured with up to 4 decimal places• Masses are generally not whole number integers
– 1 proton = 1.0073 amu and 1 neutron = 1.0086 amu
• One 12C atom = exactly 12.0000 amu, because the amuscale is based on the mass of 12C
• All atoms other than 12C will have a mass in amu that can be measured to 4 decimal places by a high-resolution mass spec instrument
Copyright © 2015 John Wiley & Sons, Inc. All rights reserved. 15-68 Klein, Organic Chemistry 2e
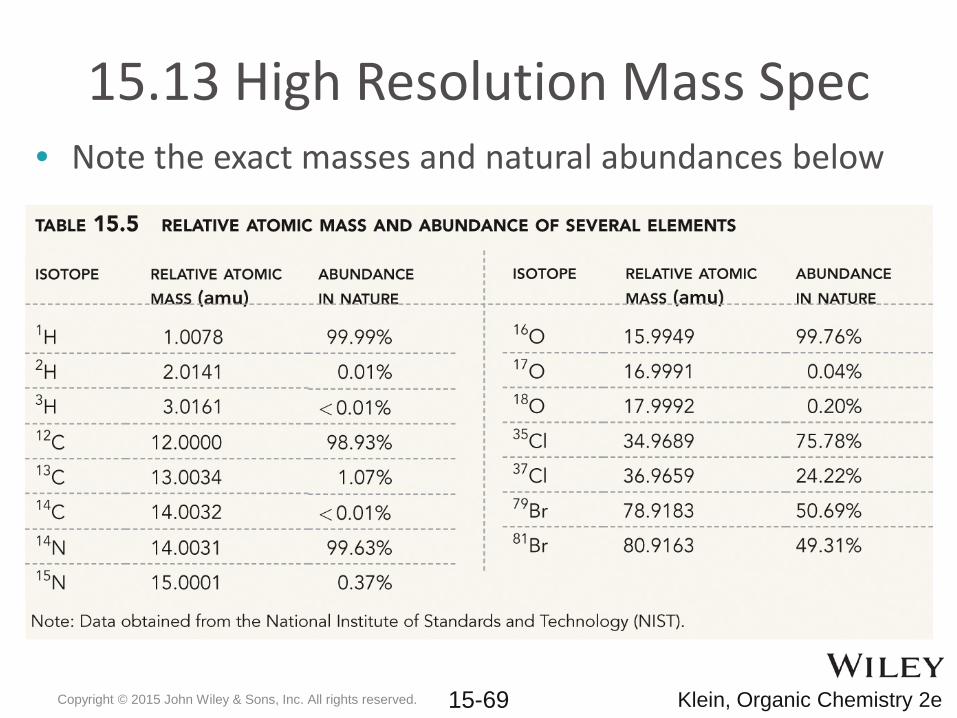
15.13 High Resolution Mass Spec• Note the exact masses and natural abundances below
Copyright © 2015 John Wiley & Sons, Inc. All rights reserved. 15-69 Klein, Organic Chemistry 2e
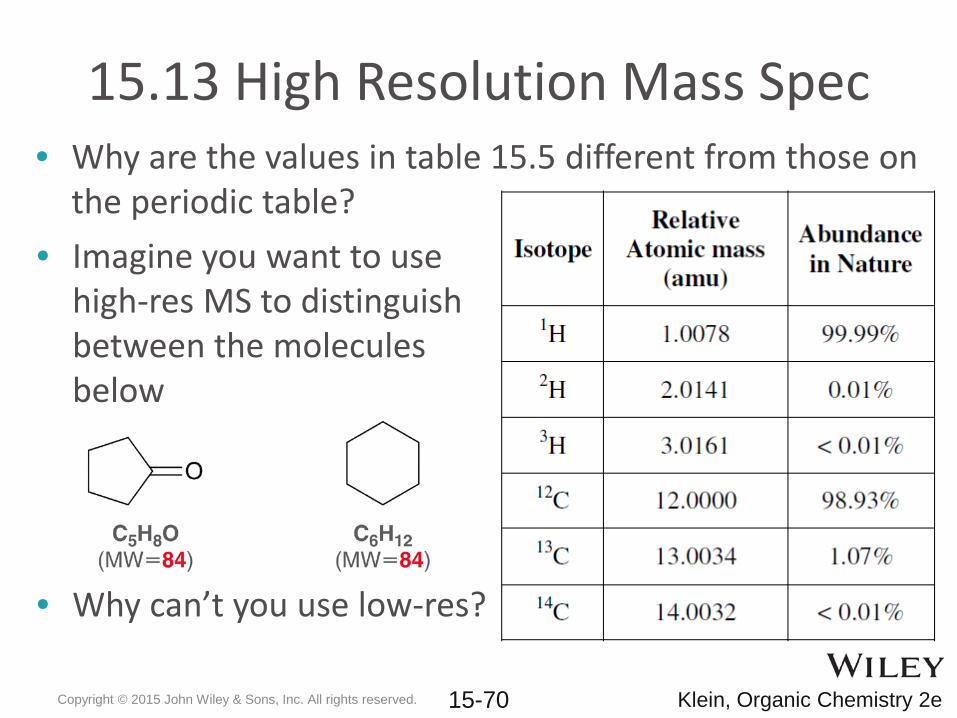
15.13 High Resolution Mass Spec• Why are the values in table 15.5 different from those on
the periodic table?• Imagine you want to use
high-res MS to distinguish between the molecules below
• Why can’t you use low-res?
Copyright © 2015 John Wiley & Sons, Inc. All rights reserved. 15-70 Klein, Organic Chemistry 2e
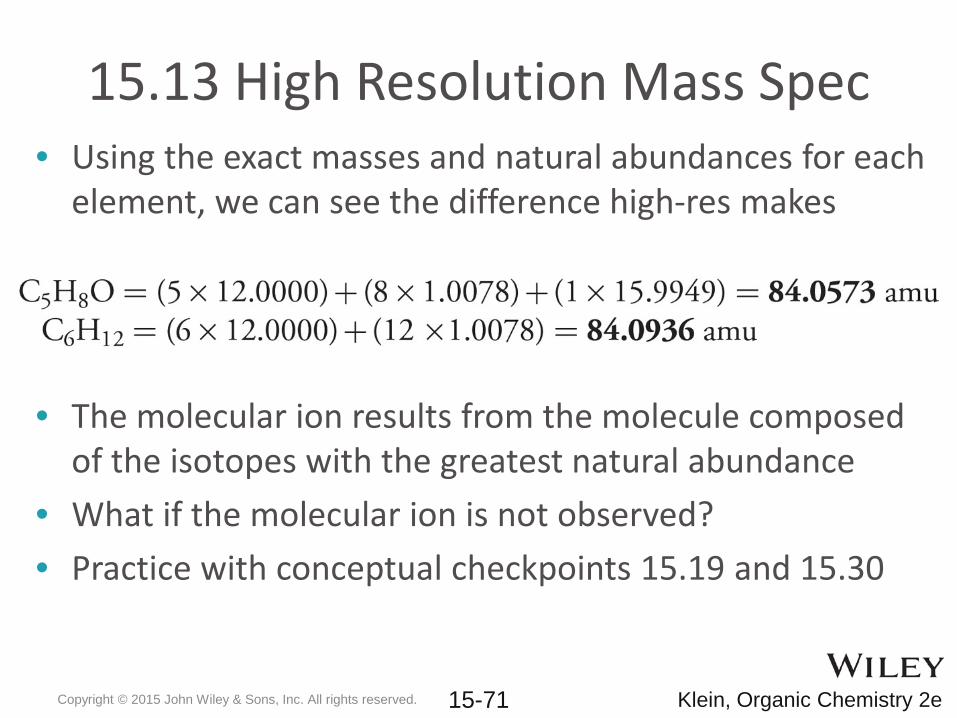
15.13 High Resolution Mass Spec• Using the exact masses and natural abundances for each
element, we can see the difference high-res makes
• The molecular ion results from the molecule composed of the isotopes with the greatest natural abundance
• What if the molecular ion is not observed?• Practice with conceptual checkpoints 15.19 and 15.30
Copyright © 2015 John Wiley & Sons, Inc. All rights reserved. 15-71 Klein, Organic Chemistry 2e
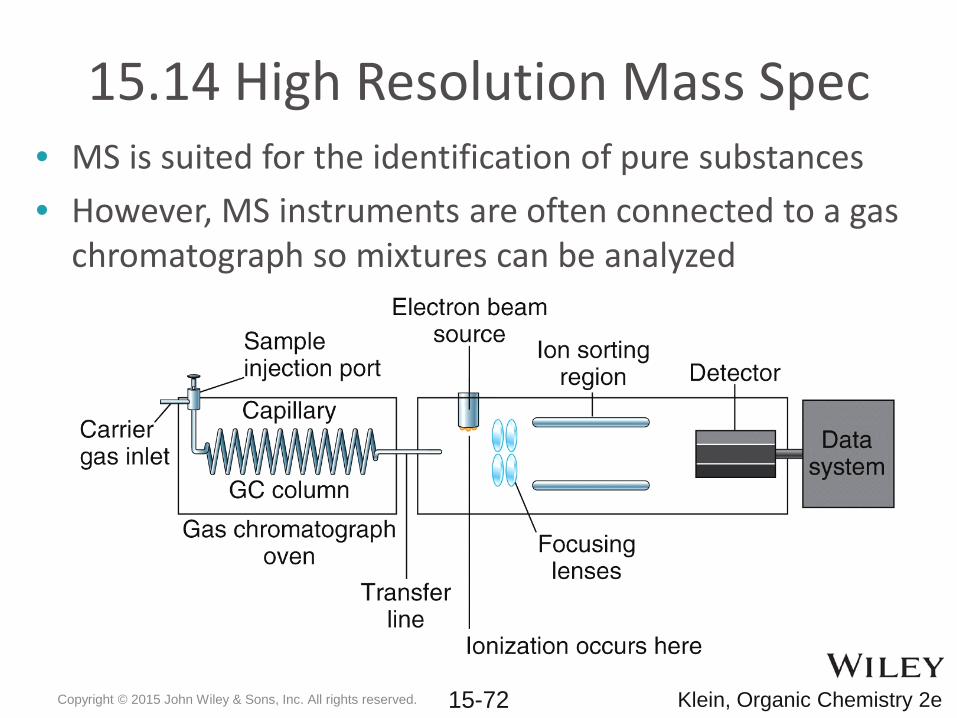
15.14 High Resolution Mass Spec• MS is suited for the identification of pure substances• However, MS instruments are often connected to a gas
chromatograph so mixtures can be analyzed
Copyright © 2015 John Wiley & Sons, Inc. All rights reserved. 15-72 Klein, Organic Chemistry 2e
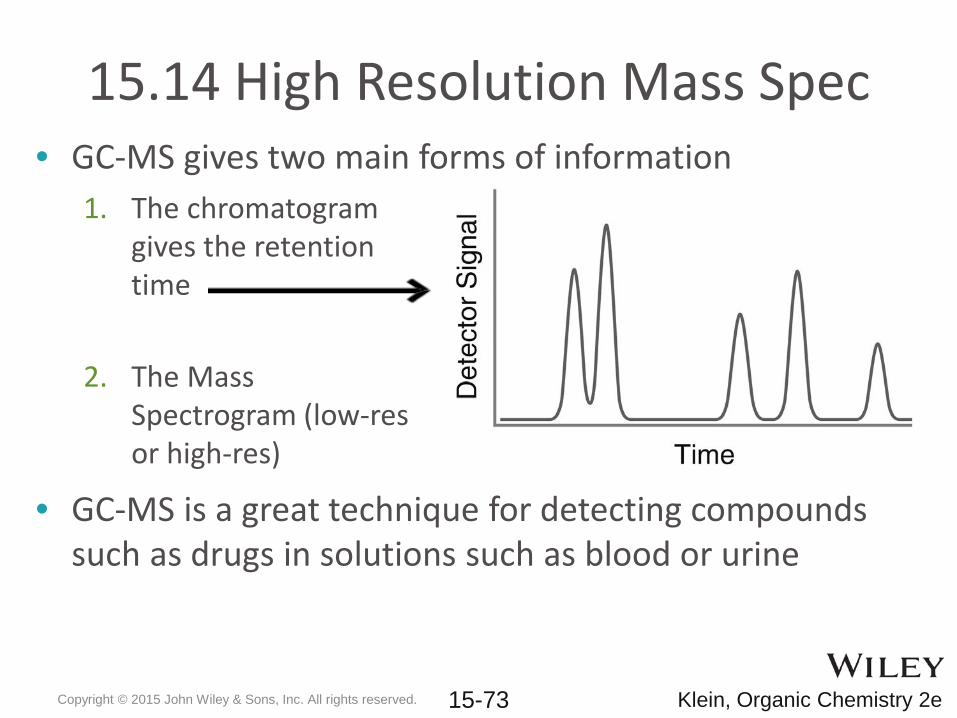
15.14 High Resolution Mass Spec• GC-MS gives two main forms of information
• GC-MS is a great technique for detecting compounds such as drugs in solutions such as blood or urine
1. The chromatogram gives the retention time
2. The Mass Spectrogram (low-res or high-res)
Copyright © 2015 John Wiley & Sons, Inc. All rights reserved. 15-73 Klein, Organic Chemistry 2e
15.15 MS of Large Biomolecules• To be analyzed by EI mass spec, substances generally
must be vaporized prior to ionization• Until recently (last 30 years), compounds that
decompose before they vaporize could not be analyzed• In Electrospray ionization (ESI), a high-voltage needle
sprays a liquid solution of an analyte into a vacuum causing ionization
• HOW is ESI relevant for analyzing large biomolecules?• ESI is a “softer” ionizing technique. WHAT does that
mean?
Copyright © 2015 John Wiley & Sons, Inc. All rights reserved. 15-74 Klein, Organic Chemistry 2e
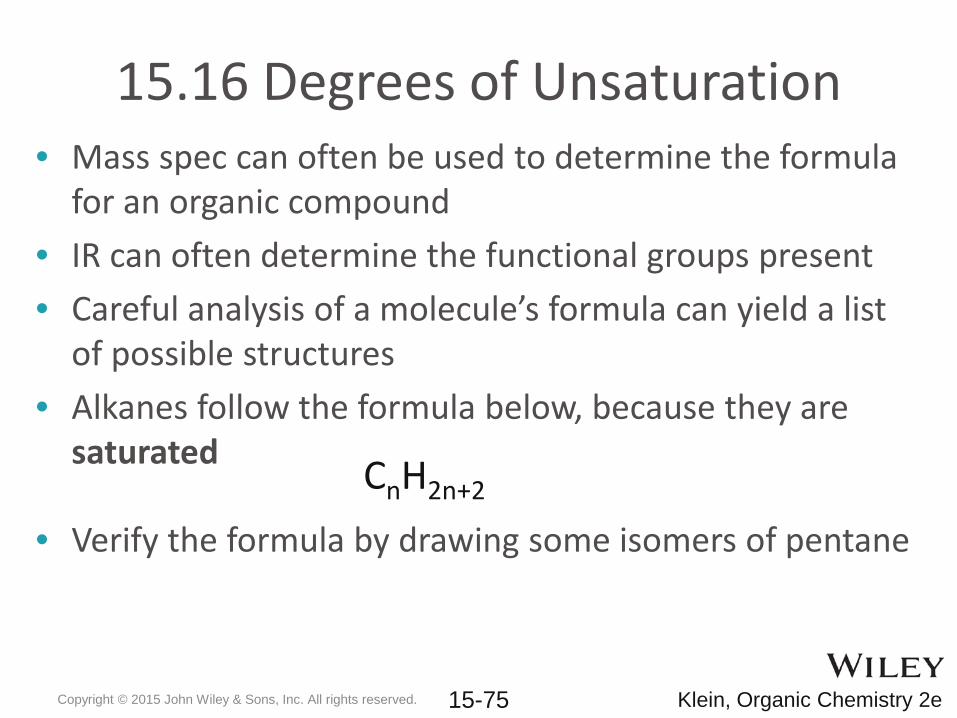
15.16 Degrees of Unsaturation• Mass spec can often be used to determine the formula
for an organic compound• IR can often determine the functional groups present• Careful analysis of a molecule’s formula can yield a list
of possible structures• Alkanes follow the formula below, because they are
saturated
• Verify the formula by drawing some isomers of pentane
Copyright © 2015 John Wiley & Sons, Inc. All rights reserved. 15-75 Klein, Organic Chemistry 2e
CnH2n+2
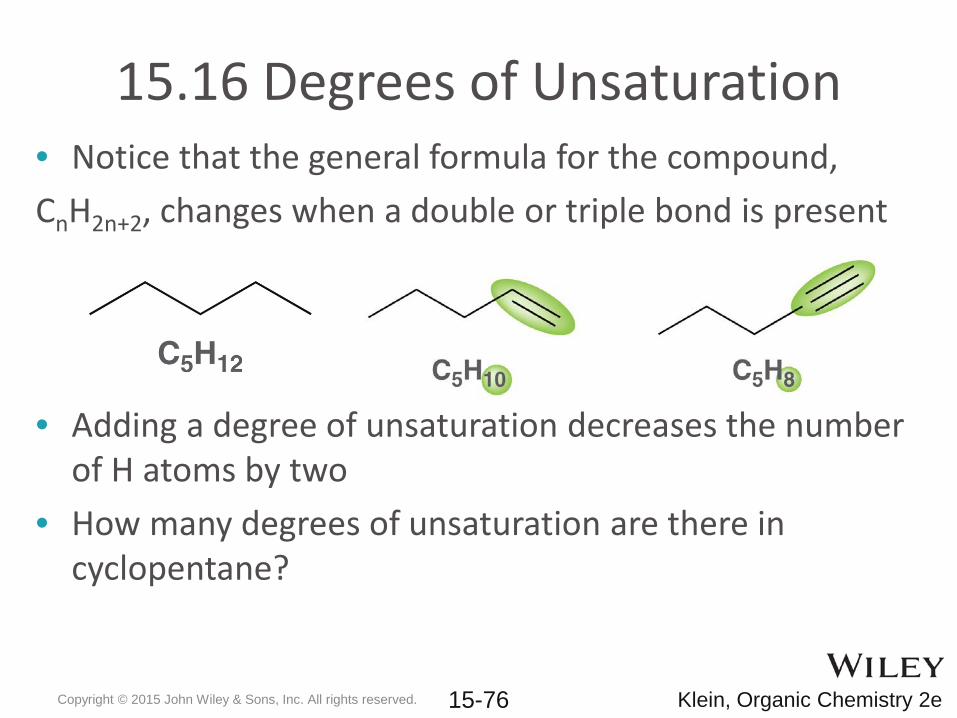
15.16 Degrees of Unsaturation• Notice that the general formula for the compound,CnH2n+2, changes when a double or triple bond is present
• Adding a degree of unsaturation decreases the number of H atoms by two
• How many degrees of unsaturation are there in cyclopentane?
Copyright © 2015 John Wiley & Sons, Inc. All rights reserved. 15-76 Klein, Organic Chemistry 2e
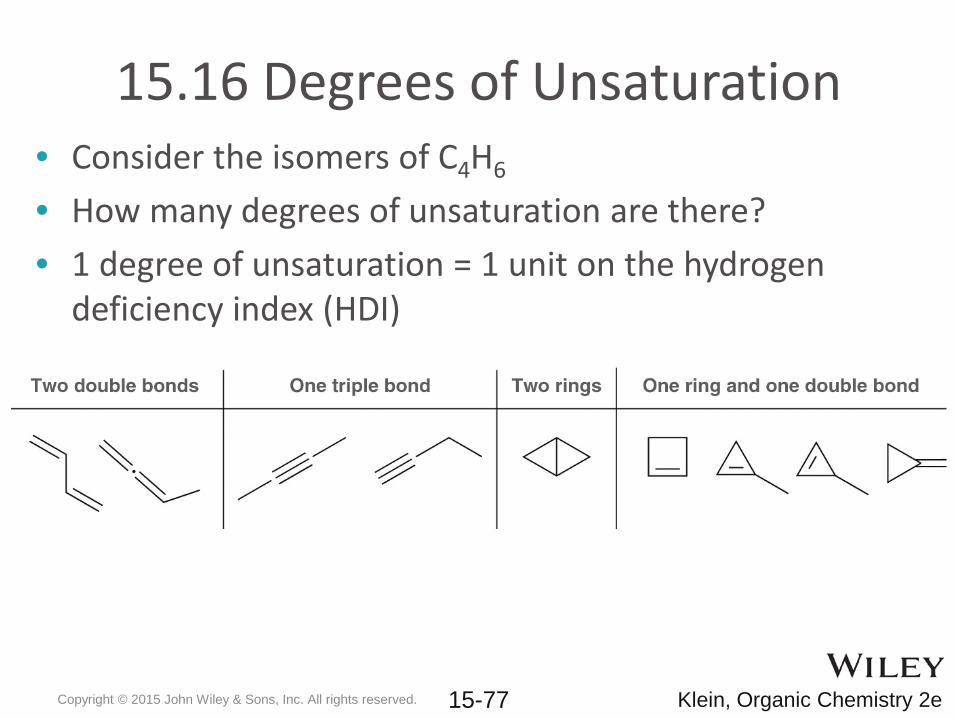
15.16 Degrees of Unsaturation• Consider the isomers of C4H6
• How many degrees of unsaturation are there?• 1 degree of unsaturation = 1 unit on the hydrogen
deficiency index (HDI)
Copyright © 2015 John Wiley & Sons, Inc. All rights reserved. 15-77 Klein, Organic Chemistry 2e
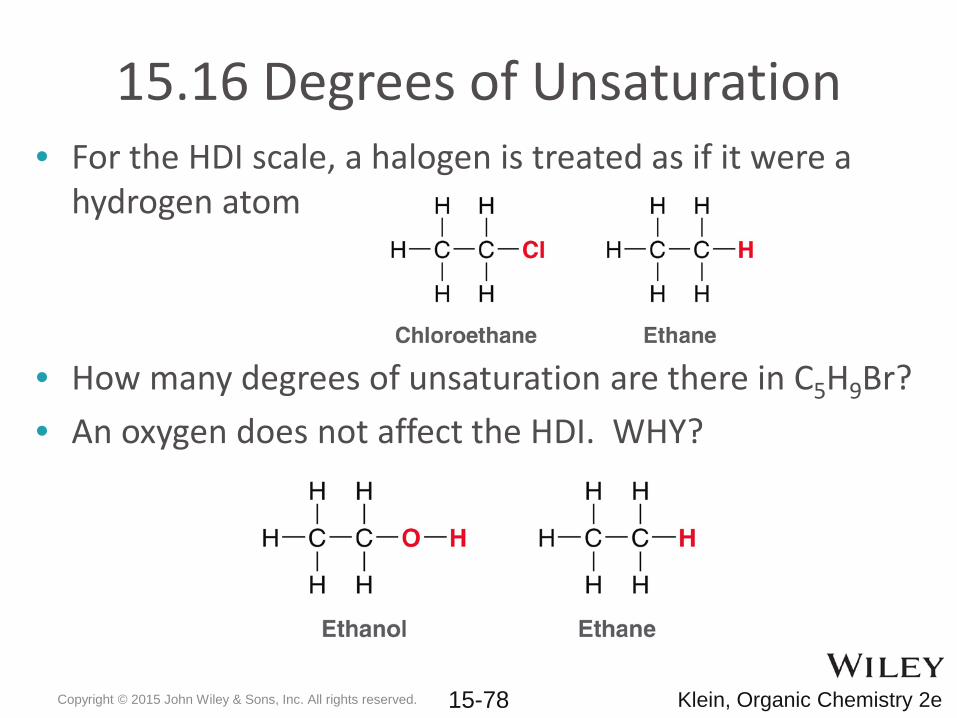
15.16 Degrees of Unsaturation• For the HDI scale, a halogen is treated as if it were a
hydrogen atom
• How many degrees of unsaturation are there in C5H9Br?• An oxygen does not affect the HDI. WHY?
Copyright © 2015 John Wiley & Sons, Inc. All rights reserved. 15-78 Klein, Organic Chemistry 2e
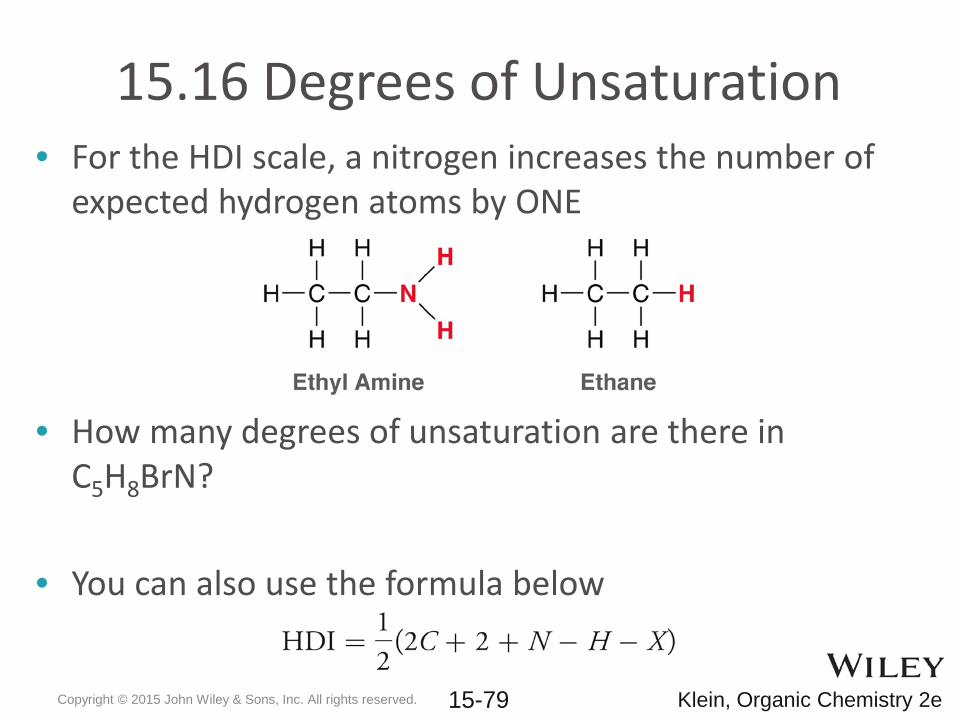
15.16 Degrees of Unsaturation• For the HDI scale, a nitrogen increases the number of
expected hydrogen atoms by ONE
• How many degrees of unsaturation are there in C5H8BrN?
• You can also use the formula below
Copyright © 2015 John Wiley & Sons, Inc. All rights reserved. 15-79 Klein, Organic Chemistry 2e
15.16 Degrees of Unsaturation• Calculating the HDI can be very useful. For example, if
HDI=0, the molecule can NOT have any rings, double bonds, or triple bonds
• Propose a structure for a molecule with the formula C7H12O. The molecule has the following IR peaks – A strong peak at 1687 cm-1
– NO IR peaks above 3000 cm-1
• Practice with SkillBuilder 15.4
Copyright © 2015 John Wiley & Sons, Inc. All rights reserved. 15-80 Klein, Organic Chemistry 2e
Chapter 16Nuclear Magnetic Resonance Spectroscopy
Organic ChemistrySecond Edition
David Klein
Copyright © 2015 John Wiley & Sons, Inc. All rights reserved. Klein, Organic Chemistry 2e
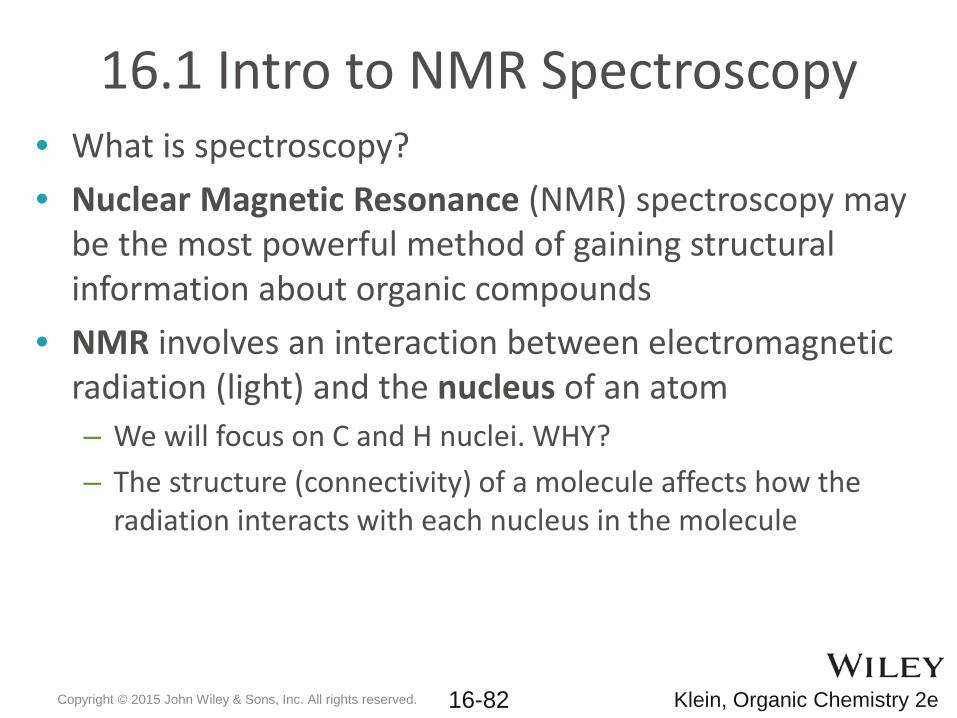
16.1 Intro to NMR Spectroscopy• What is spectroscopy?• Nuclear Magnetic Resonance (NMR) spectroscopy may
be the most powerful method of gaining structural information about organic compounds
• NMR involves an interaction between electromagnetic radiation (light) and the nucleus of an atom– We will focus on C and H nuclei. WHY?– The structure (connectivity) of a molecule affects how the
radiation interacts with each nucleus in the molecule
Copyright © 2015 John Wiley & Sons, Inc. All rights reserved. Klein, Organic Chemistry 2e 16-82
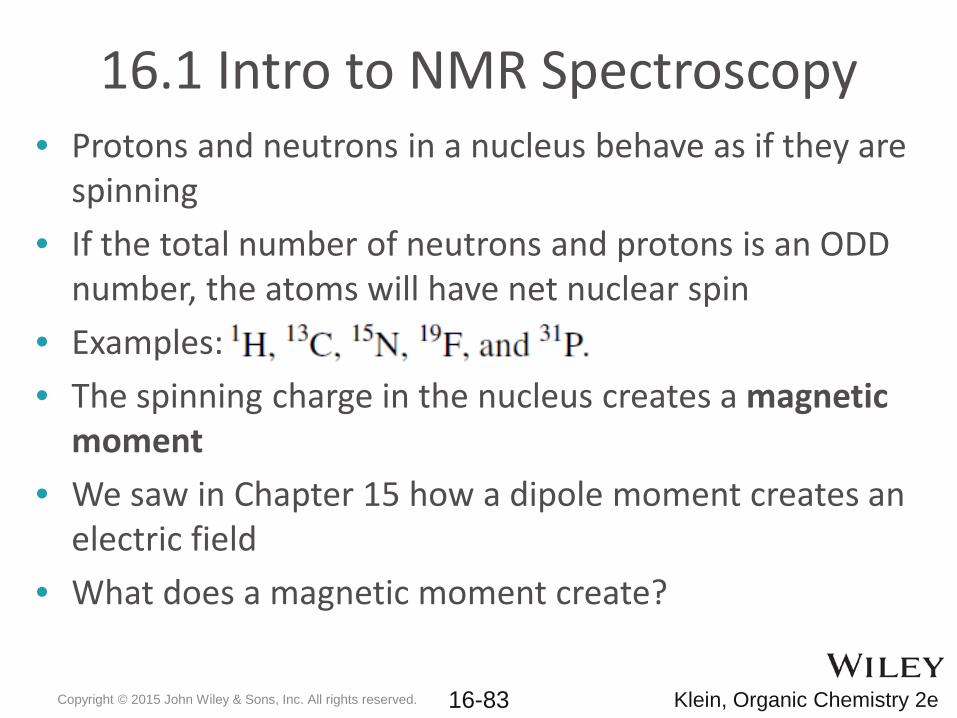
16.1 Intro to NMR Spectroscopy• Protons and neutrons in a nucleus behave as if they are
spinning• If the total number of neutrons and protons is an ODD
number, the atoms will have net nuclear spin• Examples: • The spinning charge in the nucleus creates a magnetic
moment• We saw in Chapter 15 how a dipole moment creates an
electric field• What does a magnetic moment create?
Copyright © 2015 John Wiley & Sons, Inc. All rights reserved. Klein, Organic Chemistry 2e 16-83
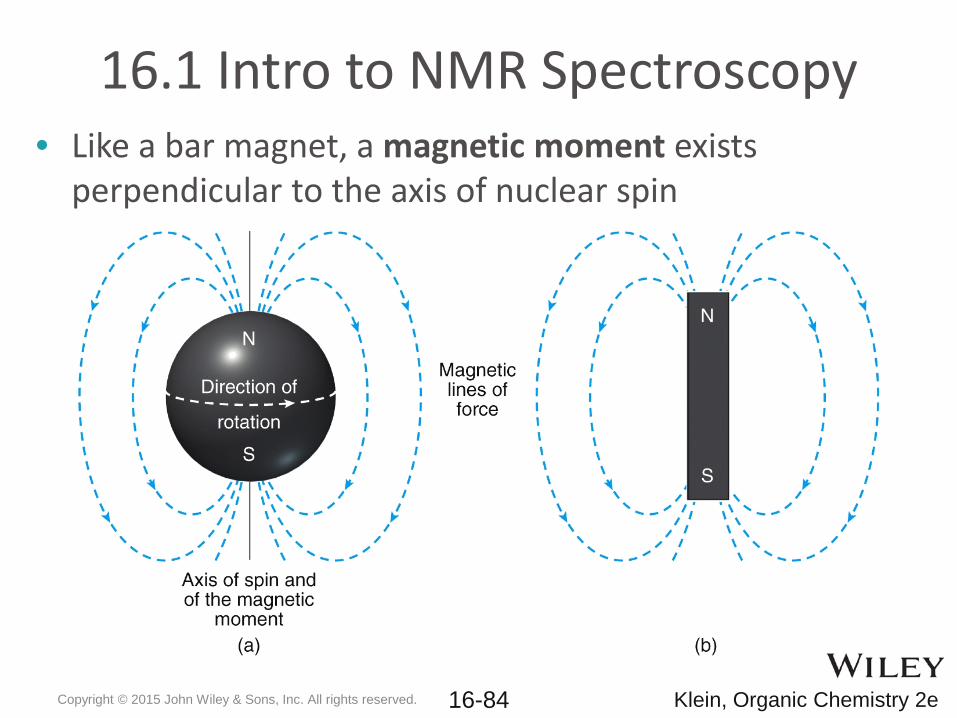
16.1 Intro to NMR Spectroscopy• Like a bar magnet, a magnetic moment exists
perpendicular to the axis of nuclear spin
Copyright © 2015 John Wiley & Sons, Inc. All rights reserved. Klein, Organic Chemistry 2e 16-84
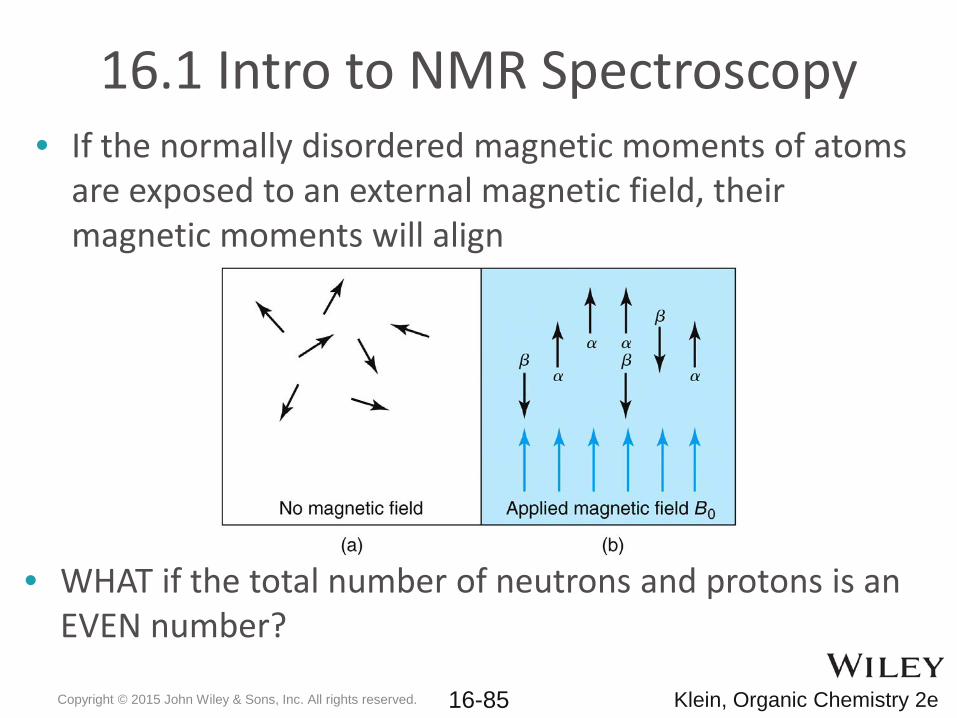
16.1 Intro to NMR Spectroscopy• If the normally disordered magnetic moments of atoms
are exposed to an external magnetic field, their magnetic moments will align
• WHAT if the total number of neutrons and protons is an EVEN number?
Copyright © 2015 John Wiley & Sons, Inc. All rights reserved. Klein, Organic Chemistry 2e 16-85
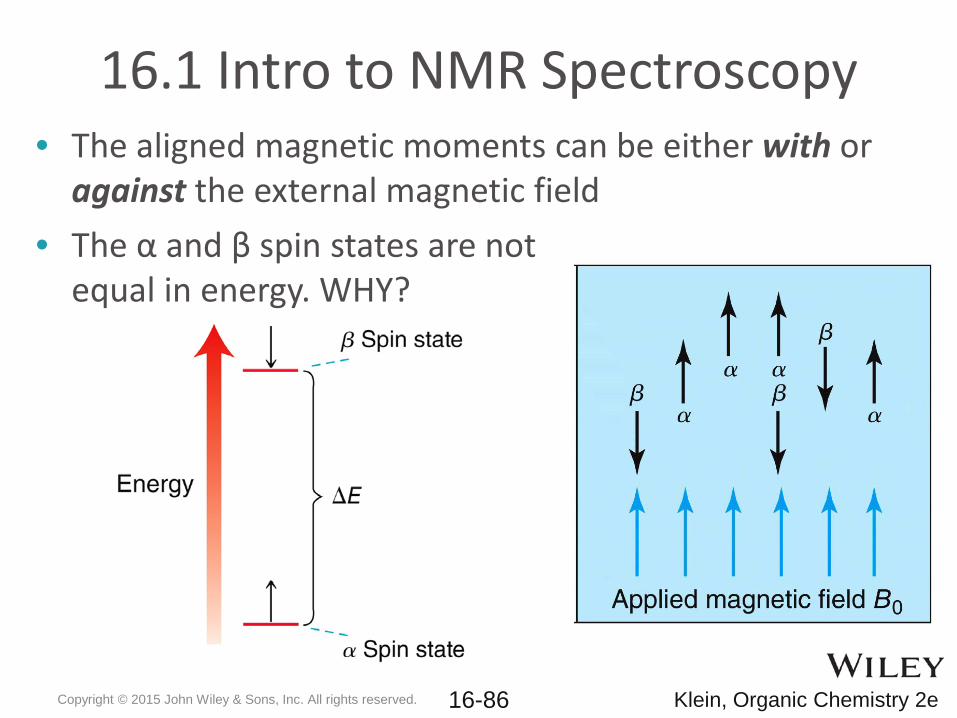
16.1 Intro to NMR Spectroscopy• The aligned magnetic moments can be either with or
against the external magnetic field• The α and β spin states are not
equal in energy. WHY?
Copyright © 2015 John Wiley & Sons, Inc. All rights reserved. Klein, Organic Chemistry 2e 16-86
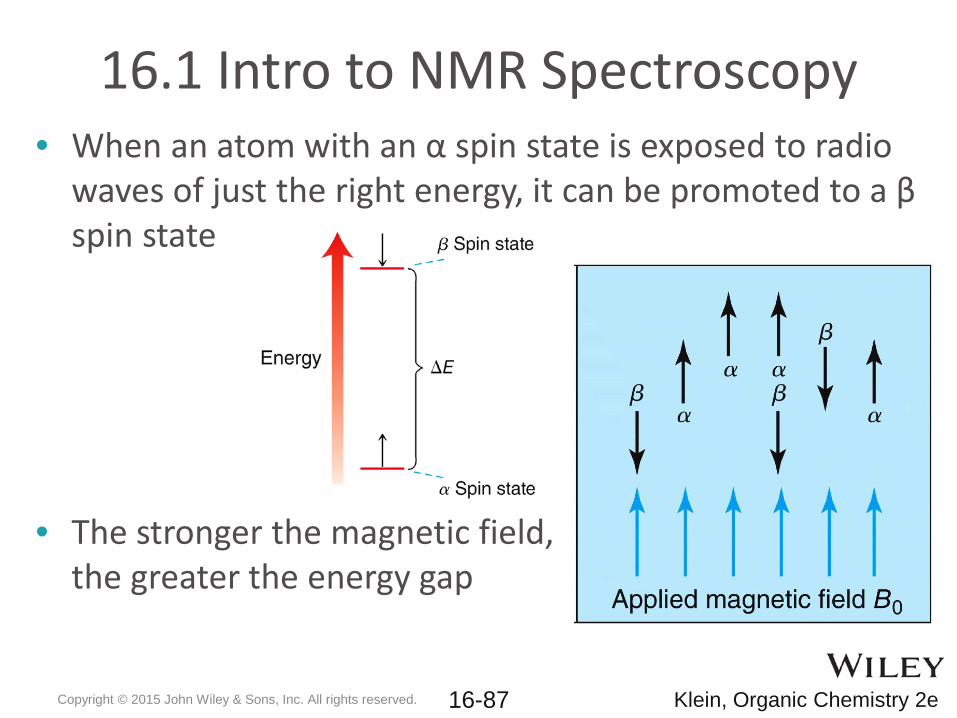
16.1 Intro to NMR Spectroscopy• When an atom with an α spin state is exposed to radio
waves of just the right energy, it can be promoted to a βspin state
• The stronger the magnetic field, the greater the energy gap
Copyright © 2015 John Wiley & Sons, Inc. All rights reserved. Klein, Organic Chemistry 2e 16-87
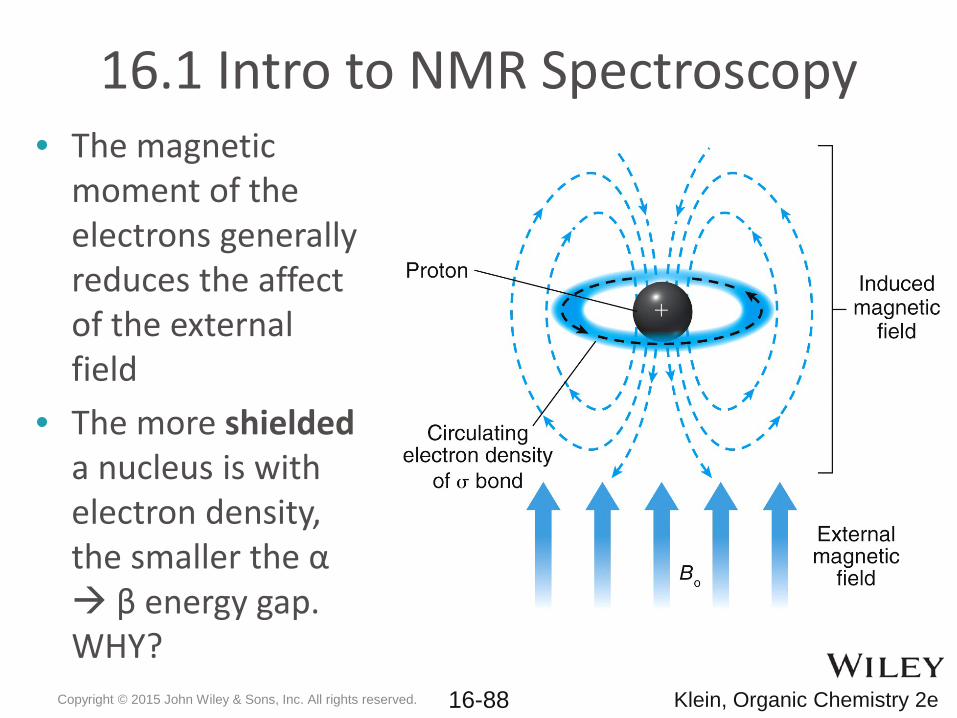
16.1 Intro to NMR Spectroscopy• The magnetic
moment of the electrons generally reduces the affect of the external field
• The more shielded a nucleus is with electron density, the smaller the α β energy gap. WHY?
Copyright © 2015 John Wiley & Sons, Inc. All rights reserved. Klein, Organic Chemistry 2e 16-88
16.1 Intro to NMR Spectroscopy• The amount of radio wave energy necessary for the α
β energy transition depends on the electronic environment for the atom
• When the α spins are flipped to β spins, the atoms are said to be in resonance
• The use of the term, “resonance” here is totally different from when we are talking about electrons in molecular orbitals
• How does NMR spectroscopy tell us about molecular structure?
Copyright © 2015 John Wiley & Sons, Inc. All rights reserved. Klein, Organic Chemistry 2e 16-89
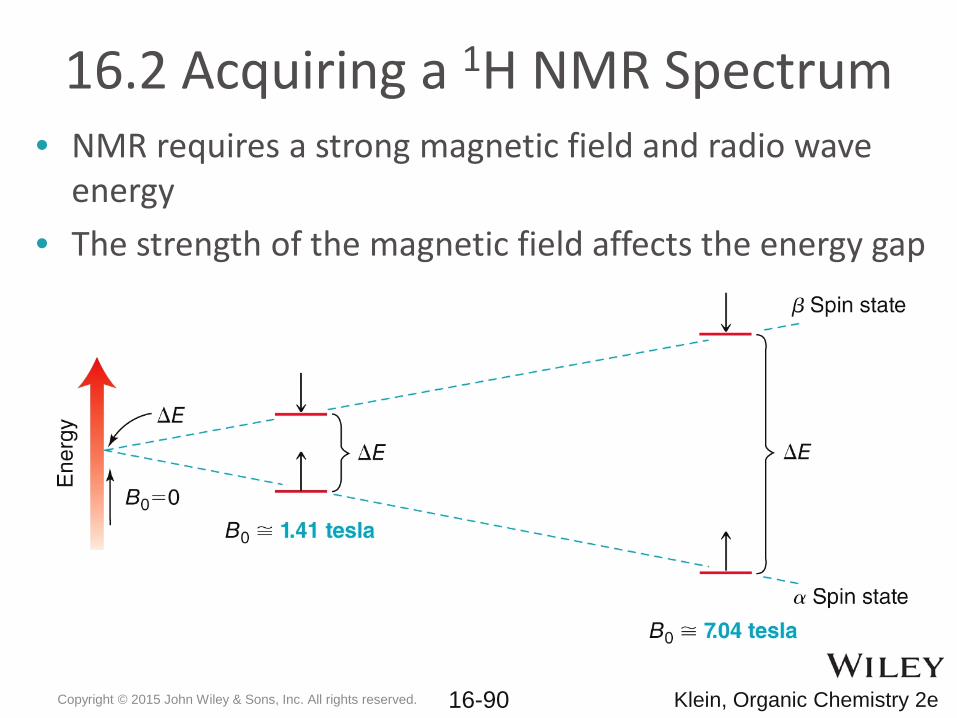
16.2 Acquiring a 1H NMR Spectrum• NMR requires a strong magnetic field and radio wave
energy• The strength of the magnetic field affects the energy gap
Copyright © 2015 John Wiley & Sons, Inc. All rights reserved. Klein, Organic Chemistry 2e 16-90
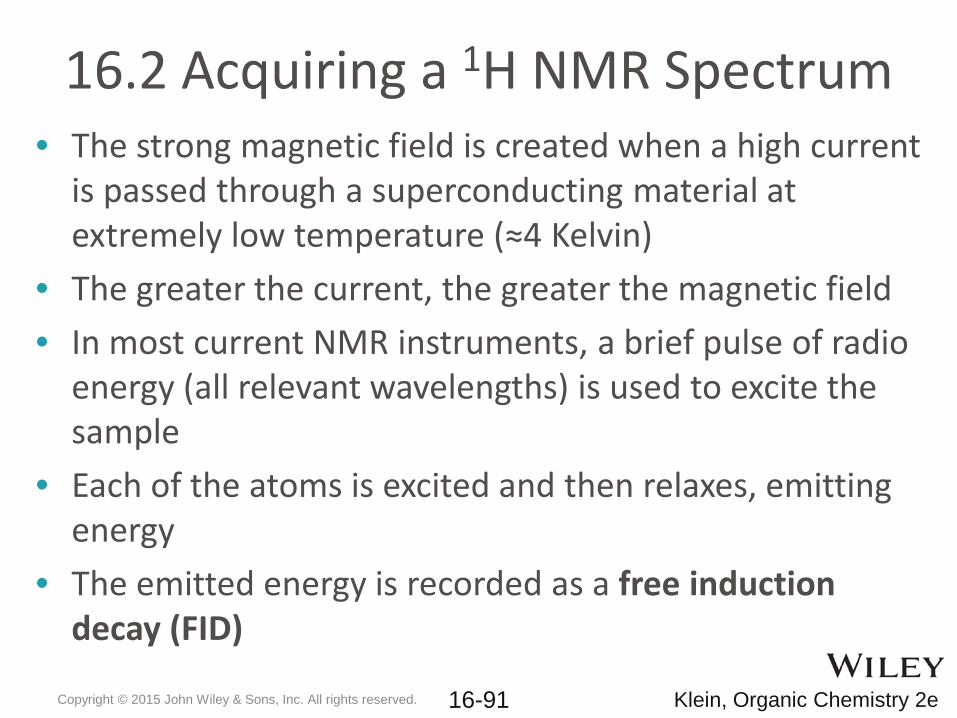
16.2 Acquiring a 1H NMR Spectrum• The strong magnetic field is created when a high current
is passed through a superconducting material at extremely low temperature (≈4 Kelvin)
• The greater the current, the greater the magnetic field• In most current NMR instruments, a brief pulse of radio
energy (all relevant wavelengths) is used to excite the sample
• Each of the atoms is excited and then relaxes, emitting energy
• The emitted energy is recorded as a free induction decay (FID)
Copyright © 2015 John Wiley & Sons, Inc. All rights reserved. Klein, Organic Chemistry 2e 16-91
16.2 Acquiring a 1H NMR Spectrum• The FID contains all of the information for each atom• A mathematical treatment called a Fourier-transform
separates the signals so an individual signal can be observed for each atom that was excited
• Such an instrument is called an FT-NMR• Often multiple FIDs are taken and averaged together• Before analysis, NMR samples must be prepared neat or
in a liquid solution and placed in a small NMR tube• The sample is placed into the magnetic field and the
tube is spun at a high rate to average magnetic field variations or tube imperfections
Copyright © 2015 John Wiley & Sons, Inc. All rights reserved. Klein, Organic Chemistry 2e 16-92
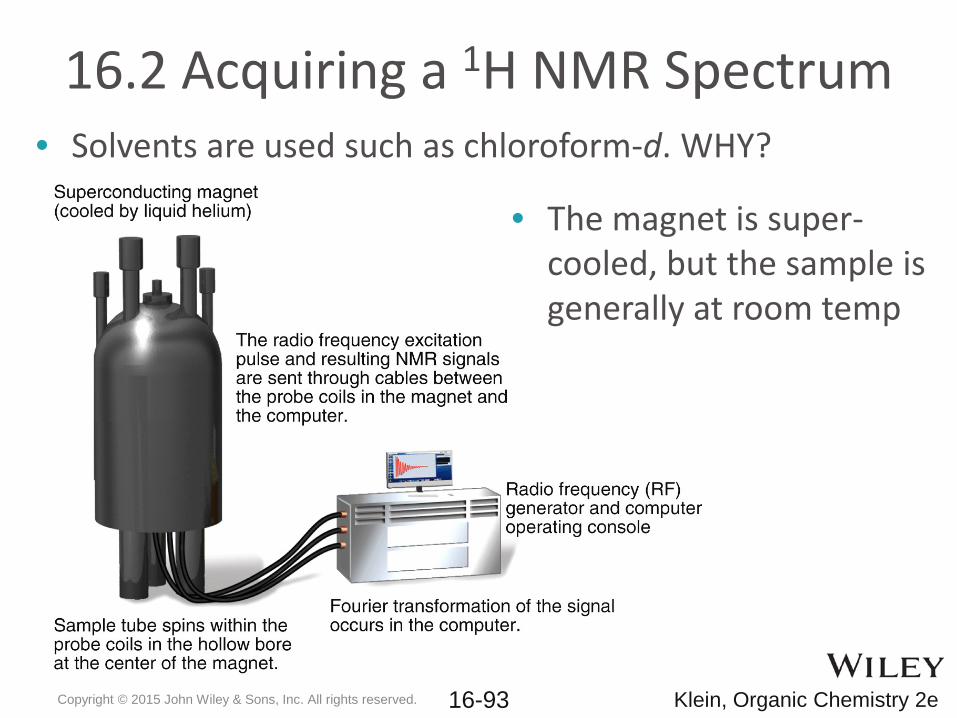
16.2 Acquiring a 1H NMR Spectrum• Solvents are used such as chloroform-d. WHY?
• The magnet is super-cooled, but the sample is generally at room temp
Copyright © 2015 John Wiley & Sons, Inc. All rights reserved. Klein, Organic Chemistry 2e 16-93
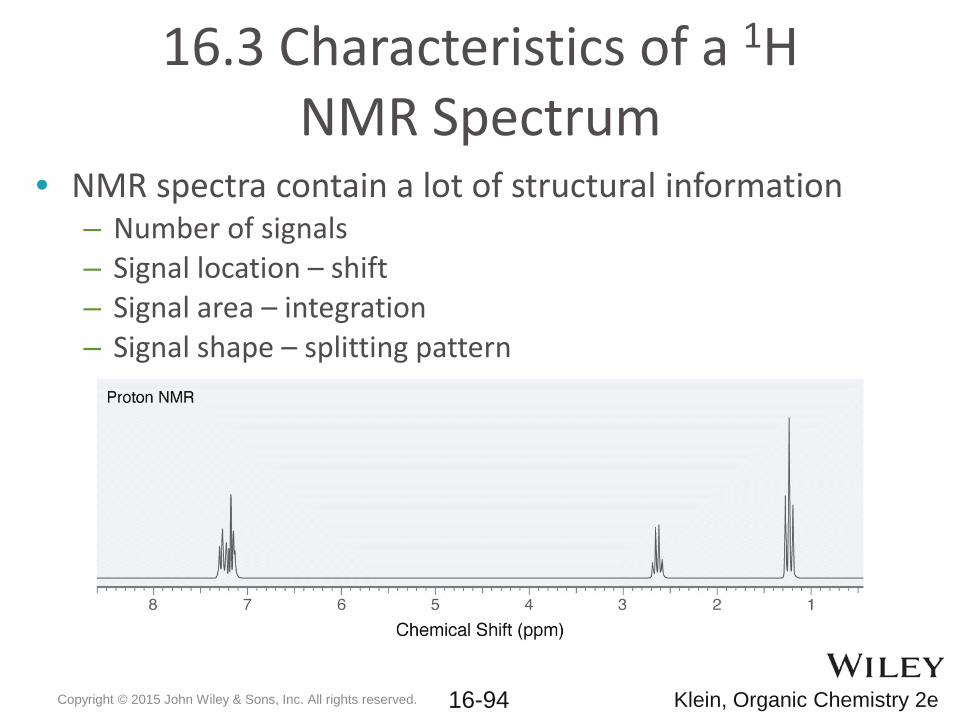
• NMR spectra contain a lot of structural information– Number of signals– Signal location – shift– Signal area – integration– Signal shape – splitting pattern
16.3 Characteristics of a 1H NMR Spectrum
Copyright © 2015 John Wiley & Sons, Inc. All rights reserved. Klein, Organic Chemistry 2e 16-94
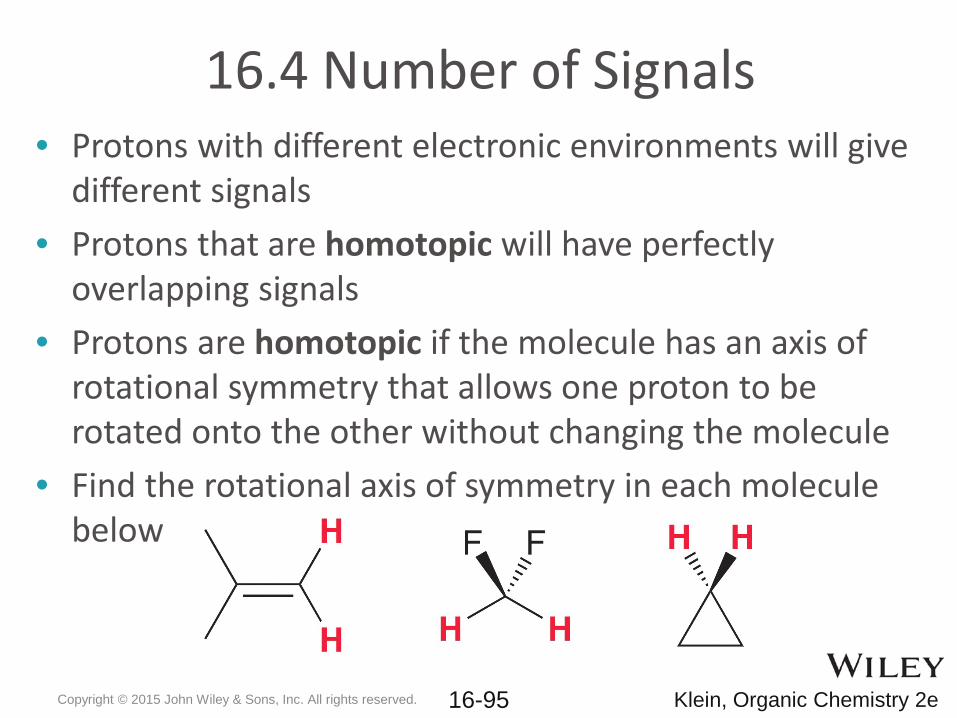
16.4 Number of Signals• Protons with different electronic environments will give
different signals• Protons that are homotopic will have perfectly
overlapping signals• Protons are homotopic if the molecule has an axis of
rotational symmetry that allows one proton to be rotated onto the other without changing the molecule
• Find the rotational axis of symmetry in each molecule below
Copyright © 2015 John Wiley & Sons, Inc. All rights reserved. Klein, Organic Chemistry 2e 16-95
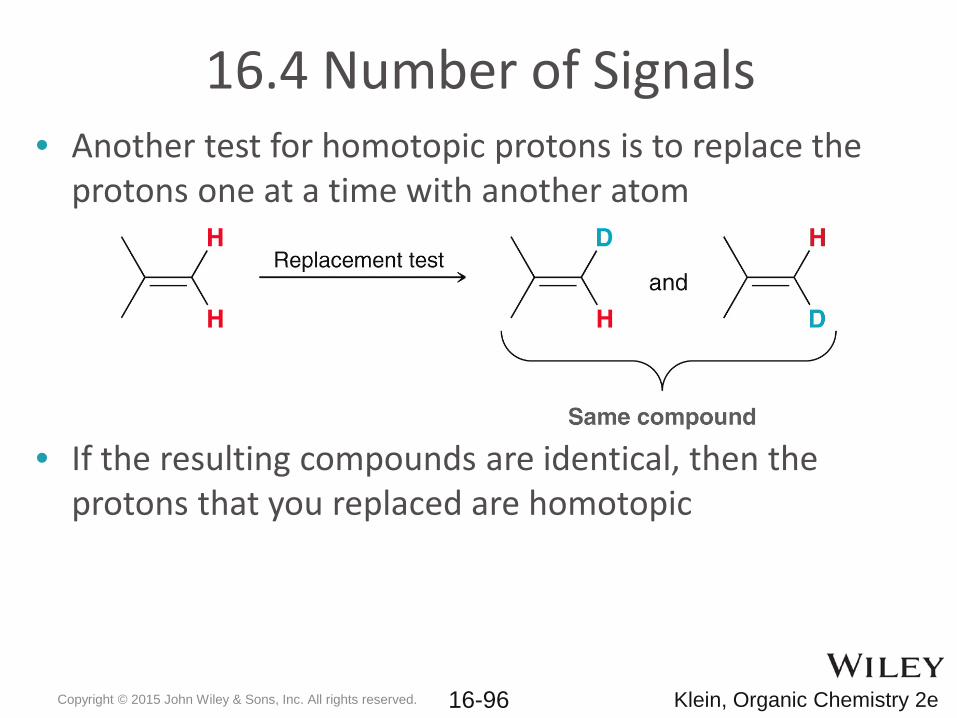
16.4 Number of Signals• Another test for homotopic protons is to replace the
protons one at a time with another atom
• If the resulting compounds are identical, then the protons that you replaced are homotopic
Copyright © 2015 John Wiley & Sons, Inc. All rights reserved. Klein, Organic Chemistry 2e 16-96
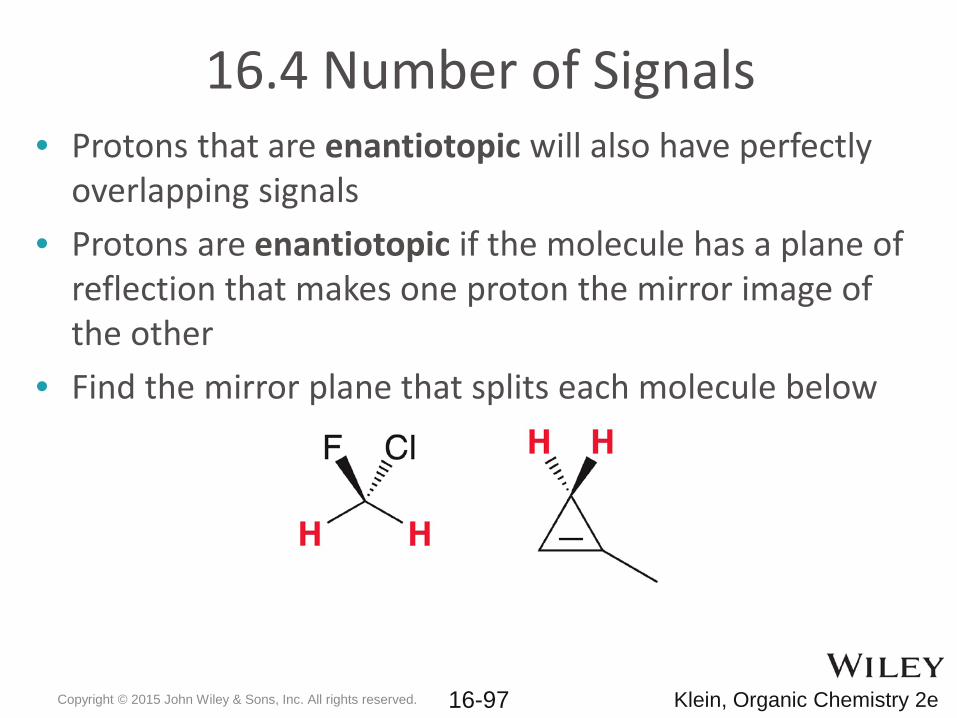
16.4 Number of Signals• Protons that are enantiotopic will also have perfectly
overlapping signals• Protons are enantiotopic if the molecule has a plane of
reflection that makes one proton the mirror image of the other
• Find the mirror plane that splits each molecule below
Copyright © 2015 John Wiley & Sons, Inc. All rights reserved. Klein, Organic Chemistry 2e 16-97
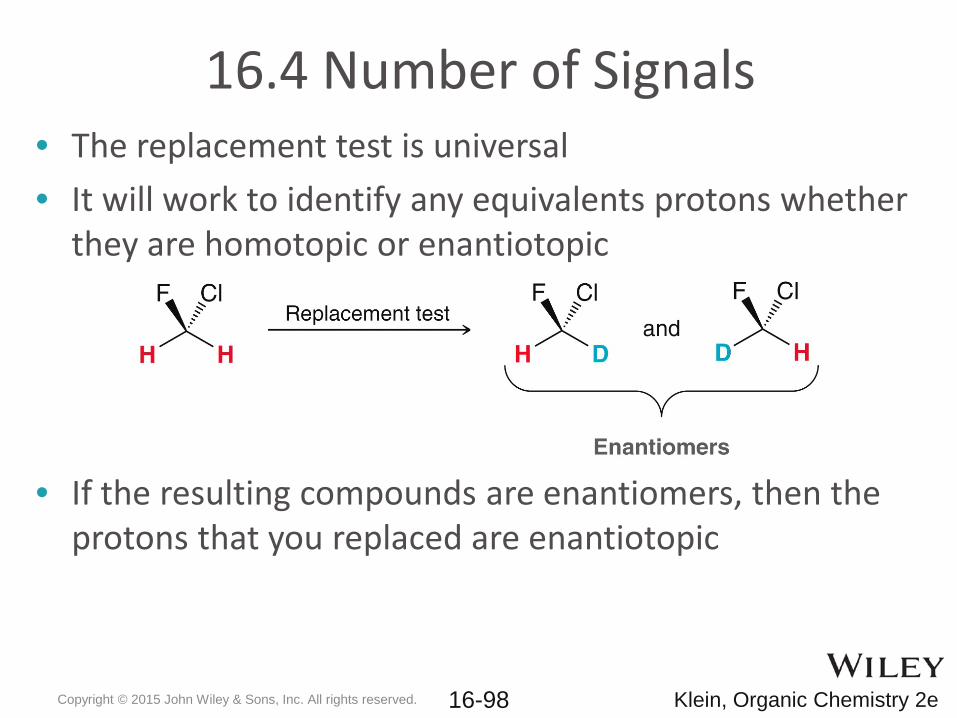
16.4 Number of Signals• The replacement test is universal• It will work to identify any equivalents protons whether
they are homotopic or enantiotopic
• If the resulting compounds are enantiomers, then the protons that you replaced are enantiotopic
Copyright © 2015 John Wiley & Sons, Inc. All rights reserved. Klein, Organic Chemistry 2e 16-98
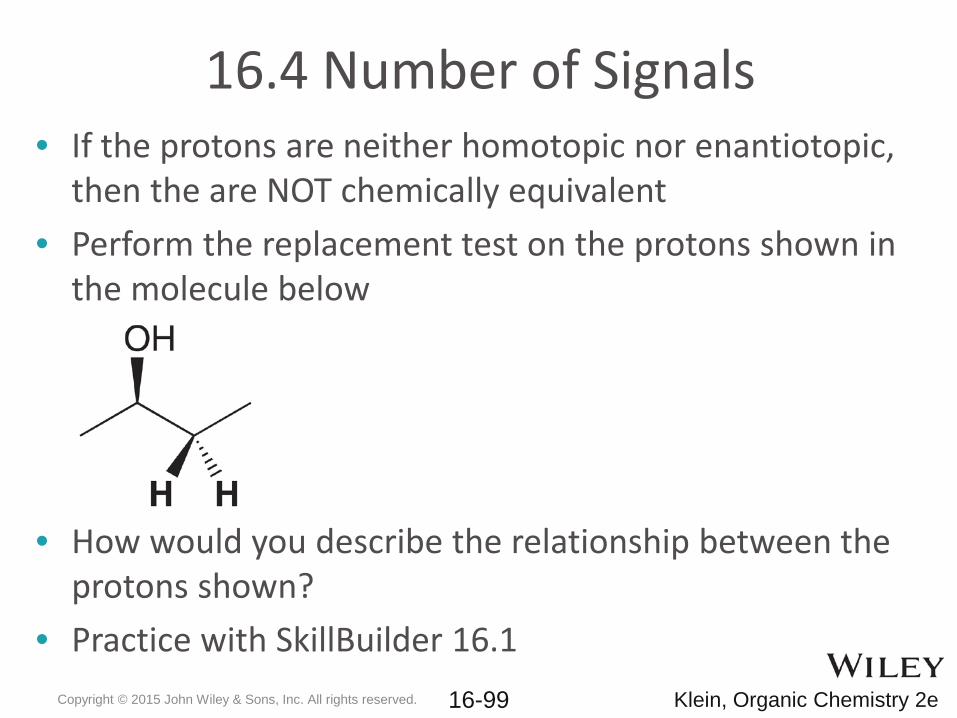
16.4 Number of Signals• If the protons are neither homotopic nor enantiotopic,
then the are NOT chemically equivalent• Perform the replacement test on the protons shown in
the molecule below
• How would you describe the relationship between the protons shown?
• Practice with SkillBuilder 16.1Copyright © 2015 John Wiley & Sons, Inc. All rights reserved. Klein, Organic Chemistry 2e 16-99
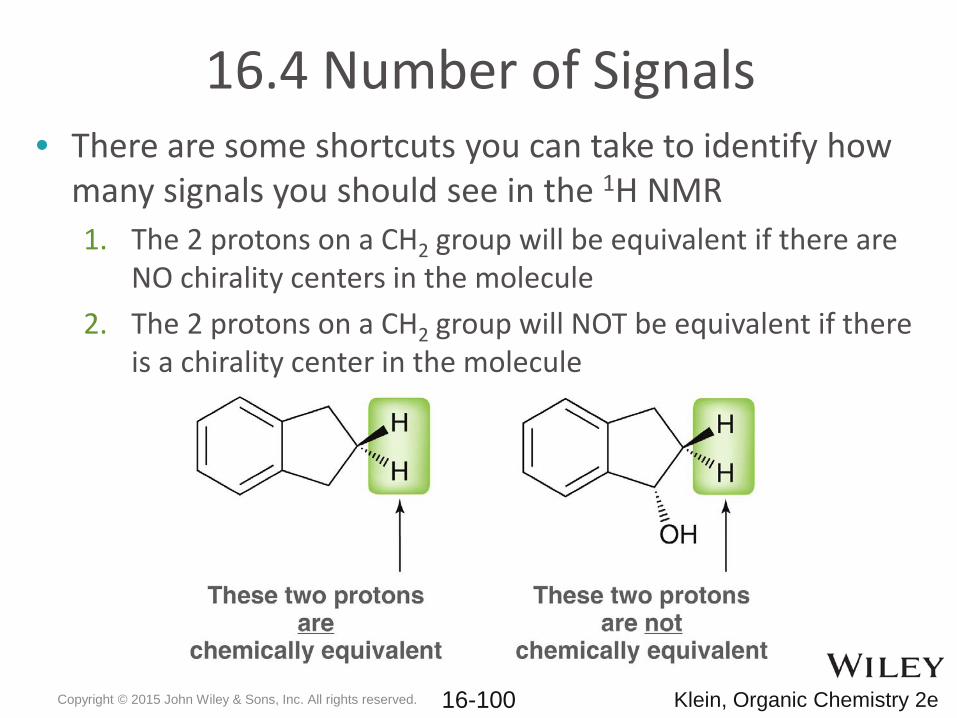
16.4 Number of Signals• There are some shortcuts you can take to identify how
many signals you should see in the 1H NMR1. The 2 protons on a CH2 group will be equivalent if there are
NO chirality centers in the molecule2. The 2 protons on a CH2 group will NOT be equivalent if there
is a chirality center in the molecule
Copyright © 2015 John Wiley & Sons, Inc. All rights reserved. Klein, Organic Chemistry 2e 16-100
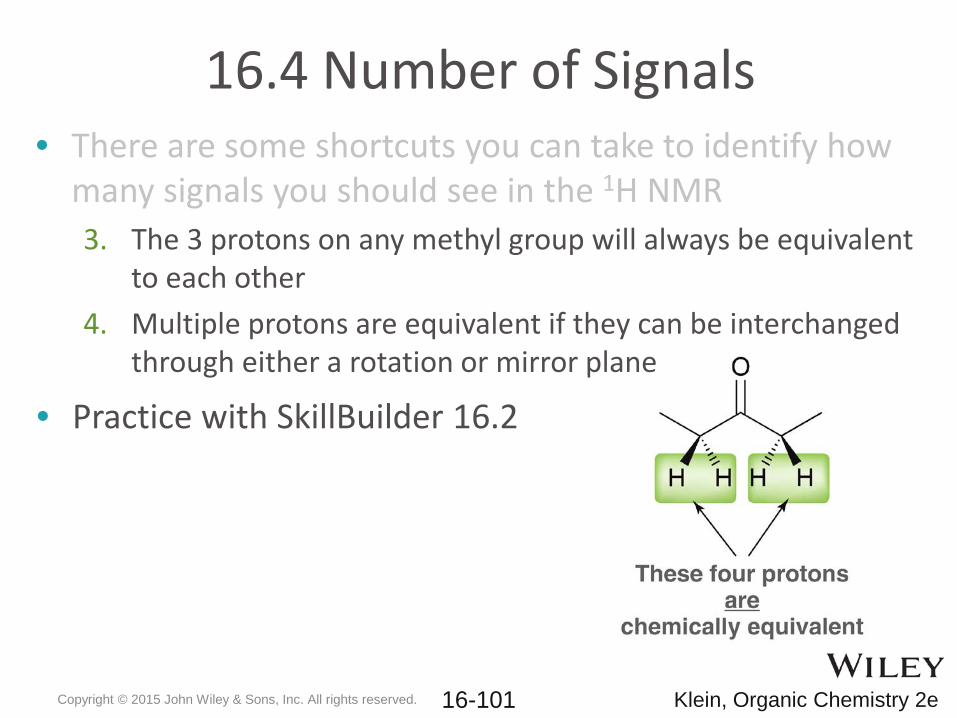
• There are some shortcuts you can take to identify how many signals you should see in the 1H NMR3. The 3 protons on any methyl group will always be equivalent
to each other4. Multiple protons are equivalent if they can be interchanged
through either a rotation or mirror plane
16.4 Number of Signals
• Practice with SkillBuilder 16.2
Copyright © 2015 John Wiley & Sons, Inc. All rights reserved. Klein, Organic Chemistry 2e 16-101
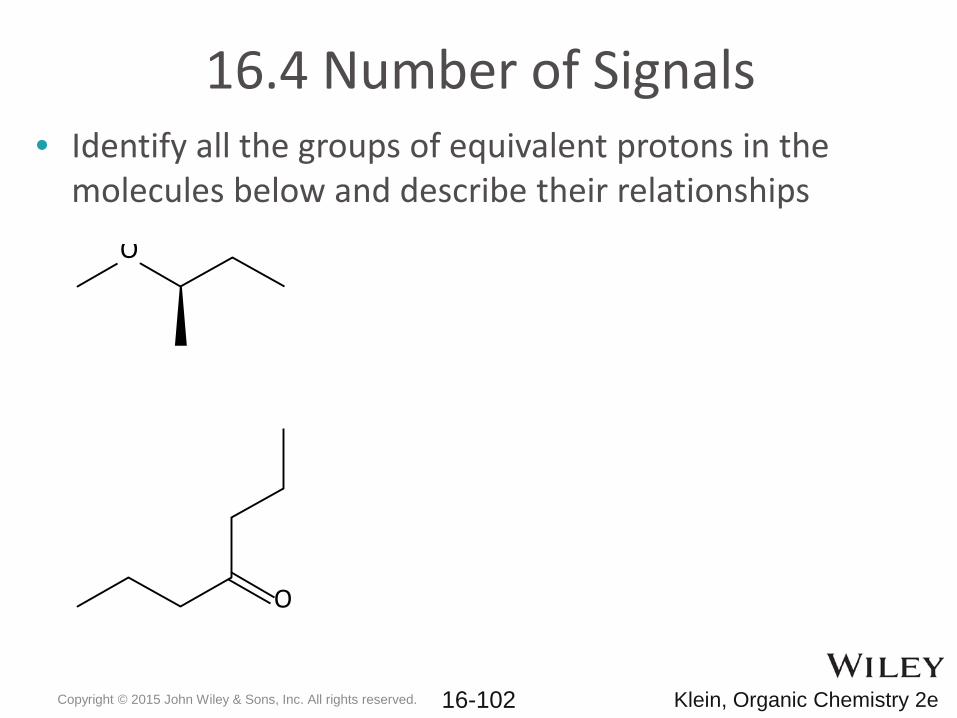
16.4 Number of Signals• Identify all the groups of equivalent protons in the
molecules below and describe their relationshipsO
O
Copyright © 2015 John Wiley & Sons, Inc. All rights reserved. Klein, Organic Chemistry 2e 16-102
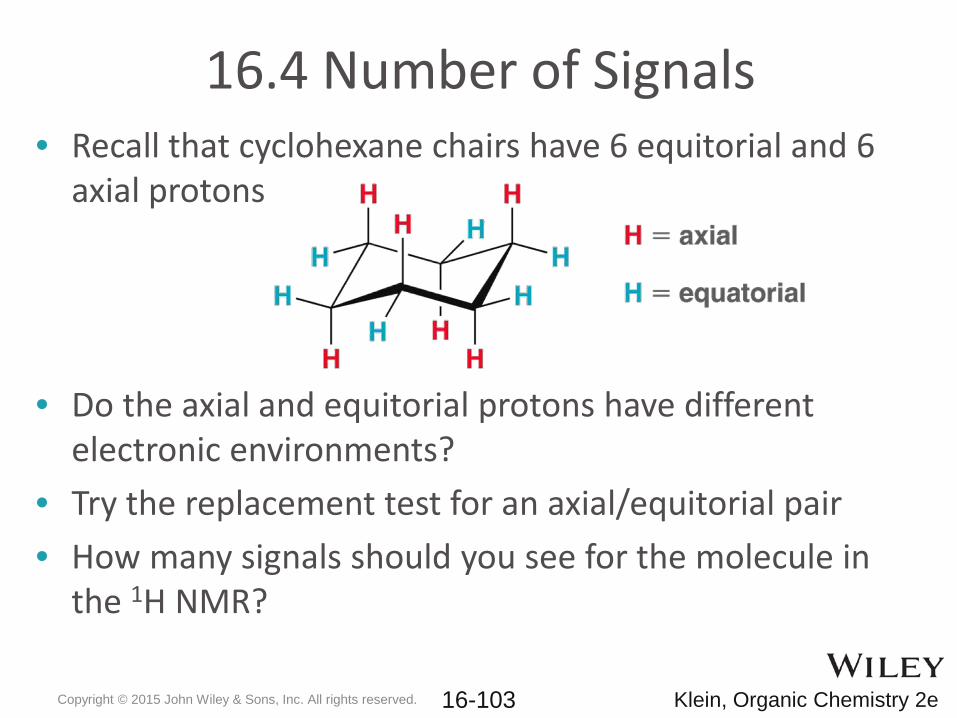
• Recall that cyclohexane chairs have 6 equitorial and 6 axial protons
• Do the axial and equitorial protons have different electronic environments?
• Try the replacement test for an axial/equitorial pair• How many signals should you see for the molecule in
the 1H NMR?
16.4 Number of Signals
Copyright © 2015 John Wiley & Sons, Inc. All rights reserved. Klein, Organic Chemistry 2e 16-103
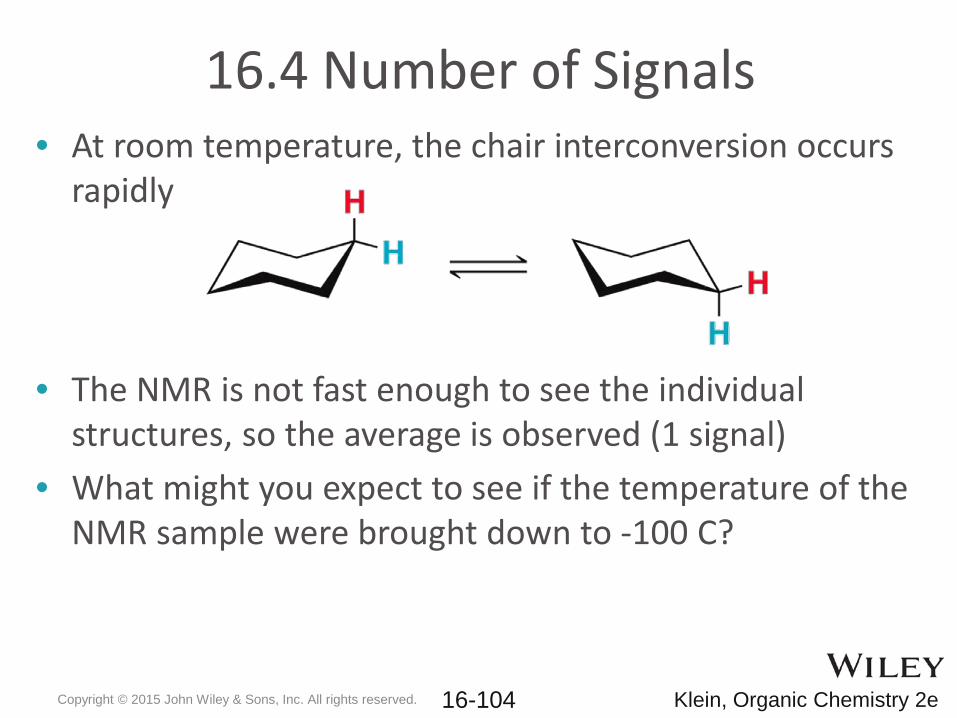
• At room temperature, the chair interconversion occurs rapidly
• The NMR is not fast enough to see the individual structures, so the average is observed (1 signal)
• What might you expect to see if the temperature of the NMR sample were brought down to -100 C?
16.4 Number of Signals
Copyright © 2015 John Wiley & Sons, Inc. All rights reserved. Klein, Organic Chemistry 2e 16-104
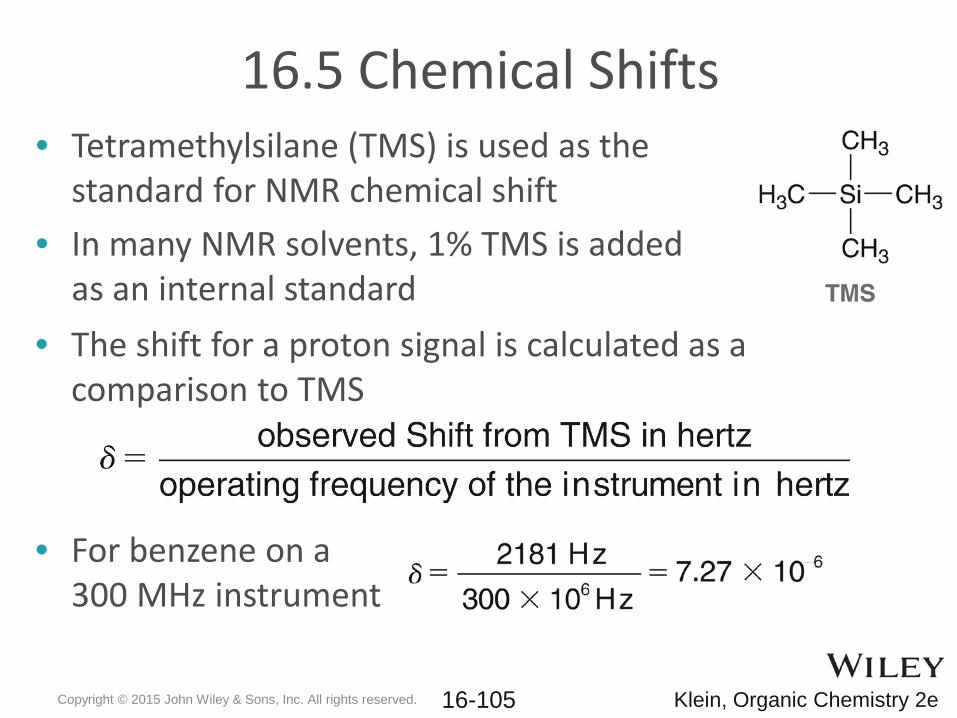
16.5 Chemical Shifts• Tetramethylsilane (TMS) is used as the
standard for NMR chemical shift• In many NMR solvents, 1% TMS is added
as an internal standard• The shift for a proton signal is calculated as a
comparison to TMS
• For benzene on a 300 MHz instrument
Copyright © 2015 John Wiley & Sons, Inc. All rights reserved. Klein, Organic Chemistry 2e 16-105
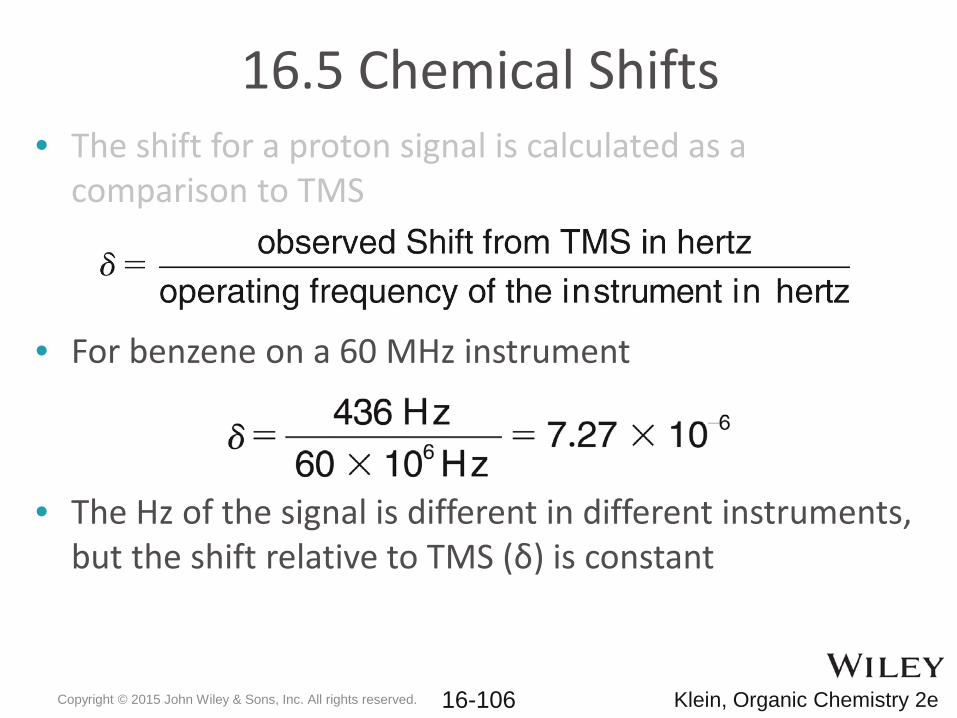
16.5 Chemical Shifts• The shift for a proton signal is calculated as a
comparison to TMS
• For benzene on a 60 MHz instrument
• The Hz of the signal is different in different instruments, but the shift relative to TMS (δ) is constant
Copyright © 2015 John Wiley & Sons, Inc. All rights reserved. Klein, Organic Chemistry 2e 16-106
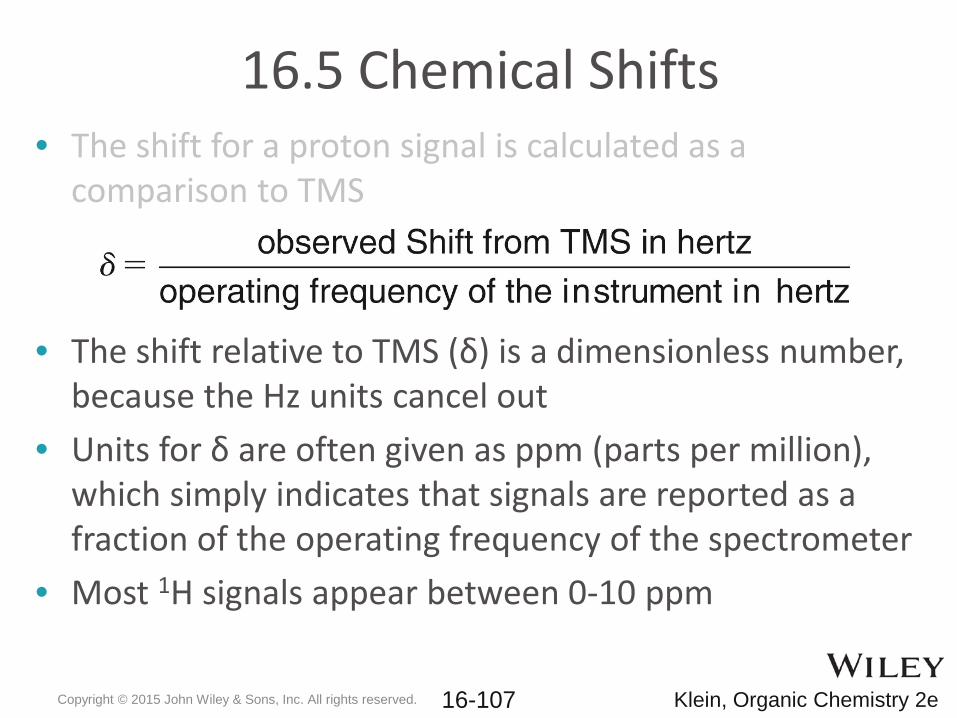
16.5 Chemical Shifts• The shift for a proton signal is calculated as a
comparison to TMS
• The shift relative to TMS (δ) is a dimensionless number, because the Hz units cancel out
• Units for δ are often given as ppm (parts per million), which simply indicates that signals are reported as a fraction of the operating frequency of the spectrometer
• Most 1H signals appear between 0-10 ppm
Copyright © 2015 John Wiley & Sons, Inc. All rights reserved. Klein, Organic Chemistry 2e 16-107
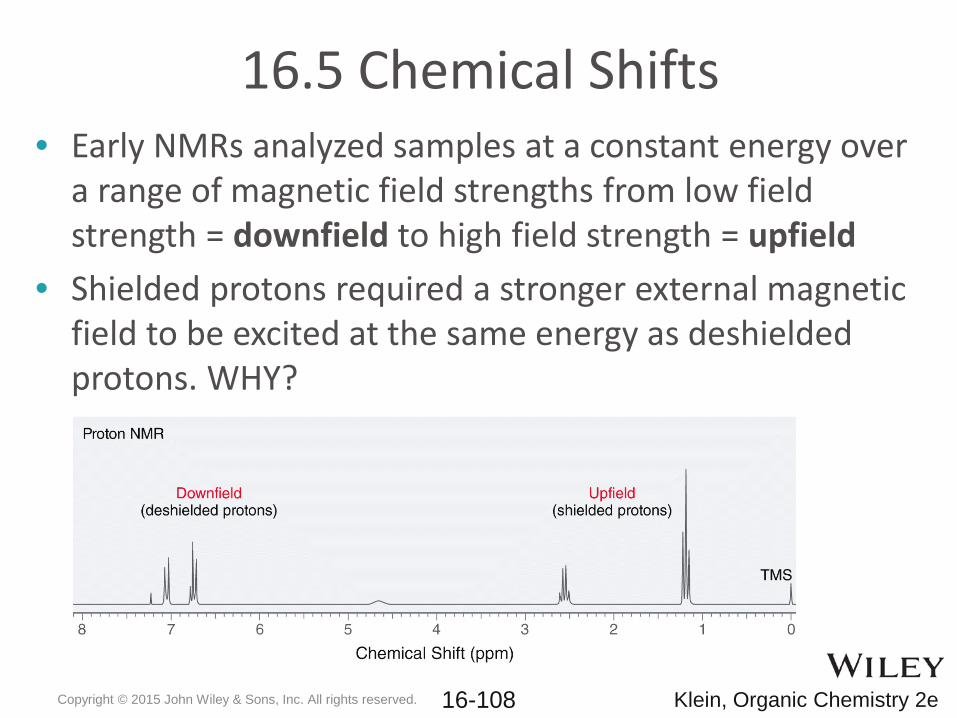
16.5 Chemical Shifts• Early NMRs analyzed samples at a constant energy over
a range of magnetic field strengths from low field strength = downfield to high field strength = upfield
• Shielded protons required a stronger external magnetic field to be excited at the same energy as deshieldedprotons. WHY?
Copyright © 2015 John Wiley & Sons, Inc. All rights reserved. Klein, Organic Chemistry 2e 16-108
16.5 Chemical Shifts
Copyright © 2015 John Wiley & Sons, Inc. All rights reserved. Klein, Organic Chemistry 2e
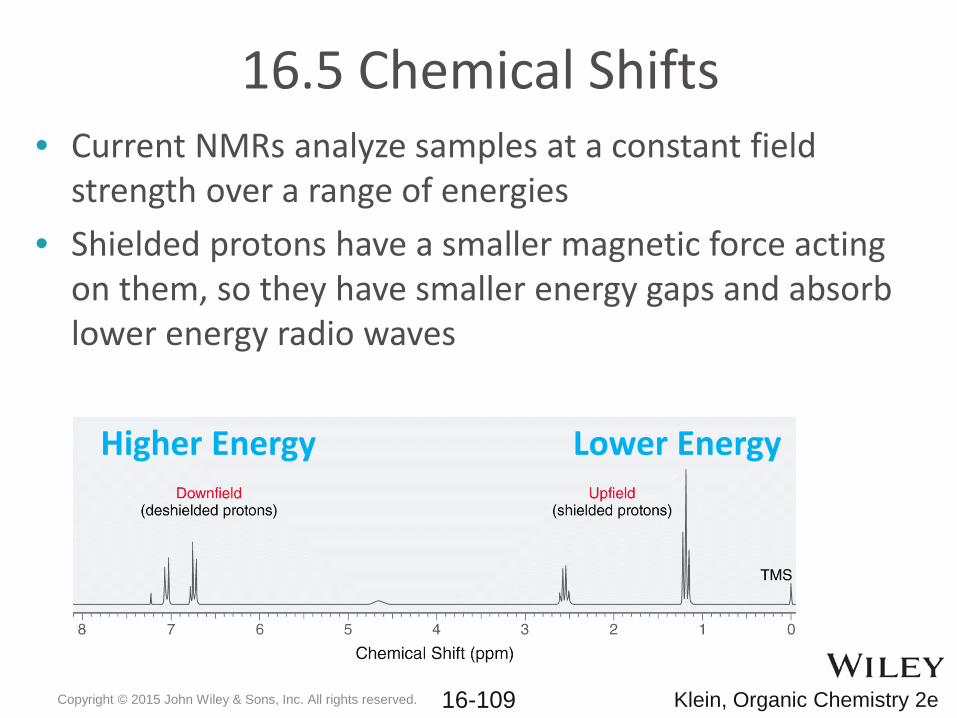
• Current NMRs analyze samples at a constant field strength over a range of energies
• Shielded protons have a smaller magnetic force acting on them, so they have smaller energy gaps and absorb lower energy radio waves
Higher Energy Lower Energy
16-109
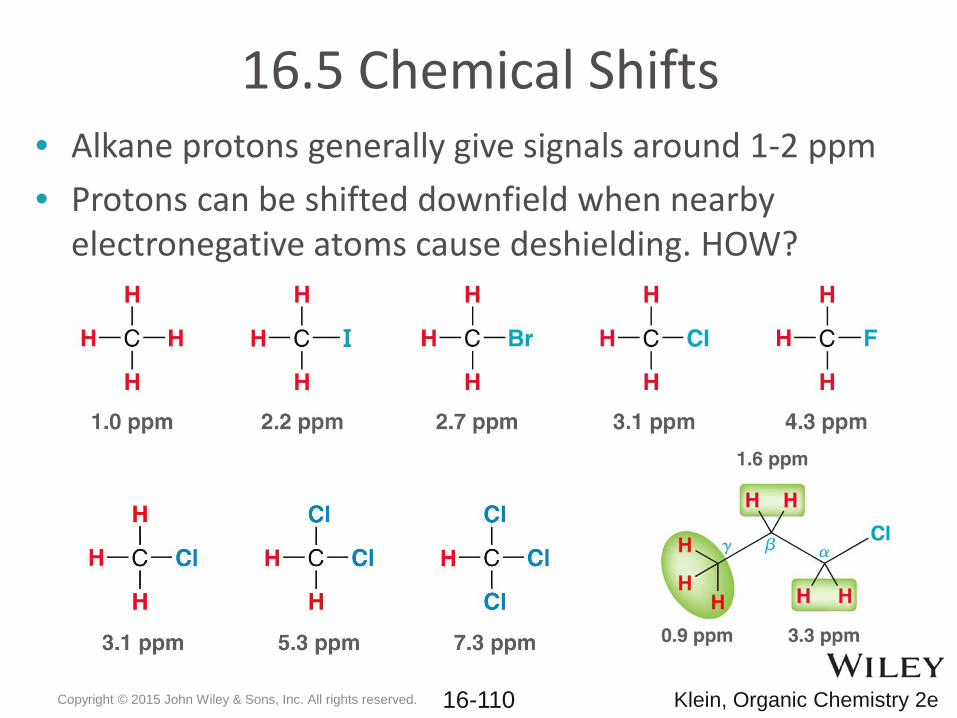
16.5 Chemical Shifts• Alkane protons generally give signals around 1-2 ppm• Protons can be shifted downfield when nearby
electronegative atoms cause deshielding. HOW?
Copyright © 2015 John Wiley & Sons, Inc. All rights reserved. Klein, Organic Chemistry 2e 16-110
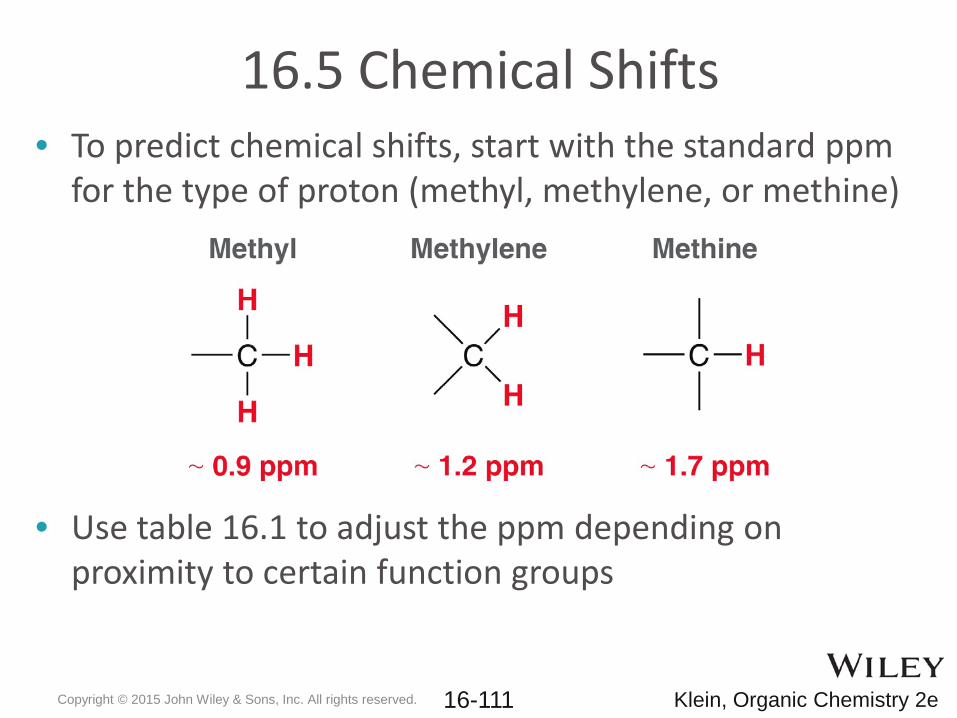
16.5 Chemical Shifts• To predict chemical shifts, start with the standard ppm
for the type of proton (methyl, methylene, or methine)
• Use table 16.1 to adjust the ppm depending on proximity to certain function groups
Copyright © 2015 John Wiley & Sons, Inc. All rights reserved. Klein, Organic Chemistry 2e 16-111
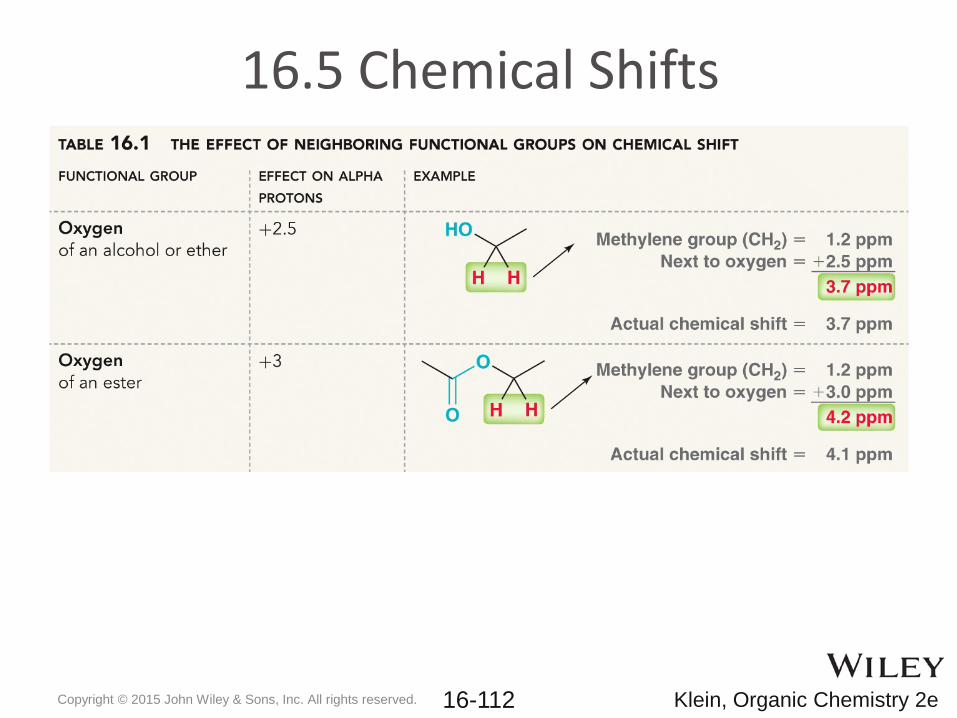
16.5 Chemical Shifts
Copyright © 2015 John Wiley & Sons, Inc. All rights reserved. Klein, Organic Chemistry 2e 16-112
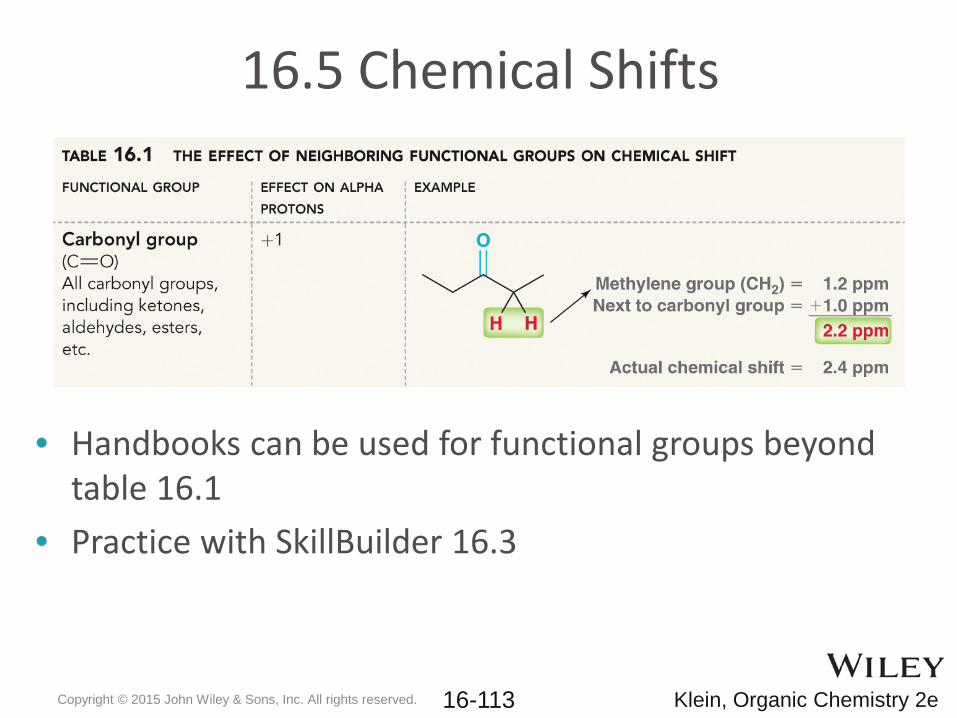
16.5 Chemical Shifts
• Handbooks can be used for functional groups beyond table 16.1
• Practice with SkillBuilder 16.3
Copyright © 2015 John Wiley & Sons, Inc. All rights reserved. Klein, Organic Chemistry 2e 16-113
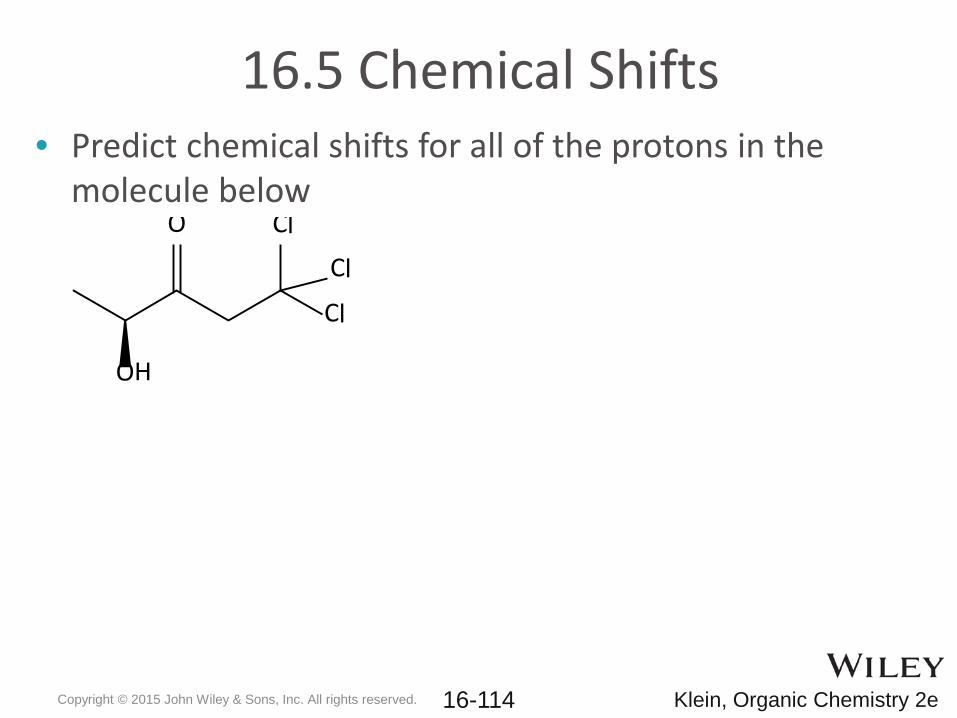
16.5 Chemical Shifts• Predict chemical shifts for all of the protons in the
molecule belowO
OH
Cl
Cl
Cl
Copyright © 2015 John Wiley & Sons, Inc. All rights reserved. Klein, Organic Chemistry 2e 16-114
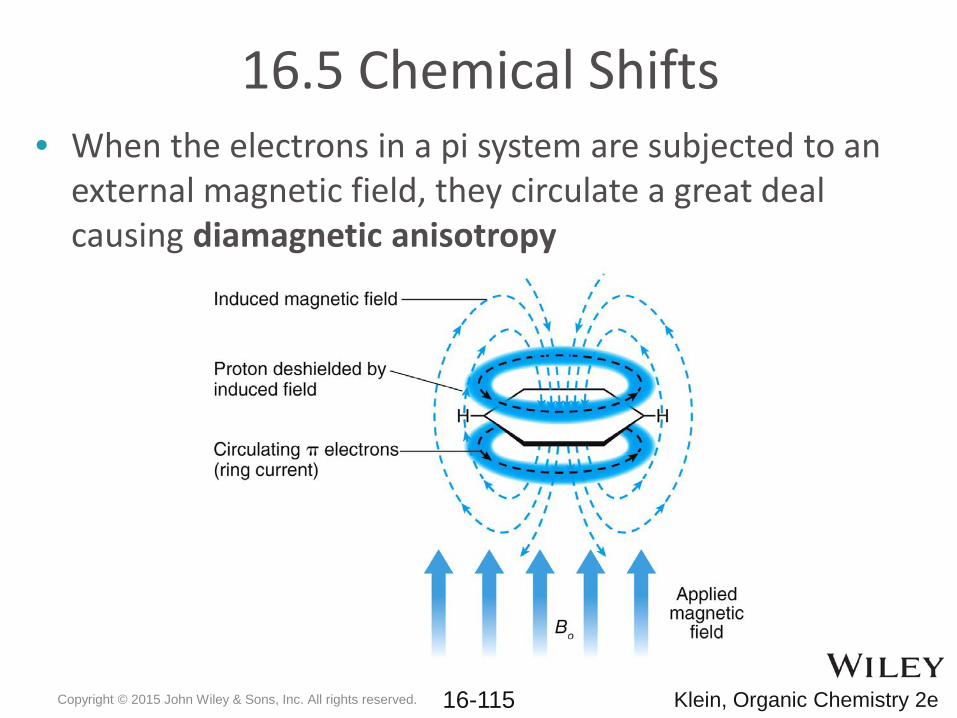
16.5 Chemical Shifts• When the electrons in a pi system are subjected to an
external magnetic field, they circulate a great deal causing diamagnetic anisotropy
Copyright © 2015 John Wiley & Sons, Inc. All rights reserved. Klein, Organic Chemistry 2e 16-115
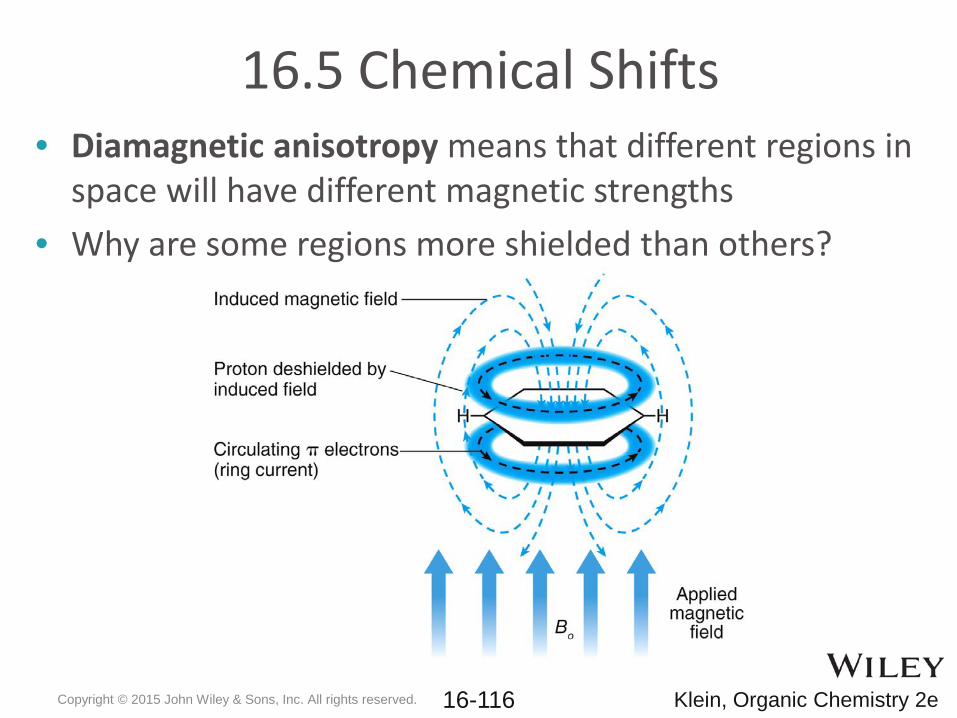
16.5 Chemical Shifts• Diamagnetic anisotropy means that different regions in
space will have different magnetic strengths• Why are some regions more shielded than others?
Copyright © 2015 John Wiley & Sons, Inc. All rights reserved. Klein, Organic Chemistry 2e 16-116
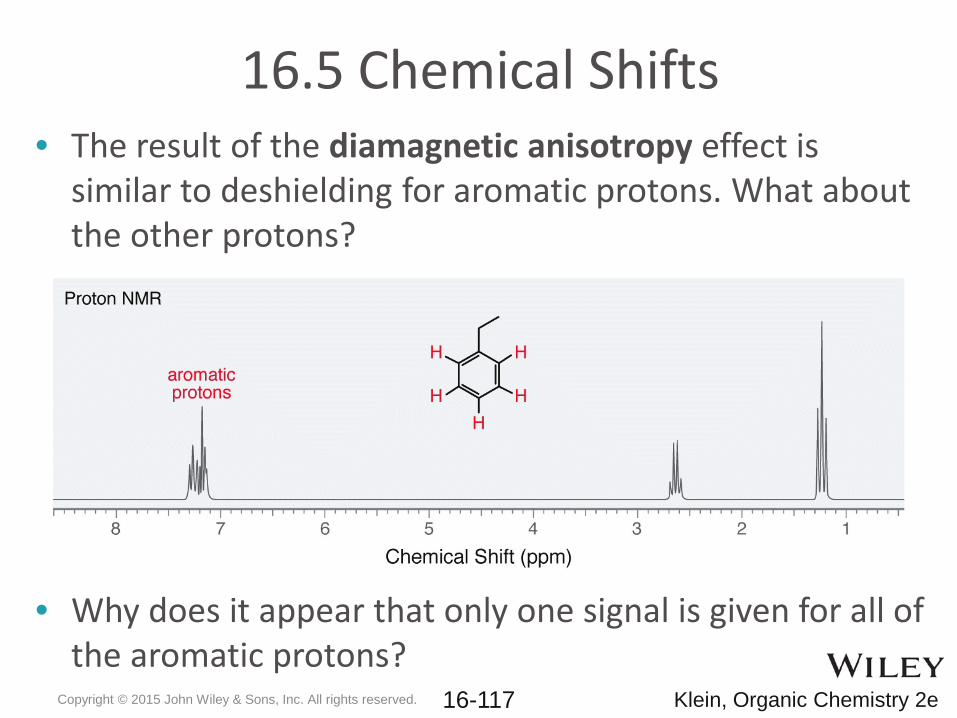
• The result of the diamagnetic anisotropy effect is similar to deshielding for aromatic protons. What about the other protons?
• Why does it appear that only one signal is given for all of the aromatic protons?
16.5 Chemical Shifts
Copyright © 2015 John Wiley & Sons, Inc. All rights reserved. Klein, Organic Chemistry 2e 16-117
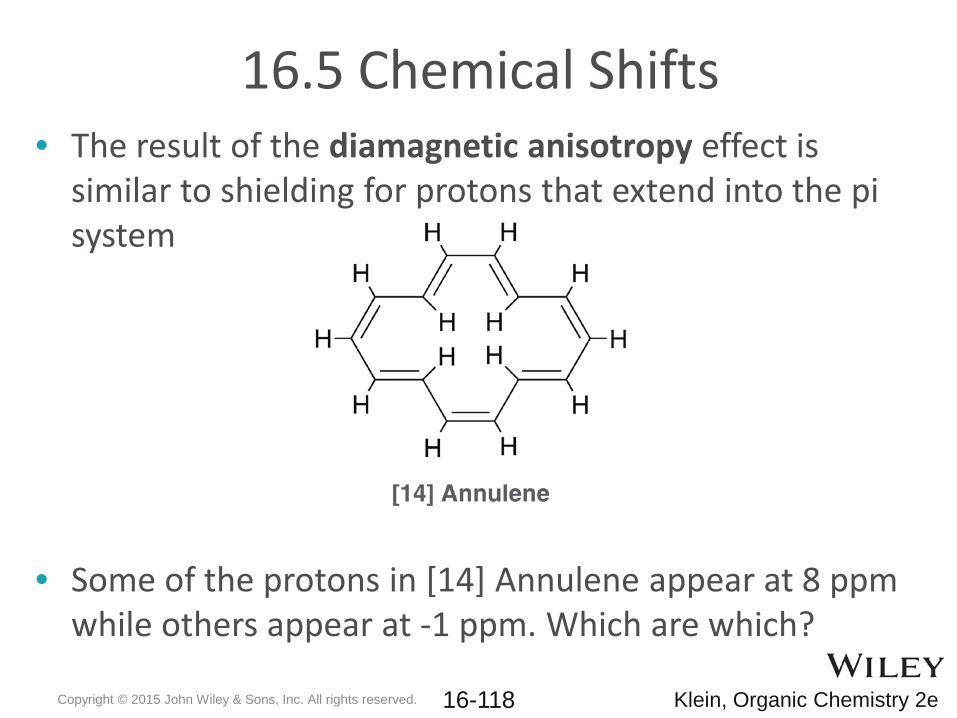
16.5 Chemical Shifts• The result of the diamagnetic anisotropy effect is
similar to shielding for protons that extend into the pi system
• Some of the protons in [14] Annulene appear at 8 ppmwhile others appear at -1 ppm. Which are which?
Copyright © 2015 John Wiley & Sons, Inc. All rights reserved. Klein, Organic Chemistry 2e 16-118
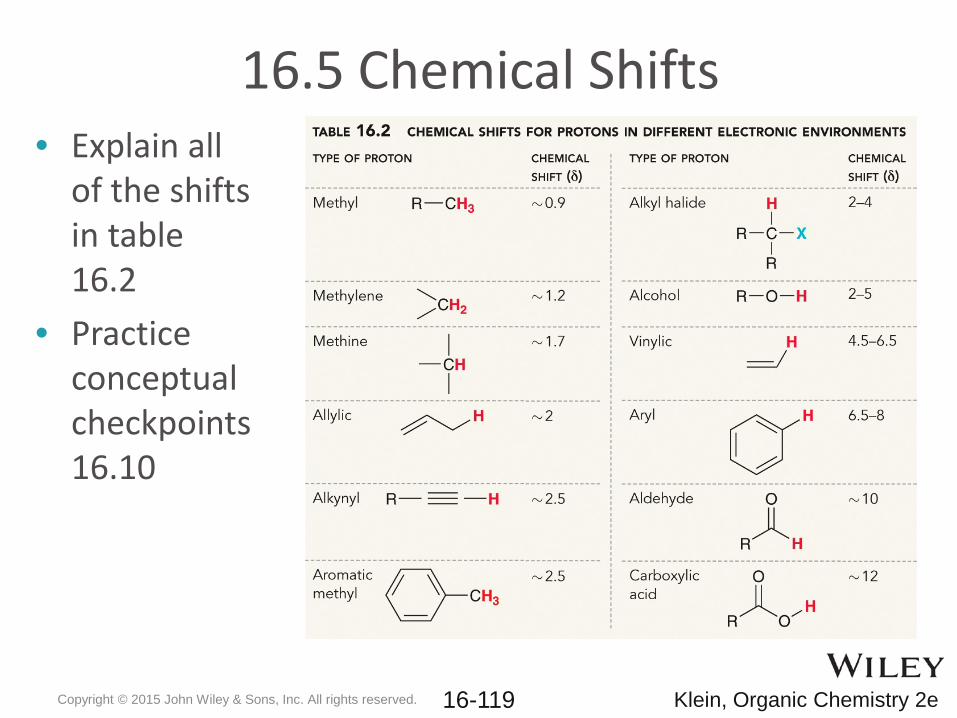
16.5 Chemical Shifts• Explain all
of the shifts in table 16.2
• Practice conceptual checkpoints 16.10
Copyright © 2015 John Wiley & Sons, Inc. All rights reserved. Klein, Organic Chemistry 2e 16-119
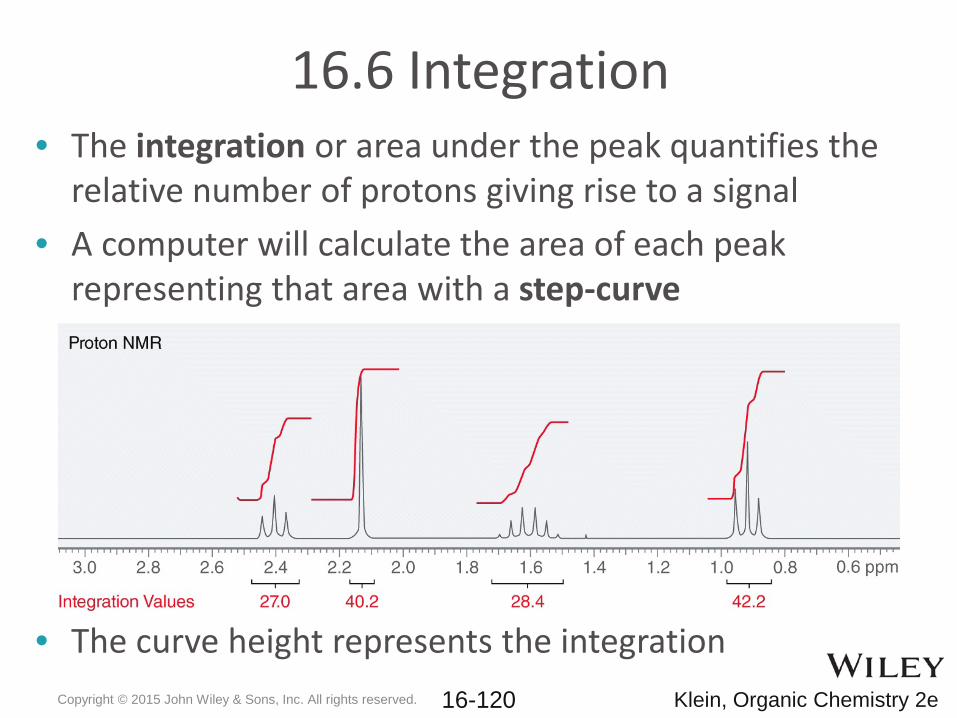
16.6 Integration• The integration or area under the peak quantifies the
relative number of protons giving rise to a signal• A computer will calculate the area of each peak
representing that area with a step-curve
• The curve height represents the integration Copyright © 2015 John Wiley & Sons, Inc. All rights reserved. Klein, Organic Chemistry 2e 16-120
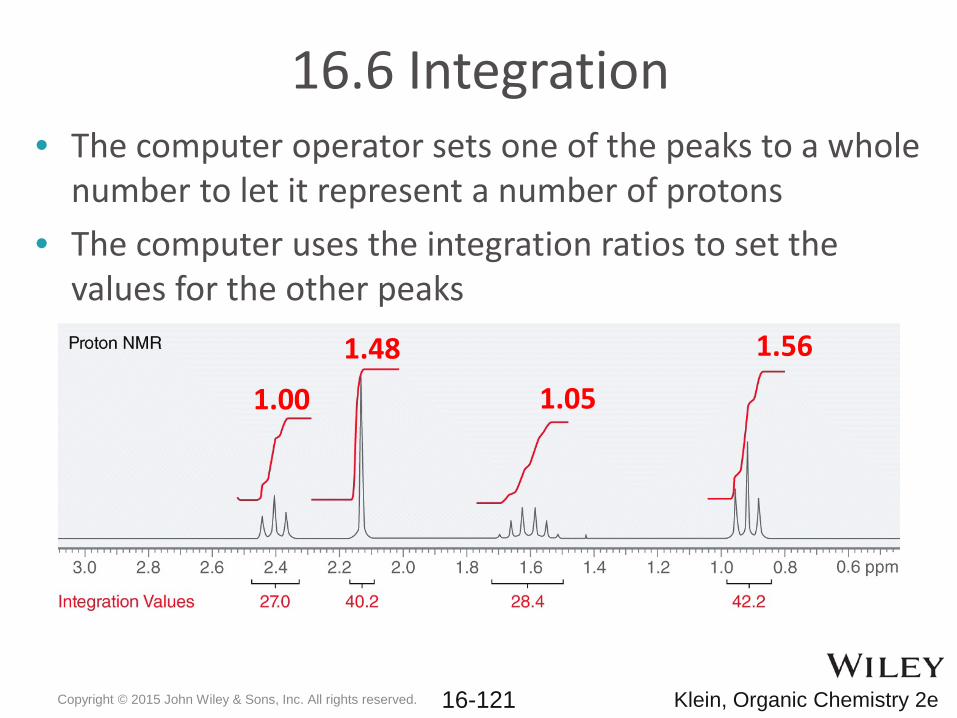
16.6 Integration• The computer operator sets one of the peaks to a whole
number to let it represent a number of protons• The computer uses the integration ratios to set the
values for the other peaks
1.00 1.051.48 1.56
Copyright © 2015 John Wiley & Sons, Inc. All rights reserved. Klein, Organic Chemistry 2e 16-121
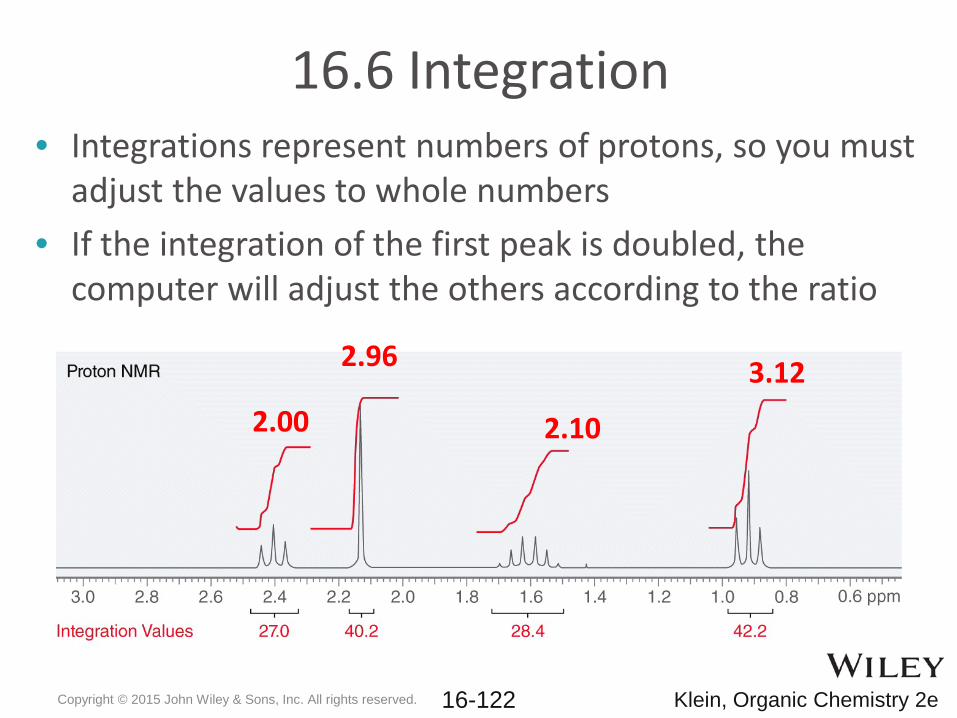
16.6 Integration• Integrations represent numbers of protons, so you must
adjust the values to whole numbers• If the integration of the first peak is doubled, the
computer will adjust the others according to the ratio
2.00 2.10
2.96 3.12
Copyright © 2015 John Wiley & Sons, Inc. All rights reserved. Klein, Organic Chemistry 2e 16-122
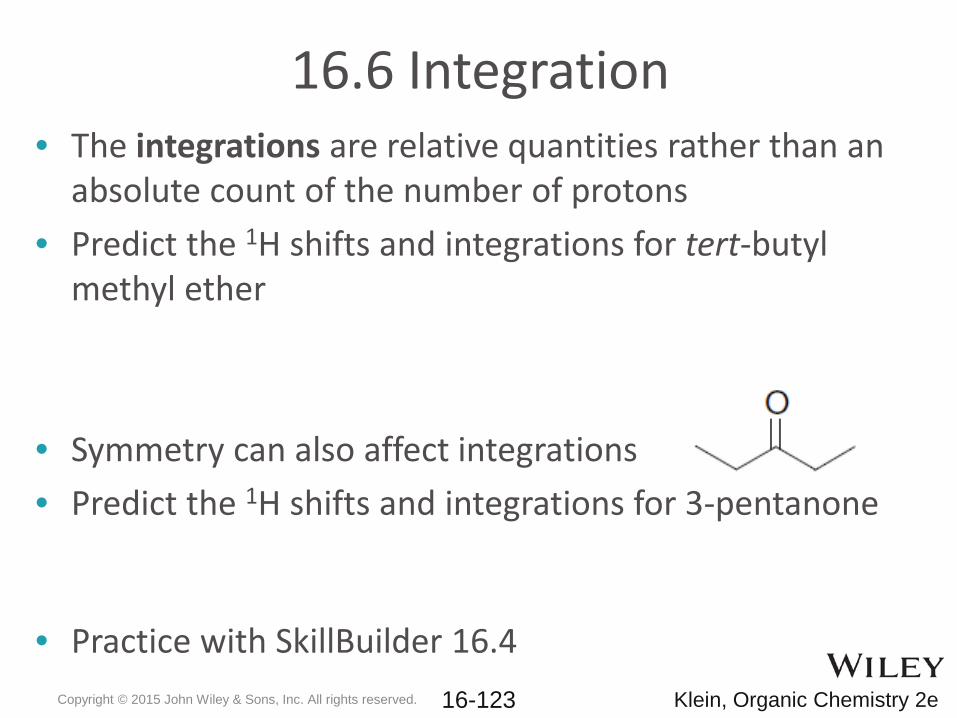
16.6 Integration• The integrations are relative quantities rather than an
absolute count of the number of protons• Predict the 1H shifts and integrations for tert-butyl
methyl ether
• Symmetry can also affect integrations• Predict the 1H shifts and integrations for 3-pentanone
• Practice with SkillBuilder 16.4Copyright © 2015 John Wiley & Sons, Inc. All rights reserved. Klein, Organic Chemistry 2e 16-123
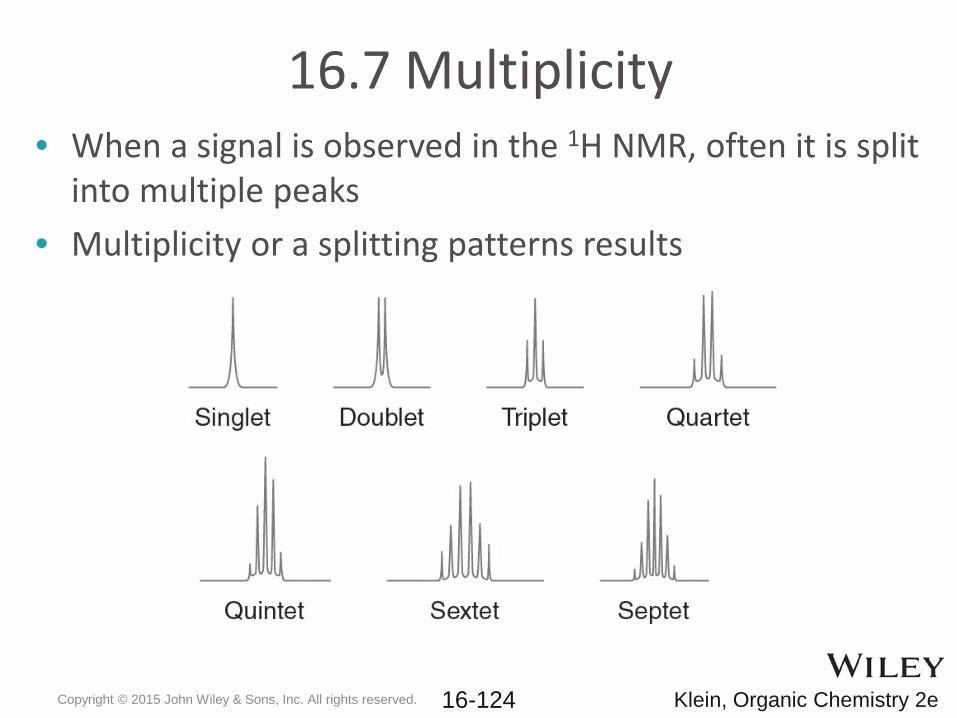
16.7 Multiplicity• When a signal is observed in the 1H NMR, often it is split
into multiple peaks• Multiplicity or a splitting patterns results
Copyright © 2015 John Wiley & Sons, Inc. All rights reserved. Klein, Organic Chemistry 2e 16-124
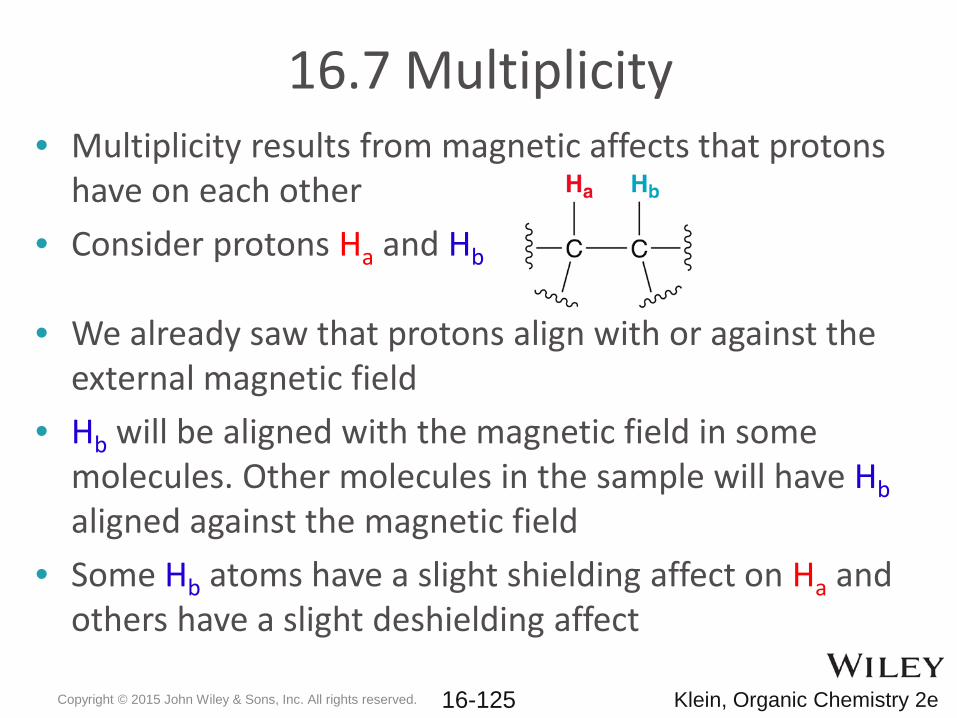
16.7 Multiplicity• Multiplicity results from magnetic affects that protons
have on each other• Consider protons Ha and Hb
• We already saw that protons align with or against the external magnetic field
• Hb will be aligned with the magnetic field in some molecules. Other molecules in the sample will have Hbaligned against the magnetic field
• Some Hb atoms have a slight shielding affect on Ha and others have a slight deshielding affect
Copyright © 2015 John Wiley & Sons, Inc. All rights reserved. Klein, Organic Chemistry 2e 16-125
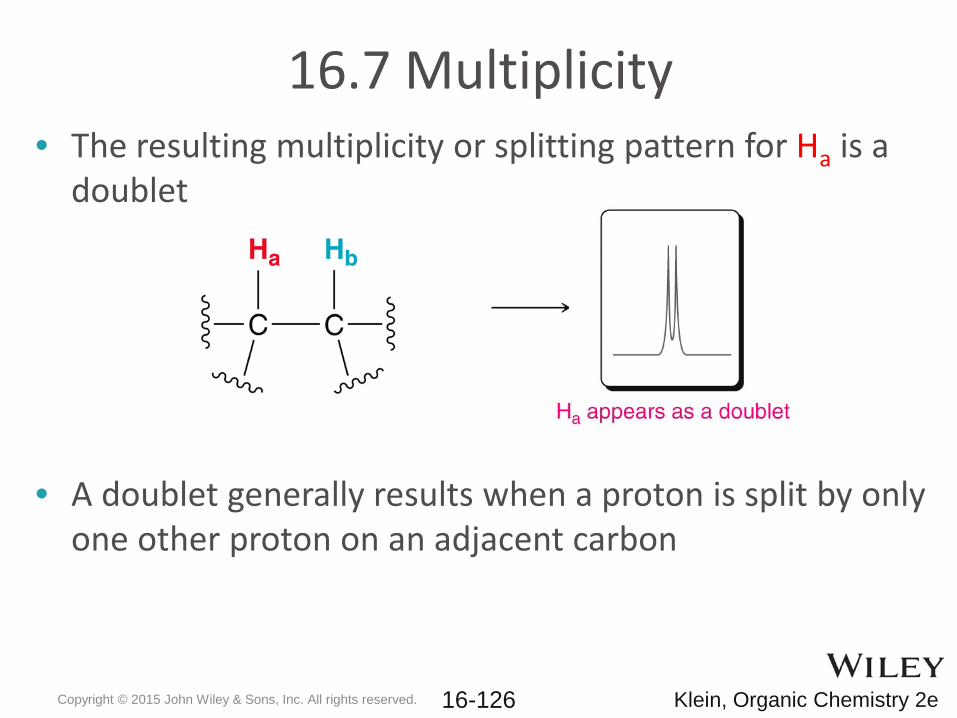
16.7 Multiplicity• The resulting multiplicity or splitting pattern for Ha is a
doublet
• A doublet generally results when a proton is split by only one other proton on an adjacent carbon
Copyright © 2015 John Wiley & Sons, Inc. All rights reserved. Klein, Organic Chemistry 2e 16-126
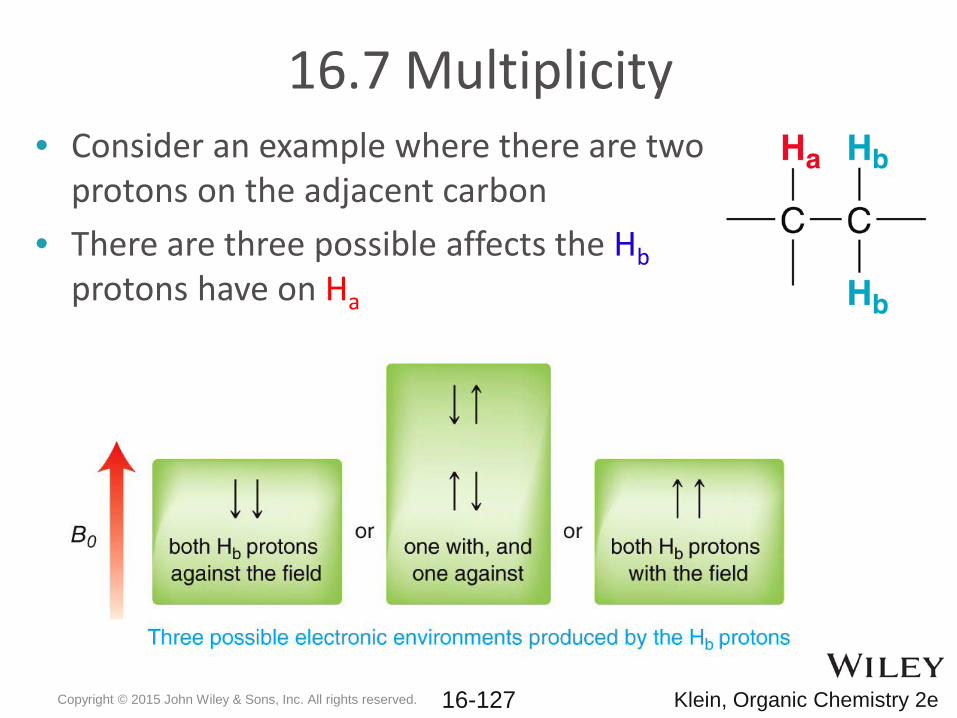
16.7 Multiplicity• Consider an example where there are two
protons on the adjacent carbon• There are three possible affects the Hb
protons have on Ha
Copyright © 2015 John Wiley & Sons, Inc. All rights reserved. Klein, Organic Chemistry 2e 16-127
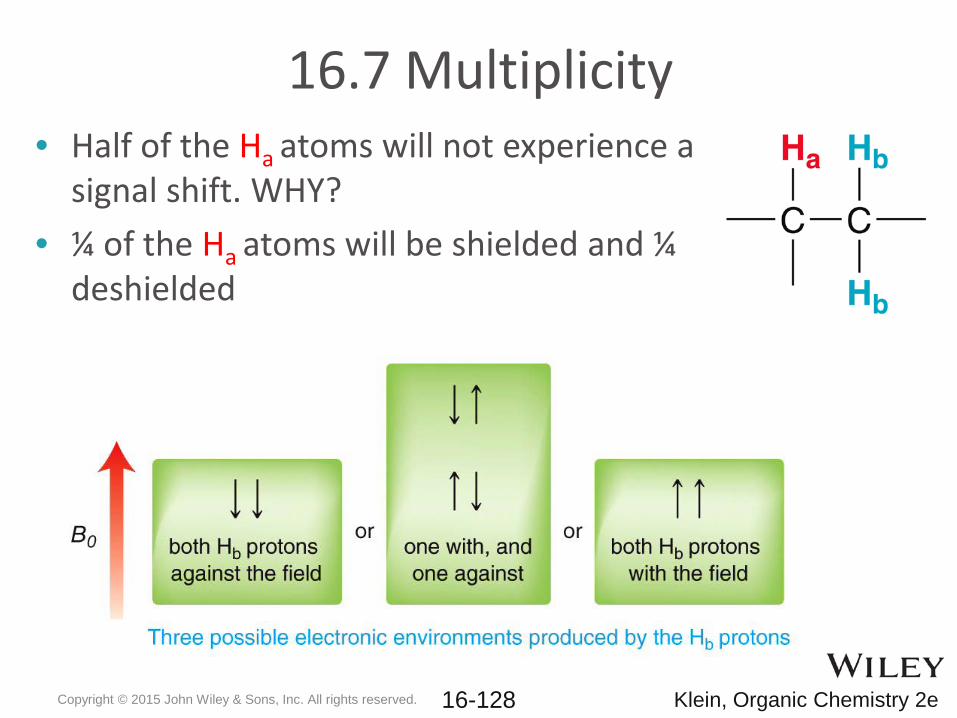
16.7 Multiplicity• Half of the Ha atoms will not experience a
signal shift. WHY?• ¼ of the Ha atoms will be shielded and ¼
deshielded
Copyright © 2015 John Wiley & Sons, Inc. All rights reserved. Klein, Organic Chemistry 2e 16-128
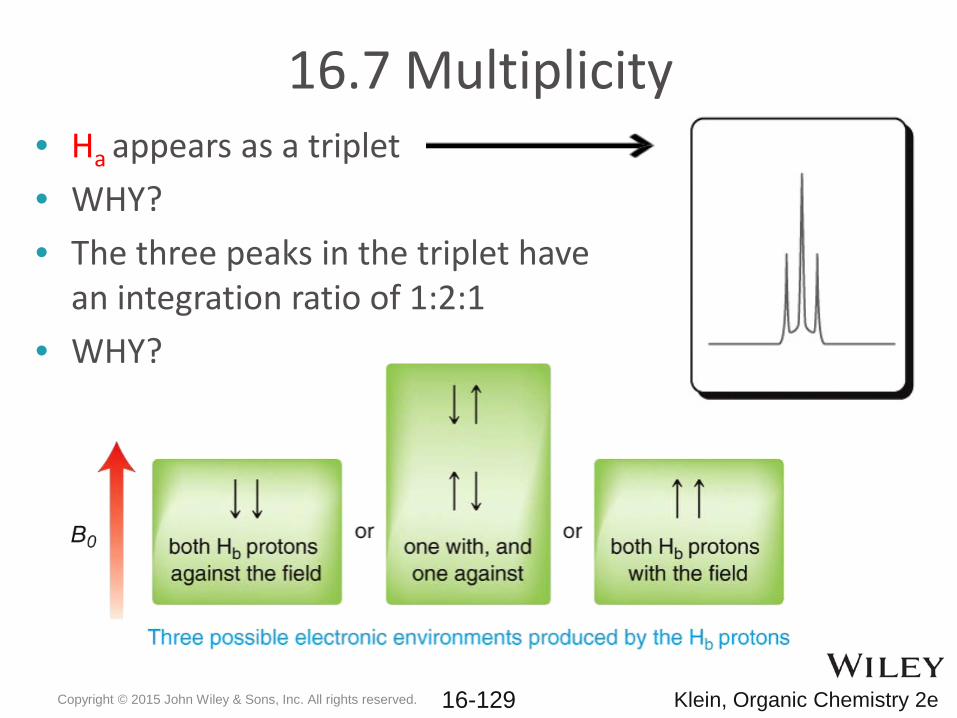
16.7 Multiplicity• Ha appears as a triplet• WHY?• The three peaks in the triplet have
an integration ratio of 1:2:1• WHY?
Copyright © 2015 John Wiley & Sons, Inc. All rights reserved. Klein, Organic Chemistry 2e 16-129
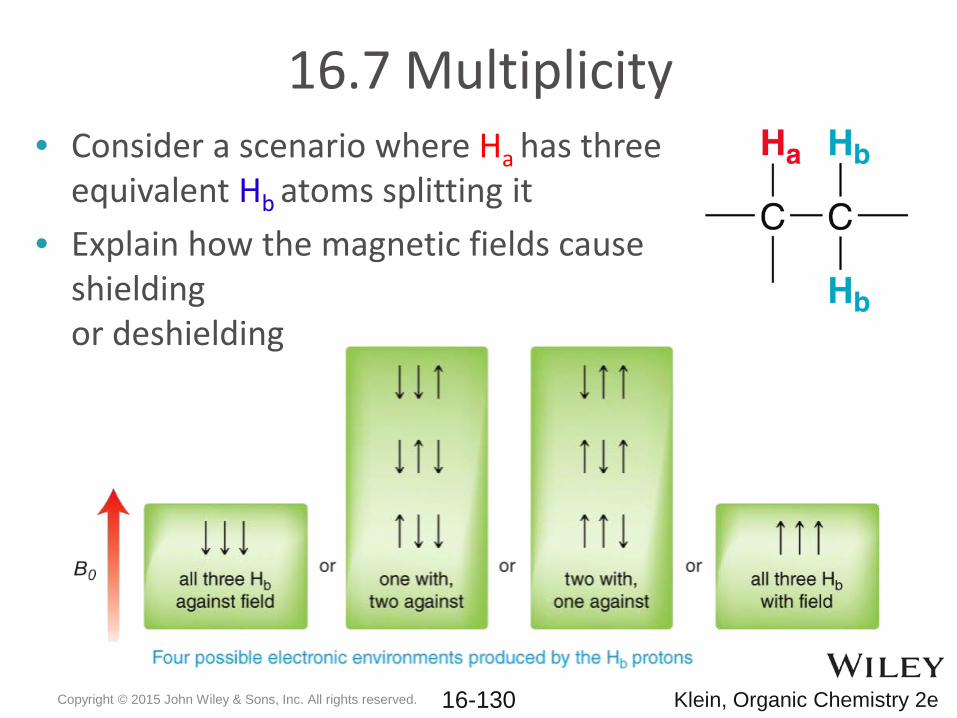
• Consider a scenario where Ha has three equivalent Hb atoms splitting it
• Explain how the magnetic fields cause shielding or deshielding
16.7 Multiplicity
Copyright © 2015 John Wiley & Sons, Inc. All rights reserved. Klein, Organic Chemistry 2e 16-130
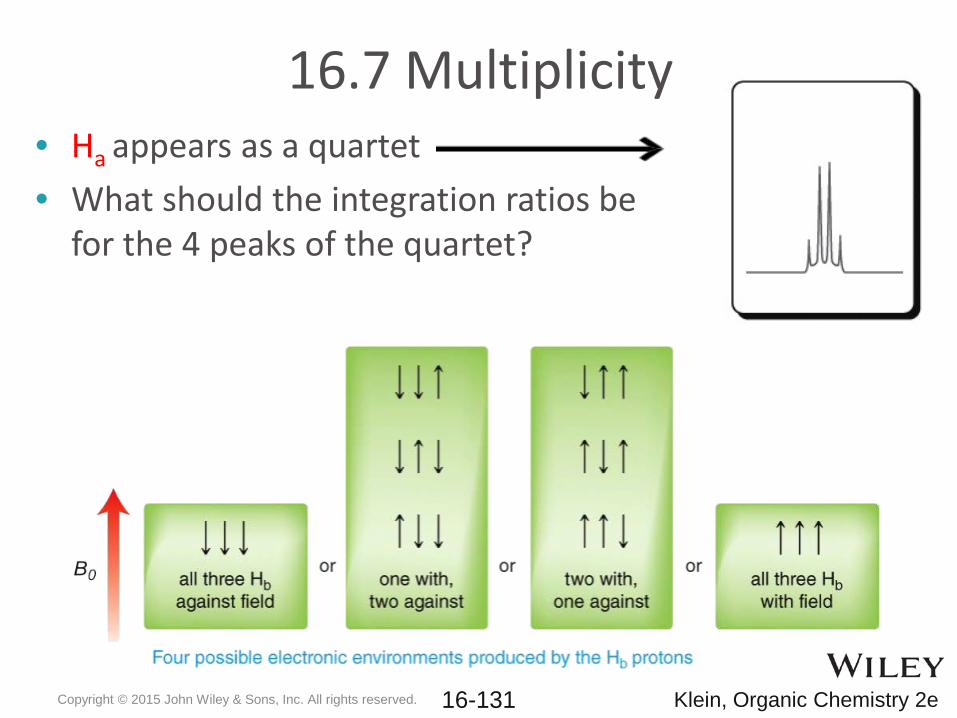
16.7 Multiplicity• Ha appears as a quartet• What should the integration ratios be
for the 4 peaks of the quartet?
Copyright © 2015 John Wiley & Sons, Inc. All rights reserved. Klein, Organic Chemistry 2e 16-131
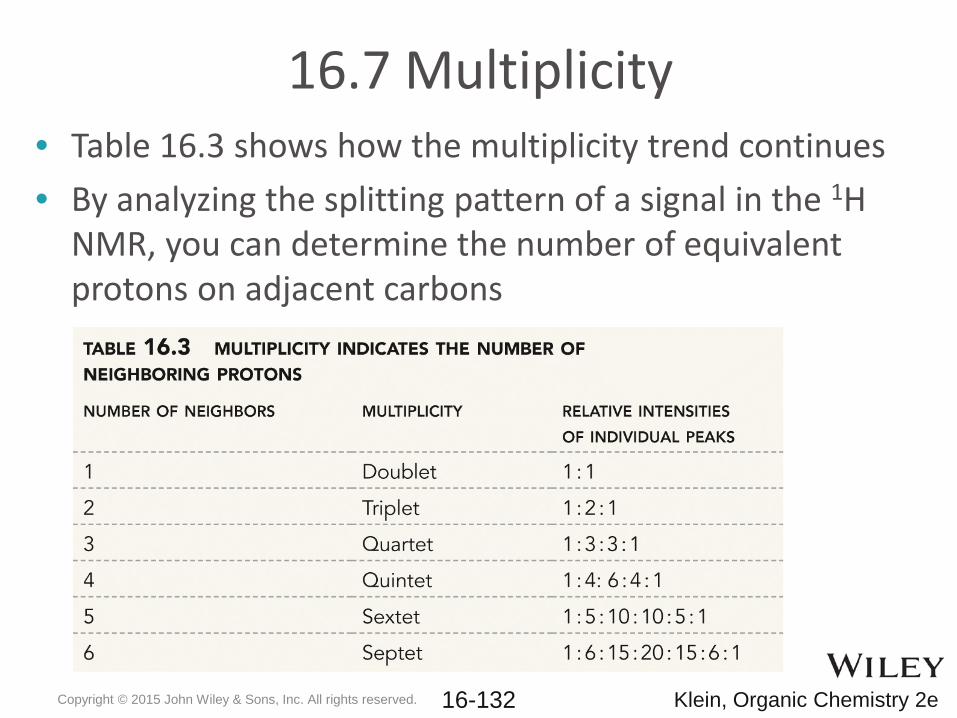
16.7 Multiplicity• Table 16.3 shows how the multiplicity trend continues• By analyzing the splitting pattern of a signal in the 1H
NMR, you can determine the number of equivalent protons on adjacent carbons
Copyright © 2015 John Wiley & Sons, Inc. All rights reserved. Klein, Organic Chemistry 2e 16-132
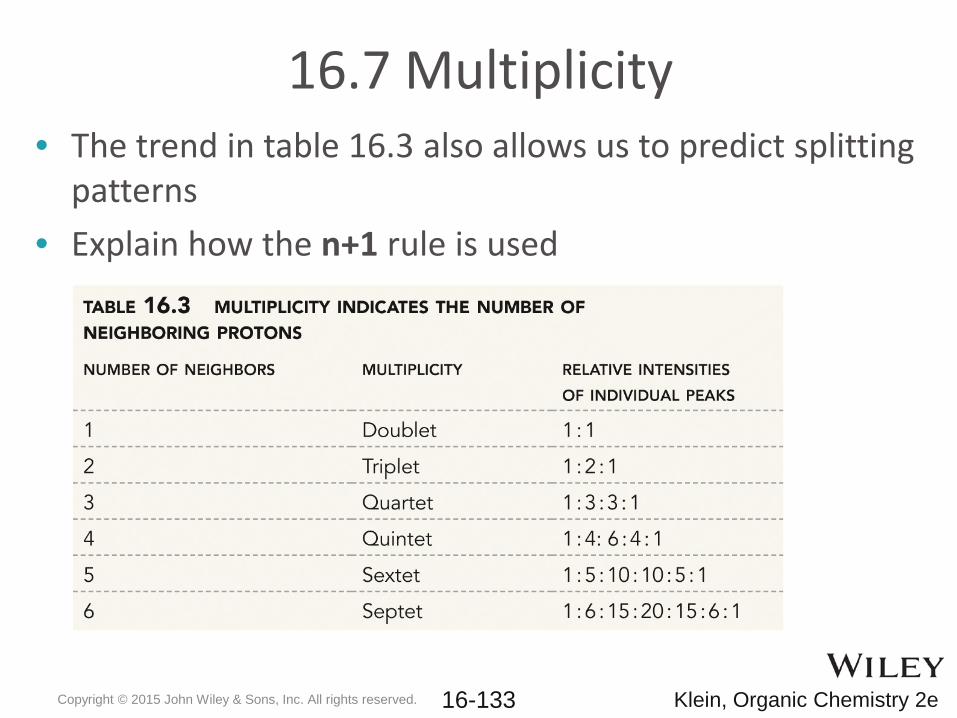
16.7 Multiplicity• The trend in table 16.3 also allows us to predict splitting
patterns• Explain how the n+1 rule is used
Copyright © 2015 John Wiley & Sons, Inc. All rights reserved. Klein, Organic Chemistry 2e 16-133
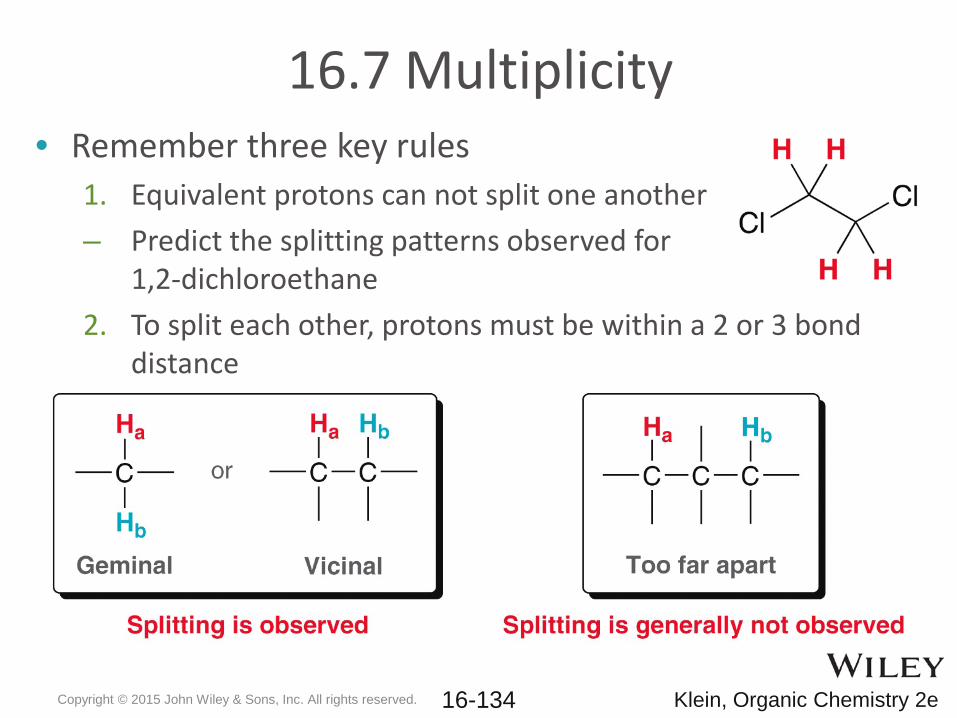
16.7 Multiplicity• Remember three key rules
1. Equivalent protons can not split one another– Predict the splitting patterns observed for
1,2-dichloroethane2. To split each other, protons must be within a 2 or 3 bond
distance
Copyright © 2015 John Wiley & Sons, Inc. All rights reserved. Klein, Organic Chemistry 2e 16-134
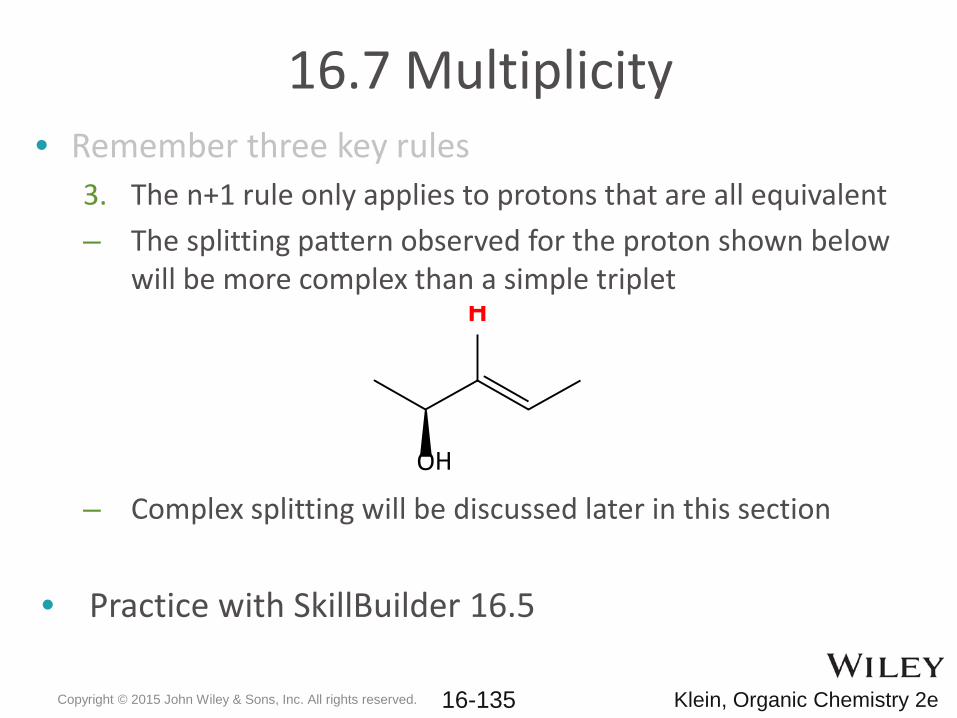
16.7 Multiplicity• Remember three key rules
3. The n+1 rule only applies to protons that are all equivalent– The splitting pattern observed for the proton shown below
will be more complex than a simple triplet
– Complex splitting will be discussed later in this section
• Practice with SkillBuilder 16.5
OH
H
Copyright © 2015 John Wiley & Sons, Inc. All rights reserved. Klein, Organic Chemistry 2e 16-135
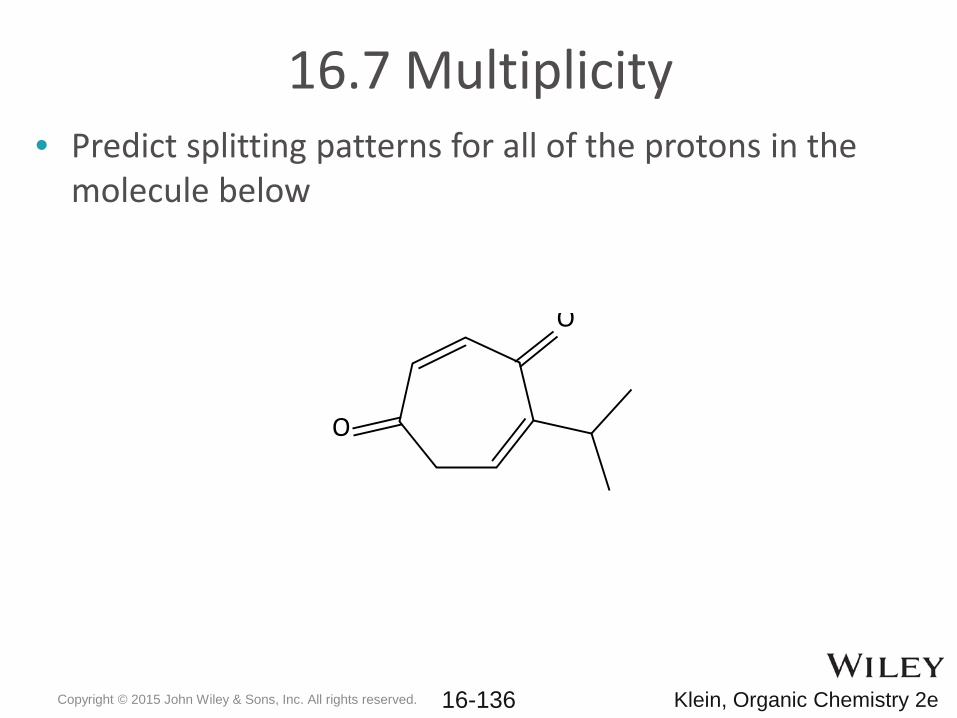
16.7 Multiplicity• Predict splitting patterns for all of the protons in the
molecule below
O
O
Copyright © 2015 John Wiley & Sons, Inc. All rights reserved. Klein, Organic Chemistry 2e 16-136
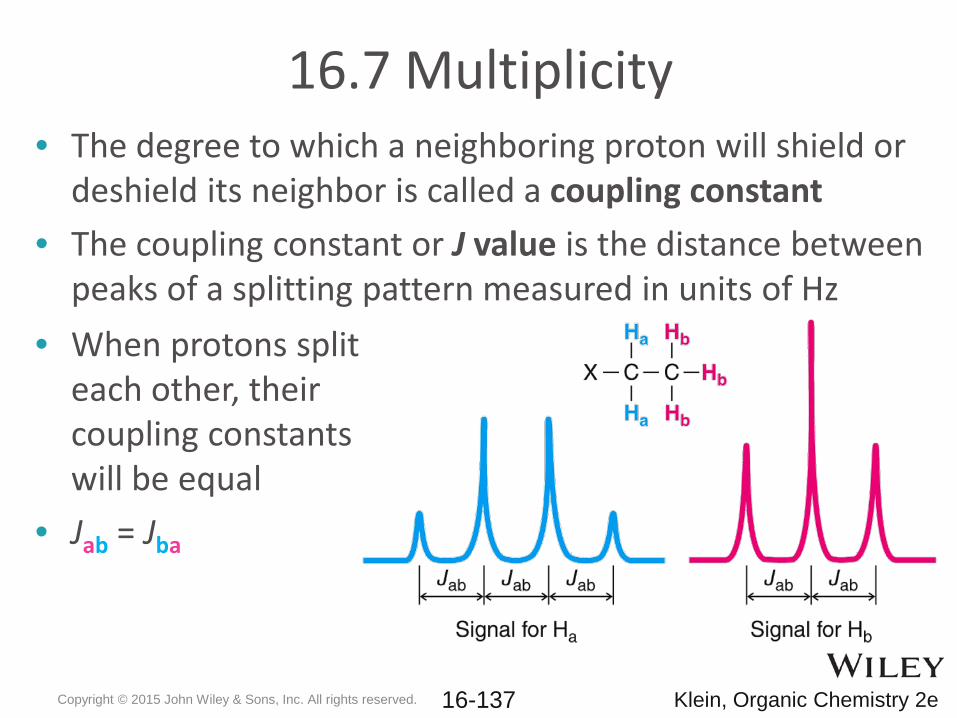
16.7 Multiplicity• The degree to which a neighboring proton will shield or
deshield its neighbor is called a coupling constant• The coupling constant or J value is the distance between
peaks of a splitting pattern measured in units of Hz• When protons split
each other, their coupling constants will be equal
• Jab = Jba
Copyright © 2015 John Wiley & Sons, Inc. All rights reserved. Klein, Organic Chemistry 2e 16-137
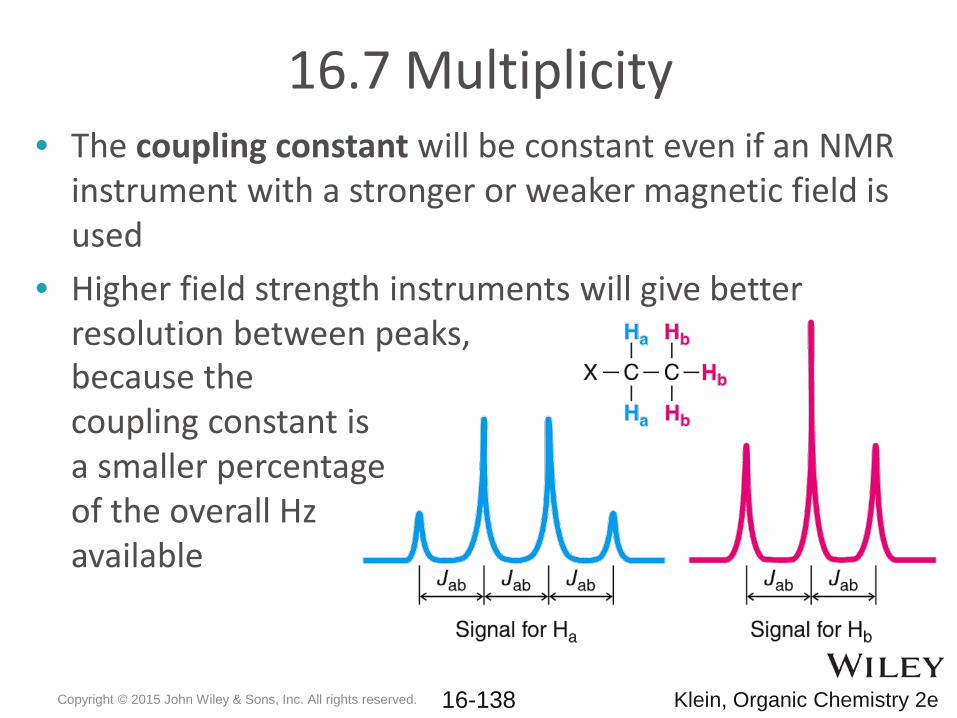
• The coupling constant will be constant even if an NMR instrument with a stronger or weaker magnetic field is used
• Higher field strength instruments will give better resolution between peaks,
16.7 Multiplicity
because the coupling constant is a smaller percentage of the overall Hz available
Copyright © 2015 John Wiley & Sons, Inc. All rights reserved. Klein, Organic Chemistry 2e 16-138
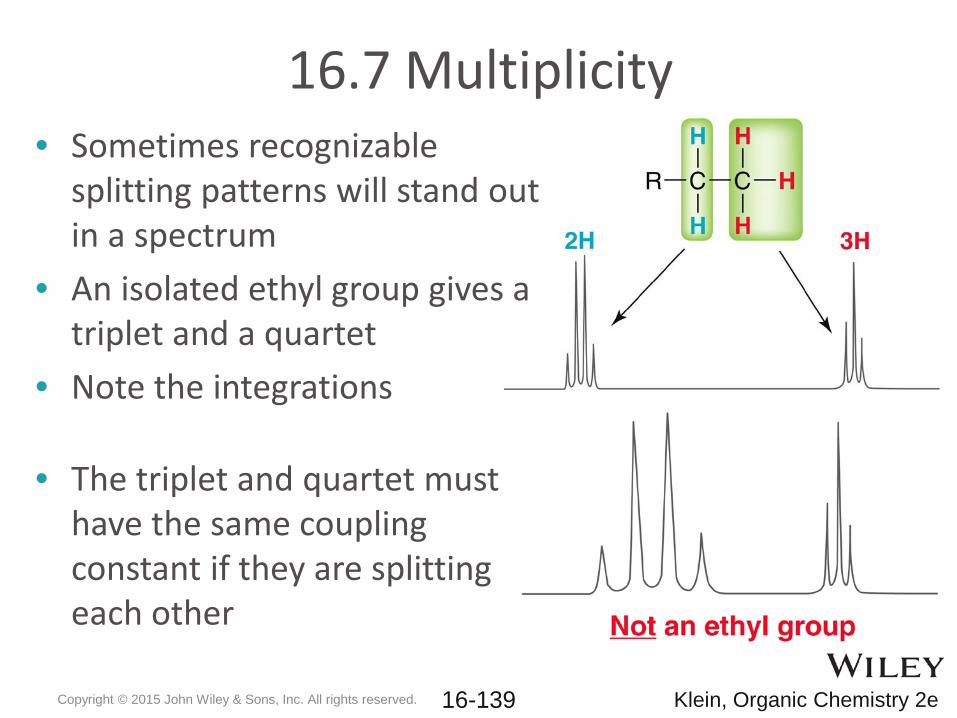
16.7 Multiplicity• Sometimes recognizable
splitting patterns will stand out in a spectrum
• An isolated ethyl group gives a triplet and a quartet
• Note the integrations
• The triplet and quartet must have the same coupling constant if they are splitting each other
Copyright © 2015 John Wiley & Sons, Inc. All rights reserved. Klein, Organic Chemistry 2e 16-139
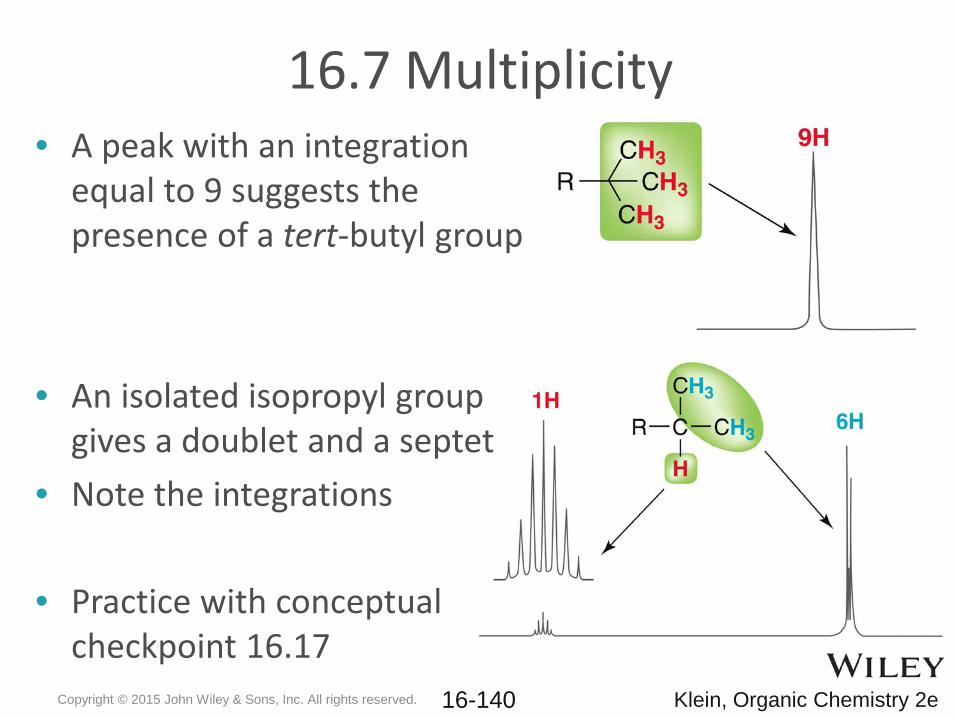
16.7 Multiplicity• A peak with an integration
equal to 9 suggests the presence of a tert-butyl group
• An isolated isopropyl group gives a doublet and a septet
• Note the integrations
• Practice with conceptual checkpoint 16.17
Copyright © 2015 John Wiley & Sons, Inc. All rights reserved. Klein, Organic Chemistry 2e 16-140
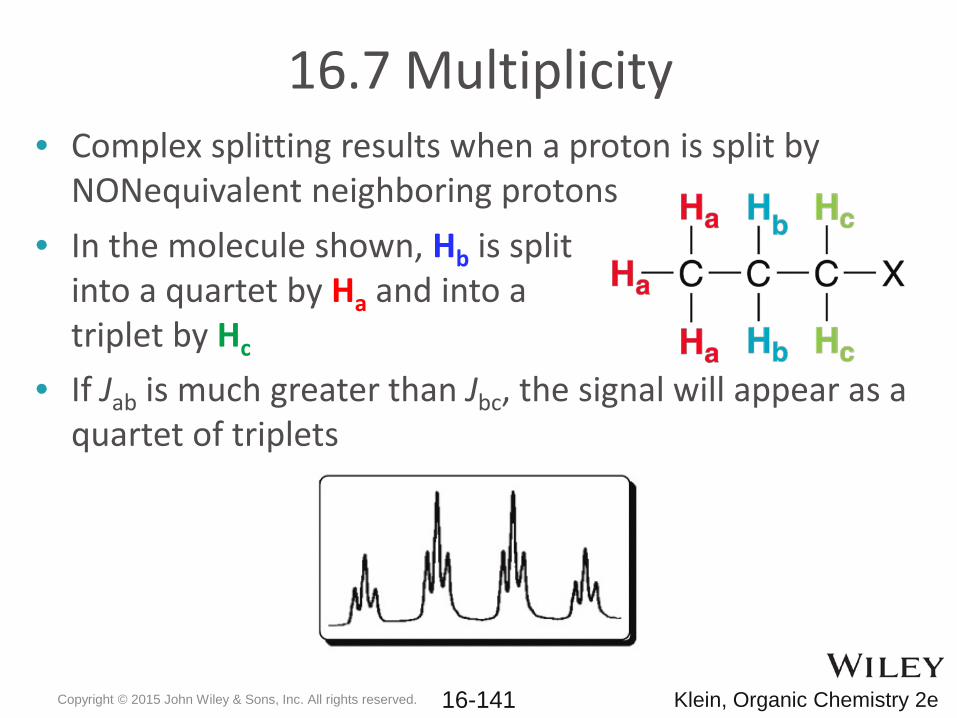
16.7 Multiplicity• Complex splitting results when a proton is split by
NONequivalent neighboring protons
• If Jab is much greater than Jbc, the signal will appear as a quartet of triplets
• In the molecule shown, Hb is split into a quartet by Ha and into a triplet by Hc
Copyright © 2015 John Wiley & Sons, Inc. All rights reserved. Klein, Organic Chemistry 2e 16-141
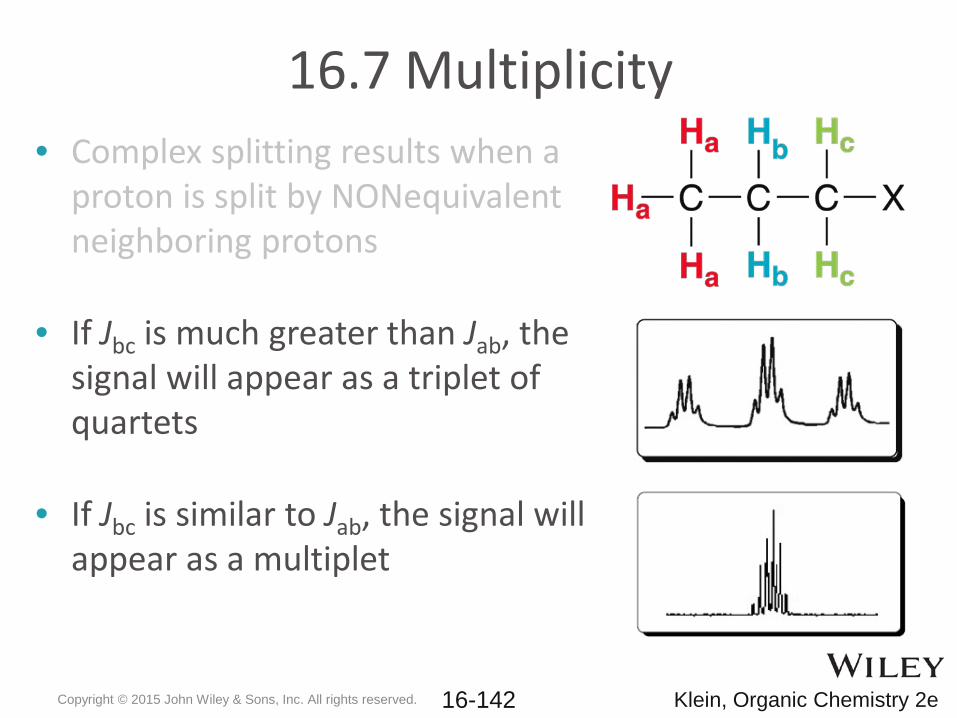
16.7 Multiplicity• Complex splitting results when a
proton is split by NONequivalent neighboring protons
• If Jbc is much greater than Jab, the signal will appear as a triplet of quartets
• If Jbc is similar to Jab, the signal will appear as a multiplet
Copyright © 2015 John Wiley & Sons, Inc. All rights reserved. Klein, Organic Chemistry 2e 16-142
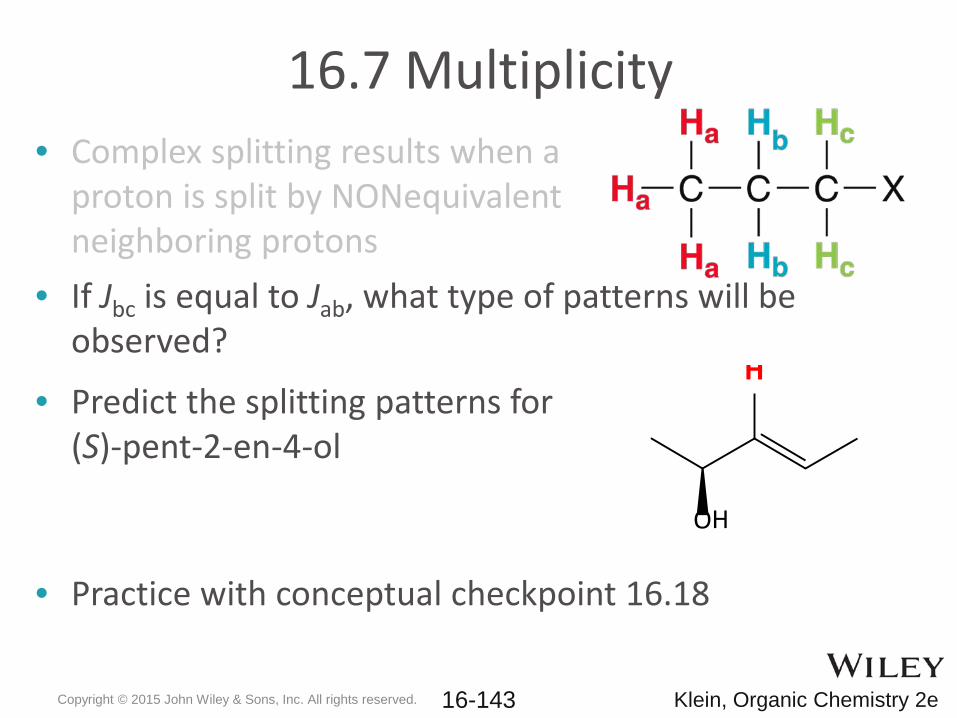
• If Jbc is equal to Jab, what type of patterns will be observed?
• Practice with conceptual checkpoint 16.18
16.7 Multiplicity• Complex splitting results when a
proton is split by NONequivalent neighboring protons
• Predict the splitting patterns for (S)-pent-2-en-4-ol
OH
H
Copyright © 2015 John Wiley & Sons, Inc. All rights reserved. Klein, Organic Chemistry 2e 16-143
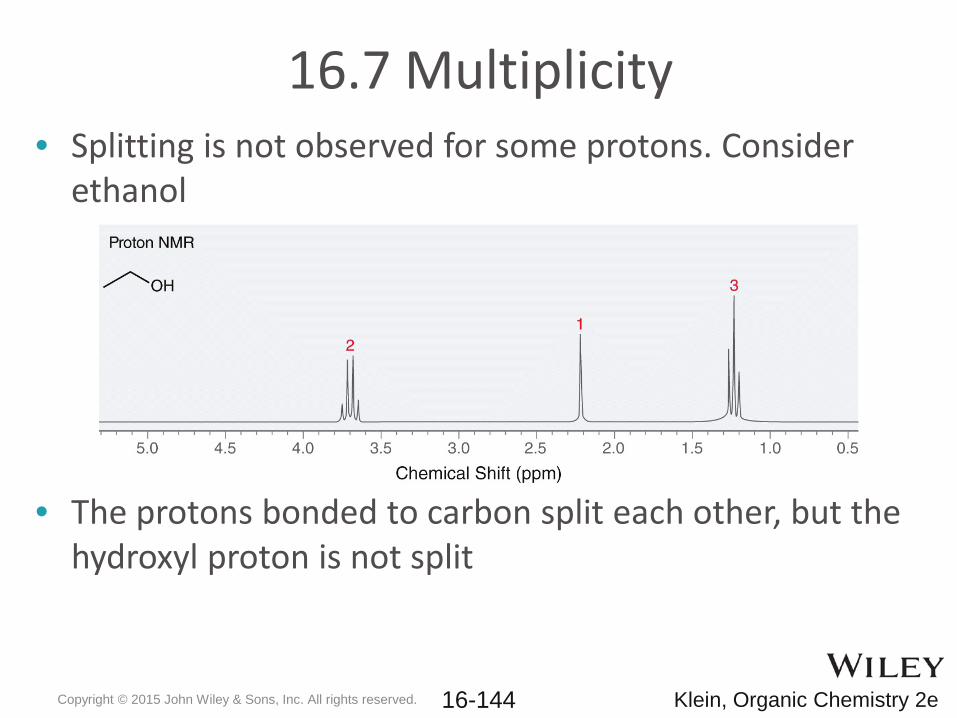
16.7 Multiplicity• Splitting is not observed for some protons. Consider
ethanol
• The protons bonded to carbon split each other, but the hydroxyl proton is not split
Copyright © 2015 John Wiley & Sons, Inc. All rights reserved. Klein, Organic Chemistry 2e 16-144
16.7 Multiplicity• The hydroxyl proton and other labile or exchangeable
protons undergo rapid exchange with trace amounts of acid. Show a reasonable mechanism
• Such exchange blurs the shielding/deshielding affect of the neighboring protons giving a singlet that is often broadened
• If ethanol is rigorously purified to remove traces of acid, then hydroxyl proton splitting is generally observed
• Aldehyde protons also often appear as singlet because their coupling constants are sometimes too small to cause observable splitting
Copyright © 2015 John Wiley & Sons, Inc. All rights reserved. Klein, Organic Chemistry 2e 16-145
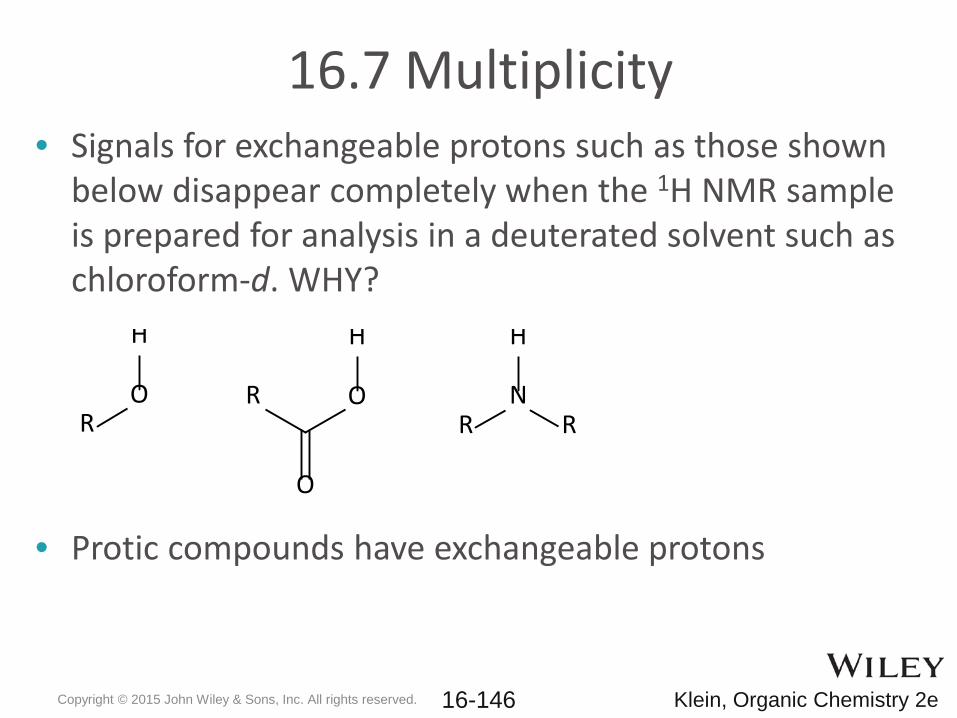
16.7 Multiplicity• Signals for exchangeable protons such as those shown
below disappear completely when the 1H NMR sample is prepared for analysis in a deuterated solvent such as chloroform-d. WHY?
• Protic compounds have exchangeable protons
RO
H
O
H
O
RR
N
H
R
Copyright © 2015 John Wiley & Sons, Inc. All rights reserved. Klein, Organic Chemistry 2e 16-146
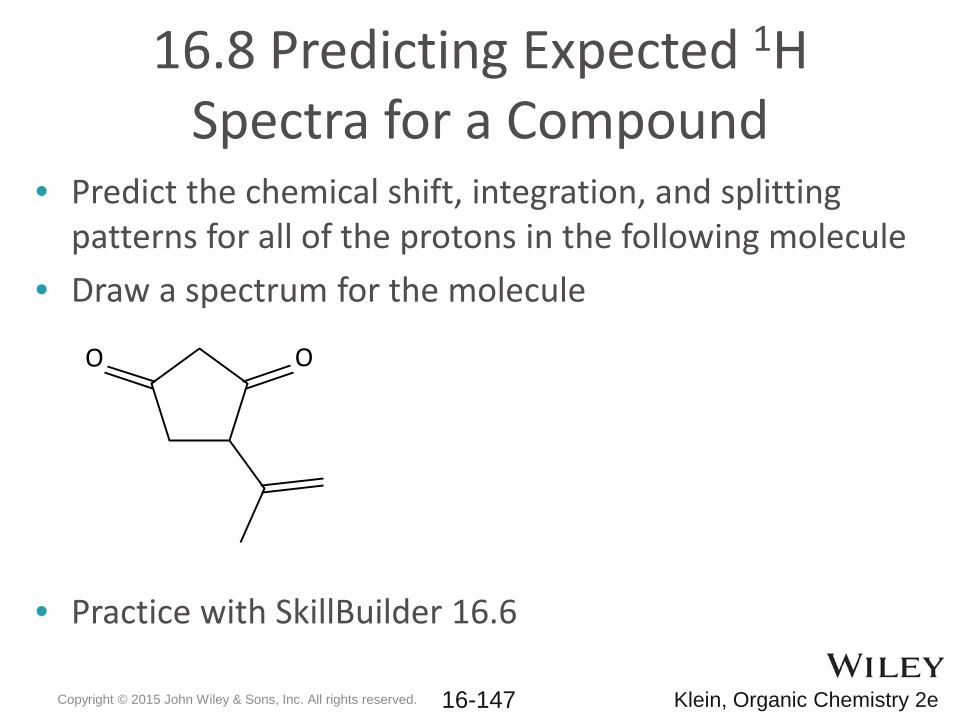
16.8 Predicting Expected 1H Spectra for a Compound
• Predict the chemical shift, integration, and splitting patterns for all of the protons in the following molecule
• Draw a spectrum for the molecule
• Practice with SkillBuilder 16.6
O O
Copyright © 2015 John Wiley & Sons, Inc. All rights reserved. Klein, Organic Chemistry 2e 16-147
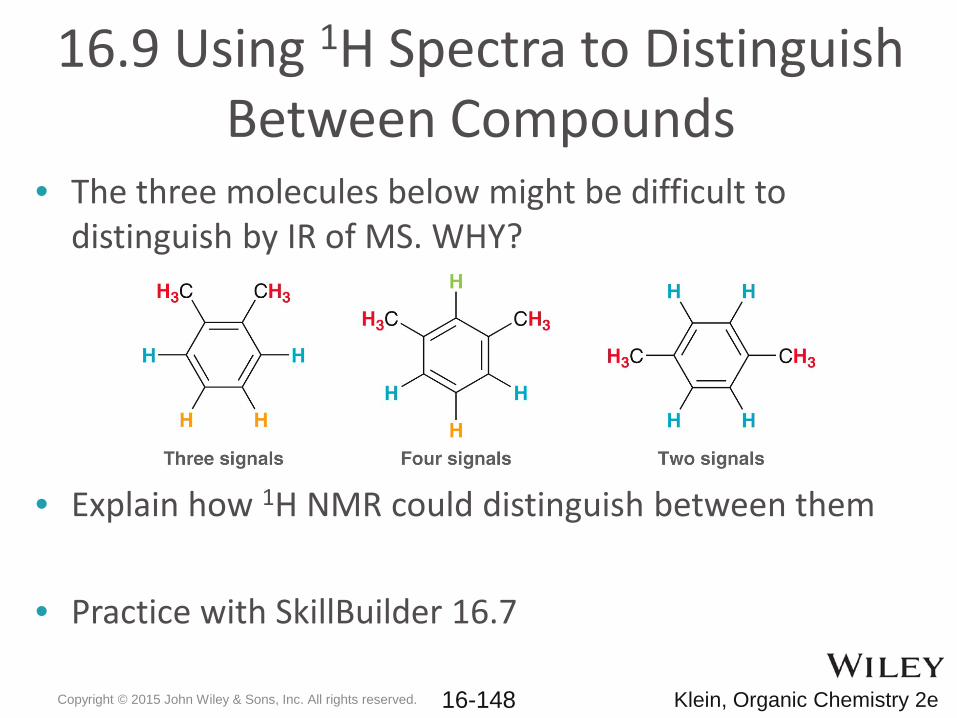
16.9 Using 1H Spectra to Distinguish Between Compounds
• The three molecules below might be difficult to distinguish by IR of MS. WHY?
• Explain how 1H NMR could distinguish between them
• Practice with SkillBuilder 16.7
Copyright © 2015 John Wiley & Sons, Inc. All rights reserved. Klein, Organic Chemistry 2e 16-148
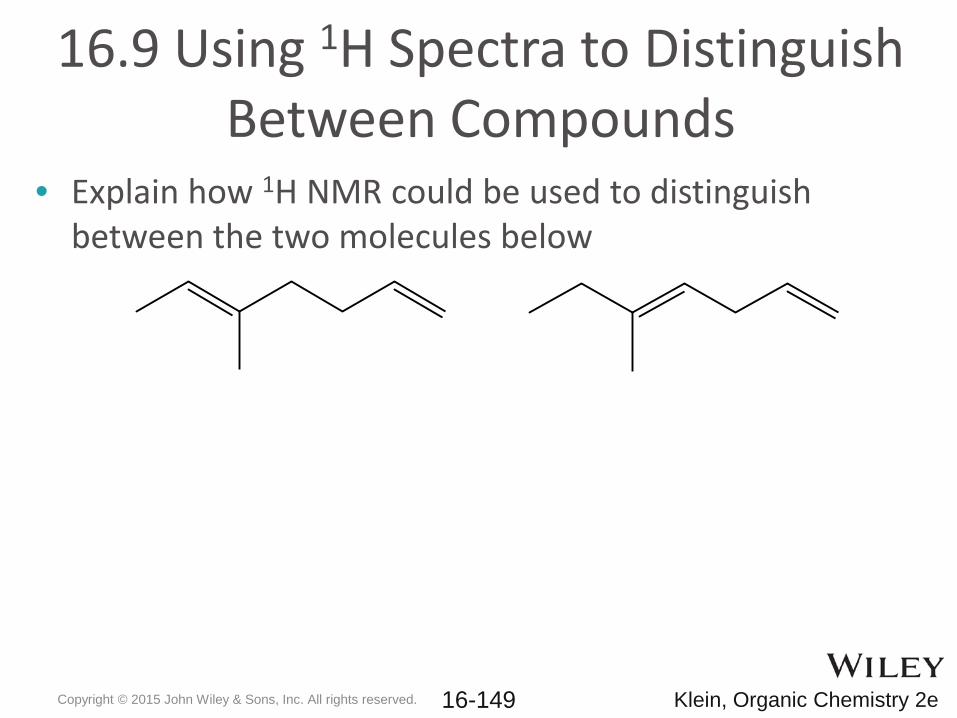
16.9 Using 1H Spectra to Distinguish Between Compounds
• Explain how 1H NMR could be used to distinguish between the two molecules below
Copyright © 2015 John Wiley & Sons, Inc. All rights reserved. Klein, Organic Chemistry 2e 16-149
16.10 Analyzing a 1H NMR Spectrum• With a given formula and 1H NMR spectrum, you can
determine a molecule’s structure by a 4-step process1. Calculate the degree or unsaturation or hydrogen deficiency
index (HDI). What does the HDI tell you?2. Consider the number of NMR signals and integration to look
for symmetry in the molecule3. Analyze each signal, and draw molecular fragments that
match the shift, integration, and multiplicity4. Assemble the fragments into a complete structure like puzzle
pieces
• Practice with SkillBuilder 16.8
Copyright © 2015 John Wiley & Sons, Inc. All rights reserved. Klein, Organic Chemistry 2e 16-150
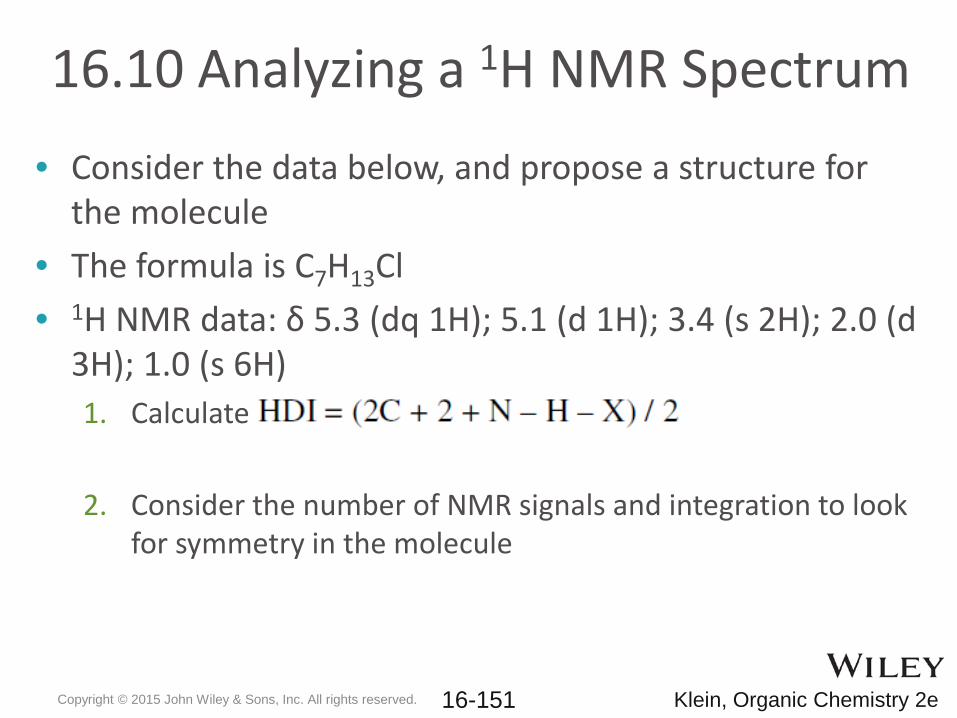
16.10 Analyzing a 1H NMR Spectrum• Consider the data below, and propose a structure for
the molecule• The formula is C7H13Cl• 1H NMR data: δ 5.3 (dq 1H); 5.1 (d 1H); 3.4 (s 2H); 2.0 (d
3H); 1.0 (s 6H) 1. Calculate
2. Consider the number of NMR signals and integration to look for symmetry in the molecule
Copyright © 2015 John Wiley & Sons, Inc. All rights reserved. Klein, Organic Chemistry 2e 16-151
16.10 Analyzing a 1H NMR Spectrum• Consider the data below, and propose a structure for
the molecule• The formula is C7H13Cl• 1H NMR data: δ 5.3 (dq 1H); 5.1 (d 1H); 3.4 (s 2H); 2.0 (d
3H); 1.0 (s 6H) 3. Analyze each signal, and draw molecular fragments that
match the shift, integration, and multiplicity
4. Assemble the fragments into a complete structure like puzzle pieces
Copyright © 2015 John Wiley & Sons, Inc. All rights reserved. Klein, Organic Chemistry 2e 16-152
16.11 Acquiring a 13C NMR Spectrum• Because 1H is by far the most abundant isotope of
hydrogen, 1H NMR signals are generally strong• 13C only accounts for about 1% of carbon atoms in
nature, so a sensitive receiver coil and/or concentrated NMR sample is needed
• In 1H NMR, shift, splitting, and integration are important• In 13C NMR, only the number of signals and the shift will
be considered
Copyright © 2015 John Wiley & Sons, Inc. All rights reserved. Klein, Organic Chemistry 2e 16-153
16.11 Acquiring a 13C NMR Spectrum• In 13C NMR, the 1H-13C splitting is often so complex that
the spectrum is unreadable• To elucidate the 13C spectrum and make it easier to
determine the total number of 13C signals, 13C NMR are generally decoupled
• In the vast majority of 13C spectra, all of the signals are singlets
Copyright © 2015 John Wiley & Sons, Inc. All rights reserved. Klein, Organic Chemistry 2e 16-154
16.12 Chemical Shifts in 13C NMR Spectra
• Compared to 1H, 13C atoms require a different frequency of energy to excite (resonate)
• Compared to the standard TMS, 13C NMR signals generally appear between 220 and 0 ppm
• Each signal on the 13C spectra represents a carbon with a unique electronic environment
• Planes and axes of symmetry can cause carbon signals to overlap if their electronic surroundings are equivalent
Copyright © 2015 John Wiley & Sons, Inc. All rights reserved. Klein, Organic Chemistry 2e 16-155
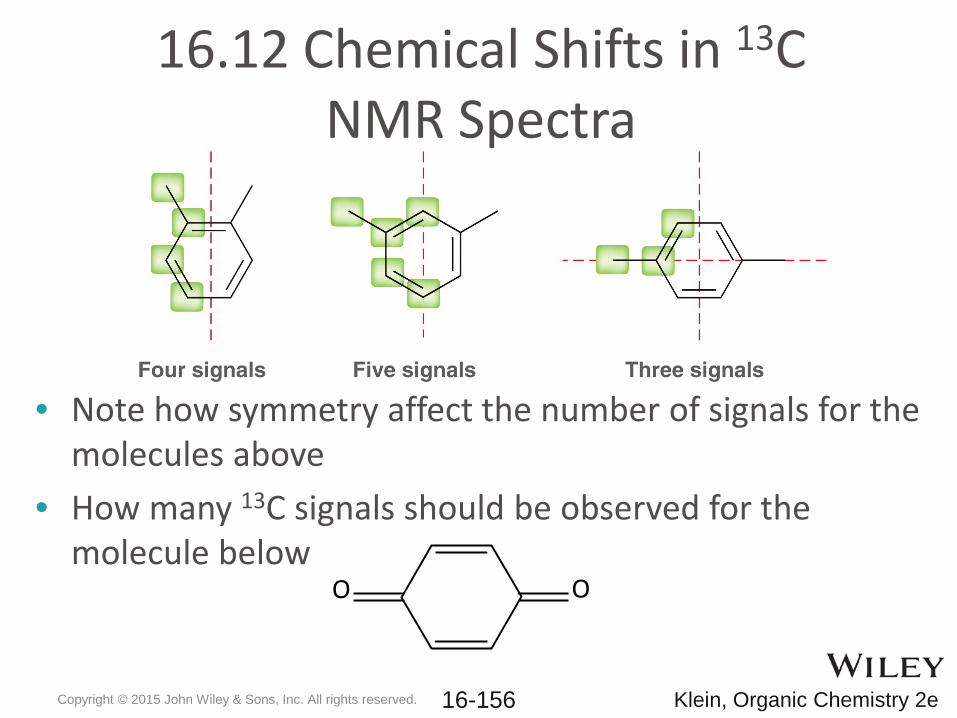
16.12 Chemical Shifts in 13C NMR Spectra
• Note how symmetry affect the number of signals for the molecules above
• How many 13C signals should be observed for the molecule below
OO
Copyright © 2015 John Wiley & Sons, Inc. All rights reserved. Klein, Organic Chemistry 2e 16-156
16.12 Chemical Shifts in 13C NMR Spectra
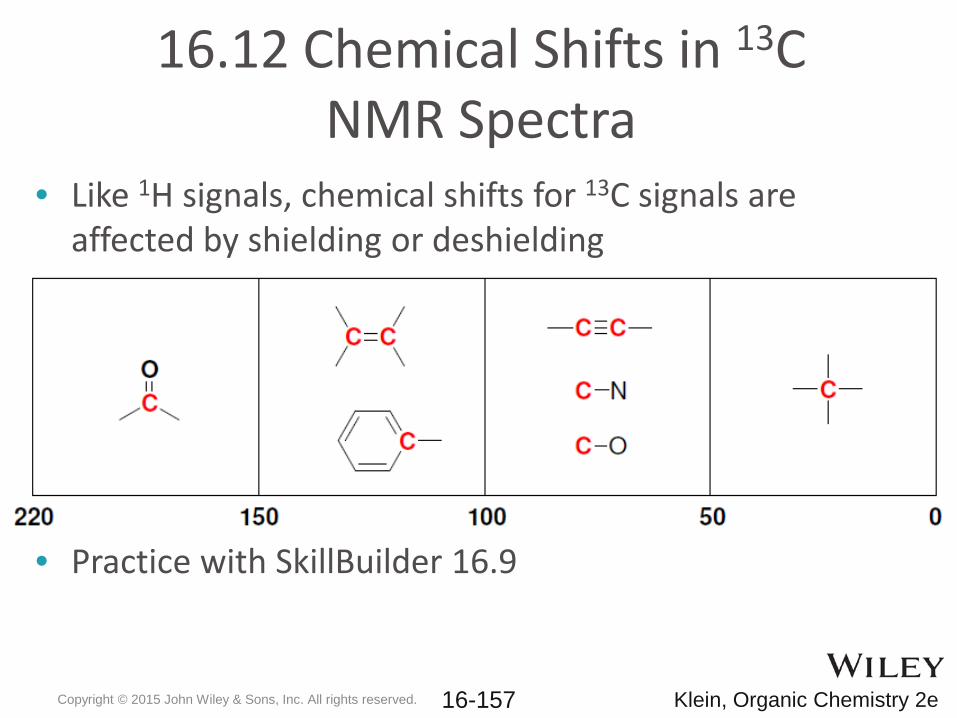
• Like 1H signals, chemical shifts for 13C signals are affected by shielding or deshielding
• Practice with SkillBuilder 16.9
Copyright © 2015 John Wiley & Sons, Inc. All rights reserved. Klein, Organic Chemistry 2e 16-157