Embed Size (px)
Citation preview
ORGANIC FARMING RESEARCH CENTREORGANIC FARMING RESEARCH CENTREZARS, NAVILE, SHIMOGAZARS, NAVILE, SHIMOGA
University of Agricultural Sciences, BangaloreUniversity of Agricultural Sciences, Bangalore
Dr. N. Deva KumarProfessor of Agronomy
Analysis of Liquid manures and their use
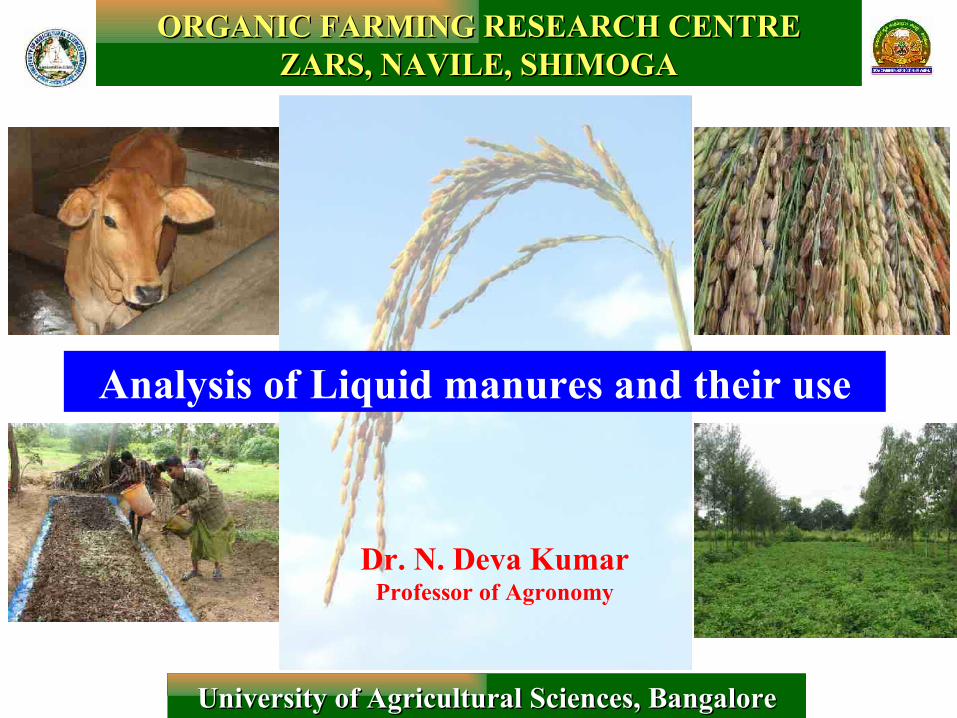
Preparation of Beejamrutha
Cow urine Lime water
WaterSoil
Cow dung
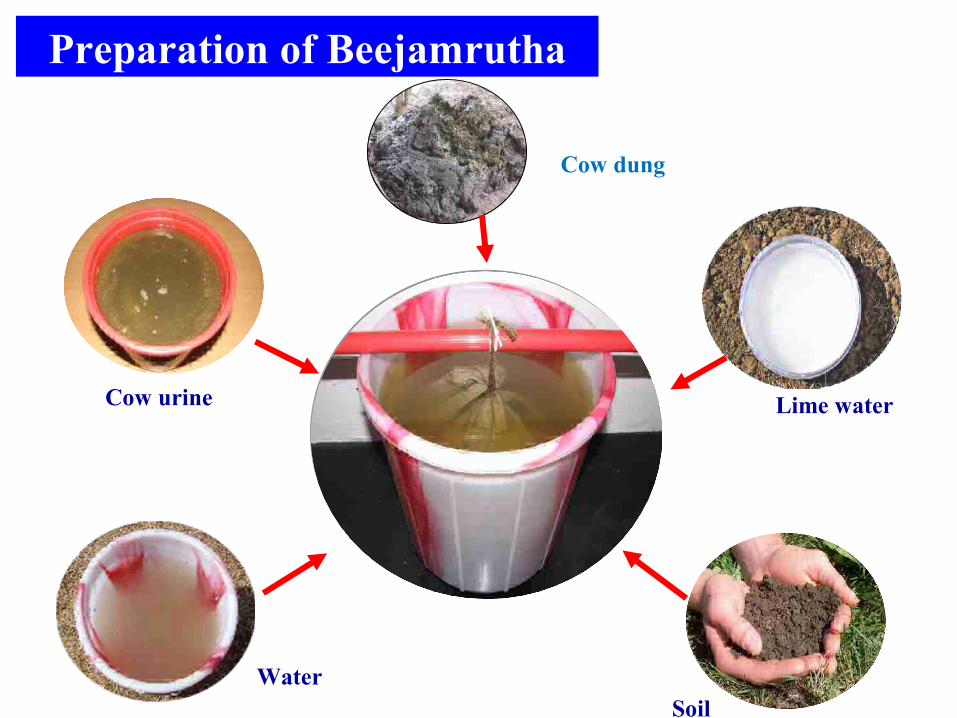
Preparation of Jeevamrutha
Soil
Jaggery
Water
Cow dung
Cow urine
Pulse flour
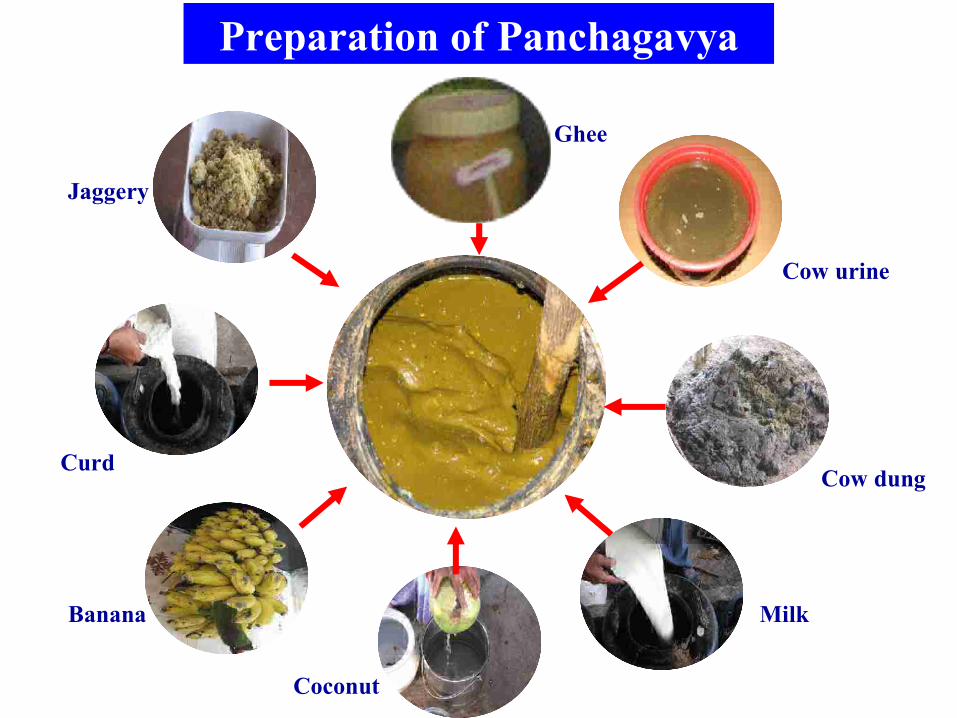
Preparation of Panchagavya
Jaggery
Curd
Ghee
Cow urine
Cow dung
Milk
Coconut
Banana

Analytical studies of Beejamrutha Jeevamrutha and Panchagavya
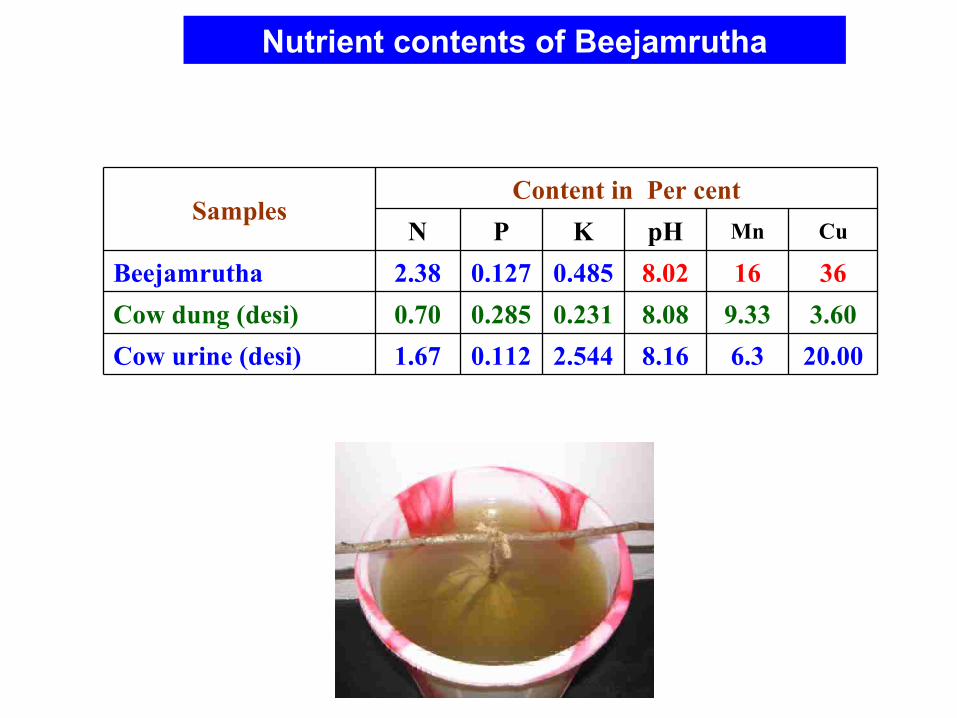
SamplesContent in Per cent
N P K pH Mn Cu
Beejamrutha 2.38 0.127 0.485 8.02 16 36
Cow dung (desi) 0.70 0.285 0.231 8.08 9.33 3.60
Cow urine (desi) 1.67 0.112 2.544 8.16 6.3 20.00
Nutrient contents of Beejamrutha
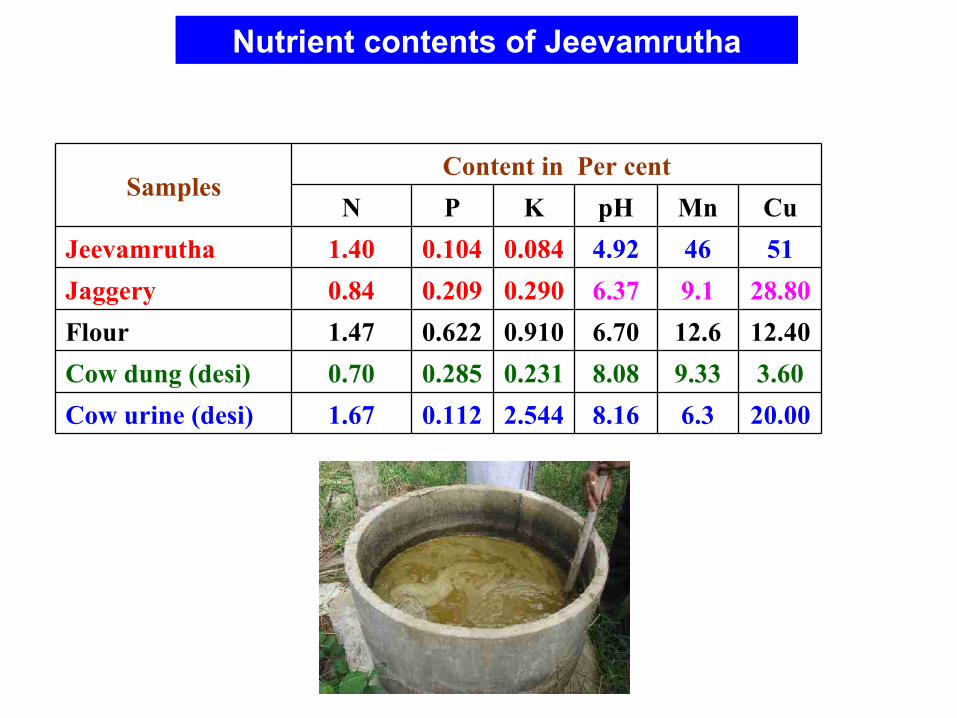
SamplesContent in Per cent
N P K pH Mn Cu
Jeevamrutha 1.40 0.104 0.084 4.92 46 51
Jaggery 0.84 0.209 0.290 6.37 9.1 28.80
Flour 1.47 0.622 0.910 6.70 12.6 12.40
Cow dung (desi) 0.70 0.285 0.231 8.08 9.33 3.60
Cow urine (desi) 1.67 0.112 2.544 8.16 6.3 20.00
Nutrient contents of Jeevamrutha
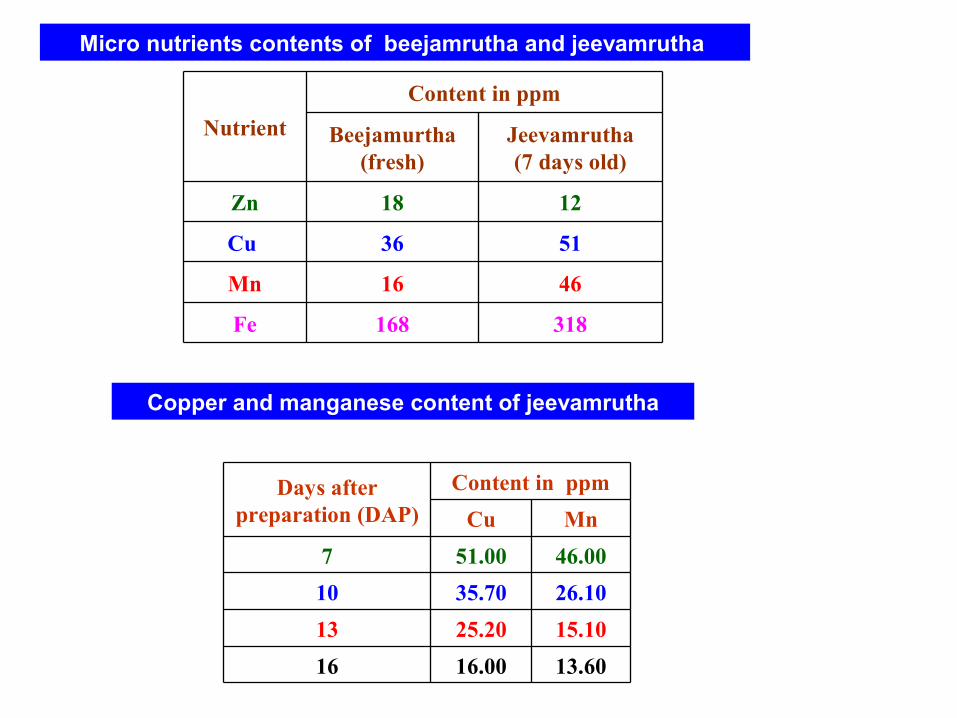
Micro nutrients contents of beejamrutha and jeevamrutha
Nutrient
Content in ppm
Beejamurtha (fresh)
Jeevamrutha(7 days old)
Zn 18 12
Cu 36 51
Mn 16 46
Fe 168 318
Days after preparation (DAP)
Content in ppm
Cu Mn
7 51.00 46.00
10 35.70 26.10
13 25.20 15.10
16 16.00 13.60
Copper and manganese content of jeevamrutha
FungiBacteria Actinomycetes
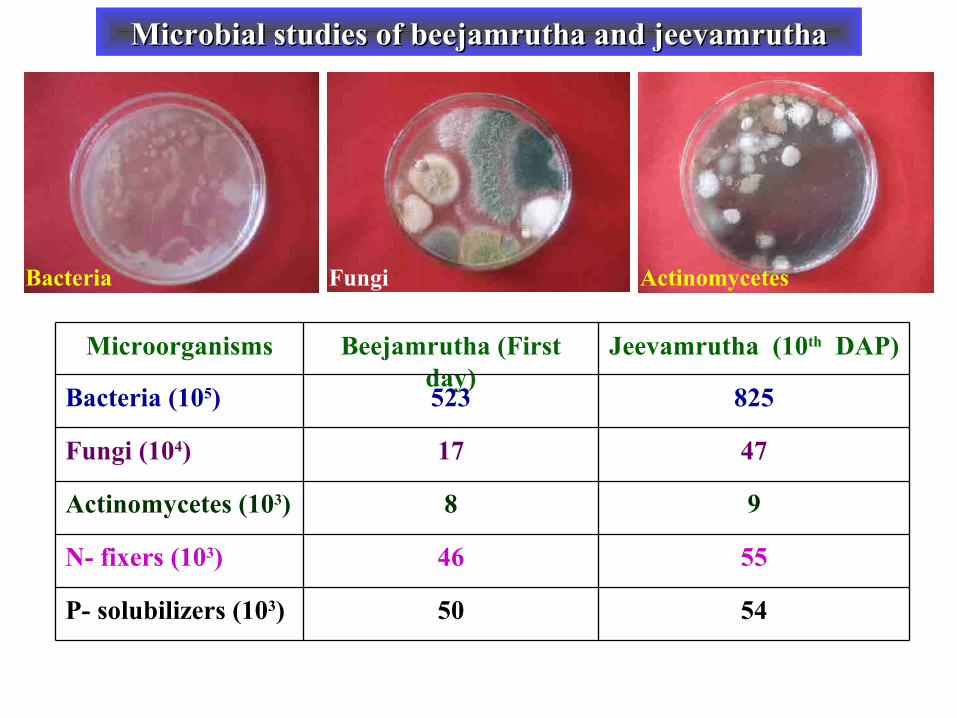
Microbial studies of beejamrutha and jeevamruthaMicrobial studies of beejamrutha and jeevamrutha
Microorganisms Beejamrutha (First day)
Jeevamrutha (10th DAP)
Bacteria (105) 523 825
Fungi (104) 17 47
Actinomycetes (103) 8 9
N- fixers (103) 46 55
P- solubilizers (103) 50 54
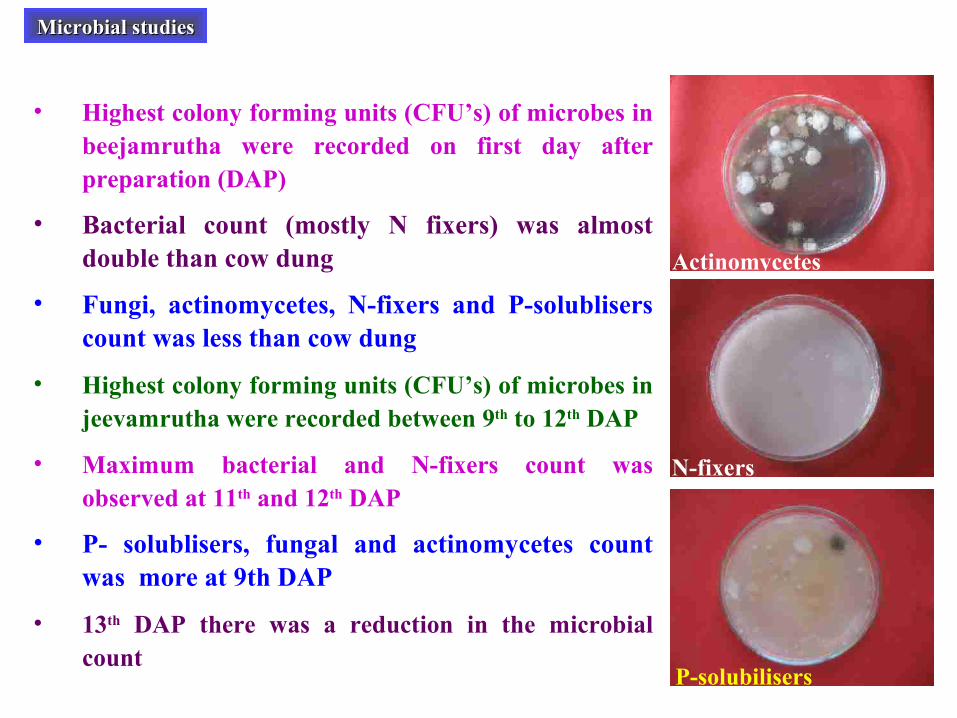
• Highest colony forming units (CFU’s) of microbes in beejamrutha were recorded on first day after preparation (DAP)
• Bacterial count (mostly N fixers) was almost double than cow dung
• Fungi, actinomycetes, N-fixers and P-solublisers count was less than cow dung
• Highest colony forming units (CFU’s) of microbes in jeevamrutha were recorded between 9th to 12th DAP
• Maximum bacterial and N-fixers count was observed at 11th and 12th DAP
• P- solublisers, fungal and actinomycetes count was more at 9th DAP
• 13th DAP there was a reduction in the microbial count
Microbial studiesMicrobial studies
P-solubilisers
N-fixers
Actinomycetes
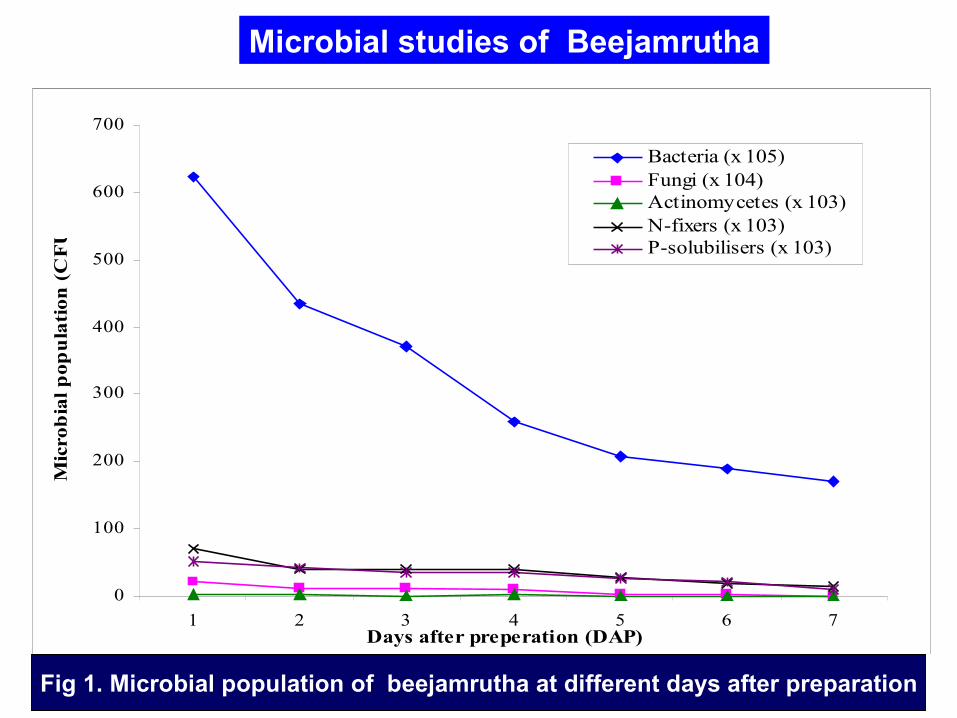
Fig 5. Microbial population of beejamrutha at different days after preperation
0
100
200
300
400
500
600
700
1 2 3 4 5 6 7Days after preperation (DAP)
Mic
rob
ial
pop
ula
tion
(C
FU
's)
Bacteria (x 105)Fungi (x 104)Actinomycetes (x 103)N-fixers (x 103)P-solubilisers (x 103)
Fig 1. Microbial population of beejamrutha at different days after preparation
Microbial studies of Beejamrutha
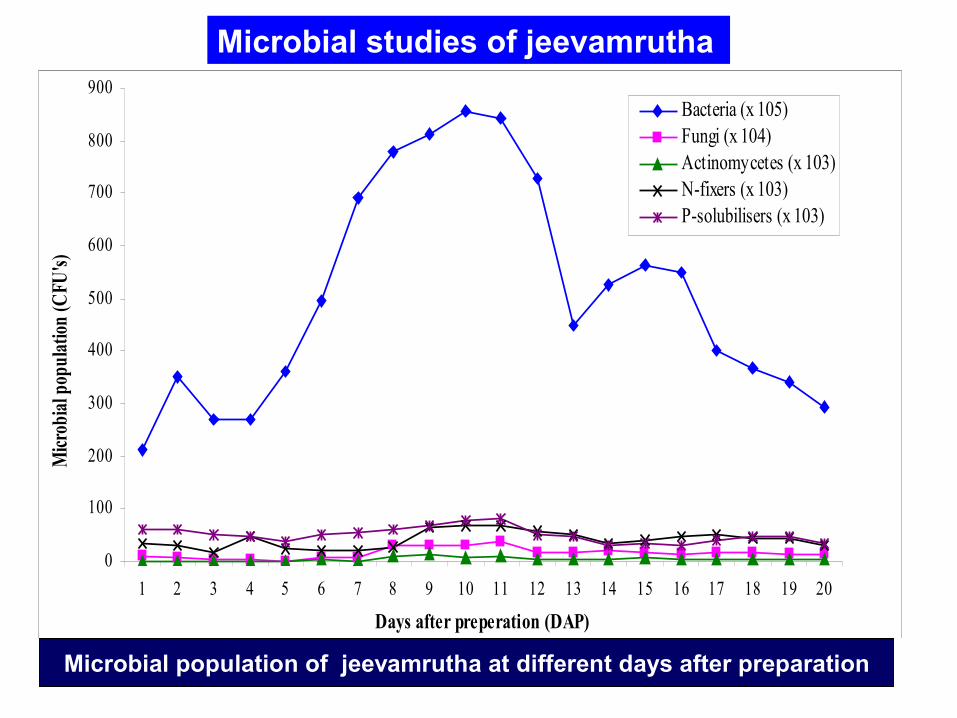
Fig. 4. Microbial populaton of jeevamrutha at different days after preperation
0
100
200
300
400
500
600
700
800
900
1 2 3 4 5 6 7 8 9 10 11 12 13 14 15 16 17 18 19 20
Days after preperation (DAP)
Micr
obia
l pop
ulat
ion
(CFU
's)
Bacteria (x 105)Fungi (x 104)Actinomycetes (x 103)N-fixers (x 103)P-solubilisers (x 103)
Microbial population of jeevamrutha at different days after preparation
Microbial studies of jeevamrutha
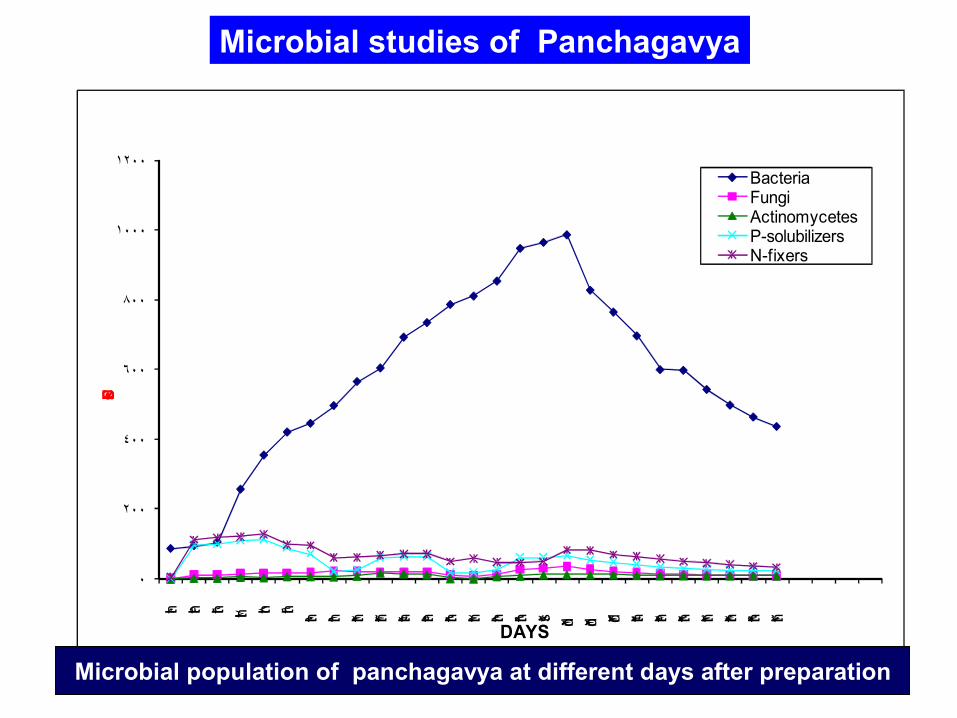
0
200
400
600
800
1000
12000th 5th 6th 7th 8th 9th 10th 11th 12th 13th 14th 15th 16th 17th 18th 19th 20st 21nd 22nd 23rd 24th 25th 26th 27th 28th 29th 30th
CFUs
DAYS
Bacteria FungiActinomycetesP-solubilizersN-fixers
Microbial studies of Panchagavya
Microbial population of panchagavya at different days after preparation

Use of Liquid manures in Rice and Fieldbean
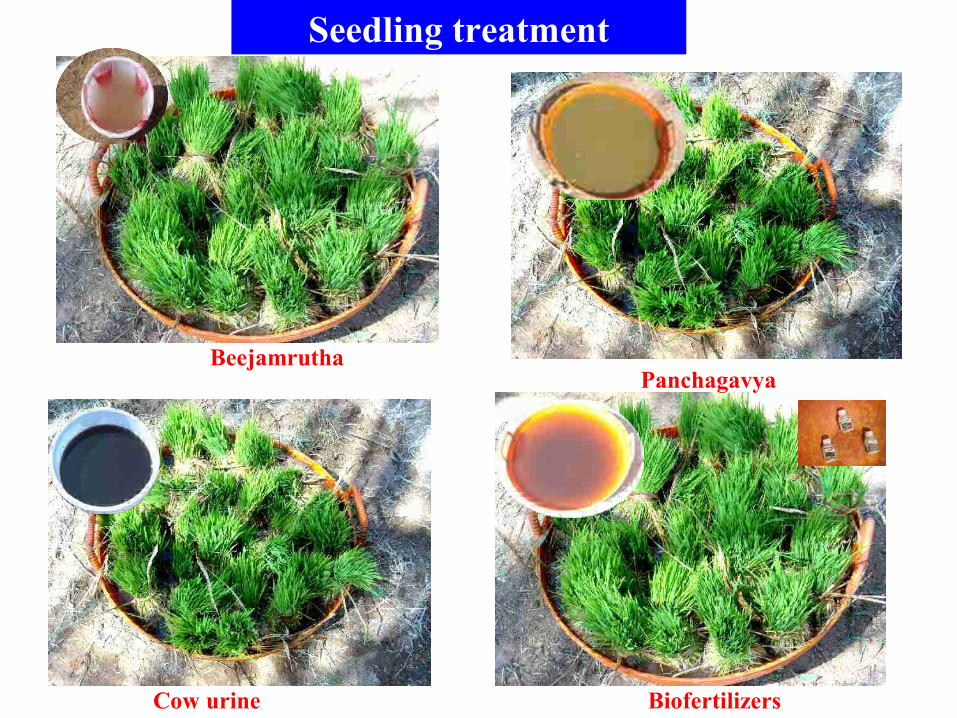
Seedling treatment
Biofertilizers
Panchagavya
Cow urine
Beejamrutha
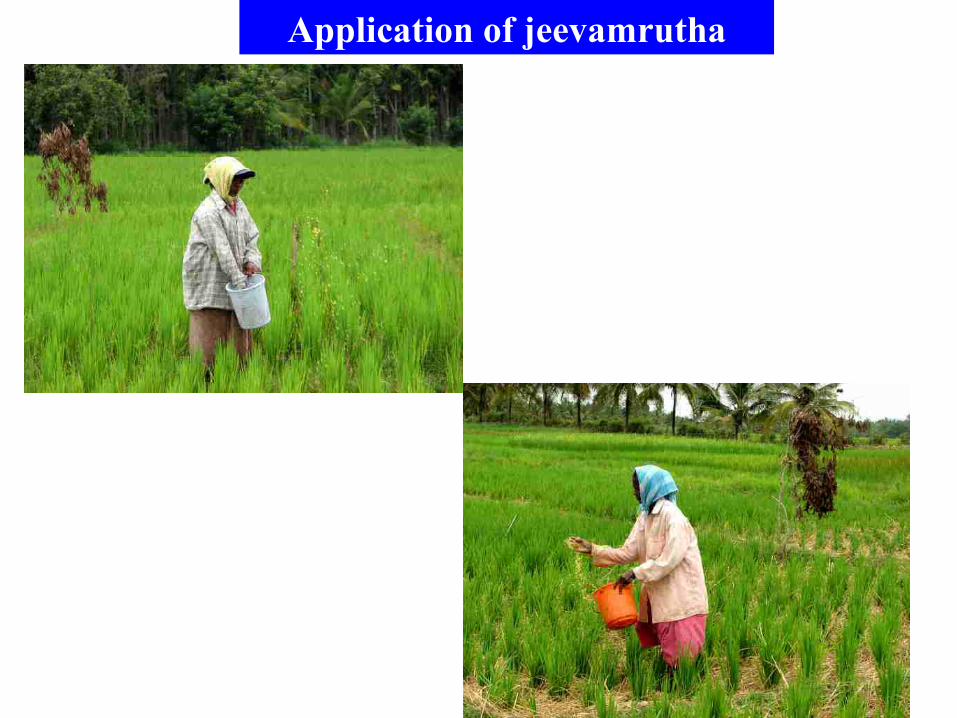
Application of jeevamrutha
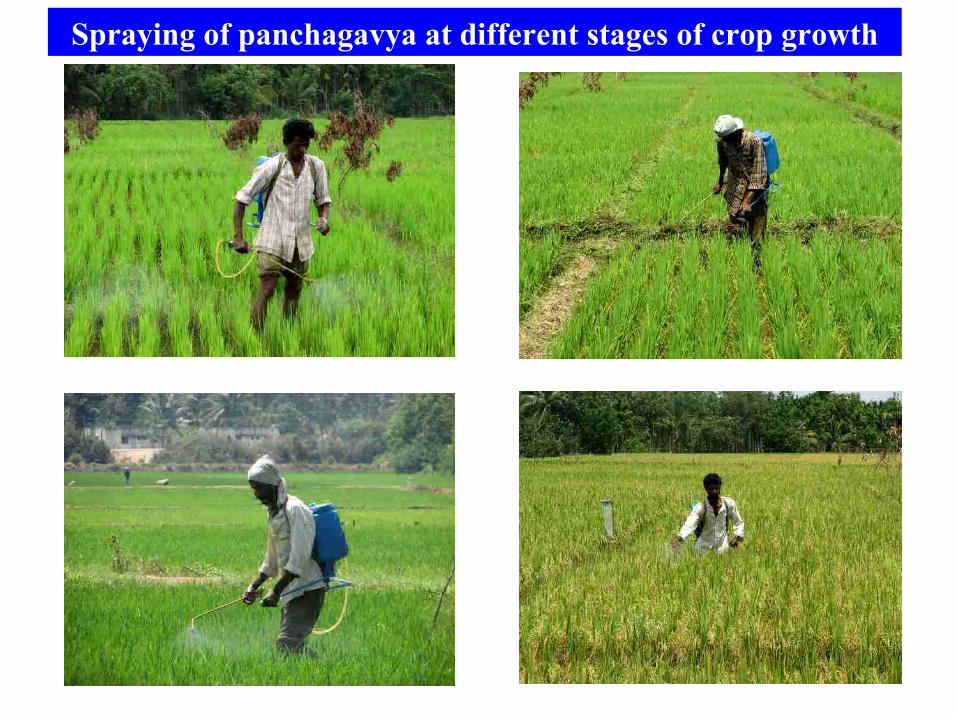
Spraying of panchagavya at different stages of crop growth
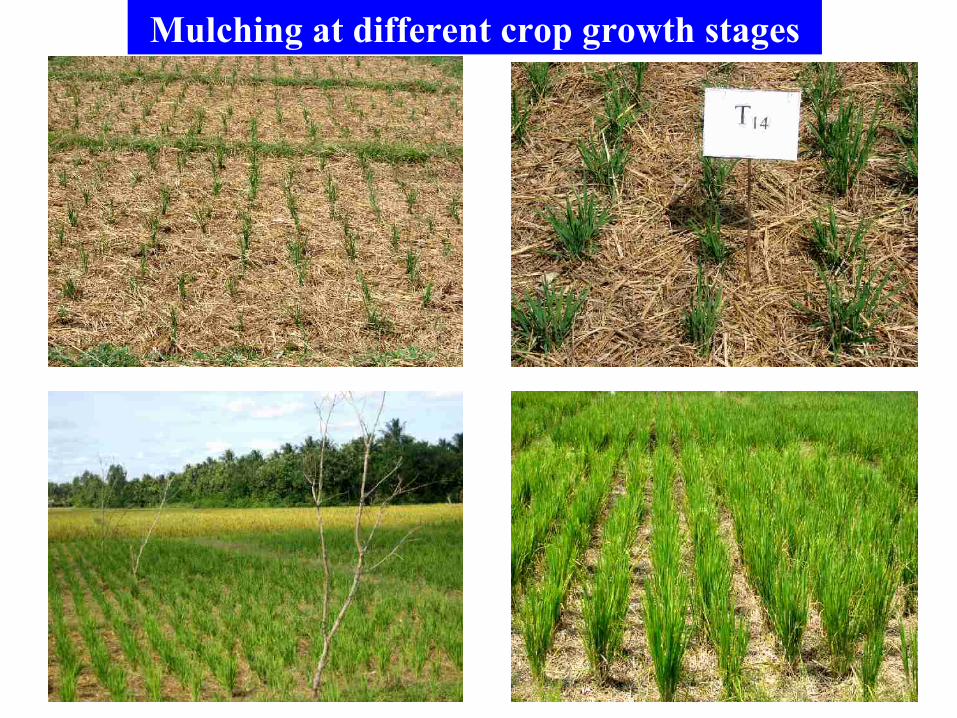
Mulching at different crop growth stages
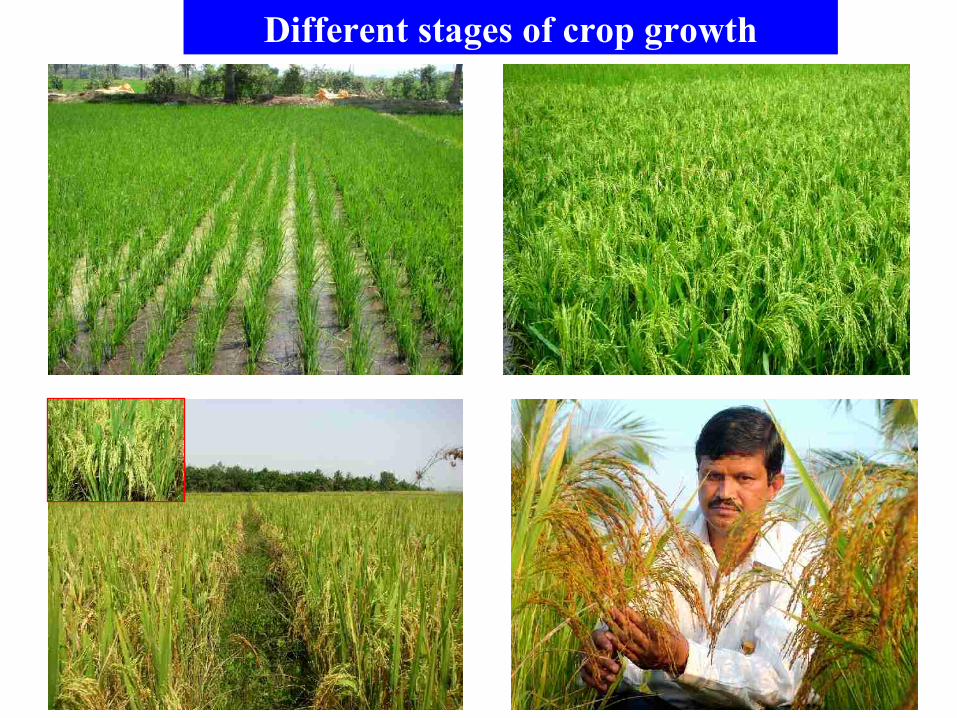
Different stages of crop growth
0
10
20
30
40
50
60
70
Khairf 2007-08
Summer 2007-08
Kharif 2008-09
Yield q / ha
Seasons
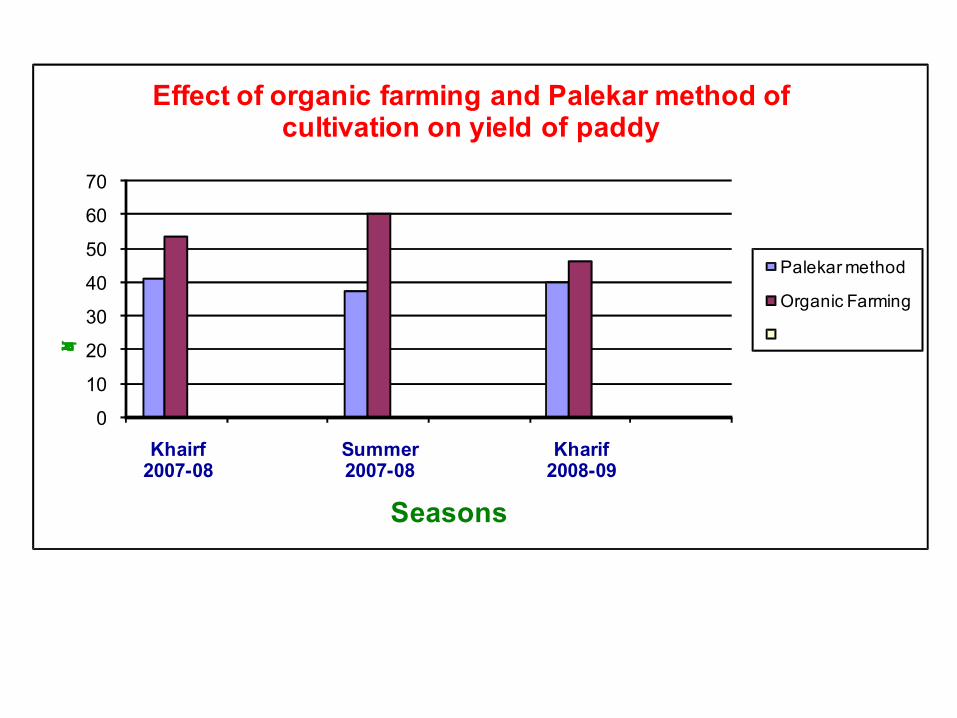
Effect of organic farming and Palekar method of cultivation on yield of paddy
Palekar method
Organic Farming
0
10
20
30
40
50
60
70
Kharif 2007-08
Summer 2007-08
Kharif 2007-08
Yield q / ha
Seasons
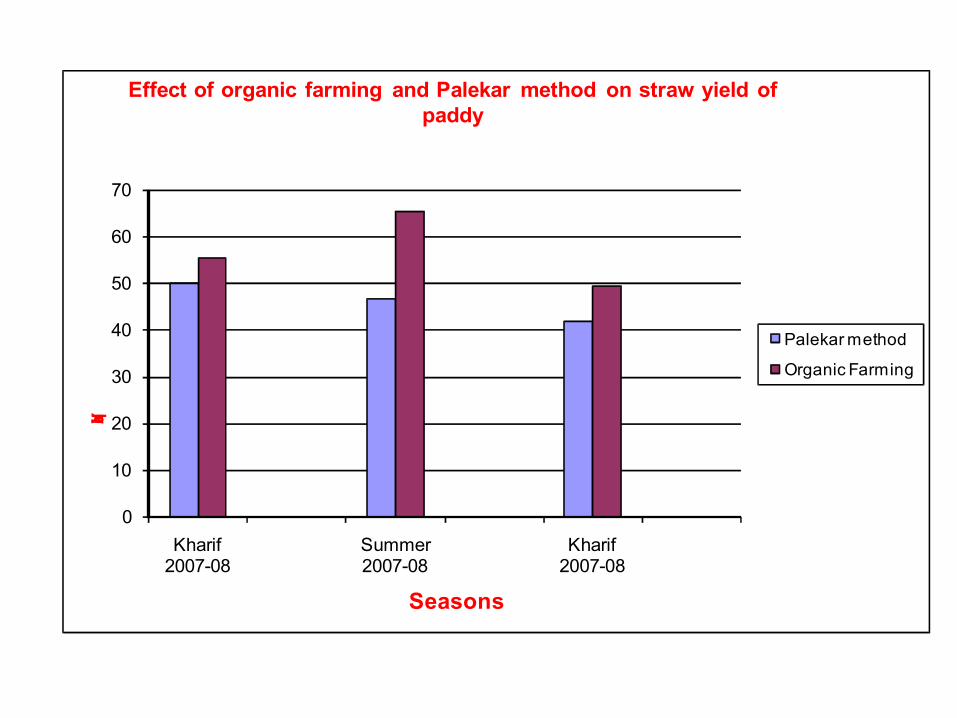
Effect of organic farming and Palekar method on straw yield of paddy
Palekar method
Organic Farming
0
10
20
30
40
50
60
Kharif 2007-08 Summer 2007-08 Kharif 2008-09
Yield q / ha
Seasons
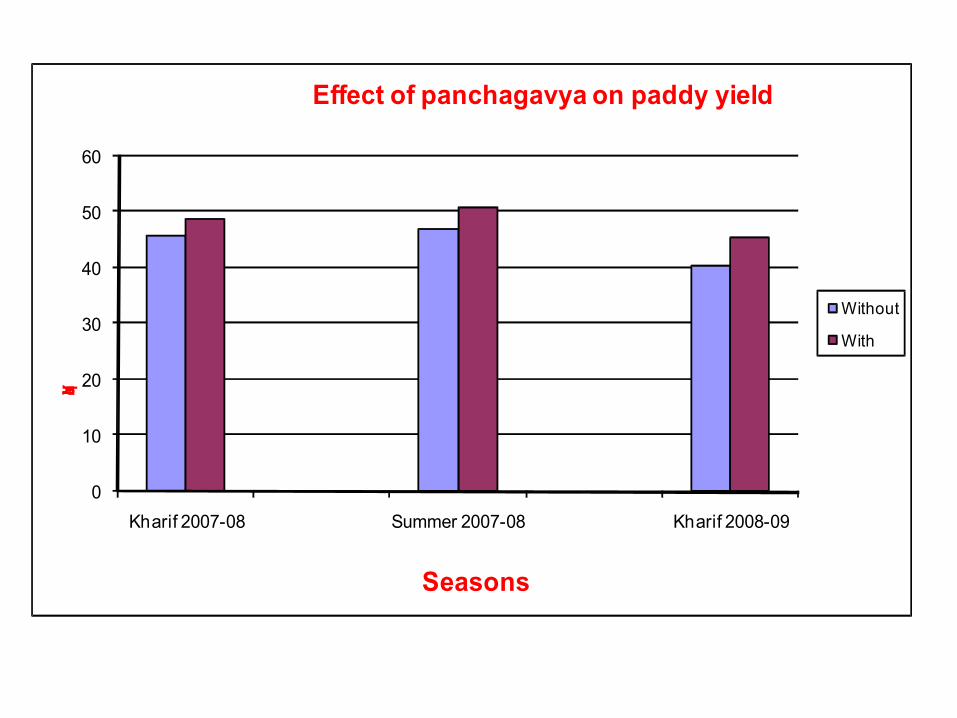
Effect of panchagavya on paddy yield
Without
With
0
10
20
30
40
50
60
70
Khairf 2007-08
Summer 2007-08
Kharif 2008-09
Yield q / ha
Seasons
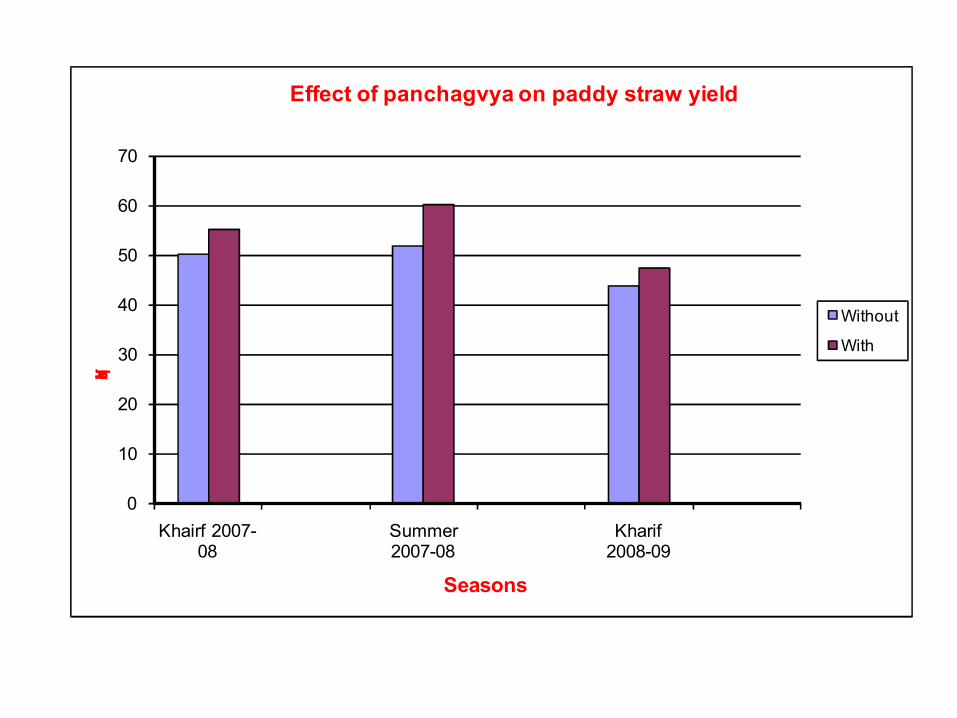
Effect of panchagvya on paddy straw yield
Without
With
0
10
20
30
40
50
60
Kharif 2007-08 Summer 2007-08
Khairf 2008-09
Yield q / ha
Treatments
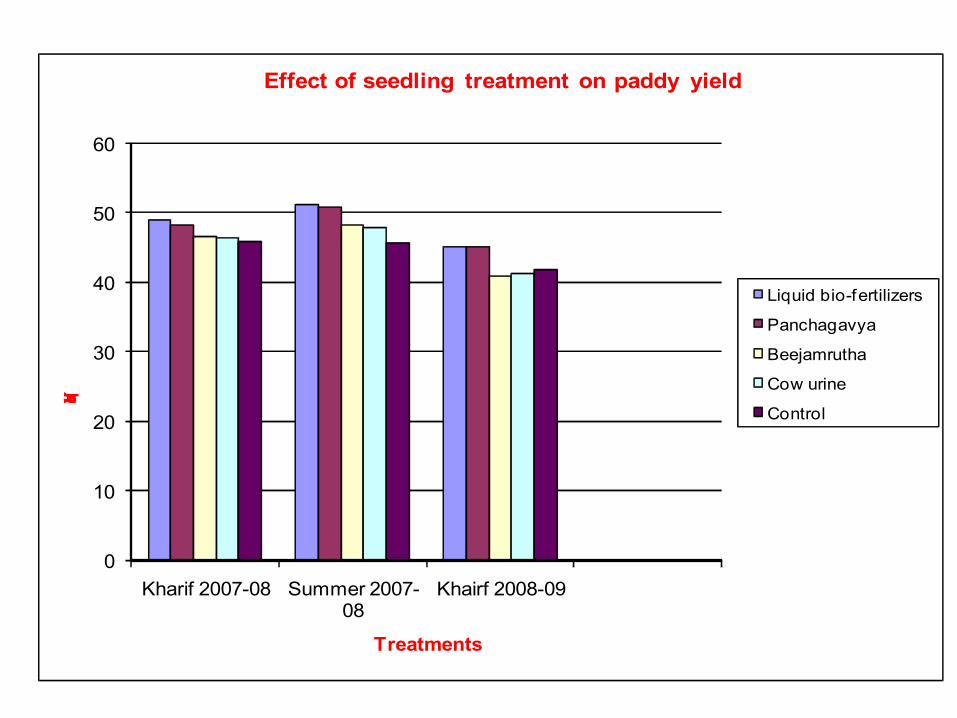
Effect of seedling treatment on paddy yield
Liquid bio-fertilizers
Panchagavya
Beejamrutha
Cow urine
Control
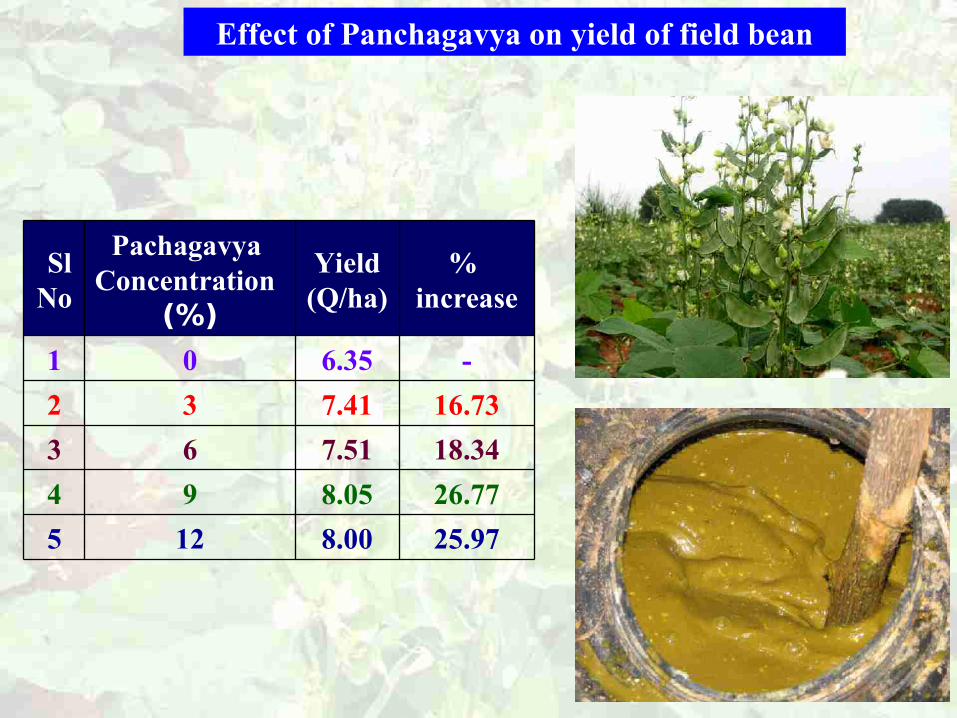
Effect of Panchagavya on yield of field bean
SlNo
Pachagavya Concentration
(%)
Yield (Q/ha)
% increase
1 0 6.35 -
2 3 7.41 16.73
3 6 7.51 18.34
4 9 8.05 26.77
5 12 8.00 25.97
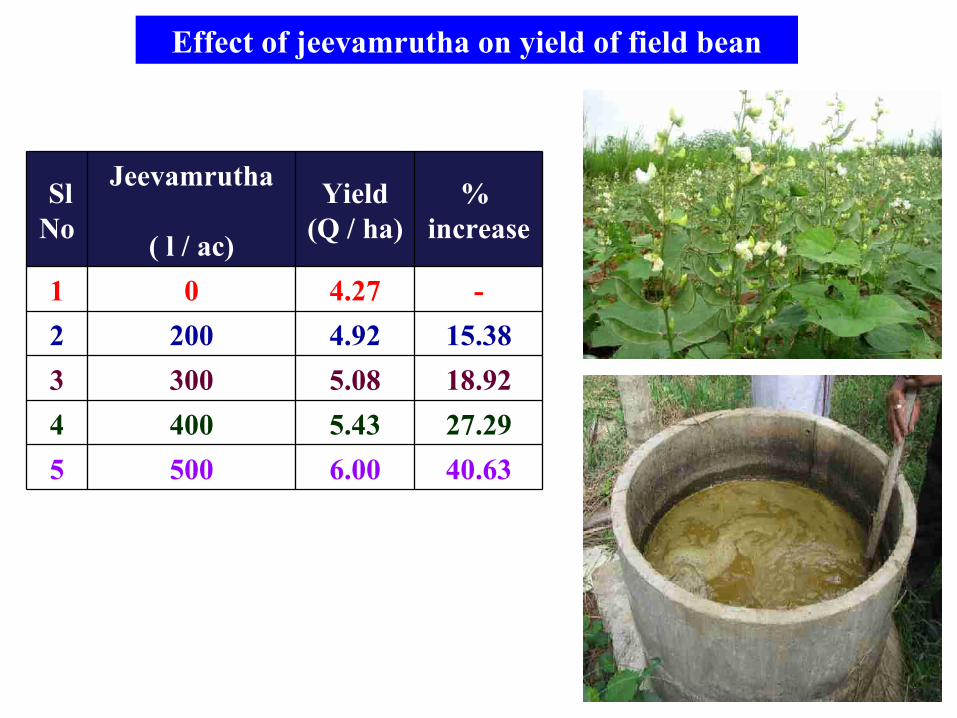
SlNo
Jeevamrutha
( l / ac)
Yield (Q / ha)
% increase
1 0 4.27 -
2 200 4.92 15.38
3 300 5.08 18.92
4 400 5.43 27.29
5 500 6.00 40.63
Effect of jeevamrutha on yield of field bean
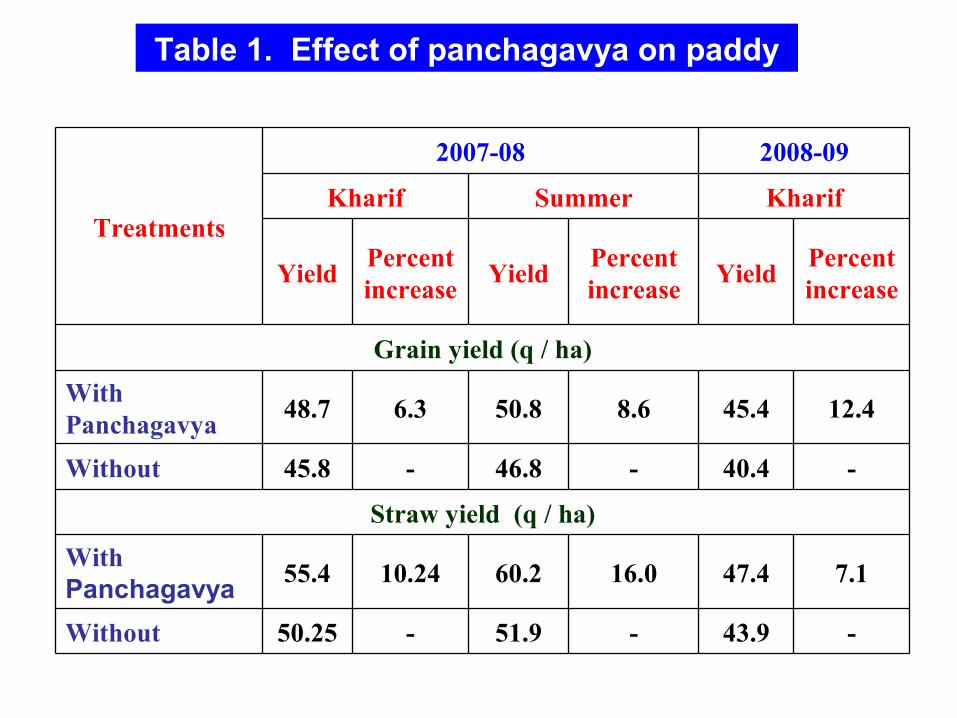
Treatments
2007-08 2008-09
Kharif Summer Kharif
YieldPercentincrease
YieldPercentincrease
YieldPercentincrease
Grain yield (q / ha)
With Panchagavya
48.7 6.3 50.8 8.6 45.4 12.4
Without 45.8 - 46.8 - 40.4 -
Straw yield (q / ha)
With Panchagavya
55.4 10.24 60.2 16.0 47.4 7.1
Without 50.25 - 51.9 - 43.9 -
Table 1. Effect of panchagavya on paddy
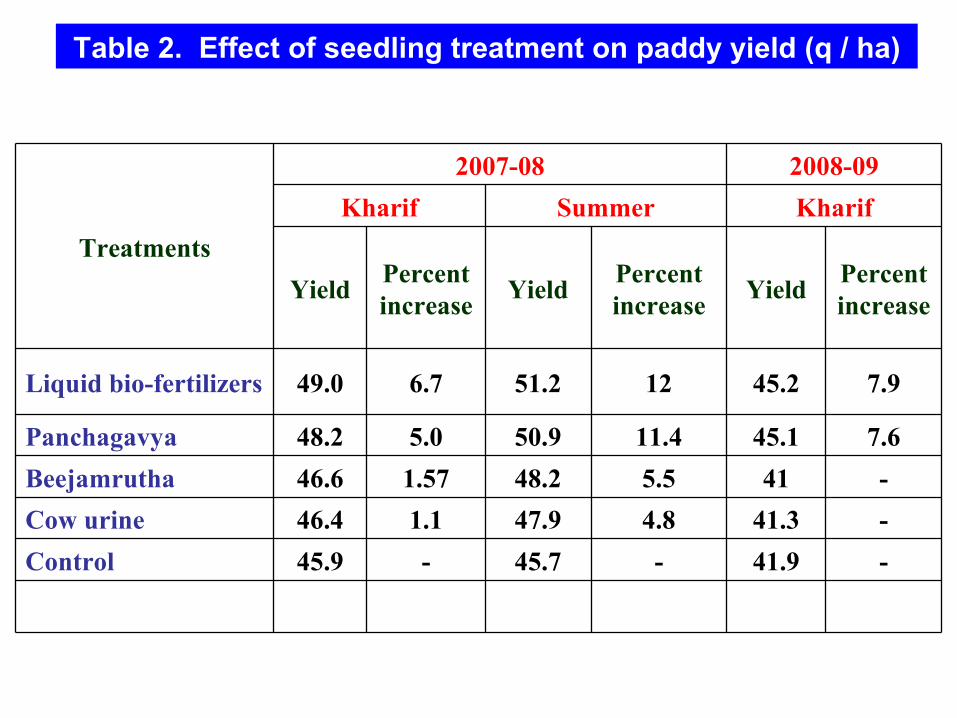
Treatments
2007-08 2008-09
Kharif Summer Kharif
YieldPercentincrease
YieldPercentincrease
YieldPercentincrease
Liquid bio-fertilizers 49.0 6.7 51.2 12 45.2 7.9
Panchagavya 48.2 5.0 50.9 11.4 45.1 7.6
Beejamrutha 46.6 1.57 48.2 5.5 41 -
Cow urine 46.4 1.1 47.9 4.8 41.3 -
Control 45.9 - 45.7 - 41.9 -
Table 2. Effect of seedling treatment on paddy yield (q / ha)
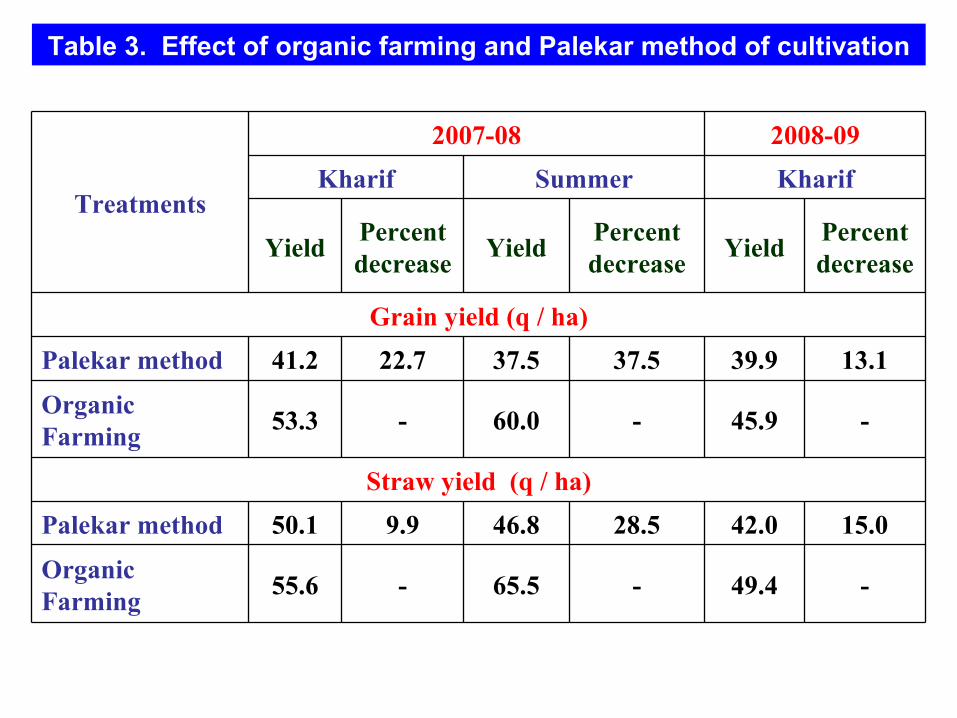
Treatments
2007-08 2008-09
Kharif Summer Kharif
YieldPercentdecrease
YieldPercentdecrease
YieldPercentdecrease
Grain yield (q / ha)
Palekar method 41.2 22.7 37.5 37.5 39.9 13.1
Organic Farming
53.3 - 60.0 - 45.9 -
Straw yield (q / ha)
Palekar method 50.1 9.9 46.8 28.5 42.0 15.0
Organic Farming
55.6 - 65.5 - 49.4 -
Table 3. Effect of organic farming and Palekar method of cultivation
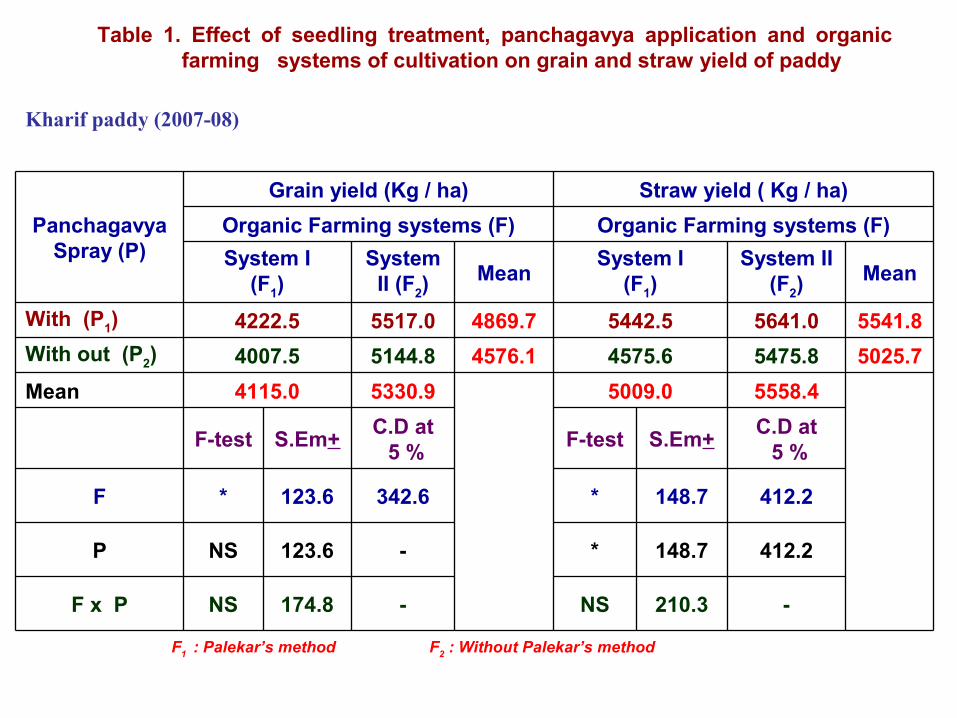
Table 1. Effect of seedling treatment, panchagavya application and organic farming systems of cultivation on grain and straw yield of paddy
PanchagavyaSpray (P)
Grain yield (Kg / ha) Straw yield ( Kg / ha)
Organic Farming systems (F) Organic Farming systems (F)
System I(F1)
System II (F2)
MeanSystem I
(F1)System II
(F2)Mean
With (P1) 4222.5 5517.0 4869.7 5442.5 5641.0 5541.8
With out (P2) 4007.5 5144.8 4576.1 4575.6 5475.8 5025.7
Mean 4115.0 5330.9 5009.0 5558.4
F-test S.Em+C.D at 5 %
F-test S.Em+C.D at 5 %
F * 123.6 342.6 * 148.7 412.2
P NS 123.6 - * 148.7 412.2
F x P NS 174.8 - NS 210.3 -
F1 : Palekar’s method F2 : Without Palekar’s method
Kharif paddy (2007-08)
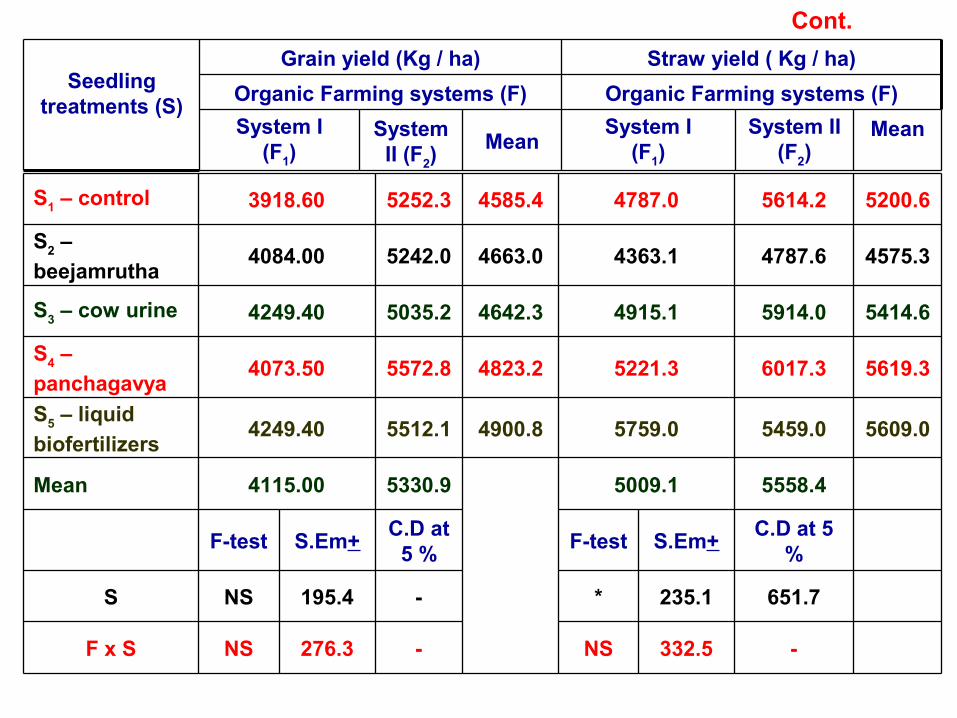
S1 – control 3918.60 5252.3 4585.4 4787.0 5614.2 5200.6
S2 –
beejamrutha4084.00 5242.0 4663.0 4363.1 4787.6 4575.3
S3 – cow urine 4249.40 5035.2 4642.3 4915.1 5914.0 5414.6
S4 –
panchagavya4073.50 5572.8 4823.2 5221.3 6017.3 5619.3
S5 – liquid
biofertilizers4249.40 5512.1 4900.8 5759.0 5459.0 5609.0
Mean 4115.00 5330.9 5009.1 5558.4
F-test S.Em+C.D at
5 %F-test S.Em+
C.D at 5 %
S NS 195.4 - * 235.1 651.7
F x S NS 276.3 - NS 332.5 -
Cont.
Seedling treatments (S)
Grain yield (Kg / ha) Straw yield ( Kg / ha)
Organic Farming systems (F) Organic Farming systems (F)
System I(F1)
System II (F2)
MeanSystem I
(F1)System II
(F2)Mean
Effect of seedling treatment, Panchagavya application and organic farming systems of cultivation on grain and straw yield of Paddy
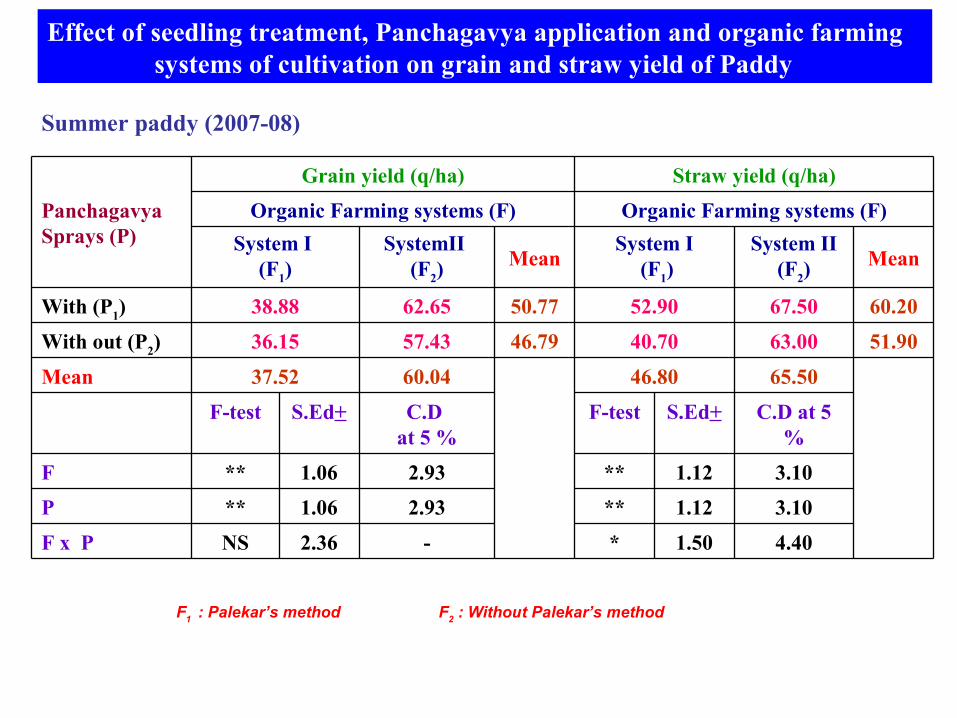
Panchagavya Sprays (P)
Grain yield (q/ha) Straw yield (q/ha)
Organic Farming systems (F) Organic Farming systems (F)
System I (F1)
SystemII (F2)
MeanSystem I
(F1)System II
(F2)Mean
With (P1) 38.88 62.65 50.77 52.90 67.50 60.20
With out (P2) 36.15 57.43 46.79 40.70 63.00 51.90
Mean 37.52 60.04 46.80 65.50
F-test S.Ed+ C.D at 5 %
F-test S.Ed+ C.D at 5 %
F ** 1.06 2.93 ** 1.12 3.10
P ** 1.06 2.93 ** 1.12 3.10
F x P NS 2.36 - * 1.50 4.40
F1 : Palekar’s method F2 : Without Palekar’s method
Summer paddy (2007-08)

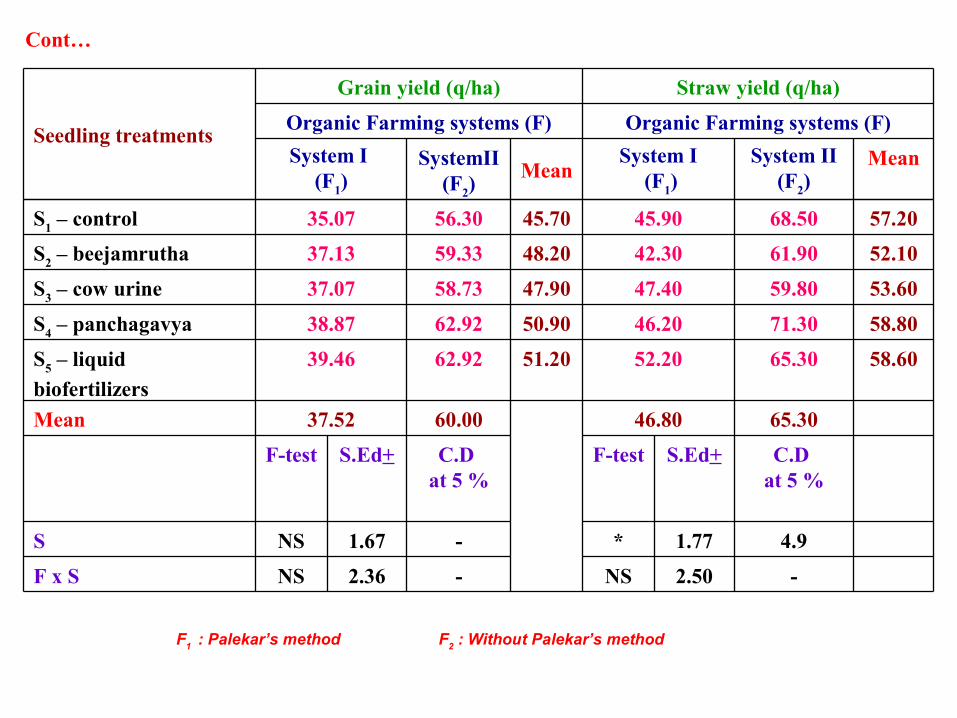
S1 – control 35.07 56.30 45.70 45.90 68.50 57.20
S2 – beejamrutha 37.13 59.33 48.20 42.30 61.90 52.10
S3 – cow urine 37.07 58.73 47.90 47.40 59.80 53.60
S4 – panchagavya 38.87 62.92 50.90 46.20 71.30 58.80
S5 – liquid
biofertilizers
39.46 62.92 51.20 52.20 65.30 58.60
Mean 37.52 60.00 46.80 65.30
F-test S.Ed+ C.D at 5 %
F-test S.Ed+ C.D at 5 %
S NS 1.67 - * 1.77 4.9
F x S NS 2.36 - NS 2.50 -
Cont…
Seedling treatments
Grain yield (q/ha) Straw yield (q/ha)
Organic Farming systems (F) Organic Farming systems (F)
System I (F1)
SystemII (F2)
MeanSystem I
(F1)System II
(F2)Mean
F1 : Palekar’s method F2 : Without Palekar’s method
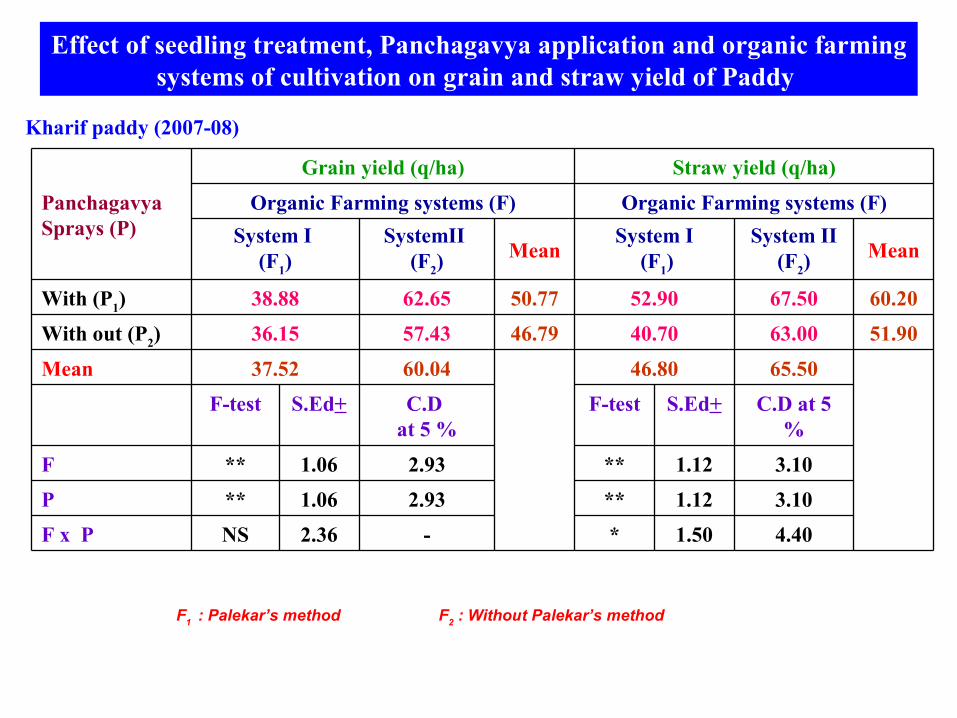
Effect of seedling treatment, Panchagavya application and organic farming systems of cultivation on grain and straw yield of Paddy
Panchagavya Sprays (P)
Grain yield (q/ha) Straw yield (q/ha)
Organic Farming systems (F) Organic Farming systems (F)
System I (F1)
SystemII (F2)
MeanSystem I
(F1)System II
(F2)Mean
With (P1) 38.88 62.65 50.77 52.90 67.50 60.20
With out (P2) 36.15 57.43 46.79 40.70 63.00 51.90
Mean 37.52 60.04 46.80 65.50
F-test S.Ed+ C.D at 5 %
F-test S.Ed+ C.D at 5 %
F ** 1.06 2.93 ** 1.12 3.10
P ** 1.06 2.93 ** 1.12 3.10
F x P NS 2.36 - * 1.50 4.40
F1 : Palekar’s method F2 : Without Palekar’s method
Kharif paddy (2007-08)
S1 – control 35.07 56.30 45.70 45.90 68.50 57.20
S2 – beejamrutha 37.13 59.33 48.20 42.30 61.90 52.10
S3 – cow urine 37.07 58.73 47.90 47.40 59.80 53.60
S4 – panchagavya 38.87 62.92 50.90 46.20 71.30 58.80
S5 – liquid
biofertilizers
39.46 62.92 51.20 52.20 65.30 58.60
Mean 37.52 60.00 46.80 65.30
F-test S.Ed+ C.D at 5 %
F-test S.Ed+ C.D at 5 %
S NS 1.67 - * 1.77 4.9
F x S NS 2.36 - NS 2.50 -
Cont…
Seedling treatments
Grain yield (q/ha) Straw yield (q/ha)
Organic Farming systems (F) Organic Farming systems (F)
System I (F1)
SystemII (F2)
MeanSystem I
(F1)System II
(F2)Mean
F1 : Palekar’s method F2 : Without Palekar’s method
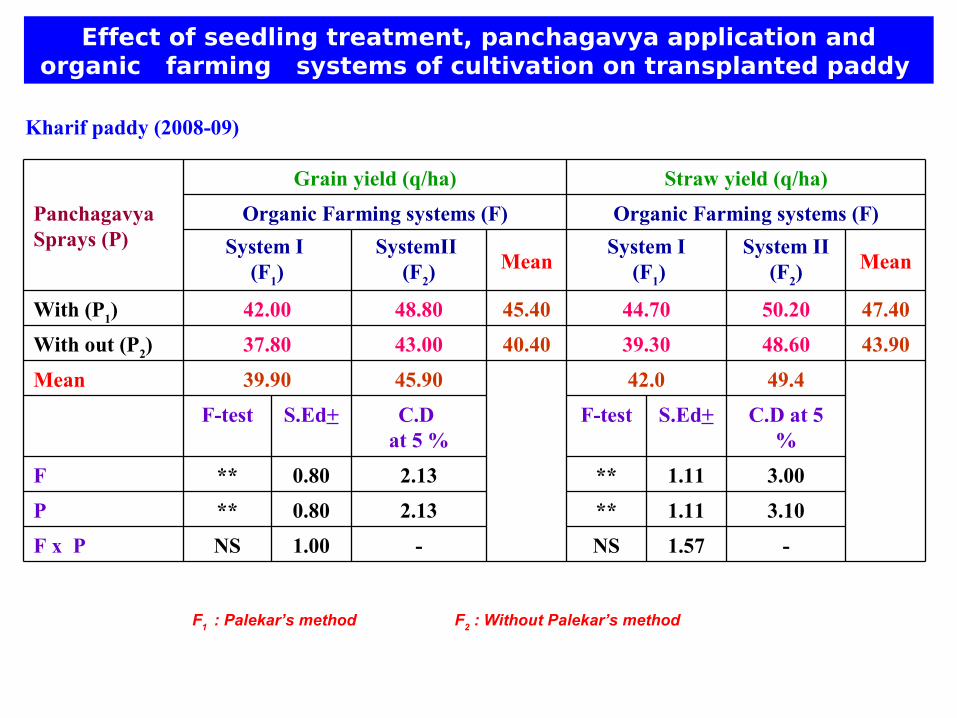
Panchagavya Sprays (P)
Grain yield (q/ha) Straw yield (q/ha)
Organic Farming systems (F) Organic Farming systems (F)
System I (F1)
SystemII (F2)
MeanSystem I
(F1)System II
(F2)Mean
With (P1) 42.00 48.80 45.40 44.70 50.20 47.40
With out (P2) 37.80 43.00 40.40 39.30 48.60 43.90
Mean 39.90 45.90 42.0 49.4
F-test S.Ed+ C.D at 5 %
F-test S.Ed+ C.D at 5 %
F ** 0.80 2.13 ** 1.11 3.00
P ** 0.80 2.13 ** 1.11 3.10
F x P NS 1.00 - NS 1.57 -
F1 : Palekar’s method F2 : Without Palekar’s method
Effect of seedling treatment, panchagavya application and organic farming systems of cultivation on transplanted paddy
Kharif paddy (2008-09)
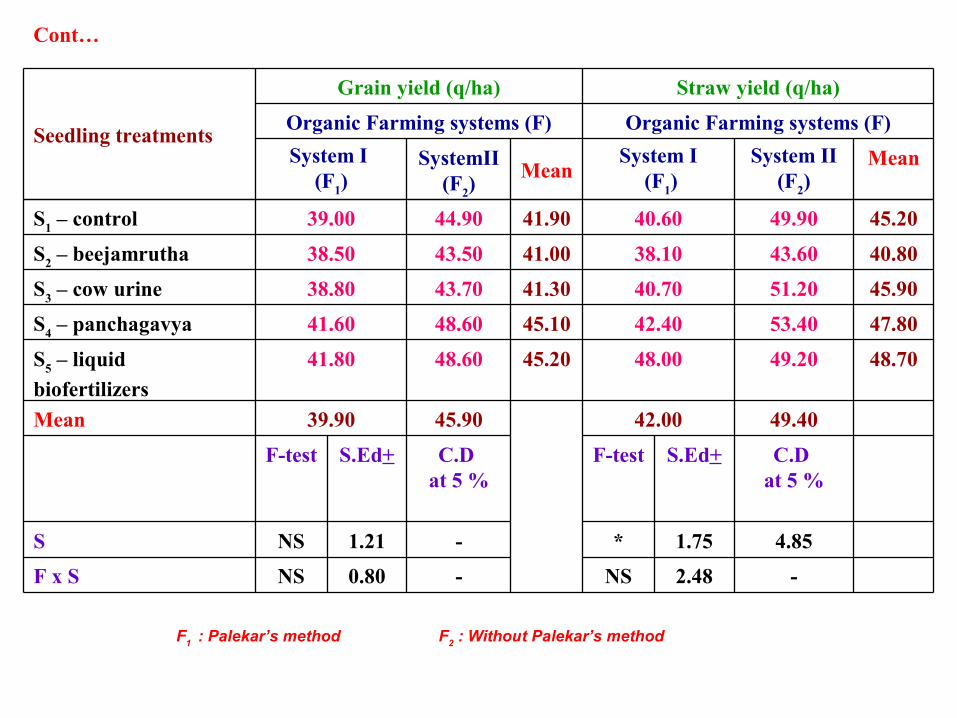
S1 – control 39.00 44.90 41.90 40.60 49.90 45.20
S2 – beejamrutha 38.50 43.50 41.00 38.10 43.60 40.80
S3 – cow urine 38.80 43.70 41.30 40.70 51.20 45.90
S4 – panchagavya 41.60 48.60 45.10 42.40 53.40 47.80
S5 – liquid
biofertilizers
41.80 48.60 45.20 48.00 49.20 48.70
Mean 39.90 45.90 42.00 49.40
F-test S.Ed+ C.D at 5 %
F-test S.Ed+ C.D at 5 %
S NS 1.21 - * 1.75 4.85
F x S NS 0.80 - NS 2.48 -
Cont…
Seedling treatments
Grain yield (q/ha) Straw yield (q/ha)
Organic Farming systems (F) Organic Farming systems (F)
System I (F1)
SystemII (F2)
MeanSystem I
(F1)System II
(F2)Mean
F1 : Palekar’s method F2 : Without Palekar’s method
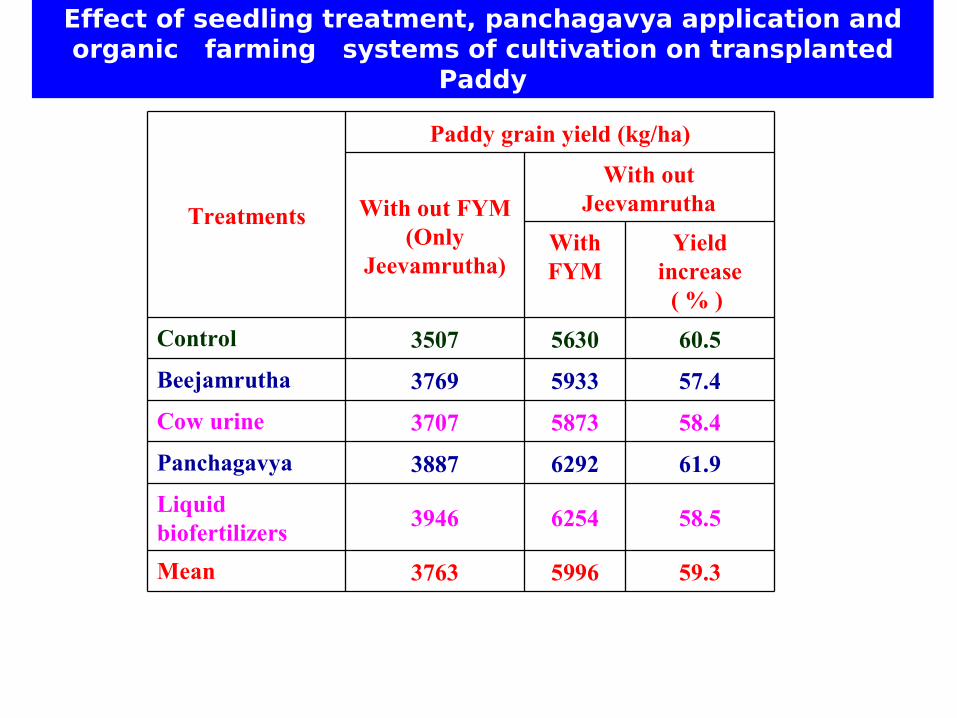
Effect of seedling treatment, panchagavya application and organic farming systems of cultivation on transplanted
Paddy
Treatments
Paddy grain yield (kg/ha)
With out FYM(Only
Jeevamrutha)
With out Jeevamrutha
With FYM
Yield increase
( % )
Control 3507 5630 60.5
Beejamrutha 3769 5933 57.4
Cow urine 3707 5873 58.4
Panchagavya 3887 6292 61.9
Liquid biofertilizers
3946 6254 58.5
Mean 3763 5996 59.3