Embed Size (px)
Citation preview
www.fibl.org
Organic Horticulture World-wideHelga WillerResearch Institute of Organic Agriculture FiBL, Switzerland
Presentation at: 28th International Horticultural Congress, Symposium Organic Horticulture: Productivity and SustainabilityAugust 22-27, 2010, Lisbon
Research Institute of Organic AgricultureForschungsinstitut für biologischen Landbau

www.fibl.org
Contents of this presentation
About the data collection on organic agriculture world-wide of the Research Institute of Organic Agriculture FiBL and the International Federation of Organic Agriculture Movements IFOAM; Key results of the most recent survey on organic agriculture world-wide;The organic market; Horticultural crops:
GeneralVegetablesFruitsOlives, Grapes, Coffee, Cocoa
Conclusion
www.fibl.org
Global survey on organic agriculture
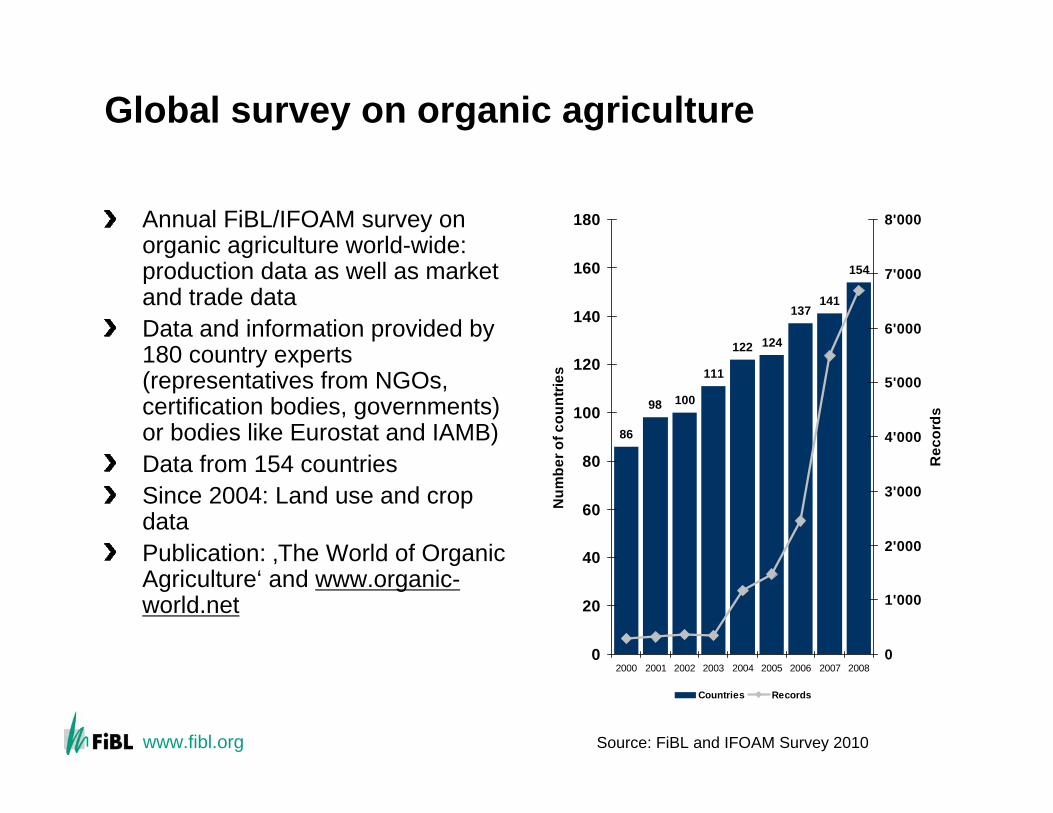
Annual FiBL/IFOAM survey on organic agriculture world-wide: production data as well as marketand trade dataData and information provided by180 country experts(representatives from NGOs, certification bodies, governments) or bodies like Eurostat and IAMB)Data from 154 countriesSince 2004: Land use and cropdataPublication: ‚The World of OrganicAgriculture‘ and www.organic-world.net
86
98 100
111
124
137141
154
122
0
20
40
60
80
100
120
140
160
180
2000 2001 2002 2003 2004 2005 2006 2007 2008
Num
ber o
f cou
ntrie
s
0
1'000
2'000
3'000
4'000
5'000
6'000
7'000
8'000
Rec
ords
Countries Records
Source: FiBL and IFOAM Survey 2010
www.fibl.org
The Global Organic Survey 2010
The global organic survey 2010 as well as the production of the yearbook‚The World of Organic Agriculture‘is carried out by FiBL and IFOAM with the support of: International Trade Centre, GenevaSwiss State Secretariat of Economic Affairs SECO, Bern
DatabaseExpansion of data collectionto new variables (market and trade data)Classification for crops and manufactured productsWebsite Overview of data collection systems
Nürnberg Messe, the organizersof the BioFach Organic Trade Fair
www.fibl.org
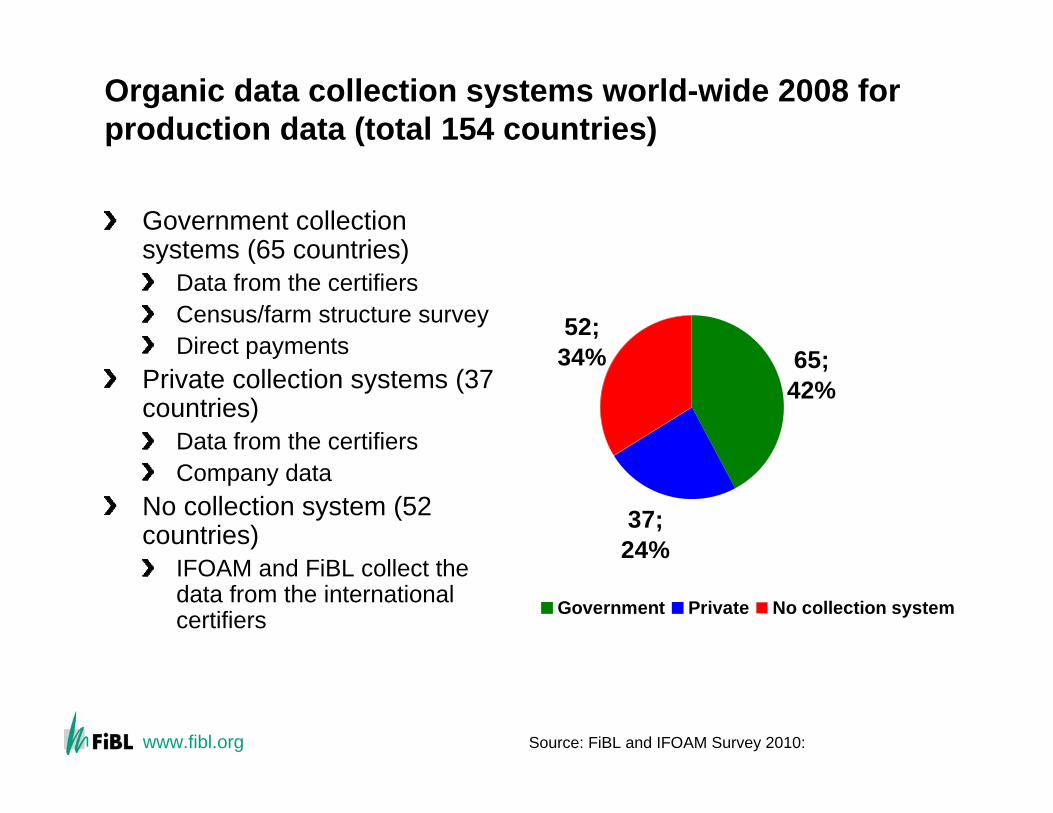
Organic data collection systems world-wide 2008 forproduction data (total 154 countries)
Government collectionsystems (65 countries)
Data from the certifiersCensus/farm structure surveyDirect payments
Private collection systems (37 countries)
Data from the certifiersCompany data
No collection system (52 countries)
IFOAM and FiBL collect thedata from the international certifiers
37; 24%
65; 42%
52; 34%
Government Private No collection system
Source: FiBL and IFOAM Survey 2010:
www.fibl.org
Problems related to data / data collection
Countries with no data collection: Not all certifiers mayshare their data, sometimes problems of continuity of data supply, therefore comparability over the years forthese countries difficult; Data availability is generally improving every year, again, this can make a direct year-to-year comparison difficult;From major organic producer countries data on land use/ crops grown are missing, even though overall data on organic agriculture are available (Australia, Brazil, China, India);No harmonized classification system for crops/products.
www.fibl.org
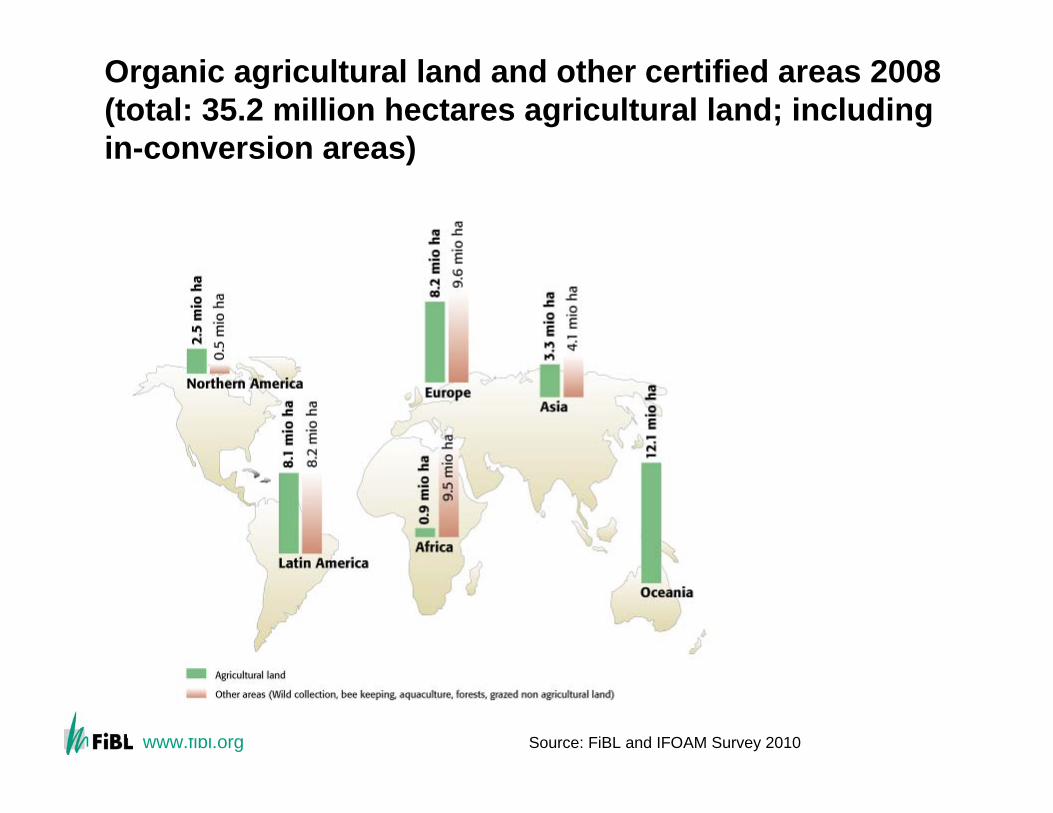
Organic agricultural land and other certified areas 2008 (total: 35.2 million hectares agricultural land; including in-conversion areas)
Source: FiBL and IFOAM Survey 2010
www.fibl.org
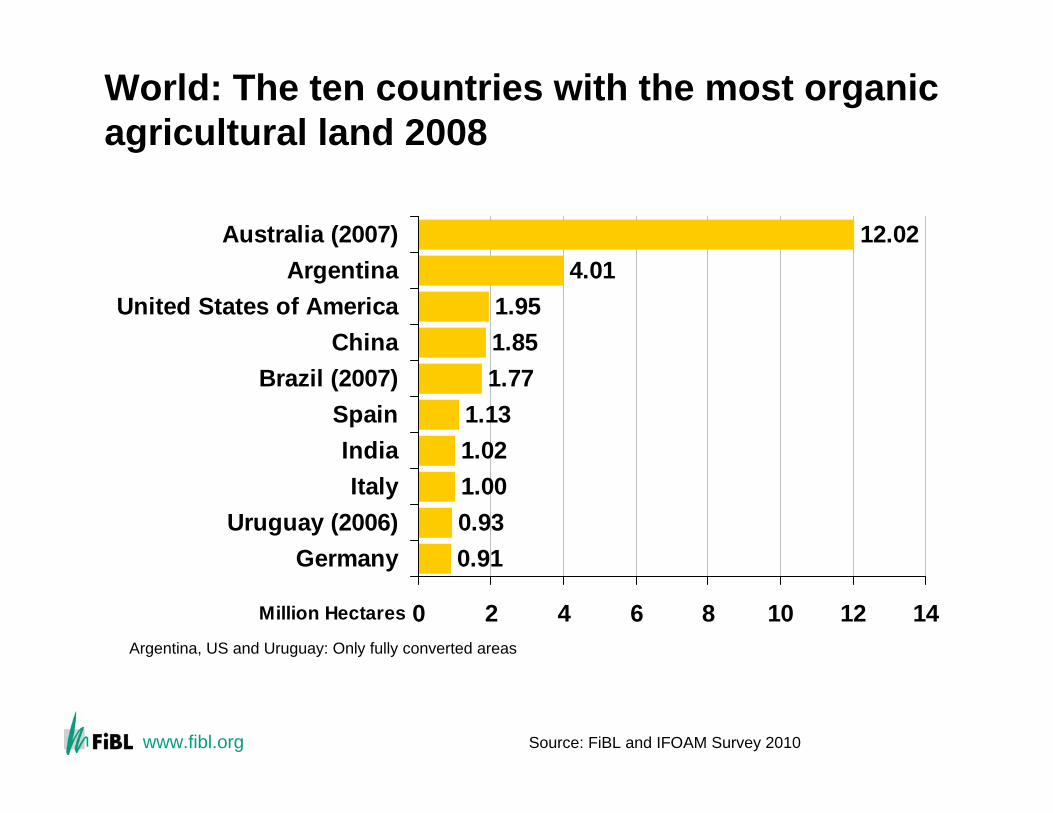
World: The ten countries with the most organicagricultural land 2008
0.910.931.001.021.13
1.771.851.95
4.0112.02
0 2 4 6 8 10 12 14
GermanyUruguay (2006)
ItalyIndia
SpainBrazil (2007)
ChinaUnited States of America
ArgentinaAustralia (2007)
Million Hectares
Argentina, US and Uruguay: Only fully converted areas
Source: FiBL and IFOAM Survey 2010

www.fibl.org
The ten countries/areas with the highest sharesof organic agricultural land 2008
7.9%8.0%
9.1%9.6%
10.5%10.8%11.1%
15.9%29.8%
36.9%
0% 5% 10% 15% 20% 25% 30% 35% 40%
ItalyCzech Republic
LatviaEstonia
French GuianaSweden
SwitzerlandAustria
LiechtensteinFalkland Islands
Source: FiBL and IFOAM Survey 2010, sharescalculated with FAOSTAT data
www.fibl.org
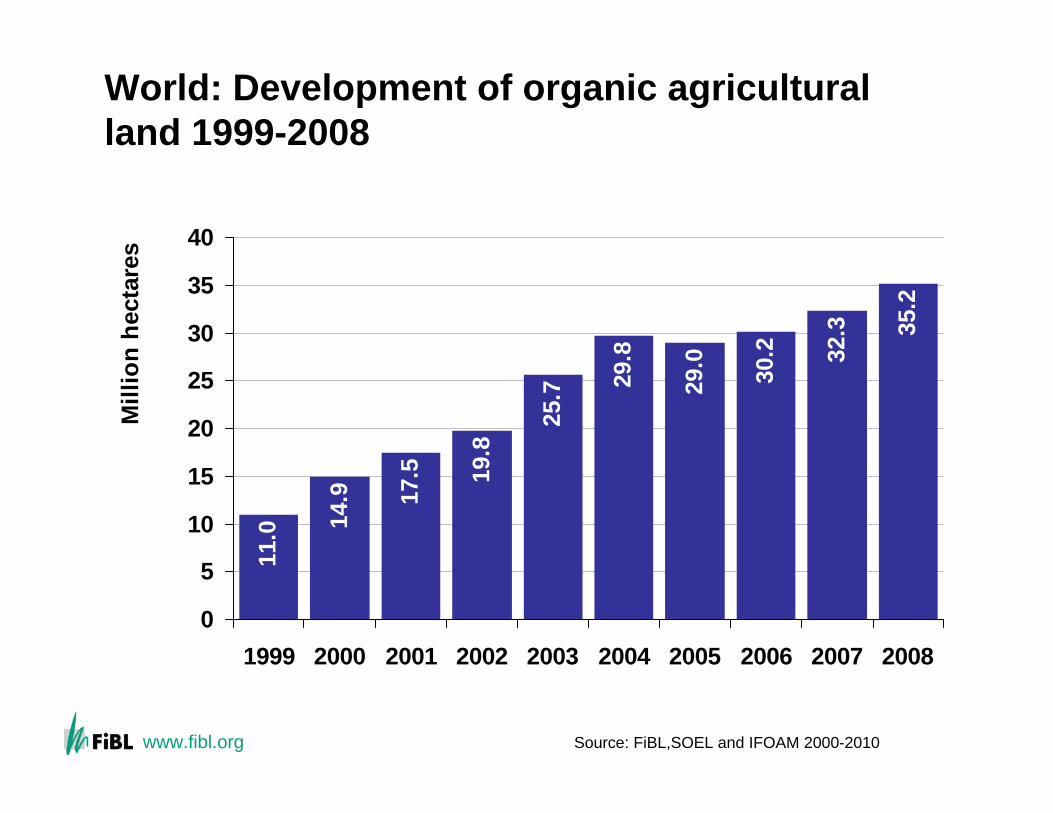
World: Development of organic agriculturalland 1999-2008
11.0
17.5 19
.8
25.7 29
.8
29.0 30.2 32
.3 35.2
14.9
0
5
10
15
20
25
30
35
40
1999 2000 2001 2002 2003 2004 2005 2006 2007 2008
Mill
ion
hect
ares
Source: FiBL,SOEL and IFOAM 2000-2010
www.fibl.org
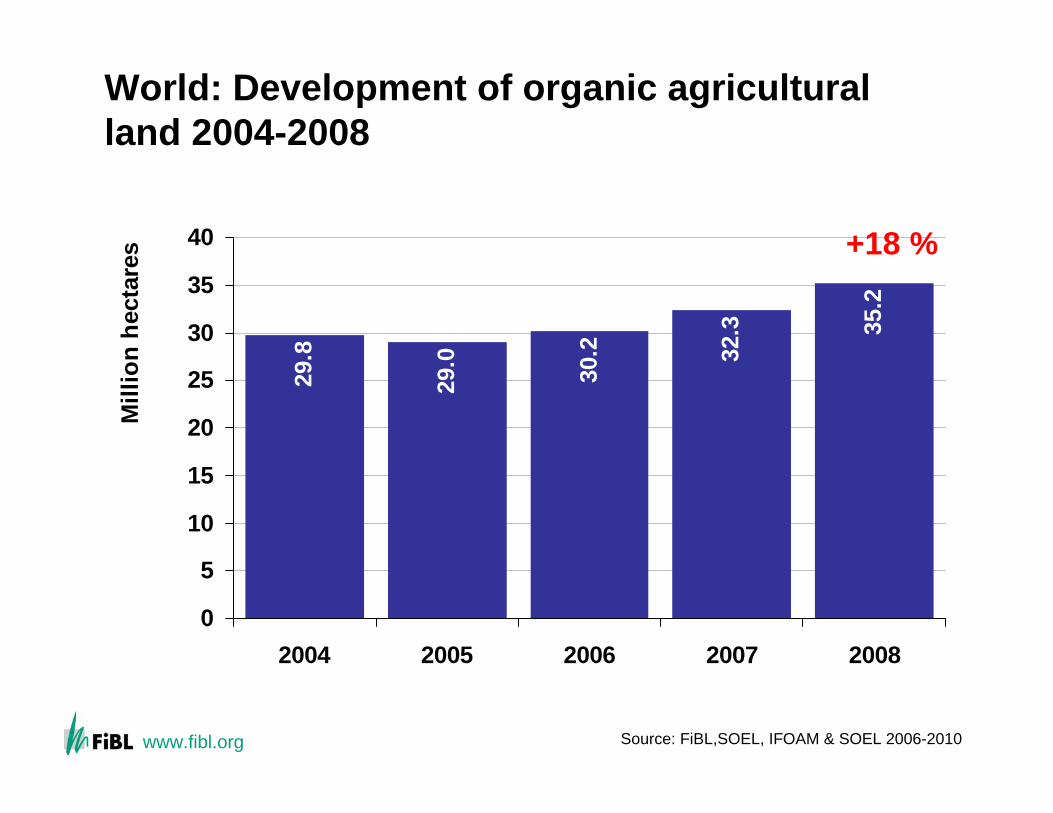
World: Development of organic agriculturalland 2004-2008
29.8
30.2 32
.3 35.2
29.0
0
5
10
15
20
25
30
35
40
2004 2005 2006 2007 2008
Mill
ion
hect
ares +18 %
Source: FiBL,SOEL, IFOAM & SOEL 2006-2010
www.fibl.org
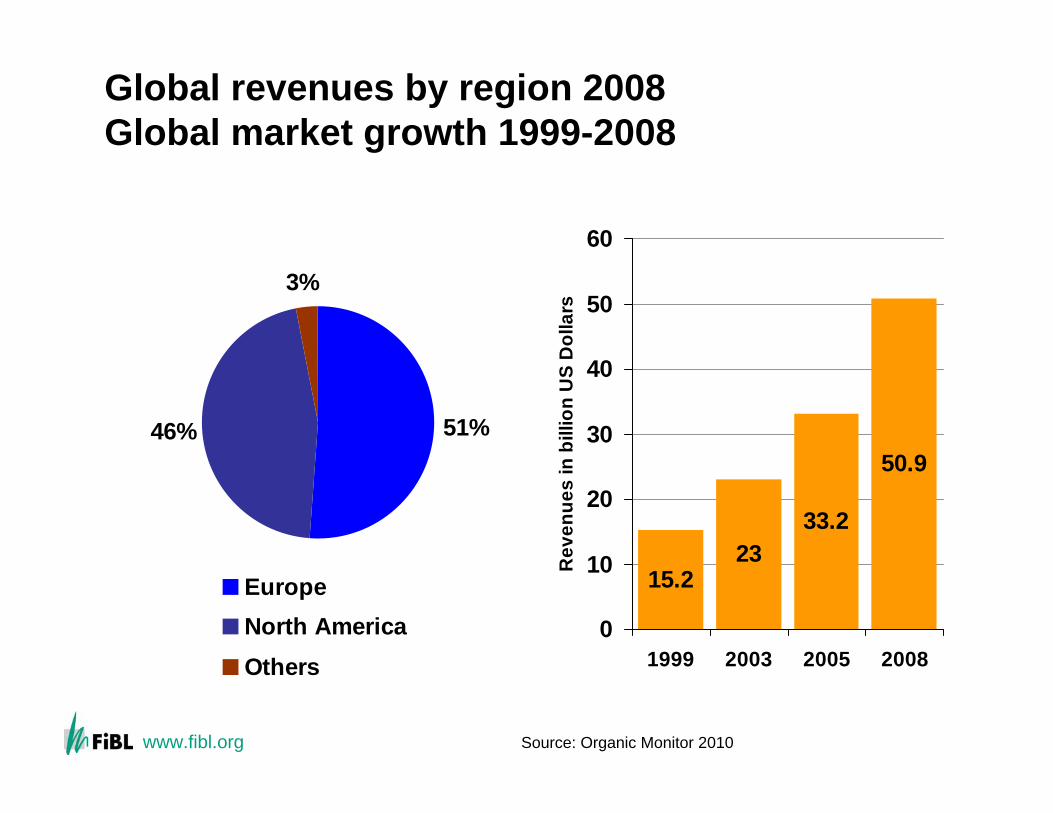
Global revenues by region 2008 Global market growth 1999-2008
15.223
33.2
50.9
0
10
20
30
40
50
60
1999 2003 2005 2008
Rev
enue
s in
bill
ion
US
Dol
lars
51%46%
3%
EuropeNorth AmericaOthers
Source: Organic Monitor 2010
www.fibl.org
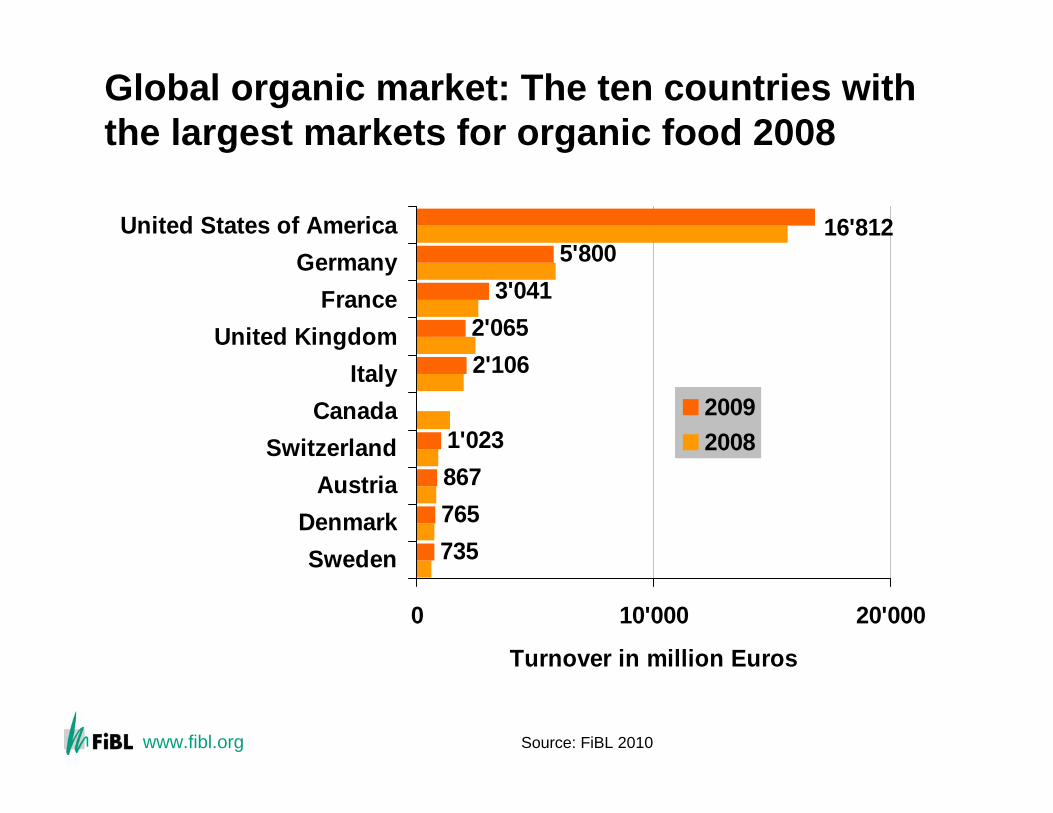
Global organic market: The ten countries withthe largest markets for organic food 2008
7357658671'023
2'1062'065
3'0415'800
16'812
0 10'000 20'000
SwedenDenmark
AustriaSwitzerland
CanadaItaly
United KingdomFrance
GermanyUnited States of America
Turnover in million Euros
20092008
Source: FiBL 2010
www.fibl.org
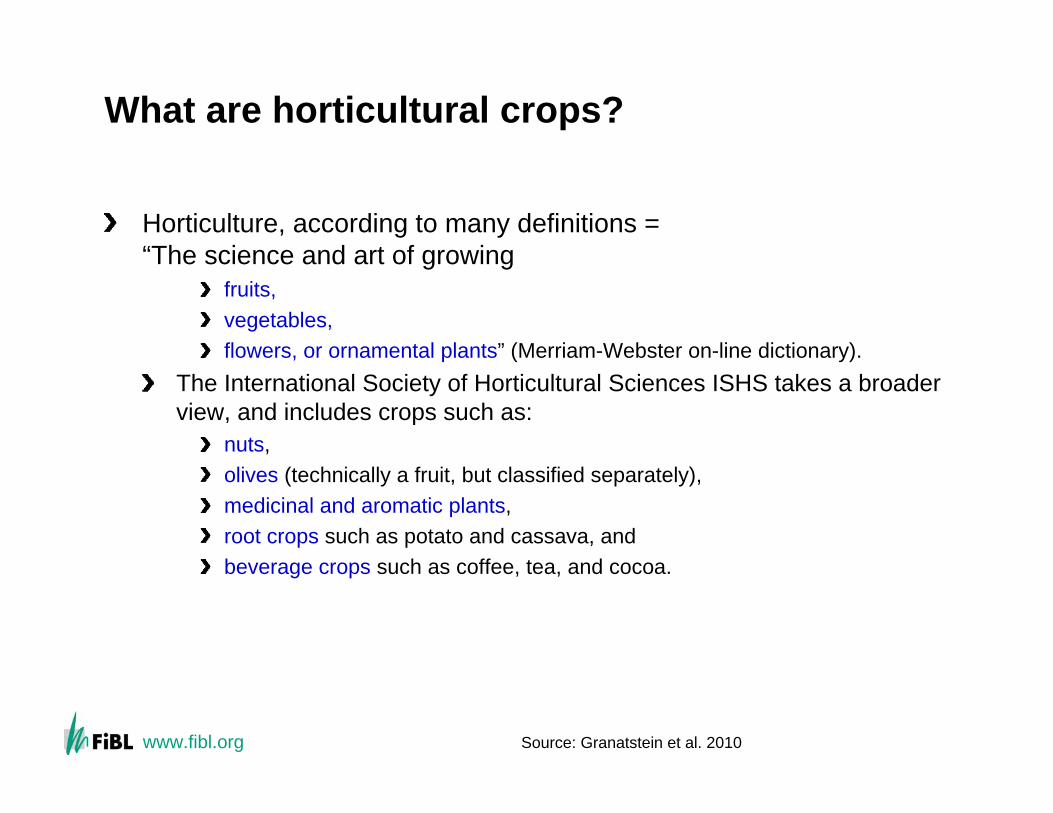
What are horticultural crops?
Horticulture, according to many definitions = “The science and art of growing
fruits, vegetables, flowers, or ornamental plants” (Merriam-Webster on-line dictionary).
The International Society of Horticultural Sciences ISHS takes a broader view, and includes crops such as:
nuts, olives (technically a fruit, but classified separately),medicinal and aromatic plants, root crops such as potato and cassava, andbeverage crops such as coffee, tea, and cocoa.
Source: Granatstein et al. 2010
www.fibl.org
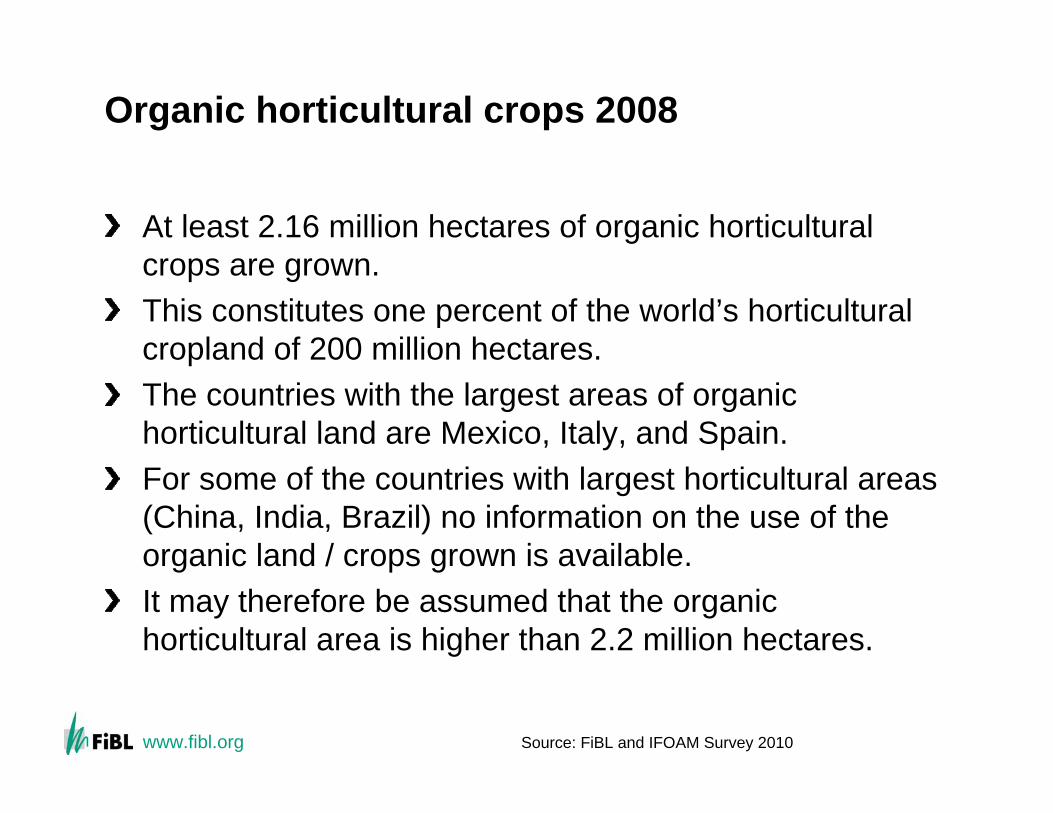
Organic horticultural crops 2008
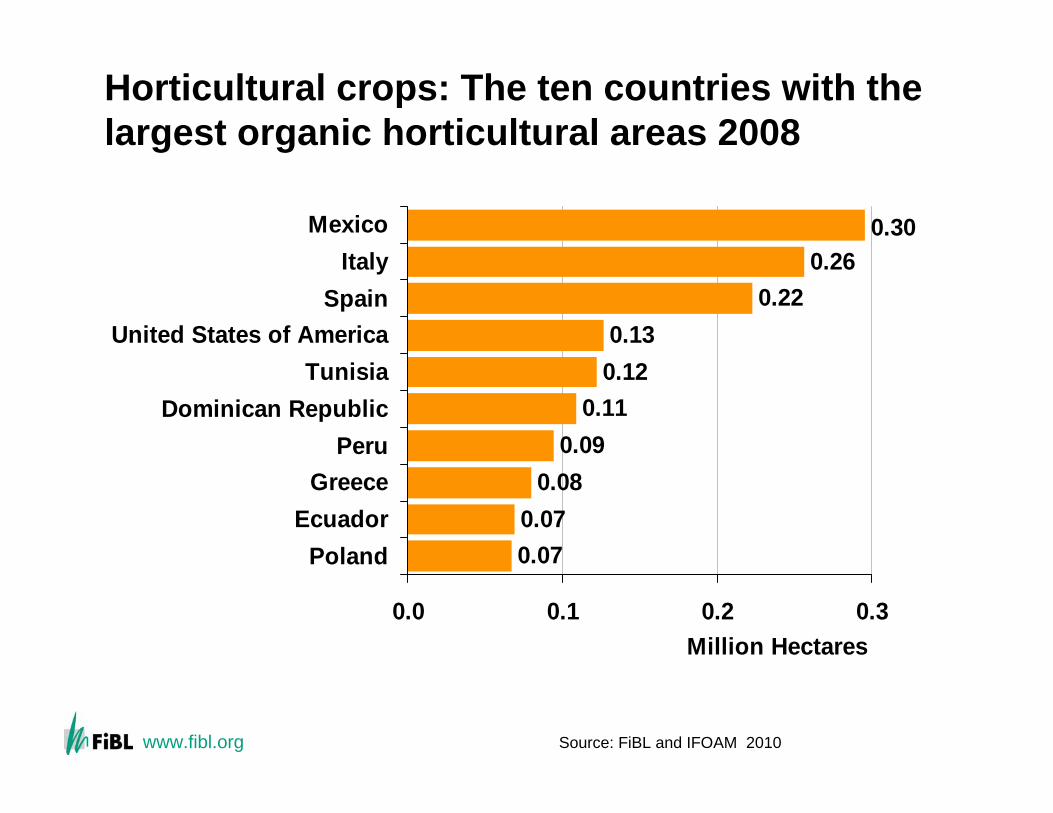
At least 2.16 million hectares of organic horticultural crops are grown.This constitutes one percent of the world’s horticultural cropland of 200 million hectares.The countries with the largest areas of organic horticultural land are Mexico, Italy, and Spain. For some of the countries with largest horticultural areas (China, India, Brazil) no information on the use of the organic land / crops grown is available. It may therefore be assumed that the organic horticultural area is higher than 2.2 million hectares.
Source: FiBL and IFOAM Survey 2010
www.fibl.org
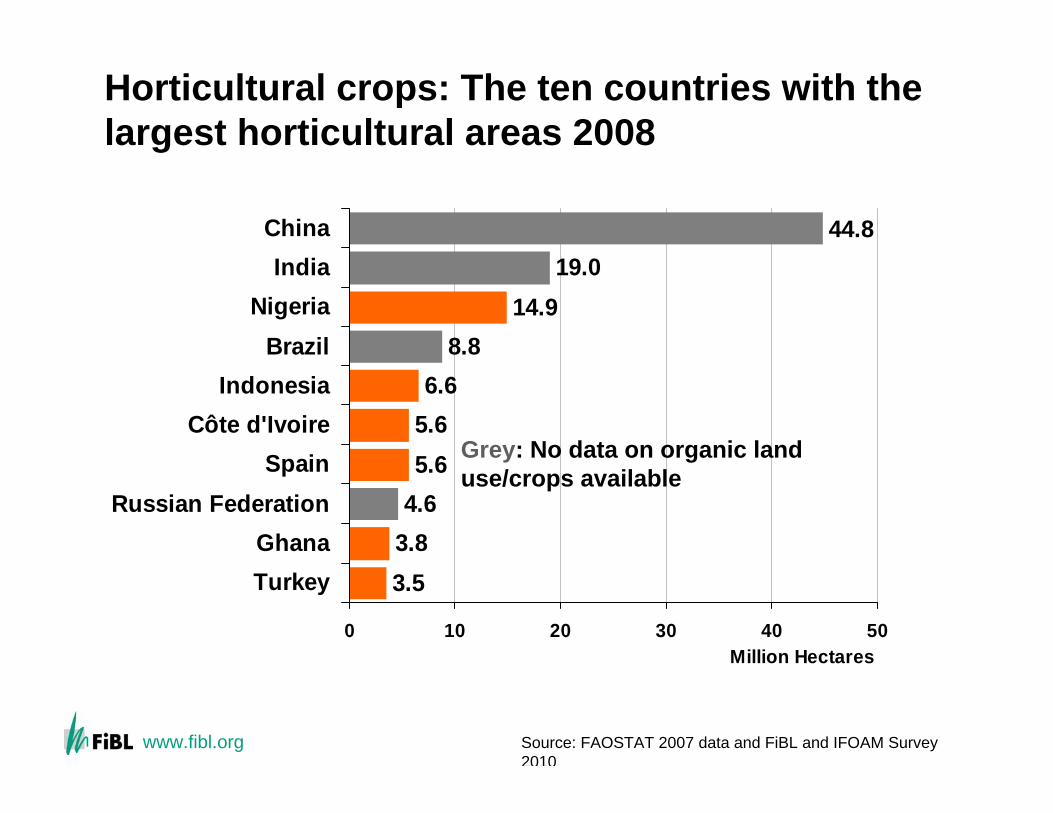
Horticultural crops: The ten countries with thelargest horticultural areas 2008
3.53.84.65.65.66.6
8.814.9
19.044.8
0 10 20 30 40 50
TurkeyGhana
Russian FederationSpain
Côte d'IvoireIndonesia
BrazilNigeria
IndiaChina
Million Hectares
Grey: No data on organic land use/crops available
Source: FAOSTAT 2007 data and FiBL and IFOAM Survey2010
www.fibl.org
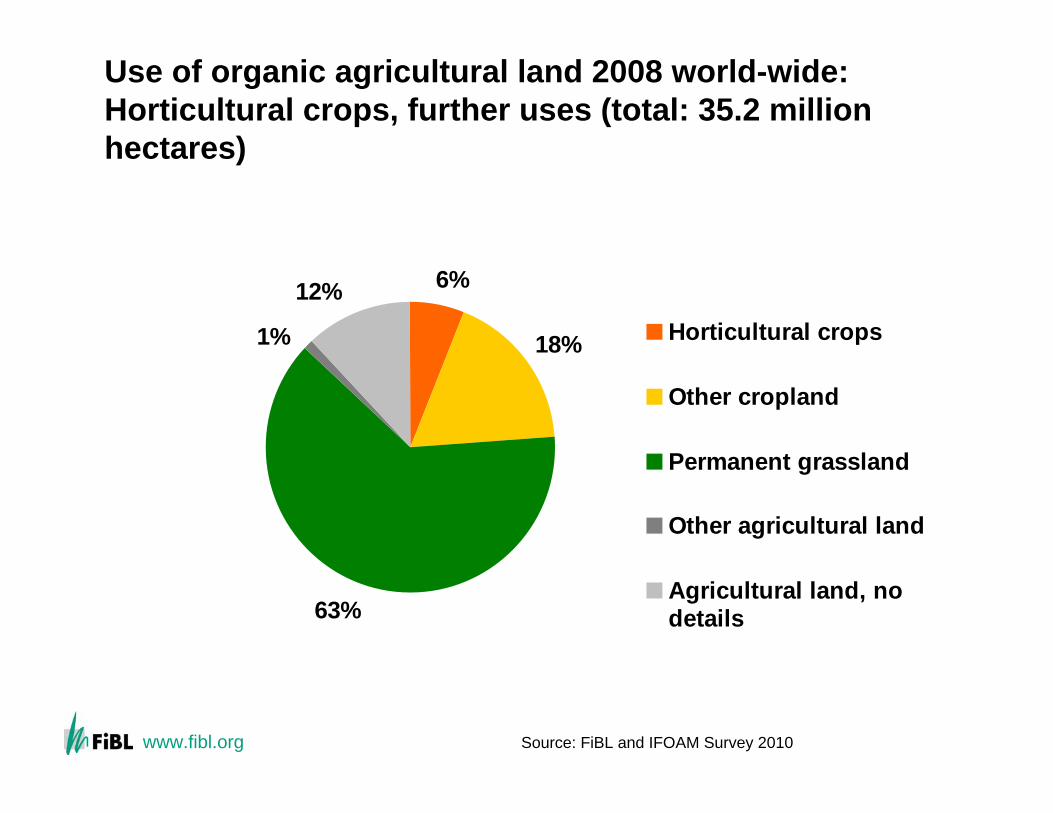
Use of organic agricultural land 2008 world-wide: Horticultural crops, further uses (total: 35.2 millionhectares)
6%
18%
63%
1%
12%Horticultural crops
Other cropland
Permanent grassland
Other agricultural land
Agricultural land, nodetails
Source: FiBL and IFOAM Survey 2010
www.fibl.org
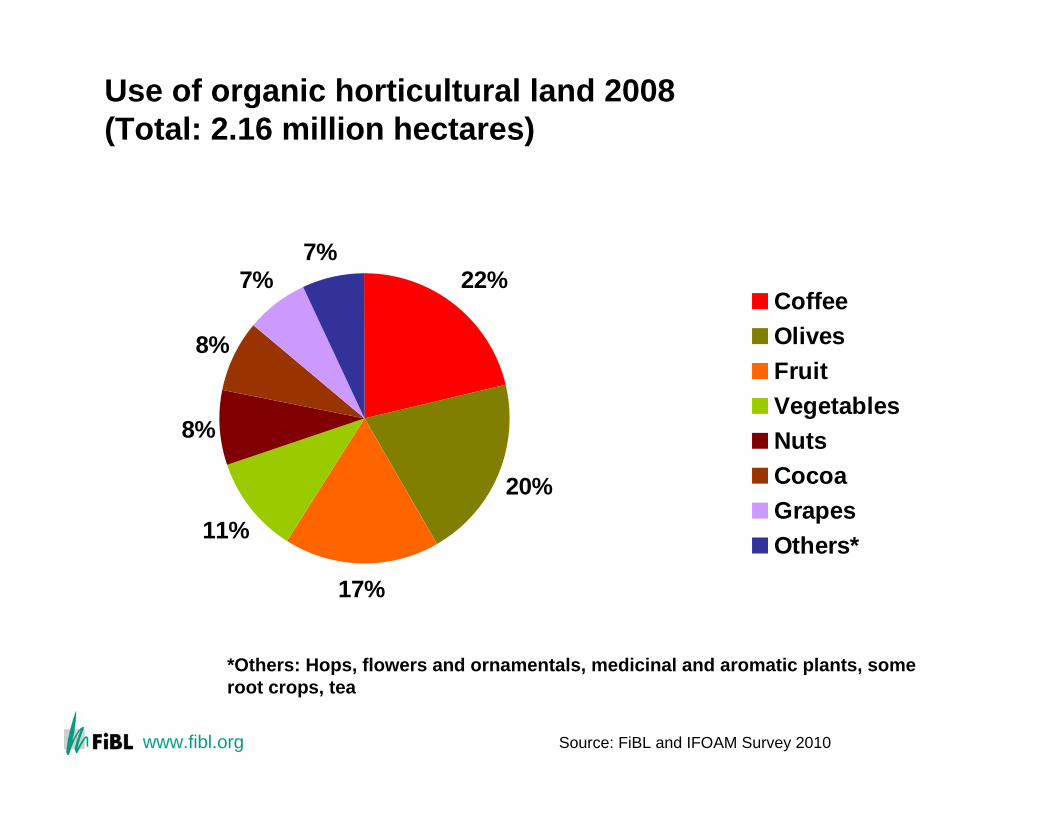
Use of organic horticultural land 2008 (Total: 2.16 million hectares)
22%
20%
17%
11%
8%
8%
7%7%
CoffeeOlivesFruitVegetablesNutsCocoaGrapesOthers*
Source: FiBL and IFOAM Survey 2010
*Others: Hops, flowers and ornamentals, medicinal and aromatic plants, some root crops, tea

www.fibl.org
Horticulture: Growth of organically managedhorticultural land 2004-2008
1.0
1.4
1.7
2.22.0
0.0
1.0
2.0
3.0
2004 2005 2006 2007 2008
Mill
ion
hect
ares
+ 140%
Source: FiBL and IFOAM Survey 2010
www.fibl.org
Horticultural crops: The ten countries with thelargest organic horticultural areas 2008
0.070.07
0.080.09
0.110.120.13
0.220.26
0.30
0.0 0.1 0.2 0.3
PolandEcuador
GreecePeru
Dominican RepublicTunisia
United States of AmericaSpain
ItalyMexico
Million Hectares
Source: FiBL and IFOAM 2010
www.fibl.org
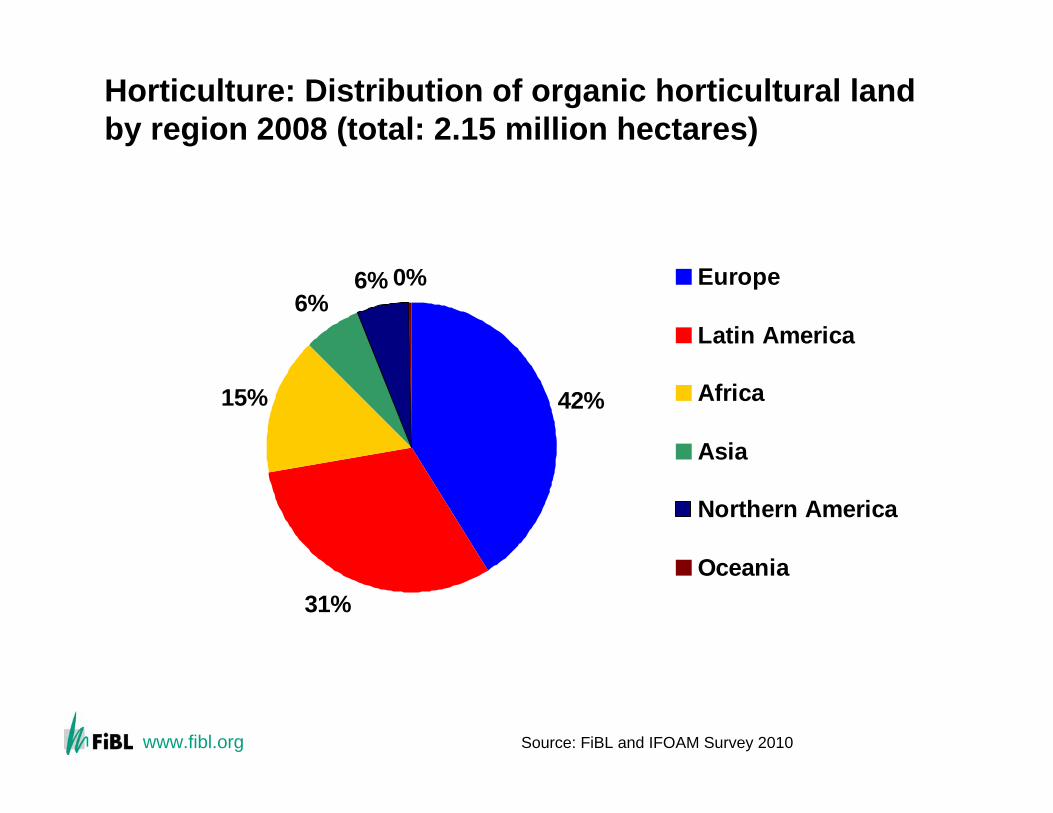
Horticulture: Distribution of organic horticultural land by region 2008 (total: 2.15 million hectares)
42%
31%
15%
6%6% 0% Europe
Latin America
Africa
Asia
Northern America
Oceania
Source: FiBL and IFOAM Survey 2010
www.fibl.org
Organic vegetables
For the development of the organic market, vegetables are a pioneer product, they are associated with health and freshness.In many countries, for organic vegetables the organic shares arehigher than for overall organic production.At least 235’000 hectares of organic vegetables are grown. This represents of 0.4 percent of the global vegetable area of 61 million hectares.Of the world’s ten largest vegetable producers land use/crop, data are missing for China and India, furthermore the Russian Federation and Bangladesh.It may therefore be assumed that the organic vegetable area is considerably higher.
Source: FiBL and IFOAM Survey 2010
www.fibl.org
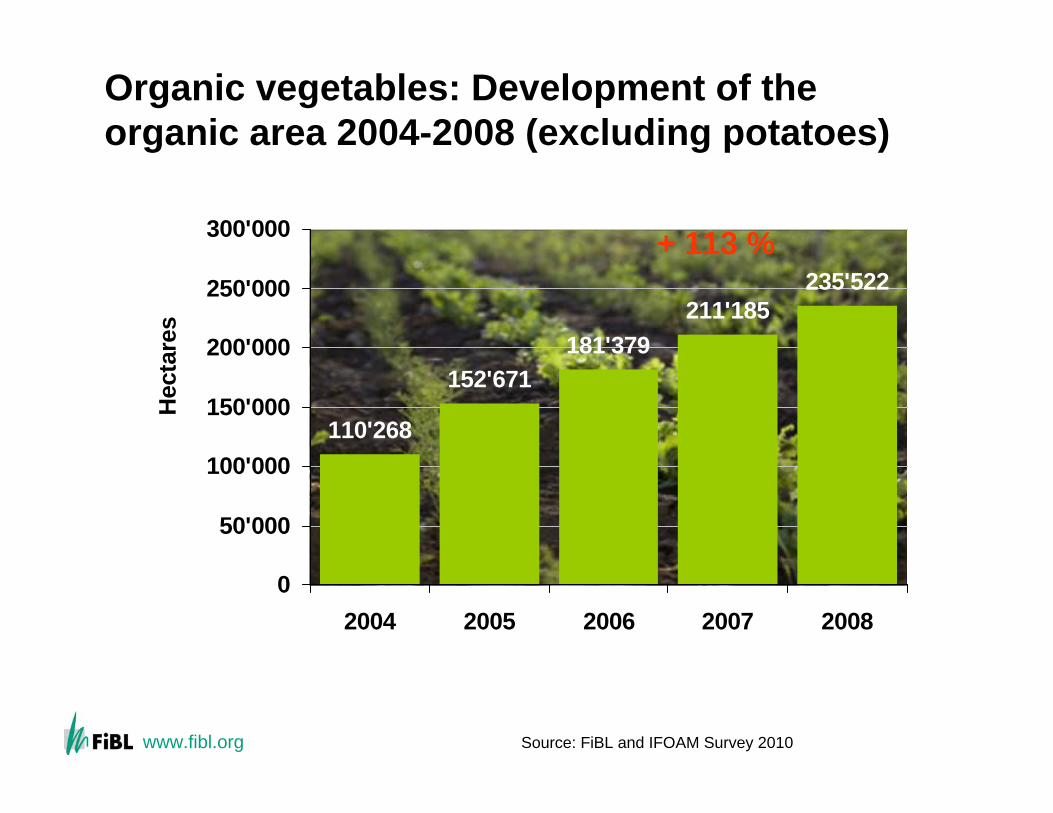
Organic vegetables: Development of theorganic area 2004-2008 (excluding potatoes)
110'268
152'671181'379
211'185235'522
0
50'000
100'000
150'000
200'000
250'000
300'000
2004 2005 2006 2007 2008
Hec
tare
s
+ 113 %
Source: FiBL and IFOAM Survey 2010
www.fibl.org
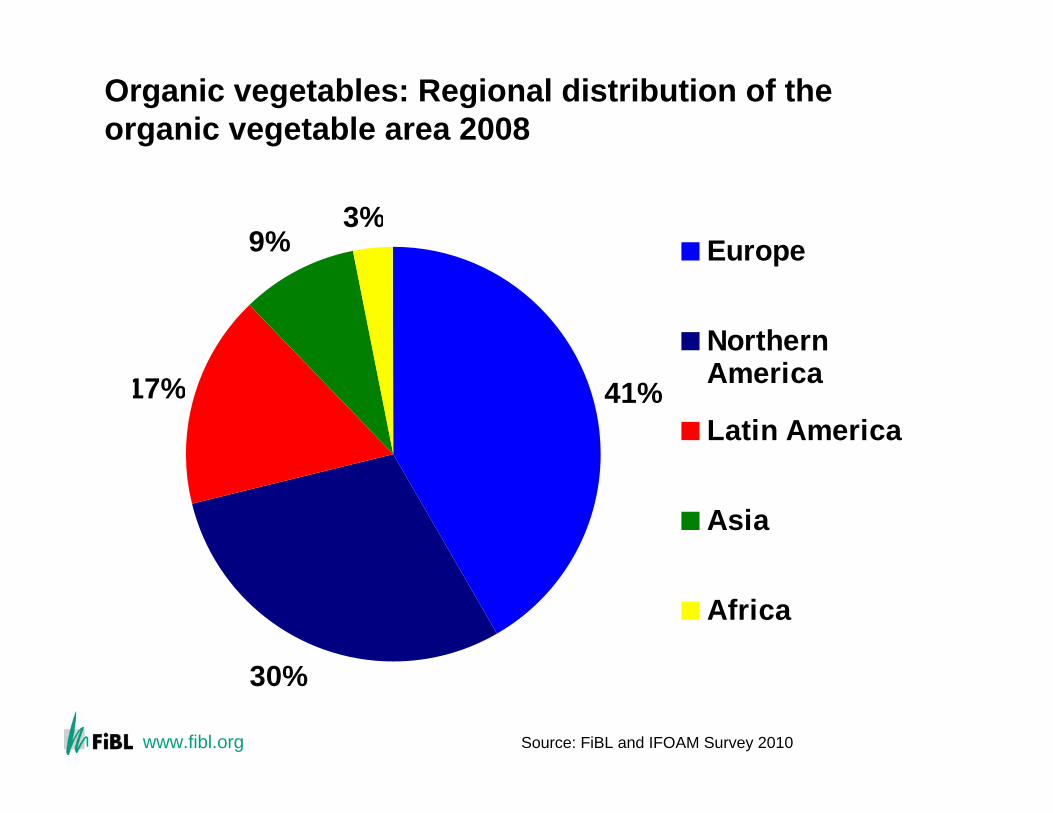
Organic vegetables: Regional distribution of theorganic vegetable area 2008
41%
30%
17%
9%3%
Europe
NorthernAmerica
Latin America
Asia
Africa
Source: FiBL and IFOAM Survey 2010
www.fibl.org
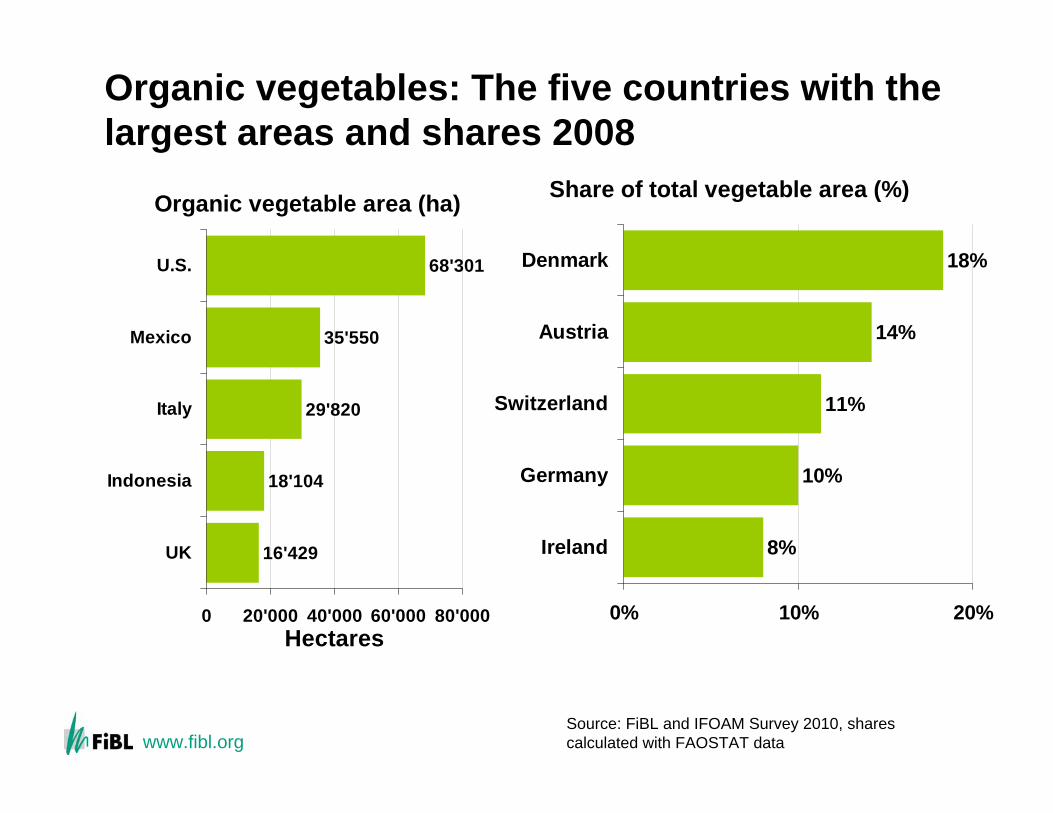
Organic vegetables: The five countries with thelargest areas and shares 2008
Organic vegetable area (ha)
16'429
18'104
29'820
35'550
68'301
0 20'000 40'000 60'000 80'000
UK
Indonesia
Italy
Mexico
U.S.
Hectares
Share of total vegetable area (%)
8%
10%
11%
14%
18%
0% 10% 20%
Ireland
Germany
Switzerland
Austria
Denmark
Source: FiBL and IFOAM Survey 2010, sharescalculated with FAOSTAT data
www.fibl.org
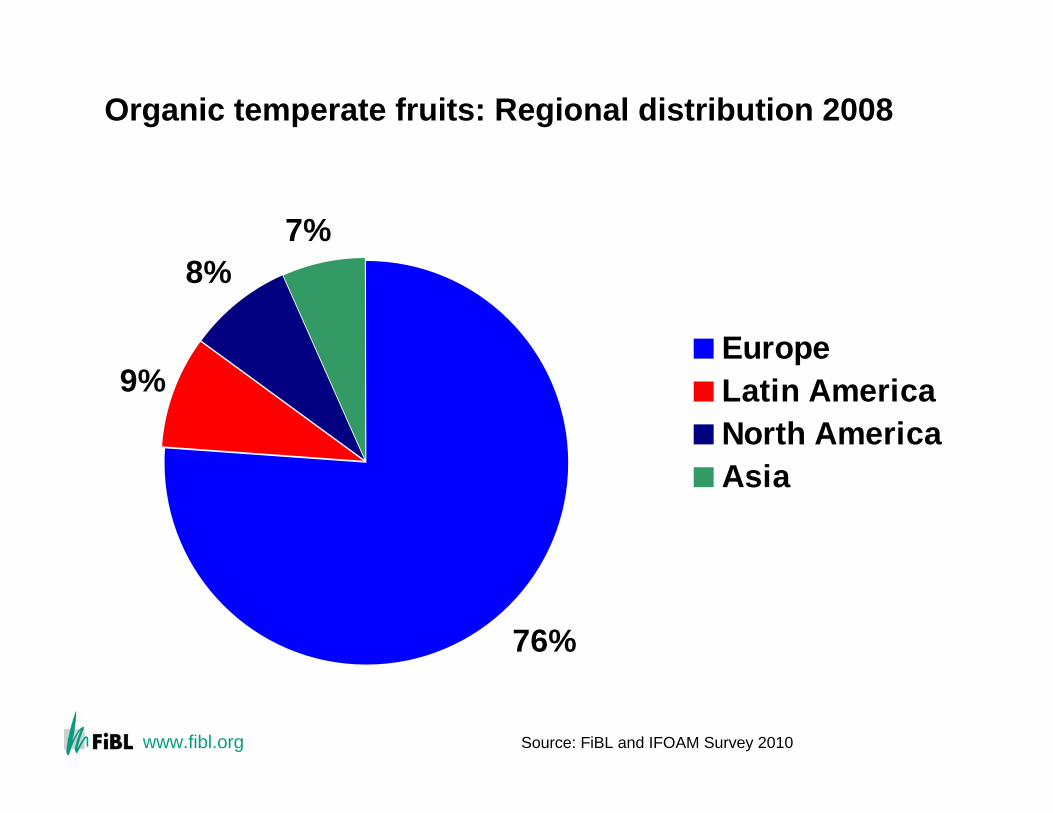
Organic temperate fruits
The area of organic temperate fruits includes pome fruit and stone fruit. At least 101,000 hectares of temperate fruit are grown organically worldwide. This constitutes 0.9 percent of the world temperate fruit area of 34 million hectares (FAOSTAT, data 2007). As no crop details were available for some of the world’s leading temperate fruit producers - China, Russia, and India - it can be assumed that the world figures for areas under organic temperate fruit are higher.
Source: FiBL and IFOAM Survey 2010
www.fibl.org
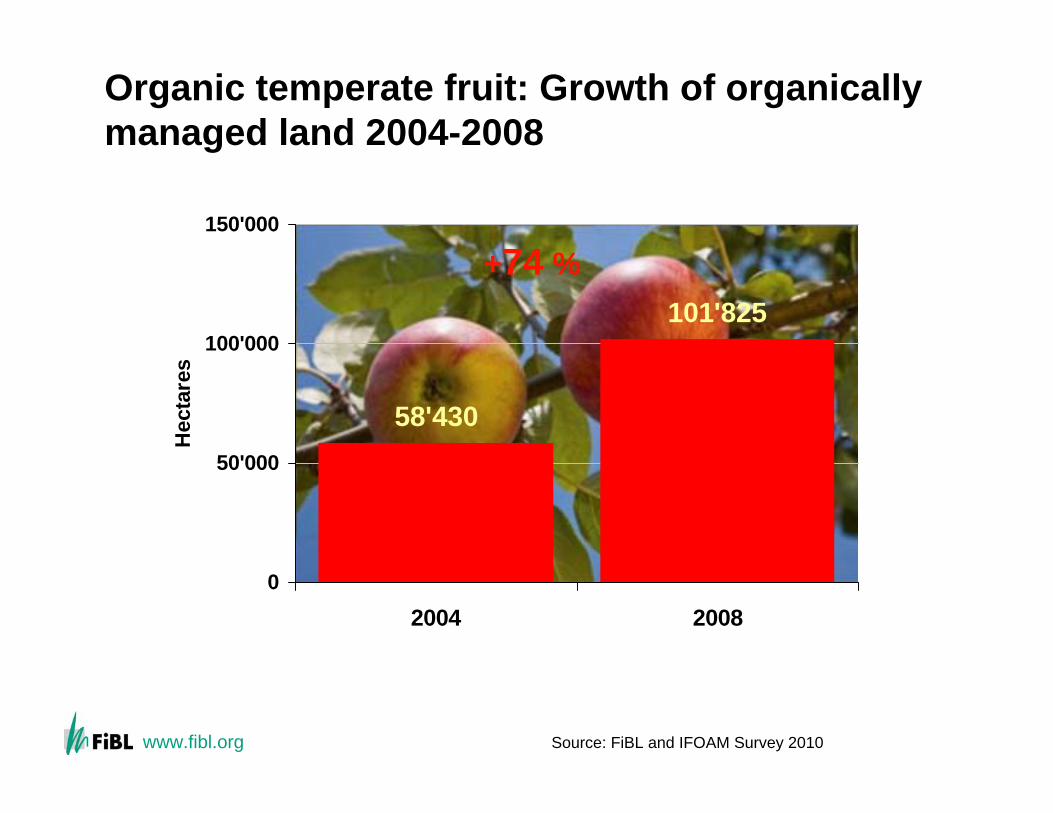
Organic temperate fruit: Growth of organicallymanaged land 2004-2008
58'430
101'825
0
50'000
100'000
150'000
2004 2008
Hec
tare
s
+74 %
Source: FiBL and IFOAM Survey 2010
www.fibl.org
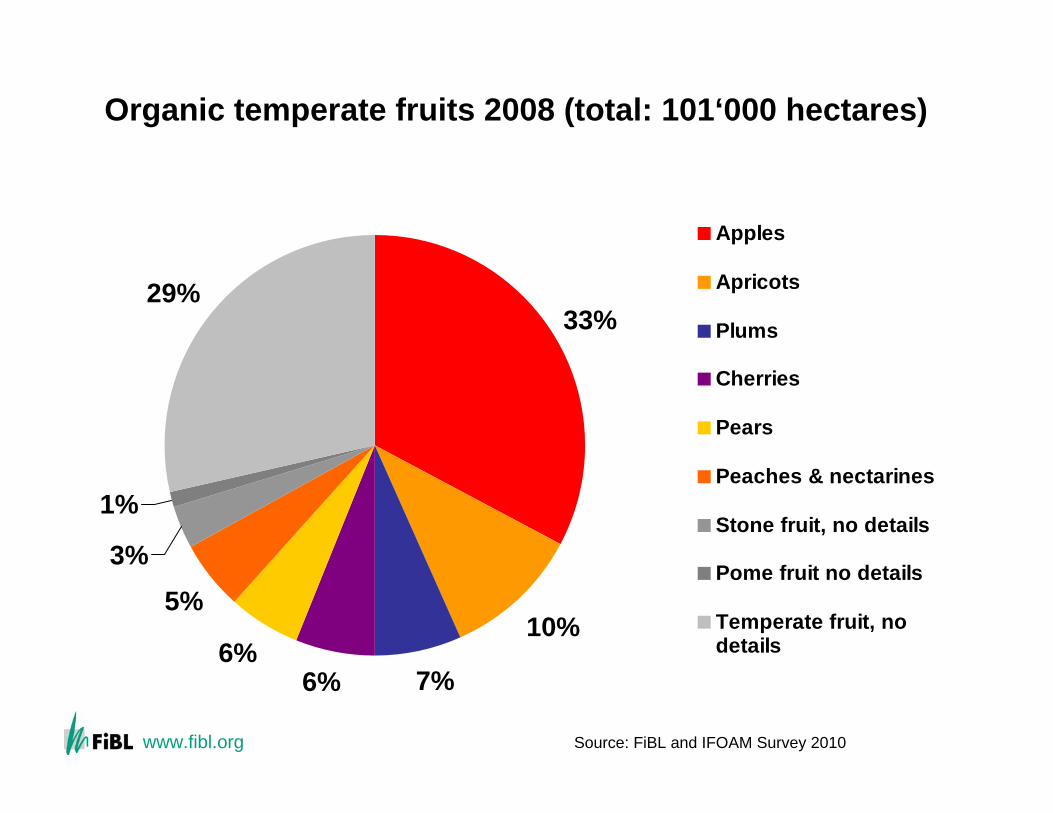
Organic temperate fruits 2008 (total: 101‘000 hectares)
33%
10%
7%6%6%
5%3%
1%
29%
Apples
Apricots
Plums
Cherries
Pears
Peaches & nectarines
Stone fruit, no details
Pome fruit no details
Temperate fruit, nodetails
Source: FiBL and IFOAM Survey 2010
www.fibl.org
Organic temperate fruits: Regional distribution 2008
76%
9%
8%7%
EuropeLatin AmericaNorth AmericaAsia
Source: FiBL and IFOAM Survey 2010
www.fibl.org
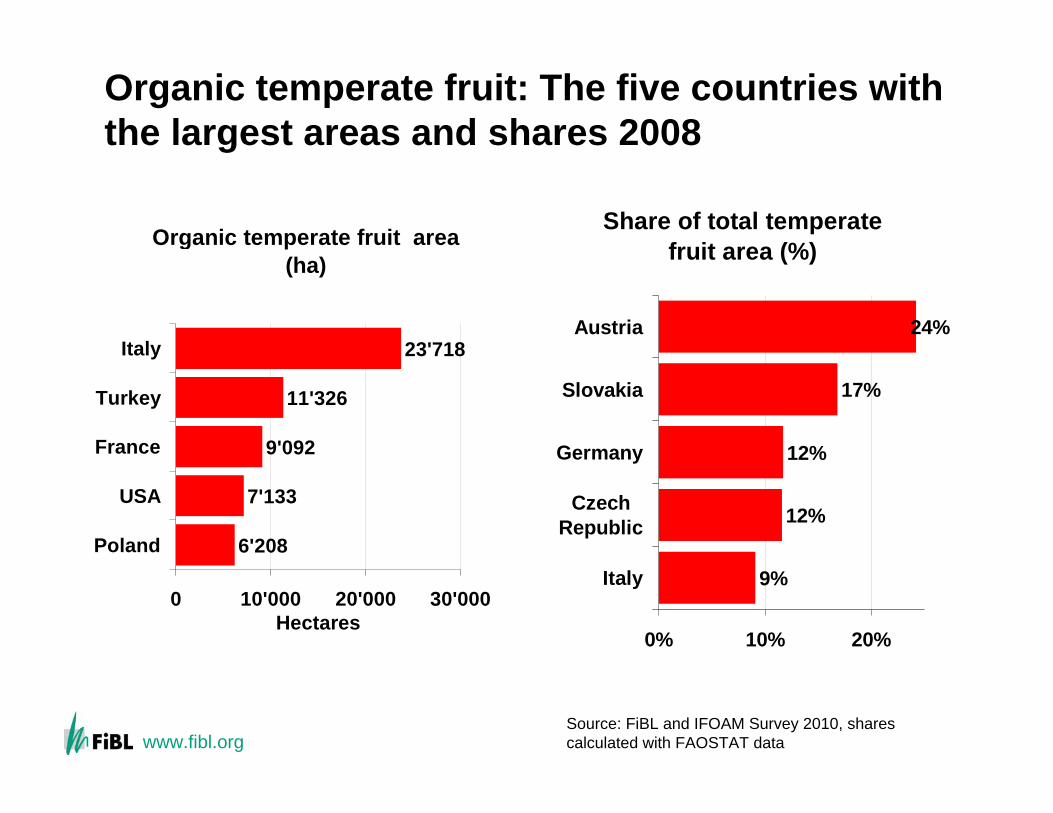
Organic temperate fruit: The five countries withthe largest areas and shares 2008
Organic temperate fruit area (ha)
6'208
7'133
9'092
11'326
23'718
0 10'000 20'000 30'000
Poland
USA
France
Turkey
Italy
Hectares
Share of total temperate fruit area (%)
9%
12%
12%
17%
24%
0% 10% 20%
Italy
CzechRepublic
Germany
Slovakia
Austria
Source: FiBL and IFOAM Survey 2010, sharescalculated with FAOSTAT data
www.fibl.org
Organic citrus and tropical fruit:Highly appreciated by consumers
Organic banana is a major organic fruit and well established in production and on the market. Citrus is well developed, too, but clearly behind bananas. For others, the market is still limited. The potential for market growth of organic citrus and tropical fruit is high. Exotic products grow faster in many countries than the overall organic products.
Source: Lukas Kilcher, oral communication
www.fibl.org
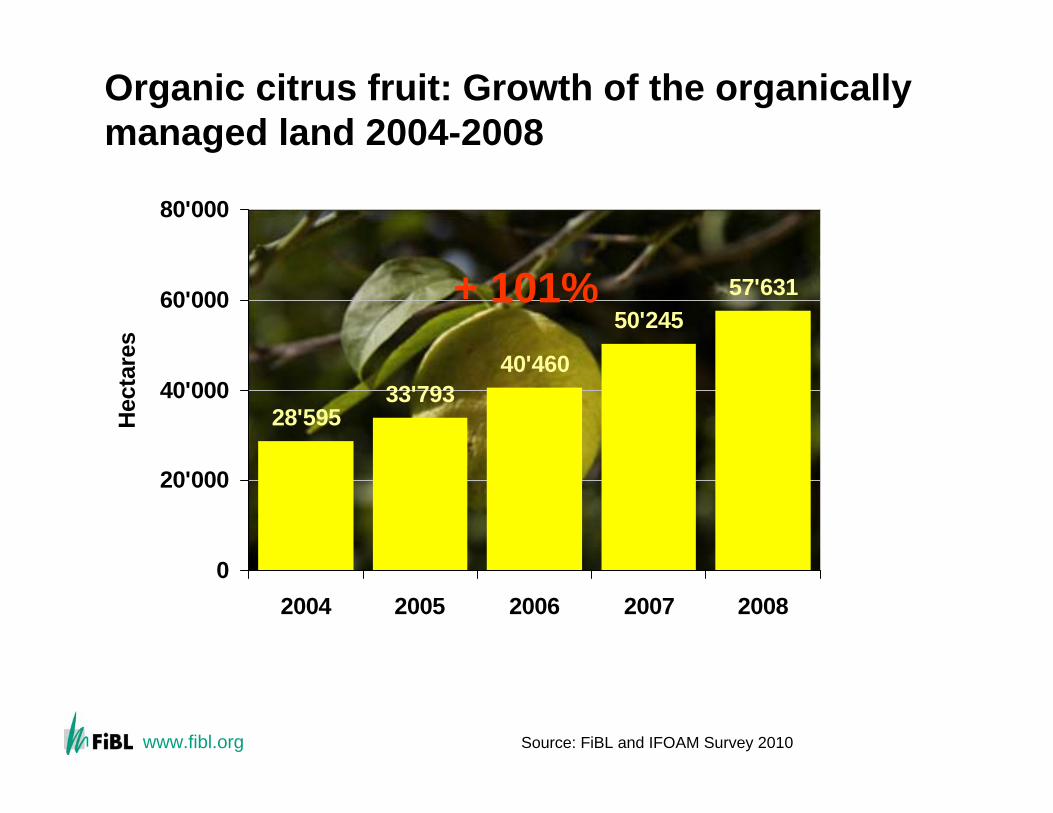
Organic citrus fruit
At least 57,700 hectares of citrus fruit are grown organically worldwide. This constitutes 0.7 percent of the world’s citrus area of 8.3 million hectares (FAOSTAT, data 2007).As no crop details were available for some of the world’s leading citrus producers like China and Brazil it can be assumed that the world figures for areas under organic citrus are higher.
Source: FiBL and IFOAM Survey 2010
www.fibl.org
Organic citrus fruit: Growth of the organicallymanaged land 2004-2008
28'59533'793
40'460
50'24557'631
0
20'000
40'000
60'000
80'000
2004 2005 2006 2007 2008
Hec
tare
s
+ 101%
Source: FiBL and IFOAM Survey 2010

www.fibl.org
Organic citrus fruits grown 2008 (Total: 58‘000 hectares)
39%
11%22%
27%
1%
Oranges
Lemons and limes
Grapefruit/PomelosCitrus fruit, other
Citrus fruit, nodetails
Source: FiBL and IFOAM Survey 2010

www.fibl.org
Organic citrus fruit: Regional distribution of organic citrus area 2008
56%
21%
12%
10% 1%
EuropeLatin AmericaNorth AmericaAfricaothers
Source: FiBL and IFOAM Survey 2010
www.fibl.org
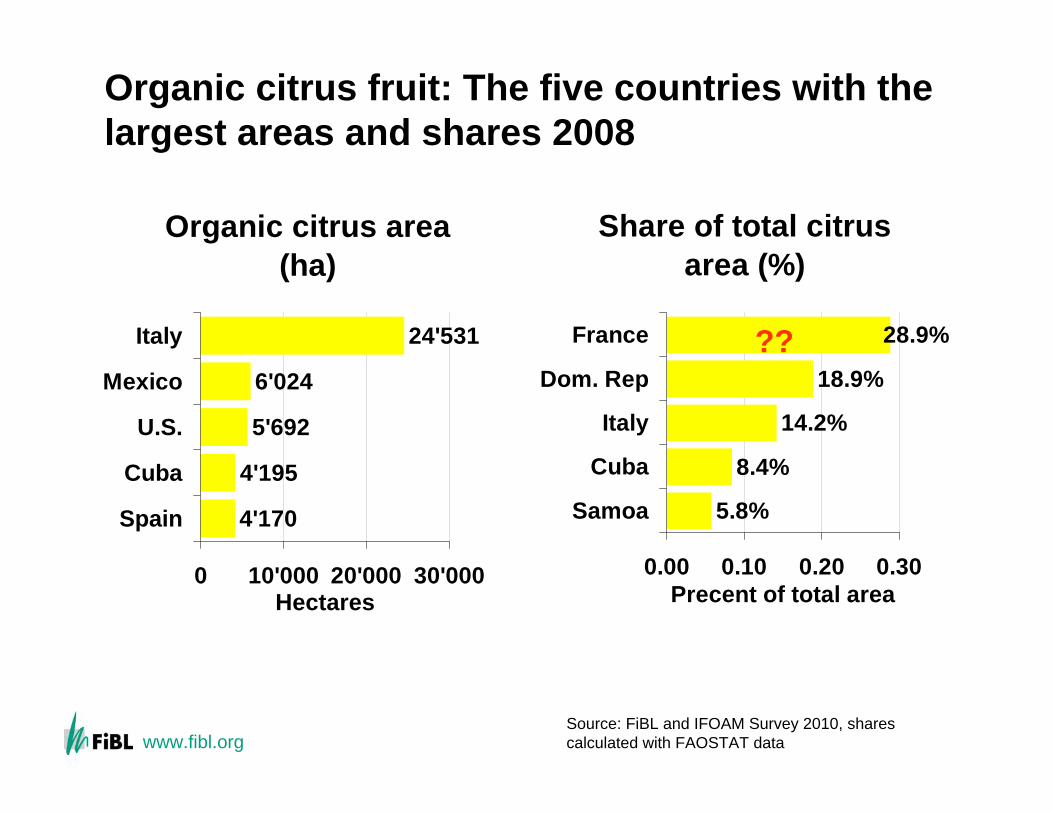
Organic citrus fruit: The five countries with thelargest areas and shares 2008
Organic citrus area (ha)
4'170
4'195
5'692
6'024
24'531
0 10'000 20'000 30'000
Spain
Cuba
U.S.
Mexico
Italy
Hectares
Share of total citrus area (%)
5.8%
8.4%
14.2%
18.9%
28.9%
0.00 0.10 0.20 0.30
Samoa
Cuba
Italy
Dom. Rep
France
Precent of total area
??
Source: FiBL and IFOAM Survey 2010, sharescalculated with FAOSTAT data

www.fibl.org
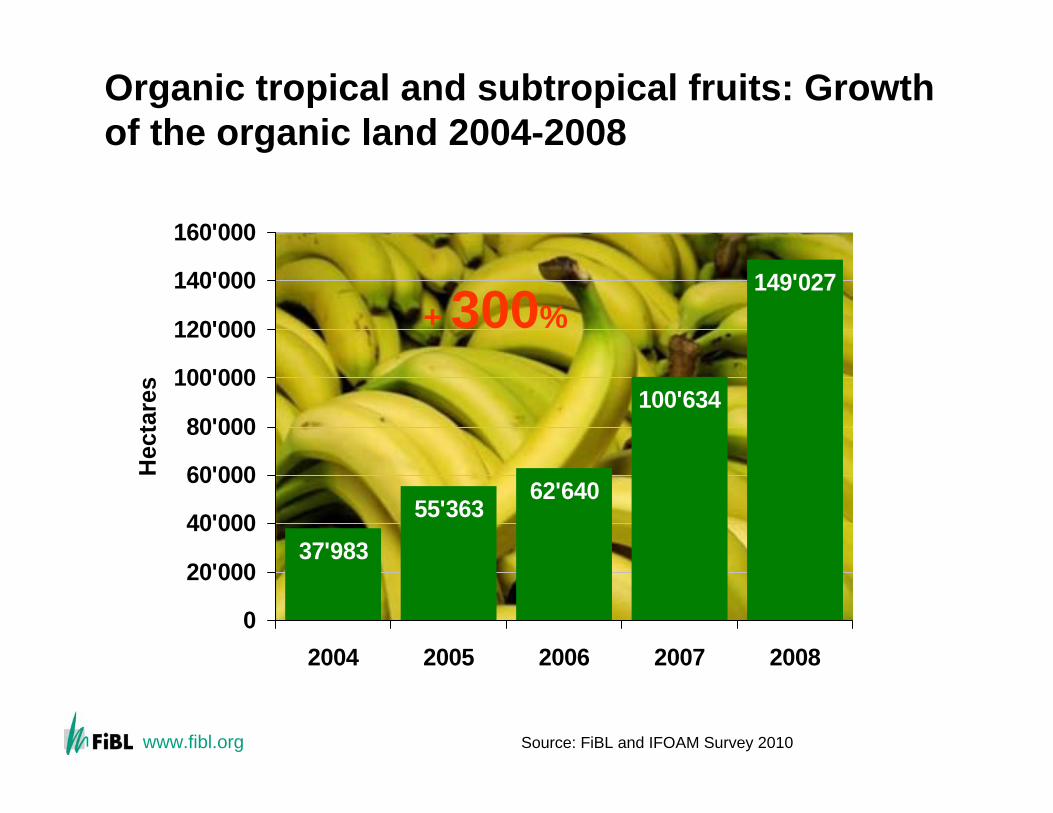
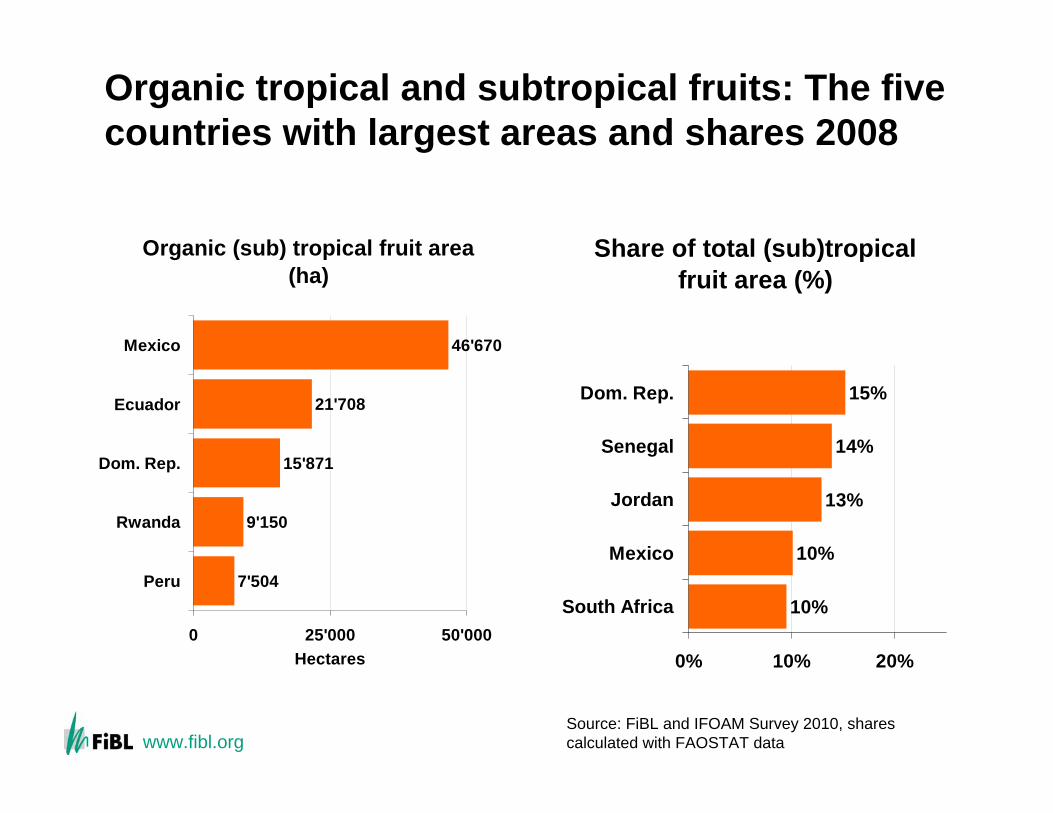
Organic tropical and subtropical fruit
At least 150’000 hectares of tropical and subtropical fruits are grown organically. This constitutes 0.7 percent of the world’s total area for tropical and subtropical fruits of 22.3 million hectares.The world’s largest overall growers are India, China, Uganda, and Brazil – unfortunately for these countries no data on organic land use are available, even though they all have large areas of organic agricultural land. It may therefore be assumed that the area for organic tropical and subtropical fruit is higher than 150’000 hectares.
Source: FiBL and IFOAM Survey 2010
www.fibl.org
Organic tropical and subtropical fruits: Growth of the organic land 2004-2008
37'983
55'36362'640
149'027
100'634
0
20'000
40'000
60'000
80'000
100'000
120'000
140'000
160'000
2004 2005 2006 2007 2008
Hec
tare
s
+ 300%
Source: FiBL and IFOAM Survey 2010

www.fibl.org
Organic tropical and subtropical fruit: Croppattern 2008 (total: 150‘000 hectares)
37%
23%
17%
4%
2%
1%
1%15% Bananas
Avocados
Mangos
Pineapples
Kiwis
Dates
Papayas
Others/no details
Source: FiBL and IFOAM Survey 2010
www.fibl.org
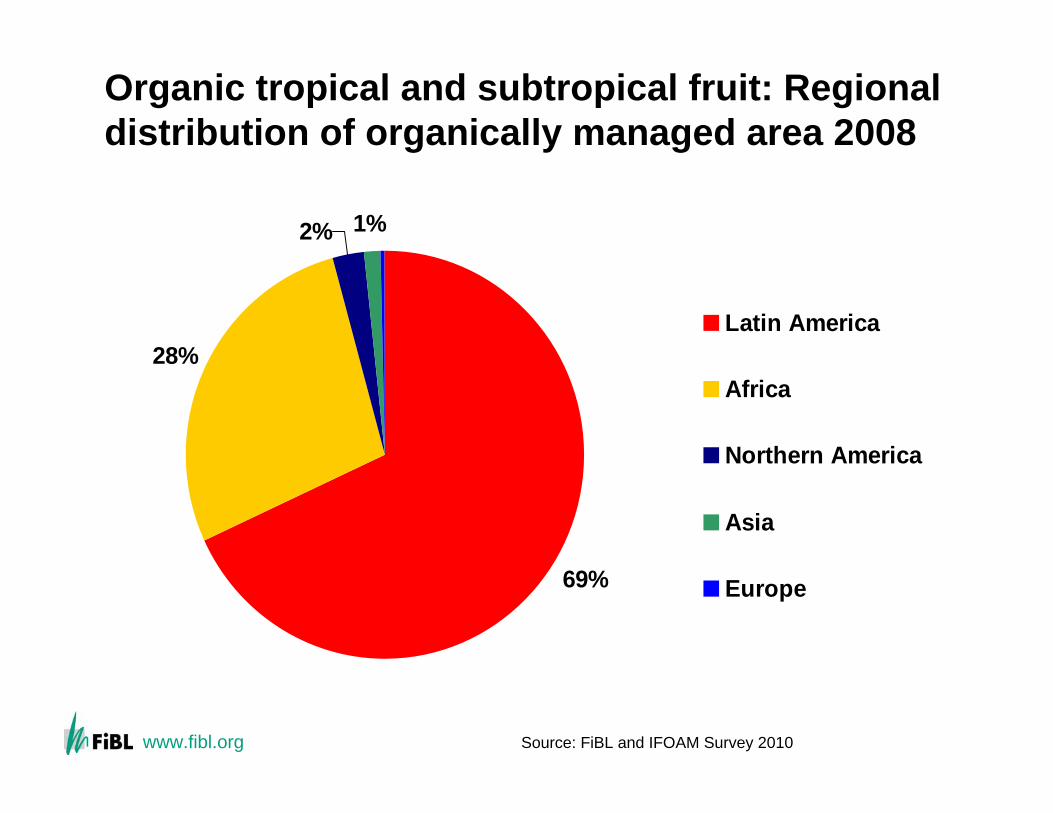
Organic tropical and subtropical fruit: Regional distribution of organically managed area 2008
69%
28%
1%2%
Latin America
Africa
Northern America
Asia
Europe
Source: FiBL and IFOAM Survey 2010
www.fibl.org
Organic tropical and subtropical fruits: The fivecountries with largest areas and shares 2008
Organic (sub) tropical fruit area (ha)
7'504
9'150
15'871
21'708
46'670
0 25'000 50'000
Peru
Rwanda
Dom. Rep.
Ecuador
Mexico
Hectares
Share of total (sub)tropical fruit area (%)
10%
10%
13%
14%
15%
0% 10% 20%
South Africa
Mexico
Jordan
Senegal
Dom. Rep.
Source: FiBL and IFOAM Survey 2010, sharescalculated with FAOSTAT data
www.fibl.org
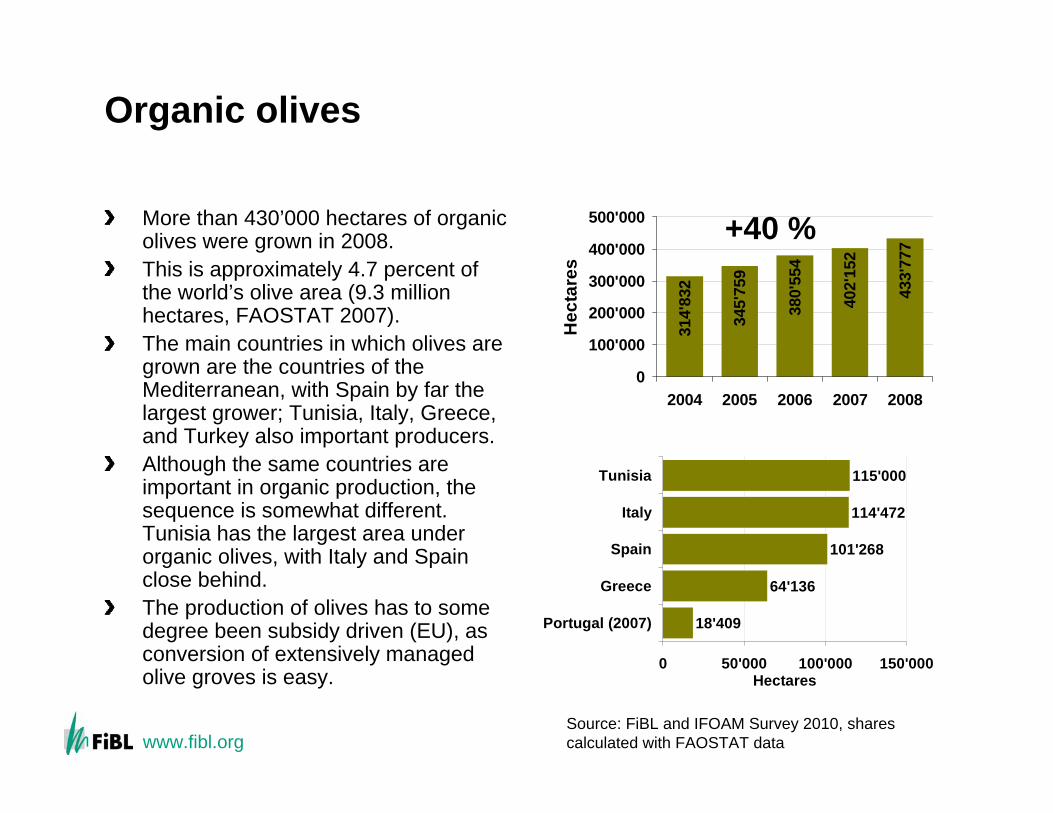
Organic olives
More than 430’000 hectares of organic olives were grown in 2008. This is approximately 4.7 percent of the world’s olive area (9.3 million hectares, FAOSTAT 2007).The main countries in which olives are grown are the countries of the Mediterranean, with Spain by far the largest grower; Tunisia, Italy, Greece, and Turkey also important producers. Although the same countries are important in organic production, the sequence is somewhat different. Tunisia has the largest area under organic olives, with Italy and Spain close behind. The production of olives has to some degree been subsidy driven (EU), as conversion of extensively managed olive groves is easy.
314'
832
345'
759
380'
554
402'
152
433'
777
0
100'000
200'000
300'000
400'000
500'000
2004 2005 2006 2007 2008
Hec
tare
s
18'409
64'136
101'268
114'472
115'000
0 50'000 100'000 150'000
Portugal (2007)
Greece
Spain
Italy
Tunisia
Hectares
Source: FiBL and IFOAM Survey 2010, sharescalculated with FAOSTAT data
+40 %

www.fibl.org
Organic grapes
Almost 150’000 hectares of organic grapes were grown in 2008. This is approximately 2.1 percent of the world’s total harvested grape area (7.3 million hectares, FAOSTAT, data 2007).The main countries in which grapes are grown are the countries of the Mediterranean, with Italy being the largest grower, followed by Italy and France 2008; since 2009 Spain has the largest grape area.The highest percentage for organic grapes is in Greece and Italy (both 6.3 percent), followed by Austria 5.3 percent). More than three quarters of the organic grape area are in Europe.
88'2
29
101'
148
113'
859
122'
960
150'
543
0
50'000
100'000
150'000
200'000
2004 2005 2006 2007 2008 2009
Hec
tare
s
6'393
11'449
28'190
30'856
40'480
0 20'000 40'000
TurkeyU.S.
FranceSpain
Italy
Hectares 2008
Source: FiBL and IFOAM Survey 2010, sharescalculated with FAOSTAT data
+70 %
www.fibl.org
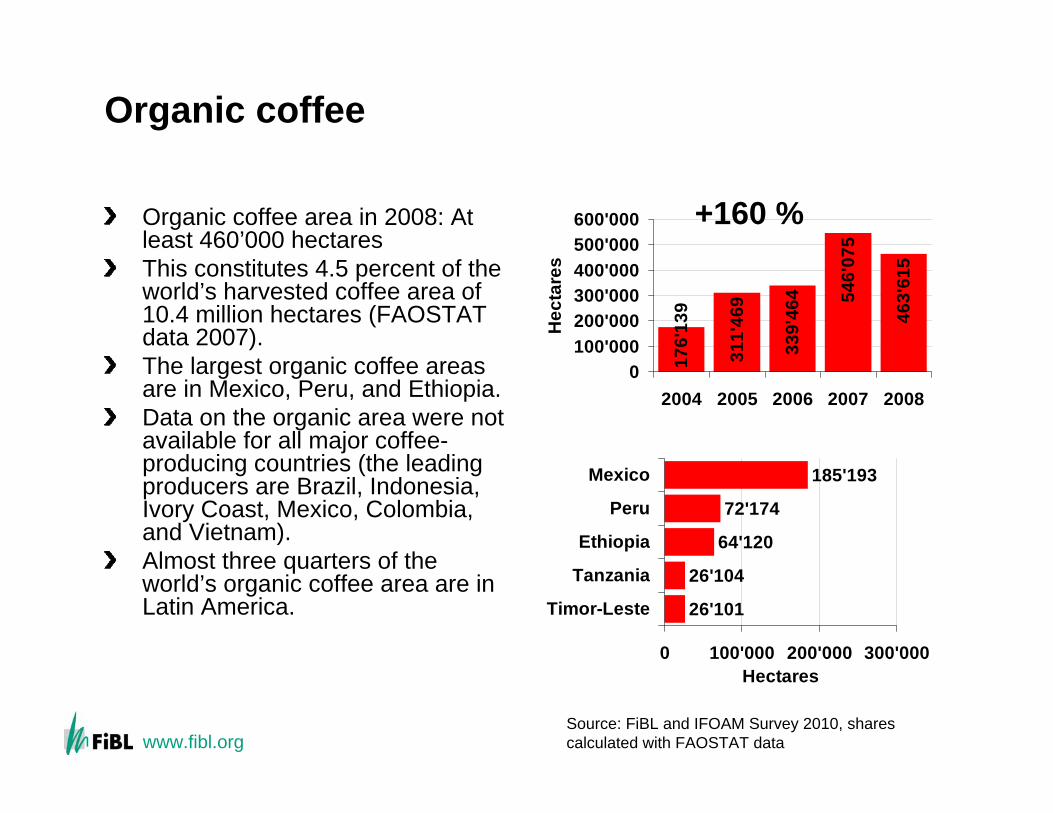
Organic coffee
Organic coffee area in 2008: At least 460’000 hectaresThis constitutes 4.5 percent of the world’s harvested coffee area of 10.4 million hectares (FAOSTAT data 2007).The largest organic coffee areas are in Mexico, Peru, and Ethiopia. Data on the organic area were not available for all major coffee-producing countries (the leading producers are Brazil, Indonesia, Ivory Coast, Mexico, Colombia, and Vietnam). Almost three quarters of the world’s organic coffee area are in Latin America. 26'101
26'104
64'120
72'174
185'193
0 100'000 200'000 300'000
Timor-Leste
Tanzania
Ethiopia
Peru
Mexico
Hectares17
6'13
9
311'
469
339'
464 54
6'07
5
463'
615
0100'000200'000300'000400'000500'000600'000
2004 2005 2006 2007 2008
Hec
tare
s
+160 %
Source: FiBL and IFOAM Survey 2010, sharescalculated with FAOSTAT data
www.fibl.org
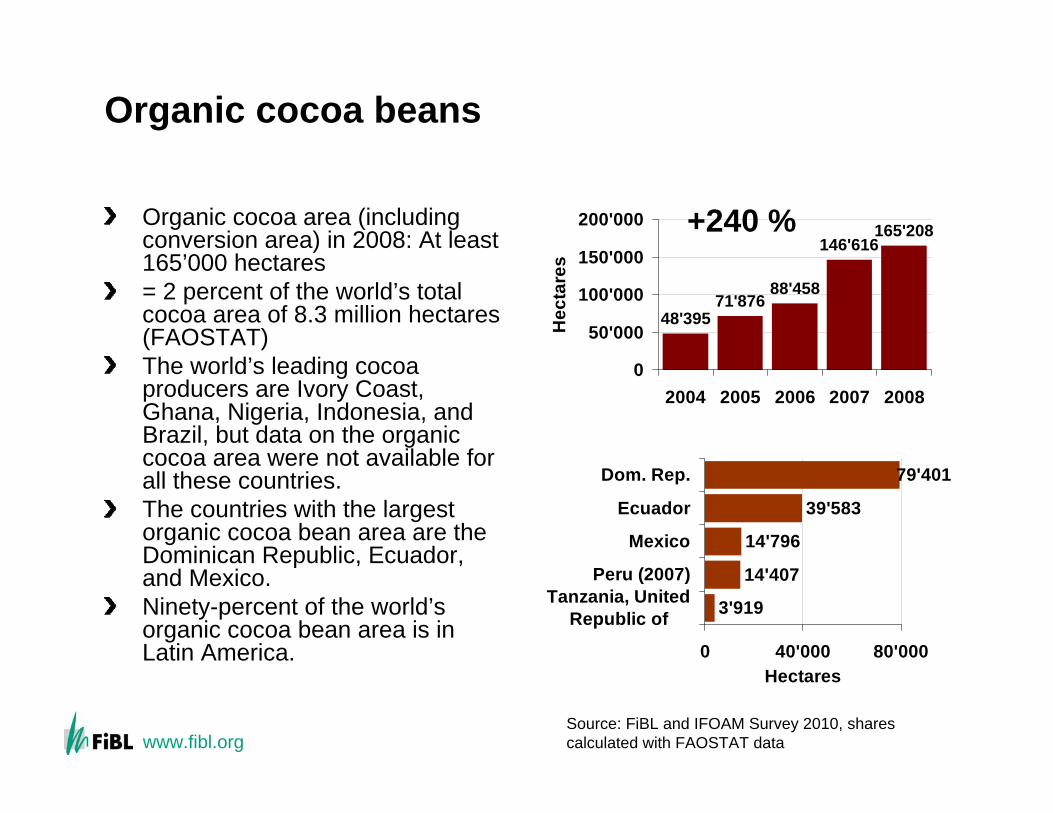
Organic cocoa beans
Organic cocoa area (including conversion area) in 2008: At least 165’000 hectares= 2 percent of the world’s total cocoa area of 8.3 million hectares (FAOSTAT)The world’s leading cocoa producers are Ivory Coast, Ghana, Nigeria, Indonesia, and Brazil, but data on the organic cocoa area were not available for all these countries.The countries with the largest organic cocoa bean area are the Dominican Republic, Ecuador, and Mexico.Ninety-percent of the world’s organic cocoa bean area is in Latin America.
3'919
14'407
14'796
39'583
79'401
0 40'000 80'000
Tanzania, UnitedRepublic of
Peru (2007)
Mexico
Ecuador
Dom. Rep.
Hectares
48'39571'876
88'458
146'616165'208
0
50'000
100'000
150'000
200'000
2004 2005 2006 2007 2008
Hec
tare
s
+240 %
Source: FiBL and IFOAM Survey 2010, sharescalculated with FAOSTAT data
www.fibl.org
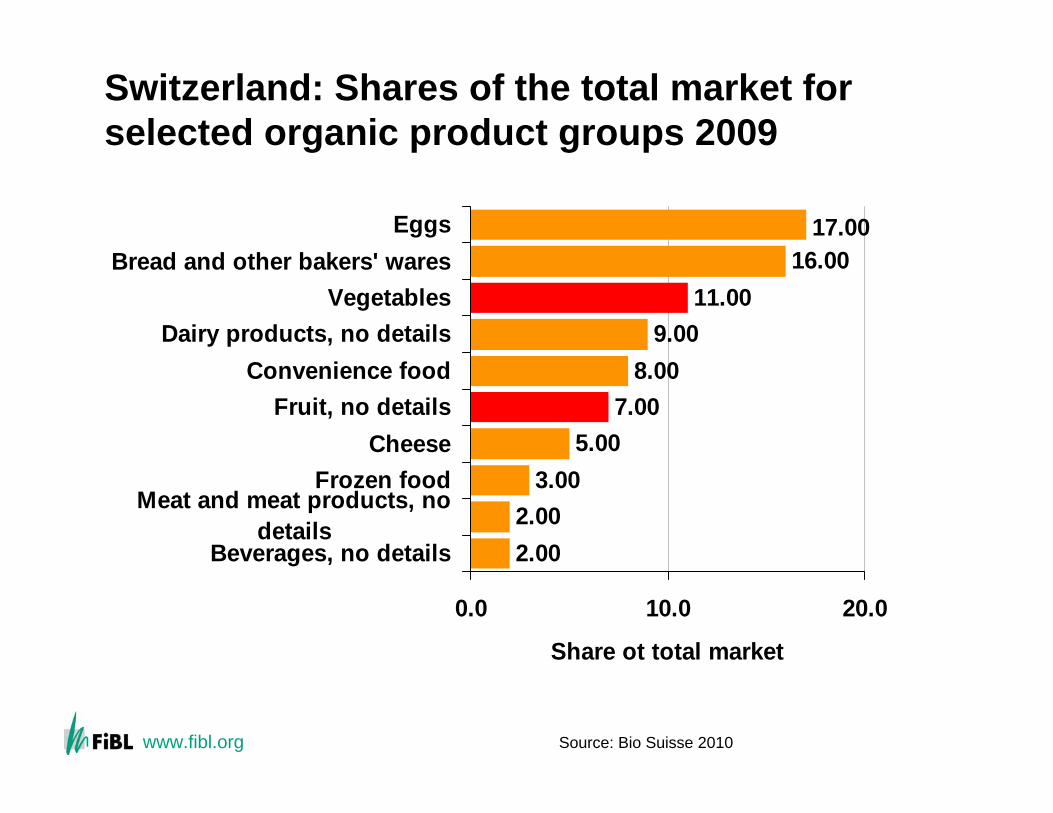
Switzerland: Shares of the total market for selected organic product groups 2009
2.002.00
3.005.00
7.008.00
9.0011.00
16.0017.00
0.0 10.0 20.0
Beverages, no details
Meat and meat products, nodetails
Frozen foodCheese
Fruit, no detailsConvenience food
Dairy products, no detailsVegetables
Bread and other bakers' waresEggs
Share ot total market
Source: Bio Suisse 2010
www.fibl.org
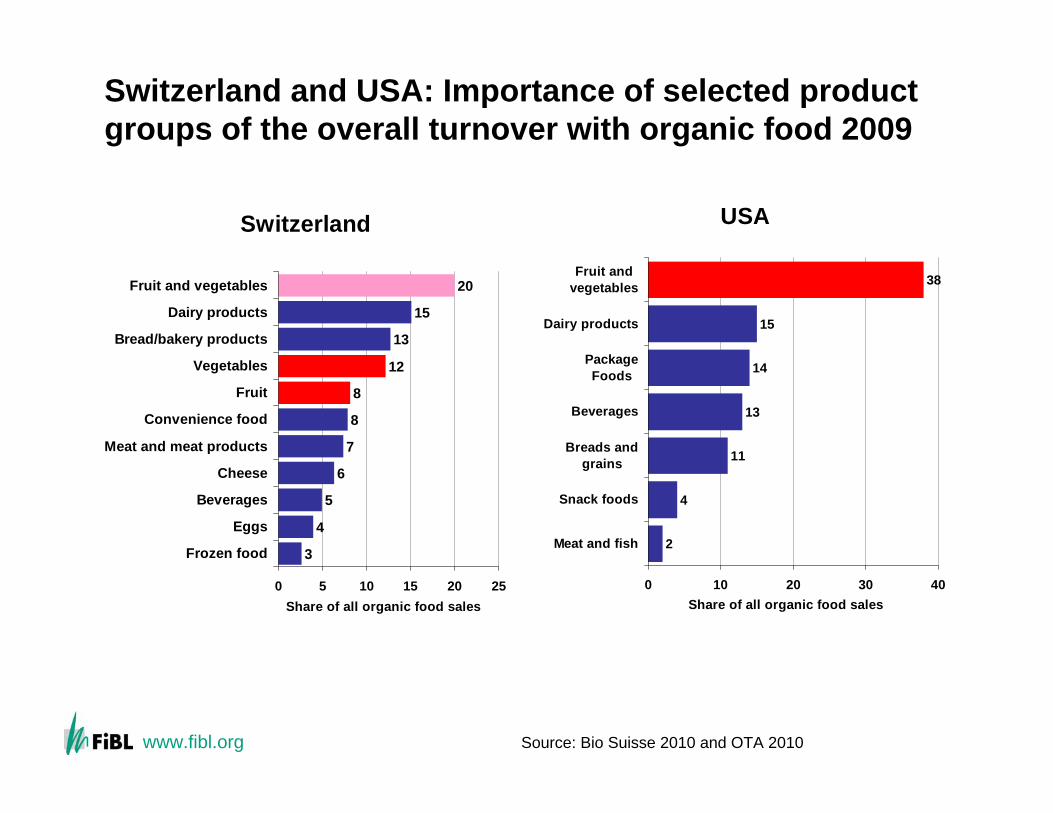
Switzerland and USA: Importance of selected product groups of the overall turnover with organic food 2009
Switzerland
3
4
5
6
7
8
8
12
13
15
20
0 5 10 15 20 25
Frozen food
Eggs
Beverages
Cheese
Meat and meat products
Convenience food
Fruit
Vegetables
Bread/bakery products
Dairy products
Fruit and vegetables
Share of all organic food sales
USA
2
4
11
13
14
15
38
0 10 20 30 40
Meat and fish
Snack foods
Breads andgrains
Beverages
PackageFoods
Dairy products
Fruit andvegetables
Share of all organic food sales
Source: Bio Suisse 2010 and OTA 2010
www.fibl.org
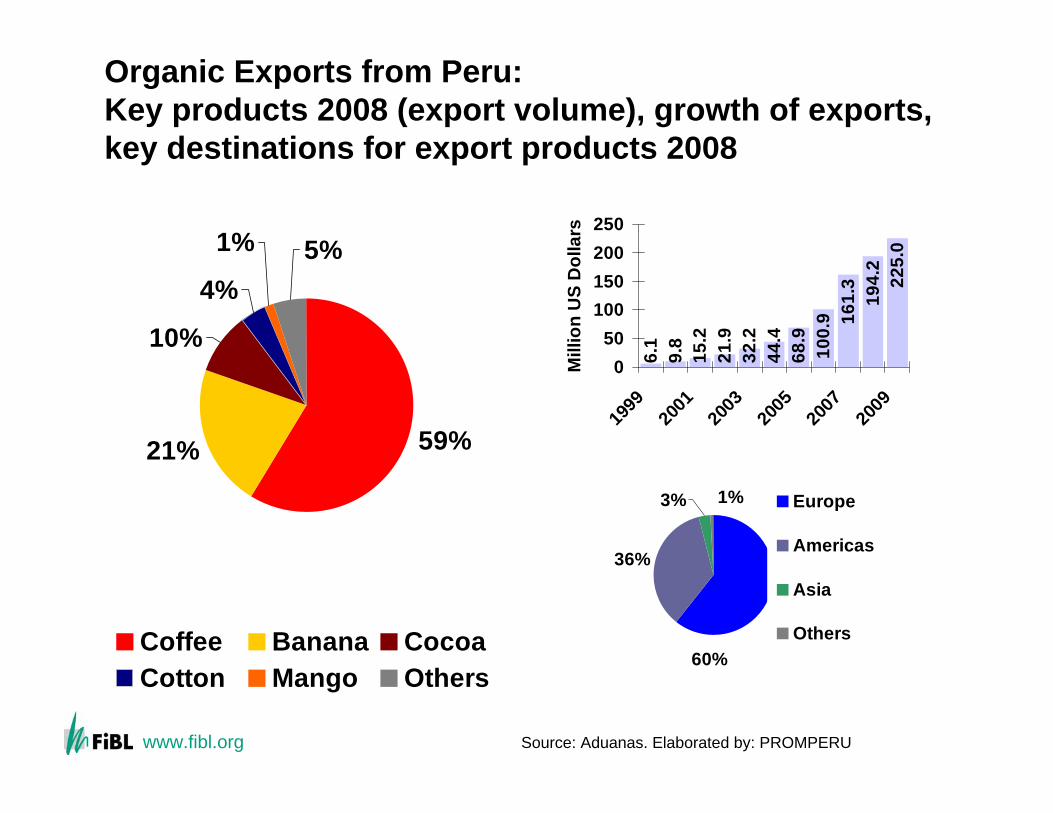
Organic Exports from Peru: Key products 2008 (export volume), growth of exports, key destinations for export products 2008
6.1
9.8
15.2
21.9
44.4
68.9
100.
9 161.
319
4.2
225.
0
32.2
050
100150200250
1999
2001
2003
2005
2007
2009
Mill
ion
US
Dol
lars
36%
60%
1%3% Europe
Americas
Asia
Others
59%21%
10%
4%
1% 5%
Coffee Banana CocoaCotton Mango Others
Source: Aduanas. Elaborated by: PROMPERU

www.fibl.org
Conclusions
Horticultural crops are among the most important products in theorganic market place, particularly vegetables and fruit.In many countries the share of land used for horticultural products is higher than the overall organic share. Growth of the organic areas for horticultural crops has been higher than for the organic agricultural land since 2004, and growth isexpected to continue in the future. For many developing countries the exports of organic horticultural crops are increasingly important. However, there are a number of production constraints like insect, disease, and weed control challenges, but with more research anddevelopment progress can be expected.It is important to improve data availability in the area of production, market and trade, so that developments can be better monitored -important for decision makers and market actors.
www.fibl.org
Acknowldements
Acknowledgements for their support with this presentation are due to
David Granatstein of Washington State UniversityElisabeth Kirby of Washington State UniversityLukas Kilcher, FiBL, Frick, SwitzerlandMartin Lichtenhahn, FiBL, Frick, SwitzerlandFranco Weibel, FiBL, Frick, Switzerland

www.fibl.org
www.fibl.org
The World of Organic Agriculture 2010
http://www.organic-world.net/statistics-crops.html
www.fibl.org
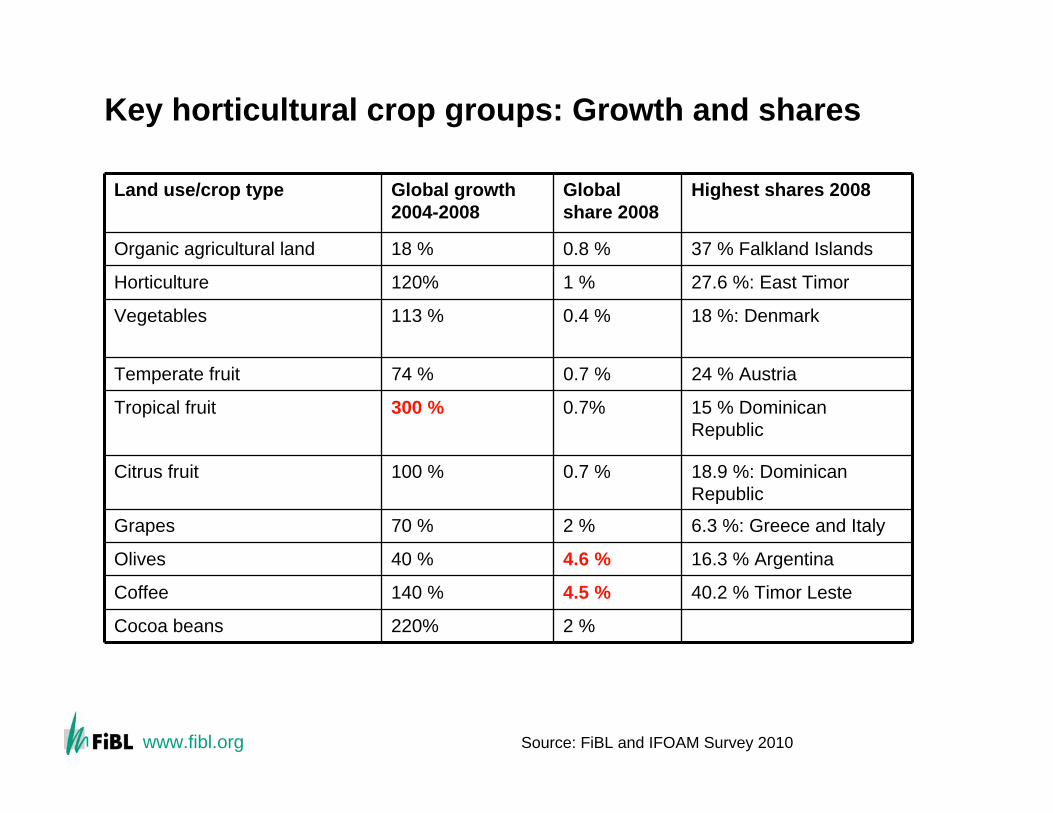
Key horticultural crop groups: Growth and shares
37 % Falkland Islands0.8 %18 %Organic agricultural land
2 %220%Cocoa beans
Land use/crop type Global growth 2004-2008
Global share 2008
Highest shares 2008
Horticulture 120% 1 % 27.6 %: East Timor
Vegetables 113 % 0.4 % 18 %: Denmark
Temperate fruit 74 % 0.7 % 24 % Austria
Tropical fruit 300 % 0.7% 15 % Dominican Republic
Citrus fruit 100 % 0.7 % 18.9 %: Dominican Republic
Grapes 70 % 2 % 6.3 %: Greece and Italy
Olives 40 % 4.6 % 16.3 % Argentina
Coffee 140 % 4.5 % 40.2 % Timor Leste
Source: FiBL and IFOAM Survey 2010
www.fibl.org
General notes on the data
Term organic: Fully converted and in-conversion areas. Share of total agricultural land: based on FAOSTAT data.Countries: For countries and areas, FiBL and IFOAM used the Standard Country and Area Codes Classifications as defined by the United Nations Statistics division.
www.fibl.org
Contact
Helga WillerResearch Institute of Organic Agriculture FiBLAckerstrasse5070 Frick SwitzerlandTel. +41 62 865 72 07Fax +41 672 865 7273E-mail [email protected], www.organic-world.net
Quelle:
www.fibl.org
Sources
FiBL and IFOAM (2010): Results of the Global Survey on Organic Agriculture 2010. The Organic World Homepage, FiBL, Frick, www.organic-world.net/statistics-world.htmlGranatstein, D., Kirby, E. und Willer, H. (2008) Current World Status of Organic Temperate Fruits. Paper presented at the Organic Fruit Conference, Vignola, Italy, June 16 and 17, 2008. www.orgprints.org/14664Granatstein, D., Kirby, E. and Willer, H. (2010): Organic Horticulture Expands Globally. SubmittedWiller, H. (2010): Organic agriculture world-wide. Current statistics. p. 27-51. In: Willer, H. and Kilcher, L. (Eds.) (2010): The World of Organic Agriculture. Statistics and Emerging Trends 2010. FiBL, Frick and IFOAM, BonnWiller, H. and Kilcher, L. (Eds.). (2010): The World of Organic Agriculture. Statistics and Emerging Trends 2010. IFOAM, Bonn and FiBL, Frick

www.fibl.org
Sources for country data mentioned in thispresentation
Australia:AQISArgentina: SENASABrazil: Organics BrazilChina: CNCAEcuador: GTZEthiopia: Data from certifiersEuropean Union: EurostatFalkland Islands: Ministryof Agriculture, Falkland IslandFrench Guiana: Agence BioIndia: APEDAIndonesia: Indonesia Organic AllianceMexico: University of ChapingoPeru: SENASA PeruRuanda: RHODA/UNCTATDSwitzerland: FiBLTunisia: Ministry of AgricultureUruguay: : DGSA/INIAU.S.: USDA