Embed Size (px)
Citation preview

1/23/2017
1
Elsa Sanchez
Brian Caldwell
Outline What are the farmers goals/needs for their soil? (Brian
and Elsa) 5 min
Nutrient building (Elsa) 20 min
Soil tests and recommendations (Brian and Elsa) 5 min
Nutrients and weeds (Brian) 10 min
N from cover crops/green manures (Brian) 10 min
Case studies (Brian and Elsa) 10 min
Farmer Goals/Needs for their Soil
Production
Sustainability (physical, biological, economic)
Reduce off farm pollution
Also--??
Compost
• Difficulty using conventional soil tests
• Excess nutrients – P, K, Mg, Ca – but many didn’t realize it
• Compost applied based on amount on hand vs. calculating
• Compost generally not analyzed prior to use
Case study of 11 organic farms:
Those relying on compost, often had surplus nutrients, as much as about 160 – 182 lbs P & N/acre/yr excess.
Drinkwater et al., 2005
West Virginia organic research fields had begun to saturate soil nutrient holding capacity; decided to “restrict compost applications to crops with maximum yield response.”
Kotcon, 2004
Other Support
Over 2 years, Morris et al., (2004) sampled 30 farms, found on average: 42% had above optimum P levels, 20% below optimum.
Challenges Using Compost
1. Compost, manures, other organic amendments & green manures slowly release nutrients
– When & how much to apply challenging
2. Nutrient availability often unpredictable –especially nitrogen
– When & how much to apply challenging

1/23/2017
2
Mineralization• Breakdown of organic nutrient sources • Conversion to inorganic, plant available forms• Rate and timing of mineralization depends on many
variables• Soil temperature• Soil moisture• Incorporation/depth of incorporation • Soil microorganisms• Carbon to nitrogen ratio• Particle size
• 10-50% a year
Who does the work of mineralization?Mineralization Process
• Fungi, bacteria, yeasts, actinomycetes, some small critters (nematodes, rotoifers)
• Nitrogen temporarily tied up by microbes
C:N Ratios
• Ratio of carbon to nitrogen in a material
• C:N ratios decrease as organic material decomposes (CO2 given off, nitrogen incorporated into fungi & bacteria)
• C:N ratio & nitrogen availability
– > 30:1; nitrogen tied-up by microorganisms
– < 20:1; nitrogen release
Nutrient Build Up in Soils
– Because mineralization unpredictable & uncontrollable:
• Nutrients released at times when plant need is not high resulting in build up of nutrients & salts in soil
• Organic nutrient sources are often over applied to insure nitrogen available for good crop yields
Nutrient Build Up
– Also, organic nutrient sources often contain more than one nutrient, not in balance with crop needs resulting in surpluses
– Compost 1 – 0.7 – 1
• Applied 12.5 tons/acre
• 250 lbs nitrogen; 175 lbs P2O5; 250 lbs K2O
DeficientExceeds Crop
Needs
PhosphatePotash
Magnesium
Calcium
1/23/2017
3
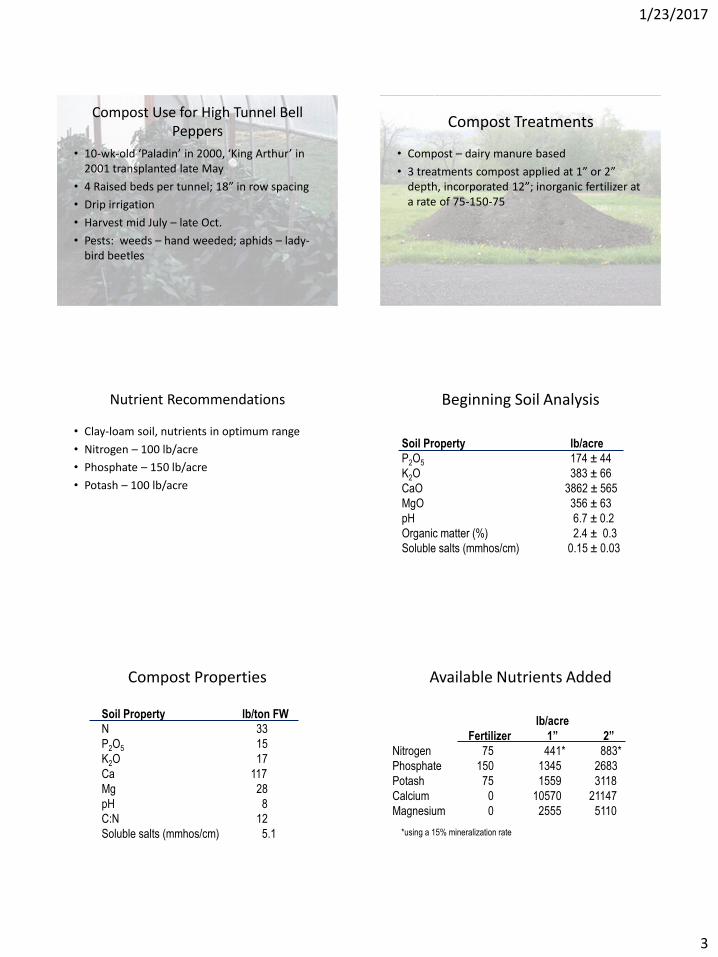
Compost Use for High Tunnel Bell Peppers
• 10-wk-old ‘Paladin’ in 2000, ‘King Arthur’ in 2001 transplanted late May
• 4 Raised beds per tunnel; 18” in row spacing
• Drip irrigation
• Harvest mid July – late Oct.
• Pests: weeds – hand weeded; aphids – lady-bird beetles
Compost Treatments
• Compost – dairy manure based
• 3 treatments compost applied at 1” or 2” depth, incorporated 12”; inorganic fertilizer at a rate of 75-150-75
Nutrient Recommendations
• Clay-loam soil, nutrients in optimum range
• Nitrogen – 100 lb/acre
• Phosphate – 150 lb/acre
• Potash – 100 lb/acre
Beginning Soil Analysis
Soil Property lb/acre
P2O5 174 ± 44
K2O 383 ± 66
CaO 3862 ± 565
MgO 356 ± 63
pH 6.7 ± 0.2
Organic matter (%) 2.4 ± 0.3
Soluble salts (mmhos/cm) 0.15 ± 0.03
Compost Properties
Soil Property lb/ton FW
N 33
P2O5 15
K2O 17
Ca 117
Mg 28
pH 8
C:N 12
Soluble salts (mmhos/cm) 5.1
Available Nutrients Added
lb/acre
Fertilizer 1” 2”
Nitrogen 75 441* 883*
Phosphate 150 1345 2683
Potash 75 1559 3118
Calcium 0 10570 21147
Magnesium 0 2555 5110
*using a 15% mineralization rate

1/23/2017
4
Nutrient Summary
• Nitrogen
– 1” compost = 4.5x more than 100 lbs/a
– 2” compost = 9x more
• Phosphate
– 1” compost + soil = 10x more than 150 lbs/a
– 2” compost + soil = 19x
• Potash
– 1” compost + soil = 13x more than 100 lbs/a
– 2” compost + soil = 35x
Marketable Pepper Yield
2000 2001
Treatment lb/ft2
Fertilizer 2.1 3.3
1” Compost 2.4 3.3
2” Compost 1.4 2.9
Soil Properties After Harvest
Fertilizer 1” Compost 2” Compost
2000
pH 6.4 7.3 7.4
OM (%) 2.5 4.8 6.6
Salts (mmhos/cm) 0.14 0.45 0.81
2001
pH 6.8 7.3 7.3
OM (%) 2.3 4.7 6.6
Salts (mmhos/cm) 0.30 0.95 1.9
Conclusions
• Possible salt injury led to lower yields
– 0.40 or 1.5 mmho/cm threshold for peppers
– Above threshold 16-50% yield reduction
• Exclude precipitation and drip irrigation
• Leaching reduced; can lead to build up of salts
Using Compost
• Nutrient content varies; recommend tested to determine amount of nutrients
• Apply nutrients based on plant needs vs. volume
• Leaching in soil or compost - remove plastic, sprinkler irrigation
Problems with Over-Application
– Loss profits due to cost of over-applied organic nutrient sources
– Indirect losses from decreased yields associated with high salt or nutrient levels in soil & weed competition
– Pollution of surface & groundwater

1/23/2017
5
How to Avoid Over Application
• Soil testing
• Analyze compost
• Calculate how much to apply
• Use variety of nutrient sources
• Avoid continuous use of any single organic nutrient source with more than 1 nutrient
3 Composts
Soil Property Compost 1 2 3
Organic N (%) 1.1 1.2 0.7
NH4+-N (lb/ton) 1.6 1.5 0.0
Phosphate (%) 0.5 0.8 0.2
Potash (%) 0.8 1.8 0.4
pH 7.4 6.9 7.5
C:N 12.1 13.2 14.7
Soluble salts 5.5 14.1 0.8
(mmhos/cm)
75 lb/acre N
• Compost 1
– 12.5 tons/acre (55 lbs organic N + 20 lbs ammonium-N)
• Compost 2
– 12 tons/acre
• Compost 3
– 27 tons/acre0
5
10
15
20
25
30
1 2 3
ton
s/ac
re
• For organic nutrient sources with more than 1 nutrient
– Use only when soil P, K levels not above optimum (exception, P in cold soils)
– If P, K levels high, use legume cover crops, nitrogen fertilizers with no or low levels of P & K
– Always incorporate to minimize runoff & erosion losses
How to Avoid Over Application
When Nutrient Levels are High
• Soil testing to monitor levels
• Nitrogen supply – use N sources with no or minimal levels of other nutrients– Legume cover crops, other nutrient sources
– Calculate residual nitrogen to determine how much is needed
• Plant cover crop, reduce tillage, use grass waterways to minimize erosion, runoff losses
Soil tests and recommendations
Variety of tests and philosophies
Early years—more intensive sampling
After about 5 years—sampling to monitor the fertility program, every 2-3 years

1/23/2017
6
Nutrients and Weeds
Recent research results
Do organic nutrient
amendments promote
weed problems?
Chuck Mohler
Cornell University
The problemMost livestock farms and organic farms use compost and manure as primary nutrient sources
Correct application rates are difficult to determine– Nutrients released slowly over time
– Concentration varies
Farmers often err on the high side to insure adequate nutrients for crop growth
Enough to supply N needs usually applies excess P and K
Crop yield responses to
compost
Rate giving full yield
Year Crop Soluble High OM
2004 Corn 0.5X 0.67X
2005 Soybean No response No response
2006 Spelt 0.8X 2.0X
2007 CornNo response
(to residual)
No response
(to residual)
Weed
height did
not reach
a
maximum
as rate
increased
Weed heights in corn 2004, high OM compost
Compost rate (relative to conventional recommendation)
0.0 0.5 1.0 1.5 2.0
He
igh
t (c
m)
0
10
20
30
40
50
60
70
80
Factor vs mCHEAL
Factor vs mAMBEL
Factor vs mSETsp
Plot 1 Regr
Giant foxtail
Lambsquarters
Common ragweed
Cornell Organic Cropping Systems:
Grain Experiment
Initiated 2005
3-year rotation: soybean spelt/(red clover)
corn
5 Systems
– “High” nutrient
– Low input
– Intensive weed management
– Reduced tillage
– Chemical

1/23/2017
7
Weed dry weight in corn, 2010
System
Hig
h nutr
ient
Low in
put
Inte
nsive
wee
d man
ag.
Red
uced ti
llage
Chem
ical
We
ed
bio
ma
ss
lb
/A
0
200
400
600
800
1000
1200
1400
1600
1800
2000Ragweed
Other annuals
Perennials
a
a
b bb
Which nutrient is limiting for the
weeds?
The answer determines the management
strategy.
2010 Experiment
Alfalfa/clover plow down on low K, low P
soil
Pigweed
Control
Pigweed with
highest rate of
compost
Pigweed with
highest “N-P-K”
treatment
Pigweed biomass Corn
Control
Corn at
highest
compost rate
Error bars are standard error.
0X 1X 2X 4X 8X
N from Cover Crops and Green
Manures

1/23/2017
8
Balancing Cover Crops and Tillage Tillage destroys soil organic matter
How to balance planting a cover crop which may require extra tillage?
Get the most out of it
Spring Oats and Peas Plant as early as possible
Terminate in early July before fall-planted brassicas
Good biomass production
5000 lb/acre peas ~ 150 lb/acre N
Good weed suppression
Summer Oats and Peas Plant before 8/15
Allow to winter kill
Moderate biomass production
3000 lb/acre peas ~ 100 lb/acre N
Good weed suppression
Red Clover Production of 1000-4000 lb/acre of dry biomass in the
fall
Plus 2500-5000 lb/acre by plowdown (mid May) the following spring
Roots are substantial as well
Adequate N for 160 bu/acre corn on a strong soil
1/23/2017
9
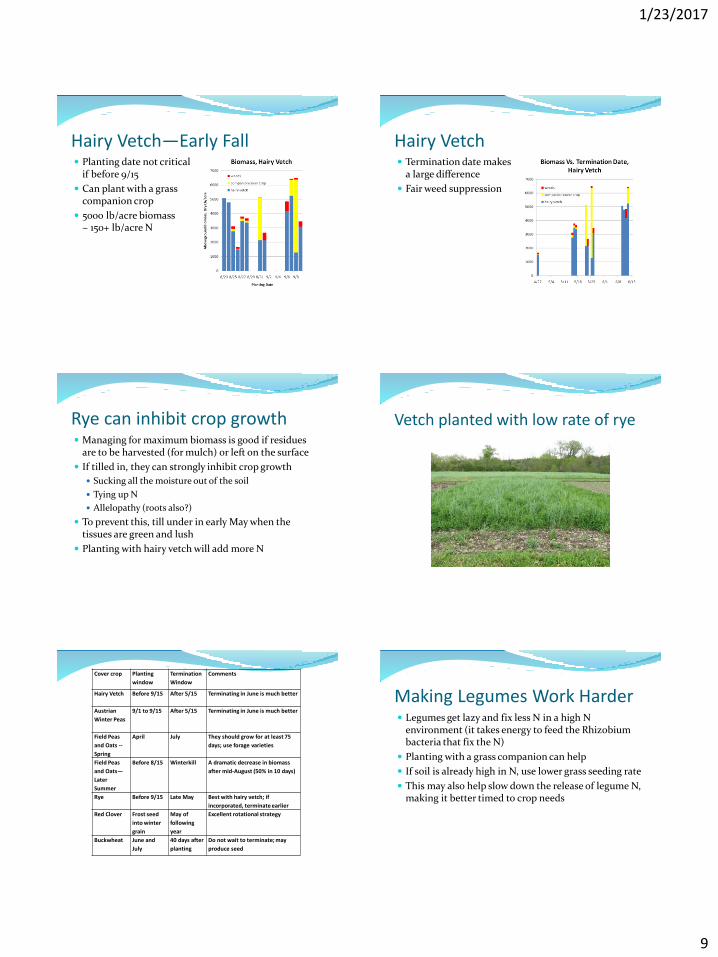
Hairy Vetch—Early Fall Planting date not critical
if before 9/15
Can plant with a grass companion crop
5000 lb/acre biomass ~ 150+ lb/acre N
Hairy Vetch Termination date makes
a large difference
Fair weed suppression
Rye can inhibit crop growth Managing for maximum biomass is good if residues
are to be harvested (for mulch) or left on the surface
If tilled in, they can strongly inhibit crop growth
Sucking all the moisture out of the soil
Tying up N
Allelopathy (roots also?)
To prevent this, till under in early May when the tissues are green and lush
Planting with hairy vetch will add more N
Vetch planted with low rate of rye
Cover crop Planting
window
Termination
Window
Comments
Hairy Vetch Before 9/15 After 5/15 Terminating in June is much better
Austrian
Winter Peas
9/1 to 9/15 After 5/15 Terminating in June is much better
Field Peas
and Oats --
Spring
April July They should grow for at least 75
days; use forage varieties
Field Peas
and Oats—
Later
Summer
Before 8/15 Winterkill A dramatic decrease in biomass
after mid-August (50% in 10 days)
Rye Before 9/15 Late May Best with hairy vetch; if
incorporated, terminate earlier
Red Clover Frost seed
into winter
grain
May of
following
year
Excellent rotational strategy
Buckwheat June and
July
40 days after
planting
Do not wait to terminate; may
produce seed
Making Legumes Work Harder Legumes get lazy and fix less N in a high N
environment (it takes energy to feed the Rhizobium bacteria that fix the N)
Planting with a grass companion can help
If soil is already high in N, use lower grass seeding rate
This may also help slow down the release of legume N, making it better timed to crop needs

1/23/2017
10
What do we know about root systems? Not much
Roots are woodier and decompose slower than plant tops
Some researchers think that the main benefit from cover crops derives from their roots
Root biomass is often in the range of 30% of aboveground for annuals
Perennials like clover may have much larger relative root biomass
More sources of information Thomas Bjorkman at Cornell has created a
clearinghouse of CC information
http://www.hort.cornell.edu/bjorkman/lab/covercrops/
Managing Cover Crops Profitably, 3rd Ed.
http://www.hort.cornell.edu/extension/organic/ocs/reports/Cover%20Crops%20Planting%20and%20Termination.pdf
Others?
Case Studies Nutrient budgets
Blue Heron Farm, Lodi, NY
Paradise Farm, Paradise, PA
Nutrient Budgets, 11 Farms
58
-100
-50
0
50
100
150
200
250
G1 G2 G3 V1 V2 V3 V4 V5 V6 V7 V8Po
un
ds p
er
Acre
per
Year
G-Field Crops Farm V-Vegetable Crops Farm
N
P
K
Blue Heron
Farm

1/23/2017
11
-400
-200
0
200
400
600
800
1000
0 1 2 3 4 5 6
year
lbs/
acre
N
P
K
Blue Heron Farm Nutrient Budget
62
Table 2. Soil Test Results for Blue Heron Farm, 1993 and 1999, analyzed by Cornell University.
Mean (with standard error) of 10 fields.
1st Barn
1993
1st Barn
1999
Vineyard
1993
Vineyard
1999
Phosphorus (lb/acre) 62 436 29 425
Potassium (lb/acre) 280 935 200 715
Magnesium (lb/acre) 460 875 265 425
Calcium (lb/acre) 4140 8360 2980 4420
pH 7.4 7.5 7.1 7.4
Percent Organic Matter 4.4 4.9 2.7 2.7
Paradise Farm

1/23/2017
12
67
Figure 2. Cumulative nutrient balances for N,P, and K for five years of a
typical rotation on Paradise Farm.
-400
-300
-200
-100
0
100
200
300
400
0 1 2 3 4 5
year
lbs/
acre
N
P
K


![THE IMPACT OF ALTERNATIVE SOIL TILLAGE ON SOIL ......P[eter] (2012). The Impact of Alternative Soil Tillage on Soil Resistance and CO 2 Emissions, Chapter 30 in DAAAM International](https://img.pdfslide.net/doc/110x75/6111311bc227415001007bc4/the-impact-of-alternative-soil-tillage-on-soil-peter-2012-the-impact.jpg)