Embed Size (px)
Citation preview

Proc. Natl. Acad. Sci. USAVol. 76, No. 12, pp. 6326-6330, December 1979Biochemistry
Organization of spacer DNA in chromatin(nuclease/yeast/chicken erythrocytes/HeLa cells)
D. LOHR* AND K. E. VAN HOLDEDepartment of Biochemistry and Biophysics, Oregon State University, Corvallis, Oregon 97331
Communicated by Peter H. von Hippel, August 22, 1979
ABSTRACT Detailed analysis of the DNA fragment pat-terns produced by DNase I digestion of yeast, HeLa, andchicken erythrocyte nuclei reveals surprising features of nuc-leosome phasing. First, the spacer regions in phased yeastchromatin must be of lengths (lOi + 5) base pairs, where m =0, 1, 2,2.... This feature is not seen in parallel studies of chickenerythrocyte chromatin. The 5-base pair increment in the yeastspacer imposes interesting restraints on the higher order struc-ture of yeast chromatin. Second, we have been able to simulatethe DNase I cutting patterns and get good agreement with theobserved yeast patterns. Third, three different chromatins showa long range periodicity in the DNase I digest pattern, with aperiod half that of the staphylococcal nuclease repeat. Theseresults suggest that the amount of chromatin observed in dis-crete extended-ladder bands is a minimum estimate of phasingand in fact phasing may be a more general feature.
DNase I digestion of yeast, chicken erythrocyte, and HeLanuclei produces "extended ladders" of bands of single-strandDNA fragments extending to well beyond the size of anucleosomal repeat (1). This shows that the interparticle DNA,so-called linker or spacer DNA, occurs in discrete sizes in at leastsome fraction of the chromatin of these species. We have usedthe term "phasing" to denote this characteristic of spacer or-ganization, because a discrete spacer requires that adjacent coreparticles be in a precise location relative to one another. Phasing,as used here, is not meant to suggest there is a precise locationof a nucleosome with respect to a given DNA sequence. Wepresent in this paper further observations on nucleosomephasing that provide at least partial explanation for many ofthe details of DNase I cleavage patterns in yeast and other eu-karyotes.
EXPERIMENTAL PROCEDURESHeLa, chicken erythrocyte, and yeast nuclei (the last fromgrowing and stationary cells) were isolated as described (2, 3).DNase I digestion and DNA extraction were performed as inref. 2. DNA was electrophoresed on either 5.5% or 8% polyac-rylamide/98% formamide gels as described (4) or 8, 12, 13, or15.5% polyacrylamide/urea gels prepared as described (5). Gelswere analyzed as in ref. 1.
RESULTSQuantitating Spacer in Phased Chromatin. In Fig. 1 we
show gel photographs and scans of the "extended-ladder"pattern obtained by DNase I digestion of yeast and chickenerythrocyte nuclei. There is an anomalous region in gels ofDNase I digests of yeast nuclei in which the regular pattern ofbands observed above 140 bases (b) and below 110 b breaksdown (1). The pattern appears as if there are really two seriesof bands with a regularly spaced series of bands above 140 b thatis out of phase with the regularly spaced series of bands below110 b to produce closer spacing of bands in the region where
The publication costs of this article were defrayed in part by pagecharge payment. This article must therefore be hereby marked "ad-vertisement" in accordance with 18 U. S. C. §1734 solely to indicatethis fact.
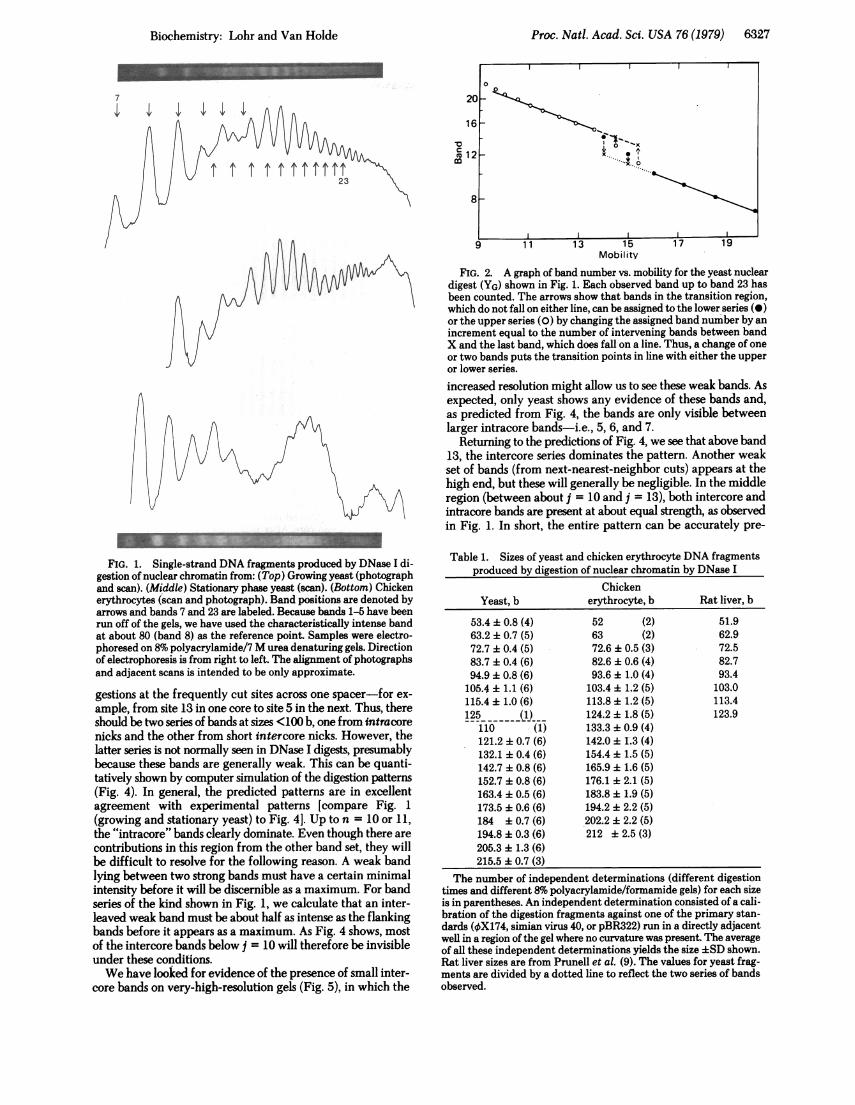
the two series overlap. In fact, a plot of band number vs. gelmobility shows precisely this behavior (Fig. 2). Both series arequite regular; however, in the overlap region there is a transitionfrom the "low" (10-z110 b) pattern to the "high" (>140 b)series.We have accurately calibrated the band sizes of the yeast and
chicken erythrocyte DNA and of our PM2 Hae III restrictionfragments against OX174 Hae III, simian virus 40 Hae III, andpBR322 Hae III restriction fragments, whose sizes are exactlyknown from DNA sequence determinations (6-8). Results areshown in Table 1. Notice that (i) in the overlap region the twopatterns differ by about 4-6 b, quantitatively showing theamount of DNA by which the high and low series of bands areout of phase and (ii) clearly the interval between bands in boththe low and high series slightly exceeds 10 b.A graphical representation of the size data (Fig. 3) shows a
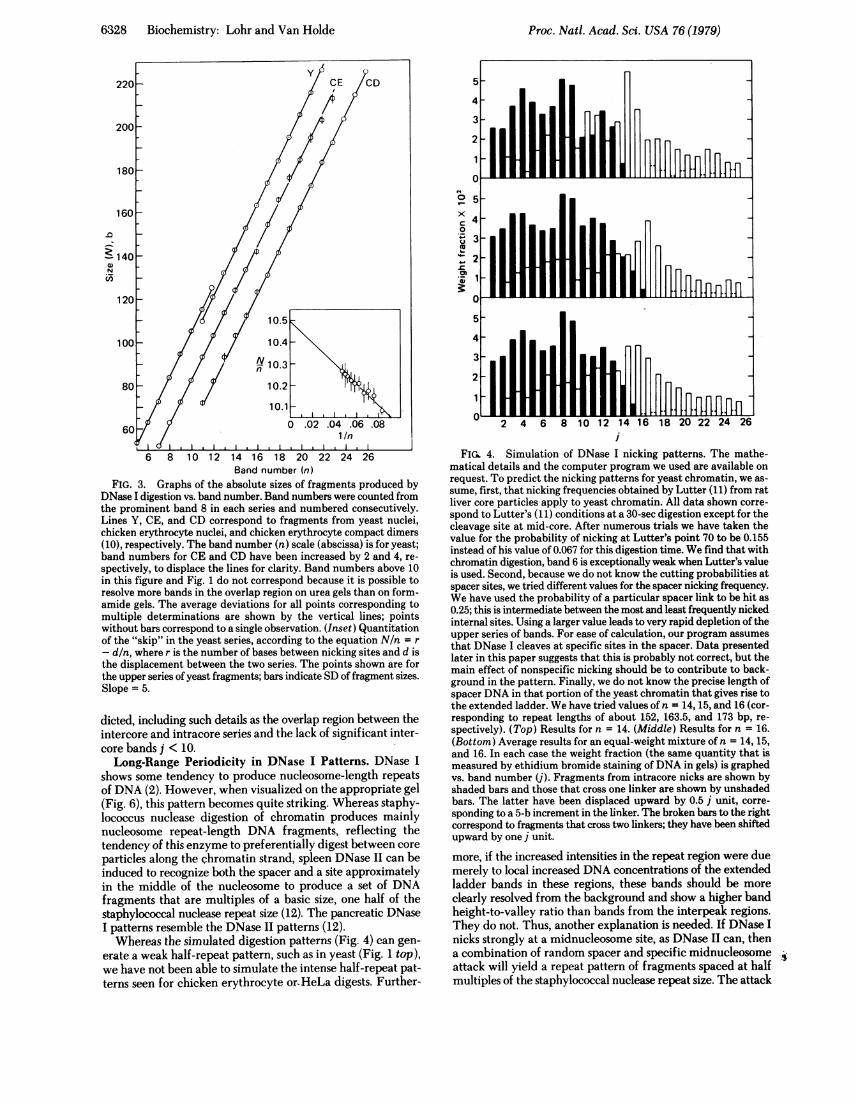
clear discontinuity in the sizes of the two series of bands ob-tained by DNase I digestion of yeast nuclei. The lower seriescan be fitted accurately by N = 10.5n, where n is the bandnumber and N is the size in bases. The upper series is fitted byN = 1O.5n - 5.0. The value of 5.0 has been obtained from Fig.3 inset. This data shows quite clearly that the upper series ofbands is displaced by 5 b from the lower set. Because the lowerseries of bands comes predominantly from intracore DNase Inicks whereas the higher series of bands must come from nicksin adjacent nucleosomes, but presumably at the usual intracoresites, the principal difference between these two series is thepresence of spacer DNA in the high series. Thus, we concludethat spacer sizes must be (lOm + 5) base pairs (bp) in size (m= 0, 1, 2,. . .). In other words, core particles in yeast chromatinmust be spaced by approximately m + 0.5 turns of DNA.The same discontinuity and DNA fragment sizes are ob-
served for both growing and stationary-phase yeast. Inter-estingly, digestions of neither the chicken erythrocyte nucleinor the compact dimer (10) show either the close spacing ofbands in an overlap region (Fig. 1) or the discontinuity associ-ated with the presence of two offset series of bands (Figs. 2 and3). We cannot entirely exclude the possibility that a disconti-nuity occurs at larger DNA sizes in the chicken erythrocytenuclear digests (see upper part of Fig. 3), because these largersizes are hard to measure with sufficient accuracy due to thefact that DNase I digests of chicken erythrocyte nuclei exhibita background that obscures the bands (see Fig. 1). The bandsare also more closely spaced in this size range.The size differences of the DNase I bands and the lack of a
yeastlike "skip" in the chicken compact dimer DNA patternmake it very unlikely that a previous suggestion-phasing inyeast arises from a population of "compact" oligomers (10)-iscorrect. A more plausible explanation is given in Discussion.
Analysis of Yeast Digestion Pattern. The presence of a 5-bpincrement in the spacer suggests that there should be bandsbetween at least some of the <140-b bands, arising from di-
Abbreviations: bp, base pair; b, bases of single-stranded DNA.* Present address: Department of Chemistry, Arizona State University,Tempe, AZ 85281.
6326
Proc. Natl. Acad. Sci. USA 76 (1979) 6327
J,
Mobility
FIG. 2. A graph of band number vs. mobility for the yeast nucleardigest (YG) shown in Fig. 1. Each observed band up to band 23 hasbeen counted. The arrows show that bands in the transition region,which do not fall on either line, can be assigned to the lower series (0)or the upper series (0) by changing the assigned band number by anincrement equal to the number of intervening bands between bandX and the last band, which does fall on a line. Thus, a change of oneor two bands puts the transition points in line with either the upperor lower series.increased resolution might allow us to see these weak bands. Asexpected, only yeast shows any evidence of these bands and,as predicted from Fig. 4, the bands are only visible betweenlarger intracore bands-i.e., 5, 6, and 7.
Returning to the predictions of Fig. 4, we see that above band13, the intercore series dominates the pattern. Another weakset of bands (from next-nearest-neighbor cuts) appears at thehigh end, but these will generally be negligible. In the middleregion (between about j = 10 and j = 13), both intercore andintracore bands are present at about equal strength, as observedin Fig. 1. In short, the entire pattern can be accurately pre-
FIG. 1. Single-strand DNA fragments produced by DNase I di-gestion of nuclear chromatin from: (Top) Growing yeast (photographand scan). (Middle) Stationary phase yeast (scan). (Bottom) Chickenerythrocytes (scan and photograph). Band positions are denoted byarrows and bands 7 and 23 are labeled. Because bands 1-5 have beenrun off of the gels, we have used the characteristically intense bandat about 80 (band 8) as the reference point. Samples were electro-phoresed on 8% polyacrylamide/7 M urea denaturing gels. Directionof electrophoresis is from right to left. The alignment of photographsand adjacent scans is intended to be only approximate.
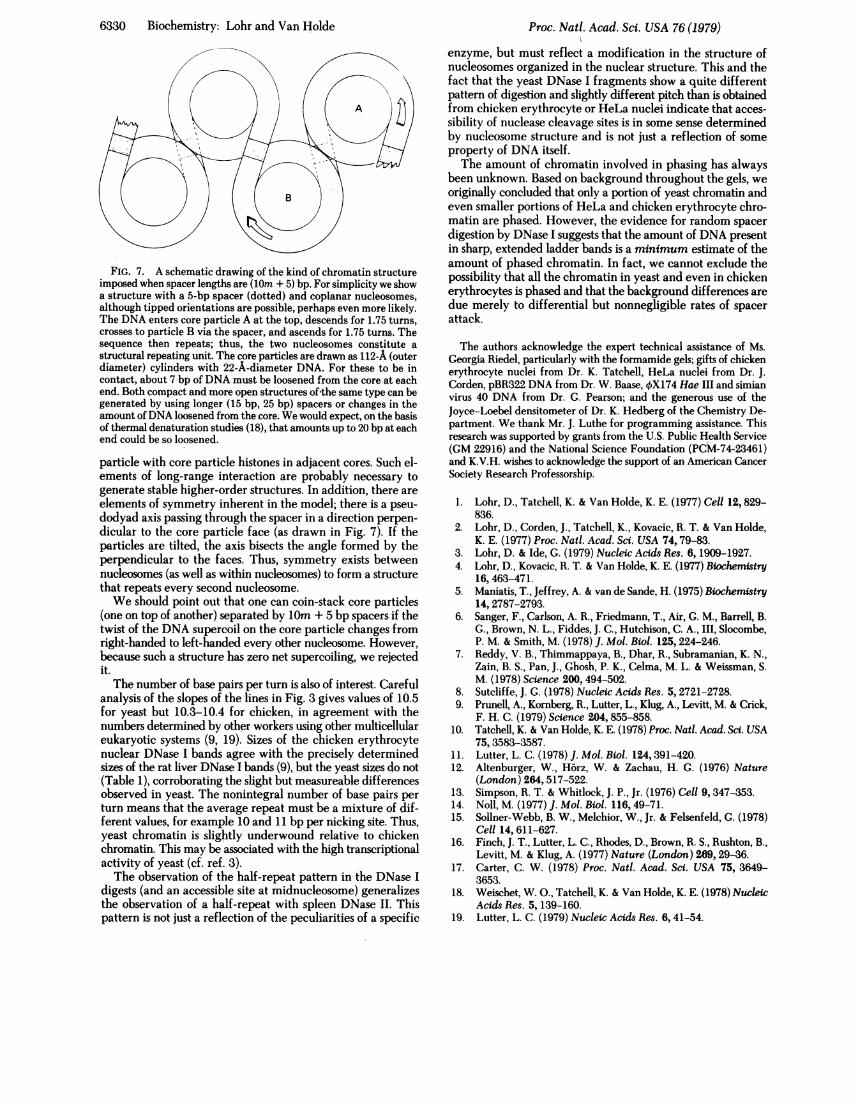
gestions at the frequently cut sites across one spacer-for ex-ample, from site 13 in one core to site 5 in the next. Thus, thereshould be two series of bands at sizes <100 b, one from intracorenicks and the other from short intercore nicks. However, thelatter series is not normally seen in DNase I digests, presumablybecause these bands are generally weak. This can be quanti-tatively shown by computer simulation of the digestion patterns(Fig. 4). In general, the predicted patterns are in excellentagreement with experimental patterns [compare Fig. 1(growing and stationary yeast) to Fig. 4]. Up to n = 10 or 11,the "intracore" bands clearly dominate. Even though there arecontributions in this region from the other band set, they willbe difficult to resolve for the following reason. A weak bandlying between two strong bands must have a certain minimalintensity before it will be discernible as a maximum. For bandseries of the kind shown in Fig. 1, we calculate that an inter-leaved weak band must be about half as intense as the flankingbands before it appears as a maximum. As Fig. 4 shows, mostof the intercore bands below j = 10 will therefore be invisibleunder these conditions.We have looked for evidence of the presence of small inter-
core bands on very-high-resolution gels (Fig. 5), in which the
Table 1. Sizes of yeast and chicken erythrocyte DNA fragmentsproduced by digestion of nuclear chromatin by DNase I
ChickenYeast, b erythrocyte, b Rat liver, b
53.4 + 0.8 (4) 52 (2) 51.963.2 + 0.7 (5) 63 (2) 62.972.7 + 0.4 (5) 72.6 + 0.5 (3) 72.583.7 + 0.4 (6) 82.6 + 0.6 (4) 82.794.9 + 0.8 (6) 93.6 + 1.0 (4) 93.4
105.4 + 1.1 (6) 103.4 + 1.2 (5) 103.0115.4 : 1.0 (6) 113.8 i 1.2 (5) 113.4125 (1) 124.2 h 1.8 (5) 123.9
110 (1) 133.3 + 0.9 (4)121.2 + 0.7 (6) 142.0 + 1.3 (4)132.1 + 0.4 (6) 154.4 + 1.5 (5)142.7 + 0.8 (6) 165.9 + 1.6 (5)152.7 + 0.8 (6) 176.1 + 2.1 (5)163.4 + 0.5 (6) 183.8 11.9 (5)173.5 + 0.6 (6) 194.2 + 2.2 (5)184 ± 0.7 (6) 202.2 + 2.2 (5)194.8 ± 0.3 (6) 212 + 2.5 (3)205.3 + 1.3 (6)215.5 + 0.7 (3)
The number of independent determinations (different digestiontimes and different 8%o polyacrylamide/formamide gels) for each sizeis in parentheses. An independent determination consisted of a cali-bration of the digestion fragments against one of the primary stan-dards (+OX174, simian virus 40, or pBR322) run in a directly adjacentwell in a region of the gel where no curvature was present. The averageof all these independent determinations yields the size +SD shown.Rat liver sizes are from Prunell et al. (9). The values for yeast frag-ments are divided by a dotted line to reflect the two series of bandsobserved.
Biochemistry: Lohr and Van Holde
6328 Biochemistry: Lohr and Van Holde
6 8 10 12 14 16 18 20 22 24 26Band number (n)
FIG. 3. Graphs of the absolute sizes of fragments produced byDNase I digestion vs. band number. Band numbers were counted fromthe prominent band 8 in each series and numbered consecutively.Lines Y, CE, and CD correspond to fragments from yeast nuclei,chicken erythrocyte nuclei, and chicken erythrocyte compact dimers(10), respectively. The band number (n) scale (abscissa) is for yeast;band numbers for CE and CD have been increased by 2 and 4, re-
spectively, to displace the lines for clarity. Band numbers above 10in this figure and Fig. 1 do not correspond because it is possible toresolve more bands in the overlap region on urea gels than on form-amide gels. The average deviations for all points corresponding tomultiple determinations are shown by the vertical lines; pointswithout bars correspond to a single observation. (Inset) Quantitationof the "skip" in the yeast series, according to the equation N/n = r
- d/n, where r is the number of bases between nicking sites and d isthe displacement between the two series. The points shown are forthe upper series of yeast fragments; bars indicate SD of fragment sizes.Slope = 5.
dicted, including such details as the overlap region between theintercore and intracore series and the lack of significant inter-core bands j < 10.Long-Range Periodicity in DNase I Patterns. DNase I
shows some tendency to produce nucleosome-length repeatsof DNA (2). However, when visualized on the appropriate gel(Fig. 6), this pattern becomes quite striking. Whereas staphy-lococcus nuclease digestion of chromatin produces mainlynucleosome repeat-length DNA fragments, reflecting thetendency of this enzyme to preferentially digest between core
particles along the chromatin strand, spleen DNase II can beinduced to recognize both the spacer and a site approximatelyin the middle of the nucleosome to produce a set of DNAfragments that are multiples of a basic size, one half of thestaphylococcal nuclease repeat size (12). The pancreatic DNaseI patterns resemble the DNase II patterns (12).Whereas the simulated digestion patterns (Fig. 4) can gen-
erate a weak half-repeat pattern, such as in yeast (Fig. 1 top),we have not been able to simulate the intense half-repeat pat-terns seen for chicken erythrocyte or-HeLa digests. Further-
10 5 4x
0
3~1
0
5
4
3-
2
0 2 4 6 8 101214 16 1820 2224 26
FIC. 4. Simulation of DNase I nicking patterns. The mathe-matical details and the computer program we used are available onrequest. To predict the nicking patterns for yeast chromatin, we as-sume, first, that nicking frequencies obtained by Lutter (11) from ratliver core particles apply to yeast chromatin. All data shown corre-spond to Lutter's (11) conditions at a 30-sec digestion except for thecleavage site at mid-core. After numerous trials we have taken thevalue for the probability of nicking at Lutter's point 70 to be 0.155instead of his value of 0.067 for this digestion time. We find that withchromatin digestion, band 6 is exceptionally weak when Lutter's valueis used. Second, because we do not know the cutting probabilities atspacer sites, we tried different values for the spacer nicking frequency.We have used the probability of a particular spacer link to be hit as0.25; this is intermediate between the most and least frequently nickedinternal sites. Using a larger value leads to very rapid depletion of theupper series of bands. For ease of calculation, our program assumesthat DNase I cleaves at specific sites in the spacer. Data presentedlater in this paper suggests that this is probably not correct, but themain effect of nonspecific nicking should be to contribute to back-ground in the pattern. Finally, we do not know the precise length ofspacer DNA in that portion of the yeast chromatin that gives rise tothe extended ladder. We have tried values of n = 14, 15, and 16 (cor-responding to repeat lengths of about 152, 163.5, and 173 bp, re-spectively). (Top) Results for n = 14. (Middle) Results for n = 16.(Bottom) Average results for an equal-weight mixture of n = 14, 15,and 16. In each case the weight fraction (the same quantity that ismeasured by ethidium bromide staining of DNA in gels) is graphedvs. band number (j). Fragments from intracore nicks are shown byshaded bars and those that cross one linker are shown by unshadedbars. The latter have been displaced upward by 0.5 j unit, corre-sponding to a 5-b increment in the linker. The broken bars to the rightcorrespond to fragments that cross two linkers; they have been shiftedupward by one j unit.
more, if the increased intensities in the repeat region were duemerely to local increased DNA concentrations of the extendedladder bands in these regions, these bands should be moreclearly resolved from the background and show a higher bandheight-to-valley ratio than bands from the interpeak regions.They do not. Thus, another explanation is needed. If DNase Inicks strongly at a midnucleosome site, as DNase II can, thena combination of random spacer and specific midnucleosomeattack will yield a repeat pattern of fragments spaced at halfmultiples of the staphylococcal nuclease repeat size. The attack
Proc. Natl. Acad. Sci. USA 76 (1979)

Proc. Natl. Acad. Sci. USA 76 (1979) 6329
FIG. 5. High-resolution analysisDNA from DNase I digests of yeast(..... ) intranuclear chromatin and clabeled with 32p, using [32P]ATP aelectrophoresed on 12, 13, and 15% jwere then autoradiographed and scagel, the lower intercore bands (betwedetected in yeast or in chicken dige.smaller DNA (<30 b) off the gel, it is jbetween intracore bands 5, 6, anderythrocyte or in core particle digest
seems to occur randomly throughalf-repeat peaks consist of cont
5 yeast, which has a small spacer (:25 bp). This is observed (1).However, spacerless chromatin must produce a background-free ladder with no evidence of the long-range DNase I repeatobserved in chicken nuclei. This is the case (1). Thus, phasingmay involve a much larger fraction of the chromatin thanpreviously suggested (1), because much of the background arisesnot from a lack of phasing but from the possibilities of randomDNase I nicks in the spacer.
This explanation needs one ad hoc assumption:, a strongmidnucleosome nicking site. The DNase I nicking site mapdetermined from digestion of end-labeled core particles doesnot show a frequently nicked site in the middle of the coreparticle (11, 13, 14). However, to satisfactorily simulate dif-ferent features of the extended ladder pattern of yeast nuclei,of DNase I digestion products. it was necessary to markedly increase the probability of cutting
t(-) and chicken erythrocytehicken core particles was end- at the central site (see legend to Fig. 4). Analogously, the spleenmd polynucleotide kinase, and DNase II map does not show a strong site in the middle of the?olyacrylamide/urea gels, which core particle (15), but cleavage does occur readily in the middleLnned. On the higher-percentage of the nucleosome in intact chromatin (12). Even oligonucleo-een j = 1 and j = 3) could not be somes redigested with either DNase I (data not shown) orAts (not shown). By running the DNase II (12) do not show the clear half-repeat patterns ob-xossible to detect intercore bandso7siblentodetectbuterorebncserved with intact chromatin. These seeming contradictions7 in yeast but not in chicken
could be resolved if intact chromatin is in a conformation thatexposes an internal core particle site to nuclease attack. The
,hout the spacer because the availability of the central site would depend on and thus reflectinua of DNA sizes, even on internucleosomal interaction.
high-resolution gels in which the extended-ladder bands arequite clearly resolved (see Fig. 1 bottom). Random cleavagewithin the spacer is certainly not incompatible with discretespacer sizes and, in fact, is much easier to understand thanspecific spacer cleavage sites.
This suggestion immediately explains a number of puzzlingobservations about phasing. Random spacer cleavages com-bined with the many internal core particle cleavage sites canproduce a great heterogeneity of DNA sizes, which is respon-sible for the extensive background in extended ladder patternsof most chromatin. The clarity of an extended ladder will thusdepend on the relative rate of DNase I attack of spacer vs. coreparticle. DNA with larger spacers, such as in the chickenerythrocyte (-60 bp), should show more spacer attack andhence would necessarily show a less clear extended ladder than
FIG. 6. Low-resolution gel electrophoresis of DNA fragmentsproduced by DNase I digestion of HeLa (upper curve) and chickenerythrocyte (lower curve) nuclei. Below is shown the gel (5.5% poly-acrylamide/formamide) from which the scans were made. Lanes: 1-3,HeLa nuclei digested to various extents; 4, chicken erythrocyte nuclei.Electrophoresis is from right to left. From a number of such gels, wefind average peak sizes at 200 b, 304 b, 397 b, 511 b, and 619 b (about101 b for the chicken erythrocyte DNase I repeat) and at 175 b, 269b, 360 b, 454 b, and 547 b (about 90 b for the HeLa DNase repeat). Inyeast, the DNase I repeat is only weakly detectable, mainly in digestsof nuclei from stationary cells, but it stills shows values of one-halfof the staphylococcal nuclease repeat.
DISCUSSIONProbably the most surprising result of this work is the detectionof a 5-bp increment in the yeast spacer. Whereas repeat lengthseems to be variable along the yeast chromatin strand (2, 4), theobservation of bands larger than one repeat length in DNaseI digests (1) proves that spacer DNA occurs in discrete lengths.Combining all these observations, we conclude that quantizedspacers in yeast are (lOm + 5) bp in length, wherem = 0, 1, 2,... -i.e., 5, 15, or 25 bp. We know of no accurate way to es-timate the relative abundance of the various spacer lengths.However, from the absence of bands 10.5m in length above n= 13, we know that there are virtually no spacers lOin bplong.The presence of a 5-bp increment in the spacer has some
interesting structural implications. The core particle itselfcontains an integral number of DNA turns: 10.5 bp per turn X14 turns = 147 bp (t 148 bp was measured for the yeast coreparticle by using the recalibrated PM2 Hae III fragments asstandards). If DNA begins to wrap around each core particlewith a particular orientation on the histone core, then the 5-bpincrement will have the effect of reversing the strand orienta-tion in adjacent nucleosomes. Thus, if one strand has a particularorientation upon entering one core particle, the other strandwill be in the same orientation on the next core particle.
However, the most interesting consequence of the 5-bp in-crement arises in the geometry of core particle arrangementalong the chromatin strand. DNA is thought to be wound in aleft-handed coil around the core particle (16). Again, if thereis a definite orientation of DNA with respect to the histone core[i.e., the major groove facing in or out at the entry point; seefigure 1 of Carter (17)], then there arises a severe constraint onthe way adjacent nucleosomes are arranged in space. Work withmodels has shown us that one cannot stack two neighboringnucleosomes separated by lOin +-5 bp spacers on top of oneanother with histone faces (the t100-A-diameter surfaces)parallel and have DNA in both be coiled left-handed. Rather,they must be arranged in a side-to-side manner, as shown in Fig.7, and can neatly pack together. As far as we are aware, thereis no evidence against such a side-to-side chromatin fiber.
In this model there can be interaction of DNA in one core
Biochemistry: Lohr and Van Holde
6330 Biochemistry: Lohr and Van Holde
FIG. 7. A schematic drawing of the kind of chromatin structureimposed when spacer lengths are (lOi + 5) bp. For simplicity we showa structure with a 5-bp spacer (dotted) and coplanar nucleosomes,although tipped orientations are possible, perhaps even more likely.The DNA enters core particle A at the top, descends for 1.75 turns,crosses to particle B via the spacer, and ascends for 1.75 turns. Thesequence then repeats; thus, the two nucleosomes constitute a
structural repeating unit. The core particles are drawn as 112-A (outerdiameter) cylinders with 22-A-diameter DNA. For these to be incontact, about 7 bp of DNA must be loosened from the core at eachend. Both compact and more open structures of-the same type can begenerated by using longer (15 bp, 25 bp) spacers or changes in theamount ofDNA loosened from the core. We would expect, on the basisof thermal denaturation studies (18), that amounts up to 20 bp at eachend could be so loosened.
particle with core particle histones in adjacent cores. Such el-ements of long-range interaction are probably necessary togenerate stable higher-order structures. In addition, there are
elements of symmetry inherent in the model; there is a pseu-dodyad axis passing through the spacer in a direction perpen-dicular to the core particle face (as drawn in Fig. 7). If theparticles are tilted, the axis bisects the angle formed by theperpendicular to the faces. Thus, symmetry exists betweennucleosomes (as well as within nucleosomes) to form a structurethat repeats every second nucleosome.We should point out that one can coin-stack core particles
(one on top of another) separated by lOm + 5 bp spacers if thetwist of the DNA supercoil on the core particle changes fromright-handed to left-handed every other nucleosome. However,because such a structure has zero net supercoiling, we rejectedit.The number of base pairs per turn is also of interest. Careful
analysis of the slopes of the lines in Fig. 3 gives values of 10.5for yeast but 10.3-10.4 for chicken, in agreement with thenumbers determined by other workers using other multicellulareukaryotic systems (9, 19). Sizes of the chicken erythrocytenuclear DNase I bands agree with the precisely determinedsizes of the rat liver DNase I bands (9), but the yeast sizes do not(Table 1), corroborating the slight but measureable differencesobserved in yeast. The nonintegral number of base pairs perturn means that the average repeat must be a mixture of dif-ferent values, for example 10 and 11 bp per nicking site. Thus,yeast chromatin is slightly underwound relative to chickenchromatin. This may be associated with the high transcriptionalactivity of yeast (cf. ref. 3).The observation of the half-repeat pattern in the DNase I
digests (and an accessible site at midnucleosome) generalizesthe observation of a half-repeat with spleen DNase II. Thispattern is not just a reflection of the peculiarities of a specific
Proc. Natl. Acad. Sci. USA 76 (1979)
enzyme, but must reflect a modification in the structure ofnucleosomes organized in the nuclear structure. This and thefact that the yeast DNase I fragments show a quite differentpattern of digestion and slightly different pitch than is obtainedfrom chicken erythrocyte or HeLa nuclei indicate that acces-sibility of nuclease cleavage sites is in some sense determinedby nucleosome structure and is not just a reflection of someproperty of DNA itself.The amount of chromatin involved in phasing has always
been unknown. Based on background throughout the gels, weoriginally concluded that only a portion of yeast chromatin andeven smaller portions of HeLa and chicken erythrocyte chro-matin are phased. However, the evidence for random spacerdigestion by DNase I suggests that the amount of DNA presentin sharp, extended ladder bands is a minimum estimate of theamount of phased chromatin. In fact, we cannot exclude thepossibility that all the chromatin in yeast and even in chickenerythrocytes is phased and that the background differences aredue merely to differential but nonnegligible rates of spacerattack.
The authors acknowledge the expert technical assistance of Ms.Georgia Riedel, particularly with the formamide gels; gifts of chickenerythrocyte nuclei from Dr. K. Tatchell, HeLa nuclei from Dr. J.Corden, pBR322 DNA from Dr. W. Baase, OX174 Hae III and simianvirus 40 DNA from Dr. G. Pearson; and the generous use of theJoyce-Loebel densitometer of Dr. K. Hedberg of the Chemistry De-partment. We thank Mr. J. Luthe for programming assistance. Thisresearch was supported by grants from the U.S. Public Health Service(GM 22916) and the National Science Foundation (PCM-74-23461)and K.V.H. wishes to acknowledge the support of an American CancerSociety Research Professorship.
1. Lohr, D., Tatchell, K. & Van Holde, K. E. (1977) Cell 12,829-836.
2. Lohr, D., Corden, J., Tatchell, K., Kovacic, R. T. & Van Holde,K. E. (1977) Proc. Natl. Acad. Sci. USA 74,79-83.
3. Lohr, D. & Ide, G. (1979) Nucleic Acids Res. 6, 1909-1927.4. Lohr, D., Kovacic, R. T. & Van Holde, K. E. (1977) Biochemistry
16,463-471.5. Maniatis, T., Jeffrey, A. & van de Sande, H. (1975) Biochemistry
14, 2787-2793.6. Sanger, F., Carlson, A. R., Friedmann, T., Air, G. M., Barrell, B.
G., Brown, N. L., Fiddes, J. C., Hutchison, C. A., III, Slocombe,P. M. & Smith, M. (1978) J. Mol. Biol. 125,224-246.
7. Reddy, V. B., Thimmappaya, B., Dhar, R., Subramanian, K. N.,Zain, B. S., Pan, J., Ghosh, P. K., Celma, M. L. & Weissman, S.M. (1978) Science 200, 494-502.
8. Sutcliffe, J. G. (1978) Nucleic Acids Res. 5, 2721-2728.9. Prunell, A., Kornberg, R., Lutter, L., Klug, A., Levitt, M. & Crick,
F. H. C. (1979) Science 204, 855-858.10. Tatchell, K. & Van Holde, K. E. (1978) Proc. Natl. Acad. Sci. USA
75,3583-3587.11. Lutter, L. C. (1978) J. Mol. Biol. 124,391-420.12. Altenburger, W., Horz, W. & Zachau, H. G. (1976) Nature
(London) 264,517-522.13. Simpson, R. T. & Whitlock, J. P., Jr. (1976) Cell 9,347-353.14. Noll, M. (1977) J. Mol. Biol. 116,49-71.15. Sollner-Webb, B. W., Melchior, W., Jr. & Felsenfeld, G. (1978)
Cell 14, 611-627.16. Finch, J. T., Lutter, L. C., Rhodes, D., Brown, R. S., Rushton, B.,
Levitt, M. & Klug, A. (1977) Nature (London) 269,29-36.17. Carter, C. W. (1978) Proc. Natl. Acad. Sci. USA 75, 3649-
3653.18. Weischet, W. O., Tatchell, K. & Van Holde, K. E. (1978) Nucleic
Acids Res. 5, 139-160.19. Lutter, L. C. (1979) Nucleic Acids Res. 6, 41-54.