Embed Size (px)
Citation preview
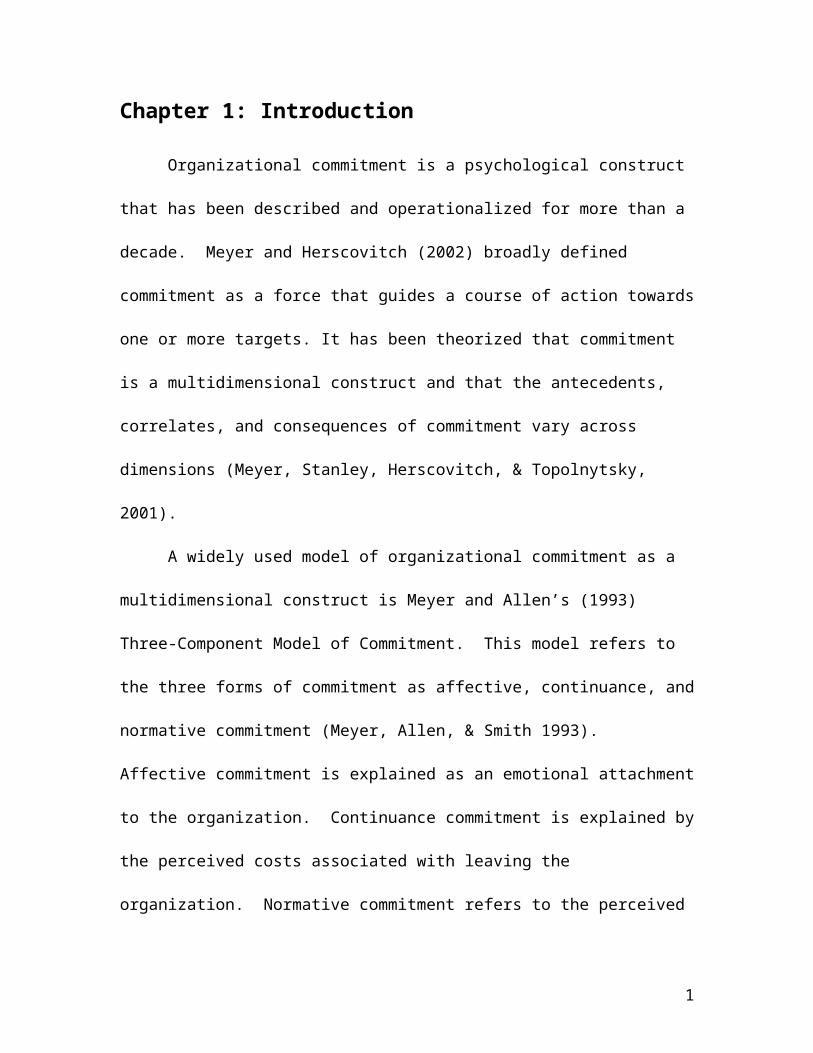
Chapter 1: Introduction
Organizational commitment is a psychological construct that has been described
and operationalized for more than a decade. Meyer and Herscovitch (2002) broadly
defined commitment as a force that guides a course of action towards one or more targets.
It has been theorized that commitment is a multidimensional construct and that the
antecedents, correlates, and consequences of commitment vary across dimensions
(Meyer, Stanley, Herscovitch, & Topolnytsky, 2001).
A widely used model of organizational commitment as a multidimensional
construct is Meyer and Allen’s (1993) Three-Component Model of Commitment. This
model refers to the three forms of commitment as affective, continuance, and normative
commitment (Meyer, Allen, & Smith 1993). Affective commitment is explained as an
emotional attachment to the organization. Continuance commitment is explained by the
perceived costs associated with leaving the organization. Normative commitment refers
to the perceived obligation to remain in the organization (Meyer, Stanley, Herscovitch, &
Topolnytsky, 2001).
The target of most interest to researchers has historically been employee retention
(Mobley, Griffeth, Hand, & Meglino, 1979). It has been suggested that employees who
exhibit both high organizational commitment and high job involvement should be least
likely to leave the organization and employees with low levels of organizational
commitment and job involvement should be the most likely to leave the organization
voluntarily (Huselid & Day, 1991).
This interest has led the construct, in relation to the business world, to have
varying semantic definitions applied to it. The most common nomenclature used to
1

define commitment is organizational commitment. Organization commitment is defined
as a psychological state that is representative of an employee’s relationship with the
organization, and influences the employee’s decision to remain employed at a particular
organization (Meyer & Allen, 1993). Operationalized measures of the three-component
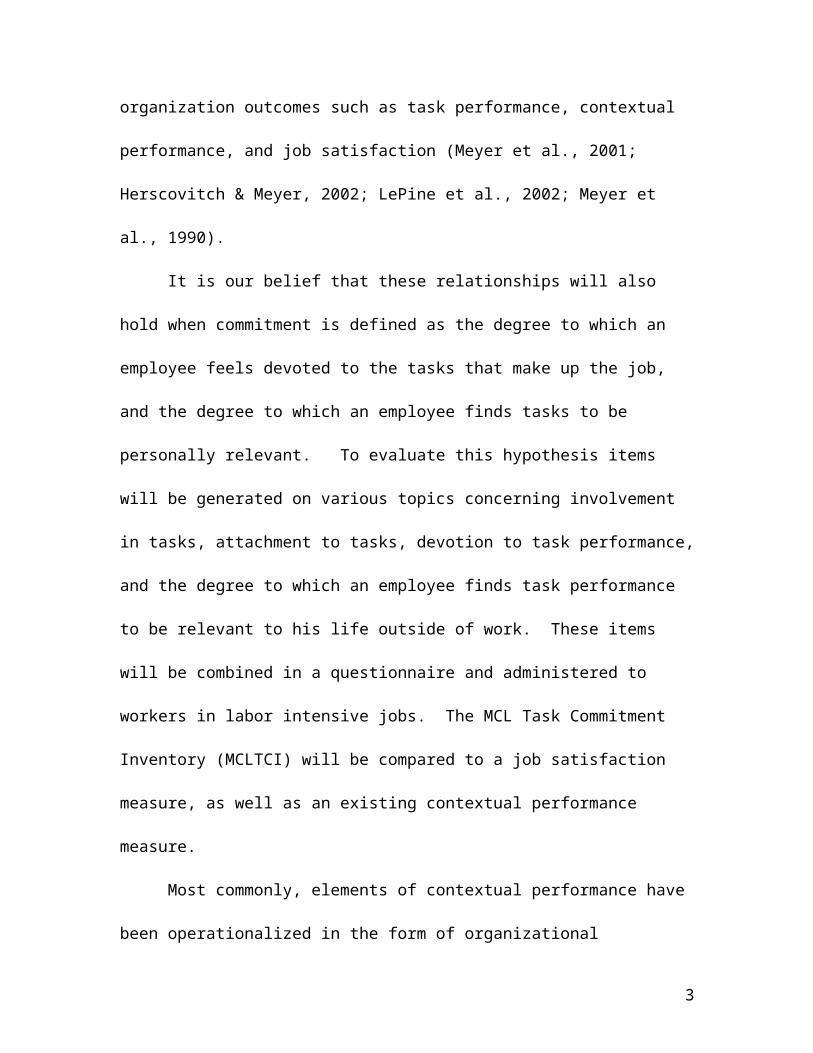
commitment model have been shown to predict many important organization outcomes
such as task performance, contextual performance, and job satisfaction (Meyer et al.,
2001; Herscovitch & Meyer, 2002; LePine et al., 2002; Meyer et al., 1990).
It is our belief that these relationships will also hold when commitment is defined
as the degree to which an employee feels devoted to the tasks that make up the job, and
the degree to which an employee finds tasks to be personally relevant. To evaluate this
hypothesis items will be generated on various topics concerning involvement in tasks,
attachment to tasks, devotion to task performance, and the degree to which an employee
finds task performance to be relevant to his life outside of work. These items will be
combined in a questionnaire and administered to workers in labor intensive jobs. The
MCL Task Commitment Inventory (MCLTCI) will be compared to a job satisfaction
measure, as well as an existing contextual performance measure.
Most commonly, elements of contextual performance have been operationalized
in the form of organizational citizenship behaviors (OCBs). Organizational citizenship
behavior has been a focus for many organizations because many managers claim to base
decisions and formulate perceptions about employees based on OCBs ( LePine, Erez, &
Johnson, 2002). Researchers have broadly defined OCB as a behavior that is
discretionary, or not formally recognized by a reward system, that can promote the
functioning of the organization (Podsakaff, MacKenzie, Paine, & Bachrach, 2000).
2
Recent studies have redefined OCBs more specifically as behaviors that
contribute to or enhance the social and psychological context that supports task
performance ( LePine, Erez, & Johnson, 2002). Further research has concluded that there
are several types of organizational citizenship behaviors. Williams and Anderson (1991)
broke OCBs down into three categories. These include positive behaviors directed
toward co-workers (OCBI), behaviors directed at organizational enhancement (OCBO),
and in-role behaviors (IRBs) directed toward task performance (Williams and Anderson,
1991). As the present study is concerned with employee task commitment, it is expected
that total scores on the task commitment survey will correlate significantly higher with
the IRB subscale than with the other two OCB subscales.
An existing career commitment survey and the Organizational Commitment
Questionnaire (OCQ) will also be compared to the aforementioned OCB subscales. It is
expected that these two surveys will show significantly stronger correlations with the
OCBI and OCBO subscales.
It is our intention to determine if commitment levels lead to similar positive
organizational outcomes in labor intensive settings. In order to accomplish this goal, a
measure of job satisfaction, organizational commitment (OCQ), career commitment, and
organizational citizenship behavior (OCBI, OCBO, IRB), will be combined with our task
commitment items into a 76 item questionnaire. This questionnaire will be administered
to workers in labor intensive settings.
This measure is designed to help determine if commitment has similar positive
effects in labor-intensive jobs. The researchers will be able to determine if scores on task
commitment are related to specific organizational outcomes. In addition, this measure
3

will allow researchers to determine what outcomes are associated with increased levels of
task commitment. This measure will be compared to various existing operationalized
commitment measures such as the Organizational Commitment Questionnaire (OCQ) and
a career commitment inventory to determine if task commitment explains more outcome
variance for labor-intensive jobs. It has been shown that organizational commitment
is generalizable across many occupations, but none of those occupations assessed were
highly labor intensive (Irving, Coleman, & Cooper, 1997).
This research will help organizations to understand the degree to which resources
should be allocated to practices that have been shown to increase levels of commitment in
employees. Furthermore, organizations will be able to determine if task commitment is
more important than other areas of commitment. The measure and the research to follow
will give labor-based organizations in industries the opportunity to develop strategic
plans that will bring employee task commitment to optimal levels.
4
Chapter 2: Directions for Administration
The MCL Task Commitment Inventory (MCLTCI) should be administered in
organizations that are assessing what aspect of commitment is most important to its
employees. It is very important that when administering the questionnaire to make sure
that employees have complete privacy so they will answer each question truthfully.
Anonymity is important as employees must feel that responses will not be viewed by
supervisors. To help achieve anonymity, it is important to have someone outside the
organization, such as a consultant, administer and collect the questionnaires.
Included in the MCLTCI are brief instructions. These instructions are easy for
respondents to understand (See Appendix I). A 1 to 5 agreement scale in used for the
MCLTCI. The respondent is asked carefully read each statement and circle the number
that corresponds with their level of agreement. Below is an example of how the scale
appears in the survey.
1- strongly disagree 2- disagree 3- undecided 4- agree 5- strongly agree
The survey will take approximately 15 to 30 minutes to complete. Included with
the survey are an informed consent form, a debriefing form, and a demographics form.
The demographics form contains questions regarding the respondent’s gender, age,
minority status, and job tenure. It is important to collect background information
concerning age, gender, and minority status and to determine if any biases arise after each
administration. Respondents can detach the provided debriefing form for their personal
records.
5
Chapter 3: Scoring
Two dimensions of the MCLTCI were derived from an exploratory principal
components factor analysis procedure. These two dimensions, which are Task Devotion
(TD) and Task Congruence (TC), contained four and six items respectively. Each item in
the MCLTCI was rated by respondents on a 5 point agreement scale, and items were
reversed scored when necessary so that a high score for each item constituted high levels
of commitment.
In order to obtain a respondent’s score on TD and TC subscales, scores for each
item should be summed. Total scores can be calculated by summing the four TD items
for a TD total score, and the six TC items for a TC total score. The score obtained is an
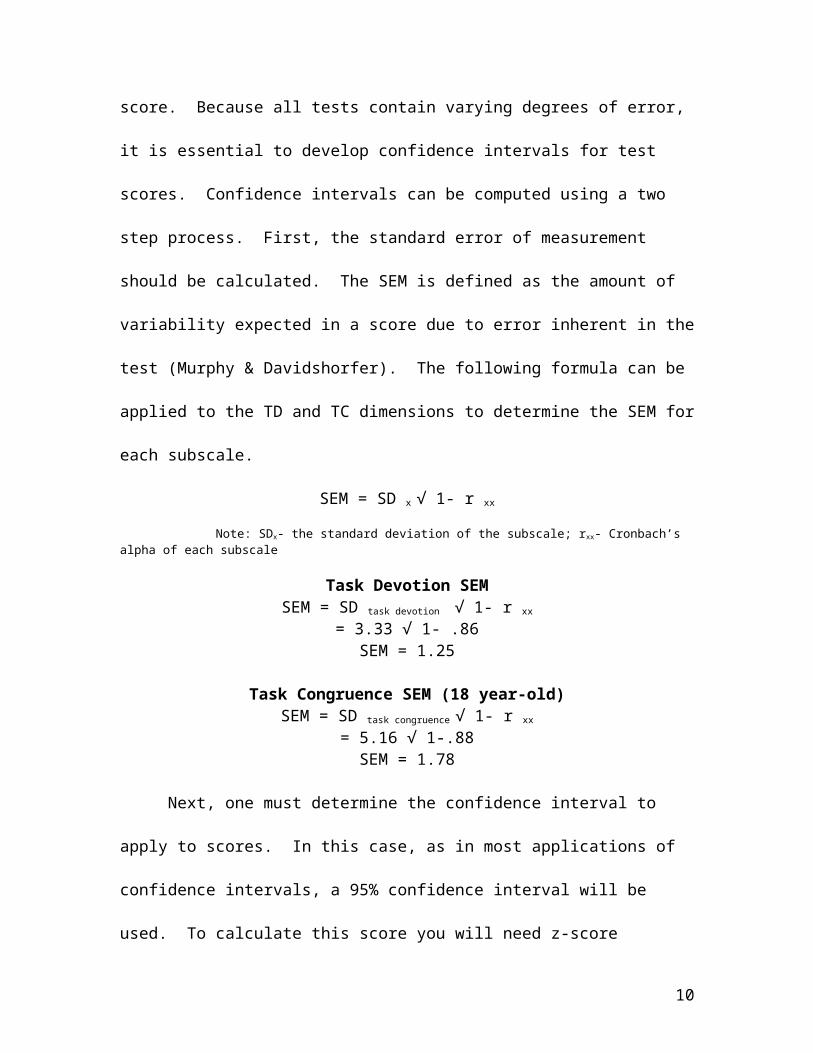
estimate of the respondent’s true score. Because all tests contain varying degrees of
error, it is essential to develop confidence intervals for test scores. Confidence intervals
can be computed using a two step process. First, the standard error of measurement
should be calculated. The SEM is defined as the amount of variability expected in a
score due to error inherent in the test (Murphy & Davidshorfer). The following formula
can be applied to the TD and TC dimensions to determine the SEM for each subscale.
SEM = SD x √ 1- r xx
Note: SDx- the standard deviation of the subscale; rxx- Cronbach’s alpha of each subscale
Task Devotion SEMSEM = SD task devotion √ 1- r xx
= 3.33 √ 1- .86SEM = 1.25
Task Congruence SEM (18 year-old)SEM = SD task congruence √ 1- r xx
= 5.16 √ 1-.88SEM = 1.78
6
Next, one must determine the confidence interval to apply to scores. In this case,
as in most applications of confidence intervals, a 95% confidence interval will be used.
To calculate this score you will need z-score corresponding to the 95th percentile. For a
95% confidence interval this score is 1.96. The following formulas can be applied to the
TD and TC dimensions to determine the confidence interval
TD- Confidence Interval95% CI TD = raw score ± (1.96)(SEM TD)
= raw score ± (1.96)(1.25)= raw score ± 2.45
TC- Confidence Interval (18 year-old)95% CI TC = raw score ± (1.96)(SEM TC)
= raw score ± (1.96)(1.79)= raw score ± 3.50
Example: If a respondent get a raw score of 14 on task devotion, then you can be 95% confident that the respondent’s true score will fall in the range 11.55 to 16.45. Similarly, if this respondent gets a raw score of 18 on task devotion, then you can be 95% that this respondent’s true score falls in the range of 14.50 to 21.50.
*Note: Age must be considered for the task congruence factor (see chapter 4 for appropriate means and standard deviations by age).
7
Score Profile Development
In order to assess the meaning of these scores it is essential to consider the mean
and standard deviations for each subscale. Three levels of commitment (Low, Moderate,
High) can be derived from the total scores. When reviewing test scores, profiles can be
developed for each respondent. A respondent that scores one standard deviation above
the mean on either subscale should be considered high on that dimension of commitment.
Similarly, respondents scoring one standard deviation below the mean in either subscale
should be considered low on that dimension. Respondents who fall within one standard
deviation of the mean show moderate commitment levels. In order to get a picture of a
respondent’s score, a score profile can be developed with the use of the provided norms
tables (See Chapter 4). Table 1- A and Table 1-B contain the score profile of the
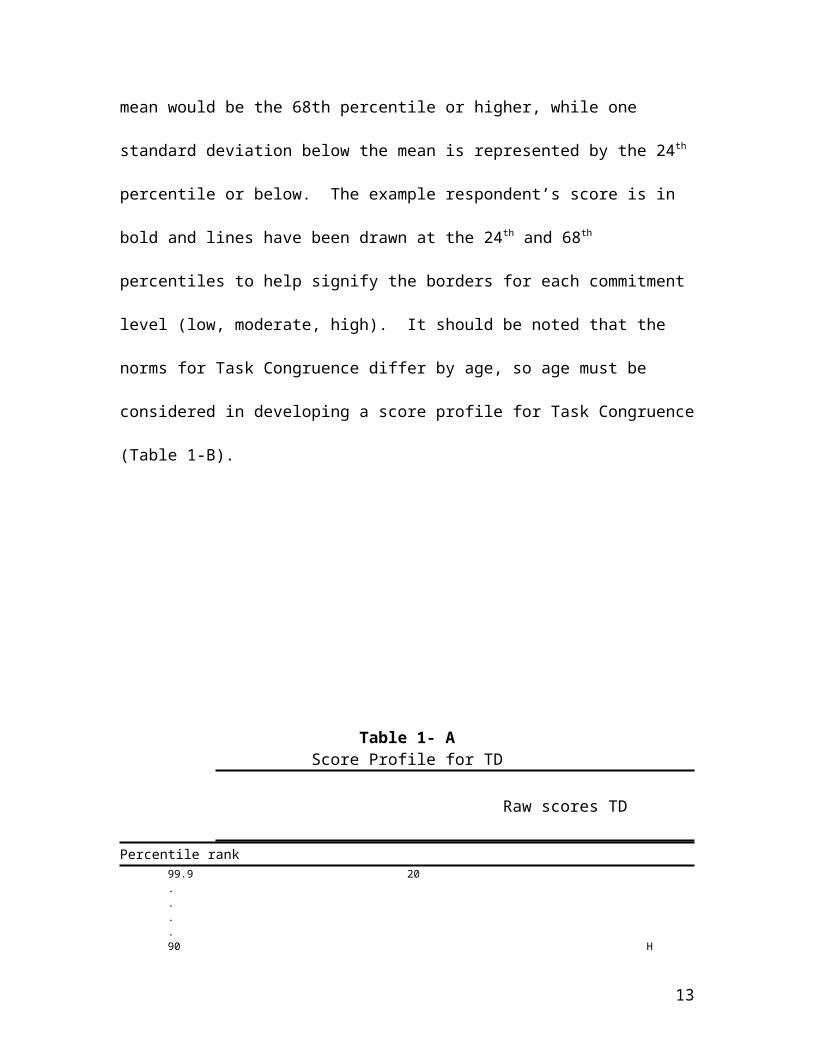
aforementioned respondent. One standard deviation above the mean would be the 68th
percentile or higher, while one standard deviation below the mean is represented by the
24th percentile or below. The example respondent’s score is in bold and lines have been
drawn at the 24th and 68th percentiles to help signify the borders for each commitment
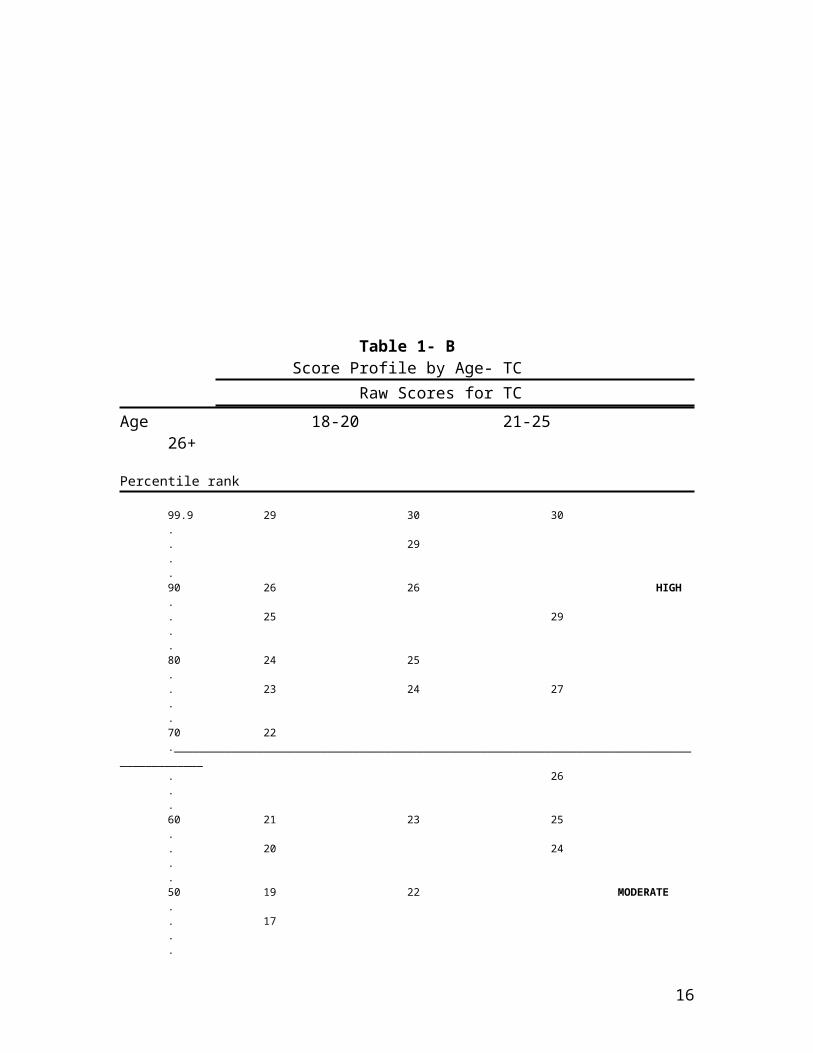
level (low, moderate, high). It should be noted that the norms for Task Congruence differ
by age, so age must be considered in developing a score profile for Task Congruence
(Table 1-B).
8

Table 1- AScore Profile for TD
Raw scores TD Percentile rank
99.9 20....90 H. I. G. H.80 19....70.__________________________________________________________________________________________________. 18..60 M. O. 17 D. E. R50 A. T. E..40 16.. 15..30.._________________________________________________________________________________________________..20 14. L. 13. O.10 12 W....
Mean: 16.32SD: 3.33
As you can see the example respondent shows a low level of task devotion. A low level of task devotion is characterized having a low degree of dedication to the task at hand. Table 2 provides a description for each commitment level for each subscale.
9
As there was a significant difference between means in the Task Congruence
subscale for age, a different normative table will have to be applied when profiling a
score on TC. Consider in the previous example the score of 18 on TC. If this respondent
is 45, the respondent would be low on TC. However if this respondent was 18 or 22 the
score would be categorized as moderate. Table 1- B, on the following page, will help to
illustrate this situation. Table 2 provides a description for each commitment level for
each subscale.
10

Table 1- BScore Profile by Age- TC
Raw Scores for TCAge 18-20 21-25 26+
Percentile rank
99.9 29 30 30.. 29..90 26 26 HIGH.. 25 29..80 24 25.. 23 24 27..70 22.______________________________________________________________________________________________. 26..60 21 23 25.. 20 24..50 19 22 MODERATE.. 17..40 21.. 16..30 17 23.. 14 16 22._____________________________________________________________________________________________.20.. 15 21.. 18 LOW10 13 11 17....
Mean: 18.95 Mean: 20.07 Mean: 24.32SD: 5.16 SD: 5.59 SD: 4.19
11

Table 2Description of Levels
Task Devotion
Low Moderate HighRespondent shows low levels of dedication to the tasks performed.
Respondent shows moderate levels of dedication to the tasks.
Respondent is highly dedicated to on the job tasks.
Description of LevelsTask Congruence
Low Moderate HighRespondent finds the tasks to be irrelevant to them personally or irrelevant to society as a whole.
Respondent has a moderate level of attachment to the tasks and finds them to be moderately aligned with their own values.
Respondent believes that the tasks are highly representative of there values, and are highly important and relevant.
12
Chapter 4: Normative Information
This research focused on workers in labor intensive jobs. In total, 350 surveys
were distributed and 84 were returned to the researchers. The bulk of the sample
included workers from a facilities management department at a local university, and a
hospital. The sample also included factory workers, stockers, and students working in
labor intensive jobs. Participation in this research was voluntary and all respondents
were given a consent form and debriefing form with the survey. Of the 84 employees
sampled, only one respondent failed to provide demographic information. Demographic
information was collected in this survey through the use of an attached demographics
form, which was designed to collect data on gender, age, minority status, and tenure. The
sample included 38 males and 45 females. The sample included 17 minorities and 66
non-minorities. The sample also included participants ranging in age and job tenure.
Table 3 contains sample demographic information. The frequency represents the number
of respondents that were in each category, and all percentages are calculated out of 83
total respondents.
13
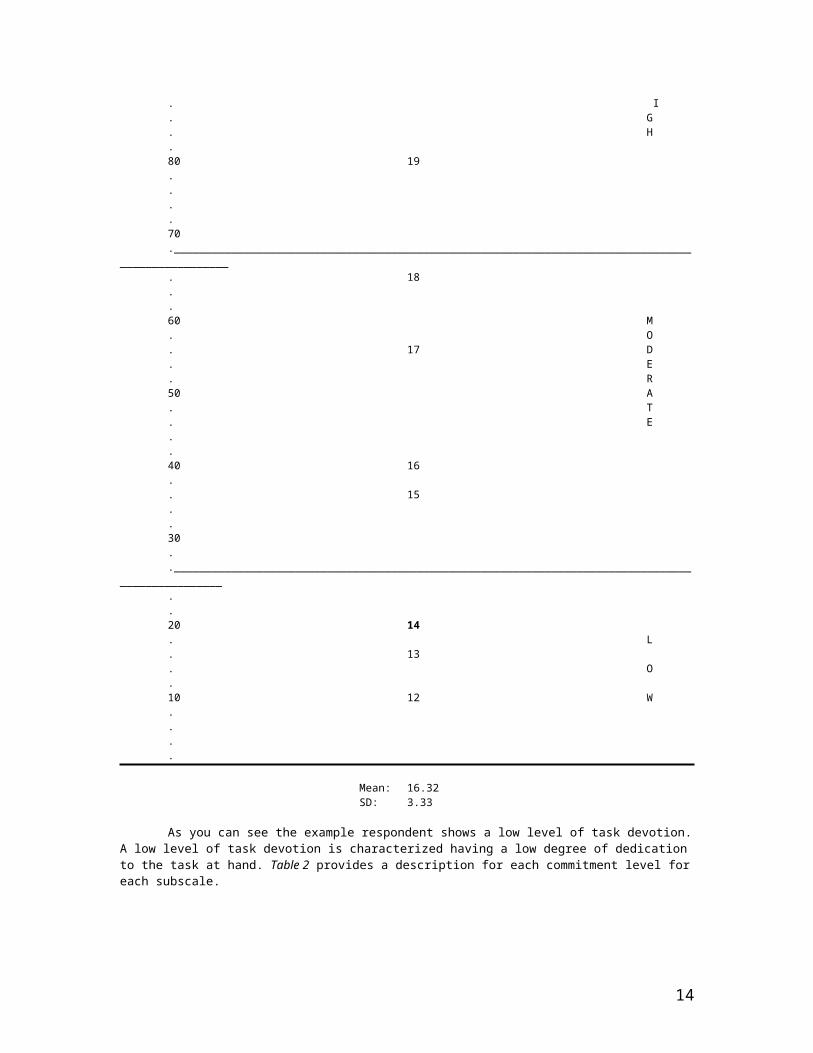
TABLE 3Sample Demographics
Age Frequency Percentage
18-20 22 26.521-25 29 34.926+ 32 38.6
Sex
Male 38 45.8Female 45 54.2
Minority Status
Minority 17 20.5Non-minority 66 79.5
Tenure
Less than one year 19 22.61-2 years 24 28.63-5 years 21 25.05-10 years 8 9.6
14
In order to make normative comparisons in regard to total test scores, independent
samples t-test and one-way ANOVA analyses were used. Since sex and minority status
were dichotomous variables, the means were compared using independent samples t-test
analysis. The means of males and females did not differ significantly for the Task
Devotion or Task Congruence scale of the MCLTCI, t (81) = -.30, p > .05, t (80) = -.32, p
> .05. The means for minorities and non-minorities were also not significantly different
for the Task Devotion (TD) or Task Congruence (TC) subscales, t (81) = 1.42, p > .05; t
(80) = -.12, p > .05.
Tenure and age where compared using a one-way ANOVA. The means for the
five levels of the tenure variable where not significantly different for TD or TC,
F (4, 78) = 1.3, p > .05; F (4, 77) = .56, p > .05. The means for the three levels of age
were not significantly different on the TD subscale, F (2, 80), p > .05. However, the
means for the three levels of the age variable were significantly different on the TC
subscale, F (2, 79) = 9.02, p < .001. Specifically, as age increased so did the total score
mean on TC.
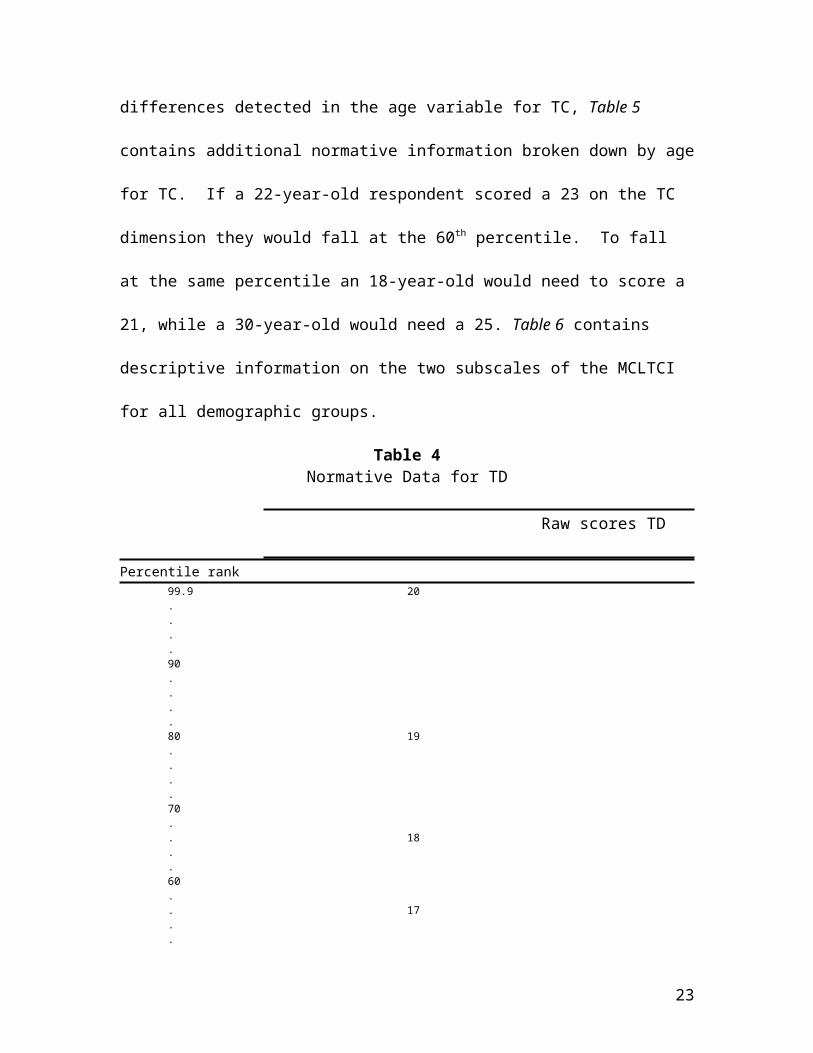
Table 4 contains normative information for total scores on the TD subscale of the
MCLTCI. Normative tables are used to help determine score meaning. If a respondent
scored an 18 on the TD this respondent would fall in the 65th. In order to read these
tables, simply find the raw score for each scale and look straight across to the left to
determine on which percentile that score falls (refer to Chapter 3 for score interpretation).
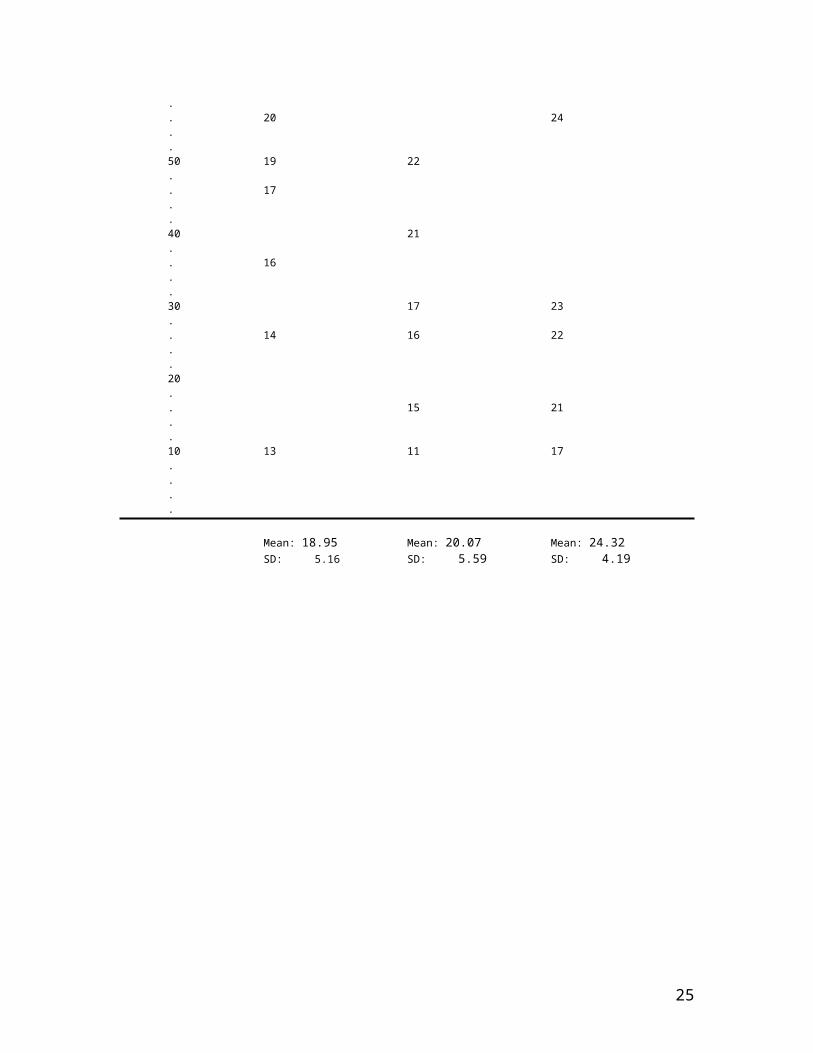
Because there were significant differences detected in the age variable for TC, Table 5
contains additional normative information broken down by age for TC. If a 22-year-old
respondent scored a 23 on the TC dimension they would fall at the 60th percentile. To fall
15
at the same percentile an 18-year-old would need to score a 21, while a 30-year-old
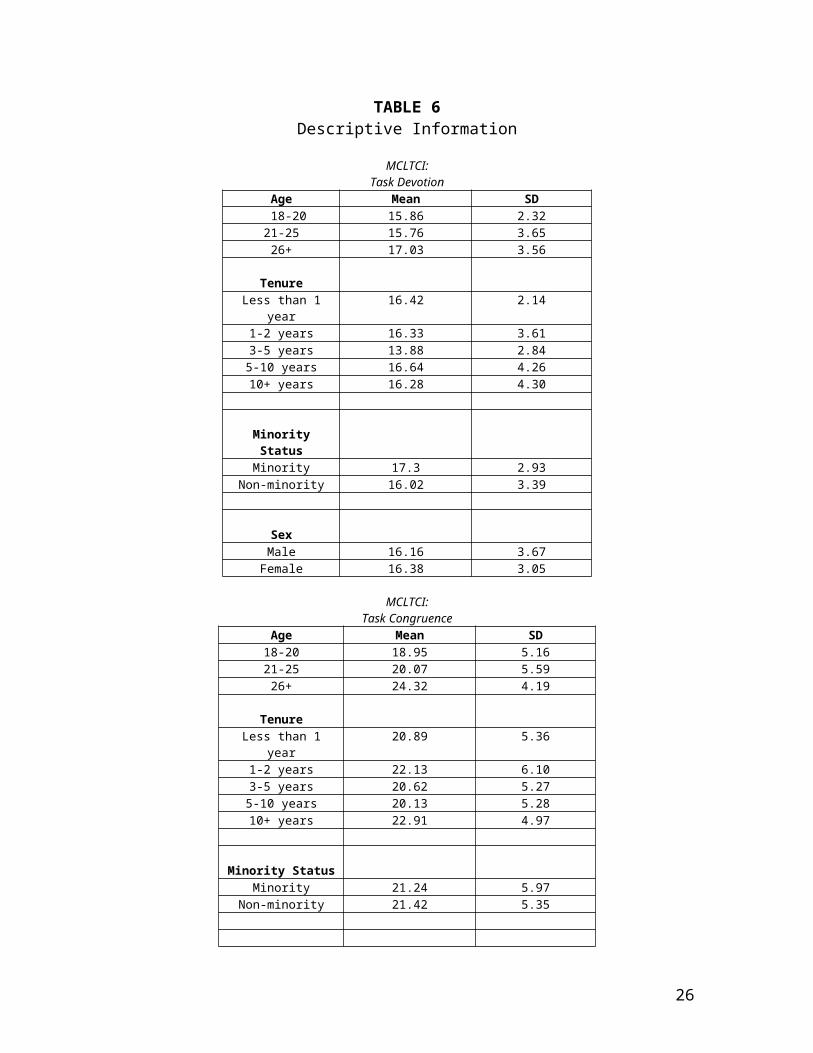
would need a 25. Table 6 contains descriptive information on the two subscales of the
MCLTCI for all demographic groups.
Table 4Normative Data for TD
Raw scores TD Percentile rank
99.9 20....90....80 19....70.. 18..60.. 17..50....40 16.. 15..30....20 14.. 13..10 12....
Mean: 16.32 SD: 3.33
16

Table 5Normative Information by Age- TC
Raw Scores for Factor 218-20 21-25 26+
Percentile rank
99.9 29 30 30.. 29..90 26 26.. 25 29..80 24 25.. 23 24 27..70 22.. 26..60 21 23 25.. 20 24..50 19 22.. 17..40 21.. 16..30 17 23.. 14 16 22..20.. 15 21..10 13 11 17....
Mean: 18.95 Mean: 20.07 Mean: 24.32SD: 5.16 SD: 5.59 SD: 4.19
17

TABLE 6Descriptive Information
MCLTCI:Task Devotion
Age Mean SD 18-20 15.86 2.3221-25 15.76 3.6526+ 17.03 3.56
TenureLess than 1 year 16.42 2.14
1-2 years 16.33 3.613-5 years 13.88 2.845-10 years 16.64 4.2610+ years 16.28 4.30
Minority StatusMinority 17.3 2.93
Non-minority 16.02 3.39
SexMale 16.16 3.67
Female 16.38 3.05
MCLTCI:Task Congruence
Age Mean SD18-20 18.95 5.1621-25 20.07 5.5926+ 24.32 4.19
TenureLess than 1 year 20.89 5.36
1-2 years 22.13 6.103-5 years 20.62 5.27
5-10 years 20.13 5.2810+ years 22.91 4.97
Minority StatusMinority 21.24 5.97
Non-minority 21.42 5.35
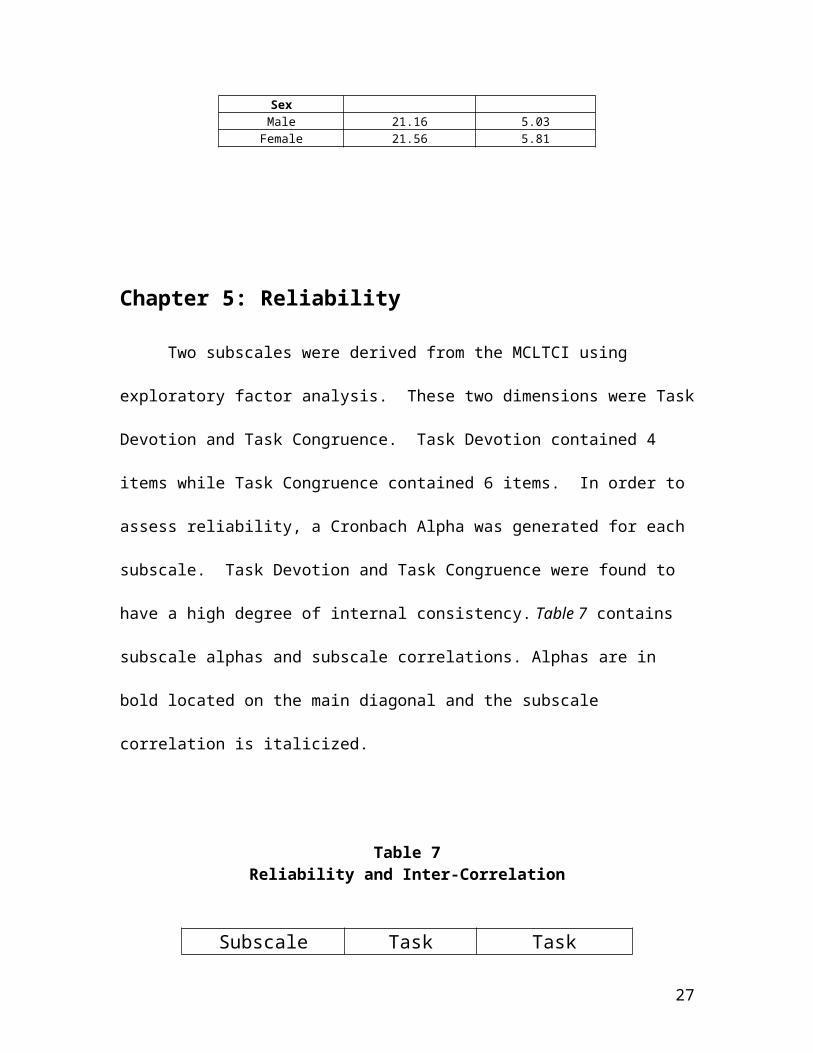
SexMale 21.16 5.03
Female 21.56 5.81
18

Chapter 5: Reliability
Two subscales were derived from the MCLTCI using exploratory factor analysis.
These two dimensions were Task Devotion and Task Congruence. Task Devotion
contained 4 items while Task Congruence contained 6 items. In order to assess
reliability, a Cronbach Alpha was generated for each subscale. Task Devotion and Task
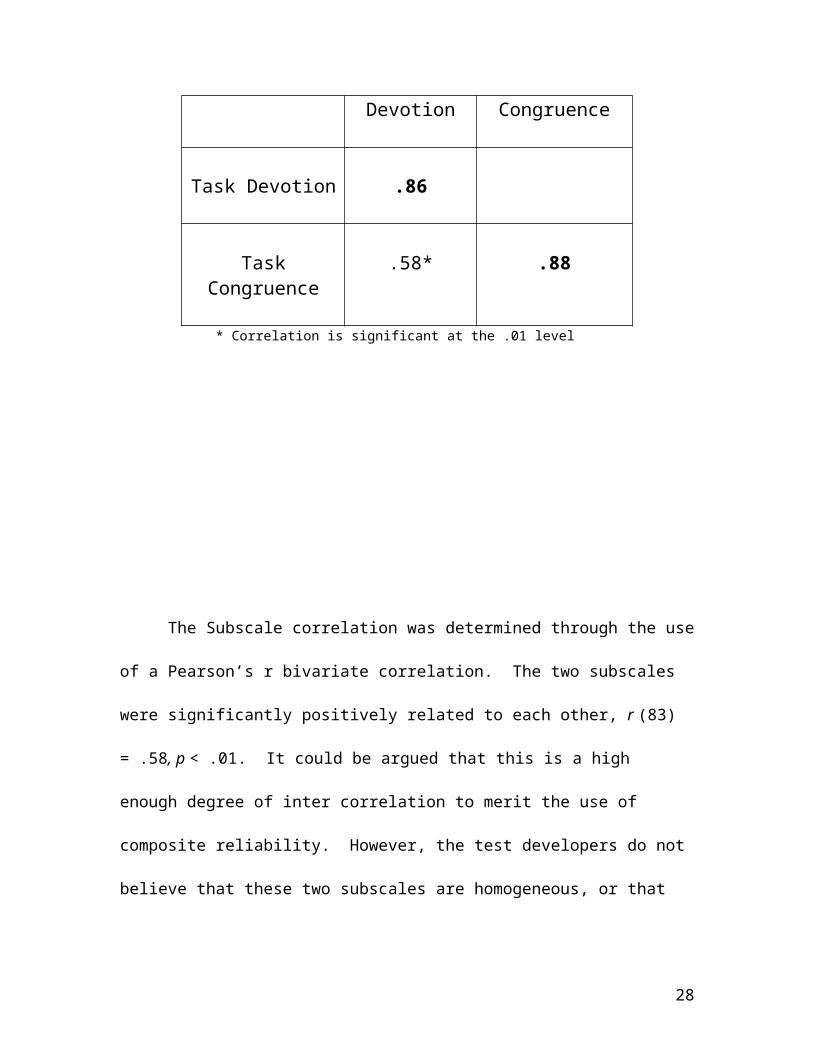
Congruence were found to have a high degree of internal consistency. Table 7 contains
subscale alphas and subscale correlations. Alphas are in bold located on the main
diagonal and the subscale correlation is italicized.
Table 7
Reliability and Inter-Correlation
Subscale Task Devotion Task Congruence
Task Devotion .86
Task Congruence .58* .88
* Correlation is significant at the .01 level
19

The Subscale correlation was determined through the use of a Pearson’s r
bivariate correlation. The two subscales were significantly positively related to each
other, r (83) = .58, p < .01. It could be argued that this is a high enough degree of inter
correlation to merit the use of composite reliability. However, the test developers do not
believe that these two subscales are homogeneous, or that task commitment is a uni-
dimensional construct. For these reasons, composite reliability was not calculated.
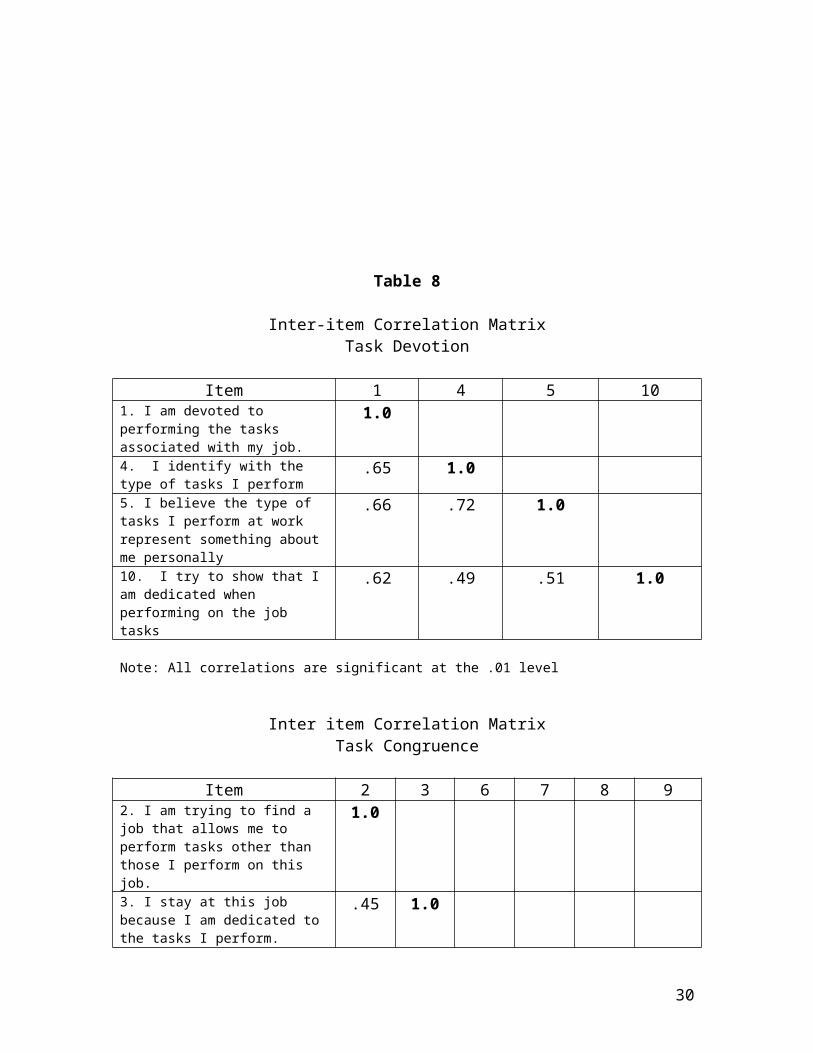
Inter-item correlations in the Task Devotion scale were high with a range from .49
to .73. This was also the case for the Task Congruence Scale, which showed inter-item
correlations in the range of .44 to .70. It is possible that these items do not address the
full content domain range for each subscale as they are so highly correlated with one
another. In the future, more items will need to be developed in order to determine if there
are other critical elements to each of these dimensions. Table 8 contains a list of items
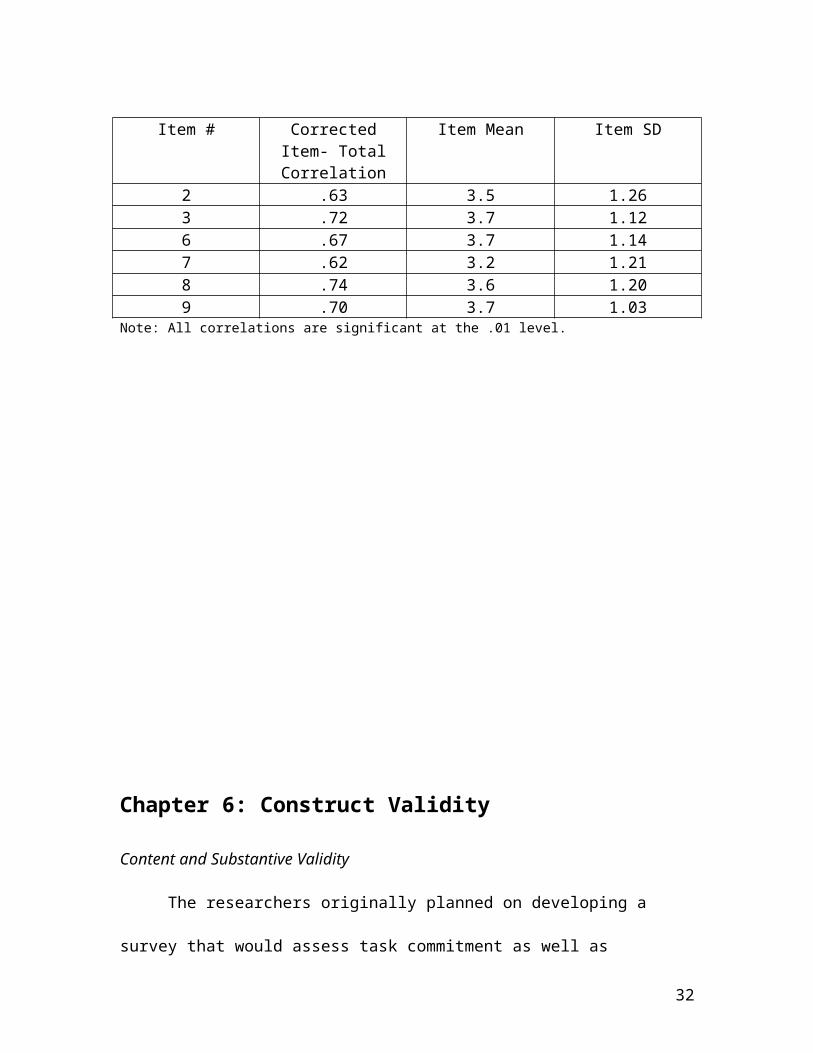
for each subscale and the inter-item correlations. Table 9 contains the item total
correlation, which is the degree to which each item is correlated to the sum of all other
items, and the item means and standard deviations.
20

Table 8
Inter-item Correlation MatrixTask Devotion
Item 1 4 5 101. I am devoted to performing the tasks associated with my job.
1.0
4. I identify with the type of tasks I perform
.65 1.0
5. I believe the type of tasks I perform at work represent something about me personally
.66 .72 1.0
10. I try to show that I am dedicated when performing on the job tasks
.62 .49 .51 1.0
Note: All correlations are significant at the .01 level
Inter item Correlation MatrixTask Congruence
Item 2 3 6 7 8 92. I am trying to find a job that allows me to perform tasks other than those I perform on this job.
1.0
3. I stay at this job because I am dedicated to the tasks I perform.
.45 1.0
6. I feel no personal attachment to the tasks I perform on the job
.54 .62 1.0
7. I would be more committed to this job if the tasks were more meaningful to me.
.58 .44 .45 1.08. The tasks I perform on the job are not personally important to me.
.53 .70 .55 .50 1.0
9. The only reason I perform the tasks on this job is because I have to.
.44 .67 .52 .51 .66 1.0
Note: All correlations are significant at the .01 level.
Table 9
21

Item Total CorrelationsTask Devotion
Item # Corrected Item-Total Correlation
Item Mean Item SD
1 .76 4.3 .904 .75 3.9 1.025 .75 3.7 1.2110 .60 4.4 .81
Note: All correlations are significant at the .01 level.
Item Total CorrelationsTask Congruence
Item # Corrected Item- Total Correlation
Item Mean Item SD
2 .63 3.5 1.263 .72 3.7 1.126 .67 3.7 1.147 .62 3.2 1.218 .74 3.6 1.209 .70 3.7 1.03
Note: All correlations are significant at the .01 level.
Chapter 6: Construct Validity
22
Content and Substantive Validity
The researchers originally planned on developing a survey that would assess task
commitment as well as organizational commitment. The original survey contained 50
items, 25 assessing organizational commitment and 25 assessing task commitment.
These fifty items were given to ten industrial psychology graduate students, considered
subject matter experts (SMEs), for item retranslation. During this process, the panel of
SMEs was instructed to read each item and determine which dimension they felt it
belonged. 45 items were originally retained as only five items did not reach the 80%
agreement cut-off during the retranslation process. The researchers then decided to
eliminate all items that fell below a 100% agreement cutoff. The researchers carefully
reviewed the data and found that no attenuation occurred when the more stringent cut-off
was established.
A final sample of 28 items remained after the application of this cutoff. It should
be noted that after test administration and analysis of the data, the researchers elected to
eliminate the organizational commitment items, as they were redundant to other included
measures. This reduced the number of items to 14.
A content validity ratio (CVR) can be used to estimate the degree to which SMEs
agree items are representative of the content domain (Murphy and Davidshofer, 2001).
These values are averaged to produce a content validity index (CVI). For this survey all
CVRs were 1.0, as only items with 100% SME agreement were retained, thus leading to a
CVI of 1.0. Table 10 contains a table of specifications. Item numbers correspond to the
final 10 item version of the MCLTCI found in Appendix I.
Table 10
23

Table of Specifications
Task Devotion Task Congruence
Feelings/attitudes/beliefs 1, 4, 5 6, 7, 8, 9
Behaviors 10 2, 3
Structural Validity
The original 14 item MCLTCI became a 10 item measure through a series of
exploratory and confirmatory factor analyses. A principal components factor analysis
was conducted and it was determined that the MCLTCI contained two factors. Four of
the original items either did not load on one of the two factors at a high enough level (.30
or higher), or loaded at a similar level for both factors. These four items were deleted
one at a time based on the factor loading (lowest loading deleted first), and all four were
subsequently deleted from the factor structure. After these deletions, a maximum
likelihood factor analysis was applied to the 10-item MCLTCI. The Kaiser-Myer-Olkin
measure of sampling adequacy was high across all items, KSO-MSA= .87. Two factors
were extracted using a varimax rotation, and the rotation converged in four iterations.
Four items loaded onto the first factor (Task Devotion), while six items loaded onto the
second factor (Task Congruence). Factor loadings were high across both factors, falling
in the range of .66 to .86 for Task Devotion and .60 to .77 for Task Congruence. This
final factor solution explained 59.4 % of the variance. Task Devotion explained 31.6%
of the variance with an eigenvalue of 3.17, while Task Congruence explained 27.8% of
the variance with an eigenvalue of 2.78. Table 11 contains all of the items that will
represent the final survey (1-10), the factor loadings for each item, as well as the factor
24
means, standard deviations, percentage of variance explained, eigenvalues, and alpha
levels.
Table 11Factor Loadings
Items Task Congruence Task Devotion
1. I am devoted to performing the tasks .10 .86associated with my job.
4. I identify with the type of tasks I perform .30 .74
5. I believe the tasks I perform on the job represent .39 .75something about me personally.
10. I try to show I am dedicated when performing .26 .66on the job tasks.
2. I stay at this job because of the tasks I perform .60 .44
3. I am trying to find a job that allows me to perform .61 .20tasks other than those I perform on this job. ®
6. The tasks I perform on the job are not personally .77 .29important to me. ®
7. I feel no personal attachment to the tasks I perform .74 .36on the job. ®
8. The only reason I perform the tasks on this job is .75 .24I have to. ®
9. I would be more committed to this job if the tasks .65 .09if the tasks were more meaningful to me personally. ®
Mean: 21.40 Mean: 16.32 SD: 5.42 SD: 3.33
Eigenvalue: 2.78 Eigenvalue: 3.17 % explained variance: 27.82 % explained variance: 31.65
Alpha: .88 Alpha: .86
25
External Validity
In order to assess external validity, various measures were administered
simultaneously with the MCLTCI. This measure was expected to correlate with job
satisfaction (JS), career commitment (CC), organizational commitment (OCQ), and in-
role behaviors (IRB). Divergence is expected to occur between the MCLTCI and the
OCBI and OCBO. Table 13 contains the correlation matrix for these convergent and
divergent tests for both subscales of the MCLTCI. Cronbach alphas are provided for
each subscale along the main diagonal (bold).
Table 12Correlation Matrix
Task Devotion
TD JS CC OCQ OCBI OCBO IRBTD .86JS .53 .89CC .50 .75 .87
OCQ .53 .70 .61 .83OCBI .30 .37 .29 .33 .75OCBO .48 .60 .43 .65 .61 .74
IRB .27 .38 .30 .43 .49 .62 .77Note: All correlations are significant at the .01 level (2-tailed).
Correlation MatrixTask Congruence
TC JS CC OCQ OCBI OCBO IRBTC .88JS .81 .89CC .76 .75 .87
OCQ .70 .70 .61 .83OCBI .36 .37 .29 .33 .75OCBO .57 .60 .43 .65 .61 .74
IRB .38 .38 .30 .43 .49 .62 .77Note: All correlations are significant at the .01 level (2-tailed).
26
All of the subscales that were administered produced strong reliabilities with
alphas ranging from .74 to .89. All discovered correlations can therefore be assumed to
be based on reliable measures of the proposed constructs. TD and TC were significantly
positively correlated with each other at a moderate level, r = .58, p < .01. Excellent
evidence for convergent validity can be derived from these charts. Task Devotion and
Task Congruence were positively correlated with JS, CC, IRB, and the OCQ as expected
(see Table 13 for correlations). However, evidence for divergence is lacking, as it was
expected that TD and TC would not be related to the OCBI and OCBO. These
researchers contend that divergence would have likely been discovered if a different
measure was used. This research was flawed in that the researchers used a measure for
divergence which was not well suited. A further review of the literature showed that
most operational definitions of commitment showed low to moderate correlations with all
OCB dimensions, including the IRB, OCBO, OCBI and others ( LePine, Erez, &
Johnson, 2002). Future research should include a more divergent measure, such as a job
burnout inventory, to determine if divergent validity can be established.
Incremental Validity
After review of this correlation matrix the researchers attempted to determine if
TD or TC could contribute incremental variance to job satisfaction. Multiple regression
analysis was used to determine if TC or TD could contribute unique variance to job
satisfaction above and beyond CC and OCQ. It was discovered that TC contributed
significant variance above and beyond that of CC and OCQ when entered together, r2change
= .07, Fcha (1, 79) = 19.64, p < .001. This finding, in conjunction with the fact that TC is
the highest correlate of JS (.81), implies that an organization would have a better chance
27
at enhancing job satisfaction through practices that were focused on task commitment
rather than organizational or career commitment. This would suggest that increasing the
degree to which a task is personally important to an individual could be more productive
than increasing the organizational ties. This may be achieved by educating the employee
as to how his or her task performance directly benefits society as a whole, or has larger
and more meaningful value. Organizations can use this survey to help establish the
degree to which they should be concerned about employee task commitment. This could
also be established with a survey on job satisfaction in a labor intensive setting. The
main implication here is that labor-intensive organizations should focus on practices that
reduce barriers in task performance and strive to find ways to make tasks personally
relevant to as many employees as possible.
Chapter 7: Extra Validity Concerns
28
Due to the discrepancy that was detected with age discussed in the norms chapter,
the variable age was evaluated to determine if differential validity existed based on age.
Specifically, a procedure involving z-score transformations and hierarchical regression
analysis was conducted. It was discovered that age has a moderating effect on the task
commitment/job satisfaction relationship. For Task Devotion there was significant
differential validity in terms of age, r2cha = .17; F cha (1,79) = 26.17, p < .001. Significant
differential validity in job satisfaction on the basis of age was also detected for Task
Congruence, although to a much lower degree, r2cha = .02; F cha (1,78) = 4.0, p < .05.
These findings suggest that the job satisfaction and task commitment relationship
may not be generalizable across all age groups. Furthermore, this evidence limits the
possible uses of this test. It is not suggested by the test developers that this test be
applied to any administrative employment decisions. This test should only be applied to
uses involving organizational enhancement. Further research should be conducted to
address this issue, and help make necessary corrections.
It should also be stated that the means for all of the subscales administered in this
questionnaire were on the high (see Chapter 4). This is likely due to the fact that most
participants received the survey at their place of work, or they were required to return the
completed survey to the place of work. Due to time and budgetary constraints, the
researchers were not able to administer the survey to large groups outside of the work
location. In all cases, special boxes were provided for the employees to hand in
completed surveys. This was an attempt to reduce respondent anxiety, but it is possible
that respondents could have provided more favorable answers for fear that others
(supervisors, managers) would see their responses. In the future, it would be ideal to
29
administer this survey away from the work area, and have respondents return surveys to a
neutral location.
Chapter 8: References
30

Anderson, Stella E. & Williams, Larry J. (1991). Assumptions about unmeasured
variables with studies of reciprocal relationships: the case of employee attitudes.
Journal of Applied Psychology, 77, 638-650.
Herscovitch, Lynne & Meyer, John P. (2002). Commitment to organizational change:
extension of a three-component model. Journal of Applied Psychology, 87,
474-487.
Huselid, Mark A. & Day, Nancy E. (1991). Organizational commitment, job
involvement, and turnover: A substantive and methodological analysis. Journal
of Applied Psychology, 76, 380-391.
Irving, Gregory P., Coleman, Daniel F., Cooper, Christine L. (1997). Further
assessments of a three-component model of occupational commitment:
Generalizability and differences across occupations. Journal of Applied
Psychology, 82, 444-452.
LePine, Jeffrey A., Erez, Amir, Johnson, Diane E. (2002). The nature and
dimensionality of organizational citizenship behavior: a critical review and meta-
analysis. Journal of Applied Psychology, 87, 52-65.
Meyer, John P., Allen, Natalie J., Gellatly, Ian R. (1990). Affective and continuance
commitment to the organization: evaluation of measures and analysis of
concurrent and time-lagged relations. Journal of Applied Psychology, 75, 710-
720.
Meyer, John P., Stanley, David J., Herscovitch, Lynne, Topolnytsky, Laryssa. (2002).
Affective, continuance, and normative commitment to the organization: a meta-
31
analysis of antecedents, correlates, and consequences. Journal of Vocational
Behavior, 61, 20-52.
Mobley, W. H., Griffeth, R. W., Hand, H.H., Meglino, B.M. (1979). Review and
conceptual analysis of the employee turnover process. Psychological Bulletin, 86,
493-522.
Murphy, K. R., & Davidshofer, C. O. (2001). Psychological testing: Principles an
Applications (5th ed.). Upper Saddle River, NJ: Prentice-Hall.
Podsakoff, MacKenzie, Paine, Bacharach. (2000). Organizational citizenship behaviors:
A critical review of the theoretical and empirical literature and suggestions for
future research. Journal of Management, 26, 513-563.
Appendix I
32
This appendix contains the final instrument as it would be
administered to respondents, and final data analyses.
Appendix II
33

This appendix contains the survey as it was administered to the validation
sample.
34