Embed Size (px)
Citation preview

ORGANIZATIONAL HEALTH AND MINDFULNESS AS
PREDICTORS OF SCHOOL EFFECTIVENESS:
USING THE BALANCED SCORECARD
by
BARRY WYATT WILLIAMS
A DISSERTATION
Submitted in partial fulfillment of the requirements for the degree of Doctor of Education
in the Department of Educational Leadership, Policy, and Technology Studies
in the Graduate School of The University of Alabama
TUSCALOOSA, ALABAMA
2010

Copyright Barry Wyatt Williams 2010 ALL RIGHTS RESERVED

ii
ABSTRACT
This study tested the idea that schools using the Balanced Scorecard, a management
monitoring program, would achieve higher school performance compared to schools not using
the Balanced Scorecard. The theory argued that close attention to school operations would result
in higher test scores for students, a better school climate, and a greater degree of mindfulness
than would be the case in non-Balanced Scorecard schools.
The Study examined 61 schools from 6 independent school districts in the state of
Georgia. Participants involved in the study completed either the Organizational Climate Index
(OCI) (Hoy, 2001) or the M-Scale survey (Hoy, 2001). Some participants completed both
surveys. OCI surveys were completed by 1,102 participants and M-Scale surveys were
completed by 1,090 participants. Reliability coefficients for the teacher level analysis of the OCI
and M-Scale were performed. To examine school effectiveness, two regression analyses were
conducted: one for the 3-year average math score and one for the 3-year average ELA score. To
examine school climate, four independent samples t tests were performed, one for each of the
four OCI scales. Finally, to examine the M-scale scores an independent samples t test was
performed.
Use of the Balanced Scorecard had mixed success. Language scores were higher, but
there appeared to be no effect on math scores. While collegial leadership and professional
teacher behavior were significant higher in the scorecard schools than in non-scorecard schools,

iii
no significant relationship was found between use of the scorecard and either academic press or
institutional vulnerability. Scorecard schools were more mindful than non-scorecard schools.

iv
DEDICATION
This dissertation is dedicated to my wife, Melanie S. Williams, and my daughters, India
Elizabeth and Alexis Dianne.

v
ACKNOWLEDGMENTS
I am happy to have this opportunity to thank the many professional colleagues, faculty
members, and friends who have helped and encouraged me during this project. I’d like to thank
Dr. J. K. Baum for breathing life into my dying academic soul. Without his confidence, none of
this would be possible. He made me feel the heat and see the light. Thank you, Dr. Baum.
I would like to thank Dr. C. John Tarter, the chairman of this dissertation, for sharing his
time and expertise. His guidance and challenging nature caused me to stretch and grow. Dr.
Tarter’s knowledge of the current literature is amazing, intimidating at times, and is a
tremendous asset. Thank you, Dr. Tarter, for demanding excellence. I would also like to thank
Dr. Angela Benson, Dr. David Dagley, Dr. Rose Newton, and Dr. Jane Newman for serving as
dissertation committee members. They encouraged and questioned at the appropriate times.
I also need and want to thank Dr. Laura Phillips for her assistance and editing skills
during this project. Her quiet encouragement pushed me to do this. Thank you, Dr. Phillips.
Additionally, I wish to thank my many classmates at The University of Alabama. Any
academic endeavor is easier when fellow students turn to colleagues. I have shared ideas and
suffered with many along the way and hope I have given as much as I have received. Special
thanks are offered to Don Watts and Cathy Terry Watts for collaborating, sharing, and
commiserating every step along the way. I also offer them my congratulations for finishing the
drill.
I was blessed with excellent assistant principals during my tenure as principal. Becky
Waldrop, Jan Baggett, Marti Robinson, Travis Thomas, and Jerry Bell, each helped me grow and

vi
allowed me to embark on this project. I will always contend that the assistant principal in any
school is the most important person, other than the students, in attendance on any given day. I
appreciate each one of you for the special talents you brought to the office every day. I learned a
great deal from each of you.
This project would not be possible without many sources of support. I wish to
acknowledge some important men and women in my life. My mother and father have loved me
all my life. I could not ask for more. My two daughters, India Elizabeth and Alexis Dianne,
deserve high praise for enduring this project. I hope that they remember this well when they
endure the challenges that college brings. I hope they understand by my example that nothing
worth doing is ever easy.
My wife Melanie is deserving of more thanks than I can give. We have been in college
together most of our married life. We were undergraduate and master’s students together and
with her blessings and support I was able to continue on. This project has required her to
experience firsthand what being a single parent is like. Melanie never complained or balked
when I decided to start this journey. She continues to be my rock and I love her dearly.
Finally, Colossians 3:23 instructs me to do whatever I do “as working for the Lord, not
for men.” I must confess that I have not always been true to this commandment while working
on this project. I can, however, proclaim with all certainty He never left me during this process.
The power and love of God made this possible. Thanks be to God.

vii
CONTENTS
ABSTRACT.................................................................................................................................... ii
DEDICATION............................................................................................................................... iv
ACKNOWLEDGMENTS ...............................................................................................................v
LIST OF TABLES......................................................................................................................... xi
LIST OF FIGURES ...................................................................................................................... xii
I INTRODUCTION.....................................................................................................................1
Background of the Study ......................................................................................................2
Need and Purpose .................................................................................................................2
Definition of Concepts .........................................................................................................3
Definition of Terms ..............................................................................................................6
Scope and Limitations ..........................................................................................................7
Assumptions .........................................................................................................................8
Research Questions ..............................................................................................................9
Hypotheses ...........................................................................................................................9
Summary...............................................................................................................................9
II REVIEW OF LITERATURE..................................................................................................11
Introduction ........................................................................................................................11
Conceptual Framework ......................................................................................................11
The Balanced Scorecard .....................................................................................................13
Core Principles of the Balanced Scorecard...................................................................14

viii
The Balanced Scorecard in the Non-Profit Setting.......................................................17
School Applications of the Balanced Scorecard...........................................................18
How the Balanced Scorecard Works ............................................................................19
S.M.A.R.T. Goals .........................................................................................................25
Section Summary..........................................................................................................28
Effectiveness.......................................................................................................................28
A.G.I.L. Model of Effectiveness...................................................................................29
Measuring Effectiveness in Schools .............................................................................30
Effectiveness Measures in the Study at Hand...............................................................32
Section Summary..........................................................................................................32
Organizational Climate.......................................................................................................33
The Development of Organizational Climate Measures...............................................36
Organizational Climate Description Questionnaire......................................................36
Organizational Health Inventory ..................................................................................37
Organizational Climate Index.......................................................................................39
Section Summary..........................................................................................................41
Mindfulness ........................................................................................................................41
Individual Mindfulness .................................................................................................42
Characteristics of Mindfulness in Organizations..........................................................43
Preoccupation with Failure ...........................................................................................43
Reluctance to Simplify..................................................................................................44
Sensitivity to Operations...............................................................................................45
Commitment to Resilience............................................................................................46

ix
Deference to Expertise..................................................................................................47
HROs in the School Setting ..........................................................................................48
Mindfulness in Action: The Plan, Do, Check, Act Cycle.............................................49
Mindfulness and Teaming ............................................................................................51
Section Summary..........................................................................................................53
Theoretical Framework ......................................................................................................54
Rationale for the Study.......................................................................................................56
Hypotheses .........................................................................................................................57
Chapter Summary...............................................................................................................57
III METHODOLOGY..................................................................................................................58
Introduction ........................................................................................................................58
Design.................................................................................................................................58
Participants and Sampling Procedures ...............................................................................59
Study Instruments ...............................................................................................................59
Data Collection...................................................................................................................61
Data Analysis......................................................................................................................61
IV RESULTS................................................................................................................................63
Introduction ........................................................................................................................63
Descriptive Statistics ..........................................................................................................64
Analysis of Reliability........................................................................................................66
Hypothesis 1 Testing ..........................................................................................................67
Hypothesis 2 Testing ..........................................................................................................70
Hypothesis 3 Testing ..........................................................................................................71

x
Summary of Findings .........................................................................................................71
V DISCUSSION .........................................................................................................................73
Implications ........................................................................................................................73
Academic Achievement................................................................................................73
Mindfulness, Collegial Leadership, and Professional Teacher Behavior .....................82
Achievement Press and Institutional Vulnerability ......................................................83
Limitations of the Study .....................................................................................................84
Recommendations ..............................................................................................................85
Conclusions ........................................................................................................................87
REFERENCES ..............................................................................................................................88
APPENDICES:
A SAMPLE BALANCED SCORECARD.............................................................................93
B OCI .....................................................................................................................................95
C M-SCALE...........................................................................................................................98

xi
LIST OF TABLES
1 Descriptive Statistics for Math and ELA Scores as a Function of the Use of the Balanced Scorecard .................................................................................................................64 2 Descriptive Statistics for OCI Scales as a Function of the Use of the Balanced Scorecard.................................................................................................................................65 3 Descriptive Statistics for Mindfulness Scale as a Function of the Use of the Balanced Scorecard.................................................................................................................................66 4 Reliability Coefficients for Composite Measures ...................................................................67 5 Results of Regression Analysis on Three-Year Average Math Scores ..................................68 6 Results of Regression Analysis on Three-Year Average ELA Scores....................................69 7 Results of Independent Samples t Tests Comparing Schools that Used the Balanced Scorecard to Schools that Did Not on the OCI Scales ............................................................71 8 Results of Independent Samples t Tests Comparing Schools that Used the Balanced Scorecard to Schools that Did Not on the Mindfulness Scale.................................................71
xii
LIST OF FIGURES
1 BSC Column 1, Goal Area 1....................................................................................................20
2 BSC Columns 1 & 2, Goal Area 1, & Strategic Objectives.....................................................21
3 BSC Columns 1 through 3, Goal Area 1, Strategic Objectives, and Performance Measures ..................................................................................................................................22
4 BSC Columns 1 through 4, Goal Area 1, Strategic Objectives, Performance Measures, and Unit of Measure.................................................................................................................23
5 BSC Columns 1 through 5, Goal Area 1, Strategic Objectives, Performance Measures, Unit of Measure, and Trend Data.............................................................................................24
6 BSC Columns 1 through 6, Goal Area 1, Strategic Objectives #1 and #2, Performance Measures, Unit of Measure, Trend Data, and Target..........................................25

1
CHAPTER I
INTRODUCTION
At first glance, monitoring for school improvement may seem an easy enough task.
Under the No Child Left Behind Act, schools in the state of Georgia are assigned status as
defined by whether or not they make Adequate Yearly Progress (AYP). Furthermore, schools
failing to make AYP for consecutive years can fall into the Needs Improvement (NI) category,
with varying levels depending on the number of years they fail to meet AYP. A brief glance at
any school’s AYP report offers a final score. However, this score constitutes only one small part
of the overall picture. Not surprisingly, the climate of the school and performance of faculty can
suffer when schools fail to meet the AYP mark. Principals may struggle to find ways to improve
climate and encourage teachers to refocus on meeting the benchmark. Conversely, schools who
meet AYP may develop a false sense of security, resulting in a tendency to relax and let down
their collective guard. Schools need some method of measurement that allows them to avoid
each situation. The problem with current school improvement plans is that they fail to
accomplish this task. Instead, they are reviewed at the year’s end and offer little more than a
summative report. Many school improvement plans offer no strategy at all. Instead, they relate
only what happened during the previous school year and provide no means for improvement
during the course of the next school year.

2
Background of the Study
Although administrators and teachers can state with certainty whether or not their school
is an AYP school, a complete picture often cannot be painted. Staff members cannot give hard
facts based on actual data to describe their particular schools. Because teachers cannot or do not
analyze current student test data, schools fall into one of two traps. Teachers either fail to
understand the actual state of the school and recognize that they are merely NI and feel hopeless,
or they gain a sense of false security because they are an AYP school and grow complacent. In
either case the faculty operates without a strategic focus.
Need and Purpose
Because a pervasive outcome measure has the effect of constantly monitoring
performance across such organizational characteristics as organizational climate and overall
faculty mindfulness, the balanced scorecard approach is an effective strategy for school
improvement. The concept of mindfulness is of theoretical interest here because the balanced
scorecard may represent an application of the general notion of mindfulness. The constant
scrutiny of the kind captured by mindfulness and represented by the balanced scorecard should
have a relationship to organizational health. This assumption is based on the belief that a
healthier organization is a more mindful organization. This leads to the assumption that the
balanced scorecard is a manifestation of mindfulness and that overall organizational health and
the balanced scorecard are compatible with each other. As Kaplan and Norton (1996a)
emphasize, the balanced scorecard is not a static tool for measuring success. It is, rather, a tool
that provides a continual progress monitoring device making it amenable to the concept of
mindfulness. Schools that use the balanced scorecard should have higher levels of mindfulness,

3
healthier climates, and exhibit more effective outcomes than schools that do not use the balanced
scorecard approach.
The purpose of this study was to determine if the use of the balanced scorecard can
provide schools with the necessary tools to monitor progress more accurately and increase
organizational climate, mindfulness, and overall effectiveness. This was accomplished by
conducting a comparison of schools that utilize the balanced scorecard against schools that do
not use the balanced scorecard. The structure of this tool will provide schools with the
opportunity to refine their target for success and use leading and lagging indicators to monitor
progress. It is believed that this will result in better organizational health and an increased level
of mindfulness in the school environment. Furthermore, it is believed that schools using the
balanced scorecard will be more effective academically than schools that do not.
Definition of Concepts
The balanced scorecard is a measurement and management system that allows
organizations to clarify their vision and strategy. “The Balanced Scorecard assists organizations
in overcoming two key issues: effective organizational performance measurement and
implementing strategy” (Niven, 2002, p. 3). Strategy is centered on strategic goals, called
S.M.A.R.T. goals, which are aligned to the organization’s mission. S.M.A.R.T. goals are
described as goals that are specific, measurable, attainable, relevant, and time-oriented. Because
the balanced scorecard uses leading and lagging indicators, it allows organizations to convert
reports into actions that can help them better achieve organizational goals. While lag indicators
represent results of actions previously taken, lead indictors are used to drive performance and
help organizations translate strategy into action. Use of the balanced scorecard forces schools to

4
respond immediately to current problems by executing a continuous school improvement model.
One such model is the 8-step process introduced by Davenport and Anderson (2002). The 8-step
process gives a rapid intervention to problems identified by using the balance scorecard. This
ability to identify and respond to problems is characteristic of organizations that are considered
mindful.
Mindfulness is accurately defined as the continuing scrutiny present is some
organizations today (Weick & Sutcliffe, 2001). While mindless organizations have a tendency to
focus on success and run the risk of growing complacent, mindful organizations not only
anticipate problems, they actively look for them. “Mindfulness is a paradox of sorts: it sees
problems as opportunities and views successes as problematic; it is both optimistic and
skeptical” (Hoy, 2003, p. 97). Problems are viewed as opportunities for growth in mindful
organizations. Mindfulness is said to be high in highly reliable organizations (HROs) (Weick &
Sutcliffe, 2001). HROs exhibit five distinct characteristics. They are a preoccupation with
failure, a reluctance to simplify, sensitivity to operations, a deep commitment to resilience in the
face of adversity, and deference to front line expertise in the event of crisis.
Broadly defined, organizational climate is “a relatively enduring quality of the school
environment that is experienced by participants, affects their behavior, and is based on their
collective perceptions of behaviors in schools (Hoy & Miskel, 2005, p. 185). It is important to
draw a distinction between culture and climate. While culture more commonly refers to
organizational norms and is manifest in patterns of behavior, climate is based on the perceptions
of individuals. Climate is a subset of culture. The concept broadly defines life in school
organizations and, in this study, is comprised of four subtests. These four subtests are collegial
leadership, professional teacher behavior, achievement press, and institutional vulnerability.

5
Collegial Leadership is present when the principal is focused on meeting both the social needs of
the faculty and achieving the goals of the school. Professional teacher behavior exists where
collegiality and respect among teachers are high. Teachers also exhibit higher levels of
commitment to students. A school that sets and achieves high academic standards has high
achievement press. Teachers, parents, and students buy into these academic standards. Finally,
low institutional vulnerability reflects the principal and teachers enjoying a higher level of
immunity from external pressures.
Talcott Parsons states that all social systems or subsystems must meet four functional
needs in order to continue (Gingrich, 2002). These functional needs can be remembered by the
acronym AGIL. The four needs are adaptation, goal attainment, integration, and latency. It is
recognized that the four are interrelated and interdependent. Likewise, school effectiveness
cannot be defined by a single measure. Hoy and Miskel (2005) have expanded upon this work
and placed the effectiveness definition into a broad conceptual framework. School climate,
student attitude, and stockholder perceptions are all elements of effectiveness. Hoy and Ferguson
(1985) point out that “research on effective schools is limited by the same weaknesses as the
research on effective organizations--the absence of both a sound theoretical framework and a
careful definition and measurement of the concept” (p. 117). For these reasons they advocate for
the Parsonian model when measuring effectiveness in schools. For the purpose of this study
school effectiveness was defined and measured using the AGIL method supplied by Parsons and
expanded upon by Hoy and Ferguson.

6
Definition of Terms
The following additional definitions are provided as a means of insuring understanding
and uniformity of the specified terms throughout the study. The definitions are consistent with
the literature reviewed and are expressed as such. They are not exclusively the words of the
researcher.
Balanced Scorecard is defined as a management system (not only a measurement system)
that enables organizations to clarify their vision and strategy and translate them into action
(Kaplan & Norton, 1996b).
Effectiveness is the extent to which any organization as a social system, given certain
resources and means, fulfills its objectives without incapacitating its means and resources and
without placing undue strain upon its members (Hoy & Ferguson, 1985, p. 121). It is measured
in this study as performance on the Math and ELA scores on the Georgia C.R.C.T. and
graduation test, the degree of organizational mindfulness, and the degree of collegial leadership,
professional teacher behavior, academic press, and institutional vulnerability.
Mindfulness is the extent to which teachers and administrators in a school carefully and
regularly look for problems, prevent problems from becoming crises, are reluctant to
oversimplify events, focus on teaching and learning, are resilient to problems, and defer to
expertise (Hoy, 2001). It is measured in this study as the score on the M-Scale. (See Appendix C)
Organizational Climate describes a harmony present when the institutional,
administrative, and teacher levels work in concert; and the school meets functional needs as it
successfully copes with disruptive external forces and directs its energies toward its mission
(Hoy, 2001). Dimensions of organizational climate include achievement press, collegial

7
leadership, institutional vulnerability, and professional teacher behavior. It is measured in this
study as the score on the OCI. (See Appendix B)
Achievement Press describes a school that sets high but achievable academic standards
and goals. Students persist, strive to achieve, and are respected by each other and teachers for
their academic success. Parents, teachers, and the principal all exert pressure for high standards
and school improvement (Hoy, Smith, &, Sweetland, 2002, p. 42).
Collegial Leadership is defined as principal behavior directed toward both toward
meeting the social needs of the faculty and achieving the goals of the school. The principal treats
teachers as professional colleagues, is open, egalitarian, and friendly, but at the same time sets
clear teacher expectations and standards of performance (Hoy et al., 2002, p. 42).
Institutional Vulnerability is defined as the extent to which the school is susceptible to a
few vocal parents and citizen groups. High vulnerability suggests that both teachers and
principals are unprotected and put on the defensive (Hoy et al., 2002, p. 42)
Professional Teacher Behavior is marked by respect for colleague competence,
commitment to students, autonomous judgment, and mutual cooperation and support (Hoy et al.,
2002, p. 42).
Scope and Limitations
There were a number of limitations inherent to this study. First, the design and regular
use of a particular school’s balanced scorecard could not be monitored by the researcher. The
study obviously focused on some schools that use the balanced scorecard and others that do not.
It is recognized that among the schools that use the balanced scorecard there is variation in how
much of the balanced scorecard is implemented and a variation in regards to how it is monitored.

8
This study did not measure the degree of implementation as a predictor of school performance.
Rather, it attempted to show that by virtue of committing to the balanced scorecard, a school
would improve because it had made a formal decision to increase the scrutiny of its operations
and would be more responsive to needed changes. This is a result of the balanced scorecards
design. Regardless of what other tools non-scorecard schools use, it is believed the balanced
scorecard is superior.
Second, due to the possible failure of respondents to answer surveys, results may not
accurately reflect the opinions of all members of the population studied. Third, the study is in
one southeastern state, so the findings may not be easily generalized. Fourth, because some
schools may already have continuous monitoring systems that do not use the balanced scorecard
in place, accuracy of the comparison may be compromised. There is an inherent limitation in
doing cross-sectional survey research because no account is made of what changes might occur
over time. Finally, survey research is limited by the reliability and validity of the measures.
Assumptions
There were several assumptions held by the researcher in regard to this study. First, it
was assumed that all surveys collected were answered honestly and accurately. Second, it was
assumed that all survey items were explained to and understood by all respondents. Third, it was
expected that about one half of the schools participating in the study understood the development
and implementation of the balanced scorecard approach and therefore assumed that one half did
not.

9
Research Questions
RQ1: Are schools that use the balanced scorecard more effective than schools that do not
use the balanced scorecard?
RQ2: What is the relationship of a balanced scorecard to school climate and its
dimensions?
RQ3: What is the relationship of the balanced scorecard to mindfulness?
Hypotheses
In the following chapters a review of the literature will be presented. A theory describing
the relationship of the balanced scorecard, organizational climate, mindfulness, and school
effectiveness will be developed. To answer the research questions, the following hypotheses will
test the theory.
H1: Schools implementing the balanced scorecard are more effective than schools not
using the balanced scorecard.
H2: Schools implementing the balanced scorecard will have higher levels of
organizational climate along all four dimensions of the OCI than schools not using the balanced
scorecard.
H3: Schools implementing the balanced scorecard will have higher levels of mindfulness
than schools not using the balanced scorecard.
Summary
School improvement is often limited in its impact due to the inflexible nature of the
school improvement plan. The balanced scorecard approach to school improvement affords

10
schools the opportunity to design and implement plans that are as useful and continuously
current as the instruments on a car’s dashboard. Constant monitoring of the various indicators
may create a more mindful attitude. Mindful schools make decisions based on a continuing
scrutiny that invites, if not seeks, problems. They view these problems as opportunities to
“welcome the bad day” (Hoy, 2003) and thus make adjustments to the status quo. This collective
agility and resolve may improve teacher professionalism and collegial behavior and directly
impact the climate of academic expectations. The focus of this study was to demonstrate the
connection of these variables.

11
CHAPTER II
REVIEW OF LITERATURE
Introduction
This chapter will introduce the concepts of the balanced scorecard, mindfulness,
organizational climate, and effectiveness. An argument will be presented to show that all three of
these concepts capture different elements of school effectiveness. Finally, it will be argued that
the use of the balanced scorecard leads to more effective schools because the internal operations
of the school support monitoring and improving performance. Thus, schools that use the
balanced scorecard will be more effective generally and with respect to mindfulness and climate
specifically. The following review of literature will discuss the balanced scorecard, mindfulness,
school organizational climate, school effectiveness, and the relevance of the four to each other.
The theory that binds these concepts will be presented as will the hypotheses that test the theory.
Conceptual Framework
The concept of this study is that the balanced scorecard will have a positive correlation to
school effectiveness, school climate, and mindfulness in the school. Each of the constructs
mentioned above have been defined in chapter I and will be expanded upon in the review of
literature section of this chapter. The study will attempt to show that all four work
interdependently.
Kaplan and Norton (1996b) define the balanced scorecard as a management system that
enables organizations to clarify their vision and strategy and translate them into action. They call

12
attention to the fact that the balanced scorecard is not a static tool for measuring success. Rather,
the balanced scorecard is a tool that provides organizations a continual progress monitoring
device. The conceptual framework suggests that because the balanced scorecard stresses putting
strategy into action its use will improve schools effectiveness, climate, and mindfulness.
Effectiveness will be defined not only as an organization achieving goals but also
demonstrating efficiency in the operations while achieving goals. This definition is based on the
work of Hoy and Ferguson (1985), which is an expanded definition originally provided by
Talcott Parsons. The multi-dimensional nature of this definition makes it amenable to the
balanced scorecard approach because it provides a more complete measure of success.
The definition of climate will be consistent with that provided by Hoy and Miskel (2005).
Climate is “the relatively enduring quality of the school environment that is experienced by
participants, affects their behavior, and is based on their collective perception of behavior in
school” (Hoy & Miskel, 2005, p. 185). The study will link climate generally to the AGIL
paradigm elaborated on by Hoy and Ferguson (1985) and more specifically to integration and
latency.
For the purpose of this study mindfulness will be defined using the definition provided by
Weick and Sutcliffe (2001) and expanded upon by Hoy (2001). Mindfulness will be shown to be
complementary to effectiveness and climate because all three are concerned with problem
solving, collaboration, and anticipating the unexpected. It will be further established that
mindfulness works to strengthen the organization at the individual level but also can have a
positive impact on the overall quality of the organization. The study will reference Hoy et al.
(2006) to show that organizational mindfulness leads to overall effectiveness because individual
participants become more understanding of effective school organization.

13
The conceptual framework of this study is that the balanced scorecard, mindfulness, and
a positive organizational climate all work jointly to make a school more effective. The intricate
nature of measuring effectiveness is in part why the balanced scorecard can be useful. Because
the balanced scorecard enables more immediate responsiveness, mindfulness and organizational
climate will be positively impacted by its use.
The Balanced Scorecard
Many schools in America today borrow methods of operation and management tools
from the business world. While some of these methods and tools may seem to be out of place or,
at best, a poor fit, others have helped school systems and individual schools progress. One such
example is the balanced scorecard. The balanced scorecard was first introduced in 1992 to help
businesses better monitor performance (Kaplan & Norton, 1992). The balanced scorecard was
designed to translate an organization’s strategy into terms that could be understood and acted
upon by everyone in the organization. Toward that end, the first balanced scorecard used the
language of measurement to define the meaning of strategic concepts such as quality, customer
satisfaction, and growth. This important tool gave birth to the development of a one-page
strategy summary known as a strategy map. These two tools have worked their way into the field
of education. Although not yet widely used, the popularity of the balanced scorecard is growing.
The balanced scorecard is built around an organization’s mission. Main goal areas that
support the mission are identified and strategic objectives are assigned to each. Each strategic
objective corresponds to units of measure, trend data, and an annual measurable goal. The use of
the balanced scorecard forces school systems and individual schools to act immediately upon
data linked specifically to the goals established within the document itself.

14
The immediacy of the response elicits the use continuous school improvement model.
Many school systems use, for example, the 8-step process of continuous improvement
(Davenport & Anderson, 2002), which identifies problems using data similar to that presented by
the balanced scorecard. Resolutions follow a standard problem-solving sequence in which
solutions are proposed based on data and various remedies are implemented and monitored. The
value of any problem-solving sequence is, however, in applying useful data drawn from a
continuing source of information; hence, its connection to the balanced scorecard. Thus, it is not
the 8-step process that is important; rather, it is the kind of sequential decision making that using
the balanced scorecard virtually forces on the organization. As the data become available, the
school cannot simply turn its collective head and ignore relevant information.
The business world has long recognized that in order to function effectively, an
organization has to be aligned around its strategy. The challenge is to align management
processes and systems to strategy (Kaplan & Norton, 2001b). In response to the need for
strategic enterprise management, the Balanced Scorecard Concept was introduced in a 1992
Harvard Business Review article (Kaplan & Norton, 1992).
Core Principles of the Balanced Scorecard
The balanced scorecard framework was implemented by applying five core principles.
The first is mobilizing change through executive leadership. As noted by its creators, “a
successful Balanced Scorecard program should be a change project, not a ‘metrics’ project”
(Kaplan & Norton, 2001a, p. 64). Initially the focus is on mobilization, or getting the process
launched. At this stage, the capacity for organizational learning at the executive level (i.e.,
strategic learning) is “perhaps the most valuable aspect of the Balanced Scorecard” (Kaplan &

15
Norton, 1996, p. 24). The focus then shifts to governance, with emphasis on team-based
approaches. By creating and clearly articulating desired outcomes and the drivers of those
outcomes, “executives can channel the energies, the abilities, and the specific knowledge held by
people throughout the organization towards achieving the [organization’s] long-term goals”
(Kaplan & Norton, 1996, p. 56). Thus by integrating long-range strategic plans with short-term
measurable objectives, the balanced scorecard evolves into a successful management system for
implementing an organization’s strategic vision (Kaplan, 1994).
The second core principle of the balanced scorecard is translating strategy into operating
terms. Baruah and Haley (2004) described the balanced scorecard as being much like an onion. It
is not just a performance measurement system; it is a multi-layered tool, with each layer serving
a different purpose and audience. At each level (or layer), strategy maps proved beneficial for
their ability to communicate strategy to an entire organization (Kaplan & Norton, 2000). Such
maps “specify cause-and-effect relationships which [make] them explicit and testable” (Kaplan
& Norton, 2000, p. 176).
Aligning organizations with strategy is the third core principle of the balanced scorecard.
An organization’s strategy theme was mapped by applying linked objectives, measures, and
initiatives across four perspectives: financial, customer, [internal] process, and learning and
growth. Each objective and measure was supported by one or more strategic initiatives. For
example, the first column of such a map might show, for each perspective, how value-creating
objectives were linked to the theme. A second column might show measures and targets needed
to realize the theme’s objective. And a third column might list cross-unit or cross-functional
projects aimed at realizing synergies for each perspective and the dollars budgeted for them.

16
Kaplan and Norton (2006) found the mapping of strategic themes to be particularly well-
suited to the public sector where organizations were diverse but limited in their freedom to
experiment with structural change. Focusing on strategy, such early adopters as Mobil Oil, Cigna
Insurance, Brown and Root Energy Services (Rockwater Division), and Chemical Retail Bank
(now Chase Bank) employed the scorecard with impressive results. As pointed out by
MacStravic (1999), having specific data to back compelling claims made in advertising was a
major benefit of using a balanced scorecard.
The fourth core principle of the balanced scorecard is making strategy everyone’s job.
Because the balanced scorecard is centered on the organization’s mission, all employees are
identified as essential. And because a well developed mission statement is the product of
collaboration, it is expected that all employees have voice and buy in concerning the mission.
Therefore, all members of an organization recognize the importance of self-monitoring of
performance and processes.
Finally, the fifth core principle is making strategy a continual process. By design, the
balanced scorecard is a powerful management system. It serves as the tool to communicate
strategy, establish targets, and align people and teams. Perhaps most importantly, it provides a
continual feedback loop that is linked directly to learning about the strategy. This is a critical and
innovative aspect of the balanced scorecard. This continual learning process does not allow
strategy to grow stagnate. “The balanced scorecard enables mangers to monitor and adjust the
implementation of their strategy and make fundamental changes in the strategy itself” (Kaplan &
Norton, 1996b, p. 23).

17
The Balanced Scorecard in the Non-Profit Setting
Beginning in 1996, the balanced scorecard was applied to non-profit organizations as
well. Shortly after the founding of the Social Enterprise program at Harvard Business School,
Kaplan approached United Way of America, United Way of Southeastern New England, and
several other organizations as prospective pilot sites for applying the balanced scorecard in
society’s “third sector.”
Like its corporate counterpart, the non-profit balanced scorecard required total
commitment on the part of the executive leadership team. Strategy rather than job description
was placed at the center of the nonprofit system. And there was emphasis on “the value of
communicating to all units and individuals, aligning them to the strategy, and encouraging them
to find innovative ways to achieve strategic outcomes in their daily operations” (Kaplan, 2001, p.
368).
Kaplan (2002) made the valid argument that success in this sector should be measured by
how well the organizations provided benefits to their constituents, not by financial performance
based on donations, expenditures, and operating expense ratios. Since financial success was not
the primary goal, nonprofits found it necessary to modify the balanced scorecard framework. The
mission of the organization was elevated; that is, it was featured and measured at the highest
level of the scorecard. After all, “[a] nonprofit agency’s mission represents accountability to
society, the rationale for its existence and ongoing support” (Kaplan, 2002, p. 4). In addition,
nonprofits had to expand the definition of customer. Both the donor and recipient perspectives
could be included in the nonprofit balanced scorecard.
Using this format, the balanced scorecard “enabled nonprofit organizations to bridge the
gap between vague mission and strategy statements and day-to-day operational actions” (Kaplan,

18
2001, p. 369). It also provided much-needed information to donors and support organizations.
The overall result has been a more efficient marketplace that rewards effectiveness. By
extension, Inamdar and Kaplan (2002) examined the application of the balanced scorecard to
nine innovative healthcare provider organizations. The results of their 2-year study also indicated
“measurable performance improvement in competitive market positioning, financial results, and
customer satisfaction” (Inamdar & Kaplan, 2002, p. 194). The value of the balanced scorecard as
a tool for organizational improvement is clear.
School Applications of the Balanced Scorecard
Like so many tools from the business world, the balanced scorecard surfaced as a tool in
schools not long after it was introduced to the non-profit sector. In 1999, the Fulton County,
Georgia district hired former United Way Vice President Martha Greenway as the system’s
Executive Director of Research, Planning, and Policy. Greenway’s primary goal was to create a
balanced scorecard that “focused on strategy formulation and execution, not just reporting
performance” (Kaplan & Lee, 2007, p. 1). The scorecard developed by Greenway and the Fulton
County Board of Education included five perspectives from which they would measure progress.
These perspectives were: student achievement, stakeholder involvement, operational processes,
staff learning and growth, and financial performance. The board then set goals for each of the
perspectives and established targets for each.
In March of 2004, Fulton County Schools became the first district in the nation to acquire
district-wide SACS accreditation. It is significant to note the accreditation team pointed to the
schools’ effective use of the balanced scorecard as one of the system’s strengths. The team
observed the “the Balanced Scorecard has provided all district and school personnel along with

19
other stakeholders with a clear understanding and awareness of expectations” (Kaplan & Lee,
2007, p. 6).
Clarifying goals and articulating strategy allows teachers to focus more on the real
challenge of school. Rather than waiting for end-of-the-year reports, a balanced scorecard in the
school allows professional staff members the opportunity to check progress throughout the year.
This helps bring focus to school improvement plans that are cumbersome and do little more than
collect dust. The renewed focus has an overall positive impact on school effectiveness, overall
organizational climate of a school, and mindfulness.
How the Balanced Scorecard Works
Using the Fulton County template as a general guide, a school system balanced scorecard
can be divided into four perspectives or goal areas. They are student achievement, stakeholder
satisfaction, effective administrative processes, and staff learning and growth. These elements
work in concert to achieve the school systems mission. They are common threads found
throughout effective schools research and provide a strong framework for developing scorecard
measures.
“A scorecard should contain just enough data to give a complete picture of organizational
performance toward achieving the overall strategy . . . and no more”(Orion Development Group,
2004). This means that each of the four perspectives, again referred to as goal areas, should
contain a number of sub-measures. These sub-measures are labeled as strategic objectives. These
strategic objectives are further divided into performance measures. A quality balanced scorecard
may contain an overall total of 20-25 performance measures. Designers however should be
mindful of falling into the trap of trying to measure everything. It is vital to limit the measures to

20
a more controllable number so that organizational direction and strategy are clearer. Having too
many performance measures defeats the purpose of a balanced scorecard because it leaves
employees uncertain as to what the top priorities are.
There is certainly no specific template to be utilized when designing a good balanced
scorecard. Rather than adopting the tool, each organization should adapt their scorecard to fit
what they are trying to capture. The following template provides general guidelines for building
a balanced scorecard that is relatively easy to read and interpret.
The first column of a balanced scorecard typically contains the goal areas determined by
the school system. These should be determined by the members of the Board of Education and
system leadership team. The goal areas should be linked accurately to the system improvement
plan. This should also link directly to the system strategy map and serve as the foundation of the
balanced scorecard. “While the strategy map is about development of strategy, the balanced
scorecard is about strategic execution” (Orion Development Group, 2004). The usual public
school balanced scorecard would reflect student achievement as goal area number 1. All other
goals would be listed as illustrated in Figure 1.
Figure 1. BSC Column 1, Goal Area 1.
Goal Area 1
Stud
ent A
chie
vem
ent

21
The second column typically contains the strategic objectives of the school system. These
too should be determined by members of the Board of Education and system leadership team
members. The strategic objectives must also be linked to the system improvement plan. Strategic
objectives are more specific than goal areas. They act more as a means to obtaining the
objectives. As illustrated in Figure 2, goal area number one, student achievement, is divided into
two strategic objectives. They are students master the curriculum and students are nationally
competitive.
Goal Area 1 Strategic Objective #1
Students Master the Curriculum
Strategic Objective #2
Stud
ent A
chie
vem
ent
Students are Nationally Competitive
Figure 2. BSC Columns 1 & 2, Goal Area 1, & Strategic Objective.
Determining these strategic objectives can be a very challenging step in developing the
balanced scorecard. It requires all stakeholders involved in the development phase have a high
level of understanding of all the relevant objectives needed to achieve the system mission.
Establishing the objectives provides the overall framework for the strategy.
The third column provides yet another level of specificity to the balanced scorecard. This
step defines specific performance measures for each objective. For the objectives listed in the
example, state and national test results provide convenient performance measures (see Figure 3).

22
Goal Area 1 Strategic Objective #1 Performance Measures
SO #1.A = CRCT (Reading)
SO #1.B = CRCT (Math) SO #1.C = Writing
Assessment
Students Master the Curriculum
SO #1.D = HSGT
Strategic Objective #2 Performance Measures
SO #2.A = I.T.B.S. (Reading) SO #2.B = I.T.B.S. Math)
SO #2.C = SAT
Stud
ent A
chie
vem
ent
Students are Nationally Competitive
SO #2.D = ACT
Figure 3. BSC Columns 1 through 3, Goal Area 1, Strategic Objectives, & Performance Measures.
Determining the unit of measure in the fourth column is a matter of simply plugging in
the information as it relates to standardized tests. The units of measure are defined as they relate
to the specific performance measures (see Figure 4). For example, SO #1.A is listed as a state
Criterion Referenced Competency Test (CRCT). Student scores are reported as either “does not
meet” grade level expectations, “meets” grade level expectations, or “exceeds” grade level
expectations. This unit of measure is constant for SO #1.B and C as well. SO #D is reported as
either “pass” or “fail.” Because students are offered multiple opportunities to pass the graduation
tests, the scorecard example shows first-time passing rate as the agreed upon unit of measure.
Gathering trend data is the next step in balanced scorecard development. Typically
balanced scorecards for schools and school systems show annual summative data. Because the
data are linked to goals, continual focus on achieving the goals is provided. This affords teachers,
administrator, indeed all stakeholders, the opportunity to be mindful of critical target areas. It
also provides clarity in terms of priorities. This calls for school systems to seek formative data
for the purpose of monitoring so they can be more responsive to feedback. This is a major benefit
of the balanced scorecard as timely information is critical for continuous improvement. This

23
section of the balanced scorecard is color coded for quick reference. Areas marked in red
indicate that the specific strategic objective showed a decrease from the previous year. Areas
marked yellow reflect improvement over the previous year but failure to meet the target. An area
marked green indicates that the target for the specific strategic objective was met. This allows all
faculty members and stakeholders to quickly identify target areas and refine strategy. These
would be listed as illustrated in Figure 5.
Figure 4. BSC Columns 1 through 4, Goal Area 1, Strategic Objectives, Performance Measures, and Unit of Measure.
Goal Area 1 Strategic Objective #1 Performance Measures Unit of Measure
SO #1.A = CRCT (Reading) % Meets + Exceeds
SO #1.B = CRCT (Math) % Meets + Exceeds
SO #1.C = Writing Assessment
% Meets + Exceeds
Students Master the Curriculum
SO #1.D = HSGT % Passing 1st Time
Strategic Objective #2 Performance Measures Unit of Measure
SO #2.A = I.T.B.S. (Reading) % > Peers SO #2.B = I.T.B.S. Math) % > Peers
SO #2.C = SAT Ave Score
Stud
ent A
chie
vem
ent
Students are Nationally Competitive
SO #2.D = ACT Ave comp score

24
Figure 5. BSC Columns 1 through 5, Goal Area 1, Strategic Objective, Performance Measures, Unit of Measure, and Trend Data.
Gathering data and performance measure information can be very labor intensive during
the development of the balanced scorecard. It is important to involve teacher leaders in this
process to help them better understand the goal areas and the details involved in the balanced
scorecard. Once the initial data are collected, updating on an annual basis is an easy enough task.
The final task is to fill in the last column. Specifically, these are the target goals set by the
organization (see Figure 6).
Goal Area 1 Strategic Objective #1 Performance Measures Unit of Measure Trend Data
2007 2008 2009
SO #1.A = CRCT (Reading) % Meets + Exceeds 86% 91% 93%
SO #1.B = CRCT (Math) % Meets + Exceeds 68% 72% 74%
SO #1.C = Writing Assessment
% Meets + Exceeds 94% 82% 89%
Students Master the Curriculum
SO #1.D = HSGT % Passing 1st Time 94% 92% 94%
Strategic Objective #2 Performance Measures Unit of Measure Trend Data
2007 2008 2009
SO #2.A = I.T.B.S. (Reading) % > Peers 59% 61% 58%
SO #2.B = I.T.B.S. Math) % > Peers 51% 48% 49% SO #2.C = SAT Ave Score 1441 1439 1468
Stud
ent A
chie
vem
ent
Students are Nationally Competitive
SO #2.D = ACT Ave comp score 18.4 19.3 19.5

25
Figure 6. BSC Columns 1 through 6, Goal Area 1, Strategic Objective #1 & #2, Performance Measures, Unit of Measure, Trend Data, and Target. S.M.A.R.T. Goals
Setting goals is a critical task when building a balanced scorecard. The goal development
process should include input from stakeholders and be linked to the trend data provided. Most
importantly, balanced scorecard goals must be S.M.A.R.T. goals. The Georgia Leadership
Institute for School Improvement (G.L.I.S.I.) is an advocate for the balanced scorecard and the
use of S.M.A.R.T. goals as a critical piece.
According to G.L.I.S.I., the acronym S.M.A.R.T. establishes a set of criteria that an
organization’s goals must have in order to be well-focused and achievable. That set of criteria is
Specific, Measurable, Attainable, Relevant, and Time-Oriented (Georgia Leadership Institute for
School Improvement, 2008).
The S in S.M.A.R.T. stands for Specific. A specific goal has a greater chance of being
accomplished than a general goal. A goal that is specific not only states a single performance
result, it also helps an organization focus strategy. Specific goals tell an organization what they
Goal Area 1 Strategic Objective #1 Performance Measures Unit of Measure Trend Data Target
2007 2008 2009 2010
SO #1.A = CRCT (Reading) % Meets + Exceeds 86% 91% 93% 96%
SO #1.B = CRCT (Math) % Meets + Exceeds 68% 72% 74% 75%
SO #1.C = Writing Assessment
% Meets + Exceeds 94% 82% 89% 91%
Students Master the Curriculum
SO #1.D = HSGT % Passing 1st Time 94% 92% 94% 95%
Strategic Objective #2 Performance Measures Unit of Measure Trend Data Target
2007 2008 2009 2010
SO #2.A = I.T.B.S. (Reading) % > Peers 59% 61% 58% 70%
SO #2.B = I.T.B.S. Math) % > Peers 51% 48% 49% 70% SO #2.C = SAT Ave Score 1441 1439 1468 1520
Stud
ent A
chie
vem
ent
Students are Nationally Competitive
SO #2.D = ACT Ave comp score 18.4 19.3 19.5 21

26
want to accomplish, why they want to achieve the goal, and who is involved in helping achieve
the goal.
The M in S.M.A.R.T. stands for Measurable. Measurable goals allow organizations to
assess progress. They include concrete criteria, provide targets, and are linked to baseline or
trend data. All of these can be expressed in numerical value referred to as performance measures.
These targets also provide the unit of measure to which each goal is linked. Questions to help
determine if a goal is measurable include the following: How much? How many? and How will
we know we have accomplished our goal?
The A in S.M.A.R.T. stands for Attainable. Attainable goals can be difficult to establish
because they must do two things that can be viewed as paradoxical. First, effective S.M.A.R.T.
goals must challenge an organization to improve. Setting goals that are well within reach serve to
produce little fear of failure. This generates a complacency that is unhealthy and contradicts the
concept of mindfulness linked to the balanced scorecard. Setting goals too high, however, can
serve to set organizations up for failure. This is why attainable goals must be realistic relative to
the resources available. Setting goals that generate a healthy amount of stress needed to create
the preoccupation of failure present in mindful organizations without setting the bar hopelessly
high requires careful collaboration.
The R in S.M.A.R.T. stands for Relevant. Relevant goals closely align with system plans
and priorities. They aim at results that must be either improved upon or maintained if a system is
to successfully complete it mission. Relevant goals also help systems maintain focus and ensure
they are maximizing resources.
The T in S.M.A.R.T. stands for Time-oriented. Unless goals are bound by time and have
deadlines, there is no sense of urgency in completing them. This, once again, can be detrimental

27
to the mindfulness of an organization. Providing deadlines with milestones or benchmarks not
only heightens urgency but also begs for a continuous monitoring system.
Without S.M.A.R.T. goals a balanced scorecard does little for an organization. Goals that
do not meet the S.M.A.R.T. criteria get lost either because they are too vague or too lofty. Either
way, mindfulness suffers and frustration grows because members of the team do not realize their
role in helping achieve the goal. The balanced scorecard makes organizations carefully set goals
and find means to constantly monitor progress towards the goals. This constant monitoring can
be expressed as the constant scrutiny present in mindful organizations.
Upon completion, the balanced scorecard provides one the ability to quickly identify the
goals and strategic intent of the organization. And, if the goals written follow the S.M.A.R.T.
criteria “a novice reading the goal should be able to explain exactly what the results are when the
goal is achieved”(Georgia Leadership Institute for School Improvement, 2008, p. 8). Any
stakeholder in a school, for example, can reference the goal area in relation to the strategic object
and on down the line. Most important, all employees can view the target and be more mindful of
how to progress towards completing the mission of the school. A complete balanced scorecard
often includes a separate page for each goal area.
Constructing a balanced scorecard can be a time and labor intensive endeavor. It will
certainly require time investment at the administrative level to build the mission and vision
around which the goals are established. Administrators would also be wise to reserve time at the
end to review measures and targets. The majority of the time will be devoted to the leadership
team. This group has the responsibility for selecting the measures, precisely defining them,
collecting the data, and so forth. Administrators should build the balanced scorecard slowly by

28
focusing at first on one goal area. This helps build leadership capacity within the organization
and increases the likelihood of buy-in.
Section Summary
The preceding section gave an explanation of what the balanced scorecard is and how it
works. The continuous scrutiny of the balanced scorecard and its effects on school achievement
has not been empirically demonstrated. This is because of the varieties of implementation and
the relative newness of the innovation. In spite of the varieties of implementation, the argument
offered here is that schools that utilize the balanced scorecard will be better off than those that do
not, by virtue of simply committing to the balanced scorecard. The explanation for their success
is that adoption of the balanced scorecard fosters a continual examination of school operations
and thus elicits cooperation from school people to find problems and solve them.
Effectiveness
Effectiveness is the dependent variable in this study. Effectiveness is defined not merely
as achieving goals but also in the efficiency of the operations of the organization to achieve
goals. Using a theoretical framework from Talcott Parsons (Hoy & Ferguson, 1985), the study
will establish the multidimensionality of school effectiveness and its connection to the balanced
scorecard, mindfulness, and climate.

29
A.G.I.L. Model of Effectiveness
Hoy and Ferguson (1985) conceived of school effectiveness along two broad dimensions:
one that contains behaviors of adaptation and goal attainment, the other containing integration
and latency. They linked school effectiveness directly to the Parsonian AGIL model.
Adaptation in the Parsonian model is referred to as an organizations ability to
accommodate to the environment. In the context of the school setting, Hoy and Ferguson (1985)
suggest “adaptation in the form of successful accommodation to internal and external forces” (p.
122). Where adaptation is high, teachers and administrators display a greater level of innovation
and maximize all resources.
Goal attainment measures organizations’ productivity relative to their ability to set and
accomplish goals. Organizations are wise to select a limited number of goals in order to better
ensure success. The measure of goal attainment in the school setting most often relates directly to
the academic achievement of all students.
Effectiveness under the Hoy and Ferguson (1985) model is further measured by the
absence of conflict within the school in regard to the relationships among professional staff. The
Parsonian model refers to this as integration, which is defined as the ability to maintain unity and
solidarity within the system. Where integration is present teachers act as a cohesive unit. Teacher
turnover and absentee rates would be low.
Latency deals with an organization’s ability to maintain motivational and value patterns.
Hoy and Ferguson’s (1985) adaptation of latency refers to members of an organization being
motivated and committed to the organization. The manifestation of latency would be seen in a
school or system where staff learning and growth are high and job satisfaction is as well.

30
Measuring Effectiveness in Schools
As stated in the first chapter of this study, effectiveness will be defined relative to the
Parsonian AGIL model adapted by Hoy and Ferguson (1985). Measuring organizational
effectiveness can a difficult task. Basic input-output philosophy would provide a very narrow
definition at best. Measuring any business organization’s effectiveness solely by financial
measures provides only a retrospective view of what has already happened. Furthermore, it
ignores any and all other aspects of the organization. Parson’s AGIL paradigm states that if any
system or organization is to survive it must (1) adapt to its environment, (2) attain its goals, (3)
integrate its components, and (4) maintain a latent pattern. Adaptation refers to the dilemma of
acquiring adequate resources. Goal attainment is the process of establishing and achieving goals.
Integration refers to the issue of maintaining harmony and dexterity among the organization. And
latency refers to the problem of creating, communicating, and maintaining the organization’s
unique culture and norms. For a system to be effective, it must perform all four functions of the
AGIL paradigm in concert. This is consistent with the practice of the balanced scorecard
approach and encourages organizations to utilize this tool. The balanced scorecard provides a
visual framework for the Parsonian AGIL paradigm and the Hoy and Ferguson adaptation of the
model. Furthermore, the balanced scorecard allows schools to keep a watchful eye on the
multiple measures to success and be more responsive to current conditions.
An effective balanced scorecard has, as one component, a strategic objective relating to
administrative processes that maximize the use of all resources. This falls in line with adaptation
under the Parsonian model and innovation under the Hoy and Ferguson model. Measuring the
level of adaptation can be achieved by examining various resource inventories, budgets, and staff
qualification reports. Adaptation can be further scrutinized by comparing how effective one

31
system recruits and hires teachers in critical needs areas as compared to others. All of these units
of measure are present on a well designed balanced scorecard.
Student achievement must also be a strategic objective in an effective balanced scorecard.
This aligns with goal attainment in the Parsonian model and is congruent with the Hoy and
Ferguson model as well. Student achievement can be measured in many ways. For the purpose of
this study student achievement will be measured by analyzing student performance on Georgia
criterion referenced competency tests and high school graduation tests. As defined by Parsons,
goal attainment relates not only to accomplishing goals but also an organizations ability to set
goals that are specific, measurable, attainable, realistic, and time bound. These goals, referred to
as S.M.A.R.T. goals are critical to the formation of any effective balanced scorecard.
Harmony among the members of society is referred to as integration under the Parsonian
model. A society that demands the cultural norms and values to be followed and respected by all
members is said to be fully integrated. Under the Hoy and Ferguson model teachers will act and
perform as a cohesive unit. They exhibit higher levels of solidarity and respect colleagues as
professionals. High integration will manifest in lower teacher turnover and absenteeism among
other things. The manifestation of integration can be reflected in both the OCI and M-Scale
scores of the schools.
A society that creates, preserves, and communicates its values to others is said to exhibit
latency under the Parsonian definition. Hoy and Ferguson (1985) state that this is reflected in
teachers being more committed to staff growth. The balanced scorecard uses teacher satisfaction
as one of the strategic objectives. This specifically correlates to the CL and PTB sub-dimensions
of the OCI.

32
The illusive nature of defining school effectiveness also begs for the use of the balanced
scorecard approach to school improvement. The very design of the balanced scorecard in fact
addresses the complexity of measuring any organizations performance. Kaplan and Norton
(1996) recognize that defining business success in financial measures is inadequate because there
is no guiding force involved. Likewise, measuring school success on academic achievement
alone fails to guide performance. Multiple measures of performance that include the system-
theory model (Hoy & Ferguson) capture a more complete picture of effectiveness. They allow
schools to measure “the internal aspects of the organization that promote harmony and efficiency
(Sweetland & Hoy, 2000).
Effectiveness Measures in the Study at Hand
The study here proposed to test the balanced scorecard will use student performance,
school climate, and mindfulness assessments. Student performance is an integral part of the
scorecard and AGIL theory as well. School climate, discussed in the next section, assesses the
teachers’ perception that the school operates well. Mindfulness, discussed further in this chapter,
measures the teachers’ view that the school does carry out a continuous scrutiny of school
operations. At the end of the research history section of this chapter, a rationale for linking
student performance, climate, and mindfulness to use of the scorecard will be elaborated. At that
time, hypotheses will be offered to test the explanation.
Section Summary
Although the achievement of goals is a common measure of success in organizations it
does not provide a complete picture. Goal attainment must be measured relative to the efficiency

33
of operations and the collective harmony of the organization. The multidimensional elements of
success require organizations to have a balanced approach to measuring success. Organizations
must find methods to measure not only end results but also processes in place to help achieve the
mission. The balanced approach to measuring success is a key component of the balanced
scorecard. The balanced scorecard helps organizations, including schools, find effective ways to
constantly monitor success and avoid failure by using lead data to make adjustments.
Organizational Climate
Organizational climate is the next important concept of this study. This section will first
explore the concept of organizational climate in the general sense and then, more specifically, in
the school setting. It will include a description and discussion of the Organizational Climate
Index (OCI) and the individual sub-dimensions of the index.
Two of the more popular terms for describing the nature of organizations are climate and
culture. While the two terms are often used interchangeably, they have specific differences.
Organizational culture refers to the norms and values that exist within any organization. These
may be established formally and/or informally and have great impact on the day-to-day
interactions within the organization. The culture of an organization is often an abstract concept.
Simply stated, it is the shared assumptions within the organization (Hoy & Miskel, 2005; Hoy &
Tarter, 1997; Hoy, Tarter, & Kottkamp, 1991). Culture is created over time and is thus related to
the organizational behaviors, attitudes, and customs that have been created throughout the
organization’s history (Pang, 2001). Unless one is a member of the organization, the elements of
culture go largely unnoticed. This makes the study of organizational culture difficult in the
quantifiable sense.
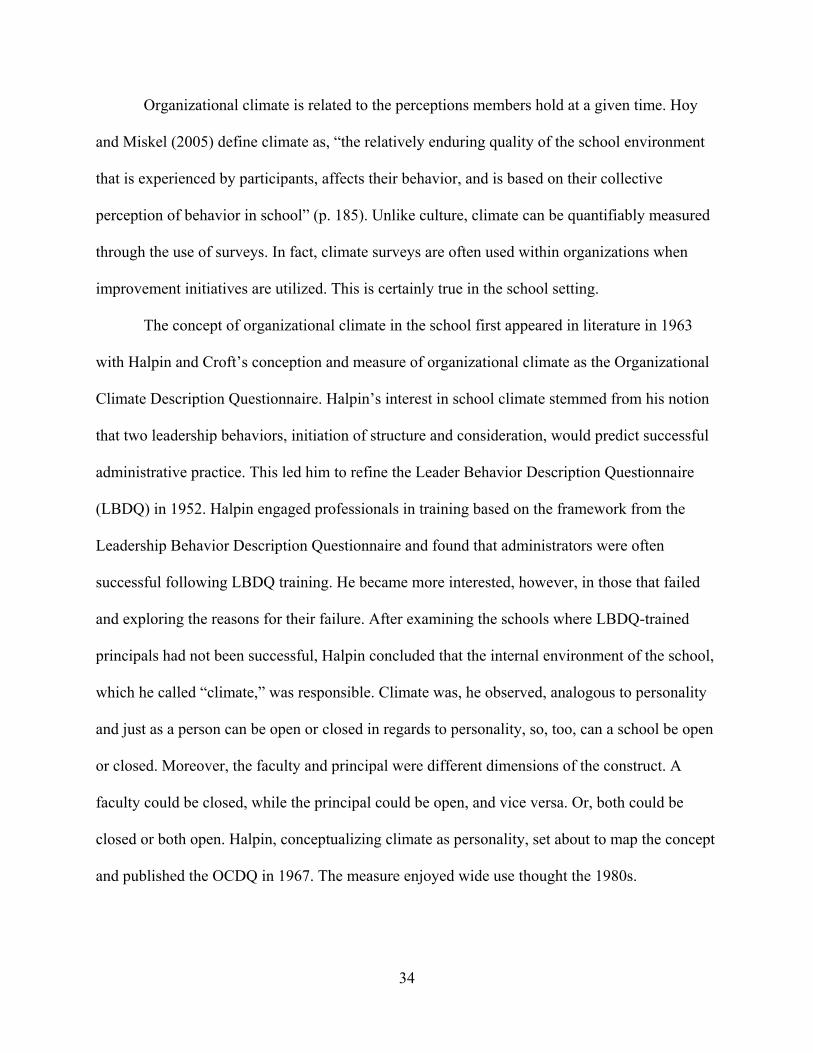
34
Organizational climate is related to the perceptions members hold at a given time. Hoy
and Miskel (2005) define climate as, “the relatively enduring quality of the school environment
that is experienced by participants, affects their behavior, and is based on their collective
perception of behavior in school” (p. 185). Unlike culture, climate can be quantifiably measured
through the use of surveys. In fact, climate surveys are often used within organizations when
improvement initiatives are utilized. This is certainly true in the school setting.
The concept of organizational climate in the school first appeared in literature in 1963
with Halpin and Croft’s conception and measure of organizational climate as the Organizational
Climate Description Questionnaire. Halpin’s interest in school climate stemmed from his notion
that two leadership behaviors, initiation of structure and consideration, would predict successful
administrative practice. This led him to refine the Leader Behavior Description Questionnaire
(LBDQ) in 1952. Halpin engaged professionals in training based on the framework from the
Leadership Behavior Description Questionnaire and found that administrators were often
successful following LBDQ training. He became more interested, however, in those that failed
and exploring the reasons for their failure. After examining the schools where LBDQ-trained
principals had not been successful, Halpin concluded that the internal environment of the school,
which he called “climate,” was responsible. Climate was, he observed, analogous to personality
and just as a person can be open or closed in regards to personality, so, too, can a school be open
or closed. Moreover, the faculty and principal were different dimensions of the construct. A
faculty could be closed, while the principal could be open, and vice versa. Or, both could be
closed or both open. Halpin, conceptualizing climate as personality, set about to map the concept
and published the OCDQ in 1967. The measure enjoyed wide use thought the 1980s.

35
As the measure was studied through 1970s and 1980s it was discovered that, when
following the OCDQ, all secondary schools were closed rather than open. This is probably
because the original group of schools that contributed to the measure was elementary schools.
Additionally, the subtests for both principal and faculty climate were not stable in factor analysis
and conceptually indistinct. New measures were developed in the 1990s (Hoy et al., 1991). The
first of these were the revisions of the OCDQ-RE. The term “Organizational Climate” was kept
to honor Halpin’s contributions to the field, but the emerging subtests were completely different
and versions for elementary and secondary schools were developed with a middle school
measure being developed somewhat later (Hoy & Sabo, 1998). The measure was starkly
empirical, had acceptable reliability indices, and predicted in anticipated directions (Hoy et al.,
1991).
The Organizational Health Inventory represents another track of the climate developed in
a Parsonian theoretical framework (Hoy & Feldman, 1987). The measure distinguished levels of
authority separating the board, conceived of as institutional integrity; the administrative level,
conceived of as initiation of structure, consideration, principal influence, and resource support;
and, finally, the technical level, where teachers manifested morale and academic emphasis. The
Hoy and Feldman conception and measure was designed specifically for high schools.
Subsequent measures were developed for elementary and middle schools (Hoy et al., 1991).
Similar to the revised OCDQ, the OHI has been widely used in the analysis of school
performance (Hoy & Sabo, 1998; Uline, Miller, & Tschannen-Moran, 1998). Although both
measures continue to be used, the next step in the evolution of the measures was to find a way to
combine them, thus, giving rise to the Organizational Climate Index (Hoy & Sabo, 1998).

36
While both the OCDQ and OHI are useful tools for assessing the climate and health of
schools, they both are inclined to be redundant because they tap overlapping elements of climate.
The Organizational Climate Index was developed as a combination of the two climate measures.
A second-order factor analysis brought together the 14 subtests of the two measures into one
four-element instrument. The dimensions that emerged were Collegial Leadership, Professional
Teacher Behavior, Academic Press, and Institutional Vulnerability (Hoy & Sabo, 1998; Hoy et
al., 2002).
The Development of Organizational Climate Measures
Organizational climate studies can be traced back to the 1950s. The construction of the
Organizational Climate Description Questionnaire (OCDQ) by Haplin and Croft (1963) provided
one of the first studies in the field. The OCDQ is a questionnaire that uses a 4-point Likert-type
scale response consisting of rarely occurs, sometimes occurs, often occurs, and very frequently
occurs. The OCDQ has become one of the most widely used measures of organizational climate.
It allows the user to collect data to describe the perception members of the organization have
concerning the climate of the work place.
Organizational Climate Description Questionnaire
The OCDQ was revised by Hoy (2001) and is now referred to as the OCDQ-RE (RE:
revised elementary edition). The OCDQ-RE is designed to identify three dimensions of principal
behavior and three dimensions of teacher behavior. The three behaviors for principals are defined
as supportive, directive, and restrictive. A principal is said to exhibit supportive behavior when
he/she values the suggestions of teachers, provides constructive feedback, and respects their
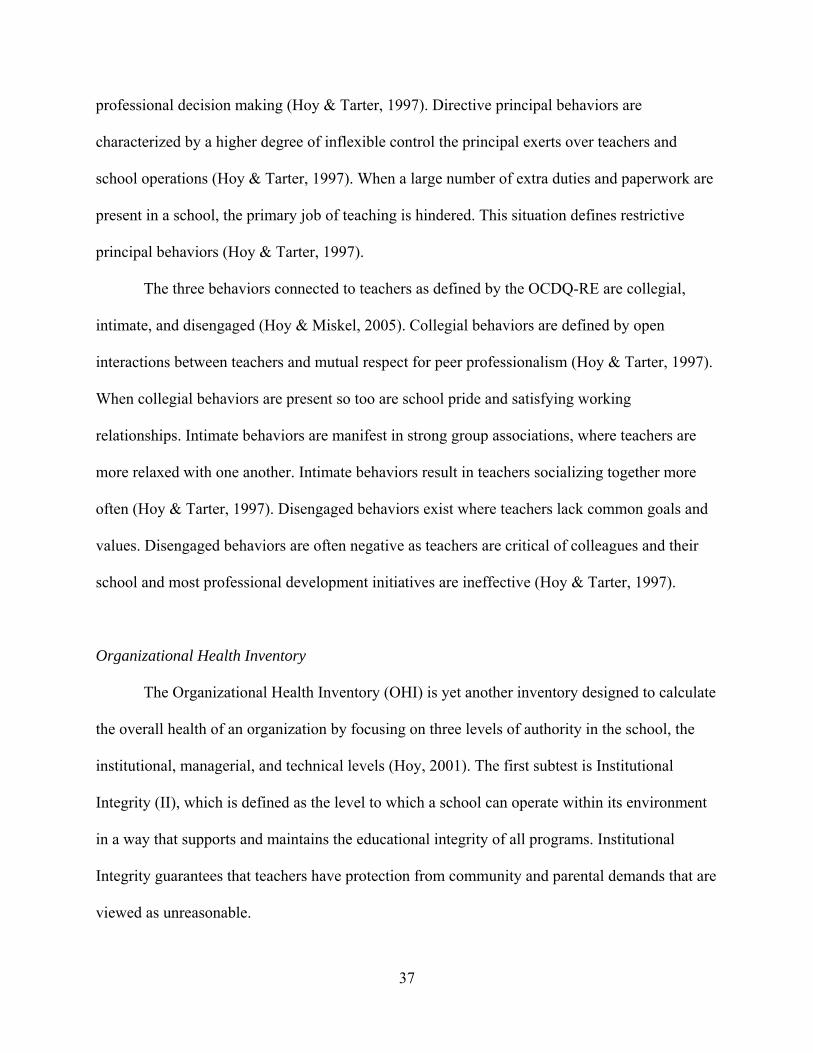
37
professional decision making (Hoy & Tarter, 1997). Directive principal behaviors are
characterized by a higher degree of inflexible control the principal exerts over teachers and
school operations (Hoy & Tarter, 1997). When a large number of extra duties and paperwork are
present in a school, the primary job of teaching is hindered. This situation defines restrictive
principal behaviors (Hoy & Tarter, 1997).
The three behaviors connected to teachers as defined by the OCDQ-RE are collegial,
intimate, and disengaged (Hoy & Miskel, 2005). Collegial behaviors are defined by open
interactions between teachers and mutual respect for peer professionalism (Hoy & Tarter, 1997).
When collegial behaviors are present so too are school pride and satisfying working
relationships. Intimate behaviors are manifest in strong group associations, where teachers are
more relaxed with one another. Intimate behaviors result in teachers socializing together more
often (Hoy & Tarter, 1997). Disengaged behaviors exist where teachers lack common goals and
values. Disengaged behaviors are often negative as teachers are critical of colleagues and their
school and most professional development initiatives are ineffective (Hoy & Tarter, 1997).
Organizational Health Inventory
The Organizational Health Inventory (OHI) is yet another inventory designed to calculate
the overall health of an organization by focusing on three levels of authority in the school, the
institutional, managerial, and technical levels (Hoy, 2001). The first subtest is Institutional
Integrity (II), which is defined as the level to which a school can operate within its environment
in a way that supports and maintains the educational integrity of all programs. Institutional
Integrity guarantees that teachers have protection from community and parental demands that are
viewed as unreasonable.

38
The second area is Collegial Leadership (CL). Characteristic of CL is a principal that is
friendly, supportive, open, and strong in establishing equality among all staff. At the same time,
the principal sets a tone for high performance by clearly establishing staff expectations.
The third area, Principal Influence (PI), is the ability of the principal to influence the
actions of superiors. Principals that exhibit high PI are persuasive and are able to secure
additional consideration from their superiors. They operate in a fashion relatively unrestricted by
the central office.
The fourth area is Resource Support (RS), defined as the availability of classroom
supplies and instructional materials made available to staff. If RS is high in a school, extra
materials are frequently supplied when requested by staff.
The fifth area is Teacher Affiliation (TA). It is characterized by a sense of friendliness
and strong affiliation with the school. Teachers feel good about each other, their job, and their
students. They are committed to both their students and their colleagues and accomplish their
jobs with enthusiasm. This is important because it has been documented that the attitude and
efforts of the faculty as a whole has a positive effect on student achievement (Goddard, Hoy, &
Hoy, 2000; Hoy & Sweetland, 2001; Sweetland & Hoy, 2000).
Finally, the sixth area, Academic Emphasis (AE), is described as the extent to which the
school is guided by and more clearly focused on academic performance. Schools that exhibit
high AE set academic goals that are high but achievable for all students. They provide a learning
environment that is orderly and focused. High AE schools have teachers who believe in their
students’ ability to achieve academic standards. This belief is transmitted to the students and
results in a student body that works hard and respects academic achievement.

39
Organizational Climate Index
Separate versions of the OCDQ-RE and OHI, depending on the grade level of the school,
must be used when measuring the climate of schools. As a result, the Organizational Climate
Index (OCI) was developed by Hoy et al. (2002). The OCI is a shorter organizational climate
descriptive measure for schools that is a combination of the OHI and OCDQ-RE. The OCI is a
30-item descriptive questionnaire. Twenty-seven items are scored and the total is then divided
into four dimensions. The four dimensions are Institutional Vulnerability, Collegial Leadership,
Professional Teacher Behavior, and Achievement Press.
Institutional Vulnerability (IV) is defined as “the extent to which the school is susceptible
to a few vocal parents and citizen groups. High vulnerability suggests that both teachers and
principals are unprotected and put on the defensive” (Hoy et al., 2002, p. 42). Schools hope to
have low scores in the area of IV, as it is important to operate without community and parental
pressures that could be considered unreasonable. Five items on the OCI are designed to measure
Institutional Vulnerability. They include “A few vocal parents can change school policy” and
“Teachers feel pressure from the community.”
Collegial Leadership (CL) describes a principal who is open to options and listens to all
sides of important topics. The principal treats faculty members as his/her equal and allows them
to put suggestions into action. CL is further characterized by a principal who is friendly,
approachable, and willing to make changes, yet he/she clarifies expectations and sets clear
standards for performance. An increase in CL opens the door to more staff input and leads to
consensus building thus creating a higher level of collective efficacy.

40
Seven items on the OCI are designed to measure CL. Items such as “The principal
explores all sides of topics and admits that options exist,” “The principal is friendly and
approachable,” and “The principal maintains definite standards of performance” are included.
Professional Teacher Behavior (PBT) is characterized by teachers helping and supporting
each other. When PBT is high, faculty members work cooperatively, provide strong social
support for one another, respect each other as competent professionals, and frequently exercise
professional judgment. They also enthusiastically accomplish their jobs and even go beyond
expectations to help students. Teacher collegiality and professionalism have long been
recognized as important elements of effective schools. This element of organizational climate
has been shown to positively impact student achievement as it “provides direction and maintains
high standards of performance” (Hoy & Miskel, 2005, p. 191). Some items scored on the OCI to
specifically measure PTB are “Teachers help and support each other,” “Teachers respect the
professional competence of their colleagues,” and “Teachers provide strong social support for
colleagues.”
Finally, Achievement Press (AP) addresses the attitude and standards of the parents and
students of a school. This attitude is directly linked to the academic emphasis present in teachers
as mentioned earlier. The teacher’s role in Achievement Press is necessary. Without a strong
belief in student achievement from the teacher perspective a “can do” attitude from students and
parents is less likely. Where AP is high, so are parent and student expectations for learning.
Students respect others who get good grades and students try to improve on previous work. A
climate where academic achievement is recognized as the norm is present when AP is high.
Parents are involved in the school improvement process and exert pressure to maintain high
standards for all students if AP is high. The OCI uses eight items to measure the level of AP in

41
schools, including “The school sets high standards for academic performance,” “Parents exert
pressure to maintain high standards,” and “Students try hard to improve on previous work.”
Section Summary
This section describes the multidimensionality of school climate and the complex nature
of measuring and manipulating it. Both the openness and health of school climates were
discussed as were the specific sub dimensions of a school climate. The interaction between
teachers, between teachers and administrators, and between the school and outside forces are all
important. All of these relationships are important to school improvement and must be addressed
effectively by school leaders. This section also suggests that strategy can be employed to change
the climate of a school. The step by step clinical strategy connects with mindfulness because it is
a continual process and it is congruent with the notion of the balanced scorecard because
progress can be measured and strategy can be engaged.
Mindfulness
Mindfulness is the final element of this study. The concept of mindfulness was
introduced by Langer, Blank, and Chanowitz (1978). It is linked to philosophy from the Far East
where individuals exhibit high levels of focused attention, calmness, and stability. Mindfulness
and its opposite, mindlessness, were further discussed by Langer and Moldoveanu (2000). Their
focus was on the exploration of mindfulness as a condition where individuals have open minds,
are more engaged in activities, are able to notice changing information, and have the ability to
exercise flexibility in situations. Mindful behavior at the individual level happens very naturally
and is a habit formed over time.

42
Langer’s (1978) work on individual mindfulness has been expanded to the organizational
setting. It was built upon by Weick and Sutcliffe (2001). They conceive of mindfulness in the
organization as a collective quality held by all. Mindfulness is best described as a high level of
constant self-scrutiny present in some organizations. It is more completely defined as follows:
the combination of ongoing scrutiny of existing expectations, continuous refinement and differentiation of expectations based on newer experiences, willingness and capacity to invent new expectations that make sense of unprecedented events, a more nuanced appreciation of context and ways to deal with it, and identification of new dimensions of context that improve foresight and current functioning. (Weick & Sutcliffe, 2001, p. 42).
This complex definition is an extension of Langer’s observation that “[a]lthough people are
certainly capable of acting mindfully, they frequently respond in routinized, mindless ways”
(Langer, 1989, p. 137). The want to eliminate the routine is what makes the concept of
mindfulness desirable.
Individual Mindfulness
According to Langer (2000), mindlessness comes about in two ways: repetition and a
single exposure during which information is processed mindlessly. In the field of education,
certain myths or mind-sets about learning may, in fact, detract from one’s ability to learn. For
example, if one advocates that the basics should be learned so well as to become second nature,
then it will not occur to the advocate to change strategies when it would be to his or her
advantage to do so. Only by attending to an object or target mindfully will performance improve.
The results of studies conducted by Langer and Brown (1992) indicate that mindfulness
is not only more effective as an educational tool, but it also makes learning more enjoyable. The
reason is easily explained: to respond statically rather than actively makes a response feel like
more of an effort, and the effort involved may be evaluated as negative, making the respondent

43
more prone to error. On the other hand, “when one is actively drawing novel distinctions, the
whole individual is involved” (Langer & Moldoveanu, 2000, p. 2). Consequently, mindfulness
gives the participant an increased state of involvement, or a sense of being in the present, and
results in a more positive response. In the final analysis, mindfulness as it relates to learning is “a
flexible state of mind in which [participants] are actively engaged in the present, noticing new
things and sensitive to context” (Langer, 2000, p. 220). The concept of mindfulness defined by
Langer can be applied to organizations as well as individuals.
Characteristics of Mindfulness in Organizations
Expanding on Langer, Weick and Sutcliffe (2001) defined mindfulness in organizations
using the following five characteristics: (1) a preoccupation with failure, (2) a reluctance to
simplify interpretations, (3) sensitivity to operations, (4) commitment to resilience, and (5)
deference to expertise. These five qualities exist in what they call highly reliable organizations
(HROs). Organizations that exhibit high levels of mindfulness and are considered HROs are
organizations that deal with the constant possibility of disaster. Aircraft carriers, nuclear power
plants, or large power companies are such organizations because failure can be of a devastating
magnitude.
Preoccupation with Failure
It is common practice in organizations to focus on success as a way to build momentum.
This notion, that success breeds success, is exactly what Weick and Sutcliffe (2001) challenge by
suggesting organizations instead focus on failure. They argue that success, too often, breeds
laziness and complacency that is a consequence of arrogance.

44
A preoccupation with failure may at first seem to create a defeatist attitude. On the
contrary, “such a preoccupation is functional because it leads to continuous scanning for
problems” (Hoy, 2003, p. 97). Organizations that look only at successes see only half of the
picture. They look at data that confirm what they expect to find and never examine data that fail
to confirm the same expectations. This allows small underlying failures to go either unnoticed or
ignored. They are then allowed to grow and become much harder to control. Because focusing
on success often leads to complacency, leaders of mindful organizations focus instead on looking
for the small mistakes and eliminating them. They also encourage members of the organization
to report errors and mistakes and often reward it. This keeps employees from covering up
mistakes and instead invites them to engage in mistake analysis. This state of constant scrutiny
gives organizations to chance to catch problems early and prevent failures that could be more
wide spread.
Reluctance to Simplify
The reluctance to simplify interpretations that Weick and Sutcliffe (2001) refer to is an
effort to encourage a deeper level of understanding within the organization. And, just like a
preoccupation with failure, it attacks another common belief held in many organizations,
simplification. More than ever before, organizations today are taught to embrace the notion that
less is more and that keeping it simple is the best method of operation. This philosophy limits
organizations because they inadvertently eliminate information that could be beneficial. When
organizations “simplify less, they see more” (Weick & Sutcliffe, 2001, p. 11).
Organizations that are reluctant to simplify avoid the problem of missing key
information. HROs are better poised to act on all information available rather than dismissing or

45
overlooking it. Members of HROs are taught to challenge the status quo and be more skeptical of
the way things are done. They are also more comprehensive in their thinking and have the ability
to enjoy differences in opinions without creating animosity.
Schools, too, look for ways to simplify. This is done in the name of efficiency but it leads
instead to behaviors that limit perspectives. In the school setting reluctance to simplify requires
teachers and administrators to more look more deeply at school data and discover the subtleties
that are present. It requires them seek input from all stakeholders in an effort to build diversity of
opinions. This allows all stakeholders to see more and as a result reach synergistic thinking.
Sensitivity to Operations
It is important that executives have the ability to discuss what is happening throughout
the organizations they lead. Being able to do this displays an understanding of how things are
done and creates a culture within the organization that allows leaders to engage employees in
meaningful dialogue about normal operations. This is an important part of what Weick and
Sutcliffe (2001) refer to as sensitivity to operations. Sensitivity to operations can be described as
knowing ones trade regardless of position and having the ability to notice when operations are
even slightly askew. It is further characterized in HROs as being “attentive to the front line,
where the real work gets done (Weick & Sutcliffe, 2001, p. 13).
Leaders in HROs recognize that, in times of crisis, front line decisions must be made
without hesitation. This means the organizational structures that embrace a chain of command or
flow of information from the top must be challenged. This is the essence of sensitivity to
operations. Troops in the field, for example, have the clearest picture of what is happening on the
battlefront at any given time. They cannot depend on central command to access the situation

46
and dictate the best course of action. The immediacy of response required means the front line
must be empowered to act. Mindful organizations apply this method of operation not only to
crisis situations but make it a part of the day-to-day operations as well.
Sensitivity to operations is imperative in the school setting. School leaders must be
experts in the areas of teaching and learning. This allows them to provide immediate feedback to
teachers and listen to them articulate their concerns. This ongoing conversation about operations
increases scrutiny and should also empower teachers to take action without a check-with-me
protocol from the hierarchy. This should create a higher awareness about what needs to be done
and reduce lag time between data collection and responsive action. Additionally, interpersonal
relationships with teachers tend to be more positive if school leaders are more sensitive to what
teaching and learning are all about. This helps “create a climate where people feel safe to
question assumptions and to report problems or failures candidly” (Weick & Sutcliffe, 2001, p.
66). Sensitivity to operations leads seamlessly to deference of expertise, another feature of
mindfulness.
Commitment to Resilience
The first three characteristics of mindfulness provide guidance in regard to what
organizations can do to develop and maintain mindfulness. This is important because it helps
them seize the unexpected minor problems that arise and prevents them from growing into major
issues. These three characteristics embody the constant scrutiny described in mindful
organization. This does not produce a formula that guarantees problems will never develop into
bigger issues nor does it suggest emergencies will never occur. Indeed crisis situations will arise
and, when they do, HROs display the ability to contain the crisis and bounce back more quickly.

47
The ability to do this is referred to as commitment to resilience. “Resilience is a combination of
keeping errors small and of improving workarounds that keep the system functioning” (Weick &
Sutcliffe, 2001, p. 14). This is a major component of HROs and characteristic of mindful
organizations.
Despite the fact that the continuing scrutiny described in mindful organizations helps
prevent crisis, mistakes will happen and surprises will occur. This is true in the business setting
as well as the school setting. One major difference is that businesses that fail to bounce back run
the risk of going out of business. This is not true in the school setting. In fact, seldom are schools
closed because of poor performance. This poses a challenge for school leaders as they try to
develop mindfulness, because the reality of failure in the business world does not extend to the
school. In the event of these surprise events, school leaders must still make use of the concept of
resilience. Administrators must display strength and flexibility in coping with whatever emerges
and encourage teachers to do the same. Schools, like businesses, must be able to anticipate
problems and be resilient in adversity. “Mindful organizations do not let failure paralyze; instead
they detect, contain, and rebound from mistakes” (Hoy, 2003, p. 98).
Deference to Expertise
The top-down approach to decision making is very common in organizations today.
Additionally, the flow of information tends to move from this same top-down pattern. This can
prove to be problematic for organizations as mistakes from “higher levels tend to pick up and
combine with errors at lower levels, thereby making the resulting problem bigger, harder to
comprehend, and more prone to escalation” (Weick & Sutcliffe, 2001, p. 16). HROs recognize
this practice as an impediment to progress and instead embrace the practice of deference to

48
expertise. HROs recognize that the players on the front line are better equipped to make
decisions for two reasons. First, they are indeed experts trained to perform the job at hand and
second, their decisions are made based on knowledge specific to current circumstances. Building
on the analogy offered earlier, troops in the field are trained professionals that have an acute
view of the battlefront as it exists in real time. It only makes sense that commanders would defer
to their expertise and recognize they are the most capable decision makers.
Deference to expertise can happen only if organizations are able to let go of rigid
administrative protocols, job titles or ranks, and experience. This requires leaders to strike the
perfect balance between organizational structures that enable creativity without embracing a
laissez faire approach to leadership. The manifestation of deference to expertise is seen when
leaders consult with employees regularly and actively listen to them for advice and judgment.
This attentive, active listening promotes self-confidence that allows employees to exercise
judgment and solve problems instantly rather than waiting for directives.
HROs in the School Setting
Rossi and Stringfield (1997) identify HROs in the school setting as having the following
characteristics:
1. The central goals of HROs are clear and widely shared.
2. All staff in an HRO believe that success is critical and that failure to achieve core
tasks would be absolutely disastrous.
3. HROs stress intensive recruitment and ongoing training.
4. HROs build interdependence among staff. This is typically “rooted in the strong sense
of community” (Rossi & Stringfield, 1997, p. 7).

49
5. HROs extend formal, logical decision analysis, evolved into standard operating
procedures as far as extant knowledge allows. The idea is to “standardize proven best
practices in some areas so as to focus human attention on performing nonstandard
tasks as well”(Rossi & Stringfield, 1997, p. 7).
6. HROs prize vigilance against lapses and flexibility toward rules. Teams work to
identify student problems early and seek solutions to those problems.
7. HROs are invariably by their supervising organizations.
Because the goals of HROs are clearly understood, progress can more readily be attained.
Blankstein (2004) states that maintaining clarity and constancy of purpose is important because it
helps school accomplish two major goals. The first is that it helps reduce stress among staff
because they clearly understand the primary function of the school. And, because the target is
clear, “leaders provide direction that is clear, strong, and unambivalent” (Blankstein, 2004, p.
25).
Mindfulness in Action: The Plan, Do, Check, Act Cycle
The eight step process advocated by Davenport and Anderson (2002) requires a close
examination of data as a means of executing strategy. They utilized an adaptation of a Plan, Do,
Check, and Act instructional cycle (PDCA), coupled with an eight-step process to address
achievement gap issues. The PDAC cycle was based on Deming’s 14 points total quality control
system. It begins with planning a change or test aimed at improvement. This involves the
collection of data and the establishment of a specific time frame for implementation. The Plan
phase follows a collaborative approach that involves all stakeholders. Based on data from a
previous period of time, stakeholders formulate a plan that is characterized by concrete goals and

50
bound by time. The Do phase entails execution of the plan, which may be done on a small scale.
This is followed by the Check phase. Here, stakeholders recognize that any action brings results.
These results, whether good or bad, require an analysis of the current data. These leading
indicators then dictate what needs to happen in the Act part of the cycle. The question then is
whether the organization should apply the change, abandon it, or run through the cycle again
under different conditions. The PDCA cycle then begins again with the Plan phase. This
continuous improvement approach is popular and useful in schools today.
Davenport and Anderson (2002) expanded upon the PDCA cycle and developed what
they called the Eight-Step Process to school improvement. The first two steps in the process
involve planning. Initially, there is test score disaggregation, which requires all professional staff
members to examine the most current student test data, to identify student strengths and
weaknesses, and to create instructional groups. The second step is the development of a timeline
for execution of the plan. In this step, teachers are charged with developing an instructional
timeline that focuses the greatest emphasis on the areas where the greatest number of students
were shown to need the most help (Davenport & Anderson, 2002). The third step of the eight-
step process corresponds with the Do phase of the PDCA cycle. It is called the instructional
focus step, and involves implementation of the timeline and delivery of instruction. Davenport
and Anderson advocate the use of frequent benchmark assessments as the fourth step. The
assessment step corresponds with the Check phase of the PDCA cycle. Assessment is done to
identify students that exhibit mastery or non-mastery of skills tested. Additionally, the
assessment step allows teachers to self-monitor in the event that certain items were not
effectively taught. Steps five and six correspond to the Act phase of the cycle. Depending on
what current data of leading indicators say, students enter into either tutorials to address

51
weaknesses or enrichment activities to further advance skills. Whatever the case, this action is a
result of what the check phase dictated. Step seven in the process is a re-check. The formal
review process, scheduled throughout the instructional year, allows students to reinforce learning
from prior units. Monitoring is the eighth and final step and it also corresponds with the Check
phase of the PDCA cycle.
The Eight-Step Process easily allows for the creation of a balanced scorecard. Because it
begins with a close look at student data, the establishment of goals, and is bound by time, the
process affords users the opportunity to reduce an improvement plan to a workable scorecard.
The monitoring step of the cycle is the logical place for the school administration to constantly
review leading indicators. This leads to an improvement plan that does not allow for stagnation.
This implies that there is indeed a connection between the concept of mindfulness, the
balanced scorecard, and the continuous improvement process. The constant state of re-evaluation
present creates an agility that helps school stakeholders develop mindfulness. Mindfulness is
another important and measurable element of overall school culture. As defined by Langer
(1993), mindfulness is “a state of mind that results from drawing novel distinctions, examining
information from new perspectives, and being sensitive to context” (p. 44).
Mindfulness and Teaming
In the context of the school setting, Hoy et al. (2006) describe mindfulness as a school’s
ability to not only anticipate trouble but, in fact, to expect it. This collective quality makes a
school more resilient when trouble arises and, therefore, better able to survive difficult
circumstances. This concept is characteristic of both the balanced scorecard and the continuous
school improvement model described earlier. The balanced scorecard framework includes,

52
among others, the core principles of translating strategy into operation and making strategy a
continual process. It also makes strategy everyone’s responsibility and leads to the formation of
more effective teams.
Team building plays an important role in the process of building and utilizing a balanced
scorecard and is an integral part of any mindful organization as well. Although teaming in
mindfulness is informal it is a team-like concept. Mindfulness does, after all, require joint efforts
in ways similar to team efforts. Edmondson, Bohmer, and Pisano (2001) opined that the most
successful teams were able to adapt quickly to new ways of working. In their study of 16 cardiac
surgery teams, they suggested ways in which team leaders might create an environment
conducive to team learning. To set the right tone, team leaders should be accessible or available,
not aloof, ask for input, and serve as a “fallibility model” by admitting their mistakes to the team.
Asking for input is a form of the constant scrutiny present in mindful organizations and
by admitting mistakes, team leaders demonstrate the importance of looking for problems within
the organization. This, too, is characteristic of mindful organizations.
In an educational perspective, Hoy et al. (2006) discovered that mindfulness is
continuous and ongoing if faculty trust is high. The two seem to go hand-in-hand because
mindful teachers look for solutions to problems rather than a place to put blame. Conceptually,
mindfulness in schools is a collective quality. It can occur only when principals and faculty
members work closely together in a trusting and caring environment. Mindfulness affords
schools the ability to not only anticipate trouble but, in fact, to expect it. This makes a school
more resilient if trouble arises and, therefore, better able to survive.
Clearly, mindfulness is a concept that could be valuable in any school. Unfortunately,
Langer and Moldoveanu (2000) found that “[e]ducation is an area that often seems to abound in

53
mindlessness” (p. 3). As noted by Dattner and Dunn (2003), “[m]indlessness involves automatic,
habitual thought” (p. 2). It is characterized by the treatment of information as context-free and
true, regardless of circumstances. The end result is the application of previous solutions to
current problems. Mindlessness is prevalent when people are distracted, overloaded, and/or
multitasking. Conditions brought on by mindlessness include boredom and malaise.
Section Summary
The opportunity to study mindfulness in the school setting could prove to be beneficial.
By exploring this construct, individual faculty members can contribute a more watchful eye
concerning the state of the school and the mindfulness of individuals can affect the collective
efforts. This can generate an organizational mindfulness that leads to a climate of openness
necessary for schools to improve. By being watchful for mistakes, reluctant to simplify, and
acutely focused on teaching and learning, teachers will be better prepared for the emergent
problems they will inevitably face. They will be more resilient in times of crisis and more willing
to recognize and defer to the expert most likely to impact change.
Mindful schools will also look for structures that are more flexible. Structures such as the
Plan, Do, Check, Act cycle and the Eight-Step Process do not dictate next steps. Instead they
provide guidance yet still provide the opportunity for teachers to exercise judgment. This serves
to better empower teachers as professionals and also helps promote a more open climate. This
review of literature promotes that study in the area of mindfulness can be beneficial to the world
of education.

54
Theoretical Framework
Based on the review of literature presented, use of the balanced scorecard should have a
positive correlation to effectiveness, school climate, and mindfulness in the school. Each
construct has been defined for the purpose of the study. All will work in concert to provide the
theoretical framework for the study.
Effectiveness has been defined as achieving goals and demonstrating efficiency in the
operations of the organization to achieve goals. This framework is based on the work of Hoy and
Ferguson (1985) which, in turn, is based on the definition originally provided by Talcott Parsons.
A particular advantage to this definition is the multi-dimensional nature of measuring success. It
provides a more complete measure of success and is consistent with the balanced scorecard
method.
For the purpose of this study, the definition of climate provided by Hoy and Miskel
(2005) will be a theoretical construct. Climate is “the relatively enduring quality of the school
environment that is experienced by participants, affects their behavior, and is based on their
collective perception of behavior in school” (Hoy & Miskel, 2005, p. 185). Climate is closely
linked to integration and latency as defined using the AGIL paradigm elaborated on by Hoy and
Ferguson (1985).
Research shows mindfulness to be complementary to effectiveness and climate. The
definition of mindfulness used as a construct in this study is provided by Weick and Sutcliffe
(2001) and expanded upon by Hoy (2001). Mindfulness, effectiveness, and climate are all
concerned with problem solving, collaboration, and anticipating the unexpected. Mindfulness not
only works to strengthen the quality of the organization at the individual level but also positively
impacts the collective efficacy of the organization. Hoy et al. (2006) provided data that shows

55
the more mindful an organization is the more understanding individual participants are in regard
to effective school organizations. Mindfulness therefore can likely improve effectiveness.
The balanced scorecard has been defined by Kaplan and Norton (1996) as a management
system that enables organizations to clarify their vision and strategy and translate them into
action. As a point of emphasis they state the balanced scorecard is not a static tool for measuring
success but a tool that provides organizations a continual progress monitoring device. Because
the balanced scorecard puts strategy into action it is theorized that it will improve schools’
effectiveness consistent with the definition provided by Hoy and Ferguson (1985).
Because the balanced scorecard clarifies mission and lets all stakeholders know their role
in meeting the mission, its use should directly affect the overall climate of a school. The theory
tested is that all sub-dimensions of the OCI (Hoy, 2001) will be improved by using the balanced
scorecard. Kaplan and Norton (2000) suggest this is possible because the balanced scorecard
“gives employees a clear line of sight into how their jobs are linked to the overall objectives of
the organization” (p. 168). This is consistent with the clinical strategy for changing school
climate as described by Hoy and Miskel (2005).
Finally, the relationship to mindfulness was tested. Because the balanced scorecard keeps
targets clearly defined and because it uses real time data to guide decisions, it clearly links to the
constant scrutiny present in organizations that are mindful. Theoretically, the balanced scorecard
and mindfulness are linked.
The balanced scorecard, mindfulness, and a positive organizational climate all work
together to make a school more effective. Measuring effectiveness can be very complex. This is
in part why the balanced scorecard can be useful. Because performance on the state mandated
tests is normally considered goal attainment it is supported by the Parsonian paradigm. There is,

56
therefore, a strong organizational argument to use the state tests as a measure of effectiveness.
Mindfulness and organizational climate can be positively impacted when the balanced scorecard
is used because they each enable the responsiveness necessary for the scorecard to work. A
reciprocal relationship exists between the scorecard and mindfulness and climate. This study is
based on the theory that the balanced scorecard, organizational climate, mindfulness, and
effectiveness are all codependent.
To test the theory, schools that use the balanced scorecard were compared to schools that
do not use the balanced scorecard. The relationship of a balanced scorecard to school climate and
its dimensions was measured. The relationship of the balanced scorecard to mindfulness was also
measured. Finally, the study tested the theory in regard to the balanced scorecard and school
effectiveness.
Rationale for the Study
This study will potentially provide a strong framework for monitoring school
improvement. Because the balanced scorecard uses leading and lagging indicators toward
progress, the study will help schools better understand the continuous school improvement
process. The study helps administrators and teachers better understand the analysis of test data
for the purpose of building a strategic student schedule. It also helps administrators and teachers
utilize data for driving instruction throughout the academic year. Administrators will be able to
use the scorecard as a summative tool for the evaluation of the academic year and as a strategic
learning tool that creates ongoing formative monitoring. The study also helps teachers and
administrators better understand school climate and its impact on school performance. Finally,

57
teachers and administrators better understand the concept of mindfulness and its impact on
school performance.
Hypotheses
This study tested three hypotheses. The first hypothesis is “Schools implementing the
balanced scorecard are more effective than schools not using the balanced scorecard.” The
second hypothesis is “Schools implementing the balanced scorecard will have higher levels of
organizational climate along all four dimensions of the OCI than schools not using the balanced
scorecard.” And the third and final hypothesis is “Schools implementing the balanced scorecard
will have higher levels of mindfulness than schools not using the balanced scorecard.”
Chapter Summary
The concepts and definitions of the balanced scorecard, mindfulness, and organizational
climate have been presented in this chapter. School effectiveness has also been discussed and
defined and all four have been linked together as interdependent elements of the study. An
argument was presented to show that the balanced scorecard, mindfulness, and organizational
climate all capture different elements of school effectiveness. It was further presented that the
use of the balanced scorecard leads to more effective schools. This is because use of the balanced
scorecard creates internal operations in the school that supports monitoring and improving
performance. The case has been made that schools that use the balanced scorecard will be more
effective than schools that do not. Additionally, the case has been presented to suggest schools
that use the balanced scorecard will have higher levels of mindfulness and healthier climates than
schools that do not. Hypotheses have been presented to test a theory.

58
CHAPTER III
METHODOLOGY
Introduction
The description of the research methodology and the procedures used for the study will
be presented in this chapter. Survey instruments, data sources, and the methods of data analysis
will be discussed. Permission from the Institutional Review Board for Human Subjects was
sought prior to collecting any data used in the study.
Design
The design of the study was to assess the impact that the balanced scorecard approach has
on the organizational health of a school and the collective mindfulness of the faculty. The study
was intended to test the predicted relationships of the balanced scorecard, mindfulness, climate,
and effectiveness in a select group of schools in Georgia.
To test climate and mindfulness, two groups of schools were surveyed. The balanced
scorecard was utilized by roughly half of the schools in the study and was the independent
variable. The dependent variables used were climate, as measured by the OCI, and mindfulness,
as measured by the M-Scale. The climate and mindfulness of both the balanced scorecard group
and the non-balanced scorecard group were measured.
To test for school effectiveness, two groups of schools were studied and again half used
the balanced scorecard while half did not. The sample included equal numbers of elementary,

59
middle, and high schools. The balanced scorecard was used as the independent variable,
socioeconomic status as the control, and achievement was used as a dependent variable.
Participants and Sampling Procedures
This study includes select schools in the Metro Regional Educational Service Agency,
West Georgia Regional Educational Service Agency, and Northwest Georgia Regional
Educational Service Agency. The target population was teachers from elementary, middle, and
high schools. OCI surveys were collected from 1,102 teachers. M-Scale surveys were collected
from 1,089 teachers. The sample size yielded an adequate data set to ensure reliability. Within
the three RESA districts, school characteristics are very similar in terms of size, demographics,
and socioeconomic makeup. A total of 82 schools were surveyed for the study. Sixty-two schools
provided adequate responses to provide OCI scores. Thirty-seven of those schools did not use the
balanced scorecard and 25 did use the balanced scorecard. The survey sample produced 51
individual school M-Scale scores. Among the 51 schools, 25 did not use the balanced scorecard
and 26 did.
Sixty schools from the subject group were randomly selected to test effectiveness. Thirty
of those schools used the balanced scorecard and thirty did not. Equal numbers of high schools,
middle schools, and elementary schools were randomly selected for each group. Test data for
each school were collected from the Georgia Department of Education website.
Study Instruments
Participants involved in the study completed the Organizational Climate Index (OCI)
(Hoy, 2001) and the M-Scale survey (Hoy, 2001). The OCI is an organizational climate

60
descriptive measure for schools. It is designed to measure the harmony present when the
institutional, administrative, and teacher levels work in concert. The instrument has four
dimensions which include a combination of items from the Organizational Health Inventory
(OHI) and the Organizational Climate Description Questionnaire (OCDQ), also developed by
Hoy. The four dimensions are Collegial Leadership (CL), Professional Teacher Behavior (PTB),
Achievement Press (AP), and Institutional Vulnerability (IV). OCI scores were compiled by
having participants answer 30 questions on a 4-point Likert-type scale. Sample items include
“the learning environment is orderly and serious” and “the principal is friendly and
approachable.” The response choices are assigned points. One point is assigned for Rarely
Occurs, 2 points for Sometimes Occurs, 3 for Often Occurs, and 4 for Very Frequently Occurs.
Each dimension of the OCI was measured by a subtest and reliability scores for the scales were
relatively high. A factor analysis of the instrument supports the construct validity of the concept
of school climate (Hoy et al., 2002).
The M-Scale score is based on a 14-item, 6-point Likert-type scale. It is designed to
measure the extent to which teachers and administrators in a school carefully and regularly look
for problems, prevent problems from becoming crises, are reluctant to oversimplify events, focus
on teaching and learning, are resilient to problems, and defer to expertise. Sample items include
“the principal welcomes challenges from teachers” and “in this school teachers welcome
feedback about ways to improve.” The response choices for the M-Scale are based on a 6-point
scale beginning with 1 point for Strongly Disagree and 6 points for Strongly Agree. The
reliability of the scale is consistently high and the construct validity has been supported in three
factor analyses (Hoy et al., 2006).

61
Data Collection
The researcher hand-delivered surveys to each building level principal in the subject
group. The researcher requested that principals administer the survey at a regularly scheduled
faculty meeting. Participating principals received e-mail reminders encouraging completion of
the surveys. Complete copies of the inventories are given in full in the Appendix.
To introduce the study, the student researcher met with groups of principals to explain the
study. Principals were given the opportunity to read the informed consent and ask any questions
concerning the study. Principals were told that they could choose not to participate as individuals
and/or schools. No coercion or undue influence was placed on principals.
Teachers received information regarding the study through the informed consent during a
regularly scheduled faculty meeting at their particular school. All teachers in the contacted
schools were asked to participate in the study. There is no inclusion or exclusion criterion,
otherwise. Participation was completely voluntary and no incentives were offered or extended.
All teachers were given a copy of both the OCI and M-Scale to complete.
Data Analysis
Establishing an Organizational Climate Index (OCI) score for each school involved a
three-step process. The first step was to score each item for each respondent with the appropriate
number 1, 2, 3, or 4. One point was awarded for each response of Rarely Occurs (RO), 2 points
for each response of Sometimes Occurs (SO), 3 points for each response of Often Occurs (O),
and 4 points for each response of Very Frequently Occurs (VFO). Items 4, 14, and 30 were not
scored due to the fact they are filler items. Step two required calculating an average school score
for each item. This is completed by adding all teacher scores for each school on each survey item

62
and then dividing each sum by the number of teachers in the school. The score is rounded to the
nearest hundredth. This process produced 27 average school item scores. The third and final step
is to sum the average school item scores for each of the four areas of the instrument. Specific
items that correlate with each area of the instrument are elaborated by Hoy (2001). These four
scores were used to establish the health profile of each of the participating schools.
Establishing the Mindfulness score for each school is a similar process. All items on the
M-Scale are answered with either Strongly Agree (SA) or Strongly Disagree (SD). Each response
receives 1 point or 6 points, depending on the response. The total number of points is divided by
14, the total number of items, to find the average score. This represents the level of mindfulness
for a particular school and was used to establish a mindfulness (M) rating for each school. The
researcher utilized computer scan sheets to tabulate both the OCI score and M score for each
school.
To answer the first research question and test the first hypothesis, two regression analyses
were conducted. One regression analysis for the 3-year average math score and the other
regression analysis for the 3-year average ELA score. In each test, the percentage of students
receiving a free or reduced price lunch (SES) was used as a control, and whether or not the
school used a balanced scorecard was the independent variable.
To address the second research question and test the second hypothesis, four independent
samples t tests were performed, one for each of the four OCI scales.
Finally, to answer the third research question and test the third hypothesis, an
independent samples t test was used to determine the relationship of the balanced scorecard to
mindfulness.
63
CHAPTER IV
RESULTS
Introduction
This chapter describes the results of gathering and analyzing data. Statistics describing
the sample, respondents, and measures will be presented. Reliability coefficients of all measures
are given. Finally, the results of hypotheses testing are given.
The purpose of this study was to determine if the use of the balanced scorecard can
provide schools with the necessary tools to monitor progress more accurately and increase
organizational climate, mindfulness, and overall effectiveness. Schools using the balanced
scorecard were compared to schools not using the balanced scorecard in terms of organizational
climate, mindfulness, and overall effectiveness measures. The central hypothesis of the study
was partially supported. Schools that use the balanced scorecard performed better than schools
that did not, in some instances.
Initially, descriptive statistics were computed for all study variables. This was followed
by analyses of reliabilities for both the OCI and M-scale. Next, the three hypotheses that
correspond to the three research questions are addressed. The chapter ends with a summary of
key findings.

64
Descriptive Statistics
Sixty schools from the subject group were selected to test academic effectiveness.
Sixteen high schools, 16 middle schools, and 28 elementary schools were selected for each
group. Among each group, the number of schools that use the balanced scorecard was the same
as the number that did not. Thirty of the schools in the effectiveness study use the balanced
scorecard and 30 do not. Table 1 shows the descriptive statistics for math and ELA scores as a
function of the use of the balanced scorecard. Test data for each school were collected from the
Georgia Department of Education website.
Table 1 Descriptive Statistics for Math and ELA Scores as a Function of the Use of the Balanced Scorecard Did Not Use the
Balanced Scorecard (n = 30)
Did Use the Balanced Scorecard (n = 30)
Total Sample (N = 60)
M SD M SD M SD 2006 Math 75.81 11.13 77.63 12.60 76.72 11.82 2007 Math 75.15 9.89 79.60 10.46 77.37 10.34 2008 Math 70.05 7.42 77.24 7.71 73.65 8.34 Average Math 73.67 7.96 78.16 9.51 75.91 8.98 2006 ELA 82.28 7.58 86.41 4.96 84.34 6.68 2007 ELA 83.60 7.35 89.38 4.48 86.49 6.70 2008 ELA 87.20 4.03 90.60 3.28 88.90 4.03 Average ELA 84.36 5.84 88.80 3.84 86.58 5.39

65
To test the influence the balanced scorecard has on climate, a total of 82 schools were
surveyed. Sixty-two schools provided adequate OCI responses. The OCI data set includes 35
elementary schools, 20 middle schools, and 7 high schools. Twenty-seven of the OCI schools use
the balanced scorecard and 35 do not. OCI surveys were collected from 1,101 teachers. Table 2
shows the descriptive statistics for OCI scales as a function of the use of the balanced scorecard.
The mean scores for the schools that used the balanced scorecard and the schools that did not use
the balanced scorecard on the four OCI dimensions are shown as part of the descriptive statistics
in Table 2.
Table 2 Descriptive Statistics for OCI Scales as a Function of the Use of the Balanced Scorecard Did Use the
Balanced Scorecard (n = 27)
Did Not Use the Balanced Scorecard (n = 35)
Total Sample (N = 62)
M SD M SD M SD Collegial Leadership 20.47 1.87 22.61 1.91 21.50 2.16 Professional Teacher Behavior
21.09 1.60 22.49 1.77 21.76 1.81
Achievement Press 20.86 1.92 21.51 1.72 21.17 1.84 Institutional Vulnerability 11.56 1.26 11.37 1.31 11.47 1.28
The sample includes M-Scale responses from 51 schools. Table 3 shows the descriptive
statistics for the M-Scale as a function of the use of the balanced scorecard. The mean for
schools that used the balanced scorecard (M = 63.20, SD = 5.05) was significantly higher than
the mean for schools that did not use the balanced scorecard (M = 44.56, SD = 9.04). The M-

66
Scale data set includes 28 elementary schools, 17 middle schools, and 6 high schools. Twenty-
six of the schools in the set use the balanced scorecard and 25 do not. M-Scale surveys were
collected from 1,089 respondents.
Table 3 Descriptive Statistics for Mindfulness Scale as a Function of the Use of the Balanced Scorecard Did Not Use the
Balanced Scorecard (n = 25)
Did Use the Balanced Scorecard (n = 26)
Total Sample (N = 51)
M SD M SD M SD Mindfulness 44.56 9.04 63.20 5.05 54.06 11.86
Analysis of Reliability
Reliability coefficients for the teacher-level analysis of the OCI and Mindfulness Scale
are shown in Table 4. The reliability coefficients (Cronbach’s α internal consistency) for the four
variables from the OCI were all above .70: Collegial Leadership (.88), Professional Teacher
Behavior (.85), Achievement Press (.81), and Institutional Vulnerability (.73). For the
Mindfulness Scale, the reliability coefficient was .94. Therefore, for all five of the composite
measures used in this study, the reliability coefficients were above the conventional cutoff of .70
for adequate reliability.

67
Table 4 Reliability Coefficients for Composite Measures
n Number of
Items.
Cronbach’s α School Climate
Collegial Leadership 1100 7 .88 Professional Teacher Behavior 1099 7 .85 Achievement Press 1097 8 .81 Institutional Vulnerability 1100 5 .73
Mindfulness 1087 14 .94
Hypothesis 1 Testing
The first research hypothesis of this study was as follows: Are schools that use the
balanced scorecard more effective than schools that do not use the balanced scorecard? Both
math and ELA student achievement were examined. Table 1 shows the math and ELA scores for
each year and the average of the 3 years as a function of whether or not the school used the
balanced scorecard.
There were no significant differences in math scores between schools that used the
balanced scorecard and schools that did not. There were, however, significant differences in ELA
scores between schools that used the balanced scorecard and schools that did not. For each of the
3 years and for the average of the 3 years, schools that used the balanced scorecard appear to
have outperformed schools that did not use the balanced scorecard in terms of math scores, with
the largest difference in 2008 and the smallest difference in 2006. For ELA scores the same trend
was observed with respect to higher scores for schools that did use the balanced scorecard than
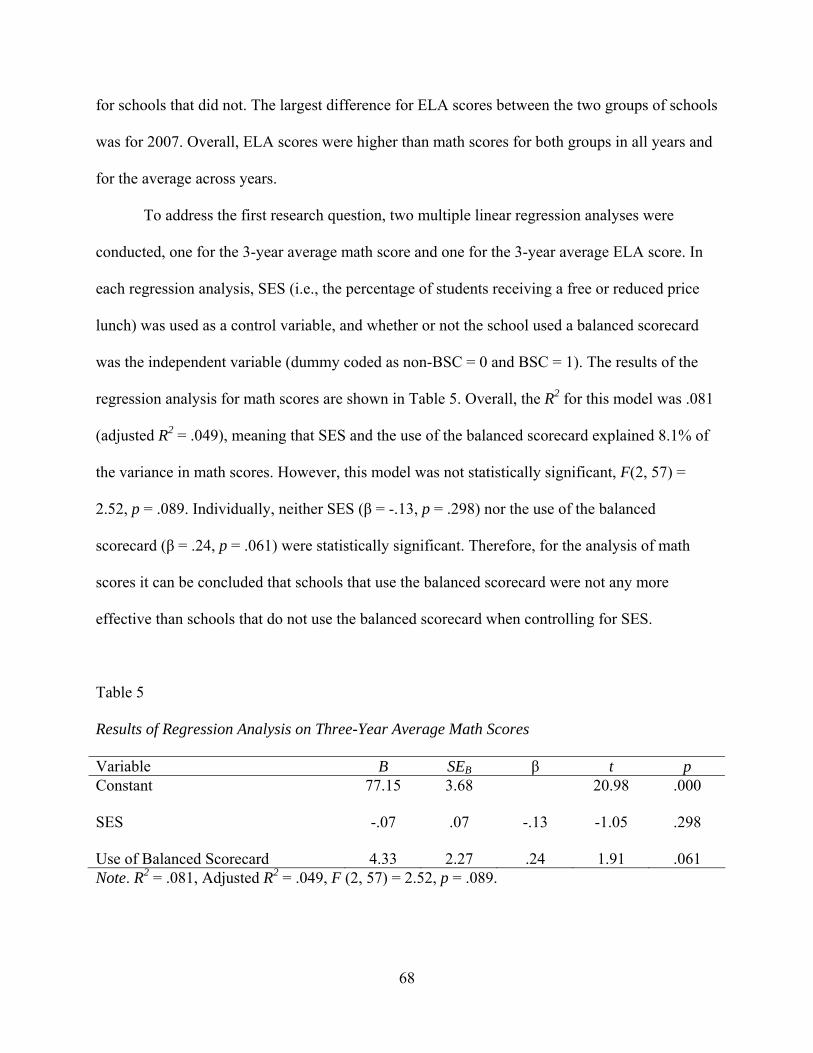
68
for schools that did not. The largest difference for ELA scores between the two groups of schools
was for 2007. Overall, ELA scores were higher than math scores for both groups in all years and
for the average across years.
To address the first research question, two multiple linear regression analyses were
conducted, one for the 3-year average math score and one for the 3-year average ELA score. In
each regression analysis, SES (i.e., the percentage of students receiving a free or reduced price
lunch) was used as a control variable, and whether or not the school used a balanced scorecard
was the independent variable (dummy coded as non-BSC = 0 and BSC = 1). The results of the
regression analysis for math scores are shown in Table 5. Overall, the R2 for this model was .081
(adjusted R2 = .049), meaning that SES and the use of the balanced scorecard explained 8.1% of
the variance in math scores. However, this model was not statistically significant, F(2, 57) =
2.52, p = .089. Individually, neither SES (β = -.13, p = .298) nor the use of the balanced
scorecard (β = .24, p = .061) were statistically significant. Therefore, for the analysis of math
scores it can be concluded that schools that use the balanced scorecard were not any more
effective than schools that do not use the balanced scorecard when controlling for SES.
Table 5 Results of Regression Analysis on Three-Year Average Math Scores Variable B SEB β t p Constant 77.15 3.68 20.98 .000 SES -.07 .07 -.13 -1.05 .298 Use of Balanced Scorecard 4.33 2.27 .24 1.91 .061 Note. R2 = .081, Adjusted R2 = .049, F (2, 57) = 2.52, p = .089.

69
The results of the analysis for ELA scores are shown in Table 6. The effect of the control
variable SES on ELA scores was not statistically significant, F(1, 57) = 1.87, p = .177. However,
the effect of the use of a balanced scorecard did have a statistically significant effect on ELA
scores, F(1, 57) = 11.57, p = .001. Referring to the means in Table 1, the statistically significant
effect of the use of the balanced scorecard was the result of better ELA performance in schools
that used the balanced scorecard (M = 88.80, SD = 3.84) than in schools that did not use the
balanced scorecard (M = 84.36, SD = 5.84).
The results of the regression analysis for ELA scores are shown in Table 6. The
regression model as a whole was statistically significant, F(2, 57) = 7.06, p = .002. The R2 of
.198 (Adjusted R2 = .170) indicated that SES and the use of a balanced scorecard explained
19.8% of the variance in ELA scores. While SES was not statistically significant (β = -.16, p =
.177), the use of the balanced scorecard did have a statistically significant effect (β = .40, p =
.001). The positive regression coefficient indicates that schools that used the balanced scorecard
(coded as 1) had higher ELA scores than schools that did not use the balanced scorecard (coded
as 0). This can also be seen in the means presented in Table 2, where schools that used the
balanced scorecard had a higher mean (M = 88.80, SD = 3.84) than schools that did not (M =
84.36, SD = 5.84).
Table 6 Results of Regression Analysis on Three-Year Average ELA Scores Variable B SEB β t p Constant 86.90 2.06 42.17 .000 SES -.05 .04 -.16 -1.37 .177 Use of Balanced Scorecard 4.32 1.27 .40 3.40 .001

70
Hypothesis 2 Testing
The second hypothesis of this study was as follows: Schools implementing the balanced
scorecard will have higher levels of organizational climate along all four dimensions of the OCI
than schools not using the balanced scorecard. It appears that the schools that did use the
balanced scorecard had slightly higher scores on the Collegial Leadership and Professional
Teacher Behavior scales, and to a lesser extent on the Achievement Press scale, while there was
virtually no difference on the Institutional Vulnerability scale.
To address the second research question, four independent samples t tests were
performed, one for each of the four OCI scales. Table 7 shows the results of these tests. The test
performed on the Collegial Leadership scale was statistically significant, t(50) = -4.07, p < .001.
This indicated that schools that used the balanced scorecard scored higher on the Collegial
Leadership scale (M = 22.61, SD = 1.91) than schools that did not use the balanced scorecard (M
= 20.47, SD = 1.87).
The test performed on the Professional Teacher Behavior scale was also statistically
significant, t(50) = -2.99, p = .004. This indicated that schools that used the balanced scorecard
scored higher on this scale (M = 22.49, SD = 1.77) than schools that did not (M = 21.09, SD =
1.60).
For the Achievement Press scale, the independent samples t test was not statistically
significant, t(50) = -1.29, p = .202. Similarly, the test performed on the Institutional
Vulnerability scale was not statistically significant, t(50) = .50, p = .608. Therefore, for the
Achievement Press and Institutional Vulnerability scales, there was no difference between
schools that used the balanced scorecard and schools that did not.

71
Table 7 Results of Independent Samples t Tests Comparing Schools that Used the Balanced Scorecard to Schools that Did Not on the OCI Scales OCI Scale t df p Collegial Leadership -4.07 50 <.001 Professional Teacher Behavior -2.99 50 .004 Achievement Press -1.29 50 .202 Institutional Vulnerability .52 50 .608
Hypothesis 3 Testing
The third and final hypothesis of this study was as follows: Schools implementing the
balanced scorecard will have higher levels of mindfulness than schools not using the balanced
scorecard. The results of the independent samples t test shown in Table 8 indicated that this
difference was statistically significant, t(49) = -9.15, p < .001.
Table 8 Results of Independent Samples t Test Comparing Schools that Used the Balanced Scorecard to Schools that Did Not on the Mindfulness Scale t Df p Mindfulness -9.15 49 <.001
Summary of Findings
The use of the balanced scorecard had mixed success in regard to predicting achievement.
In the sample set, schools that used the balanced scorecard had higher ELA achievement than

72
schools that did not use the balanced scorecard, but there was no difference for math
achievement.
The schools that used the balanced scorecard had better Collegial Leadership scores and
better Professional Teacher Behavior Scores than schools that did not use the balanced scorecard,
but that there was no difference on the Achievement Press or Institutional Vulnerability scale.
Schools that used the balanced scorecard had much higher mindfulness scores than
schools that did not use the balanced scorecard. Therefore, the answer to the third research
question is that schools that used the balanced scorecard had higher levels of mindfulness than
schools that did not use the balanced scorecard.

73
CHAPTER V
DISCUSSION
Chapter V presents an overview of the relationship of the balanced scorecard to school
effectiveness, organizational climate, and mindfulness. Limitations, implications, and
recommendations for further investigation are also given. The chapter ends with concluding
thoughts.
Implications
Academic Achievement
The results of this study indicated that schools that used the balanced scorecard had
mixed success in predicting academic performance. Two multiple linear regression analyses
were conducted in order to test the theory. In both tests, socioeconomic status was used as a
control variable and the balanced scorecard was the independent variable. The results of the
regression analysis for math scores, as presented in Table 5, concluded that schools that use the
balanced scorecard were not any more effective than schools that do not use the balanced
scorecard when controlling for SES. The results of the regression analysis for ELA scores,
however, produced a positive regression coefficient thus concluding that schools that use the
balanced scorecard are more effective in the area of ELA (see Table 6).
The effect of socioeconomic condition on student achievement is well documented and
the researcher does not challenge the impact SES has on student outcomes. Nonetheless, the

74
sample for this study indicated an insignificant relationship between SES and achievement. This
was true for both math scores and ELA scores. Sample size is one probable cause for this
instance. There is always a relationship between margin of error and sample size. As sample size
decreases, the margin of error in the statistical analysis increases. The lack of SES impact on test
scores in this study speaks more to the characteristic of the sample. The schools within the
sample are geographically close to one another resulting in a relatively homogeneous sample.
This restriction likely did not provide enough variation in SES to produce a correlation. This is a
useful finding in the study because the sample provides the opportunity to measure more
precisely the impact other variables, such as the balanced scorecard, may have on achievement.
The researcher maintains the assertion that the balanced scorecard is an appropriate tool
for measuring student achievement. Because the state test data used for construction of the
balanced scorecard are congruent with school AYP reports, schools simply must use them as
annual targets. This could, however, be problematic in terms of the balanced scorecard because
achievement is then measured by a single event. While measuring achievement is an appropriate
use of the balanced scorecard, the use of summative tests may send an unintended message. The
intended use of the balanced scorecard is to avoid putting emphasis on year-end reports. Instead,
an effective balanced scorecard should more effectively capture data from leading indicators to
better effect achievement. Leading indicators, such as benchmark test results and classroom level
grade distribution reports would better serve administrators. The concern here is not that the
balanced scorecard has no impact on achievement, but that a better balanced scorecard would
include lead data.
Advances in technology and an increased awareness of results have caused schools to be
more cognizant of data than ever before. Data are collected in many forms and from many

75
sources. This has resulted in many schools’ shifting their thinking from the processes they are
engaged in and focusing solely on the results they produce. This is the central problem
introduced in this study. The Maryland Assessment Group addressed this problem at its annual
conference in 2004. They suggest that schools often use data solely for accountability purposes.
When this happens, data are arranged in a hierarchy where the external state assessments are the
guiding force, and tools such as system benchmark tests, common course assessments, and day-
to-day student work is forgotten. Instead, the hierarchy of data for instructional decision making
would be completely opposite. Classroom assessment of student work would lead the charge,
and state tests would lag behind. The use of lead data as a tool to impact instruction also requires
a higher level of instructional leadership from the school principal. This type of leadership is a
key component of the PDCA cycle.
The “check” phase of the PDCA cycle requires the building level principal to monitor
both the implementation and effectiveness of the plan. The primary job here is twofold. First, the
principal must make certain that the goals established by the balanced scorecard do not fall from
the mind’s eye of the faculty. This can be achieved by constantly referencing the goals and
asking teachers to provide evidence of learning that points to progress towards achieving the
goals. Second, the principal must frequently visit classrooms and make certain that teachers are
utilizing best practices and adjusting instruction as needed. Principals must “assume the chief
responsibility for monitoring program success” (Davenport & Anderson, 2002, p. 101). While
these efforts should certainly be supported by the efforts of assistant principals and lead teachers,
it is the principal who must set the tone for school improvement. This requires the principal to
regularly spend quality time monitoring the progress of learning in classrooms. It also requires

76
principals to be better informed in regard to assessment techniques. They must be able to aid
teachers in the struggle that still exists concerning the difference between testing and assessment.
No Child Left Behind legislation has created an atmosphere where standardized test
results have become the primary focus. Teaching, learning, and formative ongoing assessment
for learning have been compromised. Instead, teachers all too often focus on testing of learning.
The difference is assessment for learning is compatible with the plan, do, check, act cycle. It
allows teachers to assess where a student is, where he needs to go, and what needs to be done to
make progress. Testing of learning, on the other hand, is strictly summative and does very little
to inform the decision-making process. Continuous monitoring of teaching and learning is the
type of instructional leadership needed from principals to help lead data translate to strategy.
Finding ways to measure the level of instructional leadership provided by the principal, though
challenging, is a necessary addition to a more effective balanced scorecard. The researcher
suggests adding effective school level administrative processes as a strategic objective. This
would fit in the goal area identified as organizational effectiveness and both the number of
classroom visits and number of teacher conferences could be used as units of measure.
Part of the theoretical framework for this study is the belief that the constant state of re-
evaluation present in mindful organizations creates an agility that helps them be responsive to
potential problems. This is significant because the very design of the balanced scorecard helps
frame and emphasize potential problems by establishing goals and dictating strategy. If this is
true, the obvious question to be answered here is how can schools that use the balanced
scorecard exhibit higher levels of mindfulness yet be only minimally more effective,
academically, than those that do not? If indeed mindful organizations “are attentive to the front
line, where the real work gets done” (Weick & Sutcliffe, 2001, p. 13), how does this not translate

77
to student achievement as the results of this study suggest? The answer to the question can
perhaps be found in another area of the definition of mindfulness,; deference to expertise.
Deference to expertise is described by Weick and Sutcliffe (2001) as a migration of the
decision-making process. Simply put, when systems are operating normally the decision-making
process is a top down approach. However, as conditions change from normal to a faster pace or
even emergency, the decision makers on the front line need to be allowed the freedom to act with
immediacy. Without this freedom, small problems can quickly develop into catastrophic events.
Conceptually, this idea is powerful. It seems to suggest that teachers in mindful schools are
allowed greater freedom in regard to what should be happening instructionally. The high degree
of professional autonomy granted to teachers, however, does not guarantee success. Professional
autonomy is often juxtaposed with abdication of administrative oversight. The high level of
teacher autonomy present in schools begs for a closer examination of the loose coupling
perspective discussed by Weick (1976).
Schools have long been recognized as loosely structured organizations (Bidwell, 1965).
Teachers are charged with providing instruction to students with a wide range of academic
abilities and interests and are thus allowed great professional freedom in regard to how they meet
the individual needs of students. The majority of teaching taking place in schools goes
unobserved by either administrators or lead teachers, and classroom teachers, consequently,
enjoy high levels of authority over students. This is desirable in the sense that teachers should
enjoy the ability to make instructional decisions quickly so emergent problems can be addressed
and teaching can continue without interruption. Teachers are, after all, considered to be content
experts and professionals in the arena of pedagogy. Despite the fact that teachers, as individuals
or departments, have specific curriculum goals, in the very broad sense, all teachers in any

78
particular school work to advance students and help their school achieve its goal. Because all
teachers in a school are working to achieve the same goal, a certain level of standard operating
procedures must be in place. There must be balance in the sense that teacher autonomy should be
married to mutual accountability. This is the essence of loose coupling.
Weick (1976) expands upon the loose coupling studies of Glassman (1973) and March
and Olsen (1975). These studies focus on organizations where there is often a disconnection
between the behaviors of individuals, or groups of individuals, and the outcomes produced by the
organization at large. Loose coupling is best described when “coupled events are responsive, but
that each event also preserves its own identity and some evidence of its physical or logical
separateness” (Weick, 1976, p. 3). This is obviously present in educational organizations where a
great deal of work is departmentalized. Hoy and Miskel (2005) link structural looseness in
schools to the work of Bidwell (1965). Teachers think of their work as independent of principals
and principals usually view what they do as independent of the county office. The epitome of
departmentalization occurs within the central office where departments rarely interact as they
simultaneously work to achieve the same goal. Loose coupling can be effective because it allows
the parties involved to preserve their autonomy while concurrently holding themselves and
others accountable to the goals of the organization. This should create an atmosphere that
strengthens the desire to promote the common good and allows individuals the freedom to act
immediately without checking with the higher ups. This is clearly congruent with the concept of
mindfulness and should result in a manifestation of mindful behavior in schools.
A common unintended consequence of loose coupling in schools, however, is poor
monitoring of the teaching process. This takes us back to the earlier notion that professional
autonomy can very easily turn into administrative neglect. This happens because there is often a

79
noticeable gap between what Weick (1976) calls certification and inspection. The term
certification is used to answer the question “who does the work,” while inspection seeks to find
out “how well the work is done.” Administrators have a tendency to focus on management issues
(who does the work) and often no organizational structure is in place to monitor the impact of
instruction (how well the work is done). This is common in loosely coupled organizations
because members tend to trust one another to get the job done. This creates a problem in schools
because “the work is intrinsically uninspected and unevaluated or if it is evaluated it is done so
infrequently and in a perfunctory manner (Weick, 1976, p. 11). This is perhaps true because
administrators fail to make distinctions between normal times and the high-tempo, emergency
times described by Weick (2001). It is important to note that HROs embrace mindfulness but the
deference to expertise described is to take place only in the event of an emergency. The mode of
operations in normal times requires a closer level of supervision from the top. In the practical
sense it may be true that teachers operate better when fewer precise rules are in place and
administrators would be wise to avoid absolute rules. However, the concept of mindfulness and
specifically, deference to expertise, should not translate to organizational looseness that is void
of administrative oversight. It is important to remember that while some organizations are
loosely coupled because they infrequently interact (Snook, 2000), they can at the same time be
tightly coupled because their actions lead to the attainment of a common goal (Beekun & Glick,
2001).
The results of this study reveal that teachers in schools that use the balanced scorecard
have higher levels of mindfulness than teachers where the balanced scorecard is not used. While
teachers in schools that use the balanced scorecard may have a preoccupation with failure and
may even support the notion of deference to expertise, the researcher believes the concept of

80
sensitivity to operations gets lost in loosely coupled organizations. This is certainly not
purposeful but rather illustrates the complexity of mindfulness and the difficulty of shifting
culture in schools. Defining mindfulness for a faculty and changing behaviors from the
standpoint of management can be done with relative ease. Creating a culture of mindfulness,
however, can be a more lengthy process that can challenge the leadership skills of principals.
This is true because the very nature of mindfulness requires a shift in thinking that results in a
shift in beliefs. If teachers, indeed, are more committed to resilience they expect more of
themselves and others. Weick (2001) describes this as a change in culture where “a new set of
expectations and a new urgency” (p. 119) drive the organization. High mutual expectations
extend to all team members without exception. Teachers will more easily accept the expectation
of a preoccupation with failure because current NCLB legislation has made failure more real
than ever before. Deference to expertise is accepted because teachers like the idea of being in
control of their domain. Sensitivity to operations, on the other hand, includes a never ending
vetting process where teachers carefully test the instructional prowess of administrators.
Therefore, a shift in sensitivity to operations can only happen if principals guide the learning
communities in schools and actively engage teachers in an ongoing conversation about what
good teaching and learning looks like. Administrators need to do a better job of monitoring the
teaching process. For this to happen, school leaders must be
unremitting in their scan for problems and never so removed from the day-to-day operations that they have difficulty understanding what is happening and why. Thus it is especially important for school leaders to stay close to teaching and learning in the classroom. (Hoy, 2003, p. 98)
While schools that use the balanced scorecard may exhibit more mindful behavior, the culture of
mindfulness is a slow-changing process that requires administrative attention.

81
Another unintended consequence of loose coupling in schools could be the lack of
administrative oversight in the area of curriculum. The shift to a standards-based curriculum has
not helped alleviate the problem of curriculum confusion. Despite the efforts of state officials to
provide a prioritized curriculum for every subject, “the classroom teacher ultimately decides how
much time to allocate to subjects, what topic to cover, and in what order they should be taught”
(Manzo, 2003, p. 8). This often leads to a discrepancy between what is supposed to be taught and
what is actually taught. This is discussed in detail by Marzano (2003). His work referenced three
types of curricula identified by the Second International Mathematics Study conducted in the late
1970s and early 1980s. The study shows a disconnect between the content specified by the state,
the content taught by the teacher, and the content actually learned by the students. Sausner
(2005) asserts that a visit to “five different fourth-grade classrooms [will produce] five radically
different qualities of work” (p. 32). The point being reinforced here is thav teacher autonomy,
which is present in loosely coupled schools, can inadvertently lead to a reduction of collective
focus. As was mentioned earlier, teachers are considered the content experts and most principals
defer to this expertise naturally. This leads to infrequent or superficial contact between teachers
and principals during common planning time in most schools and translates into curriculum
neglect in many cases. Just as principals must be leaders in observing classrooms, they must be
present and engaged during teacher planning time. This requires a level of instructional
leadership from the principal that is again a cultural shift in the school setting. Creating,
maintaining, and growing the professional learning communities in schools needs to be
appropriately targeted and measured on a balanced scorecard.
Although the balanced scorecard is built around S.M.A.R.T. goals that should translate
into strategy, establishing goals does not always equal success. While annual test scores should
82
be the manifestation of day-to-day instruction, they have the propensity to provide a summative
report. Framing the targets for achievement, as the balanced scorecard does, should provide a
more intense classroom focus. The amount of administrative attention given to any monitoring
system, including the balanced scorecard, is difficult to measure. This is true because building
administrators often enjoy a high degree of professional autonomy. Finding ways to monitor the
level of instructional leadership provided by the school administrators as a result of data framed
by the balanced scorecard is a challenge. Nonetheless, a better balanced scorecard would include
this lead data.
Mindfulness, Collegial Leadership, and Professional Teacher Behavior
This study shows that mindfulness, collegial leadership, and professional teacher
behavior are all stronger when schools use the balanced scorecard. Collegial leadership (CL) and
professional teacher behavior (PTB), sub-dimensions of the OCI, are both compatible with the
concept of mindfulness. All four sub-dimensions of the OCI were compared using four
independent samples t tests. The results of the tests can be found in Table 7. The results of the
independent samples t test for mindfulness are shown in Table 8.
The elements of effective teaming, central to mindfulness and brought about through an
effective balanced scorecard, have been discussed by Edmondson et al. (2001). Teaming can
logically be linked to Collegial Leadership and Professional Teacher Behavior, which are both
sub-dimensions of the OCI. Where CL is high we see a stronger team. This is true because the
principal treats teachers as professional colleagues and demonstrates a leadership style that is
more democratic and open. Because the balanced scorecard has firm goals that have been
developed collaboratively, expectations and standards of performance are clear. The levels of

83
collegial respect and autonomous judgment present when PTB is high are also central to more
effective and mindful teams.
The researcher wishes to reiterate elements from the earlier discussion on loose coupling.
While the results of the study indicate higher levels of mindfulness, collegial leadership, and
professional teacher behavior are present when schools use the balanced scorecard, work in the
area of growing these qualities needs to be continued. It is encouraging to find these qualities are
linked to a strategic planning tool and that they can apparently be developed. While mindfulness
is recognized as a management tool and CL and PTB are elements of climate, having any or all
of these qualities permeate the culture of a school takes a deeper level of leadership from school
administrators.
Achievement Press and Institutional Vulnerability
The lack of difference in Achievement Press (AP) and Institutional Vulnerability (IV)
between balanced scorecard schools and non-balanced scorecard schools requires inspection.
The results of the independent samples t tests for AP and IV are located in Table 7. As was
discussed earlier, changing the climate of a school is of primary concern to school
administrators. The process of change is difficult and slow. “Long-term systemic effort is more
likely to produce change than short-term fads” (Hoy & Miskel, 2005, p. 194). The introduction
of the balanced scorecard to schools in Georgia was met with several coincidences. The
implementation of NCLB and the stress of adequate yearly progress are among the most
significant within this collision of events. While they have served to make measurable objectives
more real in the school setting, they have caused a flood of new terminology. Veteran
administrators have had to adjust old mindsets and develop new styles, while new administrators

84
have had to quickly grow into their positions with little mentoring. In the midst of the federal
NCLB mandate, the state of Georgia introduced significant change as well. A recent and
tremendous change in the state curricula has resulted in significant dips in standardized test
scores in many areas. This certainly could impact some dimensions of the OCI. The many
changes in the field of education could cause the balanced scorecard to be viewed by teachers as
one more passing fad and therefore have little impact on achievement press.
The events described above have negatively impacted the morale of teachers. They have
also placed a more intense public spotlight on schools and their performance. The heaviness this
adds to teachers has increased public concern and pressure.
Limitations of the Study
This study is subject to certain limitations. First, the researcher has no means by which to
compare the development, design, and implementation of any particular school’s balanced
scorecard. And, a critical limitation is the absence of measuring the level of monitoring
employed by administrators. Since it was first introduced to the school setting, the design and
regular use of the balanced scorecard has been widespread yet inconsistent from school to
school.
The second limitation rests in the sample of the study. The sample is not only limited to
the State of Georgia, it is further limited to only six school systems within the state. The
restricted range of the sample creates an inability to easily generalize the findings.
The third limitation is that many schools already have continuous monitoring systems
other than the balanced scorecard in place. Therefore, accuracy of the comparison may be

85
compromised. The study was cross sectional, which means there is an inherent limitation
because no account is made of what changes might occur over time.
A very obvious limitation of the study is revealed in the discussion centered on loose
coupling. The researcher has no means by which to measure the level of coupling for the schools
in the study. This creates a complex limitation because of the multidimensional nature of this
perspective. The varying degree of coupling in schools creates varying levels of instructional
leadership and alters perceptions of both climate and culture. Measuring the impact that coupling
has on schools is a challenge. Sharp (2009) conducted a study of public sector agencies and
attempted to measure the appropriateness of coupling in criminal justice agencies in Florida. This
work is described as exploratory and provides a “much needed foundation for future research on
the concept of coupling” (Sharp, 2009, p. 50). Without empirical research linking coupling to
climate, mindfulness, and the balanced scorecard, the results of this study cannot be easily
generalized.
Recommendations
Clearly, there is the need to do more research in the area of the balanced scorecard in the
school setting. The researcher found very limited research results are available on the topic.
While a variety of continuous monitoring tools and techniques are currently employed in
schools, the use and impact of the balanced scorecard in the school setting remains largely
unexplored. However, the benefits the balanced scorecard has brought to the business world and
various non-profit groups warrants further exploration in the school setting. This study seems to
support that claim to a limited degree. Additional studies could help substantiate or refute the

86
hypotheses tested. The researcher offers suggestions for those wishing to further investigate the
balanced scorecard.
If the current study is replicated, efforts should be made to not only increase the sample
size but to ensure a more diverse sample as well. Because the schools selected for this study were
restricted to one geographic area in one southeastern state, the results produced by the sample
cannot be generalized.
Future studies should extend beyond the State of Georgia. The many changes in the math
curriculum coupled with NCLB legislation and the pressures of AYP have made math
achievement difficult in the state. Implementation of new standards bring questions of test
alignment to the forefront. Replicating the study where such changes have not taken place could
yield different results.
It is also the recommendation of the researcher that further studies more closely
scrutinize the development of individual balanced scorecards. Too often, tools employed by
schools that originate in the business sector are not well thought out prior to implementation.
This could likely be the case for the balanced scorecard. Since its introduction to schools in
Georgia, use of the balanced scorecard has rapidly increased. Further research should investigate
how these scorecards were developed, how long they have been utilized, and how they are
monitored throughout any given academic year.
This apparent lack of connectivity between the elements of this study leaves both the
researcher and reader in search of further questions. It is therefore the recommendation of the
researcher that future studies using the balanced scorecard, achievement, climate, and
mindfulness seek to examine the inter-correlation of the variables. This study was limited in that
it looked at achievement, climate, and mindfulness each independently in relation to the balanced

87
scorecard. Producing a study that links all four variables together could produce more intriguing
results and better answer the hypotheses presented.
A final recommendation is the development of a coupling scale for schools to measure
the impact loose and/or tight coupling may have on outcomes. This could be done in conjunction
with a study comparing the balanced scorecard to other monitoring systems. Continued research
linking leadership and, specifically, coupling to climate, mindfulness, and the balanced scorecard
could provide very useful information.
Conclusions
Clearly, monitoring for school improvement is not an easy task. The No Child Left
Behind Act and Adequate Yearly Progress both weigh heavily on teachers and administrators as
the prospect of falling into the Needs Improvement category becomes more real. School leaders
need tools that discourage only a quick glance at any school’s AYP report as a measure of
success. Tools such as the balanced scorecard need to be explored as the need for constant
monitoring is ever-present.
All stakeholders need to have the ability to give firm facts based on authentic data,
including lead data, to access the current condition of their particular schools. The existence of a
persistent measuring device should create constant monitoring in schools. In addition to student
achievement, performance across all elements of the school needs to be monitored. This includes
organizational climate and faculty mindfulness. The balanced scorecard approach needs to be
further explored as an effective strategy for school improvement.

88
REFERENCES
Baruah, S. K., & Haley, S. (2004, November). Implementing the balanced scorecard: It’s about leadership. PowerPoint presented at the meeting of the Balanced Scorecard Interest Group, Washington, D.C.
Beekun, R. I., & Glick, W. H. (2001). Organization structure from a loose coupling perspective:
A multidimensional approach. Decision Sciences, 32(2), 227-251. Bidwell, C. E. (1965). The school as a formal organization. In J. G. March (Ed.), Handbook of
organization (pp. 972-1022). Chicago: Rand McNally. Blankstein, A. M. (2004). Failure is not an option: Six principals that guide student achievement
in high-performing schools. Thousand Oaks, CA: Corwin Press. Dattner, B., & Dunn, A. (2003). Mindfulness at work. PowerPoint presentation by Dattner
Consulting, LLC. Davenport, P., & Anderson, G. (2002). Closing the achievement gap: No excuses. Houston:
American Productivity & Quality Center. Edmondson, A., Bohmer, R., & Pisano, G. (2001, October). Speeding up team learning.
Harvard Business Review, 125-132. Georgia Leadership Institute for School Improvement. (2008). Leading a team to develop
SMART goals: A performance based learning module for Georgia’s educational leaders. Board of Regents of the University System of Georgia.
Gingrich, P. (2002). Functionalism and Parsons class notes November 15-22, 2002. Retrieved
March 18, 2008, from http://uregina.ca/~gingrich/n2202.htm. Glassman, R.B. (1973). Persistence and loose coupling in living systems. Behavioral Science,
18, 83-98. Goddard, R. D., Hoy, W. K., & Hoy, A. W. (2000). Collective teacher efficacy: Its meaning,
measure, and impact on student achievement. American Educational Research Journal, 37(2), 479-507.
Halpin, A., & Croft, D. (1963). The organizational climate in schools. Chicago: Midwest
Administration Center, University of Chicago.

89
Hoy, W. K. (2001). The organizational health inventory (OHI-M) Retrieved July 6, 2007, from http://www.coe.ohio-state.edu/whoy/instruments_6htm#HE.
Hoy, W. K. (2003). An analysis of enabling and mindful school structures: Some theoretical,
research and practical considerations. Journal of Educational Administration, 41(1), 87-108.
Hoy, W. K., & Feldman, J. A. (1987). Organizational health: The concept and its measure.
Journal of Research and Development in Education, 20, 30-88. Hoy, W. K., & Ferguson, J. (1985). A theoretical framework and exploration of organization
effectiveness of schools. Educational Administration Quarterly, 21(2), 117-134. Hoy, W. K., Gage, C. Q., III, & Tarter, C. J. (2006). School mindfulness and faculty trust:
Necessary conditions for each other? Educational Administration Quarterly, 42(2), 236-225.
Hoy, W. K., & Miskel, C. G. (2005). Educational administration: Theory, research, and practice
(7th ed.). New York: McGraw-Hill. Hoy, W. K., & Sabo, D. J. (1998). Quality middle schools: Open and healthy. Thousand Oaks,
CA: Corwin Press. Hoy, W. K., Smith, P. A., & Sweetland, S. R. (2002). The development of the organizational
climate index for high schools: It’s measure and relationships to faculty trust. The High School Journal, 86(1), 38-49.
Hoy, W. K., & Sweetland, S. R. (2001). Designing better schools: The meaning and measure of
enabling school structures. Educational Administration Quarterly, 37(3), 296-321. Hoy, W. K., & Tarter, C. J. (1997). The road to open and healthy schools: A handbook for
change, middle and secondary edition. Thousand Oaks, CA: Corwin Press. Hoy, W. K., Tarter, C. J., & Kottkamp, R. B. (1991). Open schools/healthy schools: Measuring
organizational climate. Beverly Hills, CA: Sage. Inamdar, N., & Kaplan, R. S. (2002). Applying the balanced scorecard in healthcare provider
organizations. Journal of Healthcare Management, 47(3), 179-196. Kaplan, R. S. (1994, September-October). Driving a balanced scorecard matched to business
strategy. Planning Review, 15-19, 48. Kaplan, R. S. (2001). Strategic performance measurement and management in nonprofit
organizations. Nonprofit Management & Leadership, 11(3), 353-370. Kaplan, R. S. (2002, November-December). The balanced scorecard and nonprofit organizations.
Balanced Scorecard Report, 3-6.

90
Kaplan, R. S., & Lee, M. (2007, January). Fulton County System: Implementing the balanced
scorecard. Harvard Business School Case 9-107-029. Boston: Harvard Business School Publishing.
Kaplan, R. S., & Norton, D. P. (1992, January-February). The balanced scorecard: Measures
that drive performance. Harvard Business Review, 71-79. Kaplan, R. S., & Norton, D. P. (1996a). Linking the balanced scorecard to strategy. California
Management Review, 39(1), 53-79. Kaplan, R. S., & Norton, D. P. (1996b). Strategic learning & the balanced scorecard. Strategy &
Leadership, 24(5), 18-24. Kaplan, R. S., & Norton, D. P. (2000, September-October). Having trouble with your strategy?
Then map it. Harvard Business Review, 167-176. Kaplan, R. S., & Norton, D. P. (2001a, September). Leading change with the balanced scorecard.
Financial Executive, 64-66. Kaplan, R. S., & Norton, D. P. (2001b). Transforming the balanced scorecard from performance
measurement to strategic management: Part 2. Accounting Horizons, 15(2), 147-160. Kaplan, R. S., & Norton, D. P. (2006, March). How to implement a new strategy without
disrupting your organization. Harvard Business Review, 100-109. Langer, E. J., Blank, A., & Chanowitz, B. (1978). The mindlessness of ostensibly thoughtless
action: The role of “placebic” information in interpersonal interaction. The Journal of Personality and Social Psychology, 36, 636-642.
Langer, E. J. (1989). Minding matters: The consequences of mindlessness-mindfulness.
Advances in Experimental Social Psychology, 22, 137-173. Langer, E. J. (1993). A mindful education. Educational Psychologist, 28(1), 43-50. Langer, E. J. (2000). Mindful learning. Current Directions in Psychological Science, 9(6), 220-
223. Langer, E., & Brown, J. (1992). From reference to preference: The relationship between mindful
distinction-drawing and liking. Cambridge: Harvard University. Langer, E. J., & Moldoveanu, M. (2000). The construct of mindfulness. Journal of Social Issues,
56(1), 1-9. MacStravic, S. (1999, May-June). A really balanced scorecard. Health Forum Journal, 64-67.

91
March, J. G., & Olsen J. P. (1975). Choice situations in loosely coupled worlds. Unpublished manuscript, Stanford University.
Maryland Assessment Group. (2004). SIP or SAP? It’s a Huge Difference. Power Point
presented at Maryland Assessment Group Annual Conference, November 18, 2004. Retrieved September 16, 2009, from http://www.magonline.org/SIPorSAPMAG1104. pps.
Manzo, K. K. (2003). Teachers picking up tools to map instructional practices. Education Week,
23(6), 8. Marzano, R. J. (2003). What works in schools: Translating research into action. Alexandria,
VA: Association for Supervision and Curriculum Development. Niven, P. R. (2002). Balanced scorecard step-by-step: Maximizing performance and maintaining
results. Hoboken, NJ: John Wiley & Sons. Orion Development Group. (2004). Building the balanced scorecard in public sector
organizations. Retrieved September 23, 2008, from http://www.odgroup.com/articles/ PSA2.pdf.
Pang, V. O. (2001). My multicultural education: A caring centered reflective approach. New
York: McGraw-Hill Companies. Rossi, R. J., & Stringfield, S. C. (1997). Education reform and students at risk. Washington,
D.C.: Office of Educational Research and Improvement, U.S. Department of Education. Sausner, R. (2005). Making assessment work. District Administration, August, 31-33. Sharp, C. R. (2009). Theoretical and practical application of loose coupling: A study of criminal
justice agencies in the state of Florida. The Southwest Journal of Criminal Justice 6(1), 45-58.
Snook, S. A. (2000). Friendly fire: The accidental shoot down of U.S. black hawks over northern
Iraq. Princeton, NJ: Princeton University Press. Sweetland, S. R., & Hoy, W. K. (2000). School characteristics and educational outcomes:
Toward an organizational model of student achievement in middle schools. Educational Administration Quarterly, 36(5), 703-729.
Uline, C. L., Miller, D. M., & Tschannen-Moran, M. (1998). School effectiveness: The
underlying dimensions. Educational Administration Quarterly, 34, 462-483. Weick, K. E. (1976). Educational organizations as loosely coupled systems. Administrative
Science Quarterly, 21(1), 1-19.

92
Weick, K. E., & Sutcliffe, K. M. (2001). Managing the unexpected: Assuring high performance in an age of complexity. San Francisco: Jossey-Bass.

93
APPENDIX A
SAMPLE BALANCED SCORECARD

94
Goal Area 1 Strategic Objective #1 Performance Measures Unit of Measure Trend Data Target
2007 2008 2009 2010 SO #1.A = CRCT
(Reading) % Meets + Exceeds 86% 91% 93% 96% SO #1.B = CRCT (Math) % Meets + Exceeds 68% 72% 74% 75%
SO #1.C = Writing Assessment % Meets + Exceeds 94% 82% 89% 91%
Students Master the Curriculum
SO #1.D = HSGT % Passing 1st Time 94% 92% 94% 95% Strategic Objective #2 Performance Measures Unit of Measure Trend Data Target
2007 2008 2009 2010 SO #2.A = I.T.B.S.
(Reading) % > Peers 59% 61% 58% 70%
SO #2.B = I.T.B.S. Math) % > Peers 51% 48% 49% 70% SO #2.C = SAT Ave Score 1441 1439 1468 1520
Stud
ent A
chie
vem
ent
Students are Nationally Competitive
SO #2.D = ACT Ave comp score 18.4 19.3 19.5 21 Goal Area 2 Strategic Objective #1 Performance Measures Unit of Measure Trend Data Target
2007 2008 2009 2010
Variance to Budget Approved vs. Actual 1.4% 2% 2.2% 2% Sound Fiscal Management
Purchase Order Flow % < 10 days 93% 94% 92% 95% Strategic Objective #2 Performance Measures Unit of Measure Trend Data Target
2007 2008 2009 2010
On time Bus Delivery % on time 94% 96% 96% 95% Effective Operations Maintenance Request % < 5 days 96% 93% 95% 95%
Strategic Objective #2 Performance Measures Unit of Measure Trend Data Target
2007 2008 2009 2010
Industry Certified Staff % Certified 98% 98% 99% 100% Eff
ectiv
e A
dmin
istr
ativ
e Pr
oces
ses
Technology Support
Response to Work Orders % < 4 hours 96% 97% 96% 95% Goal Area 3 Strategic Objective #1 Performance Measures Unit of Measure Trend Data Target
2007 2008 2009 2010 CL 19 21 22 > 20
PTB 23 22 24 > 20 AP 18 21 20 > 20
School Climates are Healthy and Effective Organizational Climate
Index (OCI)
IV 16 14 17 < 15 Strategic Objective #2 Performance Measures Unit of Measure 2007 2008 2009 2010
Student Surveys % Satisfied 94% 92% 96% 95%
Stak
ehol
der
Satis
fact
ion
Parents and Students are Satisfied
Parent Surveys % Satisfied 93% 92% 94% 95% Goal Area 3 Strategic Objective #1 Performance Measures Unit of Measure Trend Data Target
2007 2008 2009 2010
M=Score 4.2 4.2 4.4 > 4.5
Faculty Demonstrates Mindfulness M-Scale
Staf
f L
earn
ing
&
Gro
wth
Did Not Meet Annual Goal Improved but Did Not
Meet Met Annual Goal

95
APPENDIX B
OCI

96
OCI DIRECTIONS: THE FOLLOWING ARE STATEMENTS ABOUT YOUR SCHOOL. PLEASE INDICATE
THE EXTENT TO WHICH EACH STATEMENT CHARACTERIZES YOUR SCHOOL BY CIRCLING THE APPROPRIATE RESPONSE.
RO =Rarely Occurs SO =Sometimes Occurs O =Often Occurs VFO =Very Frequent Occurs
1. The principal explores all sides of topics and admits that other opinions exist RO SO O VFO 2. A few vocal parents can change school policy ………….…………..……… RO SO O VFO 3. The principal treats all faculty members as his or her equal…………........... RO SO O VFO 4. The learning environment is orderly and serious …………………………… RO SO O VFO 5. The principal is friendly and approachable……………………………........... RO SO O VFO 6. Select citizens groups are influential with the board .............................…….. RO SO O VFO 7. The school sets high standards for academic performance............................... RO SO O VFO 8. Teachers help and support each other ………......................………………… RO SO O VFO 9. The principal responds to pressure from parents……………….……………. RO SO O VFO 10. The principal lets faculty know what is expected of them..................……… RO SO O VFO 11. Students respect others who get good grades.............................……….......... RO SO O VFO 12. Teachers feel pressure from the community.……............................................ RO SO O VFO 13. The principal maintains definite standards of performance.................……...... RO SO O VFO 14. Teachers in this school believe that their students have the ability to achieve academically……………………………………………………………... RO SO O VFO 15. Students seek extra work so they can get good grades ………………............. RO SO O VFO 16. Parents exert pressure to maintain high standards ………………..……........ RO SO O VFO 17. Students try hard to improve on previous work......................…....................... RO SO O VFO 18. Teachers accomplish their jobs with enthusiasm...............................……........ RO SO O VFO 19. Academic achievement is recognized and acknowledged by the school......... RO SO O VFO 20. The principal puts suggestions made by the faculty into operation…............... RO SO O VFO 21. Teachers respect the professional competence of their colleagues ................. RO SO O VFO

97
22. Parents press for school improvement ………………………………….......... RO SO O VFO 23. The interactions between faculty members are cooperative…………….......... RO SO O VFO 24. Students in this school can achieve the goals that have been set for them……. RO SO O VFO 25. Teachers in this school exercise professional judgment.…………………….. RO SO O VFO 26. The school is vulnerable to outside pressures …………………...................... RO SO O VFO 27. The principal is willing to make changes…………………….......................... RO SO O VFO 28. Teachers “go the extra mile” with their students …………………………… RO SO O VFO 29. Teachers provide strong social support for colleagues………….…………… RO SO O VFO 30. Teachers are committed to their students…………………………………… RO SO O VFO

98
APPENDIX C
M-SCALE

99
M Scale DIRECTIONS The following statements are about your school. Please indicate the extent to which you agree with each of the following statements along a scale from STRONGLY DISAGREE (1) to STRONGLY AGREE (6). 1. My principal often jumps to conclusions ……………………….……………… 1 2 3 4 5 6 2. When a crisis occurs the principal deals with it so we can get back to teaching .……………………………………………………..…………… 1 2 3 4 5 6 3. In this school teachers welcome feedback about ways to improve …………….. 1 2 3 4 5 6 4. Teachers do not trust the principal enough to admit their mistakes ……………. 1 2 3 4 5 6 5. The principal of this school does not value the opinions of the teachers ………..…………...…………………………………………………1 2 3 4 5 6 6. My principal is an expert on teaching and learning …………………………….1 2 3 4 5 6 7. Teachers in this school jump to conclusions …………………………….………1 2 3 4 5 6 8. People in this school respect power more than knowledge …………………. 1 2 3 4 5 6 9. Teachers in my building learn from their mistakes and change so they do not happen again …………………………………………… 1 2 3 4 5 6 10. My principal negotiates faculty differences without destroying the diversity of opinions ………………………………………………………….. 1 2 3 4 5 6 11. Too many teachers in my building give up when things go bad ………..….. 1 2 3 4 5 6 12. The principal welcomes challenges from teachers ………………………..... 1 2 3 4 5 6 13. When things go badly teachers bounce back quickly …………………...….. 1 2 3 4 5 6 14. Most teachers in this building are reluctant to change …………………..…... 1 2 3 4 5 6