Embed Size (px)
Citation preview
University of South FloridaScholar Commons
Graduate Theses and Dissertations Graduate School
4-15-2010
Organizational Information Markets: ConceptualFoundation and an Approach for Software ProjectRisk ManagementAreej M. YassinUniversity of South Florida
Follow this and additional works at: http://scholarcommons.usf.edu/etd
Part of the American Studies Commons, and the Other Education Commons
This Dissertation is brought to you for free and open access by the Graduate School at Scholar Commons. It has been accepted for inclusion inGraduate Theses and Dissertations by an authorized administrator of Scholar Commons. For more information, please [email protected].
Scholar Commons CitationYassin, Areej M., "Organizational Information Markets: Conceptual Foundation and an Approach for Software Project RiskManagement" (2010). Graduate Theses and Dissertations.http://scholarcommons.usf.edu/etd/3500

Organizational Information Markets:
Conceptual Foundation and an Approach for Software Project Risk Management
By
Areej M. Yassin
A dissertation submitted in partial fulfillment
of the requirements for the degree of
Doctor of Philosophy
Department of Information Systems and Decision Sciences
College of Business
University of South Florida
Major Professor: Alan R. Hevner, Ph.D.
J. Ellis Blanton, Ph.D.
Terry L. Sincich, Ph.D.
Richard P. Will, Ph.D.
Date of Approval:
April 15, 2010
Keywords: prediction markets, systems thinking, structuration theory, status reporting,
project management, risk assessment, whistle-blowing, agency theory, design science
© Copyright 2010, Areej M. Yassin

Dedication
To Mom and Dad

Acknowledgments
First and foremost, I thank God for giving me the strength and courage to succeed
and achieve my goals. I also thank my family for their love and support throughout my
graduate studies and the writing of my dissertation.
I owe my gratitude to my dissertation committee, whom without their help, this
dissertation would have not been possible. I am particularly grateful to my advisor Dr.
Alan R. Hevner who through his respect instilled confidence in me, and by trusting me
taught me to trust myself, and through his guidance, keen insight and encouraging
remarks at the end of each stage in the process motivated me to go forward and to keep
going. Dr. Hevner will always be a source of inspiration in my work and a role model to
follow. It was an honor to have him as my mentor and dissertation chair.
I am very thankful to Dr. Blanton for his help with the data collection and for
carefully reading and commenting on my surveys. His comments were very helpful in
clarifying my ideas. I am also very thankful to Dr. Sincich, who kept me thinking two
steps ahead, for long discussions that helped me sort out the details of my experiments. I
am also very grateful to Dr. Will for giving me access to his classes which has been a
tremendous help with my experiments and for his constant encouragement and support.
I also wish to extend my appreciation to the faculty, staff and doctoral students of
the Information Systems Department who supported me throughout the Ph.D. program.
To them and to all who have, in one way or another, contributed to a worthwhile
experience a heartfelt thank you.

Note to Reader
The original of this document contains color that is necessary for understanding the data.
The original dissertation is on file with the University of South Florida library in Tampa,
Florida.
i
Table of Content
List of Tables ..................................................................................................................... iv
List of Figures .................................................................................................................... vi
Abstract ............................................................................................................................ viii
Chapter One: Motivation and Dissertation Objectives ....................................................... 1
Motivation ............................................................................................................... 1
Problem Statement .................................................................................................. 4
Dissertation Objectives ........................................................................................... 7
Research Approach ................................................................................................. 8
Research Questions ............................................................................................... 12
Research Description and Contributions .............................................................. 13
Dissertation Organization ..................................................................................... 17
Chapter Two: Information Markets: Theory and Literature Review ................................ 18
Introduction ........................................................................................................... 18
Information Markets Theoretical Base ................................................................. 18
Hayek Hypothesis ..................................................................................... 18
Rational Expectations Theory ................................................................... 19
Random Walk Theory ............................................................................... 20
Efficient Market Hypothesis ..................................................................... 21
Marginal Trader Hypothesis ..................................................................... 22
A Closer Look at Information Markets ................................................................. 24
Market Design ........................................................................................... 25
Forecasting Goal ........................................................................... 26

ii
Portfolio Composition ................................................................... 26
Incentive Structure ........................................................................ 27
Trading Mechanism ...................................................................... 31
Information Markets Applications ........................................................................ 32
Information Aggregation Methods ....................................................................... 36
Information Markets Advantages ......................................................................... 39
Future Research Directions ................................................................................... 41
Chapter Three: A Foundation for the Study of Organizational Information Markets ...... 44
Introduction ........................................................................................................... 44
Markets as IT Artifacts ......................................................................................... 48
A Systems Theory of Information Markets .......................................................... 52
Structuration Theory in Information Systems....................................................... 56
Markets as IT Artifacts: A Structuration Perspective ........................................... 60
Information Markets Design ..................................................................... 62
Market Users ................................................................................. 65
Use Motivation.............................................................................. 66
Market Information ....................................................................... 70
Information Market Use ............................................................................ 72
Structuration Model of Technology-Induced Organization Development 73
Design as a Group of Decisions ................................................................ 76
Conclusions and Future Directions ....................................................................... 78
Chapter Four: Information Markets for Software Projects Risk Management ................. 81
Introduction ........................................................................................................... 81
Challenges to Software Projects Risk Assessment ............................................... 85
Research Framework and Research Questions ..................................................... 88
Information Markets Design ................................................................................. 92
Information Markets Expected Utility ...................................................... 99
Information Markets Design Evaluation ............................................................. 108
Information Market Experiment ............................................................. 110
iii
Data Analysis and Results .................................................................................. 118
Scale Validation ...................................................................................... 118
Hypotheses Testing ................................................................................. 121
Discussion and Implications ............................................................................... 128
Limitations .......................................................................................................... 132
Contributions and Future Directions ................................................................... 134
Chapter Five: Summary and Future Directions .............................................................. 137
List of References ........................................................................................................... 144
Bibliography ................................................................................................................... 156
Appendices ...................................................................................................................... 159
Appendix A: Information Markets Experimental Scenario ................................ 160
Appendix B: Information Structures ................................................................... 163
Appendix C: Risk Assessment Survey ............................................................... 168
Appendix D: Survey Experimental Scenario ...................................................... 171
Appendix E: Constructs and Measures ............................................................... 174
About the Author ................................................................................................... End Page
iv
List of Tables
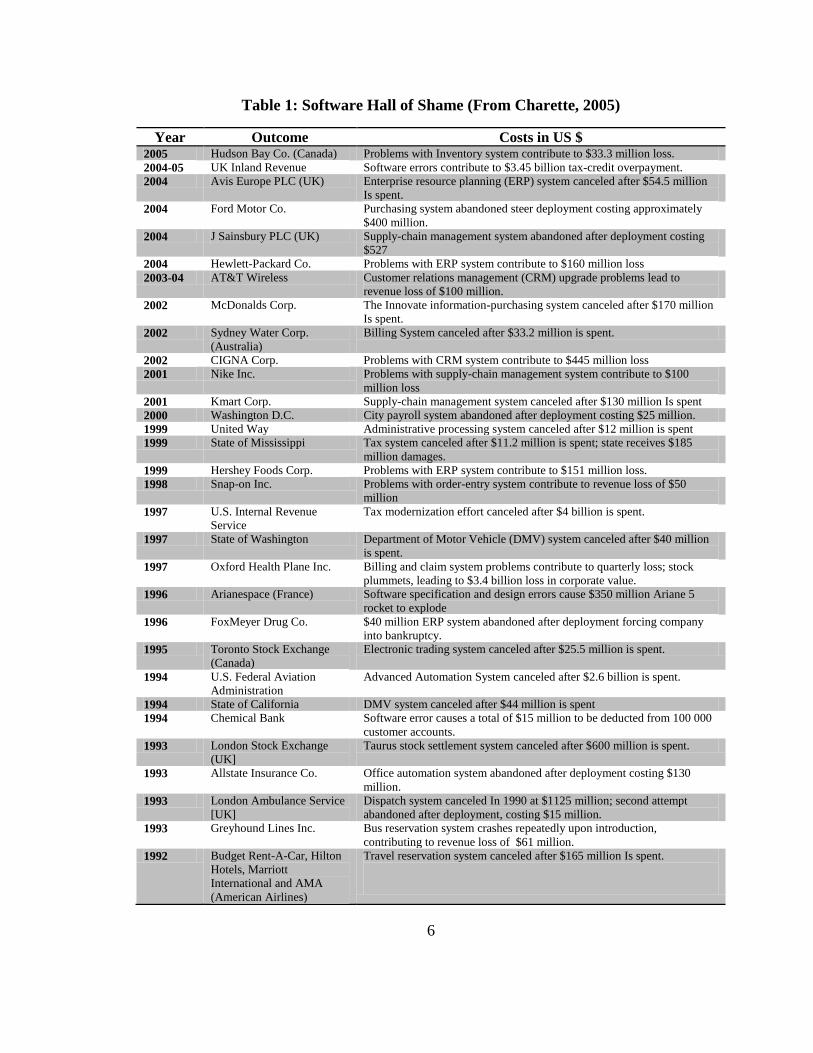
Table 1: Software Hall of Shame (From Charette, 2005) ................................................... 6
Table 2: IEM 2008 US Presidential Election Winner Takes All Contracts ...................... 28
Table 3: IEM 2008 US Presidential Election Vote Share Contracts ................................ 29
Table 4: Information Markets Contract Types .................................................................. 30
Table 5: Market Mechanisms Pros and Cons ................................................................... 32
Table 6: Information Markets‘ Advantages ...................................................................... 40
Table 7: Guiding Aspects for Design of Information Markets ......................................... 65
Table 8: Theoretical Framework Propositions .................................................................. 89
Table 9: Information Markets Major Design Aspects ...................................................... 94
Table 10: Experimental Information Market Design for Software Project Risk
Assessment ............................................................................................................ 99
Table 11: Conceptual Model Propositions ...................................................................... 103
Table 12: Experimental Information Structures ............................................................. 111
Table 13: Risk Assessment Question .............................................................................. 112
Table 14: Market Participants Demographics ................................................................. 113
Table 15: Subjects Demographics .................................................................................. 115
Table 16: Item-to-Construct Standardized Loadings ...................................................... 119
Table 17: Constructs Reliability ..................................................................................... 120
Table 18: Discriminant Validity ..................................................................................... 121
v
Table 19: Groups Assessment of High Risk Probability ................................................ 123
Table 20: Market vs. Groups Risk Assessment Accuracy .............................................. 125
Table 21: Groups Risk Assessment Accuracy T-Tests ................................................... 125
Table 22: Groups Risk Assessment Accuracy Wilcoxon tests ....................................... 126
Table 23: Scale Properties .............................................................................................. 126
Table 24: Paired Samples Test ........................................................................................ 128
Table 25: Summary of Results ........................................................................................ 130
vi
List of Figures
Figure 1: Information Systems Research Framework (From Hevner et al., 2004) ............. 9
Figure 2: Design Science Approach for Designing and Evaluating an IT Solution
for an Identified Business Problem ....................................................................... 11
Figure 3: Information Markets Typology (From Jones at al., 2009) ................................ 24
Figure 4: Steps for Designing a Virtual Stock Market (from Spann and Skiera, 2003) ... 26
Figure 5: IEM 2008 US Presidential Election Winner Takes All Market ........................ 28
Figure 6: IEM 2008 US Presidential Election Vote Share Market ................................... 30
Figure 7: Information Systems Research Framework for Information Markets
(Adapted from Hevner et al., 2004) ...................................................................... 49
Figure 8: A Systems Theory of Organizational Information Markets .............................. 53
Figure 9: Infographic for Information Markets Consensus Making Mechanism on
Design and Use of IT Artifacts ............................................................................. 61
Figure 10: A Structuration Model for Design and Use of Information ............................ 63
Figure 11: A Framework for Information Market Users .................................................. 66
Figure 12: Structuration Model of Technology-Induced Organization Development...... 74
Figure 13: Theoretical Framework for the Determinants of Software Projects Risk
Assessment Accuracy ........................................................................................... 89
Figure 14: Design Science Approach for Designing and Evaluating an Information
Market Solution for Software Project Risk Assessment ....................................... 91
vii
Figure 15: Definition of Impact Scales for Four Project Objectives ................................ 96
Figure 16: Risk Matrix ...................................................................................................... 97
Figure 17: Conceptual Model: Willingness to Report Bad News................................... 103
Figure 18: Research Model: Information Market Impact on .......................................... 105
Figure 19: Price Curves of the Project Riskiness States ................................................. 121
Figure 20: Summary of Theoretical Framework Propositions ....................................... 129
viii
Organizational Information Markets:
Conceptual Foundation and an Approach for Software Project Risk Management
Areej M. Yassin
ABSTRACT
This dissertation employs both design science and behavioral science research
paradigms to investigate an emerging form of technology-enabled human collective
intelligence known as information markets. This work establishes a conceptual
foundation for the study of organizational information markets and the design and use
processes of information markets inside organizations.
This research conceptualizes markets from an information systems perspective
and presents an information systems research framework for organizational information
markets. This work develops a systems theory of information markets to facilitate
investigation of the relationships and interactions between markets as systems and their
context of use. It proposes a structuration model for design and use of IT artifacts in
organizations and applies it to the study of information markets. A framework of market
users is developed to guide market design to satisfy the different motivational and
informational needs of market users. A design based solution is proposed to an important
open question in the information markets literature; how to generate sufficient

ix
uninformed trades. This research extends structuration theory by developing the
structuration model of technology-induced organization development.
A well-designed information market can generate several benefits to
organizations that contribute to their growth and development. Due to the importance of
software in everyday life, and the high costs and percentages of failure in software
projects, this dissertation proposes an information market solution to help organizations
better manage the risks facing software projects. It also develops a theoretical framework
for the determinants of software project risk assessment accuracy and evaluates the
market‘s efficacy in improving assessment accuracy via the use of controlled laboratory
experiments.
The results of the experiments demonstrate the market‘s efficacy in improving
assessment accuracy by increasing the currency, accuracy and completeness of reported
status information about project main objectives such as cost, schedule, performance and
functionality. The results also demonstrate the market‘s efficacy in increasing individual
willingness to report negative status information by decreasing their perception of
information asymmetry between them and management/clients, and by increasing their
perception of both the anonymity of the reporting mechanism and their perceived self-
interest in reporting negative status information.
1
Chapter One
Motivation and Dissertation Objectives
Motivation
―If foresight is not the whole of management at least it is an essential part of it"
(Henri Fayol, 1916)
Foresight is the oldest term used to describe an interdisciplinary field known
today as Futurology; or the study of the future. H.G. Wells envisioned the establishment
of this modern academic discipline as early as the 1930‘s when he said in a BBC radio
broadcast aired on November 19, 1932 ―There is not a single Professor of Foresight in the
world‖. In the latter third of the 20th
century, Futurology emerged as an academic
discipline and Wells‘ foresight was realized, perhaps sooner than he could have
imagined. But who could have imagined, few decades ago, that the most respected
futurists of the 21st century will not be professors, but rather markets?
The Economist recently published a trends article titled ―The future of futurology‖
describing prediction markets as ―the most heeded futurists … where the informed
guesswork of many is consolidated into hard probability‖ (The Economist 2007, p.1).
The article cited several markets forecasts of political outcomes, such as those of
NewsFutures, Inkling Markets, and InTrade. Other well known applications of prediction
2
markets, such as the Iowa Electronic Market, has proven to outperform polls and experts
forecasts in predicting the outcomes of the presidential elections more than 75 percent of
the time over the last ten years. In 2009, Hollywood Stock Exchange announced a 78.4%
success rate in predicting the 81st Annual Academy Awards nominations, bringing its 11
years average to an impressive 82.1%.
The MIT center for collective intelligence calls for creating new forms of
collective intelligence that take advantage of the opportunities created by the Internet and
other new communication technologies, where human and machines can collectively act
more intelligently than any individual, group, or collection of computers have ever done
before. The center advocates prediction markets as a perspective on collective
intelligence in its own right.
Undoubtedly prediction markets are at the frontier of predictive futures and
collective intelligence research. Their impressive performance holds great potentials for
the business world in areas such as forecasting, decision making, and, importantly, risk
management. The value of risk management, in any project, can be assessed based on
three measures: the importance of the project itself or its outcomes, the likelihood of
occurrence of the risks facing the project, and their expected impacts on the project
objectives. Software development projects score very high on all of the scales.
In the current era of ubiquitous computing, software is becoming an indispensable
part of our daily lives, an absolute necessity for organizations to survive fierce
competition with rivals, and even a matter of national security for governments.
3
Organizations and governments spend billions of dollars each year in new software
initiatives and projects, and yet, by rough estimate, only about 35% succeed (Rubinstein,
2007). Software failure can lead to tragic societal and economic consequences that go
well beyond inconvenience. But the biggest tragedy of all, according to risk management
expert Robert N. Charette, is that software failure is predictable and for the most part
avoidable (Charette, 2005).
The software development domain is in desperate need of better risk management
tools and practices. Markets may prove to be invaluable in minimizing software projects‘
chances of failure. By aggregating status information from all levels of the organization
and providing early warning signals about risks, markets can assume the difficult task of
―blowing the whistle‖ on challenged projects. However, for markets to become
mainstream risk management tools that inform strategic decisions, policy making and
help in long term planning, organizations must first buy into them, understand how they
work, know how to use them, and value the information they provide to inform their
decisions.
Research on prediction markets used inside organizations is still in its infancy.
Little is known about the impact of organizational environments on market design,
incentive structures, and types of questions asked in the market, or more simply put, what
works and what does not. Little is also known about the impact of the market on work
processes, corporate culture, and formal and informal reporting mechanisms in the
organization.
4
Markets are, in essence, IT artifacts. To make the best out of this innovative
technology, we must first theorize about it, and about the reciprocal relationship between
it and its environment. We must understand how markets impact organizations, how the
business setting impacts market design, and how design impacts use and, consequently,
the market objectives. Also, studies are needed that empirically test the usefulness of
prediction markets in managing risks facing organizations in general and software
projects in particular. This dissertation is the first step in a long term research effort to
accomplish these goals.
Problem Statement
A list of failed software projects states the problem loud and clear (Table 1).
Software projects have a long history of failure that keeps repeating itself. Twenty years
ago, the odds of a large software project finishing on time were close to zero (McConnell,
1996). Today the odds are not much better, but at least we know they cannot get much
worse. In 2006, 19 percent of initiated software projects in the US were outright failures;
canceled before completion or not deployed. 46 percent of projects failed to meet user
requirements, had cost overruns, or were not delivered according to schedule (Rubinstein,
2007). In 2007, Dynamic Markets Limited surveyed 800 IT managers across eight
countries. The results showed that failure rates are universal; 62 percent of IT projects
failed to meet their schedules, 49 percent exceeded their budget, and 41 percent failed to
deliver the expected business value and ROI.
5
Identifying the risks facing software projects and reasons behind their failures has
occupied project managers, software industry consultants and academics for a long time.
The most cited reasons are also universal. The literature is full of case studies,
postmortem analyses, lessons learned, and recommended practices to improve the
processes and outcomes of software projects. However, management is still unable to
effectively manage the risks involved in these projects.
Although current risk management approaches can be useful in identifying and
prioritizing risks, as well as in suggesting mitigation strategies, none of them addresses
the fundamental problem behind software project failure; communication. Many large
scale software disasters have been attributed to communication problems and inaccurate
status reporting, such as the case of the CONFIRM project (Oz, 1994). Reluctance to
transmit bad news (Kiel, Smith, Pawlowski and Jin, 2004), and both status misperception,
and deliberate misrepresentation by software developers and project managers (Snow and
Keil, 2002) are some of the reasons that lead to inaccurate assessments of risks and,
eventually, project failure.
Existing risk management tools and initial risk assessments are ineffective in
reducing a software project‘s chances of failure unless there are methods that
continuously provide complete, current, and accurate information about the status of
project objectives as events unfold. Otherwise managers are left with unrealistic, dated
assessments of project risks, and as a result fail to take appropriate actions to mitigate
them.
6
Table 1: Software Hall of Shame (From Charette, 2005)
Year Outcome Costs in US $ 2005 Hudson Bay Co. (Canada) Problems with Inventory system contribute to $33.3 million loss.
2004-05 UK Inland Revenue Software errors contribute to $3.45 billion tax-credit overpayment.
2004 Avis Europe PLC (UK) Enterprise resource planning (ERP) system canceled after $54.5 million
Is spent.
2004 Ford Motor Co. Purchasing system abandoned steer deployment costing approximately
$400 million.
2004 J Sainsbury PLC (UK) Supply-chain management system abandoned after deployment costing
$527
2004 Hewlett-Packard Co. Problems with ERP system contribute to $160 million loss
2003-04 AT&T Wireless Customer relations management (CRM) upgrade problems lead to
revenue loss of $100 million.
2002 McDonalds Corp. The Innovate information-purchasing system canceled after $170 million
Is spent.
2002 Sydney Water Corp.
(Australia)
Billing System canceled after $33.2 million is spent.
2002 CIGNA Corp. Problems with CRM system contribute to $445 million loss
2001 Nike Inc. Problems with supply-chain management system contribute to $100
million loss
2001 Kmart Corp. Supply-chain management system canceled after $130 million Is spent
2000 Washington D.C. City payroll system abandoned after deployment costing $25 million.
1999 United Way Administrative processing system canceled after $12 million is spent
1999 State of Mississippi Tax system canceled after $11.2 million is spent; state receives $185
million damages.
1999 Hershey Foods Corp. Problems with ERP system contribute to $151 million loss.
1998 Snap-on Inc. Problems with order-entry system contribute to revenue loss of $50
million
1997 U.S. Internal Revenue
Service
Tax modernization effort canceled after $4 billion is spent.
1997 State of Washington Department of Motor Vehicle (DMV) system canceled after $40 million
is spent.
1997 Oxford Health Plane Inc. Billing and claim system problems contribute to quarterly loss; stock
plummets, leading to $3.4 billion loss in corporate value.
1996 Arianespace (France) Software specification and design errors cause $350 million Ariane 5
rocket to explode
1996 FoxMeyer Drug Co. $40 million ERP system abandoned after deployment forcing company
into bankruptcy.
1995 Toronto Stock Exchange
(Canada)
Electronic trading system canceled after $25.5 million is spent.
1994 U.S. Federal Aviation
Administration
Advanced Automation System canceled after $2.6 billion is spent.
1994 State of California DMV system canceled after $44 million is spent
1994 Chemical Bank Software error causes a total of $15 million to be deducted from 100 000
customer accounts.
1993 London Stock Exchange
(UK]
Taurus stock settlement system canceled after $600 million is spent.
1993 Allstate Insurance Co. Office automation system abandoned after deployment costing $130
million.
1993 London Ambulance Service
[UK]
Dispatch system canceled In 1990 at $1125 million; second attempt
abandoned after deployment, costing $15 million.
1993 Greyhound Lines Inc. Bus reservation system crashes repeatedly upon introduction,
contributing to revenue loss of $61 million.
1992 Budget Rent-A-Car, Hilton
Hotels, Marriott
International and AMA
(American Airlines)
Travel reservation system canceled after $165 million Is spent.
7
Dissertation Objectives
This dissertation seeks to accomplish the following objectives: First, establish a
theoretical foundation for the study of organizational information markets and the design
and use processes of markets inside organizations. Second, define the relationships and
interactions between information markets and their environment. Third, design an
information market solution to help organizations overcome an important business
problem; software project risk assessment. Fourth, evaluate the proposed information
market‘s efficacy in increasing assessment accuracy by empirically testing the market
ability to:
1. Efficiently collect and combine information from the organization to provide
an assessment based on “complete” information about the status of different
project objectives, such as scope, quality, cost and schedule,
2. Respond to unfolding events by rapidly incorporating new information into
the assessment to provide current and up-to-date assessment of risk,
3. Adjust for individual errors in perception of project status and risk assessment,
and thus, provide more accurate assessment of risk.
4. Motivate those who are involved in the project or have access to information
about its progress to faithfully report status information.
8
Research Approach
Technology and behavior are inseparable in an information system and thus ought
to be inseparable in IS research (Hevner, March, Park and Ram, 2004). The IS field needs
an interdisciplinary conceptualizations of the IT artifact that articulate what the
technology is, how it interacts with the social context (Orlikowski and Iacono, 2001). ―IT
artifacts are broadly defined as constructs (vocabulary and symbols), models
(abstractions and representations), methods (algorithms and practices), and instantiations
(implemented and prototype systems)‖ (Hevner et al., 2004, p. 77).
Hevner et al. (2004) argue that IS research is conducted in alternating cycles
between design science (technology) and behavioral science (behavior). The design
science paradigm in essence is a problem solving paradigm rooted in engineering and the
sciences of the artificial (Simon, 1996). It is concerned with building innovative IT
artifacts to solve an identified organizational problem or fulfill a business need. People‘s
perceptions, roles and capabilities within the organization, as well as the organization‘s
strategies, structures and cultures, and their existing and planned technologies form the
problem space of business needs which warrants the relevance of design science research.
Design science is also concerned with evaluating the IT artifact based on the
utility provided in solving those problems. Evaluation can be carried out via case or field
studies, lab experiments or simulation. Evaluation then feeds back into the design process
to improve current understanding of the problem, the designed artifact, and the design
process itself (Hevner et al., 2004).
9
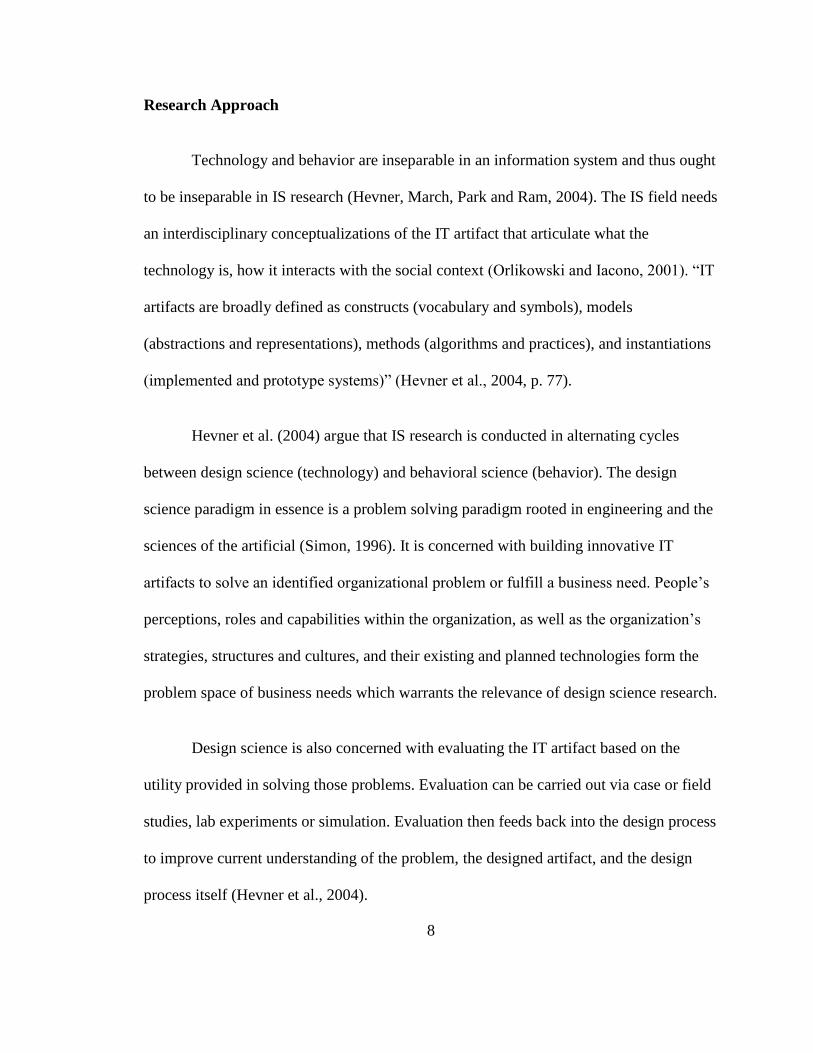
On the other hand, the behavioral science paradigm studies the IT artifact by
developing and justifying theories to explain and predict its use and impact on individuals
and organizations. The goal of behavioral science is truth that informs design, and the
goal of design science is utility that informs theory (Hevner et al., 2004). Theories as well
as designed artifacts are assessed for weaknesses, refined, and reassessed multiple times
until they accomplish their intended goals (Figure 1).
Figure 1: Information Systems Research Framework (From Hevner et al., 2004)
Rigor is guaranteed by the application of existing knowledge such as foundational
theories, frameworks, instruments, constructs, models, methods and instantiations in
developing theories and building the artifact, and by the application of existing
methodologies such as data collection and analysis techniques, measures and validation
criteria in justifying theories and evaluating artifacts. The contributions of IS research are
Application in the Appropriate Environment
Additions to the Knowledge Base
People Organization Technology
Foundations Methodologies
Environment
IS Research
Knowledge Base
Relevance
Develop/Build
Justify/Evaluate
Business Needs
Applicable Knowledge
Assess Refine
Rigor
10
assessed based on the applicability of the artifact in the problem space, its ability to meet
the business need, and the research‘s ability to add to our knowledge base (Hevner et al.,
2004).
Thus, we are utilizing both the design science and behavioral science research
paradigms to accomplish our research objectives. To establish a theoretical foundation for
the study of information markets inside organizations, this research starts by re-
conceptualizing markets as IT artifacts and presents an information systems research
framework for information markets. It employs and extends several theoretical
perspectives such as systems thinking concepts (Checkland, 1981) and structuration
theory (Giddens, 1979) to facilitate investigation of the relationships and interactions
between markets and their context of use, and the design and use processes of markets
inside organizations.
The design science research paradigm is employed to design an experimental
Web-based information market solution to aid organizations and project managers in
assessing software project risks (Figure 2). Market design is informed by existing
theories, methodologies, and empirical evidence in the information markets and software
project management literatures. The proposed market design and its expected utility in
the area of software project risk assessment are evaluated using controlled experiments.
Experimental studies on the use of information markets for business problems that
use business-related tasks and scenarios are needed to advance the theory of
organizational information markets to explain and predict information markets

11
performance in specific business settings. They provide sufficient degrees of control that
allow us to draw conclusions about manipulation effects and causality, which in turn will
allow us to build theoretical models to explain and predict the impact of various
information markets designs on key business-related dependent variables. Experimental
results can also be used to refine market design and will contribute back to our
knowledge base.
Figure 2: Design Science Approach for Designing and Evaluating an IT Solution for
an Identified Business Problem
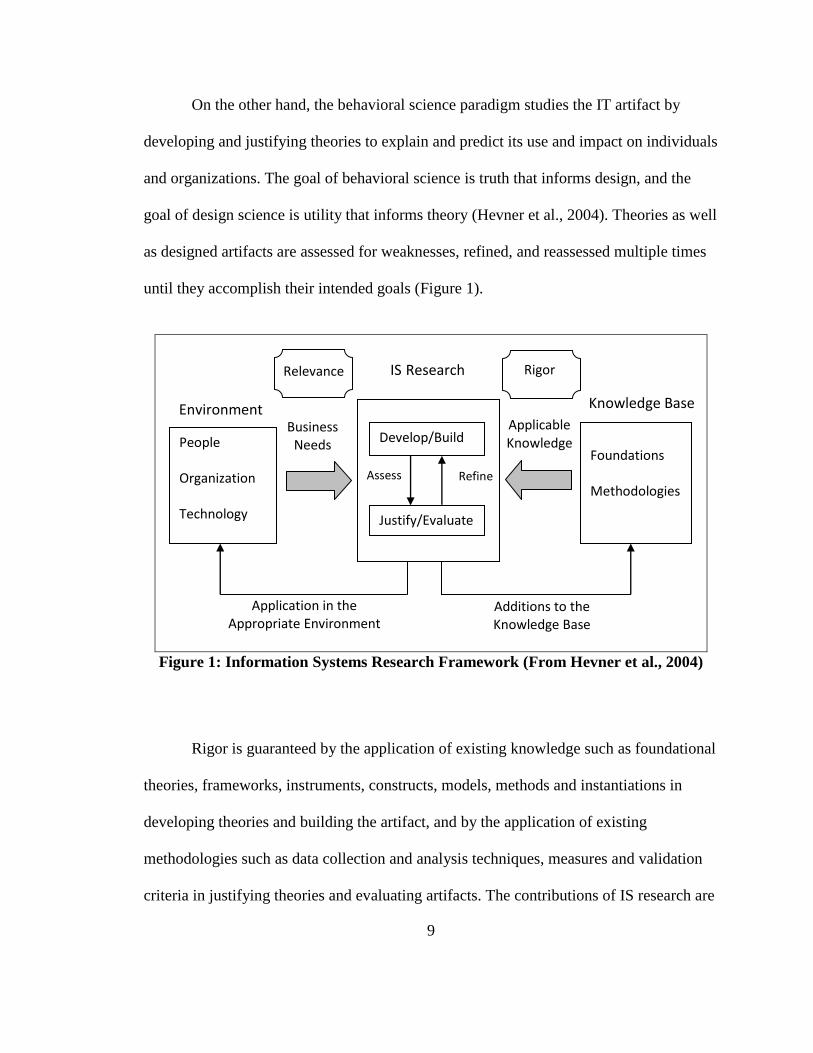
Following the design science research guidelines proposed by Hevner et al.
(2004), we advance a research approach for designing and evaluating IT artifacts
developed to fulfill an identified business need (Figure 2). The proposed approach for
conducting design science research starts by organizing research questions into two sets:
IT artifact design and IT artifact design evaluation. IT artifact design research questions
IT Artifact Design
RQ1: What is the design of the artifact? State artifact nature and specific design
RQ2: What is the artifact’s expected utility? Form hypotheses
IT Artifact Evaluation
RQ3: What is the artifact’s efficacy in providing hypothesized utility? Decide on evaluation method Test hypotheses
Business Need Knowledge Base
Justify Inform
Apply Add
Evaluate Refine
12
ask about (1) the nature and the specific design of the proposed IT solution, and (2) its
expected utility for the identified business need. After the nature and the proposed artifact
design are articulated along with the theories and literature that inform the design, the IT
artifact‘s expected utility is stated in form of testable hypotheses.
IT artifact design evaluation research questions ask about the efficacy of the
designed artifact in providing its hypothesized utility in a particular business domain. To
test the hypotheses and answer design evaluation research questions, an appropriate
evaluation method should be selected such as laboratory experiment or field studies
supported with appropriate literature, and then the hypotheses can be tested by collecting
the required data and analyzing it using appropriate data analysis techniques. Evaluation
results can then be used to modify the artifact design and/or selected evaluation method,
and will enhance our understanding of the problem either by developing or extending
existing theories, or by adding empirical evidence to our knowledge base. The evaluated
IT solution is then applied in a particular domain to help solve an identified business
problem.
Research Questions
The IT artifact design research questions are:
RQ1- What is the design of an information market for software
projects risk assessment?
13
RQ2- What is the expected utility of the designed information
market for software projects risk assessment?
Information markets are expected to improve the accuracy of software projects
risk assessment by improving the currency, accuracy and completeness of reported status
information about projects various objectives such as scope, cost, quality and schedule.
IT artifact evaluation research questions:
RQ3- What is the efficacy of an information market providing
complete, current, and accurate information about software
project risks?
Research Description and Contributions
This dissertation contributes to the theory and practice in the information systems
literature, software project management literature, and the information markets literature.
Research on information markets has increased significantly in the last 5 years
and yet there have been few reviews that cover the theoretical underpinnings of
information markets and synthesize existing studies to make this knowledge accessible to
information systems researchers. The information markets literature review presented in
this dissertation is considered a contribution because it seeks to stimulate more general
interest in information markets and suggests fruitful areas for future research.
14
This dissertation establishes a theoretical foundation for organizational
information markets by conceptualizing markets from an information systems perspective
in four different ways; as IT artifacts, systems within bigger systems, business intelligent
tools, and consensus making systems, and by developing a systems theory of information
markets. These conceptualizations along with the developed theory facilitate
investigation of the relationships and interactions between markets and their context of
use, and are an important first step towards building new information systems theories
about organizational information markets to describe, explain and predict their behavior
and impacts on organizations.
Attaining a better understanding of the design, implementation and use processes
of IT artifacts in organizations is vital to devise design, implementation and use
guidelines and procedures that promote effective structuration process that leads to
organization development. This dissertation proposes a structuration model for design
and use of IT artifacts in organizations, and applies it to the study of information markets.
It also provides guidance on the design of information markets, their interfaces and
information visualization used by developing a framework of market users to guide
market design to satisfy users‘ motivational and informational needs.
This research extends Giddens‘ structuration theory (Giddens, 1979) by
developing the structuration model of technology-induced organization development that
defines a goal and an ultimate outcome for the structuration process of IT artifacts. This
model conceptualizes design as a group of decisions, envisions the design process as a
15
decision making process, considers technology as a catalyst for organization change and
development, and views the structuration process as a continuous change process that
objectifies changeability as an organizational permanent structure that leads to
organization development.
A well-designed information market provides utility to organizations that over the
long run might lead to their growth and development. This dissertation proposes various
ways by which organizations can utilize information markets to improve their assessment
of software project risks. For example, an information market can be designed to monitor
the status of each project objective in addition to the project overall riskiness level. It can
also be used to predict the impact of a range of risk factors or the likelihood of various
impact levels of a particular risk factor.
To answer our research questions, this dissertation proposes an experimental
information market design solution for software project risk assessment. The forecasting
goal of the market is the project riskiness level. The outcomes being forecasted are ―high
risk‖, ―medium risk‖, and ―low risk‖. Riskiness level is defined in terms of the number of
unmet objectives. Project main objectives are cost, schedule, functionality and
performance. Objectives are considered unmet when they exceed a certain threshold over
their planned limit. For example, cost exceeds budget by more than 15%. The higher the
number of unmet objectives, the higher the overall riskiness level of the project.
To test the designed information market efficacy in providing complete, current,
and accurate information about software project risks, two controlled laboratory
16
experiments are conducted. The results of the experiments provide evidence to
information market efficacy in improving risk assessment accuracy by aggregating
information from all participants in the market to provide more complete, current and
accurate assessment of risks than any individual group of participants. The results also
prove that markets can increase employees‘ willingness to report negative status
information by reducing employees‘ perception of information asymmetry, providing
incentives for truthful revelation of status information, and by protecting employees‘
identities from being exposed.
This research contributes to the software project risk management literature by
proposing an innovative technology-based solution to risk assessment problems, along
with a theoretical framework for the determinants of risk assessment accuracy. The
results of the experiments improve our understanding of the factors that increase the
accuracy of software projects status reports and consequently software project risk
assessment and provide evidence to the market effectiveness in improving software risk
assessment accuracy, which will consequently reduce software projects chances of failure
and save organizations billions of dollars. This research highlights an additional benefit
for information markets besides their anonymity and incentives offered for truthful
trading; the ability to influence participants‘ perceptions of information asymmetry which
can be very useful to organizations if utilized properly.
This dissertation contributes to the information markets literature by first
proposing a design-based solution to an important open question in the information
17
markets literature; how to generate sufficient uninformed trades required for information
markets to function properly. Second, it provides a closer look at markets‘ information
aggregation and dissemination processes by conducting laboratory experiments using
realistic information structure, business-related tasks and scenarios. Third, it evaluates an
innovative application of information markets in business. This in turn will allow us to
build theoretical models to explain and predict the impact of various information markets
designs on key business-related dependent variables.
Dissertation Organization
The reminder of this dissertation is organized in three major chapters. Chapter
Two reviews the literature and the theoretical underpinnings of information markets.
Chapter Three establishes a conceptual foundation for the study of organizational
information markets and employs several theoretical perspectives to define the
relationship between markets and organizations. Chapter Four utilizes a design science
approach to design a technology enabled information market solution to aid organizations
in managing risks facing software development projects and evaluates the market‘s
efficacy in solving the identified problems using two controlled experiments. Chapter 5
completes the dissertation with a summary of the research contributions and observations
on future research directions.
18
Chapter Two
Information Markets: Theory and Literature Review
Introduction
This chapter begins by reviewing the theoretical underpinnings for information
markets. It then provides a closer look at information markets structure and design.
Successful applications of markets in general areas such as politics, entertainment, and
sports are reviewed next. We also review the few studies that empirically investigate the
use of information markets in a business setting, to forecast sales and project delivery
dates. The following section discusses the market advantages compared to other
information aggregation and forecasting methods used in organizations today. This
chapter concludes by identifying areas for future research.
Information Markets Theoretical Base
Hayek Hypothesis
Information markets are a distinct form of futures markets whose main purpose is
to aggregate information about uncertain future events. The ability of markets to
aggregate information dispersed among individuals can be traced back to Adam Smith
(1776) and his invisible hand theory. The invisible hand process works via free markets
and division of labor where outcomes are produced in a decentralized way with no
19
explicit agreement between thousands of independent, utility maximizing agents whose
aims are neither coordinated nor identical with the actual outcome, yet bringing wealth to
their nations. This vision of decentralized planning of economies that secures the best use
of knowledge in society is what Hayek (1945) believed can only be maintained through
the free markets price system.
Thus, according to the Hayek hypothesis, a society is composed of individuals,
each spatially separated from others or decentralized, who have only partial local
knowledge of a phenomenon. Each individual‘s thoughts and beliefs are diverse and
independent. It does not matter if only few know about a certain circumstance, as long as
they all act and think independently seeking their self interest. Under these conditions,
free markets can collect, coordinate, and ensure cooperation where the whole act as one
bringing about, in form of prices, a collective wisdom purified from cognitive problems
of those few (Surowiecki, 2004).
Rational Expectations Theory
The information aggregation property of prices is what gave rise to information
markets. This property was formalized by Muth (1961) in the theory of rational
expectations and price movement. According to rational expectations theory, individuals
take all available information into account in forming expectations about future events.
In a perfectly competitive market, the rational expectation equilibrium is the
intersection point of supply and demand curves. Buyers and sellers make sequential
trades at discrete points in time with imperfect information bringing about the price
20
observed in the market. The process of acquiring information in the market advances
traders through different states ranging from no information to perfect information. As
traders discover and learn, they adjust their expectations, and the observed price
consequently evolves in a series of disequilibrium price adjustments to an expected price
which theoretically should soon become the equilibrium (Hess, 1972).
Random Walk Theory
Understanding prices‘ behaviors and their formation process in order to predict
future prices has attracted economists, market analysts, and investors‘ attention for many
years. It is a fascinating area of study and a great way of making money. There are three
major schools of thought with regard to how prices form; technical, fundamental value,
and random walk. While all agree that market prices form through series of successive
price adjustments, it is why these adjustments take place and how independent they are,
that make them disagree.
Technical analysts, also known as chartists, assume that the series of past price
changes has memory and the past tends to repeat itself. They carefully analyze historical
price changes to identify patterns to help them predict future prices and eventually
increase their chances of making profit. On contrary to this implied dependency
assumption, random walk theorists assume independence. In other words, patterns
identified cannot be used to predict future changes and any profit made using technical
analysis cannot exceed those made by chance, or by using a buy and hold trading strategy
(Fama, 1965b). A Random Walk Down Wall Street (Malkiel, 1973) can even convince
21
investors that buy and hold strategy is best since attempts to outperform the market based
on technical, fundamental, or any other forms of analysis are vain.
Fundamental value analysis is consistent with the random walk independence
assumption. Fundamental value analysts believe that each security has an intrinsic value.
They evaluate the company‘s earnings, dividend policy, the riskiness of their
investments, and the political and economic factors affecting them to estimate securities
value and expected return. Changes in market prices can be caused by disagreement
between traders on how valuable securities are, new information arriving at different
points in time, or by the mere accumulation of random noise due to individuals‘
impulsive betting behavior (Fama, 1965a). The arrival of new information or the noise
created by irrational behavior can cause prices to change in a dependent way to levels
above or below their intrinsic values. However, experienced intrinsic value analysts will
shortly notice that activity and act quickly by selling or buying, thus, driving price levels
back towards their intrinsic values and eliminating any dependence in successive price
changes (Fama, 1965a).
Efficient Market Hypothesis
The Efficient Market Hypothesis (EMH) (Fama, 1970), which requires traders to
have rational expectations, is connected to random walk theory. The EMH asserts that
markets are informationally efficient, and thus are impossible to beat. In other words,
prices of traded assets reflect all available information about future prospects of the asset.
Since prospects are analogous to events. Prices in efficient information markets reflect all
22
available information about the likelihood of the events. Thus, information markets
utilize market efficiency to harness the collective knowledge of participants to predict the
likelihood of future events.
Modern behavioral finance has shown that people make systematic errors when
predicting the future. This irrational behavior could also arise due to emotional errors
(Clark, 2007), wishful thinking, or making mistakes, biased or not (Forsythe, Rietz, and
Ross, 1999). These behaviors create market inefficiencies and anomalies in prices that
may be inexplicable via any available hypothesis (Fox, 2002; Rosenberg, Reid and
Lanstein, 1985).
However, information markets effectiveness seems to be immune to irrationality.
Forsythe, Nelson, Neumann, and Wright, (1992) analyzed Iowa political stock market
data to test the market ability to aggregate information about political events. Trader level
analysis showed that some traders appeared rational while others exhibited substantial
cognitive and judgmental biases, such as assimilation-contrast and false-consensus
effects. In spite of that, the market forecasts were notably accurate.
Marginal Trader Hypothesis
In efficient information markets, it does not really matter if all traders are rational
or not, as long as the marginal trader is rational and motivated by profit; the market
generated forecast will be fairly accurate (Forsythe, Nelson, Neumann, and Wright, 1992;
Wolfers and Zitzewitz, 2004). The marginal trader hypothesis claims that ―marginal
traders who are influential in setting market prices are all that is needed for the Hayek
23
hypothesis to succeed‖(Forsythe et al., 1999, p. 84). The marginal traders are those who
submit limit orders close to the market price. While those who are inactive, make only
market orders, or make limit orders at prices far away from market prices are not
considered marginal (Forsythe et al., 1999).
Each market trade is determined by two separate acts, or two trader roles: a
market maker submitting a limit order and a price taker accepting it (submitting a market
order). Traders self select into these two roles. Violations of the law of one price, the no-
arbitrage assumption, and those of individual rationality, can be classified into price
taking and market making violations (Oliven and Rietz, 2004). Even though average
traders might exhibit judgment biases, marginal traders, or market makers, are who
determine whether markets are efficient or not (Oliven and Rietz, 2004).
Studies have found that marginal traders appear to behave more rationally, exhibit
less biased trades, and are more experienced and knowledgeable (Forsythe et al., 1992;
Forsythe et al., 1999; Oliven and Rietz, 2004). It is worth noting though, that a market
maker cannot exist without a price taker, otherwise the no-trade theorem will bind and
traders will not agree to disagree (Aumann, 1976; Milgrom and Stocky, 1982). It is still
an important open question in the information markets literature on how to attract those
price takers, despite their possible irrational behavior, to participate in trading due to their
critical role in executing trades (Wolfers and Zitzewitz, 2006).
24
A Closer Look at Information Markets
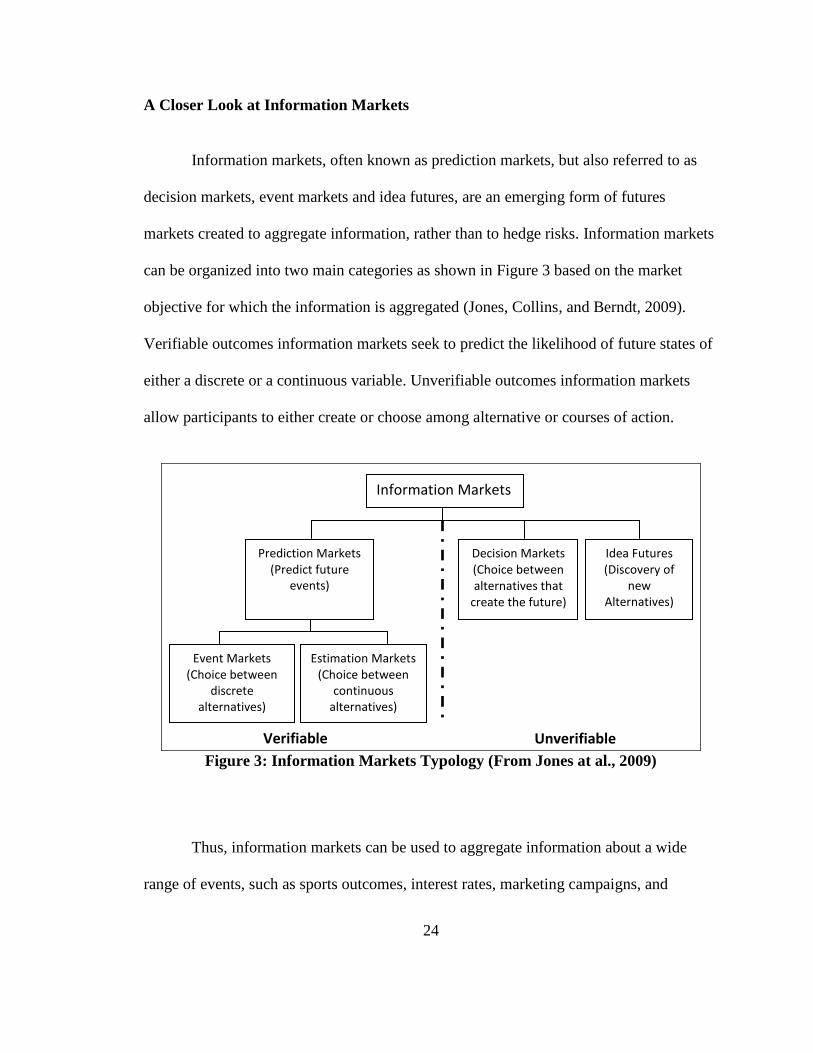
Information markets, often known as prediction markets, but also referred to as
decision markets, event markets and idea futures, are an emerging form of futures
markets created to aggregate information, rather than to hedge risks. Information markets
can be organized into two main categories as shown in Figure 3 based on the market
objective for which the information is aggregated (Jones, Collins, and Berndt, 2009).
Verifiable outcomes information markets seek to predict the likelihood of future states of
either a discrete or a continuous variable. Unverifiable outcomes information markets
allow participants to either create or choose among alternative or courses of action.
Figure 3: Information Markets Typology (From Jones at al., 2009)
Thus, information markets can be used to aggregate information about a wide
range of events, such as sports outcomes, interest rates, marketing campaigns, and
Information Markets
Idea Futures (Discovery of
new Alternatives)
Decision Markets (Choice between alternatives that
create the future)
Prediction Markets (Predict future
events)
Estimation Markets (Choice between
continuous alternatives)
Event Markets (Choice between
discrete alternatives)
Unverifiable Verifiable

25
research ideas. Although markets differ in many respects, such as market design and
incentive structure, they generally consist of one or more events for which you would like
a reliable forecast.
The standard contract in the market is the binary contract, aka winner-take-all. It
costs a certain amount and pays off, for instance, $1 if and only if the event occurs, and
nothing otherwise. Traders buy and sell contracts of future events based on their beliefs
in the events likelihood of occurrence. For example, if a trader believes the event is going
to happen, s/he will buy contracts in the event. But if a trader has information to the
contrary, s/he will sell contracts in the event. Contract prices and events probabilities are
positively correlated. The higher the likelihood of the event the higher its contract price
and vice versa. The result is a trading price that tracks the consensus opinion (Hanson,
1992), and can be interpreted as market-aggregated forecast of the event probability
(Wolfers and Zitzewitz, 2004). For example, if a contract price is selling for $70, that
means there is a 70% chance of the event happening.
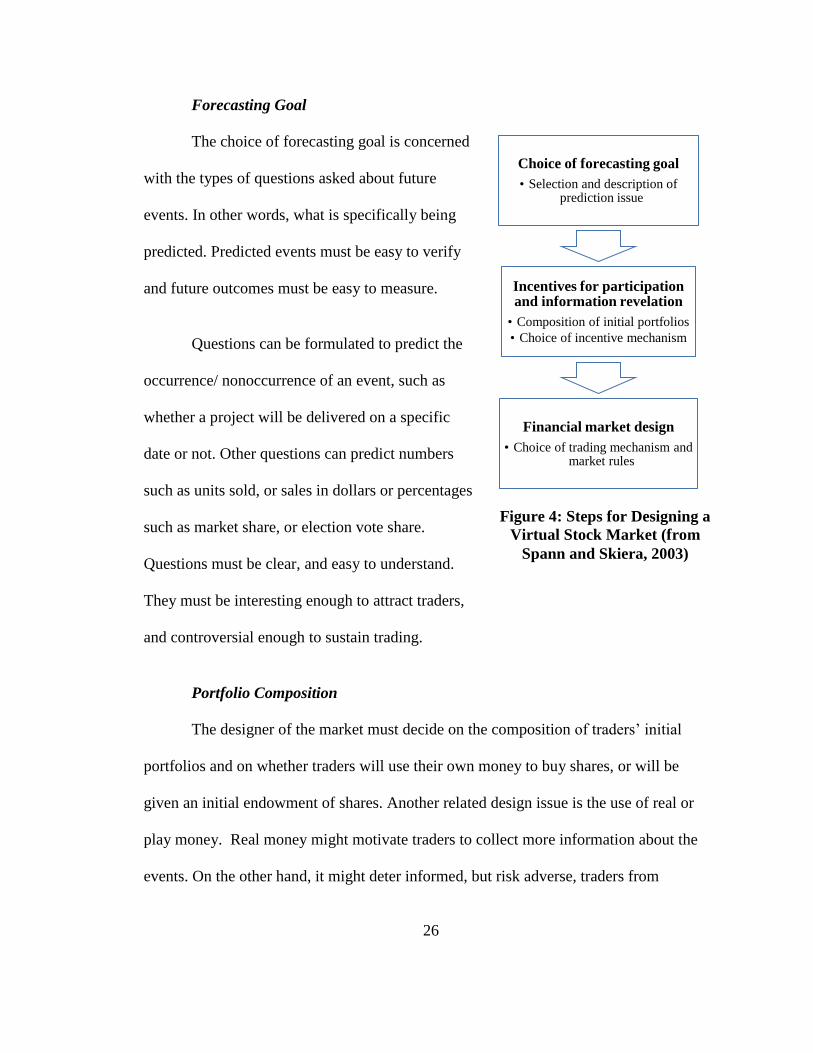
Market Design
Based on research results in the fields of experimental economics, financial
markets, and political stock markets, Spann and Skiera (2003) grouped main aspects of
information markets design into three categories, outlined in Figure 4.
26
Forecasting Goal
The choice of forecasting goal is concerned
with the types of questions asked about future
events. In other words, what is specifically being
predicted. Predicted events must be easy to verify
and future outcomes must be easy to measure.
Questions can be formulated to predict the
occurrence/ nonoccurrence of an event, such as
whether a project will be delivered on a specific
date or not. Other questions can predict numbers
such as units sold, or sales in dollars or percentages
such as market share, or election vote share.
Questions must be clear, and easy to understand.
They must be interesting enough to attract traders,
and controversial enough to sustain trading.
Portfolio Composition
The designer of the market must decide on the composition of traders‘ initial
portfolios and on whether traders will use their own money to buy shares, or will be
given an initial endowment of shares. Another related design issue is the use of real or
play money. Real money might motivate traders to collect more information about the
events. On the other hand, it might deter informed, but risk adverse, traders from
Choice of forecasting goal
• Selection and description of prediction issue
Incentives for participation and information revelation
• Composition of initial portfolios
• Choice of incentive mechanism
Financial market design
• Choice of trading mechanism and market rules
Figure 4: Steps for Designing a
Virtual Stock Market (from
Spann and Skiera, 2003)
27
participating. Additionally gambling laws might restrict the use of real money markets,
making the play money alternative plausible. In terms of predictive accuracy, studies
have shown that real and play money markets result in equally accurate predictions
(Servan-Schreiber, Wolfers, Pennock and Galebach, 2004).
Incentive Structure
Designers must also decide on an incentive structure to motivate traders to
participate, and to truthfully reveal what they know about an event. After all, a trade
requires a trader to put her money where her mouth is. The incentive structure, and the
type of contracts used, can elicit the collective expectations of a range of different
parameter, such as the probability, mean or median value of an outcome (Wolfers and
Zitzewitz, 2004). For example, when the outcomes of an event are mutually exclusive,
such as (yes/no), or (occur/not occur), the binary contract, described in the previous
section, can be used to elicit the event‘s probability of occurrence. The same applies to
events with more than two mutually exclusive outcomes. State-contingent or winner-
take-all contracts can be used, and their prices can be interpreted as the collective or the
market forecast of the event probability. As long as the no arbitrage condition is satisfied
though. In other words, the sum of prices of the traded state-contingent contracts should
be exactly equal to the payoff of the winning contract (Chen, Fine and Huberman, 2001).
For example, in case of binary contracts, if the winning contract pays off a $100, the sum
of prices of the two traded contracts must be equal to a 100 (e.g. Yes $40, No $60).
28
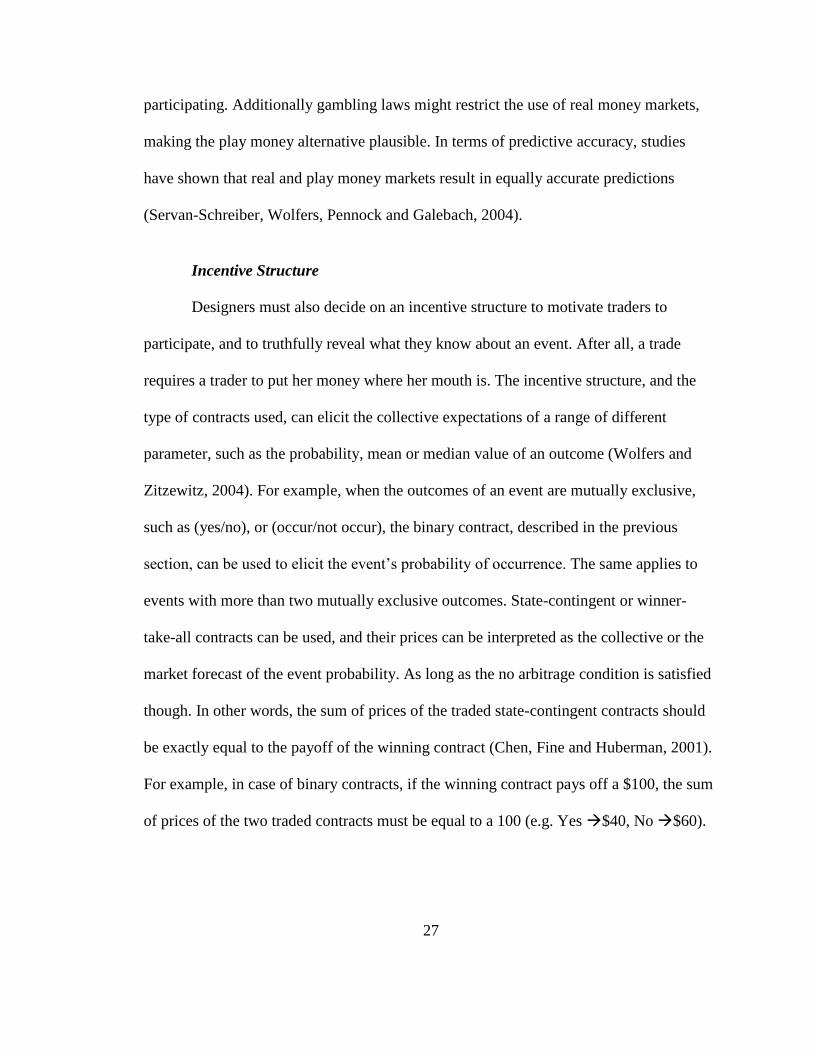
Iowa Electronic Markets (IEM), a well known real-money prediction market, used
winner-take-all contracts to predict the outcomes of the 2008 U.S. presidential elections
(Table 2). IEM‘s winner-take-all prediction market opened in June 2006. The founder of
the IEM, Professor Tom Rietz, said ―the IEM traders saw Obama's win even before
anyone knew who the two parties' nominees would be.‖ At midnight the day before the
election, prices indicated a 90 percent probability that the Democratic candidate would
win the popular vote (IEM press release, Nov 5, 2008).
Table 2: IEM 2008 US Presidential Election Winner Takes All Contracts
Code Contract Description
DEM08_WTA
$1 if the Democratic Party nominee receives the majority of popular votes
cast for the two major parties in the 2008 U.S. Presidential election, $0
otherwise
REP08_WTA $1 if the Republican Party nominee receives the majority of popular votes
cast for the two major parties in the 2008 U.S. Presidential election, $0
otherwise
Figure 5: IEM 2008 US Presidential Election Winner Takes All Market
(Source: http://iemweb.biz.uiowa.edu/graphs/graph_PRES08_WTA.cfm)
29
In support for Professor Rietz statement, Figure 5 shows that for more than two
years the democratic contract price never once dropped below the republican. Prices were
exceptionally responsive to unfolding events on the campaign trail, and fluctuated around
primary, caucus, and major party convention dates.
When forecasted outcomes are numbers or percentages, such as sales in dollars,
vote count, or percentage of vote share, index contracts can be used that pay off
proportionately to the outcomes (Wolfers and Zitzewitz, 2004). IEM vote share contracts
(Table 3) are examples of index contract.
Table 3: IEM 2008 US Presidential Election Vote Share Contracts
Code Contract Description
UDEM08_VS $1.00 times two-party vote share of unnamed Democratic nominee in 2008
election
UREP08_VS $1.00 times two-party vote share of unnamed Republican nominee in 2008
election
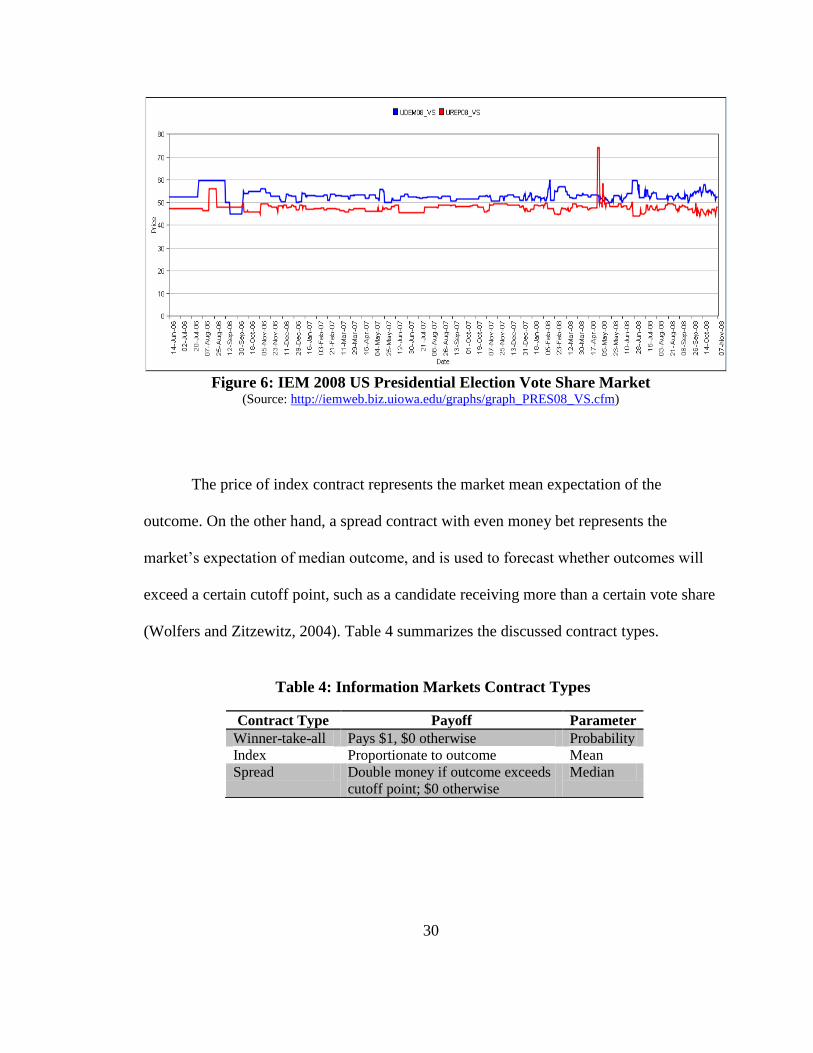
Prices on the IEM's Vote Share Market (Figure 6) predicted the percentages
received of the two-party presidential popular vote to within half percentage point: the
market predicted 53.55 percent for Barack Obama, and 46.45 percent for John McCain.
After the ballots were counted, Obama received 53.2 percent of the vote, and McCain
received 46.8 percent (IEM press release, Nov 24, 2008).
30
Figure 6: IEM 2008 US Presidential Election Vote Share Market
(Source: http://iemweb.biz.uiowa.edu/graphs/graph_PRES08_VS.cfm)
The price of index contract represents the market mean expectation of the
outcome. On the other hand, a spread contract with even money bet represents the
market‘s expectation of median outcome, and is used to forecast whether outcomes will
exceed a certain cutoff point, such as a candidate receiving more than a certain vote share
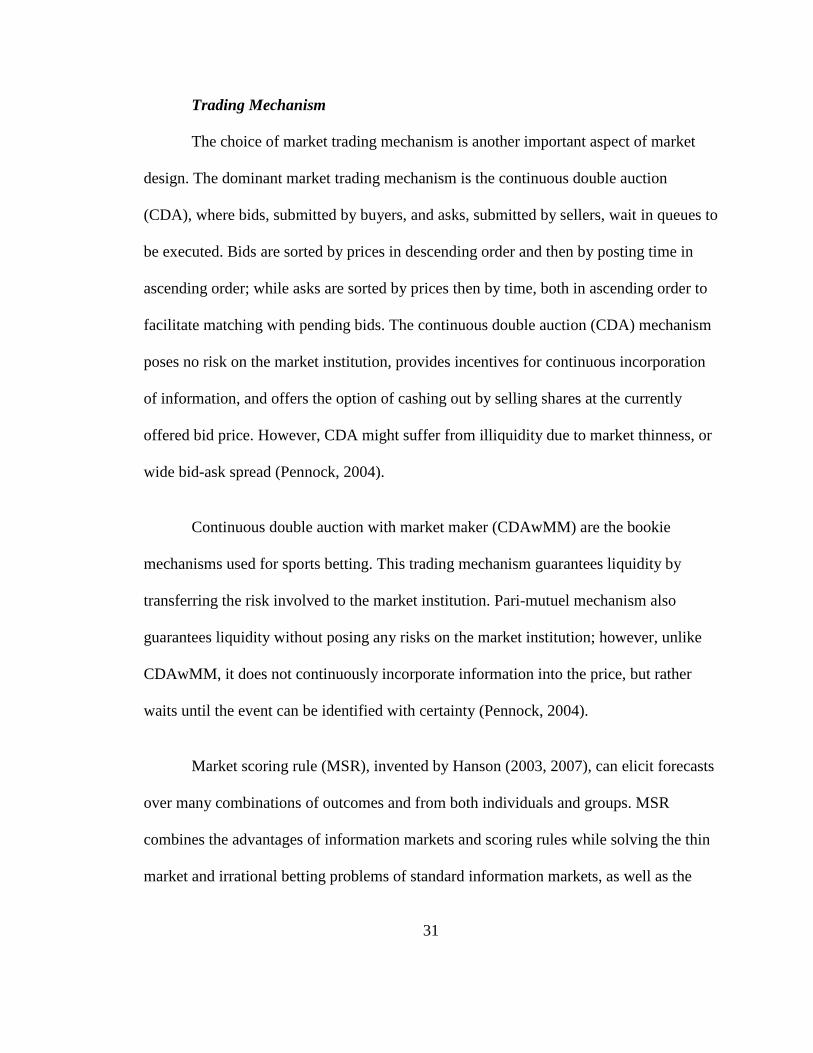
(Wolfers and Zitzewitz, 2004). Table 4 summarizes the discussed contract types.
Table 4: Information Markets Contract Types
Contract Type Payoff Parameter
Winner-take-all Pays $1, $0 otherwise Probability
Index Proportionate to outcome Mean
Spread Double money if outcome exceeds
cutoff point; $0 otherwise
Median
31
Trading Mechanism
The choice of market trading mechanism is another important aspect of market
design. The dominant market trading mechanism is the continuous double auction
(CDA), where bids, submitted by buyers, and asks, submitted by sellers, wait in queues to
be executed. Bids are sorted by prices in descending order and then by posting time in
ascending order; while asks are sorted by prices then by time, both in ascending order to
facilitate matching with pending bids. The continuous double auction (CDA) mechanism
poses no risk on the market institution, provides incentives for continuous incorporation
of information, and offers the option of cashing out by selling shares at the currently
offered bid price. However, CDA might suffer from illiquidity due to market thinness, or
wide bid-ask spread (Pennock, 2004).
Continuous double auction with market maker (CDAwMM) are the bookie
mechanisms used for sports betting. This trading mechanism guarantees liquidity by
transferring the risk involved to the market institution. Pari-mutuel mechanism also
guarantees liquidity without posing any risks on the market institution; however, unlike
CDAwMM, it does not continuously incorporate information into the price, but rather
waits until the event can be identified with certainty (Pennock, 2004).
Market scoring rule (MSR), invented by Hanson (2003, 2007), can elicit forecasts
over many combinations of outcomes and from both individuals and groups. MSR
combines the advantages of information markets and scoring rules while solving the thin
market and irrational betting problems of standard information markets, as well as the
32
information pooling problems of simple scoring rules. MSR is currently used at Inkling
Markets, the Washington Stock Exchange, BizPredict, and several other markets.
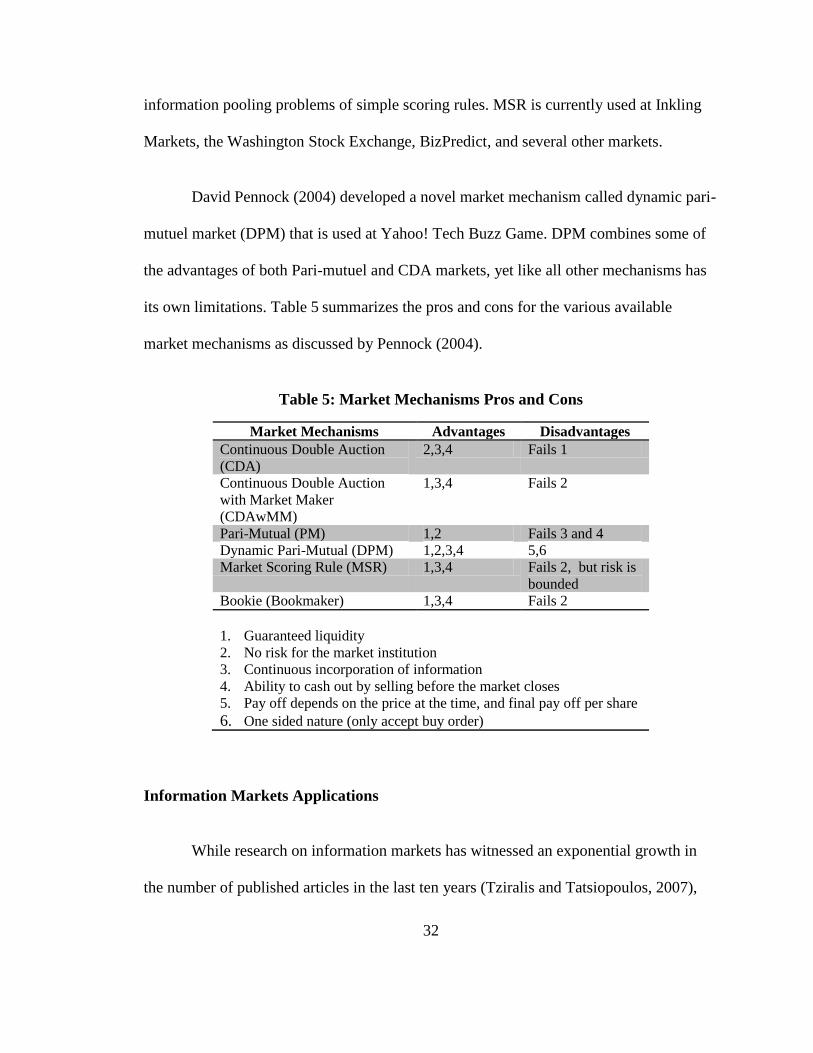
David Pennock (2004) developed a novel market mechanism called dynamic pari-
mutuel market (DPM) that is used at Yahoo! Tech Buzz Game. DPM combines some of
the advantages of both Pari-mutuel and CDA markets, yet like all other mechanisms has
its own limitations. Table 5 summarizes the pros and cons for the various available
market mechanisms as discussed by Pennock (2004).
Table 5: Market Mechanisms Pros and Cons
Market Mechanisms Advantages Disadvantages
Continuous Double Auction
(CDA)
2,3,4 Fails 1
Continuous Double Auction
with Market Maker
(CDAwMM)
1,3,4 Fails 2
Pari-Mutual (PM) 1,2 Fails 3 and 4
Dynamic Pari-Mutual (DPM) 1,2,3,4 5,6
Market Scoring Rule (MSR) 1,3,4 Fails 2, but risk is
bounded
Bookie (Bookmaker) 1,3,4 Fails 2
1. Guaranteed liquidity
2. No risk for the market institution
3. Continuous incorporation of information
4. Ability to cash out by selling before the market closes
5. Pay off depends on the price at the time, and final pay off per share
6. One sided nature (only accept buy order)
Information Markets Applications
While research on information markets has witnessed an exponential growth in
the number of published articles in the last ten years (Tziralis and Tatsiopoulos, 2007),
33
prediction markets have been around for a long time. Betting on political outcomes has a
long tradition in the United States, with large and formal markets, such as the New York
betting market, operating for over three-quarters of a century (Rhode and Strumpf, 2004).
These markets have had a very large volume of activity and a notable predictive accuracy
(Rhode and Strumpf, 2004).
Today, the Iowa Electronic Market (IEM), the most well known application of
information markets, is offering markets in which traders can bet on a wide variety of
events ranging from the outcomes of presidential elections, to the periodic interest rate
decisions of the Federal Reserve‘s Open Market Committee (Hahn and Tetlock, 2006).
Since 1988, prices on the IEM have proved more accurate than traditional polls in
forecasting elections more than 75 percent of the time, with an average absolute error of
only 1.5 percentage point, compared to 2.1 percentage points for polls (Berg, Forsythe,
Nelson and Rietz, 2003; Forsythe et al., 1992; Hahn and Tetlock, 2006).
Market forecasts can be used to inform decisions made by political parties, such
as nominating presidential candidates that are likely to win, as well as decisions made by
the candidates themselves regarding their campaigns strategy such as what issues to focus
on. The idea of using markets for decision support was first introduced by Hanson (1999)
when he used the concept of decision markets, or conditional markets, to illustrate how
market forecasts can be used to inform decisions about an event, given market predictions
of another. Berg and Rietz (2003) provided an elaborate analysis of the 1996 presidential
election market, and described how market prices can be used to support decisions; for
34
example, market forecasts suggested that Dole was not the strongest candidate in the set,
so the Republican Party could have used market prediction to support a stronger
candidate with a better chance of beating Clinton (Berg and Rietz, 2003).
The Hollywood Stock Exchange (HSX) is another successful application of
information markets. Traders in the HSX buy and sell shares of their favorite actors or
movies causing securities‘ prices to rise or fall. Traders evaluate movies by collecting
information from movies websites, readings critics‘ reviews and blogs, and interacting
with fan communities to form beliefs about movies‘ potential prospects. Prices of
securities are used to predict Oscar, Emmy, and Grammy award winners and movie box
office returns. The predictions have proved to be highly correlated with actual outcomes.
In 2009, players correctly predicted 29 of 37 Oscar nominees for the 81st Annual
Academy Awards, a 78.4% success rate, bringing HSX‘s 11 year average to an
impressive 82.1% (HSX press release, Jan 22, 2009).
The HSX is being used as a market research instrument where movies‘ box-office
prerelease forecasts are used to determine marketing budget, the number of movie
screens, and related promotional activities (Eliashberg and Sawheny, 1996; Spann and
Skiera, 2003). Spann and Skiera (2003) analyzed the HSX forecasting accuracy for 152
movies, and compared market predictions to two renowned experts‘ predictions. They
also analyzed the market performance in many other areas, such as predicting the number
of movie visitors, and chart position of pop music singles in Germany, and even in
predicting the usage of different mobile phone services of a large German mobile phone
35
operator. Market predictions were fairly accurate. Results showed that markets work well
under different incentives structures and with small number of participants.
There are many other successful Web-based implementation of information
markets designed to aggregate information and forecast events in many areas such sports,
politics, finance, law, entertainment, and even the weather. Some examples of real money
information markets include Intrade, TradeSports, Nadex and BetFair. Other examples of
play money markets are NewsFutures, Inkling markets, and the Foresight Exchange.
In 2006, over 25 companies in the United States had started to experiment with
information markets (King, 2006). Today the number has at least doubled and companies
have moved beyond the experimentation stage. Microsoft is using the market to predict
software quality issues, such as the number of bugs in new software application, Google
is using it to predict dates of product lunches and GE is using it to choose the best new
research ideas (Schonfeld, 2006). AT&T, Yahoo, Corning and Best Buy are just a few
examples of the many Fortune 500 companies that have begun to seriously use the market
in various areas.
In a series of experiments at Hewlett-Packard laboratories, markets outperformed
official HP forecasts 75% of the time in predicting printer sales and the DRAM
microchip prices (Chen and Plott, 2002; Schonfeld, 2006). Ortner (1997, 1998)
conducted an experiment using information markets at Siemens Austria to forecast delays
and reveal information about software project progress. Results showed that market
prices anticipated delays long before the official release of information, proving the
36
usefulness of using markets in the software project management arena. The Milestone
Market (www.milestonemarket.org) at the University of South Florida is being deployed
for software cost estimation and software project management where market contracts are
defined for each set of milestones, and are tied to defined cost and time estimates
(Berndt, Jones and Finch, 2006).
Intel integrated an information market designed to forecast demand into the
company‘s standard forecasting processes. The results of early experiments showed that
market forecasts are stable, responded well to demand fluctuations, and were at least as
accurate as the official forecasts, with 75% of market forecasts falling within 2.7% of
actual sales (Hopman, 2007).
In addition to aggregating information, and forecasting events, markets can be
used to study how organizations process information (Cowgill, Wolfers, and Zitzewitz,
2008). The Cowgill et al. (2008) analysis of Google‘s internal prediction market showed
how markets can be used to track information flow within the organization and how it
responds to external events.
Information Aggregation Methods
Organizations employ various methods to elicit forecasts and aggregate
information held by members of a group. When the issues at hand are purely factual,
statistical groups can be used by asking a large group of individuals and calculating the
statistical mean or median of their answers (Sunstein, 2005).
37
However, when the group is anchored by a misleading number or the group
members are ignorant to the issue at hand, the likelihood that the group will decide
correctly decreases as the size of the group increases (Sunstein, 2005).
Alternatively, deliberation can be used to improve group decision making through
discussions and debates, especially when the issues are normative rather than factual
(Sunstein, 2005). Armstrong (2006) presented the case against face-to-face meetings,
demonstrating how ineffective and inefficient traditional group meetings are at
aggregating information. Groups often produce inaccurate outcomes because of
informational and social influences (Sunstein, 2005).
Sunstein (2005) argued that informational influence occurs when group members
announce their information by conduct, conclusions or by reason-giving; influencing
other group members not to disclose any information to the contrary. On the other hand,
social influence leads individuals to conform to higher status group members fearing
disapproval, or social sanctions of various sorts. These influences impair group judgment
by emphasizing shared information, creating hidden profiles, cascade effects, and group
polarization (Sunstein, 2005).
Additionally, individual group members have limited information processing
capabilities and therefore rely on heuristics such as representativeness, availability,
framing, anchoring, and adjustment to reduce the cognitive load of predicting values or
assessing probabilities (Tversky and Kahneman, 1974). The use of heuristics reduces
38
complex tasks to much simpler judgmental tasks, creating biases and errors in individual
judgments that are propagated, and often amplified, in group settings.
The Delphi method is utilized to diminish the informational and social influences
of deliberative groups. The Delphi technique uses a self-administered questionnaire and a
system of controlled feedback wherein a group of experts participate in anonymous
rounds of estimates and feedback until the degree of convergence reaches a desired
threshold. Members are allowed to communicate their judgments and conclusions
anonymously in the form of summary statistics along with their justification and
reasoning behind them. Experts can then respond to the forecasts and justifications of
others and revise their own based on the feedback they receive. Finally, individual
judgments are statistically aggregated (Armstrong, 2001).
Rowe and Wright (1999) reviewed 25 empirical studies that evaluated the
effectiveness of the Delphi method in terms of forecast accuracy and quality. Their
review showed that Delphi outperformed both statistical and interactive groups roughly
over 80% of the time. Although the Delphi technique proved to improve forecasting and
decision making, it has its own limitations. In addition to the possible difficultly of
recruiting experts in any area of interest, Delphi does not have an incentive structure to
motivate experts to reveal their true beliefs. Also, Delphi does not allow incorporation of
additional information into the forecasts because it offers results only at a certain point in
time (Green, Armstrong, and Graefe, 2007).
39
Information Markets Advantages
Much of the enthusiasm for using information markets as a method of forecasting
and information aggregation comes from the inadequacy of existing methods to
accomplish this task. Information markets are being used to overcome the limitations of
the various aforementioned methods. Green et al. (2007) discussed how information
markets can avoid the drawbacks of Delphi. First of all, markets are not restricted by
experts‘ availability, instead, traders self select to participate in the market if they believe
their private information is not yet incorporated into the market price. Second, markets
offer incentives for true revelation of beliefs. Monetary incentives eliminate group
pressure to conform, where traders can only benefit by trading according to their own
beliefs. Third, unlike Delphi, markets are dynamic and responsive to changing
circumstances. Prices in information markets incorporate new information almost
instantly, providing continuous and up to date forecasts of events.
Information markets offer many other advantages over existing methods (Table
6). First, Web-based implementations of information markets are not restricted by
location or time. Traders can participate from around the globe, 24-7. Second, markets
are more cost effective and time efficient than other information aggregation methods.
The process of price formation and discovery collects disparate information scattered
around the organization or around the world in a matter of hours, and at relatively little to
no cost. Third, market trading is anonymous. Anonymity plays a pivotal role in reducing
social and informational influences that prevail in group settings. Fourth, trading
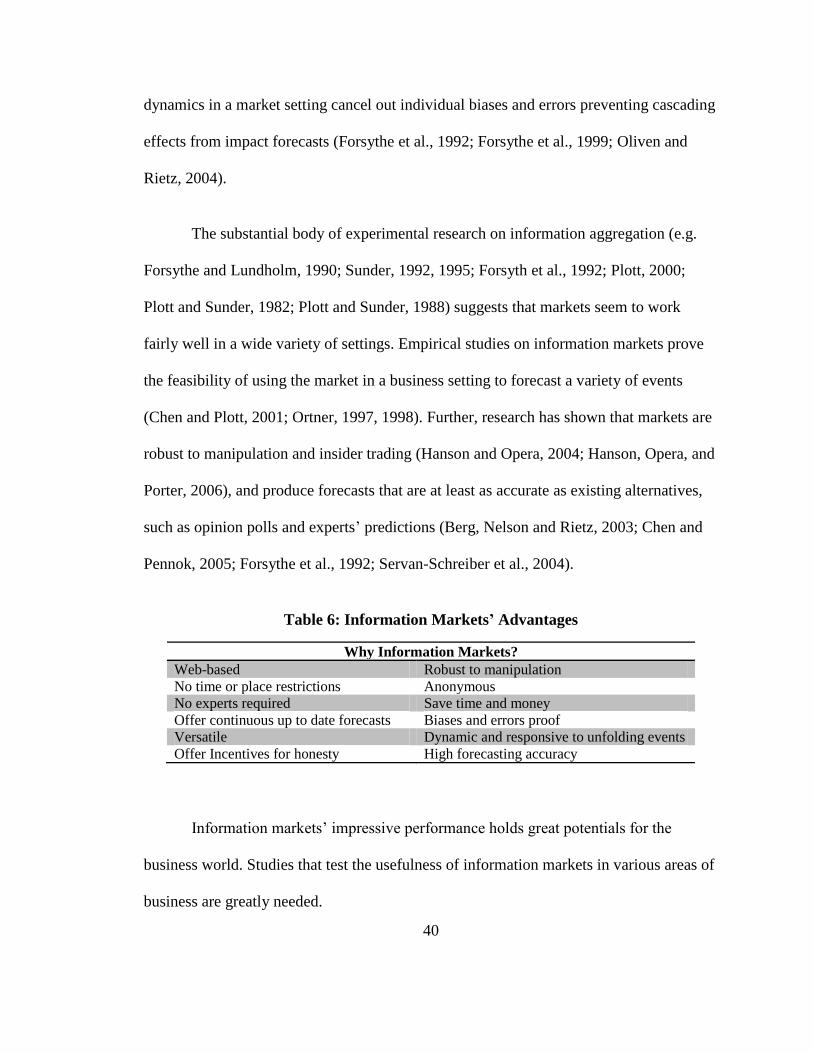
40
dynamics in a market setting cancel out individual biases and errors preventing cascading
effects from impact forecasts (Forsythe et al., 1992; Forsythe et al., 1999; Oliven and
Rietz, 2004).
The substantial body of experimental research on information aggregation (e.g.
Forsythe and Lundholm, 1990; Sunder, 1992, 1995; Forsyth et al., 1992; Plott, 2000;
Plott and Sunder, 1982; Plott and Sunder, 1988) suggests that markets seem to work
fairly well in a wide variety of settings. Empirical studies on information markets prove
the feasibility of using the market in a business setting to forecast a variety of events
(Chen and Plott, 2001; Ortner, 1997, 1998). Further, research has shown that markets are
robust to manipulation and insider trading (Hanson and Opera, 2004; Hanson, Opera, and
Porter, 2006), and produce forecasts that are at least as accurate as existing alternatives,
such as opinion polls and experts‘ predictions (Berg, Nelson and Rietz, 2003; Chen and
Pennok, 2005; Forsythe et al., 1992; Servan-Schreiber et al., 2004).
Table 6: Information Markets’ Advantages
Why Information Markets?
Web-based Robust to manipulation
No time or place restrictions Anonymous
No experts required Save time and money
Offer continuous up to date forecasts Biases and errors proof
Versatile Dynamic and responsive to unfolding events
Offer Incentives for honesty High forecasting accuracy
Information markets‘ impressive performance holds great potentials for the
business world. Studies that test the usefulness of information markets in various areas of
business are greatly needed.
41
Future Research Directions
Research on how information markets are used inside organizations is still in its
infancy. Little is known about the impact of the business environment on market design,
incentive structure, and types of questions asked in the market, or more simply put, what
works and what does not. Little is also known about the impact of the market on work
processes, corporate culture, and formal and informal reporting mechanisms in the
organization.
Future research should investigate the impact of different incentives structures
and the type of market mechanism used (e.g. pari-mutuel, continuous double auction,
market scoring rules) on the market‘s forecasting accuracy. Studies should also
investigate the impact of incentive structures and market design on organizations‘
decisions to adopt the market and traders‘ motivations to participate in it. For example,
different trading mechanisms have different associated learning curves which may affect
the market perceived ease of use, and consequently, organizations‘ decisions to adopt the
market. It may also require traders to employ different trading strategies that involve a
greater cognitive effort to analyze information and to participate in market trading; thus
discouraging them from participating in the market.
Moreover, future research should empirically compare information markets to
other methods of information aggregation, such as the Delphi method, not only in terms
of forecasting accuracy but also on multiple other dimensions, such as the nature of
forecasting problems appropriate for each method, sources of relevant information (e.g.
42
external, internal, or a mix of both), the availability of public information to attract
participants, the availability of experts in certain areas, and the costs involved in
recruiting experts, acquiring the market, training, trading time, incentives, etc.
Comparative studies seek to fill in gaps in the literature, satisfy researchers‘
curiosity, and help put everything in perspective. One might argue that the value of new
innovations can be better appreciated relatively rather than in absolute terms. However,
we caution against using forecasting accuracy as the sole basis for comparison between
markets and other existing methods. It is important to keep in mind when evaluating the
effectiveness of information markets what made them attractive in the first place.
Available methods of forecasting and information aggregation such as polls, surveys and
the Delphi method have their own limitations, and produce inaccurate forecasts all the
time. So are we really doing markets justice by comparing them to error-prone
benchmarks?
Further, unintended uses of markets might emerge that bring additional benefits to
organizations, rendering them incomparable to other methods. Markets bring about a
unique mix of involvement and enjoyment that other methods do not provide. By
promoting democratic participation in decision making and idea generation, organizations
might be able to increase employees‘ loyalty, job satisfaction, and retention rates.
Research is needed to study such questions.
Information markets impact on organizations‘ hierarchy and control structures
and on their relationships with employees, customers, partners, and strategic allies might
43
change the way business is done forever. These unanticipated benefits might create a
stronger motivation to adopt information markets than their predictive accuracy.
Information markets are innovative tools to harness the collective intelligence buried in
organizations. They hold great promises for business that are only limited by our own
innovation to realize them.
44
Chapter Three
A Foundation for the Study of Organizational Information Markets
Introduction
The term ―collective intelligence‖ has long been associated with non-human
societies such as bacteria, insects, and animals. Perhaps human pride has deterred
individuals from admitting that ―none of us, is smarter than all of us‖, until advanced
communication technologies, the World Wide Web, and the Internet have made this fact
evident to the world (Servan-Schreiber, 2008). Google, Wikipedia, and information
markets are three examples of human collective intelligence enabled by the Web that are
designed to aggregate existing information to enhance existing knowledge. However,
information markets have the additional benefit of generating new reliable knowledge
about the future (Servan-Schreiber, 2008).
Information markets, also known as prediction/decision markets, are a form of
futures markets designed to aggregate disparate information and intuitions about the
likelihood of uncertain future events. Traders bet on the chances of the event by buying
shares if they believe the event is going to happen and selling shares if they believe
otherwise. The price of the traded shares in the event can be interpreted as the market
consensus forecast of the event‘s probability (Wolfers and Zitzewitz, 2004). Once the
45
event‘s outcomes (e.g. occur/not occur) can be determined with certainty, shares payoff
according to the actual outcome.
The most well known application of information markets is the Iowa Electronic
Market (IEM), established at the University of Iowa in 1988, to predict the outcomes of
the U.S. presidential elections. Since its inception, IEM has demonstrated an impressive
predictive performance with an average absolute error of only 1.5 percentage points
compared to 2.1 percentage points for Gallup polls (Berg, Forsythe, Nelson, and Rietz,
2003). Over the long run, the market predictions were closer to the actual election result
74% of the time when compared to 964 polls over the five Presidential elections since
1988 and outperformed the polls in every election when forecasting more than 100 days
in advance (Berg, Nelson, and Rietz, 2008).
The Hollywood Stock Exchange (HSX) is another successful application of
information markets used to predict Oscar, Emmy, and Grammy award winners and
movie box office returns. In 2009, Hollywood Stock Exchange announced a 78.4%
success rate in predicting the 81st Annual Academy Awards nominations, bringing its 11
years average to a remarkable 82.1% (HSX press release, Jan 22, 2009).
Market forecasts can be used to inform decisions about forecasted events. For
example, IEM forecasts can be used to inform decisions made by political parties, such as
nominating presidential candidates that are likely to win, as well as decisions made by the
candidates themselves regarding their campaigns strategy and the issues to focus on
(Berg and Rietz, 2003). Similarly, HSX forecasts can be used by movie production
46
companies to determine marketing budget, the number of movie screens, and related
promotional activities (Eliashberg and Sawheny, 1996; Spann and Skiera, 2003).
Information markets‘ outstanding performance in predicting future events such as
elections outcomes and other issues of public interest, coupled with an increasing interest
in finding more efficient alternatives for information aggregation, has inspired the
corporate world to start experimenting with information markets. Yahoo, Google,
Microsoft, GE, HP, Intel and many other fortune 500 companies are now using
information markets to forecast business related issues, such as product delivery dates,
product sales, market demand, and software quality issues.
Although the number of companies adopting information market technology is on
the raise, it is still less than 1% of the target audience (Gartner, 2008) and despite the
enthusiasm for using information markets for business forecasting, research on
information markets used inside organizations is still in its infancy. It is expected that
information markets will reach main stream adoption within 5 to 10 years (Gartner, 2008)
and yet little is known about the impact of the business environment on market design,
incentive structure, and types of questions asked in the market, or more simply put, what
works and what does not. Little is also known about the impact of the market on work
processes, corporate culture, and formal and informal reporting mechanisms in the
organization.
Information markets are, in essence, IT artifacts. To make the best out of this
innovative technology, we must first theorize about the technology itself and about the
47
reciprocal relationship between markets and their environment to develop an
understanding of how information markets‘ use impacts organizations, how the business
setting impacts market design, and how design impacts use and consequently the market
objectives.
As a first step to systematically investigate the design and use processes of
markets inside organizations, this chapter theorizes about information markets from an
information systems perspective. The next section presents an information systems
research framework for information markets, and re-conceptualizes markets as IT
artifacts. Section three employs systems thinking concepts to develop a systems theory of
information markets to facilitate investigation of the relationships and interactions
between markets as systems and their context of use.
Section four briefly reviews Giddens‘ structuration theory and its use in the
information systems field and defines information markets from a structuration
perspective. Section five proposes a structuration model for design and use of IT artifacts
in organizations and applies it to the study of information markets. A closer look at
information markets design and use is presented in the following two sections, where a
framework of market users is proposed to guide market design to satisfy users‘
motivational and informational needs.
Our conceptualization of the structuration process of IT artifacts in general and
information markets in particular is summarized in the structuration model of technology-
induced organization development, that extends Giddens‘ structuration theory by
48
considering technology as a catalyst for organization change and development and the
structuration process as a continuous change process that objectifies changeability as an
organizational permanent structure that leads to organization development. Conclusions
and future directions conclude this chapter.
Markets as IT Artifacts
Information markets are at the frontier of predictive futures and collective
intelligence research. Their impressive performance holds great potentials for the
business world in areas such as forecasting, decision making, and risk management.
However, the relationship between information markets and organizations has not been
fully investigated.
The information systems research framework (Figure 7) and the design science
research guidelines suggested by Hevner et al. (2004) can be used to structure the
methods and activities performed by IS researchers designing/studying organizational
information markets. The information systems research framework encompasses two
complimentary, however distinct paradigms: the behavioral-science and the design-
science paradigms. The behavioral-science paradigm provides guidance ―to develop and
justify theories that explain or predict organizational and human behavior involved in the
analysis, design, implementation, management, and use of information systems‖ (Hevner
et al. 2004, p. 76).
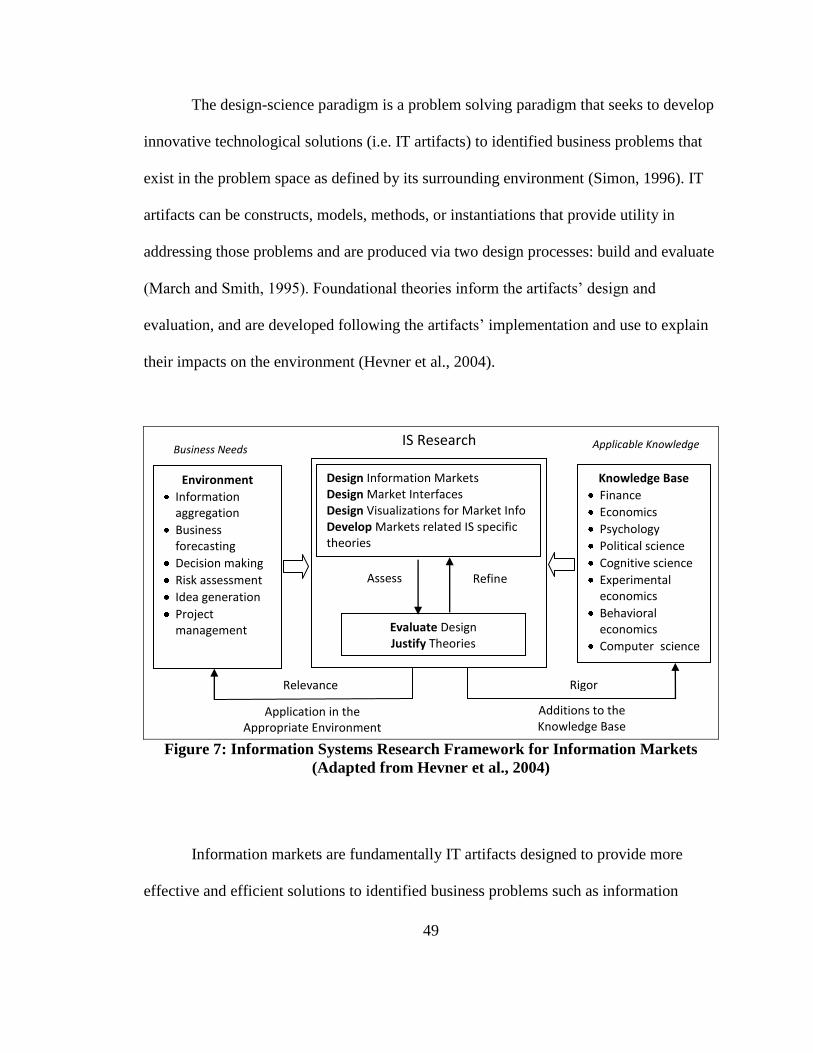
49
The design-science paradigm is a problem solving paradigm that seeks to develop
innovative technological solutions (i.e. IT artifacts) to identified business problems that
exist in the problem space as defined by its surrounding environment (Simon, 1996). IT
artifacts can be constructs, models, methods, or instantiations that provide utility in
addressing those problems and are produced via two design processes: build and evaluate
(March and Smith, 1995). Foundational theories inform the artifacts‘ design and
evaluation, and are developed following the artifacts‘ implementation and use to explain
their impacts on the environment (Hevner et al., 2004).
Figure 7: Information Systems Research Framework for Information Markets
(Adapted from Hevner et al., 2004)
Information markets are fundamentally IT artifacts designed to provide more
effective and efficient solutions to identified business problems such as information
Application in the Appropriate Environment
Additions to the Knowledge Base
Environment
Information aggregation
Business forecasting
Decision making
Risk assessment
Idea generation
Project management
IS Research
Relevance
Design Information Markets Design Market Interfaces Design Visualizations for Market Info Develop Markets related IS specific theories
Evaluate Design Justify Theories
Business Needs Applicable Knowledge
Assess Refine
Knowledge Base
Finance
Economics
Psychology
Political science
Cognitive science
Experimental economics
Behavioral economics
Computer science
Rigor
50
aggregation, forecasting, and decision making under uncertainty. However, the build and
evaluate loops used to produce the information market are informed by foundational
theories and methodologies rooted in reference disciplines such as economics
(experimental and behavioral), finance, psychology, and political science. As a result,
current studies tend to view information markets through reference disciplines lens: as a
financial market, or an economic entity (e.g. Forsythe, Nelson, Neumann and Wright,
1992).
The tendency to study the IT artifact, and its intimately related issues, through
varied reference disciplines lens is particularly concerning in the IS field. Orlikowski and
Iacono (2001) argue that although the information systems field is premised on the
centrality of information technology in everyday life, IS research does not live up to this
premise. The authors observed that IS researchers tend to under-theorize their field‘s core
subject matter, the IT artifact, and instead give central theoretical significance to the
context where the technology is absent or black boxed, to the processing capabilities of
the technology abstracted from its socioeconomic context, or to the deterministic impact
of the technology on some dependent variable.
IS studies that investigate the design and use processes of organizational
information markets and their interactions with the business environment are greatly
needed. However, existing literature on information markets and its current knowledge
base might tempt IS researchers to black box the market, undermine the importance of its
interaction with the environment, or downplay the impacts of its technological and
51
structural aspects on the effectiveness and efficiency of organizations adopting
information markets.
Although markets are socially constructed, focusing too much on the
socioeconomic context, or treating the market as either an independent or a dependent
variable, rather than focusing on the technology itself, moves us away from our main role
of investigating IS specific phenomena, and makes it easy to substitute the IS in our
research with anything else; making our contributions indistinct from those of other
disciplines (Benbasat and Zmud, 2003).
Thus, the first step in studying organizational information markets is to
reconceptualize markets as technology-enabled information systems (i.e. IT artifact).
Technology is limited to the hardware and the software components of the market, and
the information system encompasses the design, development, implementation, and use
processes of the market, as well as the dynamic interaction between the market, people,
and its environment to accomplish a certain task. This conceptualization ―white boxes‖
the market, in the sense that it clears some of the doubts surrounding information markets
that are mainly due to the black box nature of markets and organization‘s lack of general
understanding of its internal workings. It also serves as grounds for theorizing about
information markets from an information systems perspective.
52
A Systems Theory of Information Markets
Systems thinking framework (Checkland, 1981) is a useful theoretical lens
through which markets as systems can be defined, and the structures underlying these
systems and their emergent properties can be understood. It can also be employed to
investigate the relationship between IT artifacts and their context of use such as the
organization. Systems thinking framework is being applied to study organizations,
analyze organizational problems, and develop solutions by viewing organizations as
systems operating within a bigger system (e.g. industry) and in continuous interaction
with their external environment (e.g. competitors) and internal subsystems (e.g.
departments) (Checkland, 1981; Davis and Olson, 1985; Senge, 1990).
Systems thinking‘s holistic analysis approach enables organizations to see the big
picture that helps them solve complex problems effectively (Senge, 1990). Instead of
isolating the problematic parts of the system, systems thinkers examine interaction
patterns and interrelationships between systems and subsystems which allow them to
uncover dependencies among actions and to understand how problems, as well as
solutions, propagate from one system to the other. As a result, systems thinkers choose
actions that result in better long terms solutions, instead of those that result in temporary
desirable effects that may, over the long run, worsen the problem (Checkland, 1981;
Senge, 1990).
At the center of systems thinking is the concept of the ―adaptive whole‖
(Checkland, 1999) which can be useful in understanding the relationship between IT
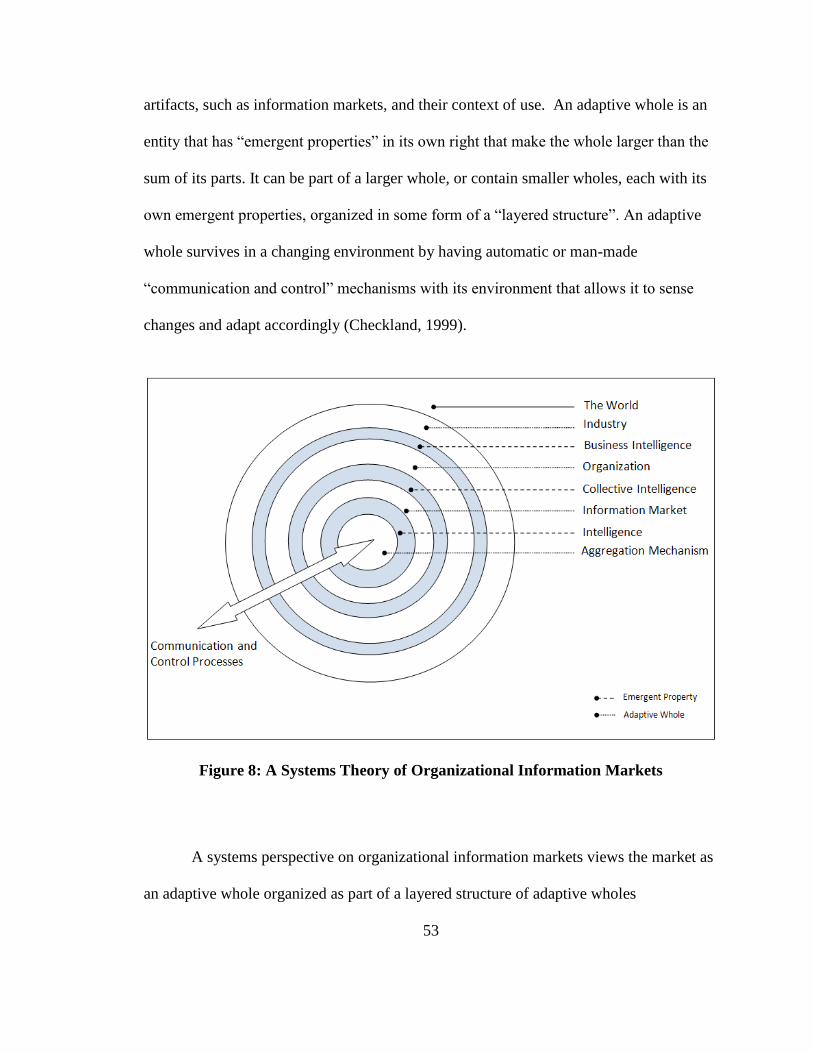
53
artifacts, such as information markets, and their context of use. An adaptive whole is an
entity that has ―emergent properties‖ in its own right that make the whole larger than the
sum of its parts. It can be part of a larger whole, or contain smaller wholes, each with its
own emergent properties, organized in some form of a ―layered structure‖. An adaptive
whole survives in a changing environment by having automatic or man-made
―communication and control‖ mechanisms with its environment that allows it to sense
changes and adapt accordingly (Checkland, 1999).
Figure 8: A Systems Theory of Organizational Information Markets
A systems perspective on organizational information markets views the market as
an adaptive whole organized as part of a layered structure of adaptive wholes
54
encapsulating each other (Figure 8). An information market is a subsystem of the
organization system in which it is used. The organization in turn operates within an
industry, all of which operates in the largest system of all: the world.
Recent research has attempted to reshape current thinking about information
markets, and called for investigating markets from a business intelligence perspective.
Yassin (2009, p.2) argued that ―the spirit of business intelligence lies at the heart of
information markets‖ and that markets used within organizations are in essence business
intelligence tools that aggregate and summarize intelligence from multiple sources to
enable accurate forecasting about future market trends and potential risks, and
consequently make better informed decisions.
Intelligence is ―information acquired to aid the purposeful execution of business
processes‖ and business intelligence is ―inferences and knowledge discovered by
applying algorithmic analysis to acquired information‖ (March and Hevner 2007,
p.1032). The market aggregation mechanism (e.g. continuous double auction, pari-
mutual, scoring rules) does not only collect and aggregate intelligence from multiple
sources but also determines how the information is collected, which makes it an adaptive
whole that has its own structures and properties (Figure 8).
An information market encapsulates the aggregation system and its emergent
properties (e.g. intelligence), along with the market incentives and contracts structures,
and produces an emergent property that makes the market larger than the sum of its parts;
collective intelligence in form of equilibrium price. An organization then analyzes the
55
intelligence stored in the market such as historical price trends, trading volume, buying
and selling transactions, in addition to the collective intelligence produced by the market
(i.e. equilibrium price) to draw inferences and make interpretations and predictions about
future events, industry trends, and potential risks.
Each system engages in a process of cybernetic information exchange with its
environment and has its own ways of responding to and communicating with the system
in which it operates, as well as with other systems. For example, an information market
communicates information to traders, to decision makers, and to the organization in form
of demand and supply cues and trading prices. It also controls participation by means of
incentives offered and contracts used in the market.
The organization impacts market participation and traders‘ beliefs in the events
being forecast through industry reports, official forecasts, project status reports, and the
feedback it receives from the industry regarding its performance relative to competitors.
Similarly, market information can be used to measure organization performance by
comparing market forecasts to official forecasts. Thus, a systems theory of information
markets facilitates theorizing about the relationship between markets and organizations
and about the impact of the business environment on market design and use by focusing
on the big picture and analyzing interactions between systems, subsystems and their
emergent properties.
56
Structuration Theory in Information Systems
Structuration theory (Giddens, 1979, 1984) is another useful theoretical lens
through which markets as IT artifacts can be defined and the relationship between the
market and its environment can be understood. Among social theories, Giddens‘
structuration theory has received substantial attention in the information systems field
due to its rejection of traditional dualistic views of social phenomena as either determined
by society (structure) or individuals (agency).
This rejection of both positivism and strong interpretivism is seen in the IS
literature as a rejection of both subjective and objective views of organizations
(Orlikowski, 1992) and that of technological and social determinism (Jones and Karsten,
2008). It was also seen as an opportunity to resolve inconsistent definitions of technology
(i.e. technology scope), and those of the interaction between technology and
organizations (i.e. technology role) (Orlikowski, 1992).
Giddens attempted to reconcile the dichotomous perspectives of social systems
(society vs. individual, structure vs. agency, objective vs. subjective) by focusing on the
social processes or individual actions that are based on social structures, but at the same
time serve to produce and reproduce social structures. The duality of structure or the
dynamic conceptualization of structure as both a medium and an outcome of interaction
is a central concept in Giddens‘ structuration theory.
57
Although technology is completely absent in structuration theory, its focus on
structures and the dynamic processes by which humans use and modify structures
through situated practice is of particular interest to IS researchers seeking to understand
structures as properties of technology, work groups, and organizations and how an
individual‘s use of technology is shaped by its features and yet reshapes them (Poole and
DeSanctis, 1990, 1992, 1994).
More than 330 IS papers have employed structuration concepts either to offer
insight into IS phenomena, to explore its limitations in comparison to other theoretical
perspectives, or as a source for developing IS-specific structuration theories that take
technology into account (Jones and Karsten, 2008). Two IS variants of Giddens‘
structuration theory; the structuration model of technology (Orlikowski, 1992) and
adaptive structuration theory (DeSanctis and Poole, 1994) were developed to facilitate
investigation of the relationship between technology and organizations.
The structuration model of technology is premised on a recursive notion of
technology called the duality of technology; that technology is the outcome of human
actions, yet is used by humans to accomplish some action and, thus, is both structurally
and socially constructed (Orlikowski, 1992). In other words, technology in and of itself
has no significance; it is only through ongoing appropriation by humans that it gains
significance. In practice, technology use is conditioned by its material properties and built
in structures. However, this conditioning is both enabling and constraining (Orlikowski,

58
1992) and although use is shaped by technology properties and structures, it also reshapes
them causing new structures to emerge (Orlikowski, 2000).
Therefore, technology design, use and interpretations are rather flexible. The
degree to which a user can exercise influence over technology construction, either
physically or socially, is termed ―the interpretive flexibility of technology‖ and it depends
on the characteristics of the technology, human agents involved, and the institutional
properties of organizations (Orlikowski, 1992).
Organizations as well as technology users tend to ―black box‖ technologies over
which they have no control. Orlikowski (1992) argued that researchers tend to view
technology as either objective or subjective depending on the temporal stage the
technology is currently at in the technology‘s lifecycle. For example, researchers
studying the design of a technology recognize its dynamic and constructed nature and
view it as a product of human action. On the other hand researchers investigating
technology‘s use and impacts are more likely to view technology as a fixed object,
ignoring the ongoing process of physical and social construction (Orlikowski, 1992).
The time-space discontinuity between design and use of technology, which
typically occurs at different organizations, is to blame for the conceptual dualism of
technology dominating the IS literature (Orlikowski, 1992). However, the structuration
model of technology posits that this disjuncture between design and use is artificial and
assumes that technology is designed and used recursively where design and use stages are
tightly coupled. In other words, technology is potentially modifiable through users‘
59
ongoing interaction with it and, besides users‘ engagement in the initial design and
development of technology, users can redesign technology at any point in time by means
of the different ways they interpret, appropriate, and manipulate it (Orlikowski, 1992).
Thus, understanding the technology-action relationship is critical in confronting
structuration‘s central paradox of why technologies with identical structures cause
different outcomes that lead to different effects on organizations (Orlikowski, 1992;
DeSanctis and Poole, 1994). Adaptive structuration theory extends Giddens‘ structuration
theory by considering the recursive relationship between technology and action, where
technology social structures and the social structures that emerge in human actions
iteratively shape each other.
Technology social structures include features and capabilities provided by the
technology and the ―spirit‖ or ―the general intent with regard to values and goal‖ of those
features (DeSanctis and Poole 1994, p.126). Other sources of social structures that enable
and constraint the appropriation process of technology are the nature of the tasks
performed using the technology such as task complexity and interdependence and the
organizational setting such as hierarchy, corporate information, and cultural beliefs.
The two central processes in adaptive structuration theory are appropriations and
structuration processes. Appropriations are ―the immediate, visible actions that evidence
deeper structuration processes‖ (DeSanctis and Poole 1994, p.128). Structuration is the
process by which social structures within technology, tasks, organizational environment
or their outputs are produced and reproduced in social life (i.e. their rules and resources
60
are brought into action) which causes new social structures to emerge. The use and reuse
of existing and new emergent social structures lead over time to their acceptance and
institutionalization; bringing organizational change (DeSanctis and Poole, 1994).
Outcomes and changes brought about by technology use are contingent on many
factors such as the organizational environment, the ―appropriation move‖ chosen by
human agents, the faithfulness of their actions to the spirit and structural features of the
technology, the reasons for bringing the technology or other structures into action, and
their attitudes towards using the technology (DeSanctis and Poole, 1994).
Although adaptive structuration theory has been mainly applied to the study of
group (decision) support systems (GDSS/GSS) and computer-mediated communications
(CMC), it has established a legitimate link between main stream IS research and social
theories in general and structuration in particular (Jones and Karsten, 2008). Thus, it can
be applied to investigate the social processes involved in appropriating any class of
advanced information technologies in organizations.
Markets as IT Artifacts: A Structuration Perspective
As defined above, information markets are technology-enabled information
systems. Thus, from a structuration perspective, an information market can be defined in
terms of its social structures: spirit and feature set. An information market is a consensus
making system that provides information about the degree of convergence in its users‘
beliefs about the likelihood of uncertain future events. It seeks to measure, quantify and
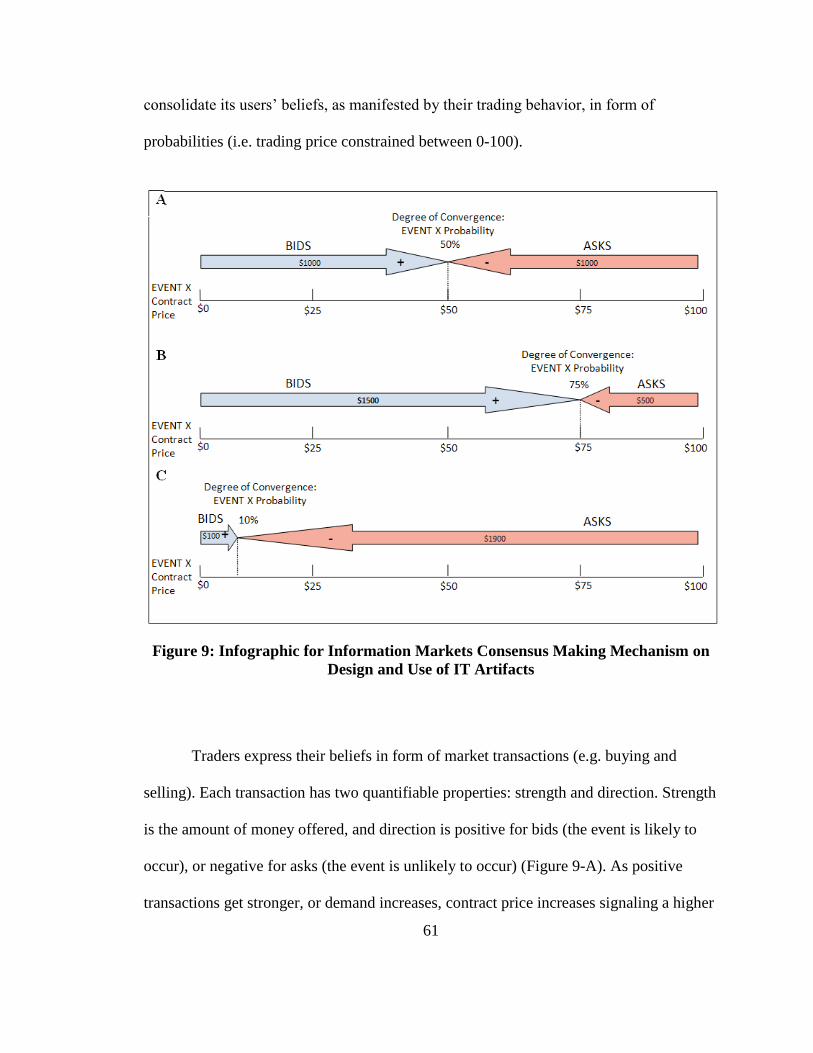
61
consolidate its users‘ beliefs, as manifested by their trading behavior, in form of
probabilities (i.e. trading price constrained between 0-100).
Figure 9: Infographic for Information Markets Consensus Making Mechanism on
Design and Use of IT Artifacts
Traders express their beliefs in form of market transactions (e.g. buying and
selling). Each transaction has two quantifiable properties: strength and direction. Strength
is the amount of money offered, and direction is positive for bids (the event is likely to
occur), or negative for asks (the event is unlikely to occur) (Figure 9-A). As positive
transactions get stronger, or demand increases, contract price increases signaling a higher
62
degree of convergence in market users‘ beliefs about the likelihood of future events
(Figure 9-B). Similarly, as negative transactions get stronger or supply increases, price
decreases signaling a lower degree of convergence in market users‘ beliefs about the
likelihood of future events (Figure 9-C).
An information markets‘ surrounding environment and the context in which it
operates shape the market objectives and its statement of purpose, also known as the
technology ―spirit‖ (Figure 10). Organizations adopting the market should first and
foremost create a mission statement and list of objectives for the market and accordingly
develop instruments to measure market performance over time. Further, organizations
should create an information sharing channel between market traders and executive
management to share information about market performance, how its predictions are
being used, and the benefits both gained and expected from its predictions. This will give
the market a heightened sense of purpose and will consequently encourage market
participation.
Information Markets Design
It is only after defining market objectives, setting forecasting goals, and
formulating forecasting problems in form of questions that markets can be properly
designed (Figure 10). The business environment imposes unique challenges on all aspects
of information markets design; design of the market itself, design of market interfaces,
and design of visualizations for market information. For example, markets designed for
business forecasting might involve estimating sales figures for a range of different
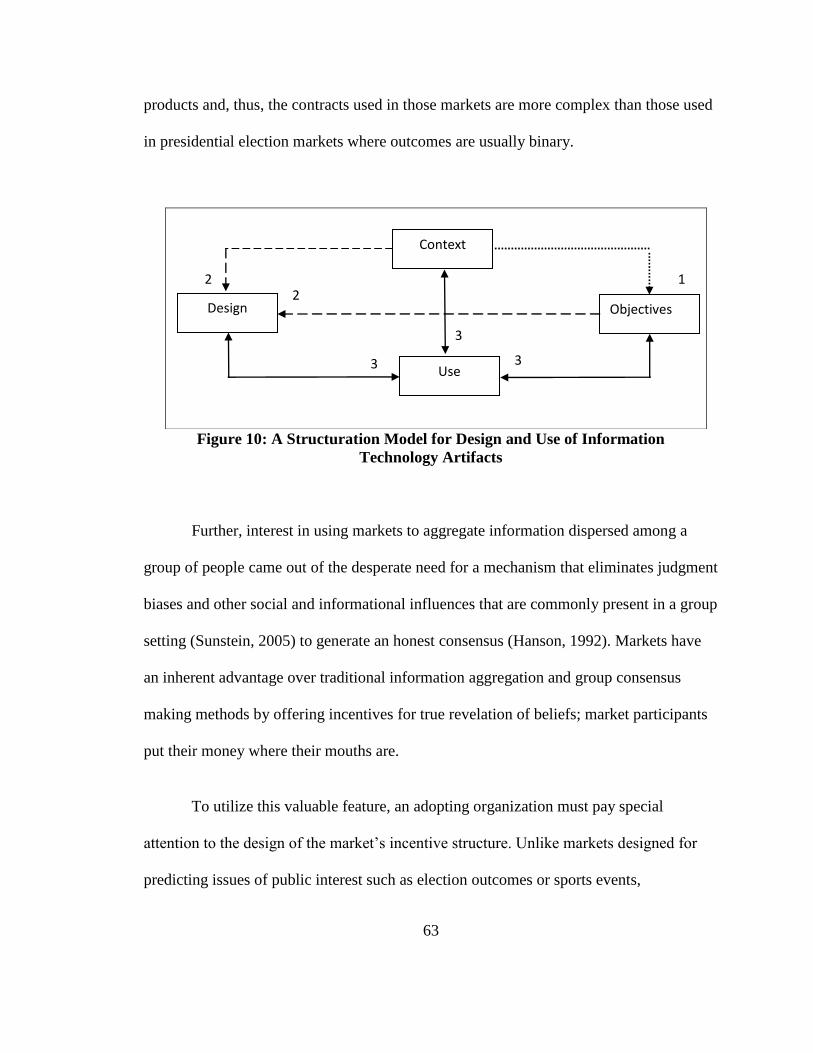
63
products and, thus, the contracts used in those markets are more complex than those used
in presidential election markets where outcomes are usually binary.
Figure 10: A Structuration Model for Design and Use of Information
Technology Artifacts
Further, interest in using markets to aggregate information dispersed among a
group of people came out of the desperate need for a mechanism that eliminates judgment
biases and other social and informational influences that are commonly present in a group
setting (Sunstein, 2005) to generate an honest consensus (Hanson, 1992). Markets have
an inherent advantage over traditional information aggregation and group consensus
making methods by offering incentives for true revelation of beliefs; market participants
put their money where their mouths are.
To utilize this valuable feature, an adopting organization must pay special
attention to the design of the market‘s incentive structure. Unlike markets designed for
predicting issues of public interest such as election outcomes or sports events,
Context
Design Objectives
Use
1 2
2
3 3
3

64
organizational markets are usually thin with a relatively small number of trades and
require a well designed incentives structure to attract traders and to motivate active
participation and information gathering especially when information relevant to the
forecasted events is not readily available, or easy to find.
Other design elements of the market itself include: the trading mechanism,
anonymity of traders, composition of initial traders portfolios, the use of real money or
play money, duration of the market, trading hours, and whether participation is open or
restricted to certain individuals. These design features of the market are shaped by the
context of use and the market objectives. For example, gambling laws in certain states or
countries might restrict the use of real money trading and depending on the questions
asked in the market and the expected amount of participation, a trading mechanism that
ensures liquidity (e.g. scoring rules) might be used instead of a one that does not (e.g.
continuous double auction).
The business environment and market objectives shape the design of market
interfaces and the various visualizations used for market information in addition to
shaping the design of the market itself. Similar to other information and communication
technologies, information markets design effectiveness depends on its ability to satisfy
users‘ needs and on users‘ ability to appropriately use it. Thus, we propose that the design
of information markets, market interfaces, and visualizations be driven by three factors
(Shown in Table 7): (1) Market users –Who; (2) Use motivation –Why; and (3) Market
information –What.
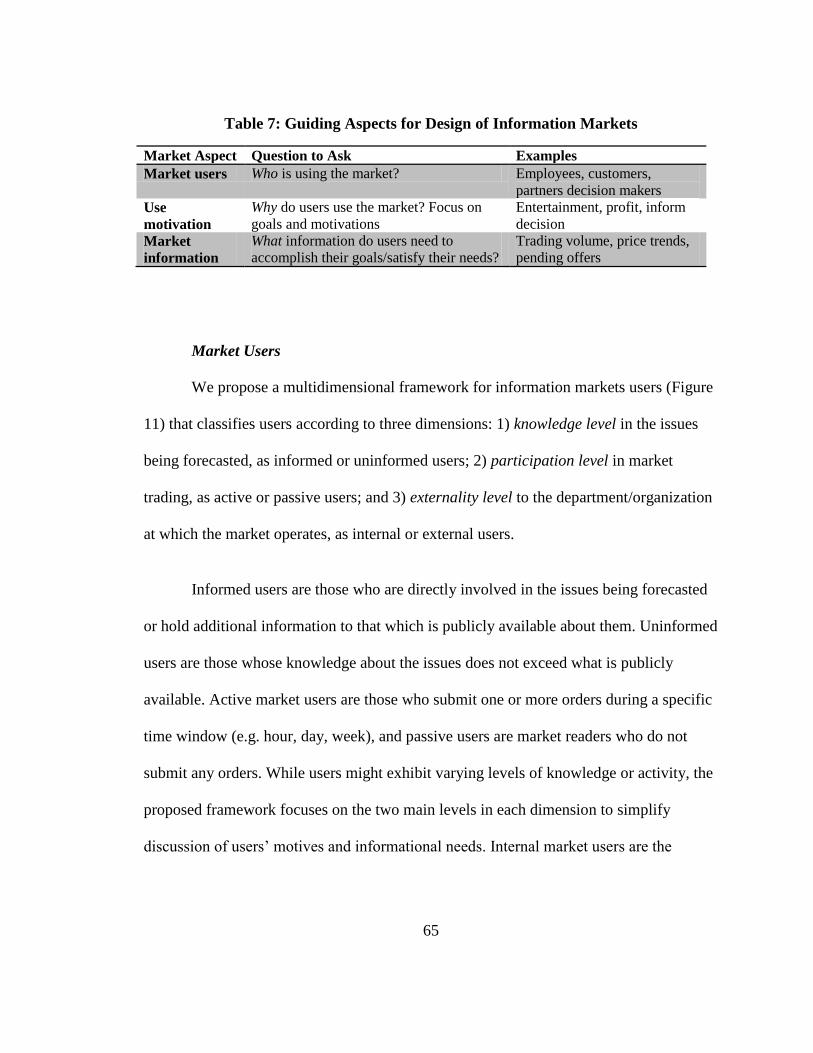
65
Table 7: Guiding Aspects for Design of Information Markets
Market Aspect Question to Ask Examples
Market users Who is using the market? Employees, customers,
partners decision makers
Use
motivation
Why do users use the market? Focus on
goals and motivations
Entertainment, profit, inform
decision
Market
information
What information do users need to
accomplish their goals/satisfy their needs?
Trading volume, price trends,
pending offers
Market Users
We propose a multidimensional framework for information markets users (Figure
11) that classifies users according to three dimensions: 1) knowledge level in the issues
being forecasted, as informed or uninformed users; 2) participation level in market
trading, as active or passive users; and 3) externality level to the department/organization
at which the market operates, as internal or external users.
Informed users are those who are directly involved in the issues being forecasted
or hold additional information to that which is publicly available about them. Uninformed
users are those whose knowledge about the issues does not exceed what is publicly
available. Active market users are those who submit one or more orders during a specific
time window (e.g. hour, day, week), and passive users are market readers who do not
submit any orders. While users might exhibit varying levels of knowledge or activity, the
proposed framework focuses on the two main levels in each dimension to simplify
discussion of users‘ motives and informational needs. Internal market users are the
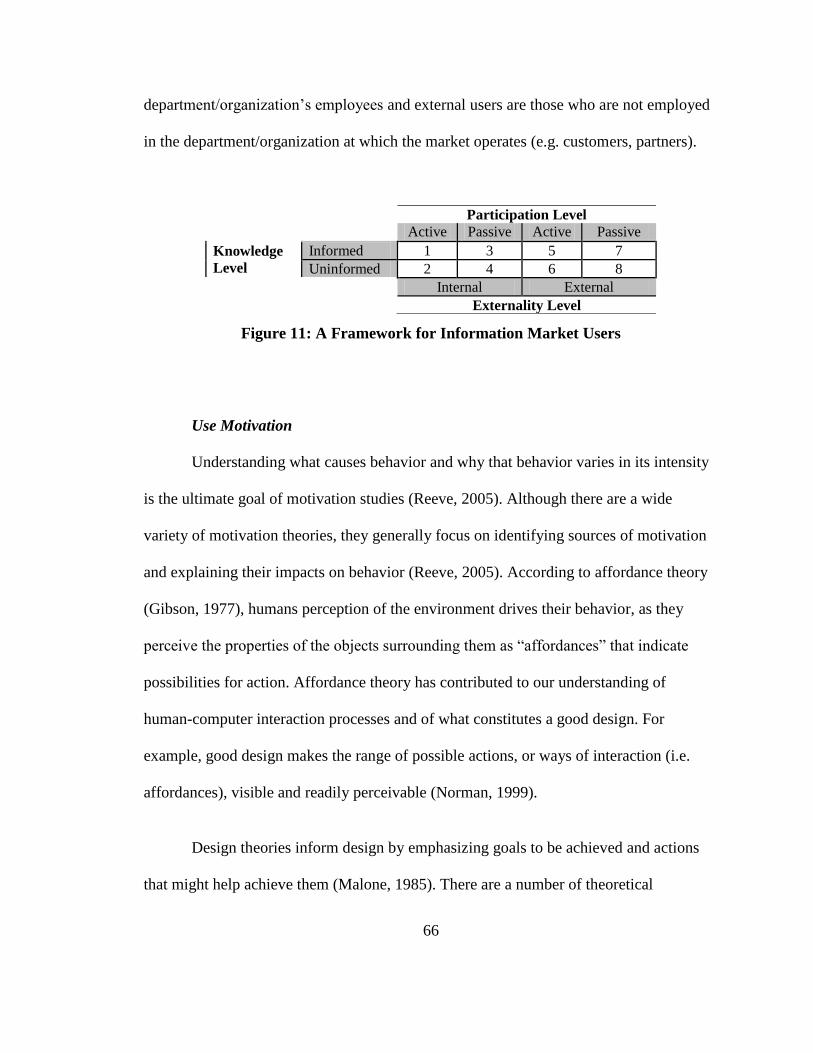
66
department/organization‘s employees and external users are those who are not employed
in the department/organization at which the market operates (e.g. customers, partners).
Figure 11: A Framework for Information Market Users
Use Motivation
Understanding what causes behavior and why that behavior varies in its intensity
is the ultimate goal of motivation studies (Reeve, 2005). Although there are a wide
variety of motivation theories, they generally focus on identifying sources of motivation
and explaining their impacts on behavior (Reeve, 2005). According to affordance theory
(Gibson, 1977), humans perception of the environment drives their behavior, as they
perceive the properties of the objects surrounding them as ―affordances‖ that indicate
possibilities for action. Affordance theory has contributed to our understanding of
human-computer interaction processes and of what constitutes a good design. For
example, good design makes the range of possible actions, or ways of interaction (i.e.
affordances), visible and readily perceivable (Norman, 1999).
Design theories inform design by emphasizing goals to be achieved and actions
that might help achieve them (Malone, 1985). There are a number of theoretical
Participation Level
Active Passive Active Passive
Knowledge
Level
Informed 1 3 5 7
Uninformed 2 4 6 8
Internal External
Externality Level

67
perspectives for designing organizational interfaces, such as information processing,
economic, political and motivational perspectives (Malone, 1985). Utilizing affordance
theory of human perception as well as motivational theories of human behavior to
understand technology use behavior, allows us to develop motivational design principles
and eventually theories to guide the design of high ―motivational affordance‖
technologies (Zhang, 2008a).
Information markets with high motivational affordances fulfill the motivational
needs of market users. Each group of users in the framework proposed above (Figure 11)
has its distinct motivational needs and goals that require different designs, information, or
information visualizations to be fulfilled. Informed active users (Groups 1 and 5) are
motivated by either extrinsic rewards such as money or prizes or by intrinsic rewards
such as recognition. Uninformed active traders (Groups 2 and 6) are risk loving
individuals who are mainly motivated by the thrill of the game and the entertaining
aspects of betting on the future.
In case of active users, market designs should continually meet users‘
expectations and fulfill their informational needs to at least sustain their activity level.
However, the real design challenge comes in case of passive market users; because
organizational information markets are usually thin and might suffer from illiquidity
issues due to low activity levels. Thus, markets should be properly designed to turn
passive users into active ones, attract as many traders as possible, and increase users‘
involvement and participation level. Special attention must be given to three types of

68
passive user as each type has different informational needs and can be influenced,
targeted, or attracted by different aspects of market design:
I. Internal and external informed users (Groups 3 and 7).
II. Internal and external uninformed users (Groups 4 and 8).
III. Internal informed and uninformed decisions makers (Groups 3 and 4).
Type I users are interested market readers who do not participate in market
trading mainly because they are risk-averse. Type I users are valuable because they hold
information that can improve the accuracy of market forecasts and generate significant
trading activity. They can be attracted by offering an anonymous trading option, a well
designed incentive structure that, for example, allows them to cash out of the market at
any point in time or by using play money instead of real money.
Type II users are also risk-averse market readers who feel they do not have
enough information to trade and read the market out of curiosity. Type II users are vital
for information markets to work due to their role in executing informed trades. Since type
II users are likely to be motivated by non-economic factors, finding ways to attract them
is still an open question in the information markets literature (Wolfers and Zitzewitz,
2006).
We propose a design-based solution to generate sufficient uninformed trades.
Market designs should be intuitive, simple, and easy to use to attract uninformed trades.
They should also be attractive to induce positive emotions that affect users‘ desire to use
69
the system (Norman, 2004) and, importantly, they should be perceived as fun,
entertaining, and to some degree ―safe‖. Using play money instead of real money may
decrease perceived riskiness of market trading and give it a fun game-like feeling.
Malone (1982) argued that for interfaces to be enjoyable, they should provide
performance feedback to users, be emotionally appealing, and capitalize on users‘ desire
to have a well informed knowledge structure.
Thus, enjoyable market interfaces should keep track of users‘ gains and losses and
display relative and historical performance evaluation to traders. It should introduce new
information when users feel their information is incomplete or inconsistent (Malone,
1982) by displaying updates, announcements, or links to potential sources of information,
such as meeting minutes and the department bulletin board. Motivating market interfaces
also support social and psychological needs for relatedness (Zhang, 2008b) by providing
the ability to communicate with other market traders through market chat rooms or
market blogs.
Type III users‘ knowledge level in the issues is irrelevant to market trading, as
designers do not seek to turn them into active users. Type III users are decision makers
who use the market for the sole purpose of informing their decisions and, thus, the
designers‘ goal is to identify ways of making the market information more useful to
managers. Decision makers‘ focus is on the intelligence stored in the market and the
collective intelligence produced by the market; how to turn it into business intelligence
that gives their organization a competitive edge in the industry. Due to decision makers‘
70
capacity in making intelligence actionable, special attention must be paid to the
informational needs of decision makers to create managerial dashboards that provide
them with greater control and visibility of what is going on in the market and allow them
to act in a timely manner.
Market Information
There are an infinite number of ways of processing, aggregating, manipulating,
and visualizing market information. Thus, there are an infinite number of ways of
designing market interfaces. Although the design of markets, markets interfaces, and
information visualizations can be guided by various theoretical perspectives, the optimal
set of information or information visualization to display on a market interface can only
be identified through the accumulation of empirical evidence.
The main piece of information needed by market users is the price of the last
traded contract in the outcome being forecasted. The last trade price represents the degree
of convergence in users‘ beliefs about the likelihood of the outcome. It can also be
interpreted as the outcome‘s probability of occurrence (Wolfers and Zitzewitz, 2004).
Other price related information that can be useful to market users include: historical price
trends, contract prices offered by other market traders, and the average, max, and min
prices over a specified trading period.
It is important to note, however, that price, and price-related information are noisy
signals that might not aggregate and transfer all the available information in the market
(Grossman and Stiglitz 1976; Noeth, Camerer, Plott, and Webber, 1999; Plott, 2000),
71
may suffer manipulation (Hansen, Schmidt and Strobel, 2004; Hanson, Oprea and Porter,
2006; Rhode and Strumpf, 2006) and bubbles (Plott, 2000), and, thus might not, at some
points in time, be an accurate representation of traders beliefs.
Therefore, it is important to supplement prices with other non-price information,
such as volume weighted price average and trading volume both in terms of money and
number of shares, when making judgments about market conditions. Further, it is
important to monitor the amount of trading activity regardless of the trading volume in a
particular event because it signals the release of updates about its status and gives traders
as well as decision makers an indication about the event‘s importance and degree of
controversiality.
Aside from trading information, announcing winners‘ names in each trading
round provides timely and positive feedback that satisfies traders‘ cognitive motivational
needs for competition, competence, achievement, and recognition (Malone 1985; Zhang,
2008b). This also motivates other traders to gather information and engage in future
trading. To satisfy social and psychological needs for relatedness and cooperation, market
designs should facilitate human-human interaction (Malone 1985; Zhang, 2008b) by
allowing traders to post comments and chat with other traders in the market.
As for decision makers, additional market information can be utilized to allow for
greater visibility of market activity. In an attempt to identify ways of making market
information more useful to managers, Yassin (2009) proposed a novel decision heuristic
for traders‘ beliefs about the likelihood of forecasted events that utilizes pending
72
transactions in the market. Pending transactions are valuable because they contain
information that is not yet incorporated into market forecasts.
The goal of forecasts is to enable managers to see ahead and take appropriate
actions in advance. However, the accuracy of market forecasts cannot be judged until the
market closing date or until the outcomes can be determined with certainty. Information
that supplements market forecasts is important because it improves the quality of input to
the decision process and allows managers to act in a timely manner.
A managerial dashboard on the market allows managers to filter trading volume
by departments or user group and to create traders‘ profiles and rank traders according to
their activity level, money invested, historical performance, and other available data.
Managers can use this capability to identify influential trades and information sources;
thus, judging their credibility.
Information Market Use
An information market is embedded in conditions of its use and that, in turn, is
embedded in an organizational environment. There is a recursive relationship between
market design and use, between use and the market context of use, and between use and
the market intended objectives (Figure 10), each shaping the other iteratively until new
physical and social structures emerge. In other words, markets are designed purposefully
according to a list of objectives which are created based on an analysis of users‘ needs.
Markets are designed with a set of intended uses in mind. Use is shaped by current
73
organizational practices, communication channels, and hierarchy of control existing in
the market‘s context of use.
However, continued use of the market can uncover unattended needs and create
new ones causing new technological features to be added to the market, thus, altering the
design of the market interfaces and the information visualizations used. Continued use
can also generate a wave of redistribution of power in adopting organizations where
market participants at all levels in the organizational hierarchy contribute to the decision
making process and, consequently, influence the decisions being made.
Further, continued use can alter formal and informal reporting mechanism in the
organization, create new communication channels, empower informal leaders, and form
informal information generating and sharing groups of market participants. These factors
may cause new social structures to emerge which over time become institutionalized
structural properties of the organization. Also, market users might appropriate the market
in unconventional ways through their different interpretations of market objectives and
the different meanings they assign to it; creating unintended uses for the market which
over time can become parts of the market objectives.
Structuration Model of Technology-Induced Organization Development
The dynamic interactions between organizations, market participants, and the
market, as well as among participants themselves will keep redefining the market design
objectives in a continuous cycle of define-design-use. Existing structures are used and
reused causing new structures to emerge and these in turn will be used and reused until
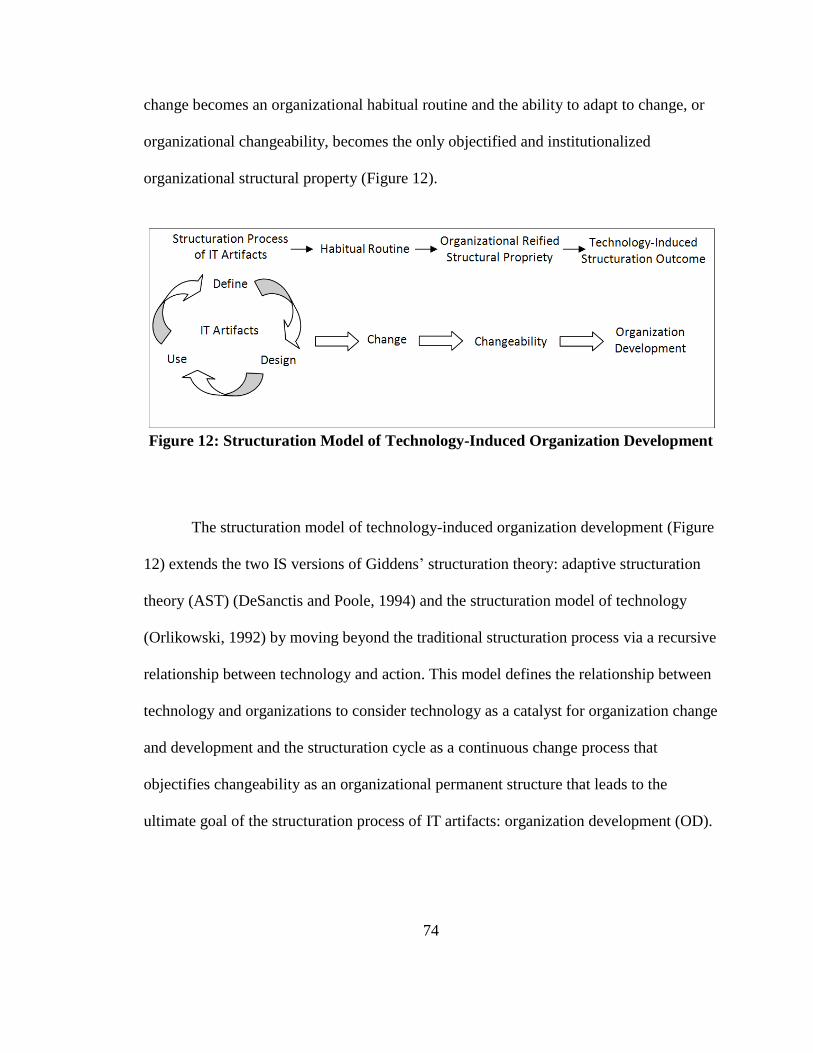
74
change becomes an organizational habitual routine and the ability to adapt to change, or
organizational changeability, becomes the only objectified and institutionalized
organizational structural property (Figure 12).
Figure 12: Structuration Model of Technology-Induced Organization Development
The structuration model of technology-induced organization development (Figure
12) extends the two IS versions of Giddens‘ structuration theory: adaptive structuration
theory (AST) (DeSanctis and Poole, 1994) and the structuration model of technology
(Orlikowski, 1992) by moving beyond the traditional structuration process via a recursive
relationship between technology and action. This model defines the relationship between
technology and organizations to consider technology as a catalyst for organization change
and development and the structuration cycle as a continuous change process that
objectifies changeability as an organizational permanent structure that leads to the
ultimate goal of the structuration process of IT artifacts: organization development (OD).
75
The structuration model of technology-induced organization development (Figure
12) posits that:
1. Effective structuration process of IT artifacts in organizations does not
produce permanent structures.
2. Existing and emerging physical and social structures involved in the
structuration process of IT artifacts (including the technology ―spirit‖ or
objectives) are temporary and potentially modifiable.
3. Effective structuration process of IT artifacts in organizations produces
habitual routines.
4. Nurtured technology-induced habitual routines become over time reified and
institutionalized organization structures.
5. Reified organization structures lead to permanent structuration outcomes.
6. The ultimate goal of the structuration process of IT artifacts in organizations is
organization development.
7. Technology-induced change should be nurtured as a habitual routine by
organizations seeking development and growth.
8. Nurtured habit of change causes organizational changeability to become
institutionalized organization structure.
9. Changeability leads to long lasting and continuous organizational
development and growth.
76
Organization development is defined as ―an effort, planned, organization-wide,
and managed from the top, to increase organization effectiveness and health through
planned interventions in the organization's processes, using behavioral-science
knowledge‖ (Beckhard 1969, p.9). Action research is used to carry out these behavioral
interventions (French and Bell, 1990) through a cyclical change process of planning,
action, and fact-finding (Lewin, 1946).
Action research cycles of behavioral intervention and evaluation has moved
traditional behavioral-science research from being reactive with respect to technology to
being a proactive problem solving paradigm where IT artifacts, such as information
markets, can be adopted and used as interventions to improve organization effectiveness
and efficiency. However, it is important to note that although the decision to adopt and
use an IT artifact as a solution is a behavioral intervention, the subsequent group of
decisions regarding the technology‘s design, which features to use, and even the choice
of which technology to adopt, is a design-science intervention.
Design as a Group of Decisions
Organizations faced with a problem can develop in-house solutions, buy custom
made solutions developed by other organizations, or buy commercial-off-the-shelf
(COTS) IT artifacts. The effectiveness of the structuration process of IT artifacts (define-
design-use) depends in some part on how much influence the users have over the
technology‘s design. Orlikowski (1992) argued that even if a technology was not
developed in-house, users can still exercise influence over technology‘s design by means
77
of the different ways they interpret, appropriate, and manipulate it. We extend
Orlikowski‘s argument by proposing that users can exercise influence over technology‘s
design even before they have any interaction with it.
Conceptualizing design as a group of decisions and the design process as a
decision making process diminishes ―the time-space discontinuity‖ between design and
use of IT artifacts in the sense that users can still choose among alternative solutions
available in the market and between various configurations and settings provided by each
solution. For example, organizations seeking to improve their sales forecasts can choose
from a variety of information market solutions available in the marketplace without
having to develop one in-house and yet retain a sufficient amount of control over their
design to ensure an effective structuration process.
Some market platforms allow users full control over their design by providing
them the option to choose from a range of trading mechanisms, contract types, incentive
structures, anonymity levels, trading hours, and many other market design features. Each
group of settings constitutes a unique IT artifact design that can be evaluated using
common design-science evaluation methods and the impacts of existing structures, such
organization policies and culture, on the decision making process can be analyzed as a
surrogate for the analysis of the design and development processes for in-house
developed solutions.
The structuration process of IT artifacts (Figure 12) combines both design science
design-evaluate loops with proactive behavioral science adopt/use–evaluate loops to

78
create an occasion for an ongoing process of organization change and development. The
traditional views on the structuration process of technology acknowledge the change
caused by the technology-action relationship and its interaction with organizations
(DeSanctis and Poole, 1994). However, this change is not planned but rather a natural
result of situated practice and unless managed its effects on people, groups, and
organizations are random and may or may not lead to organization development.
The change resulting from the structuration process of IT artifacts (Figure 12) is
planned in the sense that technology is designed or adopted as an intervention to induce
change. However, the structuration process itself takes its own path and progresses in
unplanned manner. For example, we do not instruct people how to appropriate the
technology. But we do manage the process by first encouraging users to explore and
experiment with the different ways of using the technology; second, by designing or
choosing to adopt IT artifacts that are malleable and can be redesigned or modified as
needed; and third, by creating flexible organizations rules and policies that give some
degree of freedom to technology users to experiment allowing for change to eventually
take place. It is important to note though that change is not the aspired for outcome but
rather the planned continuous change that leads to organization development.
Conclusions and Future Directions
Conceptualizing information markets as an IT artifact using a structuration lens
and placing it in a business environment as a system within a bigger system is an
important first step towards building information systems theories about organizational

79
information markets to describe, explain, and predict their behavior and impacts on
organizations. Attaining a better understanding of the design, implementation, and use
processes of information markets in organizations is vital to devise design,
implementation, and use guidelines and procedures that promote an effective
structuration process that leads to organization development.
Future research should investigate the structuration and appropriation processes of
information markets in organization where markets are used as an intervention to induce
organizational change and development. Future research should also characterize the
decision making and cognitive processes involved in analyzing/using market information
from both the trader and the decision maker perspectives, to design effective market
interfaces that meets users‘ motivational and informational needs.
Evaluations of market design‘s usefulness and efficacy in satisfying users‘ needs
by cognitive walkthroughs, focus groups, surveys, or experiments will provide valuable
feedback into the design and will add to our knowledge base by providing a better
understanding of the design and use processes of markets inside the organization. It will
also improve our understanding of the decision making and cognitive processes of
various market users when analyzing market information.
The design of information markets, market interfaces, and information
visualization should fit the task at hand to accomplish market objectives. However, fit is
moderated by traders and organizational factors. The accumulation of empirical evidence
will provide guidance on how to design highly motivating information markets that

80
satisfy users‘ needs and will suggest the optimal feature set that best fits the problem at
hand in order to result in desirable outcomes.
81
Chapter Four
Information Markets for Software Projects Risk Management
Introduction
Software projects are characterized by high failure rates. In 2006, 19 percent of
initiated software projects in the US were outright failures; canceled before completion or
not deployed. 46 percent of projects failed to meet user requirements, had cost overruns,
or were not delivered according to schedule (Rubinstein, 2007). In 2007, an independent
market research firm surveyed 800 IT managers across eight countries. The results
demonstrated that failure rates are universal; 62 percent of IT projects failed to meet their
schedules, 49 percent exceeded their budget, and 41 percent failed to deliver the expected
business value and return on investment (Dynamic Markets Limited, 2007).
One dominant reason leading to software project failures is management‘s
inability to manage the risks in the early stages of the software development process
(Boehm, 1991). Software project risk is an uncertain event that may have negative effects
on the processes and/or outcomes of software projects, such as software quality, scope,
costs and schedule (Project Management Institute, 2004). In order to guard against or
mitigate the negative effects of the various risks facing software projects, management
must first identify relevant risk factors, assess their likelihood of occurrence, and their
potential impacts on project objectives (Boehm, 1991). A risk matrix can then be

82
constructed that assigns a risk score to each factor; which is the product of its likelihood
and impact (Charette, 1989).
Several approaches for assessing risk factors‘ probabilities and impacts on project
objectives have been proposed, such as brainstorming, interviewing, the Delphi method,
and scenario analysis (Project Management Institute, 2004). However, these methods
require expert participation and are time and resource intensive. In addition, getting
objective and accurate estimation of risk probability and impact at the beginning of
software development projects is very difficult. Thus, recent research has proposed using
fuzzy logic and software metrics to assess risks (Liu, Kane and Bambroo, 2006).
Although software metrics, such as requirement volatility and cyclomatic complexity, can
lead to more objective assessment of risks, they are difficult to measure and expensive to
collect and update periodically particularly in small organizations with limited resources.
Checklist analysis is another popular method for identifying risk factors that has
received much attention in the literature due to its simplicity and low cost relative to
other methods (Iversen, Mathiassen and Nielsen, 2004). Checklist analysis relies on
historical data and knowledge of similar projects to create a list of potential risks and
their likelihood of occurrence. Several lists of risk factors have been published in the
software project management literature (Bohem and Ross, 1989; Barki, Rivard, and
Talbot, 1993; Keil, Cule, Lyytinen, and Schmidt, 1998; Moynihan, 1996; Ropponen and
Lyytinen, 2000). Other approaches such as risk-action list (Alter and Ginzberg, 1978;
83
Bohem, 1991; Jones, 1994), risk portfolio model (McFarlan, 1981), and requirements risk
analysis (Davis, 1982) have also been popular among software development managers.
Each approach has its limitations (Lyytinen, Mathiassen and Ropponen, 1998;
Moynihan, 1997) and thus hybrid methods have been proposed to provide a more
comprehensive, context-sensitive risk management approach (Lyytinen et al., 1998).
However, tt is important to note that although current risk management approaches can
be useful in identifying and prioritizing risks, assessing risks‘ probabilities and impacts,
as well as in suggesting mitigation strategies, none of them addresses the fundamental
problem behind software projects failure; communication.
Further, the initial risk assessments provided by current approaches are ineffective
in reducing software project chances of failure unless there are methods that continuously
provide complete, current, and accurate information about the status of project objectives
as events unfold. Otherwise managers are left with unrealistic, dated assessments of
project risks, and as a result fail to take appropriate actions to mitigate them.
Many large scale software disasters have been attributed to inaccurate status
reporting, such as the case of the CONFIRM project (Oz, 1994). Reluctance to transmit
bad news (Kiel, Smith, Pawlowski and Jin, 2004), status misperception, deliberate
misrepresentation by software developers and project managers (Snow and Keil, 2002),
and escalation of commitment; where resources are continued to be expended on software
projects destined for failure (Keil, 1995), are some of the reasons that lead to inaccurate
status reports, and consequently, inaccurate assessments of risks and eventually project
84
failure. These issues call for creative approaches to improve communication of project
status information in order that senior management can terminate failing projects, salvage
or redirect valuable resources in a timely manner.
This chapter introduces information markets to the software project management
domain as an approach to risk management. Markets may prove to be invaluable in
minimizing software projects chances of failure. By aggregating status information from
all levels of the organization and providing early warning signals about risks, markets can
assume the difficult task of ―blowing the whistle‖ on challenged projects. We draw on the
design science research paradigm (Hevner et al., 2004) to design an experimental
information market solution for software project risk assessment. We evaluate the
market‘s efficacy in solving the identified problems using two controlled experiments.
This chapter is organized as follows: section two reviews the literature on
software project risk assessment and discusses the challenges faced by software project
managers that justify the need for the proposed information market approach. We then
propose a theoretical framework along with propositions for the determinants of software
project risks assessment accuracy.
Section three introduces the research approach and research questions. Section
four focuses on artifact design and addresses the first two research questions by
proposing an information market solution and research hypotheses about its expected
utility for software projects risk assessment. Section five describes two controlled
experiments that used a role-playing scenario to evaluate the proposed information

85
market design and answer the design evaluation research questions. Section six describes
data analysis, scale validation and results. A discussion of the findings and their
implications for theory and practice are described next. This chapter ends with
conclusions and future directions.
Challenges to Software Projects Risk Assessment
The dynamic nature of the software industry and the high volatility of software
project requirements add complexity to the inherently complex task of risk assessment.
The intangible nature of software and the lack of visible signs of progress make it hard
for management to ascertain true project status or to uncover problems until the project is
well over budget or has passed schedule deadlines (Zmud, 1980; Abdel-Hamid and
Madnick, 1991).
Further, traditional project management and control techniques for acquiring
status information to assess project risks, such as meetings, surveys and status reports,
have been proven to be ineffective at revealing risks. Abdel-Hamid, Sengupta and Ronan
(1993) showed that project managers tend to anchor on initial perceptions of status that
affects their decisions to re-adjust project plans down the road, even when the situation
requires readjustment. Also, Snow and Keil (2002) showed that software project
managers make significant errors in assessing status and may not faithfully report their
true beliefs causing reported status to be very different from reality.
86
In many organizations valuable information that could potentially save millions of
dollars is distributed at lower levels of the hierarchy and oftentimes fails to be
communicated to project sponsors who have the power to change the direction of the
project (Keil and Roby, 1999). Employees‘ reluctance to ―blow the whistle‖ is impacted
by their sense of personal responsibility to report the bad news which is influenced by
their perception of whether bad news ought to be reported or not (Dozier and Miceli,
1985).
Additional factors that were proven to impact employees‘ willingness to report
true status information are organizational climate and information asymmetry (Keil et al.,
2004). Unhealthy organizational climate can produce the so-called ―mum effect‖ where
employees refrain from reporting unpleasant information to management because they
fear penalties of various sorts. Research has shown that in organizations where there is
reluctance to either reporting and/or hearing negative information, silence will prevail
even when an employee is an auditor or assumes a formal role of reporting problems
(Keil and Robey, 2001).
Organizational culture that does not encourage open communication creates an
incentive to shirk issues and reduces employees‘ sense of responsibility to report bad
news because the interests of employees are no longer aligned with the interests of the
organization (Keil et al., 2004). Similarly, when perceived information asymmetry
between management and employees is high and where individuals think that negative
information can be hidden from management, they will be less likely to perceive negative
87
information as ought to be reported and eventually their reluctance to report it will
increase (Keil et al., 2004).
The central whistle blowing decision model (Dozier and Miceli, 1985; Smith,
Keil and Depledge, 2001) assumes that reporting an observed organizational wrongdoing
is a choice that is left to an individual judgment and depends on whether or not s/he
perceives the wrongdoing as ought to be reported and so assumes the responsibility for
reporting it. However, in software development projects, as in many organizations,
reporting project status information is an obligation not a choice. And is generally part of
employees‘ job responsibilities and formal role in the organization.
In organizations where all information ought to be reported and each employee is
personally responsible for reporting what s/he knows, factors that directly impact
individuals reluctance to report bad news become of central focus. Further, there are
many other problems that lead to ineffective communication of project status information
other than reluctance to report bad news, such as status misperception, individual biases,
deliberate misrepresentation, reporting incomplete or dated status information, and
organizational silence (Park and Keil, 2009). These problems contribute to inadequate
assessment of software project risks that causes escalation of commitment to a failing
course of action, also known as project ―runaways‖, costing organizations hundreds of
billions of dollars every year.
Thus, organizations are in desperate need for information gathering and sharing
mechanisms that adjust for subjectivity in individual judgment, cancel individual biases
88
out, offer incentives for faithful revelation of status information, and are capable of
rapidly moving project status information from those who have it to those who need it to
assess risks and make decisions.
Research Framework and Research Questions
The project status report is a key element in the software project risk assessment
process. Current studies have focused on the accuracy of reported status information and
bad news reporting in the context of IT projects (Snow and Keil, 2001; Keil et al., 2004).
However, accuracy is only one attribute of project status information. Little research
attention has been given to factors that impact other attributes of information, and
consequently the accuracy of risk assessment. For example, accurate information can be
incomplete and does not reflect the whole picture, or not up-to-date and does not
incorporate the latest development progress updates or problems.
Thus, we propose a theoretical framework to explain the variance in accuracy of
software projects risk assessment (Figure 13). We incorporate the factors identified in the
literature that are proven to impact the accuracy of reported status in the proposed model.
Table 8 summarizes the model propositions. There are three main factors that determine
the accuracy of risk assessment: (1) currency of reported status information, (2)
completeness of reported status information, and (3) accuracy of reported status
information.
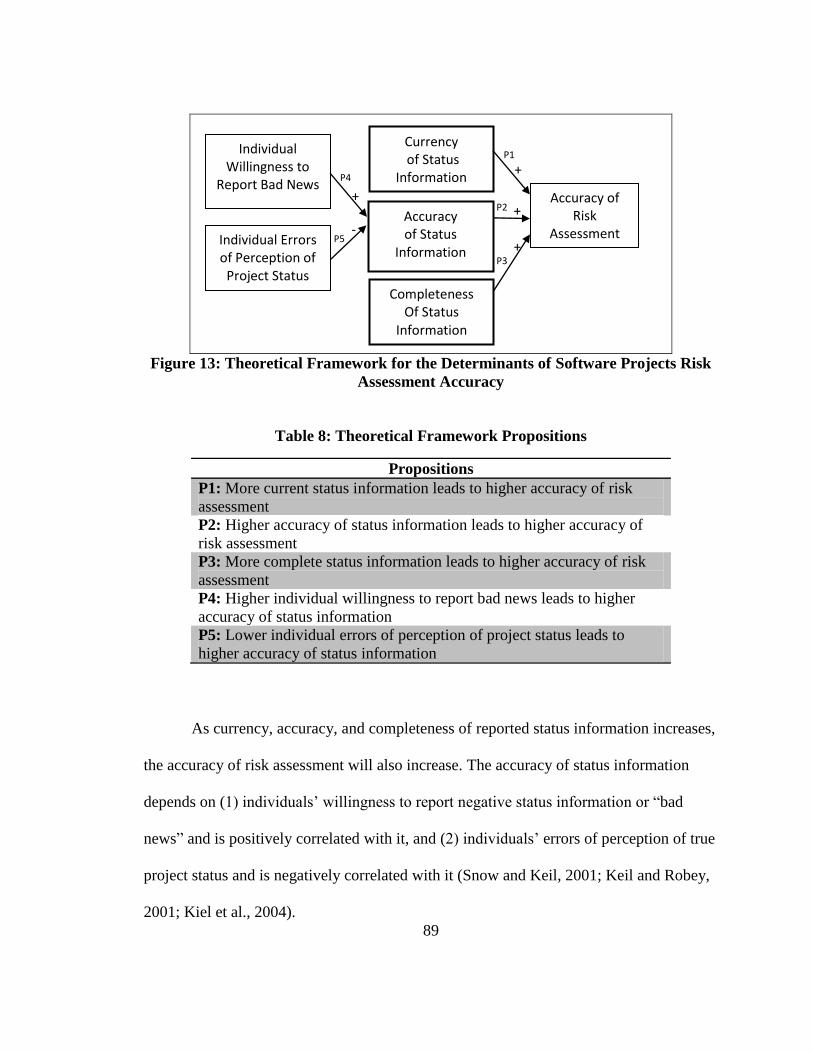
89
Figure 13: Theoretical Framework for the Determinants of Software Projects Risk
Assessment Accuracy
Table 8: Theoretical Framework Propositions
Propositions
P1: More current status information leads to higher accuracy of risk
assessment
P2: Higher accuracy of status information leads to higher accuracy of
risk assessment
P3: More complete status information leads to higher accuracy of risk
assessment
P4: Higher individual willingness to report bad news leads to higher
accuracy of status information
P5: Lower individual errors of perception of project status leads to
higher accuracy of status information
As currency, accuracy, and completeness of reported status information increases,
the accuracy of risk assessment will also increase. The accuracy of status information
depends on (1) individuals‘ willingness to report negative status information or ―bad
news‖ and is positively correlated with it, and (2) individuals‘ errors of perception of true
project status and is negatively correlated with it (Snow and Keil, 2001; Keil and Robey,
2001; Kiel et al., 2004).
+
+ +
- +
Currency of Status
Information
Individual Willingness to
Report Bad News Accuracy of
Risk Assessment
Accuracy of Status
Information Individual Errors of Perception of
Project Status
Completeness Of Status
Information
P1
P2
P3
P4
P5
90
Based on the proposed framework (Figure 13) the greatest improvement in
software risk management will come from tools that increase the accuracy of risk
assessment by improving the currency, accuracy, and completeness of reported status
information. Information accuracy can be improved by adjusting for individual errors in
perception of the project true status due to having access to only partial knowledge about
the project and by increasing individuals‘ willingness to report negative status
information.
Existing tools for identifying and assessing risks are only effective in reducing
software projects‘ chances of failure if they are supplemented with a mechanism that (1)
efficiently collects and combines information from around the organization to provide
complete assessment about the status of different project objectives, such as scope,
quality, cost and schedule, (2) responds to unfolding events by rapidly incorporating new
information into the assessment to provide current and up-to-date assessment of risks, (3)
adjusts for individual errors in perception of project status and risk assessment, and (4)
motivates those who are involved in the project or have access to information about its
progress to faithfully report status information.
The design science paradigm (Hevner et al., 2004) is concerned with the design
and evaluation of technological solutions, or IT artifacts, to fulfill an identified business
need. Thus, we are utilizing the design science research paradigm to design an
experimental Web-based information aggregation mechanism, known as an information
market, to aid organizations and project managers in assessing software project risks
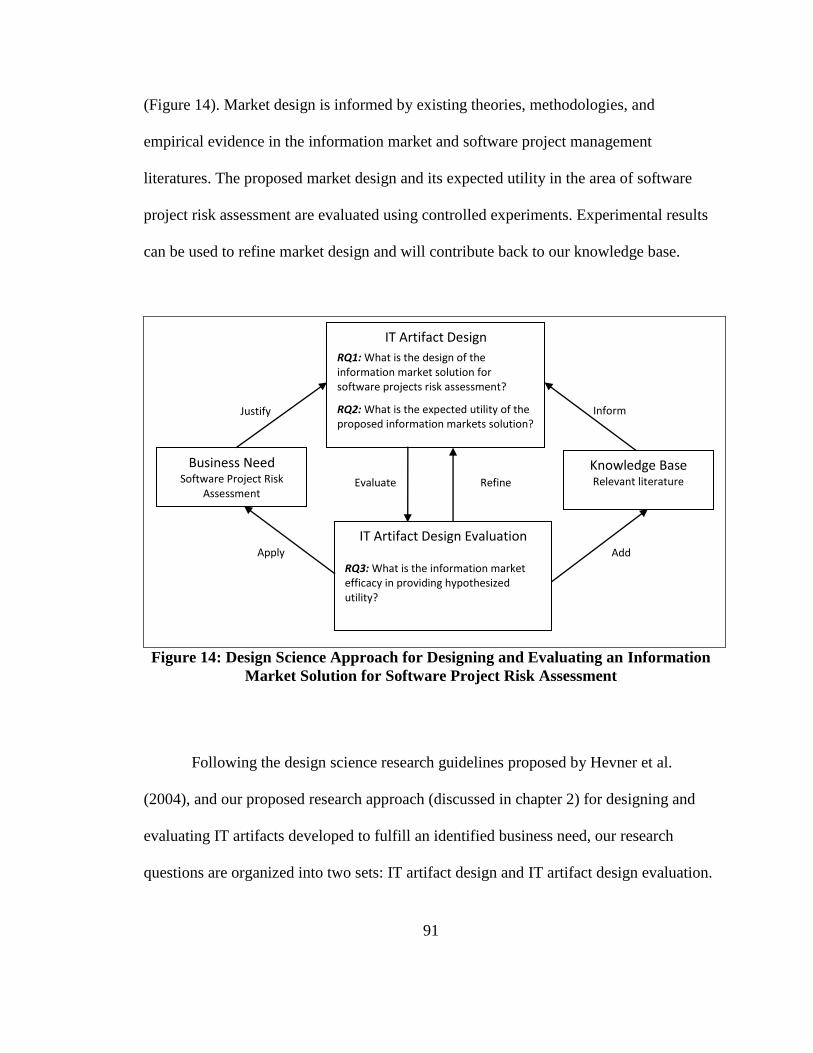
91
(Figure 14). Market design is informed by existing theories, methodologies, and
empirical evidence in the information market and software project management
literatures. The proposed market design and its expected utility in the area of software
project risk assessment are evaluated using controlled experiments. Experimental results
can be used to refine market design and will contribute back to our knowledge base.
Figure 14: Design Science Approach for Designing and Evaluating an Information
Market Solution for Software Project Risk Assessment
Following the design science research guidelines proposed by Hevner et al.
(2004), and our proposed research approach (discussed in chapter 2) for designing and
evaluating IT artifacts developed to fulfill an identified business need, our research
questions are organized into two sets: IT artifact design and IT artifact design evaluation.
IT Artifact Design
RQ1: What is the design of the information market solution for software projects risk assessment?
RQ2: What is the expected utility of the proposed information markets solution?
IT Artifact Design Evaluation
RQ3: What is the information market efficacy in providing hypothesized utility?
Business Need Software Project Risk
Assessment
Knowledge Base Relevant literature
Justify Inform
Apply Add
Evaluate Refine
92
IT artifact design research questions are:
RQ1 - What is the design of an information market solution for
software projects risk assessment?
RQ2 - What is the expected utility of the designed information
market for software projects risk assessment?
IT artifact design evaluation research questions are:
RQ3 - What is the efficacy of an information market in providing
hypothesized utility for software projects risk assessment?
Information Markets Design
An information market is a form of futures markets where individuals trade
contracts whose payoff depends on the outcomes of uncertain future event. According to
rational expectations theory (Muth, 1961), individuals take all available information into
account in forming expectations about future events. In strongly efficient markets (Fama,
1970) prices of traded assets reflect all available information about future prospects of the
asset. Since prospects are analogous to events, prices in efficient information markets
reflect all available information about the likelihood of the events.
Information markets utilize market efficiency and the information aggregation
property of prices (Hayek, 1945) to harness the collective knowledge of participants
about the likelihood of future events. Although information markets differ in many
93
respects, such as trading mechanism, payoff function, composition of initial portfolio,
and incentive structure, they generally consist of one or more events for which you would
like a reliable forecast.
The standard contract in the market is the binary contract, aka winner-take-all. It
costs a certain amount and pays off, for instance, $1 if and only if the event occurs and
nothing otherwise. Traders buy and sell contracts of future events based on their beliefs
in the events likelihood of occurrence. The higher the likelihood of the event the higher
its contract price and vice versa. The result is a trading price that tracks the consensus
opinion (Hanson, 1992) and can be interpreted as market-aggregated forecast of the event
probability (Wolfers and Zitzewitz, 2004). For example, if a contract price is selling for
$60 that means there is a 60% chance of the event happening.
In addition to forecasting events probability, the type of contract used in the
market and its payoff function can elicit the collective expectations of a range of different
parameters such as the mean or median value of an outcome (Wolfers and Zitzewitz,
2004). For example, the price of index contract with payoff proportionate to the outcome
represents the market mean expectation of the outcome and the price of a spread contract
with even money bet represents the market‘s median expectation of the outcome.
Experimental research on information aggregation suggest that markets can
aggregate and disseminate information fairly well (Forsythe and Lundholm, 1990; Plott
and Sunder, 1988) and many successful implementations of information markets
demonstrate their ability to aggregate information and generate reasonably accurate
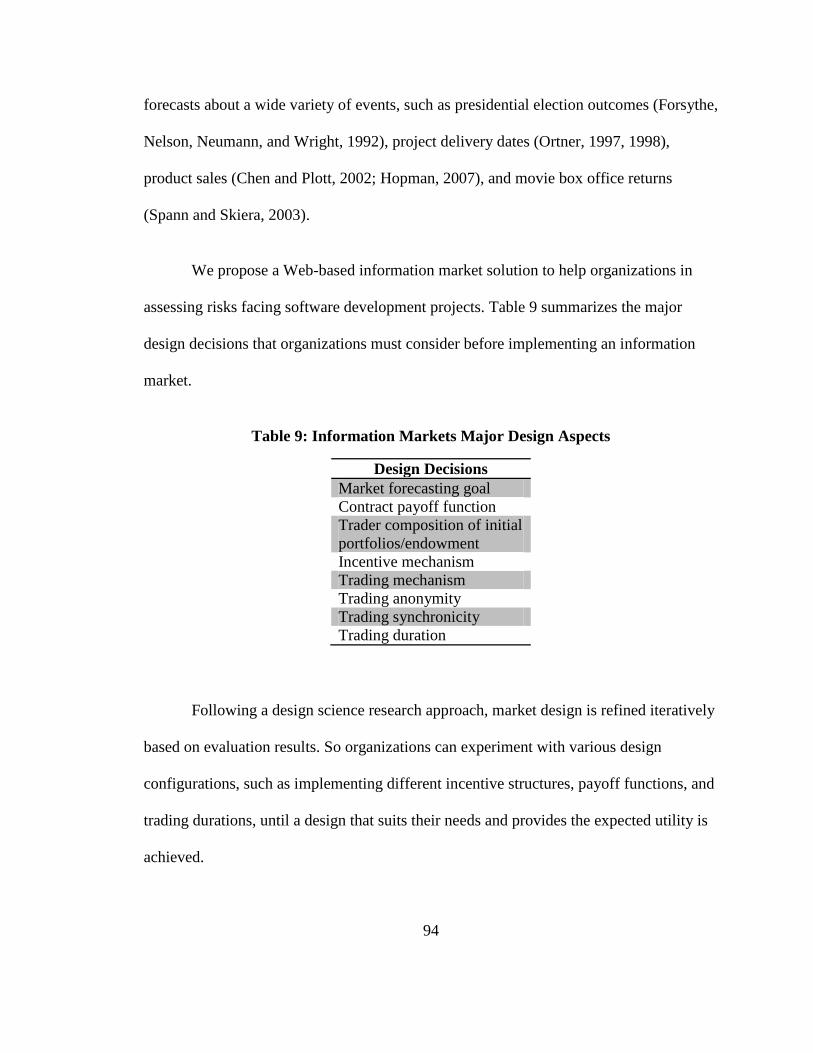
94
forecasts about a wide variety of events, such as presidential election outcomes (Forsythe,
Nelson, Neumann, and Wright, 1992), project delivery dates (Ortner, 1997, 1998),
product sales (Chen and Plott, 2002; Hopman, 2007), and movie box office returns
(Spann and Skiera, 2003).
We propose a Web-based information market solution to help organizations in
assessing risks facing software development projects. Table 9 summarizes the major
design decisions that organizations must consider before implementing an information
market.
Table 9: Information Markets Major Design Aspects
Design Decisions
Market forecasting goal
Contract payoff function
Trader composition of initial
portfolios/endowment
Incentive mechanism
Trading mechanism
Trading anonymity
Trading synchronicity
Trading duration
Following a design science research approach, market design is refined iteratively
based on evaluation results. So organizations can experiment with various design
configurations, such as implementing different incentive structures, payoff functions, and
trading durations, until a design that suits their needs and provides the expected utility is
achieved.

95
In the project management literature, project failure has generally been associated
with not meeting four main objectives; cost, time, quality and scope (Atkinson, 1999;
Lyytinen and Hirschheim, 1987; Project Management Institute, 2004; Shenhar, Levy and
Dvir, 1997). Consequently, any factor that causes the project to go over one or more of its
planned objectives is a risk that should be mitigated. The higher the number of unmet
objectives, the higher the project overall riskiness level and its chances of failure.
Information markets can be used to monitor the status of the software projects main
objectives and the overall riskiness level of the project.
The questions asked in the market are directly related to its forecasting goal and
are designed to reveal the true status of the project, or in other words, its riskiness level.
An information market for each project objective can be launched to predict how likely
each objective is to go over its planned limit, and another information market can be used
to predict the riskiness level of the project or how likely it is that one or more of its
objectives are currently unmet. The more unmet objectives the higher the riskiness level
of the project. Questions asked in the markets take into account the impact definition of
risks on major project objectives and seek to assess the collective forecast of the
likelihood of these risks. Figure 15 provides some examples of risk impact definitions on
cost, time, scope and quality objectives.
Organizations can choose to keep track of only high or medium impact risks on
the four main project objectives. For example, an information market designed to monitor
high impact risks on the status of a project cost objective will predict the likelihood of 20-
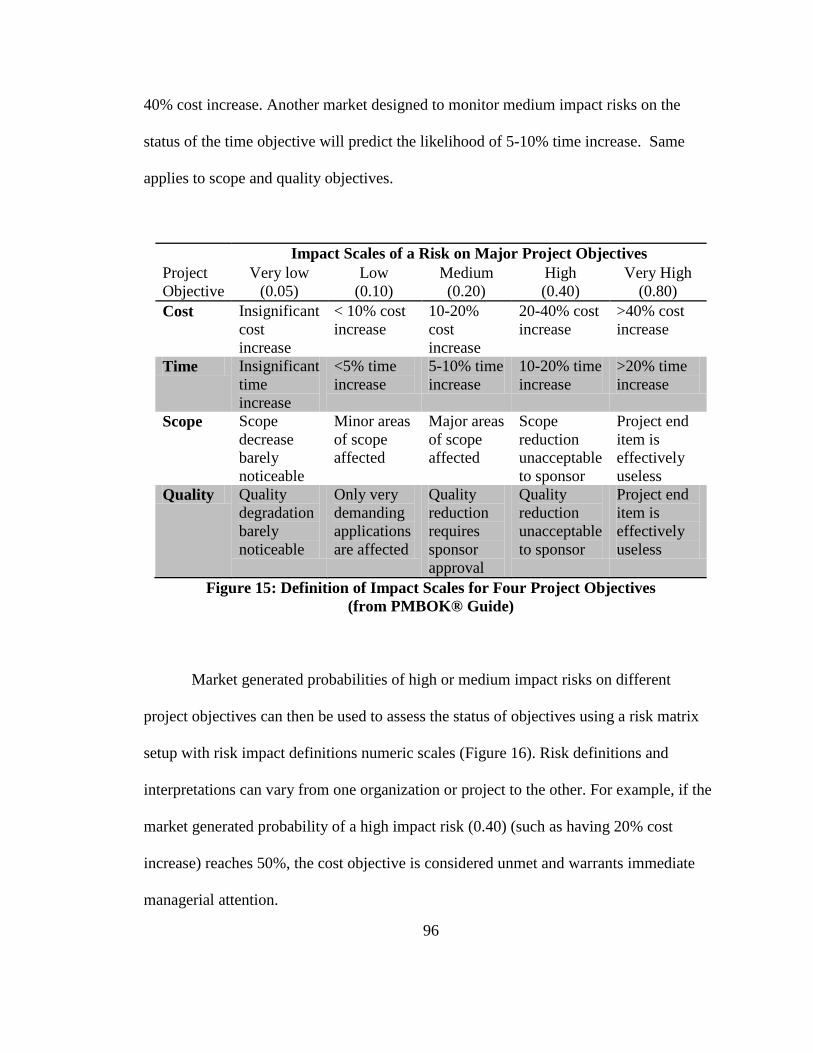
96
40% cost increase. Another market designed to monitor medium impact risks on the
status of the time objective will predict the likelihood of 5-10% time increase. Same
applies to scope and quality objectives.
Project
Objective
Impact Scales of a Risk on Major Project Objectives
Very low
(0.05)
Low
(0.10)
Medium
(0.20)
High
(0.40)
Very High
(0.80)
Cost Insignificant
cost
increase
< 10% cost
increase
10-20%
cost
increase
20-40% cost
increase
>40% cost
increase
Time Insignificant
time
increase
<5% time
increase
5-10% time
increase
10-20% time
increase
>20% time
increase
Scope Scope
decrease
barely
noticeable
Minor areas
of scope
affected
Major areas
of scope
affected
Scope
reduction
unacceptable
to sponsor
Project end
item is
effectively
useless
Quality Quality
degradation
barely
noticeable
Only very
demanding
applications
are affected
Quality
reduction
requires
sponsor
approval
Quality
reduction
unacceptable
to sponsor
Project end
item is
effectively
useless
Figure 15: Definition of Impact Scales for Four Project Objectives
(from PMBOK® Guide)
Market generated probabilities of high or medium impact risks on different
project objectives can then be used to assess the status of objectives using a risk matrix
setup with risk impact definitions numeric scales (Figure 16). Risk definitions and
interpretations can vary from one organization or project to the other. For example, if the
market generated probability of a high impact risk (0.40) (such as having 20% cost
increase) reaches 50%, the cost objective is considered unmet and warrants immediate
managerial attention.
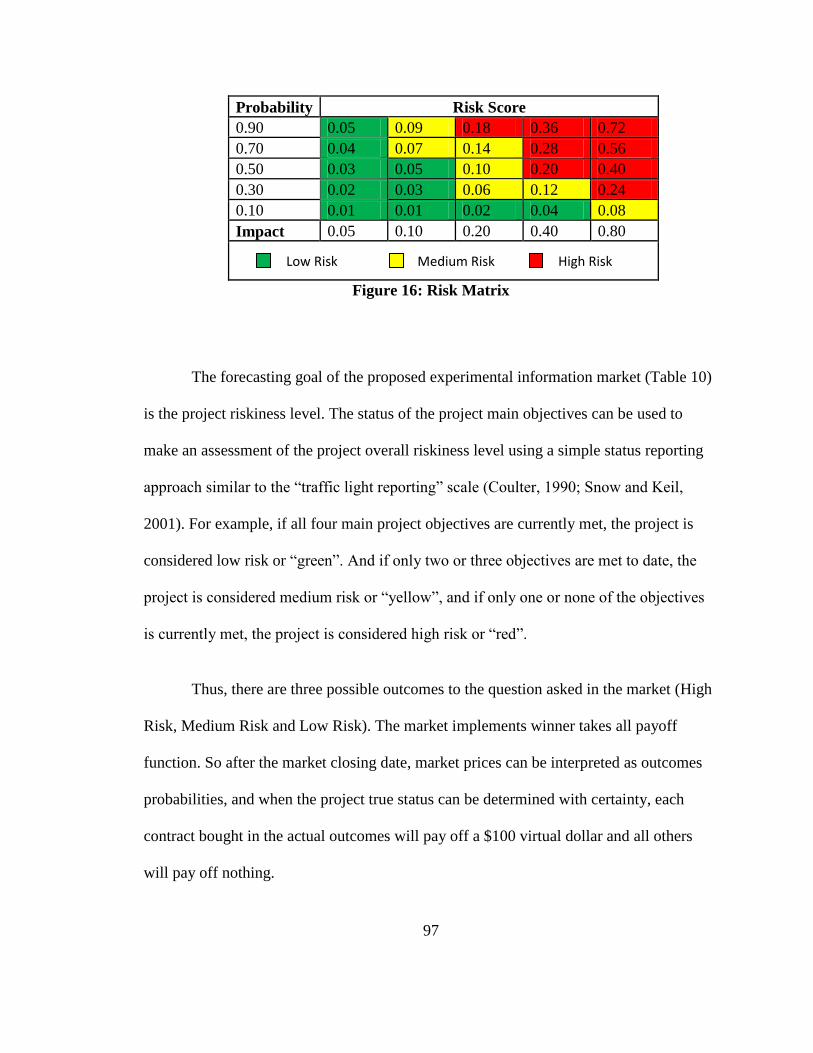
97
Probability Risk Score
0.90 0.05 0.09 0.18 0.36 0.72
0.70 0.04 0.07 0.14 0.28 0.56
0.50 0.03 0.05 0.10 0.20 0.40
0.30 0.02 0.03 0.06 0.12 0.24
0.10 0.01 0.01 0.02 0.04 0.08
Impact 0.05 0.10 0.20 0.40 0.80
Figure 16: Risk Matrix
The forecasting goal of the proposed experimental information market (Table 10)
is the project riskiness level. The status of the project main objectives can be used to
make an assessment of the project overall riskiness level using a simple status reporting
approach similar to the ―traffic light reporting‖ scale (Coulter, 1990; Snow and Keil,
2001). For example, if all four main project objectives are currently met, the project is
considered low risk or ―green‖. And if only two or three objectives are met to date, the
project is considered medium risk or ―yellow‖, and if only one or none of the objectives
is currently met, the project is considered high risk or ―red‖.
Thus, there are three possible outcomes to the question asked in the market (High
Risk, Medium Risk and Low Risk). The market implements winner takes all payoff
function. So after the market closing date, market prices can be interpreted as outcomes
probabilities, and when the project true status can be determined with certainty, each
contract bought in the actual outcomes will pay off a $100 virtual dollar and all others
will pay off nothing.
Low Risk Medium Risk High Risk
98
The traders‘ initial portfolios consist of no shares in any of the outcomes and a
sufficiently large amount of virtual money to guarantee liquidity and sustain trading
activity as events unfold. Contracts are cashed out when the market closes, and incentives
will be distributed depending on traders‘ net worth after subtracting the initial
endowment.
The trading mechanism used in the proposed market design is automated market
maker (AMM). Automated market maker has several advantages over its widely used
counterpart; continuous double auction (CDA) that makes it particularly suitable to use in
organizational markets. Markets used in organizations tend to be thin with a relatively
small number of traders which can cause liquidity problems that negatively impact
market forecasts. Unlike CDA, AMM guarantees liquidity because it does not require
matching sellers to buyers but instead it let traders buy and sell contracts directly from
the market, and as a result, transfer some of the financial risk to the market institution.
Web-based implementations of information markets are not restricted by location
or time and thus allow for both synchronous and asynchronous trading. Asynchronous
trading can be particularly useful for organizations because employees, developers,
customers and other project stakeholders can participate in trading or have access to the
market from anywhere and at anytime. Synchronous trading via the web in multiple
sessions is chosen because design evaluation experiments are conducted in a controlled
environment where experimental task requires all subjects to be in the same place at the
same time to facilitate training and distribution of information. Further, synchronous
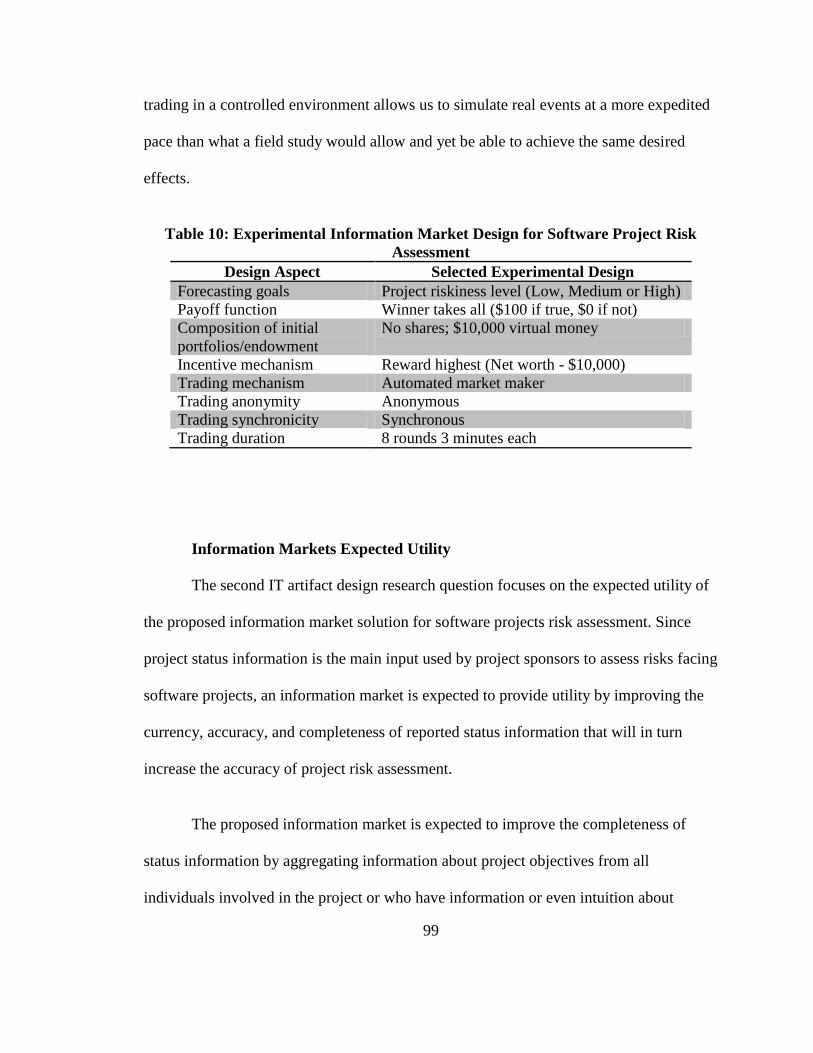
99
trading in a controlled environment allows us to simulate real events at a more expedited
pace than what a field study would allow and yet be able to achieve the same desired
effects.
Table 10: Experimental Information Market Design for Software Project Risk
Assessment
Design Aspect Selected Experimental Design
Forecasting goals Project riskiness level (Low, Medium or High)
Payoff function Winner takes all ($100 if true, $0 if not)
Composition of initial
portfolios/endowment
No shares; $10,000 virtual money
Incentive mechanism Reward highest (Net worth - $10,000)
Trading mechanism Automated market maker
Trading anonymity Anonymous
Trading synchronicity Synchronous
Trading duration 8 rounds 3 minutes each
Information Markets Expected Utility
The second IT artifact design research question focuses on the expected utility of
the proposed information market solution for software projects risk assessment. Since
project status information is the main input used by project sponsors to assess risks facing
software projects, an information market is expected to provide utility by improving the
currency, accuracy, and completeness of reported status information that will in turn
increase the accuracy of project risk assessment.
The proposed information market is expected to improve the completeness of
status information by aggregating information about project objectives from all
individuals involved in the project or who have information or even intuition about

100
project progress, regardless of their formal role or level at the organizational hierarchy.
Information markets disseminate gathered information in form of prices that can be
interpreted as a status report or collective assessment of project risks. Thus, in a properly
designed information market, price or market-generated risk assessment should be equal
to the reported status or assessment of a hypothetical person who has access to all project
information.
H1: An information market’s reported assessment of project risks
will approximate the reported assessment of a single person in
possession of all the information.
The information aggregation property of market prices provides a cost-effective
alternative to existing methods of information gathering such as surveys, periodic status
reports and meetings. Further, information markets are dynamic and responsive to
changing circumstances. Prices in information markets prove to incorporate new
information almost instantly (Forsythe et al., 1992) and, therefore, can improve the
currency of aggregated status information and provide continuous and up-to-date
assessment of risks. Thus, information market price is expected to quickly move up or
down in response to new information and so provide up-to-date assessment of risks.
Individuals often misperceive the true status of the project due to having partial
information about its progress which biases their assessments of risks. The process of
price formation and discovery provides a solution to the complex task of aggregating
individual assessments of risks. Trading dynamics in a market setting cancel individual

101
biases and errors out, preventing them from impacting predictions (Forsythe et al., 1992;
Forsythe, Rietz, and Ross, 1999; Oliven and Rietz, 2004) and therefore can improve the
accuracy of aggregated status information.
H2: An information market’s reported assessment of project risks
will be more accurate than any individual reported assessment
of project risk
Thus, in an organization where disparate project status information is dispersed
among many people, a well-designed information market can collect this information
bringing about, in form of prices, a complete and up to date collective assessment of
project risks purified from individual biases and errors.
However, prior research has identified several factors that impact the accuracy of
reported status information, such as deliberate misrepresentation of status information
(Snow and Keil, 2002). Although a well designed aggregation mechanism, such as an
information market, can adjust for individual errors caused by inaccurate perceptions of
project progress, accounting for information misrepresentation, or individuals reluctance
to report accurate information remains a challenging task.
In the context of IT projects, research adopting the whistle blowing theoretical
perspective (Dozier and Miceli, 1985) has identified situational, organizational and
personal variables that directly or indirectly influence employees‘ willingness to report
negative information. Those factors are useful in predicting communication effectiveness
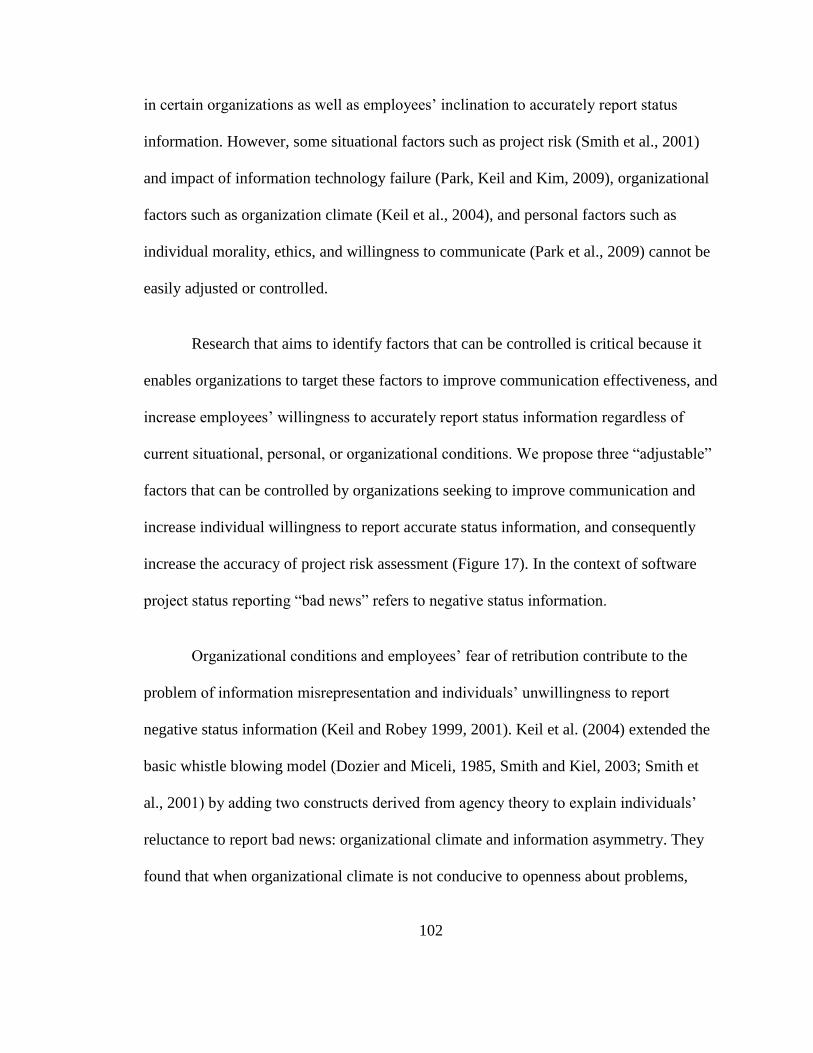
102
in certain organizations as well as employees‘ inclination to accurately report status
information. However, some situational factors such as project risk (Smith et al., 2001)
and impact of information technology failure (Park, Keil and Kim, 2009), organizational
factors such as organization climate (Keil et al., 2004), and personal factors such as
individual morality, ethics, and willingness to communicate (Park et al., 2009) cannot be
easily adjusted or controlled.
Research that aims to identify factors that can be controlled is critical because it
enables organizations to target these factors to improve communication effectiveness, and
increase employees‘ willingness to accurately report status information regardless of
current situational, personal, or organizational conditions. We propose three ―adjustable‖
factors that can be controlled by organizations seeking to improve communication and
increase individual willingness to report accurate status information, and consequently
increase the accuracy of project risk assessment (Figure 17). In the context of software
project status reporting ―bad news‖ refers to negative status information.
Organizational conditions and employees‘ fear of retribution contribute to the
problem of information misrepresentation and individuals‘ unwillingness to report
negative status information (Keil and Robey 1999, 2001). Keil et al. (2004) extended the
basic whistle blowing model (Dozier and Miceli, 1985, Smith and Kiel, 2003; Smith et
al., 2001) by adding two constructs derived from agency theory to explain individuals‘
reluctance to report bad news: organizational climate and information asymmetry. They
found that when organizational climate is not conducive to openness about problems,
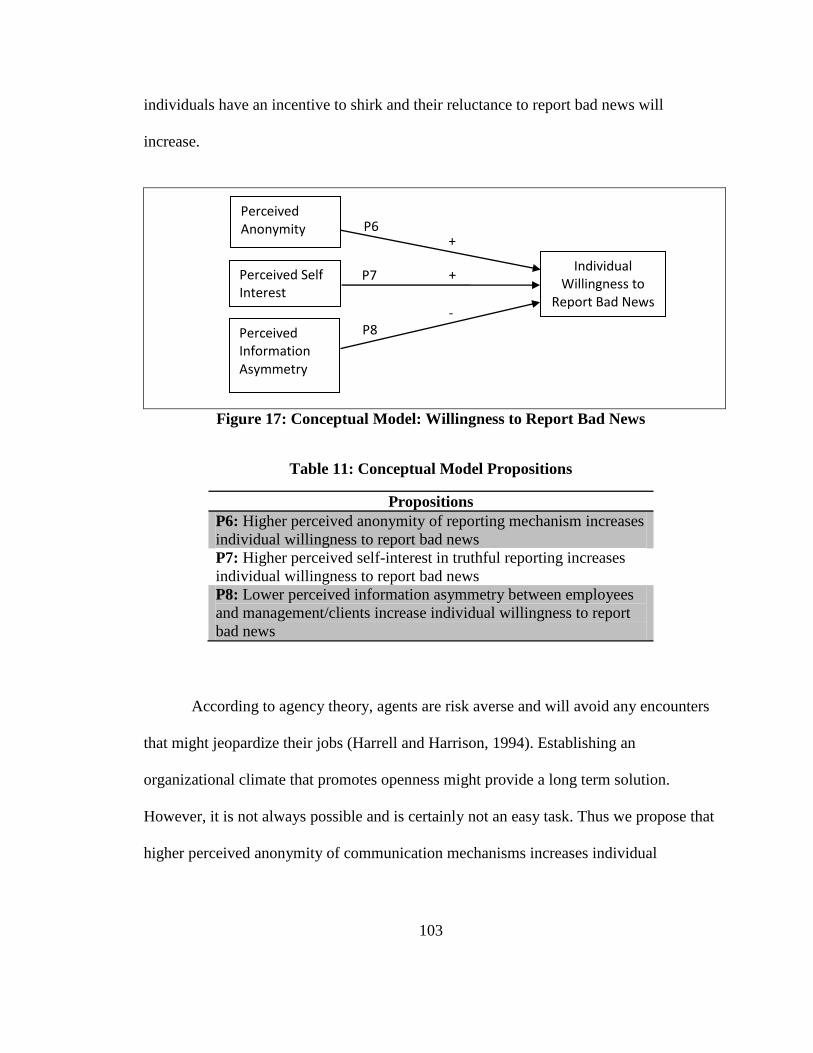
103
individuals have an incentive to shirk and their reluctance to report bad news will
increase.
Figure 17: Conceptual Model: Willingness to Report Bad News
Table 11: Conceptual Model Propositions
Propositions
P6: Higher perceived anonymity of reporting mechanism increases
individual willingness to report bad news
P7: Higher perceived self-interest in truthful reporting increases
individual willingness to report bad news
P8: Lower perceived information asymmetry between employees
and management/clients increase individual willingness to report
bad news
According to agency theory, agents are risk averse and will avoid any encounters
that might jeopardize their jobs (Harrell and Harrison, 1994). Establishing an
organizational climate that promotes openness might provide a long term solution.
However, it is not always possible and is certainly not an easy task. Thus we propose that
higher perceived anonymity of communication mechanisms increases individual
Perceived Anonymity
Perceived Information Asymmetry
P6
P7
P8
+
+
-
Individual Willingness to
Report Bad News
Perceived Self Interest
104
willingness to report negative status information regardless of the organizational climate
(Table 11), and is a factor that can be easily adjusted or controlled by organizations.
Anonymity is a complex and influential aspect of communications medium that
has received much attention in the study of collaborative technologies and group support
systems (GSS) (Valacich, Leonard, Dennis and Nunamaker, 1992). An evaluation of 54
case and field studies of organizations using group support systems (GSS) technology to
improve decision making, identified anonymity as a characteristic of successful GSS
implementations (Fjermestad and Hiltz, 2001).
Anonymity features of the communication medium improves the communication
process, and the overall group satisfaction with the technology compared to face-to-face
meetings where group members are identified (Fjermestad and Hiltz, 2001), broadens
participation and encourages diversity of thought (Bikson, 1996), improves the
effectiveness of the communication process (Dennis, Heminger, Nunamaker and Vogel,
1990), and increases group meetings quality (Dennis, Tryan, Vogel and Nunamaker,
1997). Thus, a reporting mechanism that shields employees‘ identities from being
exposed will provide employees with a sense of security and consequently will increase
the accuracy of their reports.
Employees participating in an information market report status information
through their market trades. The proposed information market design allows for
anonymous trading, where participants post bids or asks and perform market transactions
105
using pseudo names. Thus, it is expected to increase their perceived anonymity of the
market reporting mechanism (Figure 18).
H3: An information market in which trading is anonymous will
increase employees’ perception of reporting mechanism’s
anonymity
Figure 18: Research Model: Information Market Impact on
Willingness to Report Bad News
Additionally, based on agency theory, employees are utility maximizers and seek
their self-interest. So if employees feel that hiding information or remaining silent is in
their best interest, they will shirk from reporting bad news. We propose that a higher
perceived self-interest in reporting accurate information will increase employees‘
willingness to report bad news (Table 11). Thus organizations should focus on factors that
directly impact employees‘ perception of their self-interest, and at the same time, can be
H3
Perceived Anonymity
+
+ Individual Willingness to
Report Bad News
Perceived Self Interest
H4
- H5
Perceived Information Asymmetry
Information Market
H6 +
106
easily controlled. Incentives improve goal congruence between employees and
organizations (Eisenhardt, 1989). Therefore we propose that a communication
mechanism that offers incentives to employees for revealing true status information will
increase their perception of self-interest and as a result their willingness to report
negative status information (Figure 17). An information market offers incentives for
faithful trading since contracts payoff depends on the outcomes of the forecasted events.
So if employees have negative information about project progress, it is in their best
interest to trade based on this information because they will benefit when events
eventually occur (Figure 18).
H4: An information market that provides incentives for faithful
revelation of information will increase employees’ perceived
self interest in reporting true status information
In addition to perceived anonymity and perceived self-interest, we propose that
adjusting perceived information asymmetry between employees and management can
increase employees‘ willingness to report accurate information (Figure 17). When
perceived information asymmetry is high (ability to hide bad news is high) individuals‘
reluctance to report bad news will increase (Keil et al., 2004). We propose that a
communication mechanism that reduces employees‘ perceptions of information
asymmetry (by making them feel that they cannot hide negative information from
management) will increase their willingness to report bad news (Table 11).

107
Monitoring projects‘ progress reduces privately-held information and employees‘
perception of information asymmetry. An organizational information market acts like a
project monitoring tool that facilitates identification of risks early enough to mitigate
them. Further, an information market encourages employees to seek their self-interest
(because money is involved), so employees will soon realize that they are better off
utilizing their information advantage by trading on what they know because if they do
not, others will, and consequently the market will reveal this information to management
or the client. In other words, an information market acts as a control mechanism and will
decrease employees perceived information asymmetry between them and
management/client (Figure 18).
H5: An information market will reduce employees’ perceptions of
information asymmetry between them and management/client
Ineffective monitoring and failing to manage goal conflict, shirking, and
privately-held information are among the primary reasons for software development
projects failure (Mahaney and Lederer, 2003). Organizations can design communication
mechanisms, such as information market, that allow for anonymous reporting, offer
incentives, and act as a monitoring tool of the project that creates low perceived
information asymmetry in the organization, to improve the accuracy of employees‘
reports by increasing their willingness to report negative information.
108
H6: An information market in which trading is anonymous and
provides incentives for truthful revelation of information will
increase employees’ willingness to report bad news
Now we describe design evaluation research questions and the experiments
conducted to evaluate the proposed information market design and to test hypotheses
about its expected utility for software projects‘ risk assessment.
Information Markets Design Evaluation
Despite the empirical evidence on markets‘ ability to aggregate information, the
details of the information aggregation and dissemination process are not yet fully
understood (Plott and Sunder, 1982; 1988; Forsythe and Lundholm, 1990). And although
the results of laboratory experiments on security markets are useful in informing
information markets design, information aggregation tasks used in lab experiments lack
realism and their results are difficult to interpret and generalize to business settings.
The results of pilot studies in the field are encouraging by their demonstration of
the feasibility of using information markets in organizations, but they do not provide
sufficient levels of internal validity and control required to advance a rigorous theory of
organizational information markets.
There is a need for more controlled experimental studies on the use of information
markets for business problems that use business-related tasks and scenarios. Such
experimental studies are needed to advance the theory of organizational information
109
markets and to improve our understanding of their utility to organizations. Experiments
should provide sufficient degree of control that allows us to draw conclusions about
manipulation effects and causality which, in turn, will allow us to build theoretical
models to explain and predict the impact of various information markets designs on key
business-related dependent variables, and to explain and predict information markets
performance in specific business settings.
Experimental results are important to build a fundamental understanding of how
information markets work, what are their expected impacts and benefits, and why they
are expected to work well in some organizations but not as well in others. Such an
understanding will allow organizations to better utilize information markets. Field studies
can then be used to test developed theories and research models.
Thus, to answer design evaluation research question we conducted a laboratory
experiment using the proposed experimental information market (Table 10) to test the
market efficacy in providing complete, current and accurate information about software
project risks. We used Inkling prediction markets platform (www.inklingmarkets.com) to
setup the proposed risk assessment market. Given the developed theoretical framework
(Figure 13) and hypotheses outlined in the previous section, we developed preliminarily
experimental materials that include a business case, five different information structures
that include different software development progress updates, and five different versions
of a software project risk assessment survey.
110
The surveys included a section in which the subjects were asked to provide
comments and suggestions to improve the clarity and understandability of the case and
the survey. Each survey included a different information structure, or in other words,
different development progress updates that give information about the status of the four
main project objectives (functionality, quality, cost and schedule). It also included four
manipulation check questions that asked participants to evaluate whether each project
objective is currently met or not. The manipulation check questions tested the participants
understanding of the case and the progress updates. The preliminarily case and surveys
were administered to a group of 25 graduate students and their responses, comments and
suggestions were used to strengthen the manipulations and improve the clarity of the
case.
Seven doctoral students pilot tested the risk assessment experiment using the
information market. The results were used to improve several design aspects of the
experiment; including trading sessions duration, incentive structure, and the distributed
experimental materials (progress updates). The reminder of the section describes final
experiments and instruments.
Information Market Experiment
The final business scenario asked participants to play the role of a member of the
design and development team in a large consulting firm that is developing a new
reservation system for an association of hotels and car rental corporations (the client).
The scenario and development updates are inspired by the events of a real software
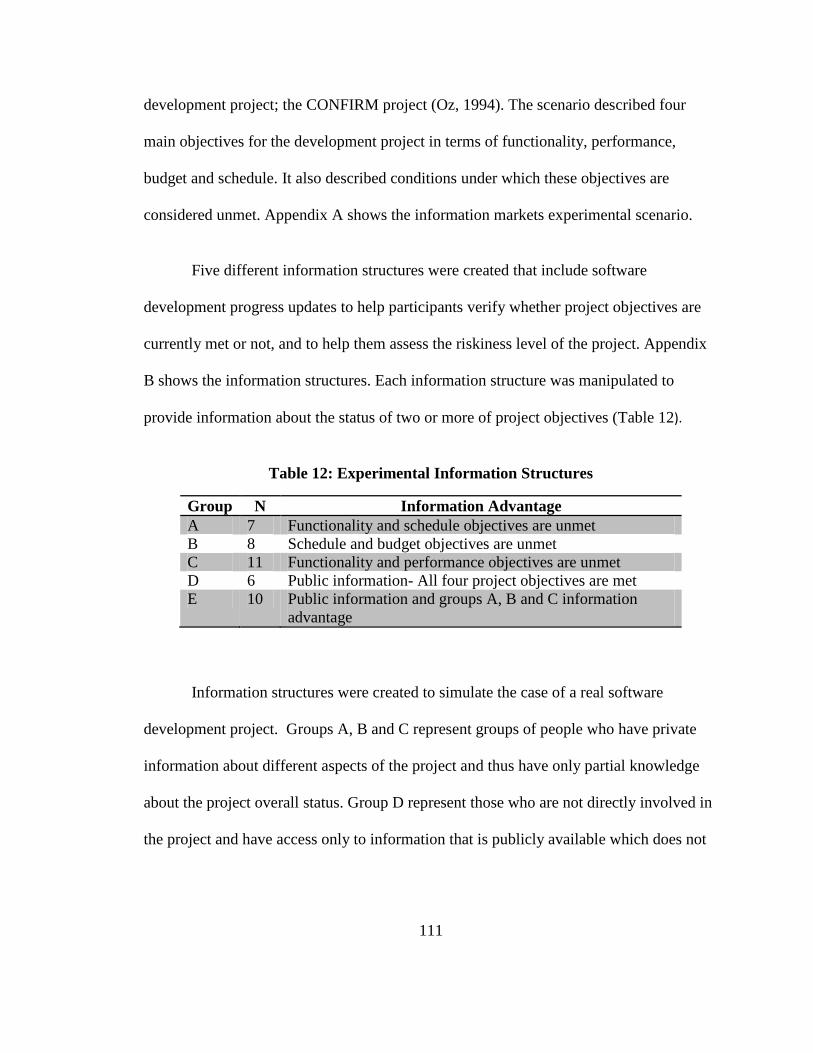
111
development project; the CONFIRM project (Oz, 1994). The scenario described four
main objectives for the development project in terms of functionality, performance,
budget and schedule. It also described conditions under which these objectives are
considered unmet. Appendix A shows the information markets experimental scenario.
Five different information structures were created that include software
development progress updates to help participants verify whether project objectives are
currently met or not, and to help them assess the riskiness level of the project. Appendix
B shows the information structures. Each information structure was manipulated to
provide information about the status of two or more of project objectives (Table 12).
Table 12: Experimental Information Structures
Group N Information Advantage
A 7 Functionality and schedule objectives are unmet
B 8 Schedule and budget objectives are unmet
C 11 Functionality and performance objectives are unmet
D 6 Public information- All four project objectives are met
E 10 Public information and groups A, B and C information
advantage
Information structures were created to simulate the case of a real software
development project. Groups A, B and C represent groups of people who have private
information about different aspects of the project and thus have only partial knowledge
about the project overall status. Group D represent those who are not directly involved in
the project and have access only to information that is publicly available which does not
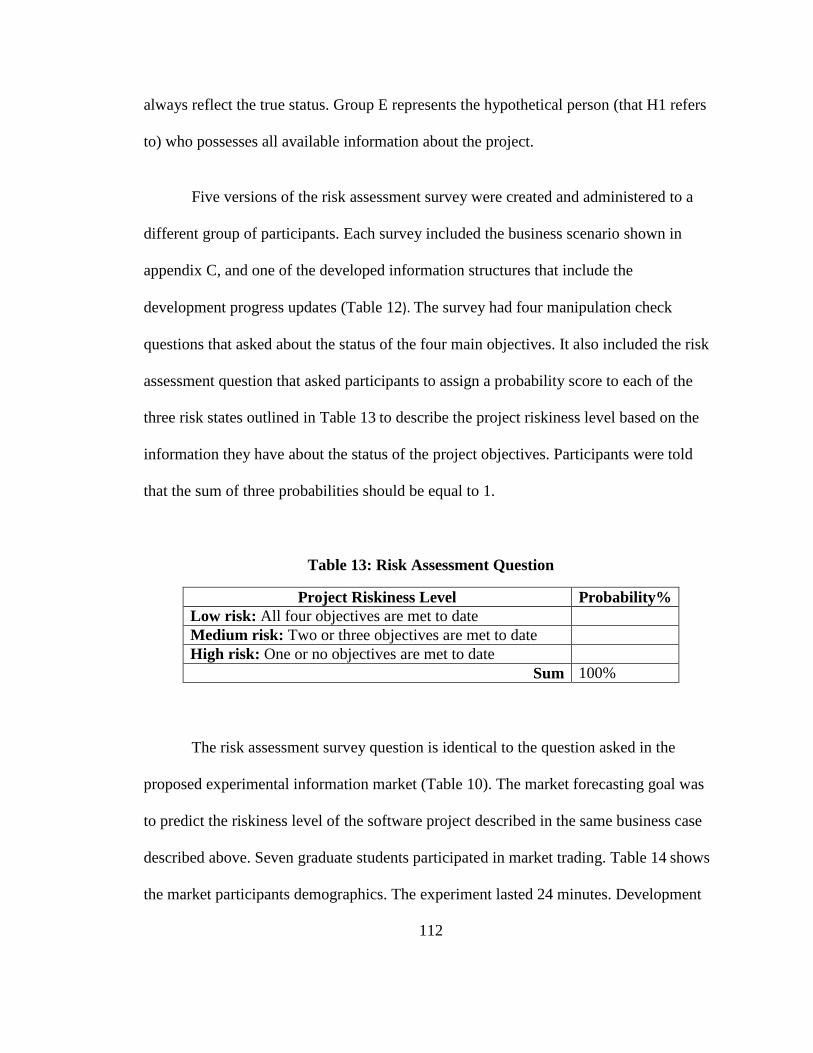
112
always reflect the true status. Group E represents the hypothetical person (that H1 refers
to) who possesses all available information about the project.
Five versions of the risk assessment survey were created and administered to a
different group of participants. Each survey included the business scenario shown in
appendix C, and one of the developed information structures that include the
development progress updates (Table 12). The survey had four manipulation check
questions that asked about the status of the four main objectives. It also included the risk
assessment question that asked participants to assign a probability score to each of the
three risk states outlined in Table 13 to describe the project riskiness level based on the
information they have about the status of the project objectives. Participants were told
that the sum of three probabilities should be equal to 1.
Table 13: Risk Assessment Question
Project Riskiness Level Probability%
Low risk: All four objectives are met to date
Medium risk: Two or three objectives are met to date
High risk: One or no objectives are met to date
Sum 100%
The risk assessment survey question is identical to the question asked in the
proposed experimental information market (Table 10). The market forecasting goal was
to predict the riskiness level of the software project described in the same business case
described above. Seven graduate students participated in market trading. Table 14 shows
the market participants demographics. The experiment lasted 24 minutes. Development
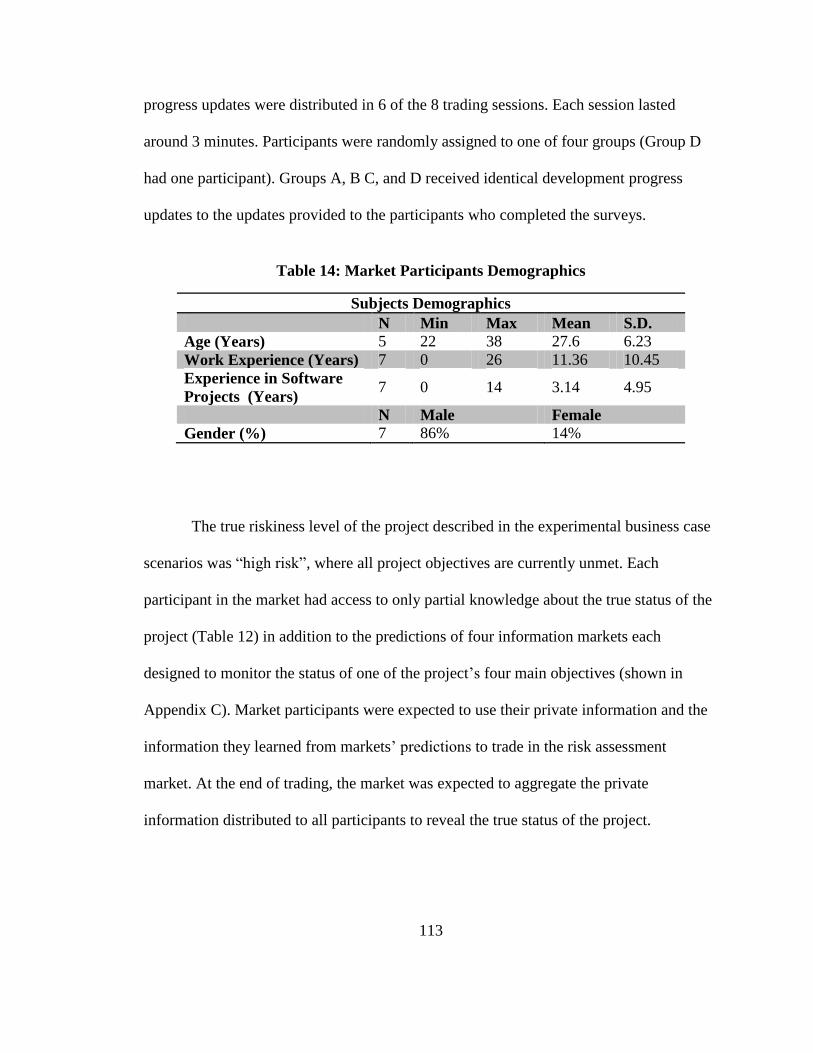
113
progress updates were distributed in 6 of the 8 trading sessions. Each session lasted
around 3 minutes. Participants were randomly assigned to one of four groups (Group D
had one participant). Groups A, B C, and D received identical development progress
updates to the updates provided to the participants who completed the surveys.
Table 14: Market Participants Demographics
Subjects Demographics
N Min Max Mean S.D.
Age (Years) 5 22 38 27.6 6.23
Work Experience (Years) 7 0 26 11.36 10.45
Experience in Software
Projects (Years) 7 0 14 3.14 4.95
N Male Female
Gender (%) 7 86% 14%
The true riskiness level of the project described in the experimental business case
scenarios was ―high risk‖, where all project objectives are currently unmet. Each
participant in the market had access to only partial knowledge about the true status of the
project (Table 12) in addition to the predictions of four information markets each
designed to monitor the status of one of the project‘s four main objectives (shown in
Appendix C). Market participants were expected to use their private information and the
information they learned from markets‘ predictions to trade in the risk assessment
market. At the end of trading, the market was expected to aggregate the private
information distributed to all participants to reveal the true status of the project.
114
Publishing private information in form of market predictions allows participants
to benefit from their information advantage and at the same time accounted for internal
communication channels among them.
In organizations, private information about the status of different project
objectives becomes known to others as project due date approaches, or simply because
employees choose to share it with others or report it to management. This practice of
making private information public was proven not to detract from information markets
effectiveness in aggregating private information. To the contrary, it was shown to
outperform settings where private information is not disclosed or where all information is
publicly available (Almenberg, Kittlitz, and Pfeiffer, 2009). Also this practice suggests
the information market usefulness in organizations that foster transparency and
encourages open communications about issues and problems.
The goal of the experiment was to test H1 and H2 by (1) comparing the market
generated assessment of project risk to the average assessment of group E who received
all available information about the project, and (2) comparing the accuracy of market
generated assessment of project risk to the accuracy of average assessment of groups A,
B, C, and D.
To test the market efficacy in increasing individuals‘ willingness to report bad
news, and as a result improve the accuracy of their status reports, we administered a
survey to a sample of 72 graduate and undergraduate business students enrolled in
information systems classes in a large metropolitan university in the United States. Table

115
15 describes participants‘ demographics. Participants‘ work experience suggests that they
are appropriate subjects for this type of experiment since the manipulations and treatment
conditions are associated with organizational dynamics and decision making.
Table 15: Subjects Demographics
Subjects Demographics
N Min Max Mean S.D.
Age (Years) 65 21 44 28.31 5.99
Work Experience (Years) 71 0 26 8.46 7.04
Experience in Software
Projects (Years) 71 0 20 2.80 5.17
N Male Female
Gender (%) 70 76% 24%
The subjects were told that the survey is part of a study that examines business
decision making, and that it consisted of two parts. The subjects were informed that the
survey is anonymous and their participation is completely voluntary. The first part of the
survey described a business scenario and asked the participants to play the role of a
member of the design and development team in a consulting firm involved in the
development of a transaction processing system for a department store (the client). The
scenario described negative project status information that according to the signed
agreement between the company and the client allows the client to break out of their
contract with the company. Appendix D shows the survey experimental scenario.
The scenario was manipulated to reflect conditions of high information
asymmetry, low self-interest in reporting negative information, and non-anonymous
reporting mechanism in the organization. For the condition of high information
116
asymmetry between the client and the organization, the subjects were informed that
unless employees report negative status information, the client will not become aware of
them until the project due date. For conditions of low self-interest in reporting negative
information, the subjects were informed that employees are expected not to mention
problems in their status reports because management shares them with the clients, and
those who mention problems in their reports get in trouble. For the non-anonymous
reporting condition, the subjects were informed that status reports must include the
employee‘s name and signature.
After reading the case, subjects were asked to express how strongly they agree or
disagree with a series of manipulation check statements that measured their perceived
information asymmetry, perceived self interest and perceived anonymity of reporting
mechanism in the organization. Then they were asked to express how likely they would
report the negative status information. The second part of the survey introduced
additional information to the case. The subjects were told that the client decided to use an
information market to track the development progress of its transaction processing
system.
Subjects were informed that information markets are known for their ability to
quickly incorporate new updates and information to provide up-to-date assessment of the
status of project objectives. This property is expected to bring negative status information
to the client attention very quickly. Subjects were also informed that trading in the
information market is anonymous, and all transactions, bids and asks are maintained by
117
an independent third party organization. Employees can report negative status
information or system problems in an information market without being identified. The
market offers incentives for true revelation of status information. So if employees are
reporting honestly they will benefit financially. All profits will be directly deposited by
the independent company into the employees‘ bank accounts to protect their identities.
All individuals involved in the design and development of the system, or have any
information about its progress, are participating in market trading.
Subjects were then asked to respond to the same questions they answered in the
first part to test the market impact on their perceived information asymmetry, perceived
self-interest in reporting bad news, perceived anonymity of reporting mechanism in the
organization, and their willingness to report bad news.
The four constructs of interest were measured using multiple-item scales using
pre-validated instruments wherever possible. Appendix E shows all measurement scales
organized by construct. Perceived information asymmetry was measured using two likert
scaled items developed and validated by Kiel et al. (2004). Items were reworded to fit the
context of the scenario. Perceived self-interest was measured using three likert scaled
items designed specifically for this study. Perceived anonymity was measured using two
likert scaled items which were also designed specifically for this study. Willingness to
report bad news was measured using a modified version of the three likert scaled items
developed and validated by Kiel et al. (2004) and Park and Kiel (2009).
118
Data Analysis and Results
Data analysis was performed in two phases. In the first phase, the reliability and
construct validity of all measurement scales were tested using confirmatory factor
analysis (CFA). Confirmatory factor analysis was chosen over alternative statistical
techniques such as exploratory factor analysis because a priori theory about the number
of factors and the relationships between factors and indicator variables exists. Amos 18
was used to perform the confirmatory factor analysis. Amos stands for ―Analysis of
Moment Structures‖ and is a software tool distributed by SPSS Inc. All measured items
were modeled as reflective indicators of their corresponding factors.
Scale Validation
Scale validity can be demonstrated through measures of convergent and discriminant
validity. Fornell and Larcker (1981) recommended three measures to assess convergent
validity. (1) Standardized item-to-factor loadings ( ) should exceed 0.70. However,
item loadings of 0.5 or 0.6 may still be acceptable if other items have high loadings on
the same factor (Chin, 1998). (2) Composite reliability for each construct should exceed
0.80. However, reliability score of 0.70 indicates ―extensive‖ evidence of reliability
(Bearden, Netemeyer and Mobley, 1993), and (3) average variance extracted (AVE) for
each construct should exceed 0.50, meaning that 50% of variance of the indicators is
accounted for by the construct.
Composite reliability scores are calculated using the following formula (Chin
1998, p.320) where is the standardized loading of the item (i) on the factor.
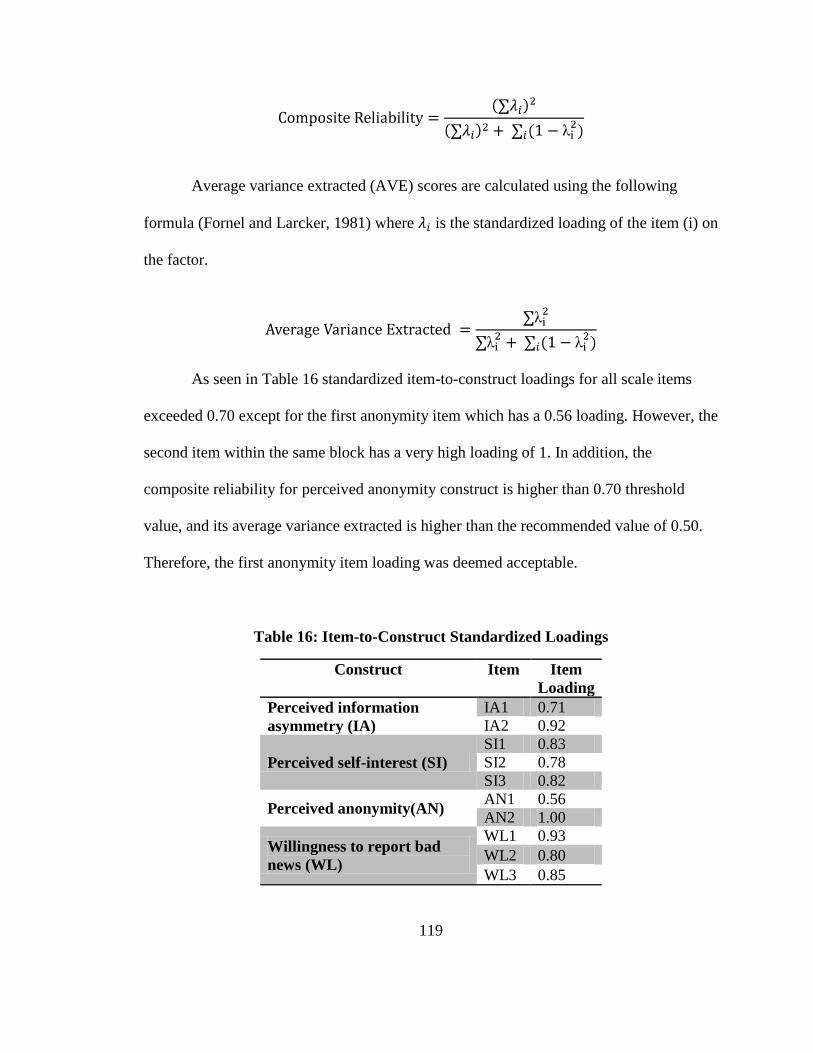
119
Average variance extracted (AVE) scores are calculated using the following
formula (Fornel and Larcker, 1981) where is the standardized loading of the item (i) on
the factor.
As seen in Table 16 standardized item-to-construct loadings for all scale items
exceeded 0.70 except for the first anonymity item which has a 0.56 loading. However, the
second item within the same block has a very high loading of 1. In addition, the
composite reliability for perceived anonymity construct is higher than 0.70 threshold
value, and its average variance extracted is higher than the recommended value of 0.50.
Therefore, the first anonymity item loading was deemed acceptable.
Table 16: Item-to-Construct Standardized Loadings
Construct Item Item
Loading
Perceived information
asymmetry (IA)
IA1 0.71
IA2 0.92
Perceived self-interest (SI)
SI1 0.83
SI2 0.78
SI3 0.82
Perceived anonymity(AN) AN1 0.56
AN2 1.00
Willingness to report bad
news (WL)
WL1 0.93
WL2 0.80
WL3 0.85
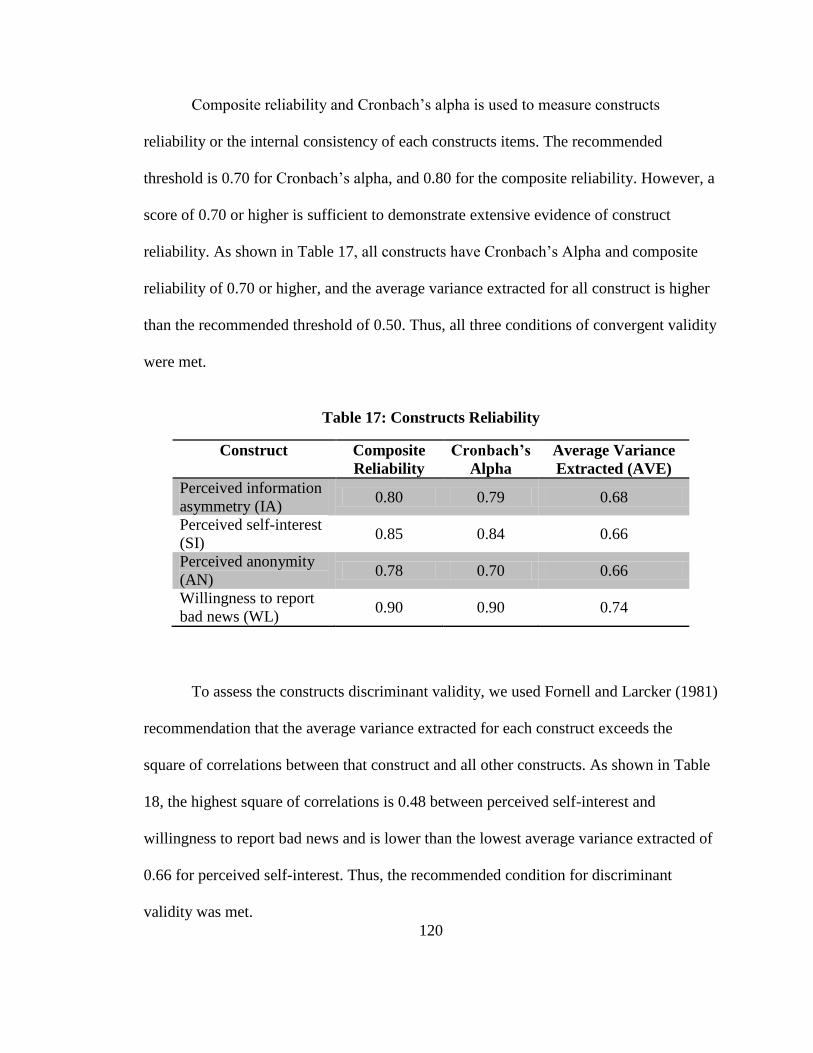
120
Composite reliability and Cronbach‘s alpha is used to measure constructs
reliability or the internal consistency of each constructs items. The recommended
threshold is 0.70 for Cronbach‘s alpha, and 0.80 for the composite reliability. However, a
score of 0.70 or higher is sufficient to demonstrate extensive evidence of construct
reliability. As shown in Table 17, all constructs have Cronbach‘s Alpha and composite
reliability of 0.70 or higher, and the average variance extracted for all construct is higher
than the recommended threshold of 0.50. Thus, all three conditions of convergent validity
were met.
Table 17: Constructs Reliability
Construct Composite
Reliability
Cronbach’s
Alpha
Average Variance
Extracted (AVE)
Perceived information
asymmetry (IA) 0.80 0.79 0.68
Perceived self-interest
(SI) 0.85 0.84 0.66
Perceived anonymity
(AN) 0.78 0.70 0.66
Willingness to report
bad news (WL) 0.90 0.90 0.74
To assess the constructs discriminant validity, we used Fornell and Larcker (1981)
recommendation that the average variance extracted for each construct exceeds the
square of correlations between that construct and all other constructs. As shown in Table
18, the highest square of correlations is 0.48 between perceived self-interest and
willingness to report bad news and is lower than the lowest average variance extracted of
0.66 for perceived self-interest. Thus, the recommended condition for discriminant
validity was met.
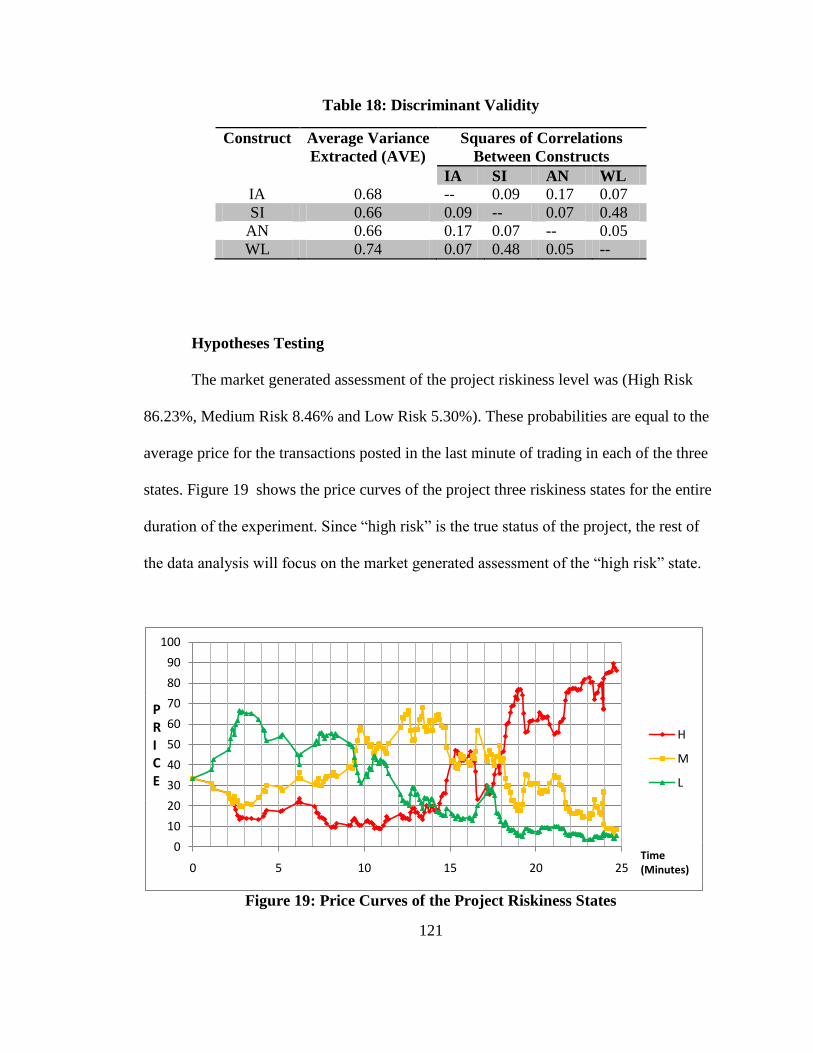
121
Table 18: Discriminant Validity
Construct Average Variance
Extracted (AVE)
Squares of Correlations
Between Constructs
IA SI AN WL
IA 0.68 -- 0.09 0.17 0.07
SI 0.66 0.09 -- 0.07 0.48
AN 0.66 0.17 0.07 -- 0.05
WL 0.74 0.07 0.48 0.05 --
Hypotheses Testing
The market generated assessment of the project riskiness level was (High Risk
86.23%, Medium Risk 8.46% and Low Risk 5.30%). These probabilities are equal to the
average price for the transactions posted in the last minute of trading in each of the three
states. Figure 19 shows the price curves of the project three riskiness states for the entire
duration of the experiment. Since ―high risk‖ is the true status of the project, the rest of
the data analysis will focus on the market generated assessment of the ―high risk‖ state.
Figure 19: Price Curves of the Project Riskiness States
0
10
20
30
40
50
60
70
80
90
100
0 5 10 15 20 25
H
M
L
Time (Minutes)
PRICE
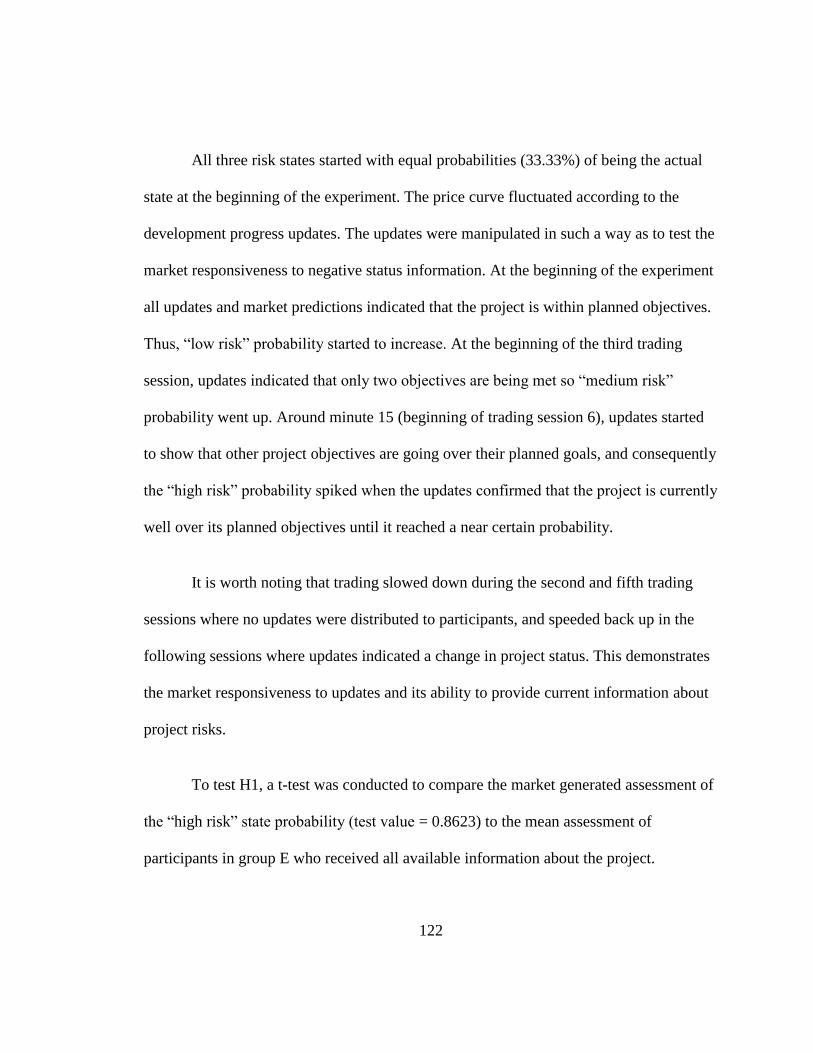
122
All three risk states started with equal probabilities (33.33%) of being the actual
state at the beginning of the experiment. The price curve fluctuated according to the
development progress updates. The updates were manipulated in such a way as to test the
market responsiveness to negative status information. At the beginning of the experiment
all updates and market predictions indicated that the project is within planned objectives.
Thus, ―low risk‖ probability started to increase. At the beginning of the third trading
session, updates indicated that only two objectives are being met so ―medium risk‖
probability went up. Around minute 15 (beginning of trading session 6), updates started
to show that other project objectives are going over their planned goals, and consequently
the ―high risk‖ probability spiked when the updates confirmed that the project is currently
well over its planned objectives until it reached a near certain probability.
It is worth noting that trading slowed down during the second and fifth trading
sessions where no updates were distributed to participants, and speeded back up in the
following sessions where updates indicated a change in project status. This demonstrates
the market responsiveness to updates and its ability to provide current information about
project risks.
To test H1, a t-test was conducted to compare the market generated assessment of
the ―high risk‖ state probability (test value = 0.8623) to the mean assessment of
participants in group E who received all available information about the project.
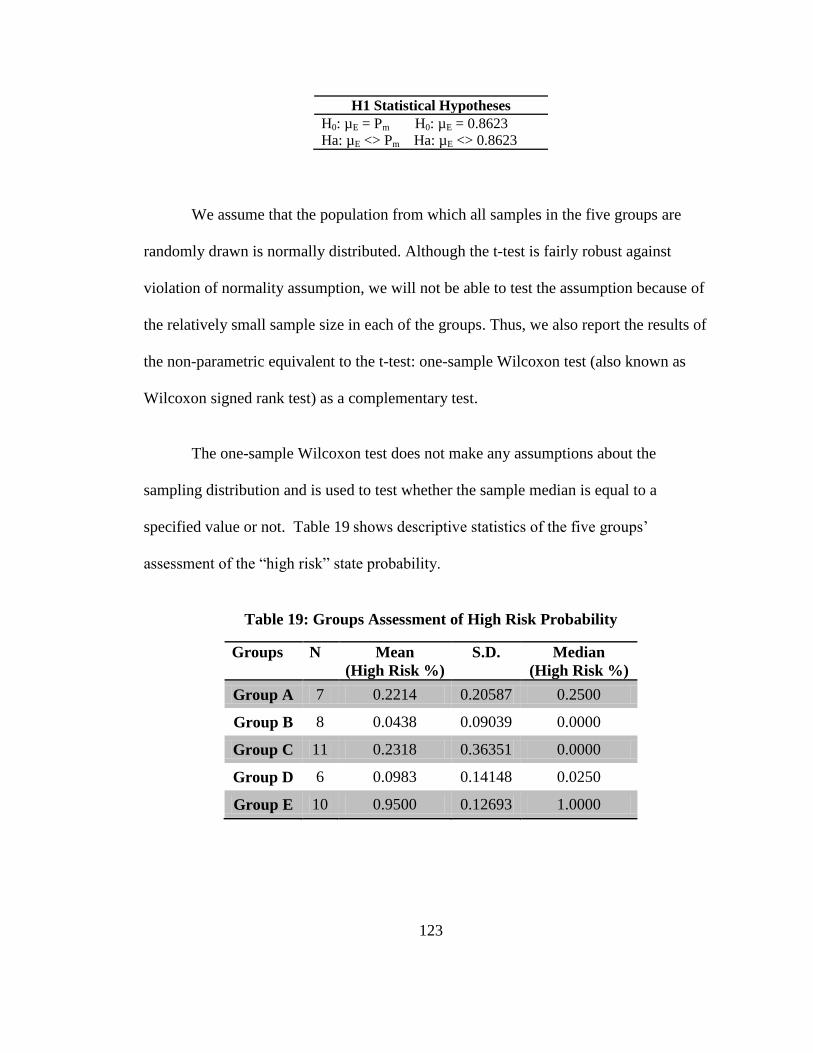
123
H1 Statistical Hypotheses
H0: µE = Pm H0: µE = 0.8623
Ha: µE <> Pm Ha: µE <> 0.8623
We assume that the population from which all samples in the five groups are
randomly drawn is normally distributed. Although the t-test is fairly robust against
violation of normality assumption, we will not be able to test the assumption because of
the relatively small sample size in each of the groups. Thus, we also report the results of
the non-parametric equivalent to the t-test: one-sample Wilcoxon test (also known as
Wilcoxon signed rank test) as a complementary test.
The one-sample Wilcoxon test does not make any assumptions about the
sampling distribution and is used to test whether the sample median is equal to a
specified value or not. Table 19 shows descriptive statistics of the five groups‘
assessment of the ―high risk‖ state probability.
Table 19: Groups Assessment of High Risk Probability
Groups N Mean
(High Risk %)
S.D. Median
(High Risk %)
Group A 7 0.2214 0.20587 0.2500
Group B 8 0.0438 0.09039 0.0000
Group C 11 0.2318 0.36351 0.0000
Group D 6 0.0983 0.14148 0.0250
Group E 10 0.9500 0.12693 1.0000
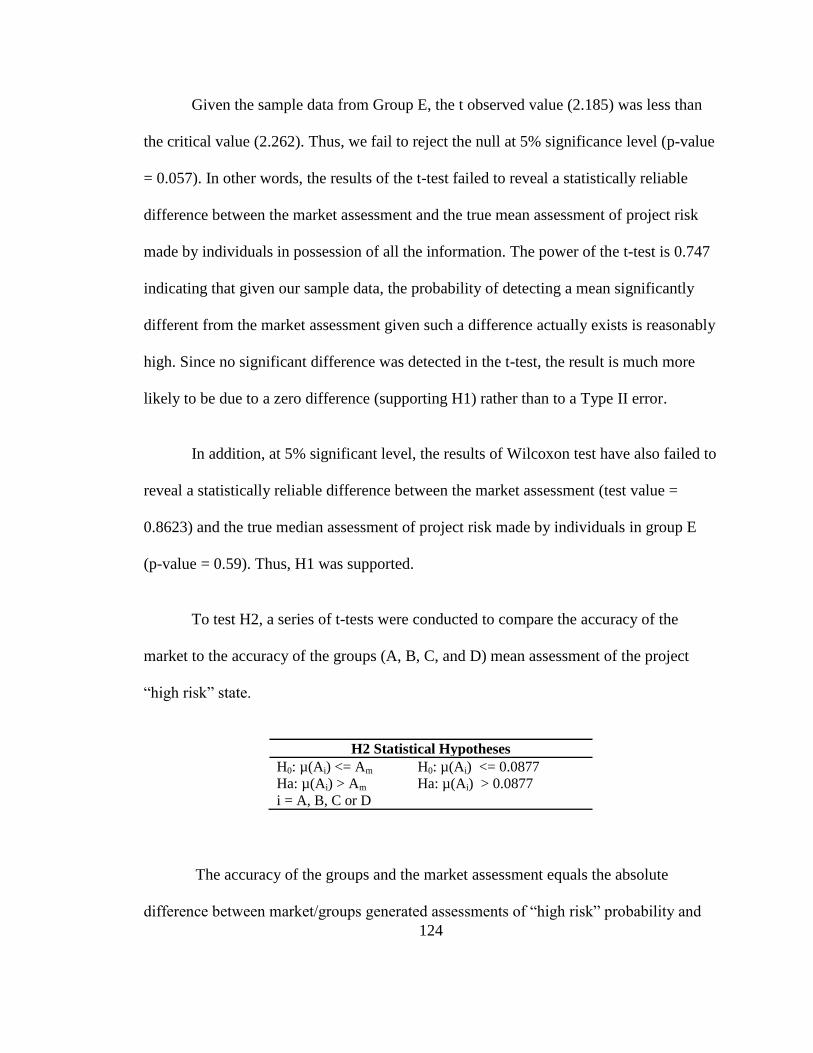
124
Given the sample data from Group E, the t observed value (2.185) was less than
the critical value (2.262). Thus, we fail to reject the null at 5% significance level (p-value
= 0.057). In other words, the results of the t-test failed to reveal a statistically reliable
difference between the market assessment and the true mean assessment of project risk
made by individuals in possession of all the information. The power of the t-test is 0.747
indicating that given our sample data, the probability of detecting a mean significantly
different from the market assessment given such a difference actually exists is reasonably
high. Since no significant difference was detected in the t-test, the result is much more
likely to be due to a zero difference (supporting H1) rather than to a Type II error.
In addition, at 5% significant level, the results of Wilcoxon test have also failed to
reveal a statistically reliable difference between the market assessment (test value =
0.8623) and the true median assessment of project risk made by individuals in group E
(p-value = 0.59). Thus, H1 was supported.
To test H2, a series of t-tests were conducted to compare the accuracy of the
market to the accuracy of the groups (A, B, C, and D) mean assessment of the project
―high risk‖ state.
H2 Statistical Hypotheses
H0: µ(Ai) <= Am H0: µ(Ai) <= 0.0877
Ha: µ(Ai) > Am Ha: µ(Ai) > 0.0877
i = A, B, C or D
The accuracy of the groups and the market assessment equals the absolute
difference between market/groups generated assessments of ―high risk‖ probability and

125
the mean assessment made by group E (Assuming PE = µE). Table 20 shows the market
vs. groups risk assessment accuracy.
Table 20: Market vs. Groups Risk Assessment Accuracy
Groups A B C D E Market
Mean Assessment 0 ≤ Pi ≤ 1 0.2214 0.0438 0.2318 0.0983 0.9500 0.8623
Mean Accuracy Ai =|PE – Pi| 0.7286 0.9063 0.7182 0.8517 0.0877
Median Assessment 0 ≤ Pi ≤ 1 0.2500 0.0000 0.0000 0.0250 1.0000 0.8623
Median Accuracy Ai =|PE – Pi| 0.7500 1.0000 1.0000 0.9750 0.1377
Table 21 shows the results of the t-tests. The t critical values for all the groups are
less than the observed t values, the P-values are less than 5% significance level, and the
upper and lower bound of all confidence intervals are positive. Thus, we reject the null
hypothesis and accept the alternative at 5% significance level. We conclude that the
market assessment accuracy of the project actual riskiness level is greater than the true
mean assessment accuracy of any group of individuals with only partial knowledge about
the project.
Table 21: Groups Risk Assessment Accuracy T-Tests
Test Value Information Market Accuracy = 0.0877
t observed t critical df P-value
(2-tailed)
Mean
Difference
95% Confidence Interval
of the Difference
Lower Upper
Group A 8.207 1.943 6 .000 .63857 .4482 .8290
Group B 25.543 1.894 7 .000 .81625 .7407 .8918
Group C 5.732 1.812 10 .000 .62818 .3840 .8724
Group D 13.187 2.015 5 .000 .76167 .6132 .9101
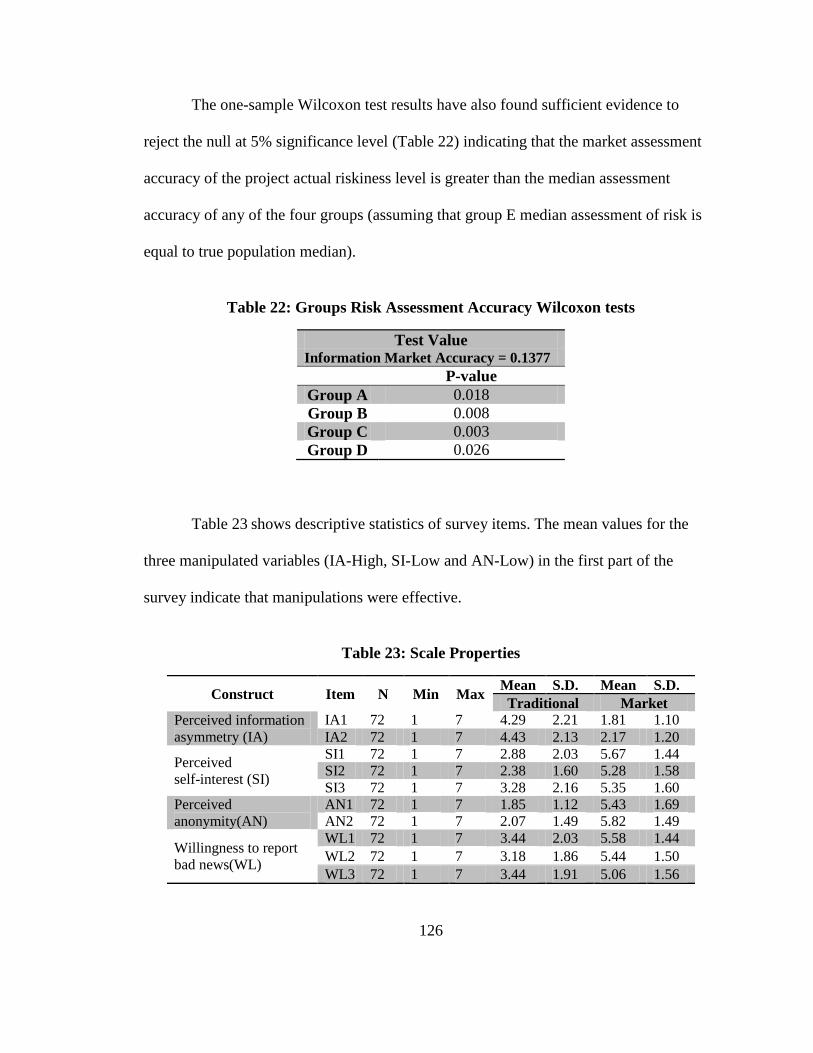
126
The one-sample Wilcoxon test results have also found sufficient evidence to
reject the null at 5% significance level (Table 22) indicating that the market assessment
accuracy of the project actual riskiness level is greater than the median assessment
accuracy of any of the four groups (assuming that group E median assessment of risk is
equal to true population median).
Table 22: Groups Risk Assessment Accuracy Wilcoxon tests
Test Value Information Market Accuracy = 0.1377
P-value
Group A 0.018
Group B 0.008
Group C 0.003
Group D 0.026
Table 23 shows descriptive statistics of survey items. The mean values for the
three manipulated variables (IA-High, SI-Low and AN-Low) in the first part of the
survey indicate that manipulations were effective.
Table 23: Scale Properties
Construct Item N Min Max Mean S.D. Mean S.D.
Traditional Market
Perceived information
asymmetry (IA)
IA1 72 1 7 4.29 2.21 1.81 1.10
IA2 72 1 7 4.43 2.13 2.17 1.20
Perceived
self-interest (SI)
SI1 72 1 7 2.88 2.03 5.67 1.44
SI2 72 1 7 2.38 1.60 5.28 1.58
SI3 72 1 7 3.28 2.16 5.35 1.60
Perceived
anonymity(AN)
AN1 72 1 7 1.85 1.12 5.43 1.69
AN2 72 1 7 2.07 1.49 5.82 1.49
Willingness to report
bad news(WL)
WL1 72 1 7 3.44 2.03 5.58 1.44
WL2 72 1 7 3.18 1.86 5.44 1.50
WL3 72 1 7 3.44 1.91 5.06 1.56
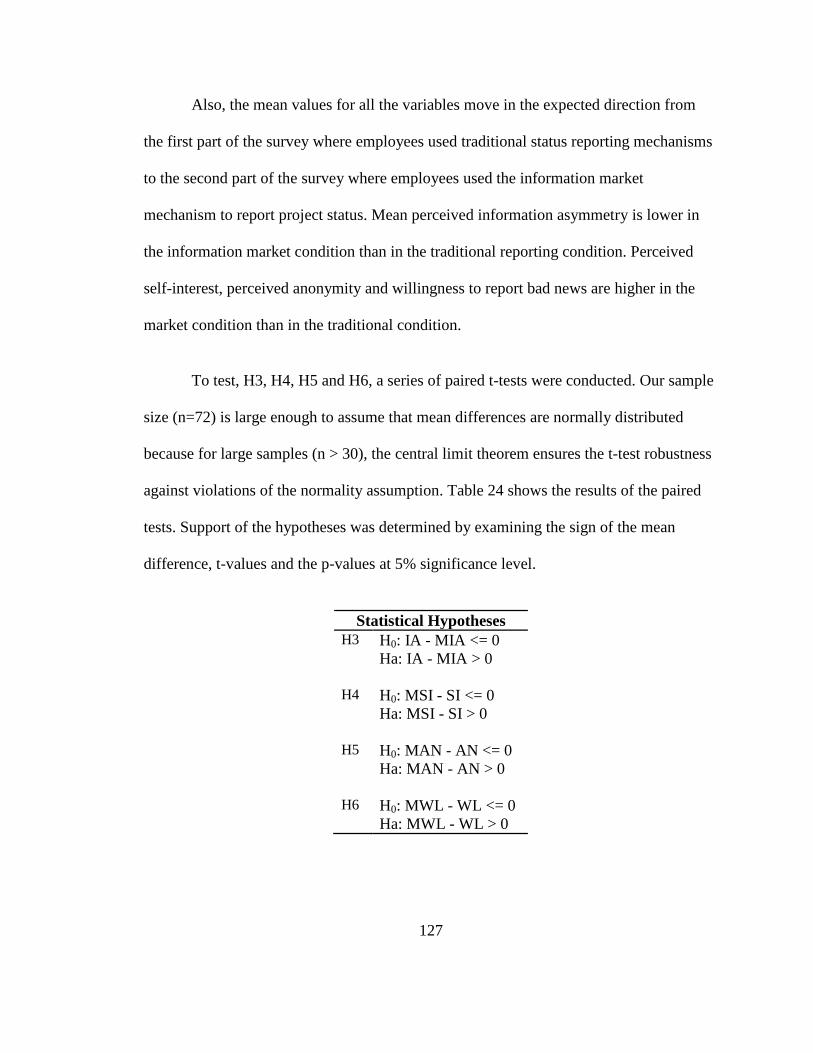
127
Also, the mean values for all the variables move in the expected direction from
the first part of the survey where employees used traditional status reporting mechanisms
to the second part of the survey where employees used the information market
mechanism to report project status. Mean perceived information asymmetry is lower in
the information market condition than in the traditional reporting condition. Perceived
self-interest, perceived anonymity and willingness to report bad news are higher in the
market condition than in the traditional condition.
To test, H3, H4, H5 and H6, a series of paired t-tests were conducted. Our sample
size (n=72) is large enough to assume that mean differences are normally distributed
because for large samples (n > 30), the central limit theorem ensures the t-test robustness
against violations of the normality assumption. Table 24 shows the results of the paired
tests. Support of the hypotheses was determined by examining the sign of the mean
difference, t-values and the p-values at 5% significance level.
Statistical Hypotheses
H3 H0: IA - MIA <= 0
Ha: IA - MIA > 0
H4 H0: MSI - SI <= 0
Ha: MSI - SI > 0
H5 H0: MAN - AN <= 0
Ha: MAN - AN > 0
H6 H0: MWL - WL <= 0
Ha: MWL - WL > 0
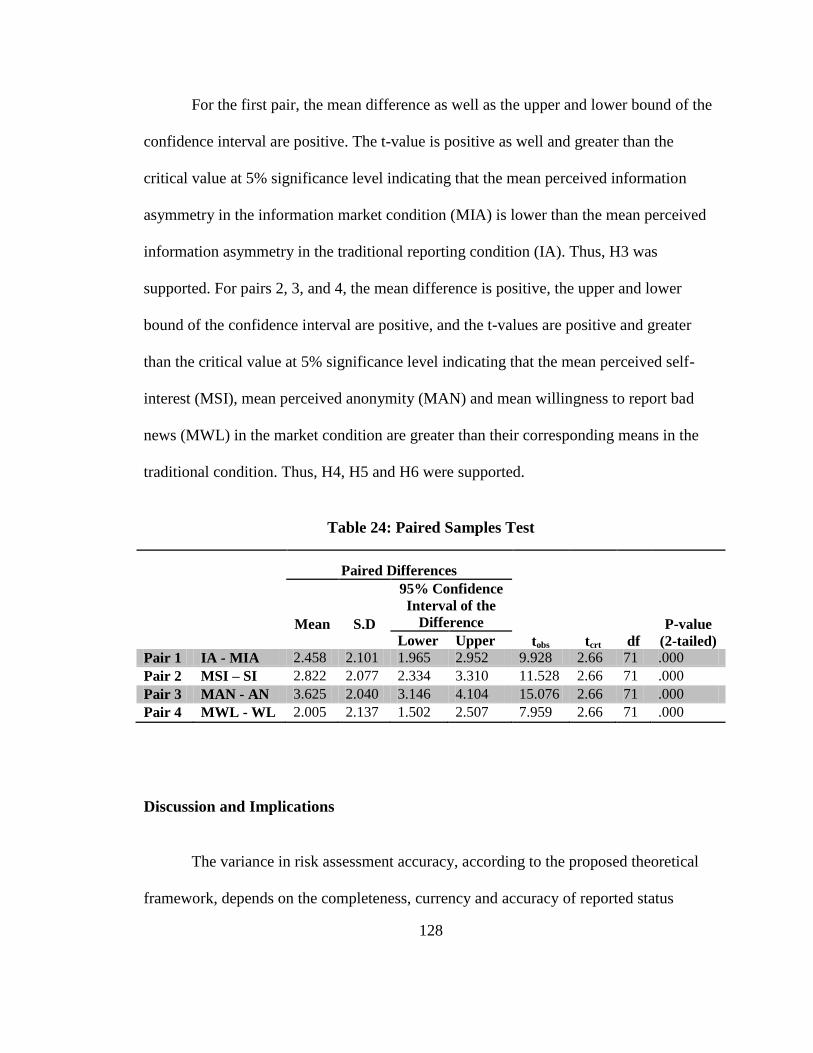
128
For the first pair, the mean difference as well as the upper and lower bound of the
confidence interval are positive. The t-value is positive as well and greater than the
critical value at 5% significance level indicating that the mean perceived information
asymmetry in the information market condition (MIA) is lower than the mean perceived
information asymmetry in the traditional reporting condition (IA). Thus, H3 was
supported. For pairs 2, 3, and 4, the mean difference is positive, the upper and lower
bound of the confidence interval are positive, and the t-values are positive and greater
than the critical value at 5% significance level indicating that the mean perceived self-
interest (MSI), mean perceived anonymity (MAN) and mean willingness to report bad
news (MWL) in the market condition are greater than their corresponding means in the
traditional condition. Thus, H4, H5 and H6 were supported.
Table 24: Paired Samples Test
Paired Differences
tobs tcrt df
P-value
(2-tailed)
Mean
S.D
95% Confidence
Interval of the
Difference
Lower Upper
Pair 1 IA - MIA 2.458 2.101 1.965 2.952 9.928 2.66 71 .000
Pair 2 MSI – SI 2.822 2.077 2.334 3.310 11.528 2.66 71 .000
Pair 3 MAN - AN 3.625 2.040 3.146 4.104 15.076 2.66 71 .000
Pair 4 MWL - WL 2.005 2.137 1.502 2.507 7.959 2.66 71 .000
Discussion and Implications
The variance in risk assessment accuracy, according to the proposed theoretical
framework, depends on the completeness, currency and accuracy of reported status
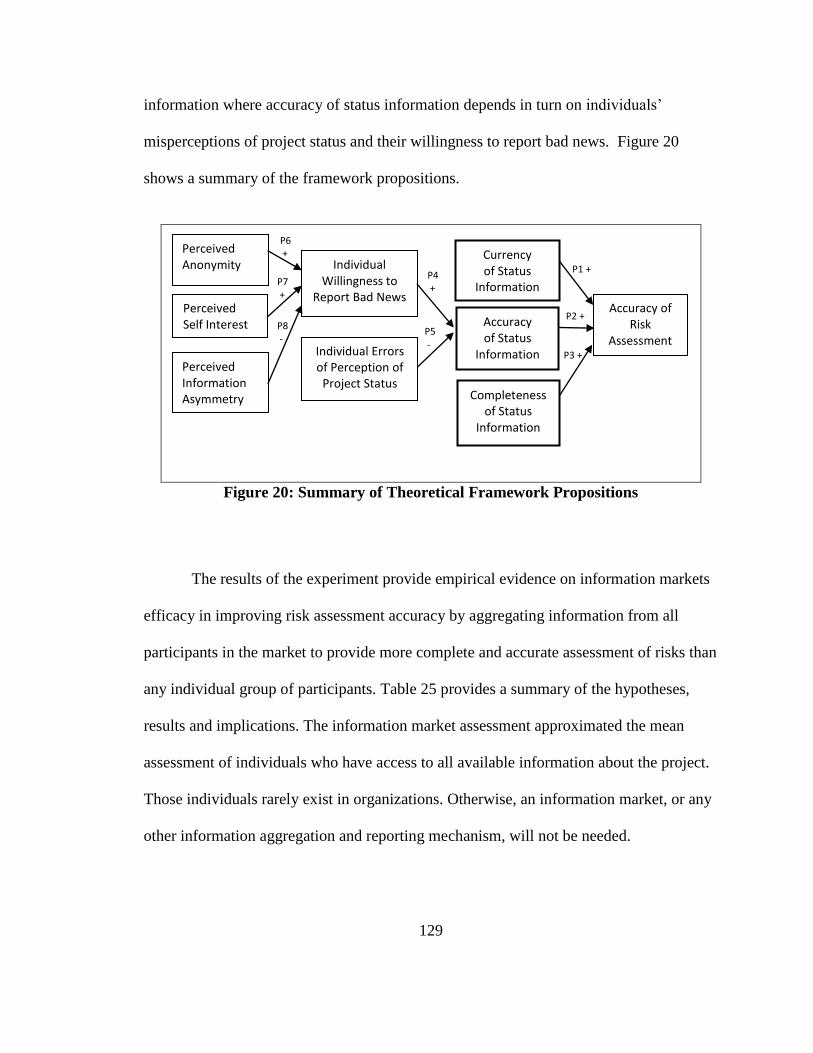
129
information where accuracy of status information depends in turn on individuals‘
misperceptions of project status and their willingness to report bad news. Figure 20
shows a summary of the framework propositions.
Figure 20: Summary of Theoretical Framework Propositions
The results of the experiment provide empirical evidence on information markets
efficacy in improving risk assessment accuracy by aggregating information from all
participants in the market to provide more complete and accurate assessment of risks than
any individual group of participants. Table 25 provides a summary of the hypotheses,
results and implications. The information market assessment approximated the mean
assessment of individuals who have access to all available information about the project.
Those individuals rarely exist in organizations. Otherwise, an information market, or any
other information aggregation and reporting mechanism, will not be needed.
+
+
Currency of Status
Information
Individual Willingness to
Report Bad News Accuracy of
Risk Assessment
Accuracy of Status
Information Individual Errors of Perception of
Project Status Completeness
of Status Information
P1 +
P2 +
P3 +
P4 +
P5 -
Perceived Anonymity
Perceived Self Interest
Perceived Information Asymmetry
P6 +
P7 +
P8 -
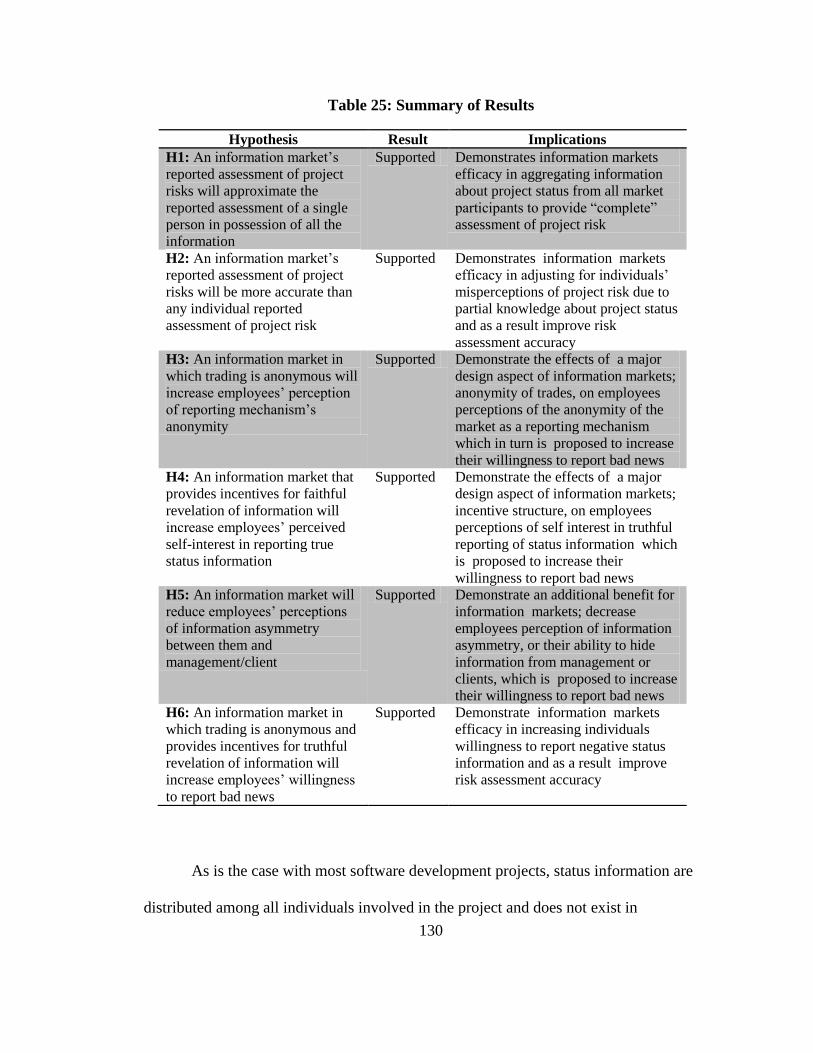
130
Table 25: Summary of Results
As is the case with most software development projects, status information are
distributed among all individuals involved in the project and does not exist in
Hypothesis Result Implications
H1: An information market‘s
reported assessment of project
risks will approximate the
reported assessment of a single
person in possession of all the
information
Supported Demonstrates information markets
efficacy in aggregating information
about project status from all market
participants to provide ―complete‖
assessment of project risk
H2: An information market‘s
reported assessment of project
risks will be more accurate than
any individual reported
assessment of project risk
Supported Demonstrates information markets
efficacy in adjusting for individuals‘
misperceptions of project risk due to
partial knowledge about project status
and as a result improve risk
assessment accuracy
H3: An information market in
which trading is anonymous will
increase employees‘ perception
of reporting mechanism‘s
anonymity
Supported Demonstrate the effects of a major
design aspect of information markets;
anonymity of trades, on employees
perceptions of the anonymity of the
market as a reporting mechanism
which in turn is proposed to increase
their willingness to report bad news
H4: An information market that
provides incentives for faithful
revelation of information will
increase employees‘ perceived
self-interest in reporting true
status information
Supported Demonstrate the effects of a major
design aspect of information markets;
incentive structure, on employees
perceptions of self interest in truthful
reporting of status information which
is proposed to increase their
willingness to report bad news
H5: An information market will
reduce employees‘ perceptions
of information asymmetry
between them and
management/client
Supported Demonstrate an additional benefit for
information markets; decrease
employees perception of information
asymmetry, or their ability to hide
information from management or
clients, which is proposed to increase
their willingness to report bad news
H6: An information market in
which trading is anonymous and
provides incentives for truthful
revelation of information will
increase employees‘ willingness
to report bad news
Supported Demonstrate information markets
efficacy in increasing individuals
willingness to report negative status
information and as a result improve
risk assessment accuracy
131
concentrated form. Management as well as the clients relies on traditional project
management techniques such as status reports and periodic meetings to monitor the status
of the project and to check on its progress. However, traditional monitoring and reporting
techniques have proven ineffective time and time again due to employees misperceptions
of true project status and their reluctance to report negative information.
The results of the experiment prove that information markets can adjust for
individuals‘ risk perception errors due to incomplete information about the true status of
the project. Market assessment of project risk proved to be more accurate than any
individual group of people with access to incomplete information about the project.
Additionally, the results provide evidence on information markets efficacy in increasing
individual willingness to report negative status information via the market, and
consequently improving the accuracy of the market generated assessment of project risks.
Information markets ability to increase individual willingness to report bad news
can be attributed to major design features of information markets such as anonymity of
trades and incentive structures. Markets offer anonymity and provide incentives for
honest reporting. The results of the experiment showed a significant increase in
individuals‘ perceived self-interest in reporting true status information and in their
perceived anonymity of the market reporting mechanism.
Further, an information market is proven to decrease employees‘ perception of
information asymmetry, or in other words, their perceived ability to hide information
from management/clients. Information markets efficiency in responding to updates and
132
their proven ability to collect all available information about an event are believed to be
the driving reasons behind the observed significant decrease in individuals‘ perception of
information asymmetry.
These results have important theoretical and practical implications. At the
conceptual level, the decreased information asymmetry suggest that regardless of
information markets‘ predictive accuracy, their mere existence in the organization might
have a psychological impact that levels the playing field between management or clients
and employees. As a result an information market can also increase employees‘
willingness to report bad news via other more traditional reporting mechanisms, and
consequently improve risk assessment accuracy.
Perhaps information markets‘ indirect positive effects on transparency of
communications might encourage some organizations to adopt them more than the
market‘s actual assessment accuracy. Also, markets may prove to be invaluable in
minimizing software projects‘ chances of failure particularly in organizations where
reporting of negative status information are not encouraged. By providing early warning
signals about risks, markets can assume the difficult task of ―blowing the whistle‖ on
challenged projects.
Limitations
Although laboratory experiments provide high degrees of internal validity and
control, they provide lower degrees of external validity compared to field studies. To
133
improve generalizability of the results, the experimental information aggregation task
used in this study was based on a realistic business scenario. However, the scenario and
the progress updates that were distributed to participants throughout the experiment were
manipulated to achieve high degree of control over the information structure that will
allow us to test the market efficacy in aggregating information, and to investigate its
effect on the market assessment of risk.
In organizations the actual distribution of information among employees might
not be as clear, and there might be other context-specific or extraneous variables, such as
internal communication sharing channels between market participants that affect the
market generated assessment that have not been investigated or accounted for in this
study.
Additionally, the survey measured behavioral intentions rather than actual
behavior, and was manipulated to measure employees‘ willingness to report negative
status information under certain conditions. The focus on few variables allowed us to
investigate the impact of certain market design features on participants‘ perceptions and
consequently their behavioral decision to report negative information. The goal was to
shed light on some important factors that can improve the accuracy of risk assessment by
increasing employees‘ willingness to report bad news, and at the same time, can be
controlled by organizations, such as anonymity and incentives. However, there might be
other factors that can be controlled by organizations that we did not investigate here.
134
Control of treatment conditions provided high internal validity that allowed us to
examine causal relationships by measuring the difference in participants‘ perceptions of
information asymmetry, anonymity and self-interest caused by the information market
treatment. Anonymous market trading proved to increase employees‘ perception of the
anonymity of the reporting mechanism. However, in organizations, markets might not be
perceived as anonymous reporting mechanisms even when trading is.
Depending on the forecasting goal and the size of the organization, traders in the
market might not feel that their identities are protected because of the specialized
knowledge they have about the project. So if small number of employees has access to
status information about a certain objective, their trades in the market might be identified
even when their real names are not attached to their trades. Thus, caution must be taken
when generalizing this result to some organizations because perception of anonymity
might be moderated by the size of the organization and employees‘ job responsibilities.
Having said that, the market can still improve their willingness to report negative
information because of the incentives it offers for truthful reporting, and the market
effects on their perceptions of information asymmetry.
Contributions and Future Directions
This research makes several contributions to the software project risk
management literature. First, it develops a theoretical framework for the determinants of
risk assessment accuracy. This framework broadens our perspective by focusing on

135
important but under-investigated attributes of information that directly impact the
accuracy of risk assessment, such as information currency and completeness.
Second, it proposes an innovative technology-based information market solution
to risk assessment problems to improve the accuracy, currency and completeness of
reported project status information and consequently the accuracy of risk assessment.
Third, it evaluates the efficacy of the proposed solution by conducting two
controlled experiments. The risk assessment experiment provides a closer look at
information aggregation and dissemination in information markets by using a realistic
information structure and business scenario.
The results of the experiments highlight an additional benefit for information
markets besides their anonymity and incentives, which is the ability to influence
participants‘ perceptions of information asymmetry. This effect can be very useful to
organizations if utilized properly. The results also provide evidence to the market
effectiveness in improving software risk assessment accuracy, by improving the currency,
accuracy and completeness of reported status information, which will consequently
reduce software projects chances of failure and save organizations billions of dollars.
Fourth, this research develops and validates measures for several important
constructs such as perceived self-interest in reporting bad news and perceived anonymity
of reporting mechanism. It also re-validates modified versions of existing measures such
as willingness to report bad news and perceived information asymmetry.
136
Finally, this research highlights the importance and impacts of three variables
derived from agency theory on employees‘ willingness to report bad news. These
variables are information asymmetry, self-interest and anonymity. The difference
between our proposed conceptual model of willingness to report bad news (Figure 17)
and existing models in the literature is that it focuses our attention on factors that not only
impact willingness but also can be adjusted and controlled by organizations. The
proposed information market solution is proven to decrease employees‘ perception of
information asymmetry, and to increase their perception of the anonymity of the
reporting mechanism and their perceived self-interest in reporting negative status
information.
Future research should investigate the impact of these three factors individually
on individuals‘ willingness to report bad news. It should also seek to identify other
factors that can be adjusted by organizations or influenced by the use of technology.
Future research should investigate the impact of different information structures on
market generated assessment of risk, and then test information market effectiveness in
improving risk assessment accuracy in the field.
137
Chapter Five
Summary and Future Directions
Information markets are a form of futures markets whose primary purpose is to
aggregate disparate information which is expensive to collect using other commonly used
methods. Participants in the market trade contracts that payoff depending on the
outcomes of future event. Contract prices can be interpreted as a forecast of the event
probability and can be used by organizations to support a wide variety of decisions.
Despite the corporate world‘s enthusiasm for information markets, the
relationship between markets and organizations has not been fully investigated yet. There
are many open questions and unknowns when it comes to the design and use of markets
in a business environment. Markets are fundamentally technology-enabled information
systems designed to provide efficient and effective solutions to identified business
problems, such as forecasting, information aggregation and decision making under
uncertainty.
Technology is limited to the hardware and the software components of the
market, and the information system encompasses the design, development,
implementation, and use processes of the market, as well as the dynamic interaction
between the market, people, and its environment to accomplish a certain task. This
138
dissertation employs two theoretical perspectives to investigate the relationship between
information markets as IT artifacts and their context of use.
Systems thinking framework (Checkland, 1981) is employed to develop a systems
theory of information markets to facilitate investigation of the relationships and
interactions between markets as systems and their context of use. An information market
is viewed as a subsystem of the organization system in which it is used. The organization
in turn operates within an industry, all of which operates in the largest system of all: the
world.
An information market encapsulates the aggregation system and its emergent
properties or the ―intelligence‖ stored in the market, along with the market incentives and
contracts structures, and produces an emergent property that makes the market larger than
the sum of its parts; collective intelligence in form of equilibrium price. Each system
engages in a process of cybernetic information exchange with its environment and has its
own ways of responding to and communicating with the system in which it operates, as
well as with other systems. A systems theory of information markets allow us to choose
design and use processes that result in better long term benefits to organizations in light
of existing interactions and interrelationships between the market and its subsystems,
such as the aggregation mechanism and the incentives structure, and the bigger system(s)
in which it operates, such as the organization and its various departments and the
industry.
139
The second theoretical perspective is structuration theory (Giddens, 1979, 1984).
This research proposes a structuration model for design and use of IT artifacts in
organizations and applies it to the study of information markets. The context in which the
market operates shapes the market objectives and all aspects of market design. There is a
recursive relationship between market objectives, design, use and context of use, each
shaping the other iteratively.
Just like any other information and communication technology, market success
depends on users‘ abilities to effectively use it, and on the market‘s abilities to satisfy
users‘ needs. The business environment imposes unique challenges on the market design.
Thus, we propose that the design of information markets, market interfaces, and
visualizations be driven by three factors: (1) Market users –Who; (2) Use motivation –
Why; and (3) Market information –What.
This dissertation develops a multidimensional framework of market users to guide
market design to satisfy users‘ motivational and informational needs. The framework
classifies users according to three dimensions: 1) knowledge level in the issues being
forecasted, as informed or uninformed users; 2) participation level in market trading, as
active or passive users; and 3) externality level to the department/organization at which
the market operates, as internal or external users.
Each group of market users has its own motivational needs and goals that can be
satisfied using different information and market designs. Thus, information markets,
market interfaces, and information visualizations can be designed specifically to target
140
and attract any group of users depending on careful analysis of their motivations and
needs. Thus, uninformed traders who are needed for markets to function properly can be
attracted using markets designs that are intuitive, enjoyable, induce positive emotions that
affect users‘ desire to use the system, and most importantly, they should be perceived as
fun, entertaining, and to some degree ―safe‖.
This research extends Giddens‘ structuration theory (Giddens, 1979, 1984),
adaptive structuration theory (AST) (DeSanctis and Poole, 1994), and the structuration
model of technology (Orlikowski, 1992), by moving beyond the traditional structuration
process and the recursive relationship between technology and action that defines the
relationship between technology and organizations, to consider technology as a catalyst
for organization change and development. The structuration cycle is viewed as a
continuous change process that objectifies changeability as an organizational permanent
structure that leads to the ultimate goal of the structuration process of IT artifacts:
organization development (OD).
A well-designed information market can generate several benefits to
organizations which contribute to their growth and development. Software development
organizations are in desperate need of better risk management tools due to their role in
reducing software project chances of failure. This dissertation develops a theoretical
framework for the determinants of software project risk assessment accuracy and
proposes an information market design solution to help organizations better assess
141
software project risks. It evaluates the information market efficacy in increasing risk
assessment accuracy using two controlled experiments.
The first experiment compares the market generated assessment of risk for a given
software project to the mean assessment of a group of individuals with access to all
available information about the project. The results showed that the market assessment of
risks approximated the mean assessment of the group demonstrating the market efficacy
in aggregating available information about the project from all market participants to
provide an assessment based on ―complete‖ information about the project status which
leads to higher accuracy of risk assessment.
It also compares the market generated assessment of risk to the mean assessment
of four groups of individuals each of whom has access to partial information about the
project status. The results showed that the market assessment of risk is more accurate
than the assessment generated by any of the groups demonstrating the market efficacy in
adjusting for individuals‘ errors of perception of project risk due to their incomplete
information about its status.
The second experiment focuses on three factors derived from agency theory that
can be ―controlled‖ by organizations or influenced by the use of technology and are
proposed to impact individuals‘ willingness to report negative status information, and as
a result, the accuracy of reported status and risk assessment. These factors are
information asymmetry between employees and management/clients, anonymity of the
reporting mechanism, and self-interest in truthful reporting.
142
The results of the experiment demonstrated the effectiveness of major design
features of information markets, such as the incentive structure and anonymity of trades,
in influencing participants‘ perceptions of (1) information asymmetry between them and
management/clients, (2) market anonymity as a reporting mechanism, and (3) self-
interest in truthful reporting. The results also demonstrated the market efficacy in
increasing participants‘ willingness to report negative status information, and as a result
increasing the accuracy of reported status and risk assessment.
Future research should investigate the impact of these three factors idependently
on an individual‘s willingness to report bad news. It should also seek to identify other
factors that can be adjusted by organizations or influenced by the use of technology.
Future research should investigate the impact of different contracts, incentive
structures and market mechanisms such as pari-mutuel, continuous double auction, and
market scoring rules on the market‘s assessment accuracy. It should also investigate the
impact of different information structures on market generated assessments of risk, and
then test information market effectiveness in improving risk assessment accuracy in the
field.
This dissertation suggests other fruitful areas of research. There is a great need for
studies that empirically compare information markets to other methods of information
aggregation, such as the Delphi method, not only in terms of forecasting accuracy but
also on multiple other dimensions, such as the nature of the forecasting problems
appropriate for each method, sources of relevant information (e.g. external, internal, or a
143
mix of both), the availability of public information to attract participants, the availability
of experts in certain areas, and the costs involved in recruiting experts, acquiring the
market, training, trading time and incentives.
Further, there is a need for studies that investigate the structuration and
appropriation processes of information markets in organization where markets are used as
an intervention to induce organizational change and development. Additionally, there is a
need for research that seeks to characterize the decision making and cognitive processes
involved in analyzing and using market information, from both the trader and the
decision maker perspectives. Research is also needed on the design of effective market
interfaces that meet users‘ motivational and informational needs.
144
List of References
Abdel-Hamid, T. K. and Madnick, S. E. (1991) Software Project Dynamics: An
Integrated Approach, Englewood Cliffs, NJ, Prentice-Hall.
Abdel-Hamid, T. K., Sengupta K. and Ronan, D. (1993) Software project control: An
experimental investigation of judgment with fallible information, IEEE Trans.
Software Eng. 19, 6, 603-612.
Almenberg, J., Kittlitz, K. and Pfeiffer, T. (2009) An experiment on prediction markets in
science, PLoS ONE, 4, 12, e8500.
Alter, S. and Ginzberg, M. (1978) Managing uncertainty in MIS implementation, Sloan
Management Review, 20, 1, 23-31.
Armstrong, J. S. (2001) Principles of Forecasting: A Handbook for Researchers and
Practitioners, Kluwer Academic Publisher, Amsterdam.
Armstrong, J. S. (2006) How to make better forecasts and decisions: Avoid face-to-face
meetings, Foresight, 5, 3-8.
Atkinson, R. (1999) Project management: Cost, time and quality, two best guesses and a
phenomenon, it's time to accept other success criteria, International Journal of
Project Management, 17, 6, 337-342.
Aumann, R. J. (1976) Agreeing to disagree, Annals of Statistics, 4, 6, 1236-1239.
Bapna, R., Jank, W. and Shmueli, G. (2008) Price formation and its dynamics in online
auctions, Decision Support Systems, 44, 3, 641-656.
Barki, H., Rivard, S. and Talbot, J. (1993) Toward an assessment of software
development risk, Journal of Management Information Systems, 10, 2, 203-225.
Bearden, W. O., Netemeyer, R. G. and Mobley, M. F. (1993) Handbook of Marketing
Scales, Sage Publications, Newbury Park, CA.
145
Beckhard, R. (1969) Organization Development: Strategies and Models, Reading,
Addison- Wesley, MA.
Benbasat, I. and Zmud, R. W. (2003) The Identity Crisis Within the IS Discipline
Defining and Communicating the Discipline‘s Core Properties, MIS Quarterly,
27, 2, 183-194.
Berg, J. E., Forsythe, R., Nelson, F. D. and Rietz, T. A. (2003) Results from a dozen
years of election futures markets research, forthcoming in C.R. Plott and V. Smith
(Eds) Handbook of Experimental Economic Results, North Holland, Amsterdam.
Berg, J., Nelson, F. and Rietz, T. (2008) Prediction market accuracy in the long run,
International Journal of Forecasting, 24, 283-298.
Berg, J. E. and Rietz, T. A. (2003) Prediction markets as decision support systems,
Information Systems Frontiers, 5, 1, 79–93.
Berndt D. J., Jones J. L. and Finch D. (2006) Milestone markets: Software cost estimation
through market trading, The 39th Hawaii International Conference on System
Sciences (HICSS), Hawaii, January 4-7.
Boehm, B. W. (1991) Software risk management: Principles and practices, IEEE
Software, 8, 1, 32-41.
Boehm, B. W. and Ross, R. (1989) Theory-W software project management: Principles
and examples, IEEE Transactions on Software Engineering, 15, 7, 902-916.
Charette, R. N. (1989) Software Engineering Risk Analysis and Management, Third ed.,
McGraw-Hill, New York.
Checkland, P. (1981) Systems Thinking, Systems Practice, John Wiley & Sons, New
York.
Checkland, P. (1999) Systems thinking, In Currie W. L. and R. D. Galliers (Eds.),
Rethinking Management Information Systems: An Interdisciplinary Perspective,
Oxford, UK: Oxford University Press.
Chen, K.-Y., Fine, L. R. and Huberman, B. A. (2001) Forecasting uncertain events with
small groups, Proceedings of 3rd ACM conference on Electronic Commerce,
October 14 -17, Tampa, FL, USA, 58-64.
146
Chen, K.-Y. and Plott, C. R. (2002) Information aggregation mechanisms: Concept,
design and implementation for a sales forecasting problem, Social Science
Working Paper No.1131, California Institute of Technology, Pasadena.
Chin, W. (1998) The partial least squares approach for structural equation modeling, In
G. A. Marcoulides (Ed.), Modern Methods for Business Research, Lawrence
Erlbaum Associates, Mahwah, NJ, 295-336.
Clark, J. (2007) Emotional errors, Journal of Personal Finance, 5, 4, 12.
Cowgill, B., Wolfers, J. and Zitzewitz, E. (2008) Using prediction markets to track
information flows: Evidence from Google,
(http://www.bocowgill.com/GooglePredictionMarketPaper.pdf.)
Davis, G. B. (1982) Strategies for information requirements determination, IBM Systems
Journal, 21, 1, 4-30.
Davis, G. and Olson, M. (1985) Management Information Systems: Conceptual
Foundations, Structure and Development, Second Ed., McGraw-Hill, Boston,
MA.
Dennis, A. R., Heminger, A. R., Nunamaker, J. F. and Vogel, D. R. (1990) Bringing
automated support to large groups: the Burr–Brown experience, Information and
Management, 18, 111-121.
Dennis, A. R., Tyran, C. K., Vogel, D. R. and Nunamaker, J. F. (1997) Group support
systems for strategic planning, Journal of Management Information Systems, 14,
1, 155-184.
DeSanctis, G., Poole, M. S. (1994) Capturing the complexity in advanced technology use:
Adaptive structuration theory, Organization Science, 5, 2, 121-147.
Dozier, J. B. and Miceli, M. P. (1985) Potential predictors of whistle-blowing: A
prosocial behavior perspective, Academy of Management Review, 10, 4, 823-836.
Dynamic Markets Limited (2007) IT Projects: Experience Certainty, Independent Market
Research Report, Dynamic Markets Limited, August 2007.
The Economist (2007) The future of futurology, The Economist, 30 December 2007.
147
Eisenhardt, K. M. (1989) Agency theory: An assessment and review, Academy of
Management Review, 14, 1, 57-74.
Eliashberg, J. and Sawhney, M. S. (1996) A parsimonious model for forecasting gross
box-office revenues of motion pictures, Marketing Science, 15, 2, 113-131.
Fama, E. (1965a) The behavior of stock market prices, Journal of Business, 38, 1, 34–
105.
Fama, E. (1965b) Random walks in stock market prices, Financial Analysts Journal, 21,
5, 55–59.
Fama, E. (1970) Efficient capital markets: A review of theory and empirical work,
Journal of Finance, 25, 2, 383-417.
Fjermestad, J. and Hiltz, S. R. (1998) An assessment of group support systems
experimental research: Methodology and results, Journal of Management
Information Systems, 15, 3, 7-149.
Fjermestad, J. and Hiltz, S. R. (2001) Group support systems: A descriptive evaluation of
case and field studies, Journal of Management Information Systems, 17, 3, 115-
159.
Fornell, C. and Larcker, D. F. (1981) Evaluating structural equation models with
unobservable variables and measurement error, Journal of Marketing Research,
18, 39-50.
Forsythe, R. and Lundholm, F. (1990) Information aggregation in an experimental
market, Econometrica, 58, 309–347.
Forsythe, R., Nelson, F. D., Neumann, G. R. and Wright, J. (1992) Anatomy of an
experimental political stock market, American Economic Review, 82, 1142–1161.
Forsythe, R., Rietz, T. A. and Ross, T. W. (1999) Wishes, Expectations and Actions:
Price Formation in Election Stock Markets, Journal of Economic Behavior and
Organization, 39, 83-110.
Fox, J. (2002) Is the market rational? No, say the experts. But neither are you--so don't go
thinking you can outsmart it, Fortune, December 9.

148
French, W. and Bell, C. (1990) Organization Development: Behavioral Science
Interventions for Organization Improvement, Prentice-Hall, Englewood Cliffs,
N.J.
Gartner (2008) Hype cycle for social software, Gartner Research, Number: G00158239
Gibson, J. J. (1977) The theory of affordances. In R. Shaw & J. Bransford (eds.),
Perceiving, Acting and Knowing. Hillsdale, NJ: Erlbaum.
Giddens, A. (1979) Central Problems in Social Theory, London, UK, Macmillan.
Giddens, A. (1984) The Constitution of Society: Outline of the Theory of Structuration,
Cambridge, UK, Polity Press.
Green, K., Armstrong, J. S. and Graefe, A. (2007) Methods to elicit forecasts from
groups: Delphi and prediction markets compared, Foresight: The International
Journal of Applied Forecasting, International Institute of Forecasters, 8, 17-20.
Grossman, S. J. and Stiglitz, J. E. (1976 ) Information and competitive price systems, The
American Economic Review, 66, 2, 246-253.
Hahn, R. W. and Tetlock, P. C. (2006) Introduction to information markets, in
Information Markets: A New Way of Making Decisions in the Public and Private
Sectors, Paul Tetlock and Robert Litan (eds.), AEI-Brookings Joint Center,
Washington, D.C.
Hansen, J., Schmidt, C. and Strobel, M. (2004) Manipulation in political stock markets:
Preconditions and evidence, Applied Economics Letters, 11, 459-463.
Hanson, R. (1992) Idea futures: Encouraging an honest consensus, Extropy, 3, 2, 7-17.
Hanson, R. (1999) Decision markets, IEEE Intelligent Systems, 14, 16-19.
Hanson, R. (2003) Combinatorial information market design, Information Systems
Frontiers, 5, 1, 107-119.
Hanson, R. (2007) Logarithmic market scoring rules for modular combinatorial
information aggregation, Journal of Prediction Markets, 1, 1, 1–15.
Hanson, R. and Oprea, R. (2004) Manipulators increase information market accuracy,
George Mason University Working Paper.
149
Hanson, R., Oprea, R. and Porter, D. (2006) Information aggregation and manipulation in
an experimental market, Journal of Economic Behavior and Organization, 60,
449-459.
Harrell, A. and Harrison, P. (1994) An incentive to shirk, privately held information, and
managers‘ project evaluation decisions, Accounting, Organizations and Society,
19, 7, 569–577.
Hayek, F. A. (1945) The use of knowledge in society, American Economic Review, 35,
519-530.
Hess, A. C. (1972) Experimental evidence on price formation in competitive markets,
The Journal of Political Economy, 80, 2, 375-385.
Hevner, A. R., March, S. T., Park, J. and Ram, S. (2004) Design science in information
systems research, MIS Quarterly, 28, 1.
Hopman, J. W. (2007) Using forecast markets to manage demand risks, Intel Technology
Journal, 11, 2, 127-135.
Jones, C. (1994) Assessment and Control of Software Risks, Yourdon Press Prentice
Hall, Upper Saddle River, NJ.
Jones J. L., Collins R. W. and Berndt, D. J. (2009) Information markets: A research
landscape, Communications of the Association for Information Systems (CAIS),
25, 289-304.
Jones, M. R. and Karsten, H. (2008) Gidden's structuration theory and information
systems research, MIS Quarterly, 32, 1, 127-157.
Keil, M. (1995) Pulling the plug: Software project management and the problem of
project escalation, MIS Quarterly, 19, 4, 421-447.
Keil, M., Cule, P. E., Lyytinen, K. and Schmidt, R. C. (1998) A framework for
identifying software project risks, Communications of the ACM, 41, 11, 76-83.
Keil, M. and Robey, D. (1999) Turning around troubled software projects: An
exploratory study of the deescalation of commitment to failing courses of action,
Journal of Management Information Systems, 15, 4, 63-87.
150
Keil, M. and Robey, D. (2001) Blowing the Whistle on Troubled Software Projects,
Communications of the ACM, 44, 4, 87-93.
Keil, M., Smith, H. J., Pawlowski, S. and Jin, L. (2004) ‗Why didn't somebody tell me?‘:
Climate, information asymmetry, and bad news about troubled projects, The
DATABASE for Advances in Information Systems (ACM), 35, 2, 65-84.
King, R. (2006) Workers, place your bets, BusinessWeek, August 3.
Lewin, K. (1946) Action research and minority problems, The Journal of Social Issues, 2,
4, 34-46.
Liu, X. F., Kane, G. and Bambroo, M. (2006) An intelligent early warning system for
software quality improvement and project management, The Journal of Systems
and Software, 79, 1552–1564.
Luhn, H. P. (1958) A business intelligence system, IBM Journal of Research and
Development, 2, 4, 314-9.
Lyytinen, K. and Hirschheim, R. A. (1987) Information systems failures: A survey and
classification of the empirical literature, Oxford Surveys in Information
Technology, 4, 257-309.
Lyytinen, K., Mathiassen, L. and Ropponen, J. (1998) Attention shaping and software
risk—A categorical analysis of four classical risk management approaches,
Information System Research, 9, 3, 233-255.
Mahaney R. C. and Lederer, A. L. (2003) Information systems project management: An
agency theory interpretation, The Journal of Systems and Software, 68, 1-9.
Malkiel B. G. (1996) A Random Walk Down Wall Street, W.W. Norton and Company,
New York, NY.
Malone, T. W. (1982) Heuristics for designing enjoyable user interfaces: Lessons from
computer games, Conference on Human Factors in Computer Systems (CHI),
ACM, Gaithersburg, MD, March 15-17, 1982.
Malone, T. W. (1985) Designing organizational interfaces, Conference on Human Factors
in Computer Systems (CHI), ACM, 66-71.
151
March, S. and Hevner, A. (2007) Integrated decision support systems: A data
warehousing perspective, Decision Support Systems 43, 3, 1031-1043.
March, S. and Smith, G. (1995) Design and natural science research on information
technology, Decision Support Systems, 15, 251-266.
McConnell, S. (1996) Rapid Development: Taming Wild Software Schedules, Microsoft
Press.
McFarlan, F. W. (1981) Portfolio approach to information systems, Harvard Business
Review, 59, 5, September/October, 142-150.
Milgrom, P. and Stokey, N. (1982) Information, trade and common knowledge, Journal
of Economic Theory, 26, 1, 17-27.
Moynihan, T. (1996) An inventory of personal constructs for information systems project
risk researchers, Journal of Information Technology, 11, 359-371.
Moynihan, T. (1997) How experienced project managers assess risk, IEEE Software,
May/June, 35–41.
Muth, J. (1961) Rational expectations and the theory of price movements, Econometrica,
29, 6, 315-35.
Negash, S. (2004) Business intelligence, Communications of the Association for
Information Systems, 13, 177-95.
Noeth, M., Camerer, C. F., Plott, C. R. and Webber, M. (1999) Information aggregation
in experimental asset markets: Traps and misalligned beliefs, Tech. rep. 1060,
California Institute of Technology.
Norman, D. A. (1999) Affordance conventions, and design, Interactions 6, 3, 38-43.
Norman, D. A. (2004) Emotional Design: Why We Love (or Hate) Everyday Things,
Basic Books, New York, NY.
Oliven, K. and Rietz, T. A. (2004) Suckers are born but markets are made: Individual
rationality, arbitrage, and market efficiency on an electronic futures market,
Management Science, 50, 3, 336-351.
152
Orlikowski, W. (1992) The duality of technology: Rethinking the concept of technology
in organizations, Organization Science, 3, 3, 398-427.
Orlikowski, W. and Iacono, S. (2001) Desperately seeking the ‗IT‘ in IT research—A call
to theorizing the IT artifact, Information Systems Research, 12, 2, 121-134.
Ortner, G. (1997) Forecasting markets: An industrial application I, Mimeo, Technical
University of Vienna.
Ortner, G. (1998) Forecasting markets: An industrial application II, Mimeo, Technical
University of Vienna.
Oz, E. (1994) When professional standards are lax: The CONFIRM failure and its
lessons, Communications of the ACM, 37, 10, 29-36.
Park, C. W. and Keil, M. (2009) Organizational silence and whistle-blowing on IT
projects: An integrated model, Decision Sciences, 40, 4, 901-918.
Park, C. W., Keil, M. and Kim, J. (2009) The effect of it failure impact and personal
morality on it project reporting behavior, IEEE Transactions on Engineering
Management (IEEE-TEM), 56, 1, 45-60.
Pennock, D.M. (2004) A Dynamic pari-mutuel market for hedging, wagering, and
information aggregation, Proceedings of the 5th ACM conference on Electronic
Commerce, May 17-20, New York, NY, USA, 170-179.
Plott, C. R. (2000) Markets as information gathering tools, Southern Economic Journal,
67, 2-15.
Plott, C. R. and Sunder, S. (1982) Efficiency of experimental security markets with
insider information: An application of rational expectations models, Journal of
Political Economy, 90, 663–698.
Plott, C. R. and Sunder, S. (1988) Rational expectations and the aggregation of diverse
information in laboratory security markets, Econometrica, 56, 1085-1118.
Poole, M. S. and DeSanctis, G. (1990) Understanding the use of group decision support
systems: The theory of adaptive structuration, In J. Fulk & C. Steinfeld (eds.),
Organizations and Communication Technology, Newbury Park, Ca: Sage.
153
Poole, M. S. and DeSanctis, G. (1992) Microlevel structuration in computer-supported
group decision-making, Human Communication Research, 19, 1, 5-49.
Poole, M. S. and DeSanctis, G. (2004) Structuration theory in information systems
research: Methods and controversies, in The Handbook for Information Systems
Research, M. E. Whitman and A. B. Wosczynski (eds.), 206-249.
Project Management Institute (2004) A Guide to the project management body of
knowledge, Newtown Square, PA, Project Management Institute.
Ramsay, J. O. and Dalzell, C. (1991) Some tools for functional data analysis (with
discussion), Journal of the Royal Statistical Society, 53, 539-572.
Reeve, J. (2005) Understanding motivation and emotion. John Wiley & Sons, Inc., New
York, NY.
Rhode, P. W. and Strumpf, K. S. (2004) Historical presidential betting markets, The
Journal of Economic Perspectives, 18, 127-141.
Rhode, P. W. and Strumpf, K. S. (2006) Manipulating political stock markets: A field
experiment and a century of observational data, Working Paper, University of
North Carolina.
Ropponen, J. and Lyytinen, K. (2000) Components of software development risk: How to
address them? A project manager survey, IEEE Transactions on Software
Development, 26, 2, 98-112.
Rosenberg, B., Reid, K., Lanstein, R. (1985) Persuasive evidence of market inefficiency,
Journal of Portfolio Management, 13, 9-17.
Rowe, G. and Wright, G. (1999) The Delphi technique as a forecasting tool: Issues and
analysis, International Journal of Forecasting, 15, 4, 353-375.
Rubinstein, D. (2007) Standish group report: There‘s less development chaos today,
Software Development Times, March 1, 2007,
(http://www.sdtimes.com/article/story-20070301-01.html), accessed August 30,
2009.
Schonfeld, E. (2006) Why gambling at the office pays, Business 2.0 Magazine, 7, 8, Sep
1.
154
Senge, P. (1990) The Fifth Discipline: The Art And Science Of The Learning
Organization, New York, NY.
Servan-Schreiber, E. (2008) Prediction markets: Trading uncertainty for collective
wisdom, forthcoming in Hélène Landemore and Jon Elster Collective Wisdom,
Paris, France.
Servan-Schreiber, E., Wolfers, J., Pennock, D. M. and Galebach, B. (2004) Prediction
markets: Does money matter?, Electronic Markets, 14, 3, 243–251.
Shenhar, A., Levy, O. and Dvir, D. (1997) Mapping the dimensions of project success,
Project Management Journal, 28, 2, 5-13.
Simon, H. A. (1996) The Sciences of the Artificial, (3rd ed.), Cambridge, MA, MIT
Press.
Smith, A. (1976) Wealth of Nations, Oxford: Clarendon.
Smith, H. J. and Keil, M. (2003) The reluctance to report bad news on troubled software
projects: A theoretical model, Information Systems Journal, 13, 69-95.
Smith, H. J., Keil, M. and Depledge, G. (2001) Keeping Mum as the Project Goes Under:
Towards an Explanatory Model, Journal of Management Information Systems, 18,
2, 189-228.
Snow, A. and Keil, M. (2002) The Challenge of accurate software project status
reporting: A two-stage model incorporating status errors and reporting bias, IEEE
Trans. on Engineering Management, 49, 4, 491-504.
Spann, M. and Skiera, B. (2003) Internet-based virtual stock markets for business
forecasting, Management Science, 49, 1310-1326.
Sunder, S. (1992) Market for information: Experimental evidence, Econometrica 60, 667-
695.
Sunder, S. (1995) Experimental asset markets: A survey, in JH Kagel and AE Roth, eds,
Handbook of Experimental Economics, Princeton NJ: Princeton University Press,
445-500.
Sunstein, C. R. (2005) Group judgments: Statistical means, deliberation, and information
markets, New York University Law Review, 80, 3, 962-1049.
155
Surowiecki, J. (2004) The Wisdom of Crowds, Random House, Inc.
Tversky, A. and Kahneman, D. (1974) Judgment under uncertainty: Heuristics and
biases, Science, 185, 1124-1131.
Tziralis, G. and Tatsiopoulos, I. (2007) Prediction markets: An extended literature
review, Journal of Prediction Markets, 1, 75-91.
Valacich, J. S., Leonard, J. M., Dennis, A. R. and Nunamaker, J. F. (1992) A conceptual
framework of anonymity in Group Support Systems, Group Decision and
Negotiation, 1, 3, 219-241.
Vessey, I. (1991) Cognitive fit: A theory-based analysis of the graphs versus tables
literature, Decision Sciences, 22, 219-240
Wells, H.G. (1932) Wanted: Professors of Foresight!, Futures Research Quarterly, 3, 1,
Spring 1987, 89-91.
Wolfers, J. and Zitzewitz, E. (2004) Prediction markets, Journal of Economic
Perspectives, 18, 107-126.
Wolfers, J. and Zitzewitz , E. (2006) Five open questions about prediction markets, in
Information Markets: A New Way of Making Decisions in the Private and Public
Sectors, ed. Robert Hahn and Paul Tetlock, AEI-Brookings Press, Washington
D.C.
Yassin, A. M. (2009) Decision support markets: Innovative business intelligence tools,
The 15th
Americas Conference on Information Systems (AMCIS), San Francisco,
CA, USA, August 6-9, 2009.
Zhang, P. (2008a), Motivational affordances: The fundamental reasons for ICT design
and use, Communications of the ACM (CACM), 51, 11, 145-147.
Zhang, P. (2008b) Toward a positive design theory - Principles for designing motivating
information and communication technology, in M. Avital, R. Bolland, and D.
Cooperrider (eds.), Designing Information and Organizations with a Positive
Lens, a volume of the Advances in Appreciative Inquiry series, Elsevier, 45-74.
Zmud, R. W. (1980) Management of large software development efforts, MIS Quarterly,
4, 2, 45-56.

156
Bibliography
Agarwal, R. and Lucas, H. C. (2005) The information systems identity crisis: Focusing
on high-visibility and high impact research, MIS Quarterly, 29, 3, 381-398.
Aloini, D., Dulmin, R. and Mininno, V. (2007) Risk management in ERP project
introduction: Review of a literature, Information & Management, 44, 6, 547-567.
Anthony, R. N. (1965) Planning and control systems: A framework for analysis, Boston,
Harvard University Graduate School of Business Administration.
Banville, C. and Landry, M. (1989) Can the field of MIS be disciplined?,
Communications of the ACM, 32, 1, 48-60.
Barki, H., Rivard, S. and Talbot, J. (1988) An information systems keyword classification
scheme, MIS Quarterly, 12, 2, 299-324.
Barki, H., Rivard, S. and Talbot, J. (1993) A keyword classification scheme for IS
research literature: An update, MIS Quarterly, 17, 2, 209-226.
Benbasat, I. and Weber, R. W. (1996) Rethinking diversity in information systems
research, Information Systems Research, 7, 4, 389-399.
Benbasat, I. and Zmud, R. W. (1999) Empirical research in information systems: The
practice of relevance, MIS Quarterly, 23, 1, 3-16.
Davenport, T. H. and Markus, M. L. (1999) Rigor vs. relevance revisited: Response to
Benbasat and Zmud, MIS Quarterly, 23, 1, 19-23.
Du, S., Keil, M., Mathiassen, L., Shen, Y. and Tiwana, A. (2007) Attention-shaping
tools, expertise, and perceived control in IT project risk assessment, Decision
Support Systems, 43, 1, 269-283.
Gioia, D. A. and Pitre, E. (1990) Multiparadigm perspective on theory building, The
Academy of Management Review, 15, 4, 584–602.
157
Glass, R. L., Vessey, I. and Ramesh, V. (2004) An analysis of research in computing
disciplines, Communications of the ACM, 47, 6, 89-94.
Gorry, G. A. and Scott Morton, M. S. (1971) A framework for management information
systems, Sloan Management Review, 13, 1, 55-70.
Hirschheim, R. and Klein, H. A. (2003) Crisis in the IS field? A critical reflection on the
state of the discipline, Journal of the Association for Information Systems, 4, 5,
237-293.
Ives, B., Hamilton, S. and Davis, G. (1980) A framework for research in computer-based
management information systems, Management Science, 26, 9, 910-934.
Keen, P.G.W. (1980) MIS research: Reference discipline and cumulative tradition,
Proceedings of the first International Conference on Information Systems,
Philadelphia, PA.
King, J. L. (1993) Editorial Notes, Information Systems Research, 4, 4, 291-298.
Kuhn, T.S. (1970) The Structure of Scientific Revolutions, 2d ed. Chicago: University of
Chicago Press.
Lee, A. S. (1991) Integrating positivist and interpretive approaches to organizational
research, Organization Science, 2, 4, 342–365.
Lyytinen, K. (1999) Empirical research in information systems: On the relevance of
practice in thinking of IS research, MIS Quarterly, 23, 1, 25-28.
Lyytinen, K. and King, J. L. (2004) Nothing at the center?: Academic legitimacy in the
information systems field‘, Journal of the Association for Information Systems, 5,
6, 220–246.
Mason, R. and Mitroff, I. I. (1973) A program for research on management information
systems, Management Science, 19, 5, 475-487.
Robey, D. (1996) Diversity in information systems research: Threat, promise, and
responsibility, Information Systems Research, 7, 4, 400-408.
Simon, H. A. (1960) The New Science of Management Decision, New York, Harper &
Row.
158
Swanson, E. B. and Ramiller, N. C. (1993) Information systems research thematics:
Submissions to a new journal, 1987-1992. Information Systems Research, 4, 4,
299-330.
Wade, M., Biehl, M. and Kim, H. (2006) Information systems is not a reference
discipline (and what we can do about it), Journal of the Association for
Information Systems, 7, 5, 247-269.
Watson, H. J., Taylor, K. P., Higgins, G., Kadlec, C. and Meeks, M. (1999) Leaders
assess the current state of the IS academic discipline, Communications of the AIS,
2, 2, 1–27.

159
Appendices
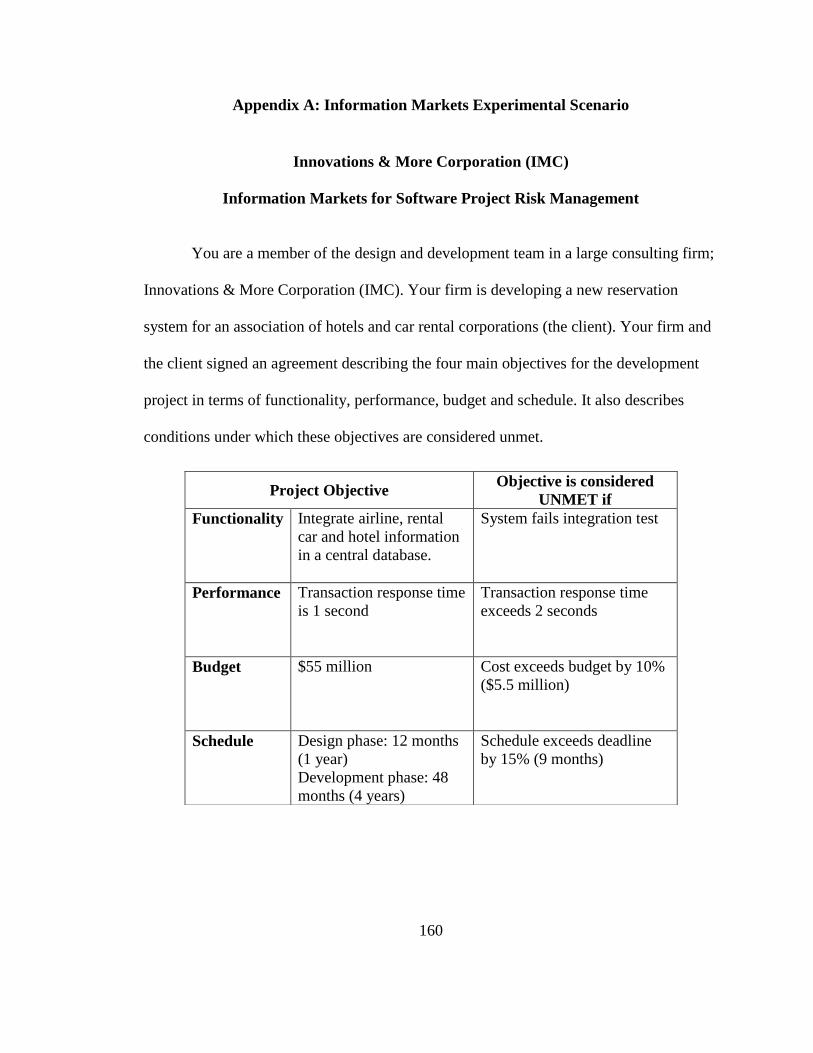
160
Appendix A: Information Markets Experimental Scenario
Innovations & More Corporation (IMC)
Information Markets for Software Project Risk Management
You are a member of the design and development team in a large consulting firm;
Innovations & More Corporation (IMC). Your firm is developing a new reservation
system for an association of hotels and car rental corporations (the client). Your firm and
the client signed an agreement describing the four main objectives for the development
project in terms of functionality, performance, budget and schedule. It also describes
conditions under which these objectives are considered unmet.
Project Objective Objective is considered
UNMET if
Functionality Integrate airline, rental
car and hotel information
in a central database.
System fails integration test
Performance Transaction response time
is 1 second
Transaction response time
exceeds 2 seconds
Budget $55 million Cost exceeds budget by 10%
($5.5 million)
Schedule Design phase: 12 months
(1 year)
Development phase: 48
months (4 years)
Schedule exceeds deadline
by 15% (9 months)
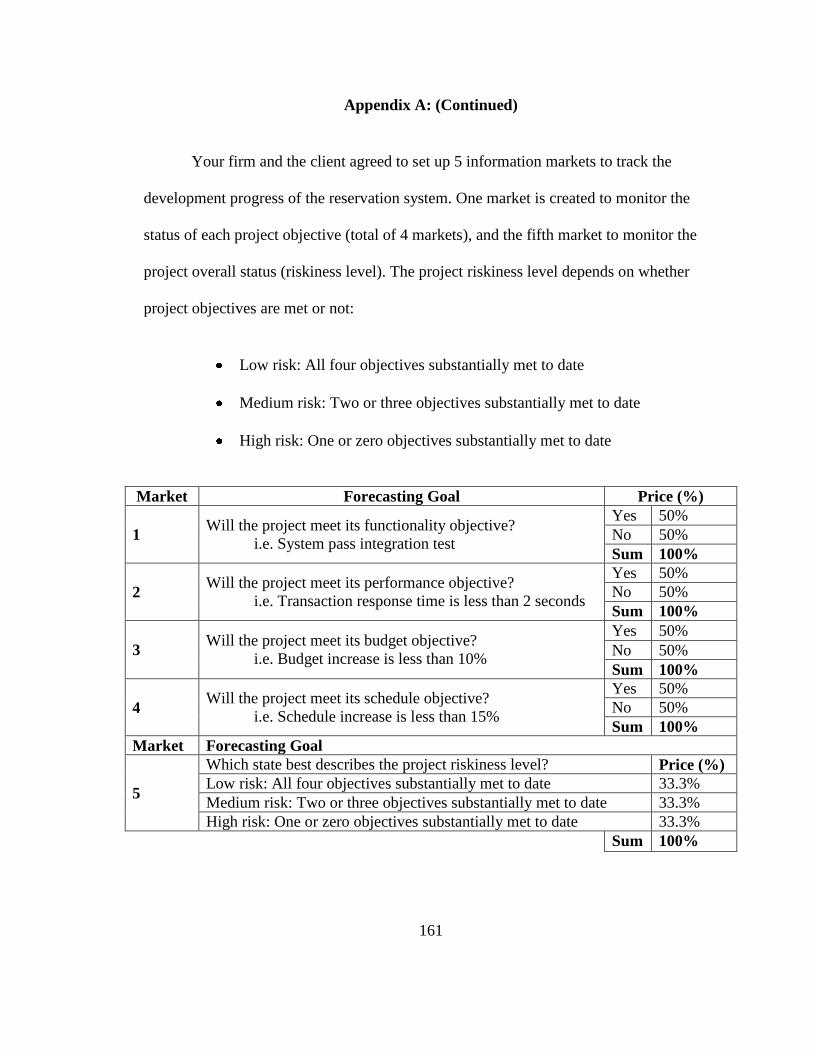
161
Appendix A: (Continued)
Your firm and the client agreed to set up 5 information markets to track the
development progress of the reservation system. One market is created to monitor the
status of each project objective (total of 4 markets), and the fifth market to monitor the
project overall status (riskiness level). The project riskiness level depends on whether
project objectives are met or not:
Low risk: All four objectives substantially met to date
Medium risk: Two or three objectives substantially met to date
High risk: One or zero objectives substantially met to date
Market Forecasting Goal Price (%)
1 Will the project meet its functionality objective?
i.e. System pass integration test
Yes 50%
No 50%
Sum 100%
2 Will the project meet its performance objective?
i.e. Transaction response time is less than 2 seconds
Yes 50%
No 50%
Sum 100%
3 Will the project meet its budget objective?
i.e. Budget increase is less than 10%
Yes 50%
No 50%
Sum 100%
4 Will the project meet its schedule objective?
i.e. Schedule increase is less than 15%
Yes 50%
No 50%
Sum 100%
Market Forecasting Goal
5
Which state best describes the project riskiness level? Price (%)
Low risk: All four objectives substantially met to date 33.3%
Medium risk: Two or three objectives substantially met to date 33.3%
High risk: One or zero objectives substantially met to date 33.3%
Sum 100%
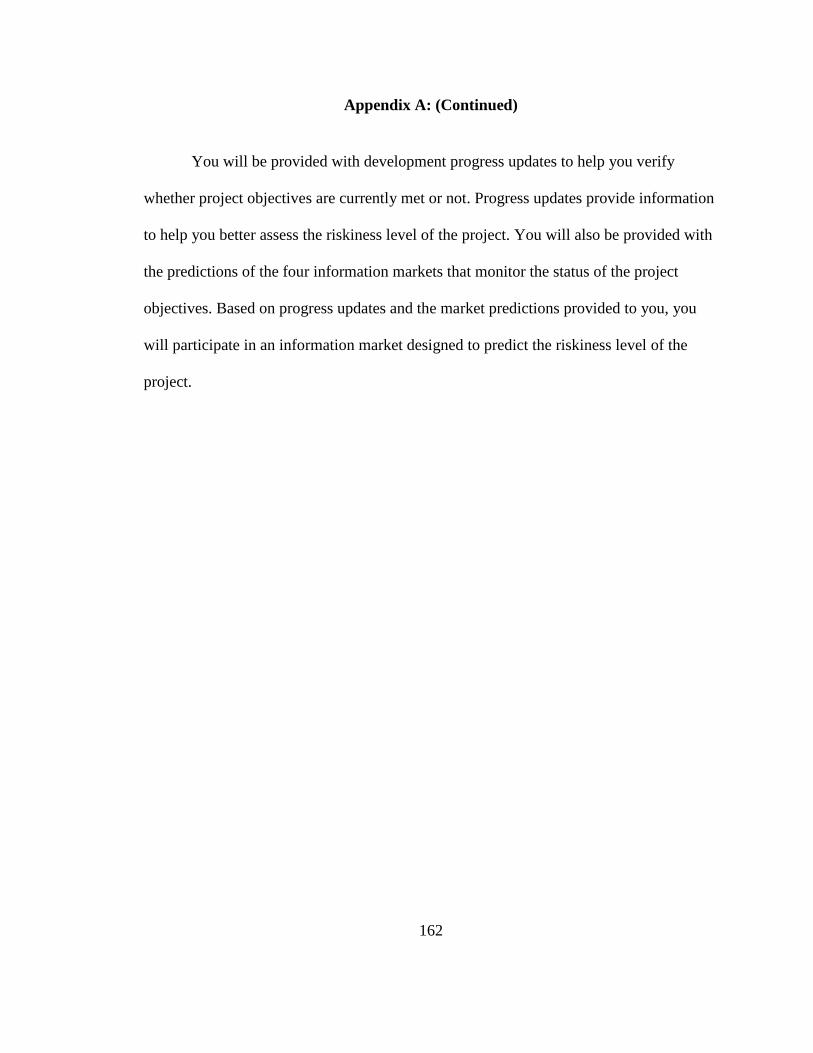
162
Appendix A: (Continued)
You will be provided with development progress updates to help you verify
whether project objectives are currently met or not. Progress updates provide information
to help you better assess the riskiness level of the project. You will also be provided with
the predictions of the four information markets that monitor the status of the project
objectives. Based on progress updates and the market predictions provided to you, you
will participate in an information market designed to predict the riskiness level of the
project.
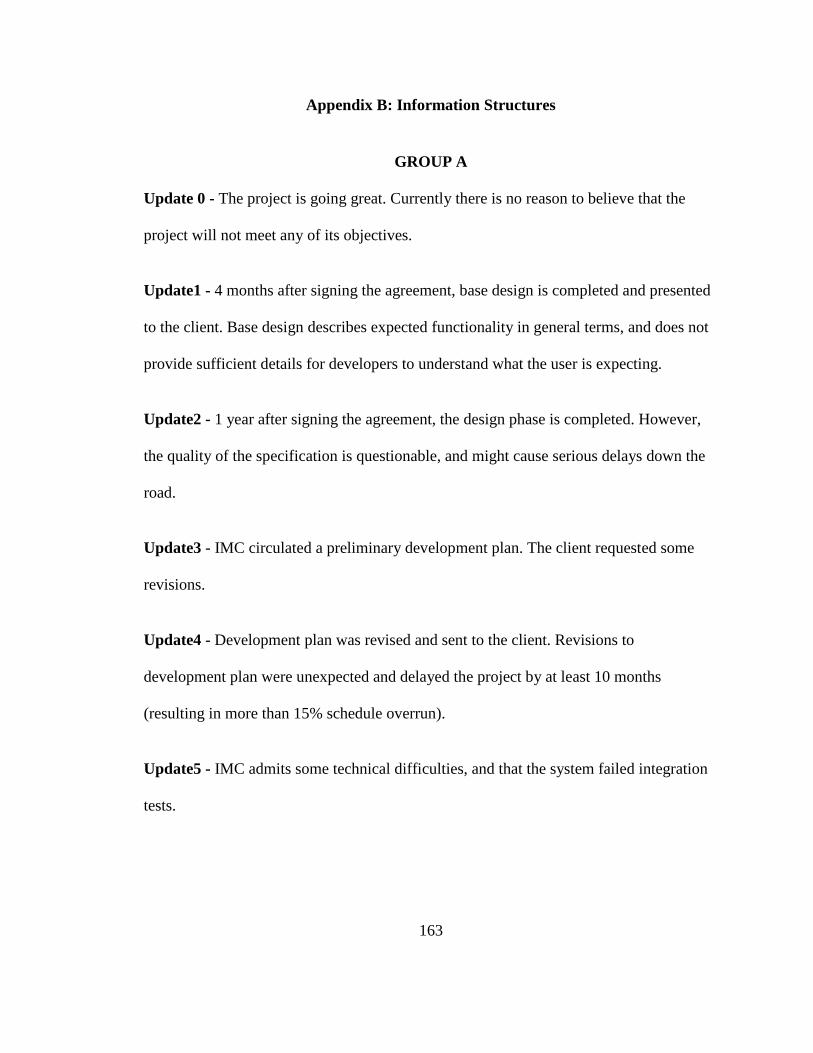
163
Appendix B: Information Structures
GROUP A
Update 0 - The project is going great. Currently there is no reason to believe that the
project will not meet any of its objectives.
Update1 - 4 months after signing the agreement, base design is completed and presented
to the client. Base design describes expected functionality in general terms, and does not
provide sufficient details for developers to understand what the user is expecting.
Update2 - 1 year after signing the agreement, the design phase is completed. However,
the quality of the specification is questionable, and might cause serious delays down the
road.
Update3 - IMC circulated a preliminary development plan. The client requested some
revisions.
Update4 - Development plan was revised and sent to the client. Revisions to
development plan were unexpected and delayed the project by at least 10 months
(resulting in more than 15% schedule overrun).
Update5 - IMC admits some technical difficulties, and that the system failed integration
tests.
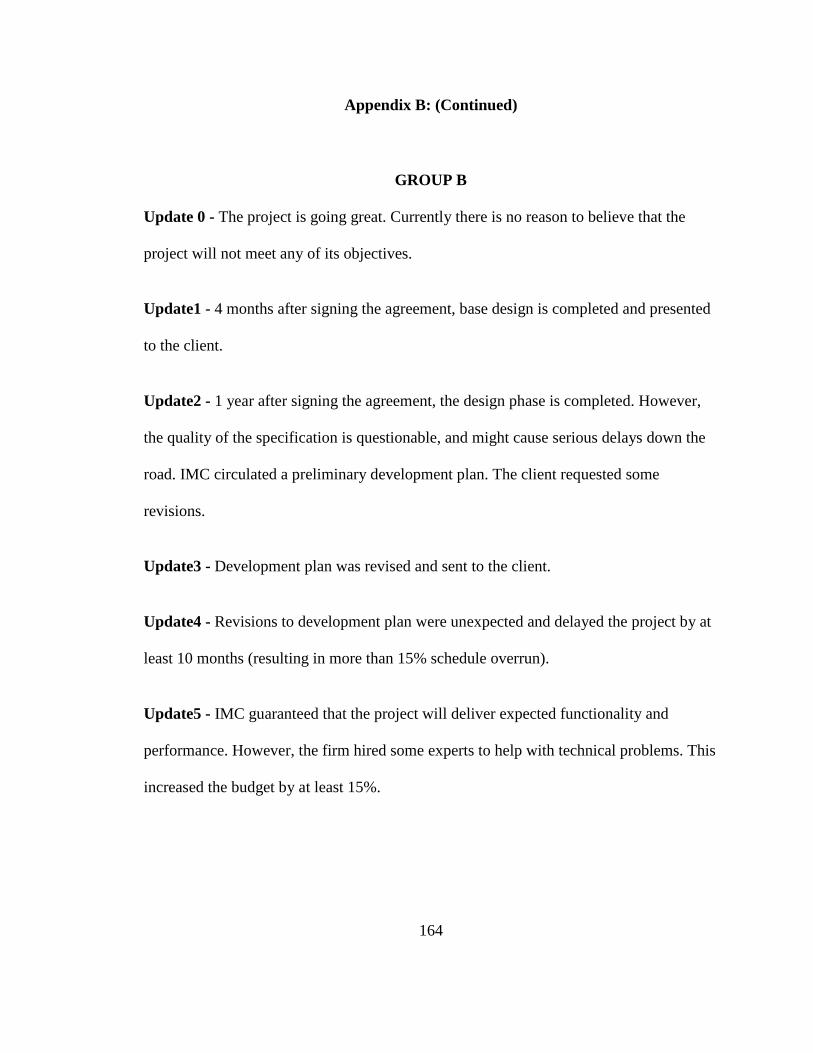
164
Appendix B: (Continued)
GROUP B
Update 0 - The project is going great. Currently there is no reason to believe that the
project will not meet any of its objectives.
Update1 - 4 months after signing the agreement, base design is completed and presented
to the client.
Update2 - 1 year after signing the agreement, the design phase is completed. However,
the quality of the specification is questionable, and might cause serious delays down the
road. IMC circulated a preliminary development plan. The client requested some
revisions.
Update3 - Development plan was revised and sent to the client.
Update4 - Revisions to development plan were unexpected and delayed the project by at
least 10 months (resulting in more than 15% schedule overrun).
Update5 - IMC guaranteed that the project will deliver expected functionality and
performance. However, the firm hired some experts to help with technical problems. This
increased the budget by at least 15%.
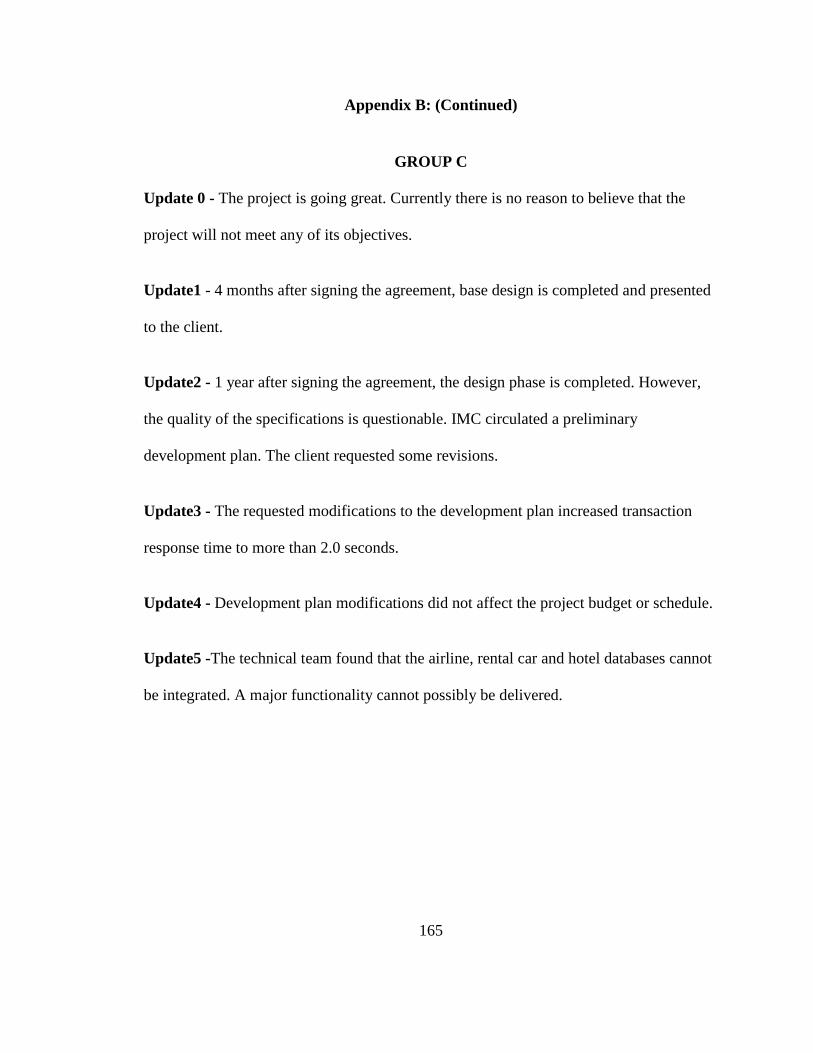
165
Appendix B: (Continued)
GROUP C
Update 0 - The project is going great. Currently there is no reason to believe that the
project will not meet any of its objectives.
Update1 - 4 months after signing the agreement, base design is completed and presented
to the client.
Update2 - 1 year after signing the agreement, the design phase is completed. However,
the quality of the specifications is questionable. IMC circulated a preliminary
development plan. The client requested some revisions.
Update3 - The requested modifications to the development plan increased transaction
response time to more than 2.0 seconds.
Update4 - Development plan modifications did not affect the project budget or schedule.
Update5 -The technical team found that the airline, rental car and hotel databases cannot
be integrated. A major functionality cannot possibly be delivered.

166
Appendix B: (Continued)
GROUP D (PUBLIC INFORMATION)
Update 0 - The project is going great. Currently there is no reason to believe that the
project will not meet any of its objectives.
Update1 - 4 months after signing the agreement, base design is completed and presented
to the client. Your firm (IMC) guaranteed the client that the final specifications will
provide all necessary details to meet users‘ needs, and the design phase will be completed
on time.
Update2 - 1 year after signing the agreement, the design phase is completed on time.
IMC circulated a preliminary development plan. Client requested some revisions.
Update3 - 6 months later, development plan is revised and sent to the client.
Update4 - IMC guaranteed that the project will still be delivered on time and with
promised functionality.
Update 5 - Two months later, IMC admits some technical difficulties, but is confident
that it will deliver the project within budget and with expected performance.
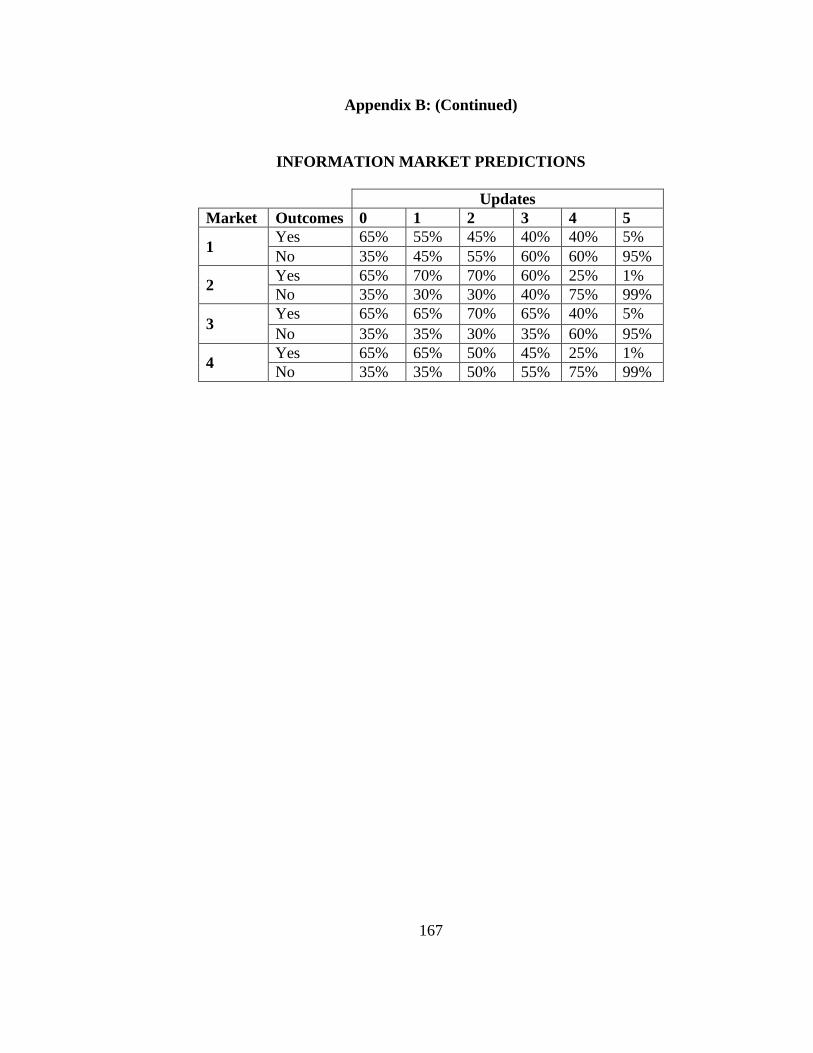
167
Appendix B: (Continued)
INFORMATION MARKET PREDICTIONS
Updates
Market Outcomes 0 1 2 3 4 5
1 Yes 65% 55% 45% 40% 40% 5%
No 35% 45% 55% 60% 60% 95%
2 Yes 65% 70% 70% 60% 25% 1%
No 35% 30% 30% 40% 75% 99%
3 Yes 65% 65% 70% 65% 40% 5%
No 35% 35% 30% 35% 60% 95%
4 Yes 65% 65% 50% 45% 25% 1%
No 35% 35% 50% 55% 75% 99%
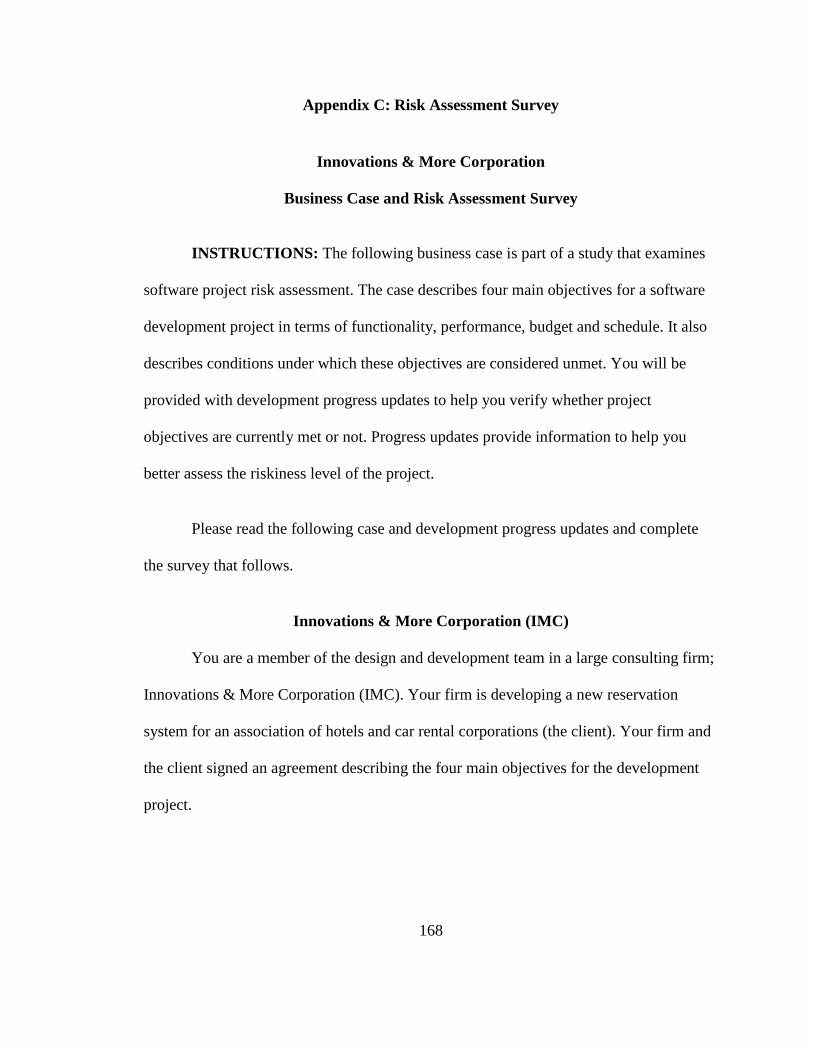
168
Appendix C: Risk Assessment Survey
Innovations & More Corporation
Business Case and Risk Assessment Survey
INSTRUCTIONS: The following business case is part of a study that examines
software project risk assessment. The case describes four main objectives for a software
development project in terms of functionality, performance, budget and schedule. It also
describes conditions under which these objectives are considered unmet. You will be
provided with development progress updates to help you verify whether project
objectives are currently met or not. Progress updates provide information to help you
better assess the riskiness level of the project.
Please read the following case and development progress updates and complete
the survey that follows.
Innovations & More Corporation (IMC)
You are a member of the design and development team in a large consulting firm;
Innovations & More Corporation (IMC). Your firm is developing a new reservation
system for an association of hotels and car rental corporations (the client). Your firm and
the client signed an agreement describing the four main objectives for the development
project.
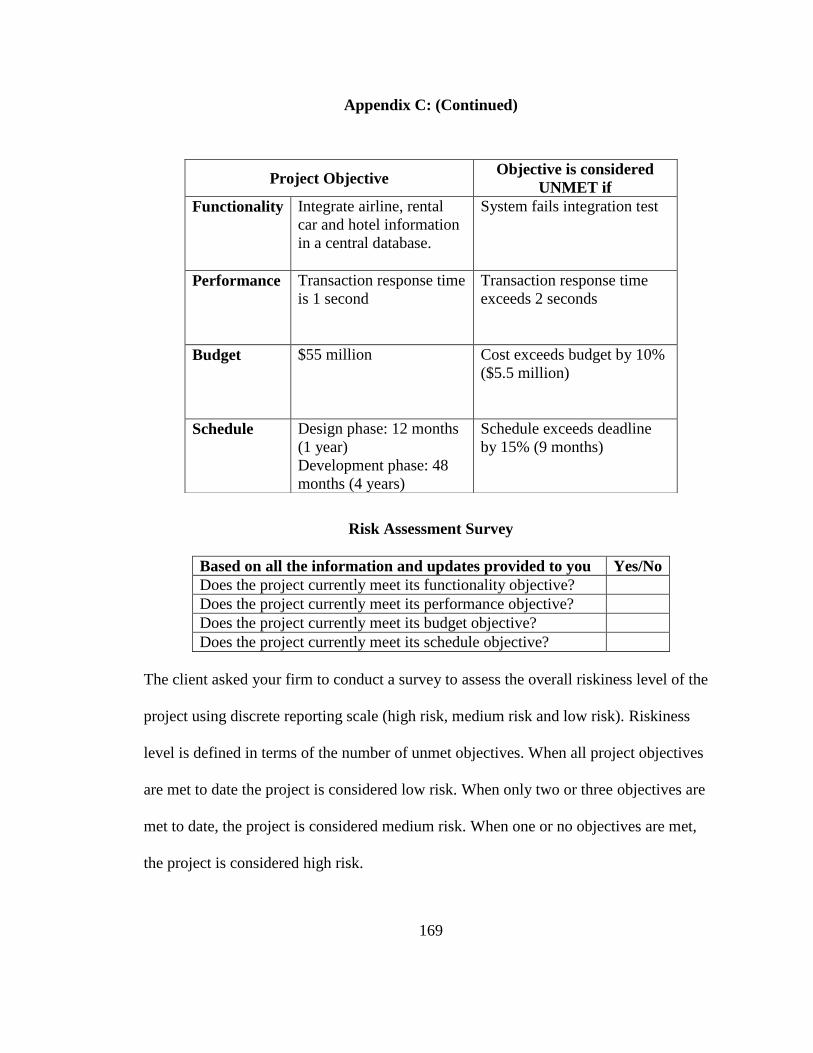
169
Appendix C: (Continued)
Risk Assessment Survey
Based on all the information and updates provided to you Yes/No
Does the project currently meet its functionality objective?
Does the project currently meet its performance objective?
Does the project currently meet its budget objective?
Does the project currently meet its schedule objective?
The client asked your firm to conduct a survey to assess the overall riskiness level of the
project using discrete reporting scale (high risk, medium risk and low risk). Riskiness
level is defined in terms of the number of unmet objectives. When all project objectives
are met to date the project is considered low risk. When only two or three objectives are
met to date, the project is considered medium risk. When one or no objectives are met,
the project is considered high risk.
Project Objective Objective is considered
UNMET if
Functionality Integrate airline, rental
car and hotel information
in a central database.
System fails integration test
Performance Transaction response time
is 1 second
Transaction response time
exceeds 2 seconds
Budget $55 million Cost exceeds budget by 10%
($5.5 million)
Schedule Design phase: 12 months
(1 year)
Development phase: 48
months (4 years)
Schedule exceeds deadline
by 15% (9 months)
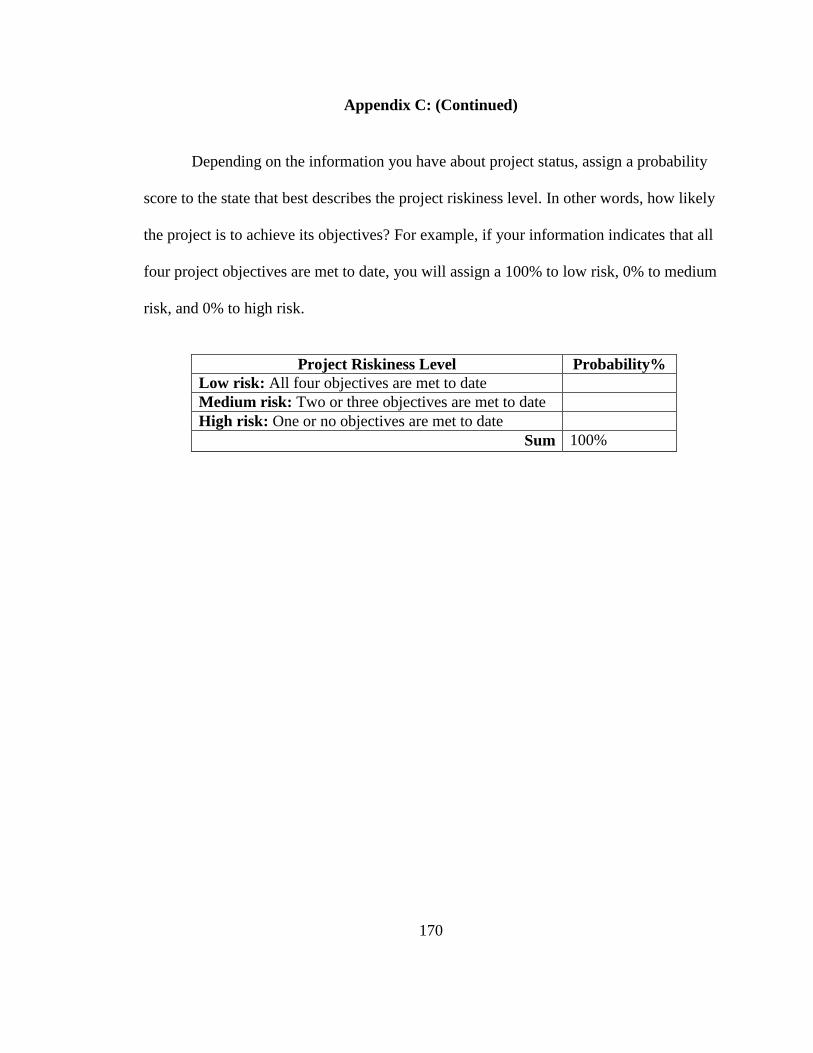
170
Appendix C: (Continued)
Depending on the information you have about project status, assign a probability
score to the state that best describes the project riskiness level. In other words, how likely
the project is to achieve its objectives? For example, if your information indicates that all
four project objectives are met to date, you will assign a 100% to low risk, 0% to medium
risk, and 0% to high risk.
Project Riskiness Level Probability%
Low risk: All four objectives are met to date
Medium risk: Two or three objectives are met to date
High risk: One or no objectives are met to date
Sum 100%
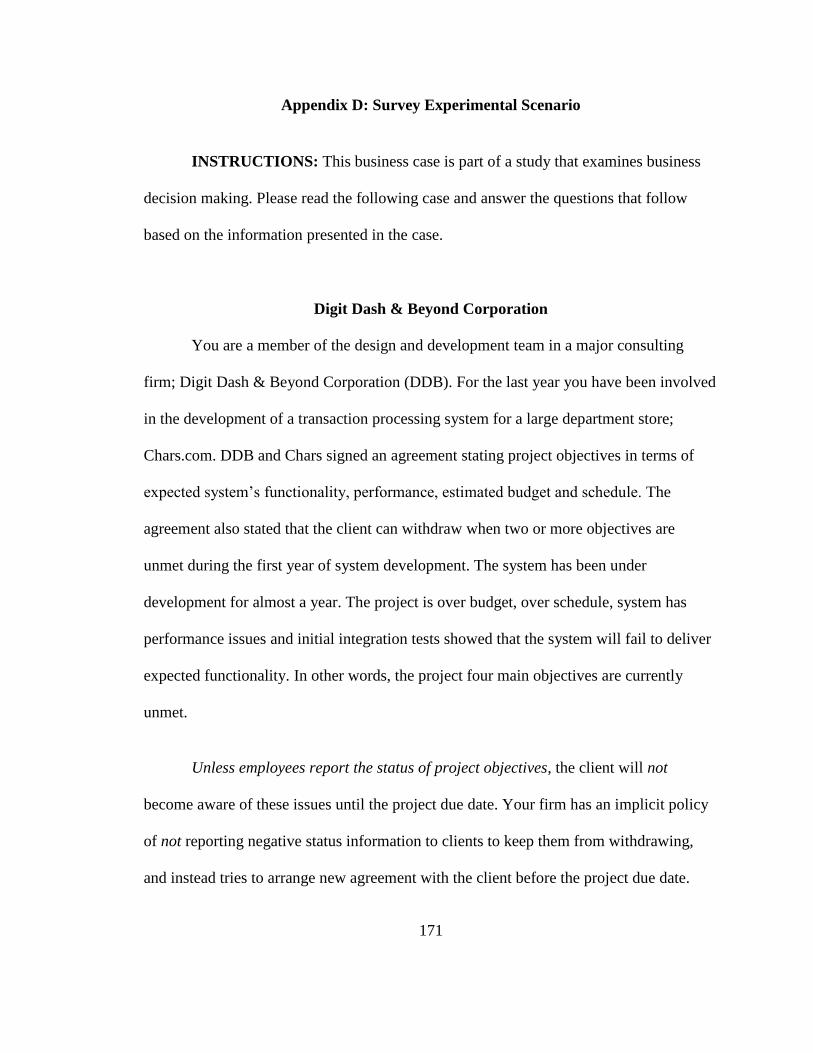
171
Appendix D: Survey Experimental Scenario
INSTRUCTIONS: This business case is part of a study that examines business
decision making. Please read the following case and answer the questions that follow
based on the information presented in the case.
Digit Dash & Beyond Corporation
You are a member of the design and development team in a major consulting
firm; Digit Dash & Beyond Corporation (DDB). For the last year you have been involved
in the development of a transaction processing system for a large department store;
Chars.com. DDB and Chars signed an agreement stating project objectives in terms of
expected system‘s functionality, performance, estimated budget and schedule. The
agreement also stated that the client can withdraw when two or more objectives are
unmet during the first year of system development. The system has been under
development for almost a year. The project is over budget, over schedule, system has
performance issues and initial integration tests showed that the system will fail to deliver
expected functionality. In other words, the project four main objectives are currently
unmet.
Unless employees report the status of project objectives, the client will not
become aware of these issues until the project due date. Your firm has an implicit policy
of not reporting negative status information to clients to keep them from withdrawing,
and instead tries to arrange new agreement with the client before the project due date.
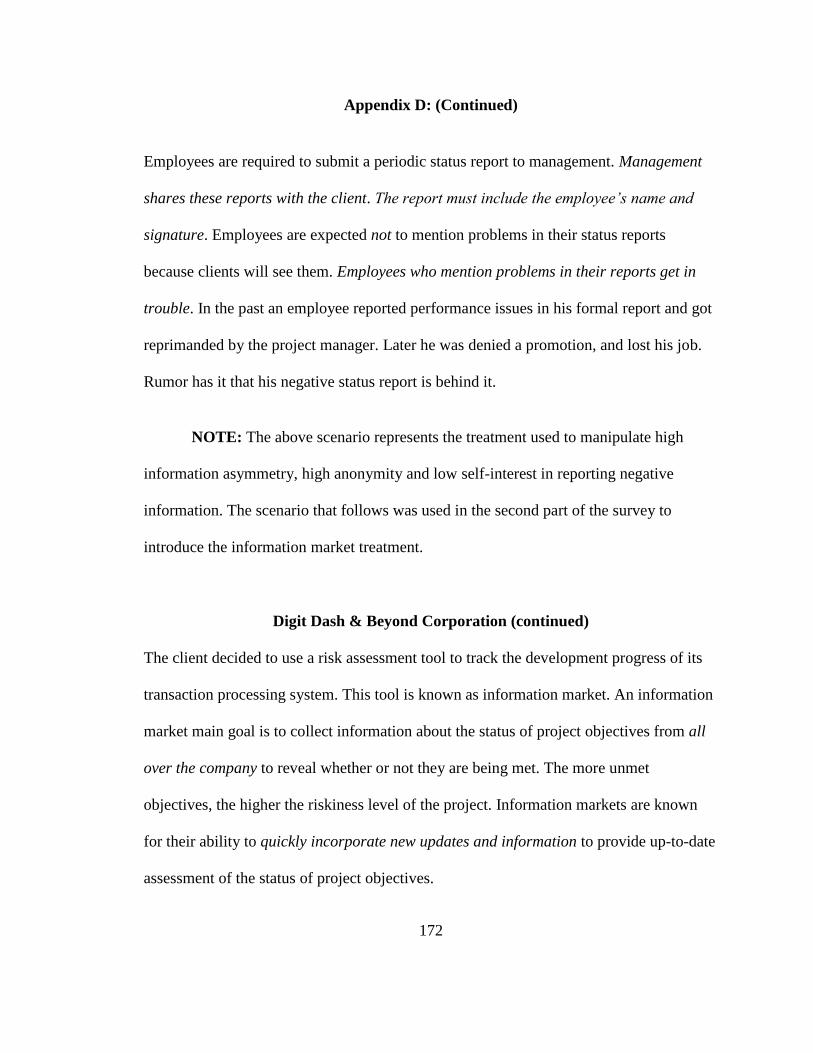
172
Appendix D: (Continued)
Employees are required to submit a periodic status report to management. Management
shares these reports with the client. The report must include the employee’s name and
signature. Employees are expected not to mention problems in their status reports
because clients will see them. Employees who mention problems in their reports get in
trouble. In the past an employee reported performance issues in his formal report and got
reprimanded by the project manager. Later he was denied a promotion, and lost his job.
Rumor has it that his negative status report is behind it.
NOTE: The above scenario represents the treatment used to manipulate high
information asymmetry, high anonymity and low self-interest in reporting negative
information. The scenario that follows was used in the second part of the survey to
introduce the information market treatment.
Digit Dash & Beyond Corporation (continued)
The client decided to use a risk assessment tool to track the development progress of its
transaction processing system. This tool is known as information market. An information
market main goal is to collect information about the status of project objectives from all
over the company to reveal whether or not they are being met. The more unmet
objectives, the higher the riskiness level of the project. Information markets are known
for their ability to quickly incorporate new updates and information to provide up-to-date
assessment of the status of project objectives.
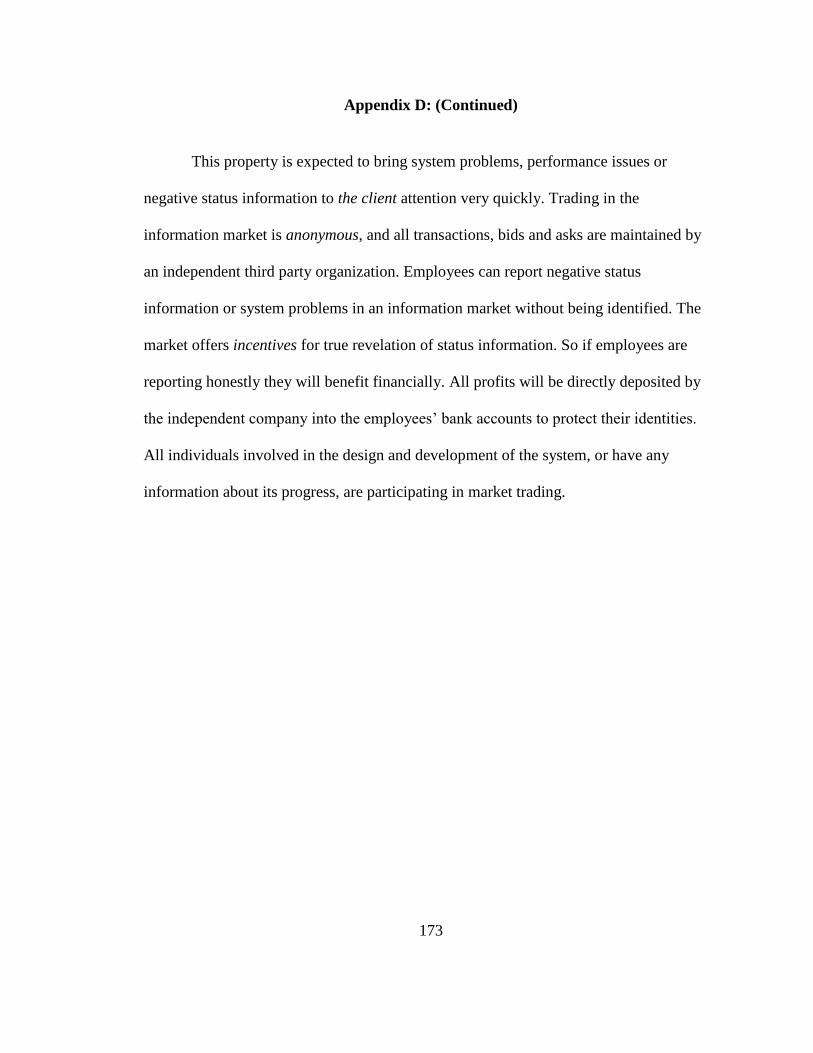
173
Appendix D: (Continued)
This property is expected to bring system problems, performance issues or
negative status information to the client attention very quickly. Trading in the
information market is anonymous, and all transactions, bids and asks are maintained by
an independent third party organization. Employees can report negative status
information or system problems in an information market without being identified. The
market offers incentives for true revelation of status information. So if employees are
reporting honestly they will benefit financially. All profits will be directly deposited by
the independent company into the employees‘ bank accounts to protect their identities.
All individuals involved in the design and development of the system, or have any
information about its progress, are participating in market trading.
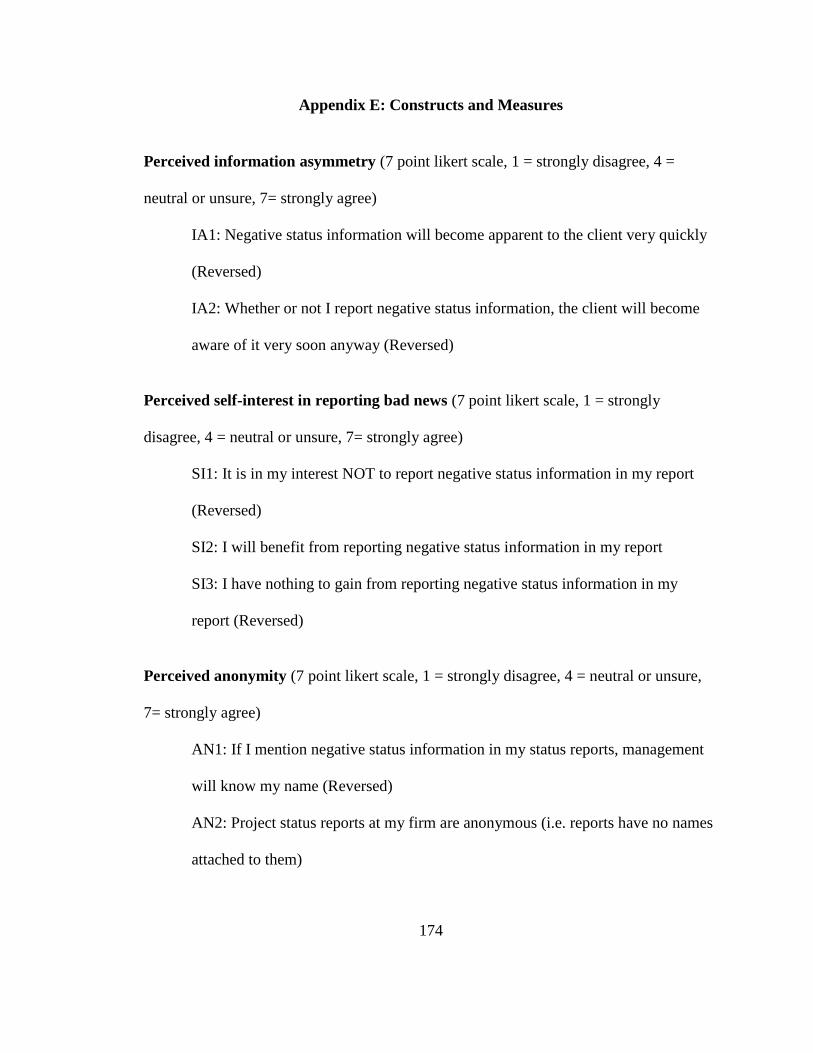
174
Appendix E: Constructs and Measures
Perceived information asymmetry (7 point likert scale, 1 = strongly disagree, 4 =
neutral or unsure, 7= strongly agree)
IA1: Negative status information will become apparent to the client very quickly
(Reversed)
IA2: Whether or not I report negative status information, the client will become
aware of it very soon anyway (Reversed)
Perceived self-interest in reporting bad news (7 point likert scale, 1 = strongly
disagree, 4 = neutral or unsure, 7= strongly agree)
SI1: It is in my interest NOT to report negative status information in my report
(Reversed)
SI2: I will benefit from reporting negative status information in my report
SI3: I have nothing to gain from reporting negative status information in my
report (Reversed)
Perceived anonymity (7 point likert scale, 1 = strongly disagree, 4 = neutral or unsure,
7= strongly agree)
AN1: If I mention negative status information in my status reports, management
will know my name (Reversed)
AN2: Project status reports at my firm are anonymous (i.e. reports have no names
attached to them)
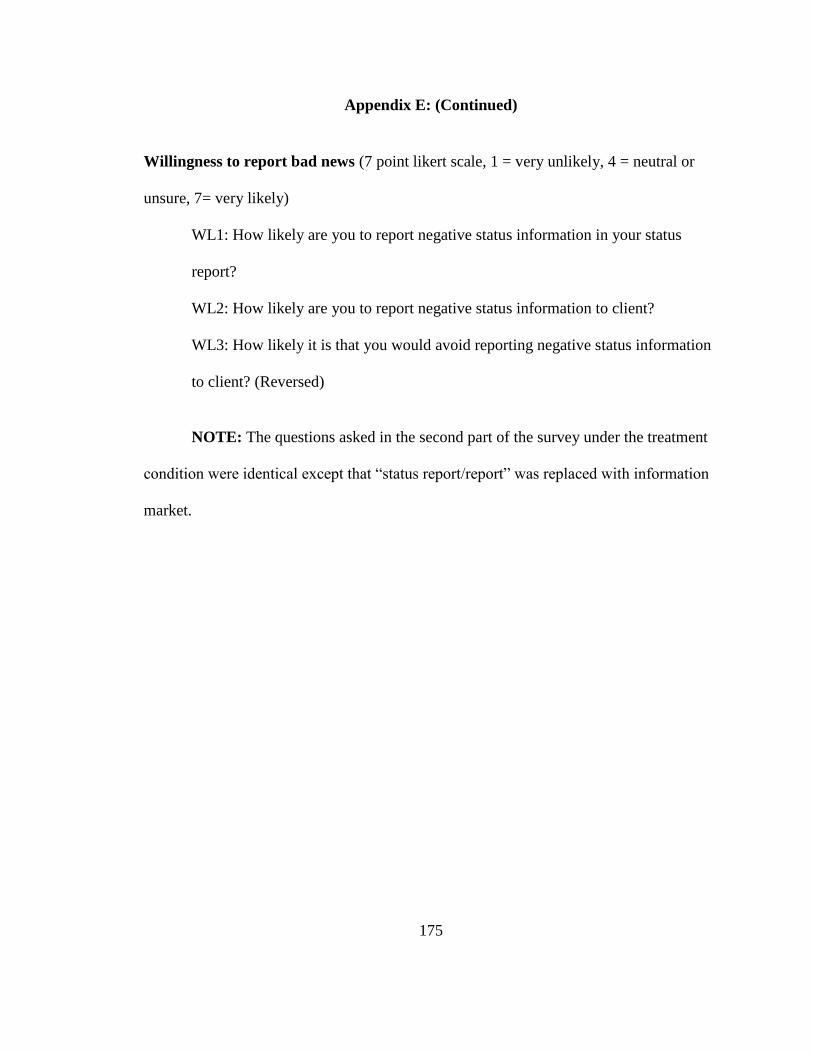
175
Appendix E: (Continued)
Willingness to report bad news (7 point likert scale, 1 = very unlikely, 4 = neutral or
unsure, 7= very likely)
WL1: How likely are you to report negative status information in your status
report?
WL2: How likely are you to report negative status information to client?
WL3: How likely it is that you would avoid reporting negative status information
to client? (Reversed)
NOTE: The questions asked in the second part of the survey under the treatment
condition were identical except that ―status report/report‖ was replaced with information
market.

About the Author
Areej M. Yassin received her B.S. degree in Computer Science with a minor in
Business Administration from Yarmouk University in Jordan, where she was on the
Dean‘s Honor List several times and was awarded the University Graduate Scholarship.
Dr. Yassin earned both her M.S. in Management Information Systems and MBA degrees
from the University of South Florida, where she maintained a 4.0 GPA. She is member of
Phi Kappa Phi and Beta Gamma Sigma honor societies. Before pursuing her academic
career, Dr. Yassin held several positions in industry. She is an Oracle Certified
Professional (OCP), Cisco Certified Network Associate (CCNA), and Microsoft Certified
Office User Specialist (MOUS Master).