Embed Size (px)
Citation preview

Organizational Learning and Project Portfolio
Success: An Empirical Study in a Multinational Oil
and Gas Company
Authors: Autie Minati Putri
Mostafa Al Hadla
Supervisor: Kiflemariam Hamde
Student
Umeå School of Business and Economics
Autumn Semester 2015
Master Thesis, one-year, 15 hp

ABSTRACT
This study aims to understand the impact of organizational learning on project portfolio
success in a multinational Oil and Gas company operated in Indonesia. The Organizational
Learning and Project Portfolio Success have been proven to have contribution to business
performance and they might possess a relationship where enhancing one of them will
strengthen the other. Exploring on this relationship might give beneficial input to the
organization in order to maximize their success. Thus, our research question is formulated
as:
To what extent does Organizational Learning impact the Project Portfolio Success?
We developed the study’s conceptual model based on the relevant previous literature. The
conceptual model depicted the aim of the study to test the potential positive impact of each
Learning Stocks (Individual, Group, and Organizational) on Project Portfolio Success, as
well as the aim to test the potential negative impact of the misalignment between Learning
Stocks and Learning Flows on Project Portfolio Success in the studied company.
We adopted quantitative research method due to the nature of research question and the
ontological and epistemological assumptions we hold toward the studied phenomena.
Accordingly, we used a questionnaire as an instrument to collect the required data to test the
hypotheses. The questionnaire was subject to a pilot test to ensure the clarity of statements
before it was distributed to the targeted respondents which are the managers and the Project
Management Office personnel in the studied company. The research hypotheses were tested
by applying single and multi-regression analyses using SPSS software.
Our findings showed that, independently, each learning stock type (Individual, Group and
organizational) has a significant positive impact to project portfolio success. When we looked
for the best model that gives the highest explanatory power, the result showed that the
combination of all three learning stocks in one model can explain project portfolio success
construct the most. Lastly, the study proved that the misalignment between learning stocks
and flows gives negative impact to the project portfolio success.
We concluded the study by stating the theoretical contribution and practical
recommendations based on the results such as the need to have a balanced investment in the
individual, group and organizational learning stocks; ensure the alignment between the
organizational units’ strategies and goals; develop an “Internal Strategy Awareness Index”;
and conduct a revision of the alignment between the company’s strategy and the project
portfolio.
Keywords: Learning Flows, Learning Misalignment, Learning Stocks, Organizational
Learning, Portfolio Management, and Project Portfolio Success.
ACKNOWLEDGEMENT
We would like to use this opportunity to express our gratitude to Allah SWT, the Most
Gracious and the Most Merciful, for the opportunity, strength and blessing given to us that
enable us to finish this thesis as the final work of our master study.
We would like to thank all people and organizations who supported and helped us in
numerous ways to complete this thesis. First, Prof. Kiflemariam Hamde as our supervisor,
for his time and effort to drive us forward through his precious advices during the completion
of this thesis. Second, all respondents in the studied company who voluntarily participated
in this study. Not to forget, all the staff of Umeå School of Business and Economics,
especially Prof. Tomas Blomquist and Gisela Taube-Lyxzen for their technical and
administrative support during our research. All of their contributions were highly
appreciated.
Finally, we are deeply grateful to all our family and friends for their constant support and
encouragement throughout this whole master program.
Umeå, Sweden, 14 December 2015
Mostafa Al Hadla and Autie Minati Putri
TABLE OF CONTENTS
I. INTRODUCTION........................................................................................................................... 1
1.1 Problem Background .............................................................................................................. 1
1.2 Theoretical Background ......................................................................................................... 2
1.3 Choice of Company ................................................................................................................. 4
1.4 Research Gap ........................................................................................................................... 5
1.5 Research Question and Purpose ............................................................................................ 6
1.6 Research Limitation ................................................................................................................ 6
II. SCIENTIFIC METHODOLOGY ..................................................................................................... 7
2.1 Pre Understanding .................................................................................................................. 7
2.2 Research Philosophy ............................................................................................................... 7
2.2.1 Ontological Assumptions ..................................................................................................... 8
2.2.2 Epistemological Assumptions .............................................................................................. 8
2.3 Nature of Research .................................................................................................................. 9
2.4 Research Approach ................................................................................................................. 9
2.5 Research Method ................................................................................................................... 10
2.6 Research Strategy .................................................................................................................. 11
2.7 Research Time Horizon ........................................................................................................ 12
2.8 Ethical Consideration ........................................................................................................... 12
2.9 Literature Search .................................................................................................................. 13
III. LITERATURE REVIEW AND CONCEPTUAL MODEL ............................................................ 14
3.1 Project Portfolio .................................................................................................................... 14
3.1.1 Definition ............................................................................................................................. 14
3.1.2 Portfolio Success Dimension .............................................................................................. 17
3.2 Organizational Learning ...................................................................................................... 22
3.2.1 Definition ............................................................................................................................. 22
3.2.2 Types of Organizational Leaning ...................................................................................... 24
3.2.3 Processes and Dimensions of Organizational Learning .................................................. 25
3.3 Organizational Learning and Project Portfolio Linkage................................................... 32
3.4 Hypotheses and Conceptual Model ..................................................................................... 33
IV. EMPIRICAL STUDY ................................................................................................................... 35

4.1 Construct Measurement Method ......................................................................................... 35
4.1.1 Questionnaire Design ......................................................................................................... 35
4.1.2 Pilot Test ............................................................................................................................. 36
4.2 Data Collection ...................................................................................................................... 37
4.2.1 Population and Sampling Technique ................................................................................ 37
4.2.2 Questionnaire Distribution ................................................................................................ 38
4.3 Measure Validation and Quality Criteria ........................................................................... 38
4.4 Model Validation - Quantitative Data Analysis .................................................................. 39
4.4.1 Descriptive Statistics .......................................................................................................... 39
4.4.2 Regression Analysis ............................................................................................................ 39
V. EMPIRICAL FINDINGS ............................................................................................................... 40
5.1 Demographics ........................................................................................................................ 40
5.2Cronbach’s Alpha .................................................................................................................. 42
5.3 Descriptive Analysis .............................................................................................................. 43
5.4 Regression Analysis ............................................................................................................... 44
VI. DISCUSSION AND ANALYSIS ................................................................................................... 48
6.1 Hypothesis 1 ........................................................................................................................... 48
6.2 Best Fitting Model ................................................................................................................. 49
6.3 Hypothesis 2 ........................................................................................................................... 50
VII. CONCLUSIONS .......................................................................................................................... 52
7.1 General Conclusions ............................................................................................................. 52
7.2 Theoretical and Methodological Contribution ................................................................... 53
7.3 Practical Implication ............................................................................................................. 53
VIII. QUALITY CRITERIA ............................................................................................................... 56
8.1 Validity ................................................................................................................................... 56
8.2 Reliability ............................................................................................................................... 56
8.3 Generalizability ..................................................................................................................... 56
8.4 Replication ............................................................................................................................. 57
IX. FUTURE RESEARCH ................................................................................................................. 58
REFERENCES ................................................................................................................................ 59

LIST OF APPENDIXES
Appendix 1: Questionnaire Construct Development – Organizational Learning
Appendix 2: Questionnaire Construct Development – Project Portfolio Success
Appendix 3: Questionnaire – English Version
Appendix 4: Questionnaire – Bahasa Indonesia Version
Appendix 5: Descriptive Analysis Result
Appendix 6: Regression Analysis SPSS Result
LIST OF TABLES
Table 1 Comparison of Success Criteria Dimension ......................................................................... 21 Table 2 Perspectives of Organizational Learning in Literature and Current Study .......................... 31 Table 3 Cronbach’s Alpha Values .................................................................................................... 42 Table 4 Descriptive Statistic ............................................................................................................. 43 Table 5 Regression Analysis Summary ............................................................................................ 45 Table 6 Model Fit Rule of Thumb. Source: Muijs, 2012, p. 145 ...................................................... 46 Table 7 Stepwise Method Multiple Regression Model Summary Comparison ................................ 47 Table 8 Stepwise Method Multiple Regression Coefficients Table Comparison ............................. 47
LIST OF FIGURES
Figure 1 Number of Publications with Project Portfolio Topic ........................................................ 14
Figure 2 Number of Publications with Organizational Learning/Learning Organization Topic...... 23
Figure 3 4I's Framework of organizational Learning. ....................................................................... 28
Figure 4 Conceptual Model ............................................................................................................... 34
Figure 5 Gender Distribution Comparison ........................................................................................ 40
Figure 6 Age Distribution Comparison ............................................................................................. 41
Figure 7 Managerial Position Comparison ........................................................................................ 41
Figure 8 Working Duration Distribution ........................................................................................... 42
Figure 9 Conceptual Model Modification for Hypotheses 1 ............................................................. 49
Figure 10 Conceptual Model Modification for Best Fitting Model .................................................. 50
Figure 11 Conceptual Model Modification for Hypothesis 2 ........................................................... 51
1
I. INTRODUCTION
The chapter describes the fundamental background of our research problem and then
presents relevant concepts and current research trends regarding Organizational Learning,
Project Portfolio, as well as the relationship between the two concepts. From existing
researches, gaps are identified and outlined, resulting in statements of the chosen research
question and purposes to be achieved by this study. Here, the choice of research subject is
justified and the limitation of this study is established.
1.1 Problem Background
Porter (1996, p. 67) defined strategy as the creation of unique and valuable position,
involving doing things differently from competitors and they can outperform competitors if
they can preserved these differences. In order to achieve this successfully, Porter (1996, p.
71) points out the need for a strategic fit between each activity and the overall strategy of the
firm. For project-based organizations this translates into projects being the main business
activities.
Recently, more attention has been paid to the process of aligning project or project
management to business strategy since the fit will result in project success (Shenhar et al.,
2001; Cooke-Davis, 2004; Kerzner, 2013), organizational competitiveness (Porter, 1996;
Shenhar et al., 2004), business success and other strategic objectives (Meskendahl, 2010;
Cooper et al., 2001). Portfolio Management is considered as means to attain strategic
alignment between business strategy and project (Artto & Dietrich, 2004; Kaiser et al., 2015).
Portfolio management becomes a critical link connecting corporate strategy, capital
allocation and project implementation. Thus, company needs frequent and effective reviews
to identify possible symptoms of portfolio inertia early and correct them before they
significantly hinder business performance (Ernst & Young, 2015).
The portfolio management concerns about selecting the right project that will give best value
to the organization (Meskendahl, 2010, p. 807). The ability to implement and manage project
portfolios vary between organizations. Such ability to select the “right projects” can be
considered as one of the organization dynamic capabilities (Killen et al., 2008b, p. 338).
Furthermore, learning mechanisms shape the establishment and evolution of project portfolio
management capabilities (Killen et al., 2008b). Box & Platts (2005, p. 374) suggested that
learning is obligatory to create culture of change, that became one important element in their
project alignment model.
Moreover, standing by its own, organizational learning can help realizing business value
through active management of knowledge within a project. Active management involves
participation from all stakeholders to align team members' knowledge (Reich et al., 2014, p.
591). Cooke-Davis (2002, p. 189) emphasized that effective learning from project
experiences is one of project management success factors. Along with results from the other
studies such as Adenfelt (2010) & Mainga et al. (2011), Reich et al. (2014, p. 599) strongly
suggest to consider knowledge dimension as part of any model that purports to fully explain
project outcomes.

2
Previous narrations have acknowledged the importance of the portfolio management to
business performance and therefore organizations might want to enhance their performance
on portfolio management. One of the opportunities to realize such objective is by maximizing
the role of knowledge as important input to portfolio management. Organizational learning
is a system that will help organization to make efficient use of the knowledge. The goal here
is to develop an understanding of the impact of organizational learning on the end results of
projects, not just intermediate variables as demonstrated from existing literature. On the other
hand, organizational learning, alone, also brings benefit to business. Hence, we found it
beneficial to study the relationship between organizational learning and project portfolio
success. The two concepts have been proven to have contribution to business performance
and they might possess a relationship where enhancing one of them will strengthen the other.
Exploring on this relationship might support organization to maximize their success factors.
1.2 Theoretical Background
Recently, researchers, practitioners and project management bodies showed an increasing
interest in elaborating the concept of project portfolio and investigating the factors affecting
it. Project Management Institute (2006, p. 4)offers a practical definition of portfolio which is
a component collection of programs, projects, or operations managed as a group to achieve
strategic objectives, while Portfolio Management includes identification, categorization,
evaluation, selection of components to best accomplish organizational strategies. It balances
conflicting demands between programs and projects by allocating resources based on
organizational priorities and capacity (Project Management Institute, 2006, p. 5).
Meskendahl (2010, p. 807) added that portfolio management is also concerned with the usage
of scarce resources. Projects need to be carefully selected in priority based on those that
would give the organization the most value aligned with the firm’s strategy. This selection is
critical to the success of the business process. Cooper et al. (2001, p. 362) considered that
portfolio management as a dynamic decision making process.
The success of the portfolio has been defined in many ways by the researcher. The main goals
of the portfolio management itself are to maximize value of the portfolio (financial, market),
allocate and focus resource by balancing the projects within the portfolio and link portfolio
to the business strategy (Cooper et al., 1997; Elonen & Artto, 2003, p. 396). Researchers
have built the success criteria according to those main goals.
The first frequently used criterion is the success of each single project inside the portfolio.
Maximizing a portfolio’s value implies maximizing the success of the portfolio’s projects.
The most common definition of single project success is to fulfill the iron dimension of cost,
schedule, and quality (Shenhar et al., 2001). However, researcher such as Müller et al. (2008,
p. 34) considered that project success should also include the customer satisfaction. It is
important to note the difference between single-project success and the average project
success across the entire portfolio where the latter is a portfolio performance influenced also
by the interdependence between projects (Jonas et al., 2013, p. 218). The success of single
project is a necessary but not sufficient condition for successful project portfolio (Martinsuo
& Lehtonen, 2007, p. 62).
The result of a portfolio with high cross-project coordination will be much greater than the
sum of the single project result (Jonas et al., 2013, p. 218). This cross coordination is

3
represented by synergies that are frequently used as another portfolio success criteria (Jonaset
al., 2013; Meskendahl, 2010). Strategic Fit, mentioned repeatedly in this text, is a success
criterion that incorporates the extent to which projects reflect the corporate business strategy
(Teller et al., 2014, p. 70) as well as align it with the available resource in terms of people,
time and fund. Portfolio balance is another success criterion resulting from the prioritization
process when organization deals with scarce resources (Cooper, 2001, p. 374). Balance is
distributed between low-risk projects, long-term and short-term, projects, technologies and
markets (Killen et al., 2008a) and application areas (Teller et al., 2014). Project success can
also be argued as operational success, while the business success itself shall be related to the
output of the project, either for customer or for the organization itself (Shenhar et al., 2001,
p. 702). The benefit to customers is often associated or termed product success and it shall
have attention since this product is the first reason of the existence of a project. Lastly, the
longest dimension put as success criterion is preparing for the future. The dimension shows
how portfolio can open new opportunities that help shape the future of the organization
(Shenhar et al., 2001, p. 710).
The ability to establish good portfolio management is one of organizational capabilities or
competencies. Previous research have examined how capabilities are built up through
learning process (Cepeda & Vera, 2007; Killen et al., 2008b; Mainga & Yan, 2009; Mainga
et al., 2011; Söderlund, 2005). Mainga et al. (2011, p. 99) suggested that the project
competencies are built through interaction of activities (generation, capturing, sharing) with
secondary processes (experience accumulation, knowledge articulation, knowledge
codification, and knowledge re-use) at each level of organization.
Organizational learning itself has been proven to play an important role in business
performance (Bontis et al., 2002; Reich et al., 2014). Organizational learning enables
organizations to obtain, process, interpret, and respond to information as well as to change
organizational behaviors to generate opportunities and improve outcomes (Killen et al.,
2008a, p.338). It incorporates behaviors and knowledge and provides means to understand
how intellectual capital changes over time (Bontis et al., 2002, p. 440). It is a multifaceted
concept, involving activities on different level of organization (individual, group, the whole
organization) (Mainga et al., 2011, p. 97). Learning ability is raised as one major source of
sustainable competitive advantage (Artto & Dietrich, 2004, p. 153)
Reich et al. (2014) demonstrated that knowledge management, through knowledge
alignment, impacts business-related project performance. Knowledge Alignment cannot be
achieved without knowledge sharing because congruence of knowledge cannot readily be
achieved without sharing (Reich et al., 2014, p. 592). Bontis et al. (2002) introduced the
concept of misalignment between the stocks of learning and flow of learning that suggests
there is learning that is not being absorbed by the organization, and this misalignment affects
business performance negatively. Learning Stock is intellectual capital; the knowledge exists
in an organization on a particular time (Bontis et al., 2002, p. 440). Learning Flow is how
this stock changes (flow) overtime, whether in Feed-Forward flow (that individual learning
affects the group or whole organization learning) or Feed-Back flow (how the embedded
learning inside an organization affect the group and individual learning) (Bontis et al., 2002,
p. 445). Knowledge sharing is part of the Learning Flow concept introduced in the study.

4
1.3 Choice of Company
Oil and gas industry is a large industry with operational tentacles reaching all parts of the
world. It is the most global and aggressive industry in terms of educational programs and
workforce development (Badiru & Osisanya, 2012, p. 11). There are local and worldwide
forums and associations in oil and gas industry with one of the aim to share knowledge within
the area, among those are Society of Petroleum Engineers (SPE) and American Petroleum
Institute (API). The advancement of knowledge sharing culture makes the industry attractive
for us to apply the study on organizational learning. Additionally, we also spot that most
literature discussing oil and gas projects tries to give solution to practical problems and there
is lack of theoretical literature from the social science point of view.
Oil and gas projects have been hallmarked by massive investment, enormous interfaces as
well as complex engineering endeavors (Badiru & Osisanya, 2012, p. 28). There is huge
attention given to the oil and gas projects from the government and public affected by
previous major accident such as Deep Water Horizon oil spill (2010) or the infamous Exxon
Valdez oil spill (1989) that effects can still be felt two decades after. Those accidents, which
are often considered as catastrophes, have proved that the impact of the project failure in this
industry is huge.
Project with scale, complexity, major investment and daunting challenge displayed by oil
and gas projects will attract bigger attention from the government as well as public. It is a
typical practice that government’s involvement plays major role in oil and gas companies,
especially in developing countries. The industry itself is a tycoon industry which dynamic
may affect the whole general consumer market (Badiru & Osisanya, 2012, p. 27). Statistics
reveals that generating a successful project is not easy. Leach (2000, p. 1) mentioned that as
many as 30% of projects are terminated before its completion and even the surviving projects
usually fail to deliver their objectives. Ernst & Young (2014) evaluated the performance of
365 oil and gas mega projects and their result shows that 64% of the projects were facing
cost overruns and 73% of the projects were reporting schedule delays. The cumulative
financial impacts of the evaluated projects may reach US$ 500 billion.
Given all of the above factors, we assumed that oil and gas companies will try to manage
their project in a more systematic way by using a mature and high end project management
system that will ease us in conducting the research as well as give us a wider and more
beneficial learning opportunity.
Indonesia’s oil and gas industry has a long and successful history as they are also considered
as international pioneer in many areas including the development of “Production Sharing
Contract” model and Liquefied Natural Gas (LNG) commercialization (PWC, 2014, p. 1).
Indonesia is the only East Asia country ever joining OPEC (Organization of the Petroleum
Exporting Countries). Those facts become the base of our specific interest to study the oil
and gas industry in Indonesia.
It is evidenced that all oil and gas companies manage more than one project at a time. Their
project portfolio may consist of up to hundreds of complex projects, which they prioritize not
only on financial goals and risks, but also increasingly based on the availability of scare
resources including human talent (Nava & Rivolta, 2013). The studied company is an oil and
gas producer operated in Indonesia. The organization structure consists of divisions that each

5
has their own diverse project portfolio. They value learning process as means to grow shown
by many knowledge sharing initiatives they established including: mentoring program,
periodic skill assessment, improvement forum and award session, participation on national
and international conferences. Given this diverse portfolio and the advancement of the
knowledge sharing mentioned, the organization is considered suitable for this study.
1.4 Research Gap
Theoretical Gap
It has been explained that both concept of organizational learning and project portfolio have
independently given positive impact to business performance. We argued that in a project
based organization, the success of their portfolio projects is part of the business performance.
Therefore, we have curiosity to see if the two concepts possessed relationship.
Killen et al. (2008a) concluded that organizational learning creates a capability to manage
project portfolio. Mainga et al. (2011) study implied that different inter-project learning
mechanisms affect the development of project competencies in a project based firm. The two
studies proved that learning helps in developing project portfolio management capability. We
argued that the capability leads to the success of the portfolio and we feel the need to bridge
the gap and study the direct relationship of organizational learning and project portfolio
success. To our knowledge, the direct relationship between the two concepts has not been
addressed before and previous literature has not tested both concepts with the same
combination of dimensions and measurement tools as used in this study (specifically learning
from the stocks and flows perspective) as most literature measured organizational learning
as one holistic concept in relation to the business performance in general. Moreover, as will
be evidenced in Chapter III, the number of literature on project portfolio success and learning
stocks and flows is considered low.
Lycett et al. (2004, p. 291) mentioned that knowledge transfer aspect has been neglected in
multi project management practices. Reich et al. (2014) and Bontis et al. (2002) have shown
that without alignment, the knowledge possessed by organization will not be useful for its
desired purpose. This stock of knowledge only gives their minimum advantage if it is not
shared within organization. Despite the essential of the knowledge alignment, the concept is
rarely investigated in the organizational learning literature. Therefore, we decided to include
the study of learning misalignment impact to project portfolio success as part of our study.
Contextual Gap
The studied company is a multinational oil and gas company. The knowledge sharing culture
is already nurtured within oil and gas industry with the existence of several international
journal and professional associations. However, due to the nature of the business, the
developing knowledge is more in the practical side. Most journals and papers are dedicated
to solve practical issues, most often using quantitative techniques. This trend might be caused
by the important role of high and solid technology needed by the industry and therefore the
main social actors involved are mostly come from engineering background. We believe that
the penetration of social science in oil and gas industry, especially in business studies, has
not been wide enough yet and this concern then become the spotted contextual gap for this
research.

6
We find more contextual gap when we were in search for literature on business strategy and
project alignment related to project portfolio. Such topic has long been developed especially
for IT projects. The nature of project in oil and gas industry and IT projects is different in
terms of its result tangibility and uncertainty. Outside project-based organization context,
literature on project portfolio topic is also commonly found in operation activities such as
manufacturing. Hence, we hope that this research can add theoretical contribution on project
portfolio topic in a different context than those presented in existing literature.
1.5 Research Question and Purpose
Considering our problem background, theoretical background and knowledge gaps, this
study aims to answer the following question:
To what extent does Organizational Learning impact the Project Portfolio Success?
Corresponding to the above research question, the study builds on the previous research by
providing and testing theory to understand the impact of organizational learning on project
portfolio success. This contribution will be proven from theoretical perspective, by
investigating (and elaborating) any evidence in the literature of such role, and empirical by
using a quantitative study that would support (or not) the theoretical findings. We aimed to
find the best model to predict project portfolio success from organizational learning
constructs based on findings of this study. Moreover, as part of methodological contribution,
future research may benefit from the method and instrument used in this study. It is also
hoped that the result of this study will give the decision makers in the studied company better
understanding when they aim to enhance the level of success of their project portfolio through
learning process. As practical implication, the result can be used to guide them to formulate
their learning strategy. Here, we provide some example of strategies that can be formulated
based on our empirical findings.
1.6 Research Limitation
Most studies are subject to limitations and our study was performed in only one organization
that limit the generalizability of the result. Moreover, the short duration of the data collection
time and the distance with the organization, became a limitation for us to gain bigger response
rate. However, we argued that the proposed theoretical framework determined relationship
between the two constructs could be tested in different organizations, industries, type of
project as well as geographical areas to produce a more general result as will be further
discussed in Chapter VIII and IX.
The research question and research purpose formulated in this chapter will be linked with
our philosophical assumptions and become the basis of the research approach and strategy
explained in Chapter II. The theoretical framework of the introduced topic on Project
Portfolio Success and Organization Learning will be further elaborated in Chapter III.

7
II. SCIENTIFIC METHODOLOGY
The chapter starts with our pre-understanding that shaped our choice towards options on
this study, including: philosophical assumptions and worldview, research approach,
research method, research strategy, time horizon. The ethical consideration taken during
this study as well as the method used for literature search is also explained at the end of this
chapter.
2.1 Pre Understanding
Our previous educations and work experiences shape our pre-understanding. Our pre-
understanding is argued can affect the way we think and interpret things. Being trained as an
engineer, one of the author developed a systematical and objectives way of thinking that
might be traced as the source of her ontological view as an objectivist as well as her
epistemological view as a positivist that influence the philosophical assumptions taken on
this study. The topic itself, derived from the similar work experiences where both authors
have been involved in the portfolio management in their previous jobs. During the MSPME
(Master in Strategic Project Management European) programme taken by the authors,
various topics on project portfolios have been explored and deepened author’s
understandings.
Bryman & Bell (2015, p. 40) argues that authors are likely to be influenced by previous
knowledge of the organization. One of the authors has worked in oil and gas industry for five
years. This fact gives positive impact to the research since her knowledge has helped to
identify the suitable organization as well as understand the structure of the industry. The other
author has had project management role in a telecommunication company where he was
involved in creating alignment of business strategy and projects. This experience helped him
to understand the structure and management of project portfolio, also he has studied
organizational learning during his academic studies which gave him a relatively extensive
theoretical knowledge about the topic. We argue that limited understanding on the studied
topic and organization practice would make it difficult for us to carry on the study. However,
we understand that subjectivity issue might be in question and we will display in our steps of
conducting quantitative analysis that the study has been carried in an objective and value free
manner. Moreover, both authors had experiences in conducting research with quantitative
methods, therefore we are convenient with the use of quantitative method for this study.
2.2 Research Philosophy
Knowledge of research philosophy is essential to understand the research process as a whole
(Grix, 2002, p. 175) Research philosophy adopted by researcher is influenced by practical
considerations and becomes important assumptions in understanding interrelationship of
research key components, guiding the choice of research strategy and research design, avoid
confusion on theoretical approaches as well as understanding other researcher’s position,
(Bryman & Bell, 2015, p.48; 22; Grix, 2002, p. 176, Saunders et al., 2012, p. 129). The

8
different philosophical stance will lead to different interpretation on the same social
phenomena (Grix, 2002, p. 178).
2.2.1 Ontological Assumptions
Ontology has been defined as knowing what is out there to know about, the nature of reality,
image of social reality upon which a theory is based whether social phenomena can be viewed
independently as external reality to social actors or not (Bryman & Bell, 2015, p. 32; Grix,
2002, pp. 175-177; Saunders et al., 2012, p. 130). The two main ontological views are
objectivism and constructionism.
Objectivism views social entities as objects existing independently from social actors, social
phenomena is a separate reality that is outside our reach and pre-determined (Bryman & Bell,
2015, p. 32; Grix, 2002, p. 177). Constructionism, the other ontological view, believes that
the phenomena exist because of the world view of social actors and their consequent behavior
(Bryman & Bell, 2015, p. 32; Saunders et al., 2012, p. 132). Hence, since human perception
is a result of continual thinking process then social phenomena are in constant state of change
(Bryman & Bell, 2015, p. 33; Saunders et al., 2012, p. 132). Thus, constructionists aim to
understand the subjective meanings of what motivates social actors to conduct certain actions
(Saunders et al., 2012, p. 132).
Our ontological stance in this study is objectivism since our purpose is to draw a general
observation of organizational learning effect to project portfolio success that we argue are
part of organization’s reality and therefore external to social actor’s control. We believe that
organizational learning is an established system that has established norms, rules,
standardized procedure in the organization. As consequences, the steps of our research
process are carried out in value-free way.
We considered that taking the view of cconstructionism might give us better insight in
revealing the subjective meaning behind the relationship between the studied phenomena. If
we had use constructionism view, the research purpose might be able to answer how and why
there is or is not effectual relationship between organizational learning and project portfolio
success. However, that purpose is outside the scope of study and therefore we did not adopt
constructionism stance.
2.2.2 Epistemological Assumptions
Epistemology refers to the study of knowledge, what can be considered as acceptable
knowledge and how can we know about it. Epistemology defines whether the researcher is
part of the knowledge or independent to it. (Grix, 2002, p. 178; Bryman & Bell, 2015, p. 26;
Saunders et al., 2012, p. 132). The main epistemological stances discussed below are:
positivism, realism, interpretivism, and pragmatism.
Positivism advocates application of natural sciences method to study social reality and even
beyond (Grix, 2002, p. 178). Positivism conducts value-free research where they do not take
personal standpoint but rather being an observer, external to the knowledge (Bryman & Bell,
2015, p. 27). Researchers test and confirm hypotheses, which constitute a foundation to draw
conclusions of relationships in data and give them an opportunity to generalize findings to
law-like implications (Bryman & Bell, 2015, p. 27; Saunders et al., 2012, p. 134). The realist
9
approach is similar with the positivist but they believe that the senses show us as reality is
the truth and that there is a reality quite independent of the mind (Saunders et al., 2012, p.
136). Two types of realism are direct realism that believes the world is what we experience
through our senses and critical realism that argues on how sense can deceives us and that is
why there will be further mental processing after we sense the sensation (Saunders et al.,
2012, p. 136).
The contrasting view of positivism is interpretivism that interpret human as not a natural
science objects and they have subjective meaning behind their action (Bryman & Bell, 2015,
p. 28; Saunders et al., 2012, p. 116). The last stance is pragmatism when they believe that the
most important on research is the research question itself so it is possible to work with
variations in the psychological stances (Saunders et al., 2012, p. 137).
Our epistemological stance is positivism since the purpose of the study is to find out whether
organizational learning is or is not a factor that contribute to project portfolio success and not
to interpret why such relationship has taken place. We believe that researchers shall uncover
existing reality by using objective methods and it means that researchers need to be detached
from the phenomenon as far as possible. Thus, we consider natural science methods
appropriate for the purpose of our study. Additionally, the process of thinking of positivism
is mainly the test of theories and the development of laws (Bryman & Bell, 2015, p. 27). That
is the approach we want to conduct by developing a conceptual model and test the hypotheses
built based on our literature review.
We understand that we can also extend the study to examine the subjective meaning behind
the studied phenomena and shall we decide to do that, then the more appropriate stance will
be pragmatism. However, due to our predetermined research scope, we will not try to seek
deeper understanding on what is behind the relationship between organizational learning and
project portfolio success.
2.3 Nature of Research
The research question will determine the nature of your research whether it is an exploratory,
descriptive or explanatory (Saunders et al., 2012, p. 170). Exploratory study is useful when
researcher wants to seek understanding of phenomena (Saunders et al., 2012, p. 170). It has
an advantage of being flexible an able to adapt to change as new information and new insights
appear. The descriptive study purpose is to gain accurate profile of events or situations and
sometimes it is used as mediatory analysis to support the conclusion analysis (Saunders et
al., 2012, p. 171). Explaining relationship from any given situations is the emphasis of the
third category, explanatory studies (Saunders et al., 2012, p. 172).Our study falls into
description-explanatory studies (Saunders et al., 2012, p. 171) since we aim to establish
relationship between variables and in the way of doing so, we will use a descriptive analysis.
2.4 Research Approach
Researchers can view the relationship between theory and research in either deductive or
inductive approach or abduction as the combination of both approaches. A deductive
approach is the most frequently used relationship between theory and research and follows a
logic sequence (Bryman & Bell, 2015, p. 24). Deductive reasoning is used when researcher

10
reasons from abstract and general idea to specifics (Graziano & Raulin, 2011, p. 41). It
implies that researchers must be able to translate concepts from previous theories into
hypotheses and test them with aid from collected data (Bryman & Bell, 2015, p. 24; Saunders
et al., 2012, p. 145). The process of deduction may be perceived as simple and linear but
could be complex in reality in terms of obstacles related to data collection mismatched with
hypotheses or a lack of relevance (Bryman & Bell, 2015, p. 24). Deductive studies could be
subject to revision if new theoretical findings have an impact on researcher’s unpublished
study (Bryman & Bell, 2015, p. 24).
A contrasting approach from deductive is inductive that is widely used with qualitative
studies (Bryman & Bell, 2015, p. 25). Inductive reasoning is used when researcher reasons
from particular to the general (Graziano & Raulin, 2011, p. 41). Inductive research main
purpose is to build new theories or contribute to established theories through observations of
detected patterns (Saunders et al., 2012, p. 146). Induction involves a development where
conclusions drawn from observations and empirical findings are incorporated back into
existing knowledge, in form of theory as the result of research (Bryman & Bell, 2015, p. 26;
Ghauri & Grønhaug, 2010, p. 15). Abduction moves back and forth between theory data,
combining the deductive and inductive approach (Saunders et al., 2012, p147) as solutions
to overcome the limitation of deductive and inductive approach (Bryman & Bell, 2015, p.
27)
In this study, we reviewed existing theories and literature to be able to build the conceptual
model and hypotheses stating the relationship between the studied concepts. Then we gather
data to test the hypotheses empirically. Thus, we are using a deductive approach to define
the relationship between organizational learning and project portfolio success. Deductive
approach is consistent with our ontological view of objectivism and epistemological
orientation of positivism. The inductive approach is not appropriate for our study since the
construct and measurement tools used in this study are based on existing theory.
2.5 Research Method
Quantitative and qualitative researchers are both interested in what individuals do and think,
but they deviate in their research approach and their ontological and epistemological
positions (Bryman & Bell, 2015, p. 37). It is suggested to deliberate on both research
approaches before deciding which method to use because it is of significance that it aligns
with the problem statement and purpose of the study, thus it needs to be considered before
one starts to collect data (Saunders et al., 2012, p.161). The choice of strategy, method and
design should also be assessed depending on what is practically feasible. Practical
implications are important to consider when deciding upon what research design will be used
(Bryman & Bell, 2015, p.42)
Quantitative research method tests hypotheses composed and verified from concepts in
previous theory and a deductive approach between theory and research is taken (Bryman &
Bell, 2015, p. 161, Saunders et al., 2012, p.162). Constructs are then tested on respondents
of interest that typically entails numeric data that allow researchers to analyze relationships
between theories and the empirical results (Bryman & Bell, 2015, p.161). Some of the distinct
features of quantitative research are that results can be measured and generalized among
11
populations (Bryman & Bell, 2015, pp. 175). Other emphasis in quantitative studies are that
they focus on facts and reason, it is a logical and critical approach, has controlled
measurement, entails outsider view position to data and result oriented (Ghauri & Grønhaug,
2010, p. 105)
Qualitative research is generally more often used to generate new theory by an inductive
research approach (Bryman & Bell, 2015, p. 38). Qualitative research strategy is more
concerned with words and their meaning since data is mainly collected by interviews and
observations (Bryman & Bell, 2015, p. 392), although this does not have to be the case. Thus,
interpretations of qualitative data contribute to the conceptual framework (Bryman & Bell,
2015, p. 392). Other emphasis in quantitative studies are that it focuses on respondent’s point
of view, observation and measurement usually done in natural setting, entails insider view
and closeness to data and process oriented (Ghauri & Grønhaug, 2010, p. 105).
Our research will use the quantitative method by collecting numerical data from respondents
through questionnaires since we aim to find a generalization regarding the effect of
organizational learning to project portfolio success. The organizational learning and project
portfolio success are able to be measured quantitatively using the measurement tools that
have been developed by previous researchers in each fields of study. The numeric data will
be used to conduct statistical tests to explore the relationship between the two concepts. We
considered combining qualitative and quantitative methods in a mixed method study to have
deeper understanding on the issue. Interviews could have been a complementary approach to
confirm the quantitative study findings. However, this idea was reconsidered and eliminated
due to limited time available.
2.6 Research Strategy
Research strategy is a plan taken by researchers in order to answer their research question
(Saunders et al., 2012, p. 163). Experimental and survey strategies are often associated with
quantitative research (Saunders et al., 2012, p. 163). We considered survey through
questionnaire as the most appropriate means for our study given the different location of the
researcher and the studied company. It is the most economical and effective way to gain the
data according to our chosen philosophical, research approach and research method in order
to reach our research purpose. The questionnaire gave us the quantitative data we need for
our statistical analysis in order to figure out the relationship between variables (Saunders et
al., 2012, p. 177). The questionnaire was built by examining current existing study that
correlate to the deductive approach (Saunders et al., 2012, p. 176).
Moreover, the survey was conducted in only one company. However, we want to emphasize
that the company consists of many division and each division has their own portfolio. We
asked the respondent to evaluate their division project portfolio instead of the overall
organization portfolio to create variation in the responses and find more evidences for our
study.

12
2.7 Research Time Horizon
Time horizon is also an important part when designing research (Saunders et al., 2012, p.
190). Cross sectional study is the “snapshot” time horizon while the longitudinal study learns
the situation over time (Saunders et al., 2012, p. 190). Due to the time limitation we have, we
will conduct a cross-sectional study by studying the relationship of organizational learning
and project portfolio success at particular time. Our questionnaire is newly built for this study
only, so there is no secondary data that we can compare with our data in order to conducts
longitudinal study. Bryman & Bell (2015, p. 61) consider cross sectional design as generic
term for research with questionnaire and structured interviews as data collection tools.
Moreover, we consider that longitudinal studies is more appropriate if we want to test the
time effect to the relationship of both concepts or if we want to see the effect of changes in
the organization (e.g. new learning policy effect) to project portfolio success and those are
not the cases in our study.
2.8 Ethical Consideration
We interpreted ethical consideration as a standard of conduct while doing research in order
to fulfill the aim of research (being truth to knowledge), respect collaboration with parties
involved in the research and to ensure accountability, quality and integrity of the research
itself by avoiding research misconduct and conflict of interest.
In order to fulfill the research aim where we want to contribute new knowledge that fulfill
the quality criteria, validity and reliability of the measurement tools will be evaluated. The
discussion on how we fulfill these quality criteria will be elaborated in Chapter IV. In this
report, we tried to be open on every step that we took while doing research by disclosing
which parts of the research that are taken from previous studies, modified from previous
study and originally came from our thinking process. We also ensured that there were no
attempts to fabricate, falsify, or misrepresent data to promote the truth as well as avoid error.
Bryman & Bell (2015, p.129) concerns on research ethics revolves around how researcher
treat the people involved in the research and activities that should or should not be engaged
with them. Authors need to ensure that the subjects received a full disclosure of the nature of
the study, the risks, benefits and alternatives, with an extended opportunity to ask questions.
To start the research process, the studied company has been given a full understanding on the
research purpose, approach, and what kind of information that we seek from them and how
those information will be used. Informed consent from each respondent was sought prior
conducting the survey through the very first page of the questionnaire itself. We made sure
that the respondent has enough information to make an informed decision on giving their
consent. A contact email address is given for whenever they have question or doubt. As
positivist, we take every answer given by respondents as it is without any further
interpretation.
The company’s name is decided not to be disclosed in the written paper to preserve their
anonymity and avoid any damage that might come from the study result. Collected data was
securely stored and will not be distributed to other parties without company’s consent. At the

13
end of the research, all results are shared to the company in order to gain permission prior to
publishing. Researchers disclose no conflict of interest when conducting this study.
2.9 Literature Search
Literature review is crucial since a new research will be judged based on its relation with
other existing literature in the field of knowledge and therefore researcher need to be
educated on the current development, trend, debate, issues on their particular field (Saunders
et al., 2012, p. 71). Literature should be assessed by its significance and how it can fits into
the narrative that is built by the researcher (Bryman & Bell, 2015, p. 9). Ghauri & Grønhaug
(2010, p. 51) outlined the main purposes of literature review are: (1) to frame problem under
scrutiny; (2) to identify relevant concepts, methods, techniques, and facts; and (3) to help us
position the current research as each research shall contribute something new to the
knowledge.
We collected information from a vast variety of sources in order to obtain a wide range of
knowledge from previous research. The search of relevant academic articles has been
conducted using Umeå University DiVA system, Heriot-Watt University Library Resources
EBSCOhost and Google Scholar. Following keywords were used in several combinations
when searching in databases for relevant articles: Organizational Learning, Knowledge
Management, Project Strategic Alignment, Business and Project Strategy, Project Portfolio,
Portfolio Management., Project Portfolio Success Moreover, we looked into relevant journal
in Project Management field such as: International Journal in Project Management, Project
Management Journal, International Journal of Managing Projects in Business and
International Journal of Project Organization and Management.
Some articles have been cited many times and occurred frequently in another article in the
relevant subjects. We consider this as an indication of that they made relevant contributions
to the field and therefore we decided to evaluate such articles more during the literature
review activities. We found another articles cited and/or listed in the reference list for the
first couple articles and it became like snowballing effect. We always tried to avoid secondary
citation by trying to get hold of the primary resources. Primary literature sources refer to the
first time information occurs in a source (Saunders et al., 2012, p. 83) that ensures us reliable
and sufficient information subject to appropriate interpretations.
We referred to five books of research methodology to ensure that we followed the best
practice in building the thesis structure. The books are used extensively in academic and
social science research, including Saunders et al. (2012), Bryman & Bell (2015), Graziano &
Raulin (2011), Ghauri & Grønhaug (2010) and Muijs (2012). The last reference is more
focused in conducting the quantitative research with specific software (SPSS).
The deductive research approach chosen in this chapter dictates the need of hypotheses for
this study that will be built on Chapter III based on the literature study. Furthermore, how
each steps of the chosen research approach of quantitative study will be further elaborated
in Chapter IV.

14
III. LITERATURE REVIEW AND CONCEPTUAL MODEL
This chapter explains theories that constitute the foundation of the study. The concept of
project portfolio and how previous researchers measured its success is presented. In the
same manner, the concept of organizational learning and how previous researchers
measured its level are also presented. Further, current research that shows hint of linkage
between Organizational learning and project portfolio are identified. Finally the conceptual
model and hypotheses that will guide this study are drawn.
3.1 Project Portfolio
We conducted literature search by using EBSCOhost database to figure out the number of
publications in the topic, including articles, books, Master and PhD theses, periodic,
conference papers, and news. The project portfolio topic hits around 1300 topics with
substantial growth around last decade as shown in Figure 1. However, when we use the
keyword “project portfolio success” with combination of the term “performance” and
“efficiency” in lieu of “success”, the statistic we got is less than 1% of total publication or
only 12 publications listed with such keywords. The number is considerably low showing
that there are plenty room of exploration within this topic.
Figure 1 Number of Publications with Project Portfolio Topic
3.1.1 Definition
A project portfolio is a “collection of projects that are carried out in the same business unit
sharing the same strategic objectives and the same resource pool” (Aalto, 2000, p.1). The
groups of projects inside a portfolio are carried out under the sponsorship and/or management
of a particular organization (Archer & Ghasemzadeh, 1999, p. 208). Project Management
Institute (2006, p. 4) added that a portfolio, which is a component collection of programs,
projects, or operations managed as a group, aims to achieve strategic objectives. Although
the projects or programs within the portfolio may not necessarily be interdependent or
directly related, they are linked to organization’s strategic plan by means of the
organization’s portfolio (Project Management Institute, 2013, p. 3)
15
Turner and Müller (2003, p.7) defined a portfolio of projects as “an organization, (temporary
or permanent) in which a group of projects are managed together to coordinate interfaces and
prioritize resources between them and thereby reduce uncertainty”. It is more permanent in
nature than projects and created for the purpose of efficient utilization of resources across the
projects that it comprises (Turner & Müller, 2003, p.5).
Project portfolio management is a means of attaining alignment between project management
and business strategy (Artto & Dietrich, 2004, p. 144; Kaiser et al., 2015, p. 126). The
coordinated management of a portfolio delivers increased benefits to the organization (Platje
et al., 1994, p. 100). Project portfolio management becomes critical link connecting corporate
strategy, capital allocation and project implementation. Thus, the company needs frequent
and effective reviews to identify possible symptoms of portfolio inertia early and correct
them before they significantly hinder business performance (Ernst & Young, 2015). Project
portfolio management then becomes a critical management task (Cooper et al., 1997) since
it is a manifestation of business strategy that dictates the future investment of the firms
(Cooper et al., 2001, p. 361)
Project portfolio management is defined as the simultaneous management of the whole
collection of projects as one large entity (Meskendahl, 2010, p. 807). The major aim of
project portfolio management is to select and rank projects according to their viability of
adding values, to align projects with business strategy and maintain a balanced collection of
projects that are based on the most critical project measures (Archer and Ghasemzadeh, 1999,
p. 207; Cooper et al., 1997). It shall focuses on building effectiveness, therefore executing
the “right” projects (Teller et al., 2012, p. 598). Related normative frameworks and
techniques for project evaluation, selection and prioritization, resource allocation, and
knowledge sharing between projects were often the focus of earlier project portfolio
management research (Martinsuo & Lehtonen, 2007, p. 57).
Project portfolio management concerns with the usage of scarce resources. These projects
must compete for scarce resources (people, finances, time, etc.) available from the sponsor,
since there are usually not enough resources to carry out every proposed project. (Archer &
Ghasemzadeh, 1999, p. 208). Thus, projects need to be carefully selected in priority based
on those that would give the organization the most value aligned with the firm’s strategy
(Meskendahl, 2010, p. 808) and meets the organization's stated objectives without exceeding
available resources or violating other constraints.
In relation to the limited resources shared, project portfolio management includes
identification, categorization, evaluation, selection of components to best accomplish
organizational strategies. It balances conflicting demands between programs and projects by
allocating resources based on organizational priorities and capacity (Project Management
Institute, 2006, p. 5). Appropriate project portfolio decisions require organizations to absorb
external influences for portfolio and project effectiveness, adapt their portfolio to new market
opportunities and maintain innovation across projects to stay competitive (Biedenbach &
Müller, 2012, p. 622)
Blichfeldt and Eskerod (2008, p. 358) defined project portfolio management as the
“managerial activities that relate to the initial screening, selection and prioritization of project
proposals, the concurrent reprioritization of projects in the portfolio, and the allocation and

16
reallocation of resources to projects according to priority”. This definition is also adopted by
Jonas et al. (2013, p. 216) that structured the scope of the managerial activities along a
chronological sequence of generic and recursive phases: portfolio structuring, resource
management, and portfolio steering.
Cooper et al. (2001, p. 362) considered project portfolio management as a dynamic decision
process, which means that it is constantly updated and revised. During the process, new
projects are evaluated, selected and prioritized; existing projects may be accelerated, killed
or reprioritized; and resources are allocated and reallocated to the active projects. Among the
characteristics of portfolio decision processes are uncertain and changing information,
dynamic opportunities, multiple goals and strategic considerations, interdependence among
projects, and multiple decision-makers and locations.
In the literature, the concept of project portfolio management also appears in various guises.
Program management and multi-project management are examples of closely related terms
(Elonen & Artto, 2003, p. 395). Using these similarities, Elonen & Artto (2003, p. 396)
incorporate some literature of program management in their definition of portfolio
management that includes broad view on portfolio management. Part of it are the
management of interfaces between projects, co-ordination of collections of projects and
management in accordance with resource and other constraints.
Cooper et al. (1997) offered widely used objectives of portfolio management which are to
maximize the value of the portfolio, link the portfolio to the strategy and balance the
portfolio. Moreover, Cooper et al. (2001, p. 364) also discovered eight key reasons why
portfolio management is critical, namely: to achieve financial goals; to maintain competitive
position; to properly and efficiently allocate scarce resources; to forge link between project
selection and business strategy; to achieve focus; to achieve balance; to better communicate
priorities and to provide better objectivity in project selection. The project portfolio success
criteria used in this study are profoundly based on those objectives.
Success means different things to different people. (Shenhar et al., 2001, p. 699), therefore a
standardized success measurement is needed. While project success concerns doing projects
right, project portfolio success is about doing the right projects (Cooper et al., 2000, p. 18).
Project portfolio success is not simply the aggregate of project success in the portfolio.
Research on the link between project and portfolio management, has found project
management to be a mediating factor between single-project factors and portfolio
management. Thus, single-project management is important but insufficient for portfolio
management (Martinsuo & Lehtonen, 2007 p. 62). Martinsuo and Lehtonen (2007, p. 57) that
utilizes the term efficiency as an exchange to success, have explained that project portfolio
management efficiency could be determined by estimating the degree to which the portfolio
fulfills its objectives. These objectives consist of strategic alignment, balance across projects,
and value maximization. These three goals are similar with Cooper et al. (1997)’s objectives
mentioned earlier.
17
After reviewing the current literature, we propose the below definitions to be used throughout
this study:
Project Portfolio is a set of projects sharing the same strategic objectives and resource pool,
are managed under the same management/sponsorship in order to coordinate interfaces and
prioritize resources between them. The activities on managing such set of projects include
the screening, selection, prioritization and reprioritization of project, and the allocation and
reallocation of resources.
Project Portfolio Success is a performance result determined by the predefined success
criteria to meet the objectives of maximizing the value of the portfolio, linking the portfolio
to the strategy and balancing the portfolio itself.
From these definitions we can see that the project in a portfolio share the same strategic
objectives and share resources from the same pool. Therefore, there is a need to manage them
under one management in order to coordinate interfaces among them and allocate the limited
resources to the projects that need it best based on the strategic objectives. Also we can see
that the management of the project portfolio implies a set of activities, including the
screening, selection, prioritization and reprioritization of project, and the allocation and
reallocation of resources (Blichfeldt & Eskerod, 2008, p. 358). Moreover, the success of the
project portfolio will differ for organizations based on the criteria defined for each of the
organizations and the objectives of portfolio management are to maximize the value of the
portfolio, link the portfolio to the strategy and balance the portfolio itself (Cooper et al., 1997;
Martinsuo & Lehtonen, 2007, p. 57). The success criteria defined in the next section are
developed based on and congruent with these objectives.
3.1.2 Portfolio Success Dimension
Martinsuo & Lehtonen (2007, p. 64) suggested that to assess project portfolio management
and its effects the results have to be made measureable and have to cover a wider perspective
than an isolated project. This section will discuss the success criteria frequently appearing in
literature that will be adapted to be used in this study. Not all of the studied literature used
the same exact terms as, however they can be categorized into following dimension:
Dimension 1. Average Project Success
Martinsuo & Lehtonen (2007, p. 62) concluded in their study that single project management
efficiency has a crucial and significant effect on project portfolio management efficiency.
Project Management Institute (2006, p. 6) mentioned that portfolio success is measured in
terms of aggregate success performance of each single project as its components. Therefore,
the average success over all projects within the portfolio forms the first dimension of project
portfolio success. The average project success is defined as the average of single project
performance across the entire portfolio influenced also by the interdependence between
projects (Jonas et al., 2013, p. 218). To measure the concepts, we therefore have to look at
single project success criteria as discussed in the next paragraphs.
Much of the project management literature limits its attention to the traditional success
criteria of budget, schedule, and quality compliance (Shenhar et al., 2001, p. 702). However,
18
more and more research takes on a wider project perspective going beyond this “iron
triangle” in assessing the project success. Meskendahl (2010, p. 809) extended this
operational mindset by including customer satisfaction as one major project success criteria.
This notion is also used by various other authors (Teller et al., (2014); Biedenbach and
Müller, (2012);, Jonas, (2013);, and Unger et al., (2012). Shenhar et al. (2001) also
recognizes the benefit to customer as success criteria even though he separated it from the
iron the criteria of meeting time, budget, and requirements goals. Müller et al. (2008, p. 34)
proposed a more elaborated and wider perspective of stakeholder satisfaction, that will not
only includes customer but also shareholders, communities, government entities and other
related parties. This term is considered more suitable for this study.
Müller et al. (2008, p. 34) incorporated two other single project success factors: financial
results which in this study is categorized under the dimension of Product Success that will
be detailed later on; and user requirement that we argue possess the element of quality and
customer satisfaction. In conclusion, the study considers four items as part of this dimension,
which are Schedule Adherence, Budget Adherence, Quality Adherence, and Stakeholder
Satisfaction.
Dimension 2. Synergies
The coordinated management of all projects within a portfolio delivers benefits beyond the
results when each projects is managed independently (Platje et al., 1994, p. 100). This
concept is followed by Meskendahl (2010) and Jonas et al. (2013). Jonas et al. (2013, p. 218)
argued that this kind of synergy among projects within a portfolio is rarely realized in practice
due to unforeseen project contingencies and the numerous interdependences between
projects. However, they included this dimension since they believed the exploitation of
synergies represents a form of value generation. High synergy between projects may lead to
the efficient use of resources and faster learning process.
The synergy studied as success criteria in this particular study will cover interdependences
between projects in terms of technical synergy and market synergy. Technical synergy comes
in form of shared Information System platform, shared technology licenses, shared facilities
during project or shared technical resources. Market strategy concerns more on the joint
exploitation of project results or product. It may come in form of shared distribution channel
or facilities, shared infrastructure, or shared sales agreement. These two type of synergies are
choose due to its suitability to the project type context.
Dimension 3. Strategic Fit
Strategic fit incorporates the extent to which the organizational business strategies are
consistently reflected by the objectives of their projects portfolio (Jonas et al., 2013, p. 219).
Strategic fit (or also usually termed strategic alignment) has become one of the central themes
by different areas in strategic management literature. Porter (1996, p. 71) points out the need
for a strategic fit between each activity and the overall strategy of the firm. For project-based
organizations this translates into projects being the main business activities. Hence, portfolio
management has to achieve an optimal alignment of projects to each other and should only
pursue projects that are in line with the business strategy. The strategic fit of the project

19
portfolio describes the degree to which the sum of all projects reflects the business strategy
(Meskendahl, 2010, p. 809).
The strategic fit concept ensures that projects accurately reflect the organizations long term
strategies (Haniff & Fernie, 2008, p. 2). Another way to look at this relationship is reflected
in Jamieson & Morris (2004)’s research. They suggested that most of the components
comprising the strategic planning process—internal analysis, organizational structures,
control systems—have strong links to project management processes and activities. As a
result, these strongly influence an organization’s intended business strategies. Similarly,
Artto and Dietrich (2004) suggested that an important managerial challenge involved in
aligning project management and business strategy is encouraging individuals to participate
in using emerging strategies to create new ideas and renew existing strategies. Both points of
views are in-line with a two-way influences, the business/organizational strategy influences
project strategy and vice versa, presented in Alsudiri et al. (2013).
In conclusion, the third success criterion used in this study is strategic fit as also used in
previous studies such as Teller et al. (2014), Jonas et al. (2013), Biedenbach & Müller (2012),
Meskendahl (2010), Killen et al. (2008a), Müller et al. (2008), and Martinsuo & Lehtonen
(2007). Under the dimension of strategic fit, this study will assess the alignment of project
portfolio with corporate strategy, the alignment of resources allocation with corporate
strategy whereas resources allocated across the portfolio in such a way that the most effective
resources are provided to those projects with the highest strategic relevance, the alignment
between number of projects and available resources. Jonas et al. (2013) and Teller et al.
(2014) suggested the fit between portfolio and the future of the company that, in this study,
considered is more appropriate to be included in preparing for the future dimension, detailed
later in this section.
Dimension 4. Portfolio Balance
According to project management literature, a portfolio has to be balanced along a range of
dimensions to provide the best value to the organization (Cooper et al., 1997). However, there
is no consistent convention on the dimension to cover portfolio balance (Meskendahl, 2010,
p. 809). Teller et al. (2014) and Jonas et al. (2013) examined balance on technology used,
application areas and project risks. Biedenbach and Müller (2012) add the consideration of
the value of the project as well as Killen et al. (2008a). The latter study also considered
market balance. Meskendahl (2010) introduced the balance of utilization of resources along
the project execution as well as the constant generation of cash flow.
The elements of project balance mentioned in literature are sometimes not independent of
each other (Meskendahl, 2010, p. 809). High investment projects usually also constitute
longer duration or higher risk. Therefore, the elements need to be adjusted based on the
context of the studied company and then the correlation between each element shall be
examined statistically. In this study, portfolio balance will be examined by how portfolio
consists of projects with different level of risk as over-commitment to high risk projects may
jeopardize the future of the organization (Archer & Ghasemzadeh, 1999, p. 209). On the
other hand, low risk projects may not carry the high return as typical characteristics of risky
projects, resulting to lower expected return if project risk selection is too conservative

20
(Archer & Ghasemzadeh, 1999, p. 212). Moreover, schedule duration balance is considered
important since too many long term projects may cause financing or cash flow problems
(Archer & Ghasemzadeh, 1999, p. 212). Lastly, the balance between technology complexities
is also examined.
Dimension 5. Average Product Success
Project success can be argued as operational success, while the business success itself shall
related to the output of the project, either for customer or for the organization itself (Shenhar
et al., 2001, p. 702). In this study, we use the term “product success” to describe the success
criteria related to the final product as an output of the project. In the literature, economic
success is often referred to as product success measure (Killen et al., 2008a, p. 27) which is
considered as a more appropriate term for this study. The term “product success” offers a
more general and wider definition, allowing the success to not only be assessed in economical
term.
Teller et al. (2014) measured the product success by market success and commercial success
of all projects in the portfolio as inspired by the works of Shenhar et al. (2001) and
Meskendahl (2010). Both researcher used the term of business or economic success instead
of product success. Shenhar et al. (2001, p. 710) defined his business success dimension as
integration of two subsets: market performance and commercial performance. This
dimension immediately and directly addresses the impact the project portfolio may have on
the organization (Meskendahl, 2010, p. 810).
Market success describes the extent to which sales objectives like market share or sales
volumes are achieved (Shenhar et al., 2001, p. 710). These goals are often assessed in
comparison to competitors' performance to account for environmental changes. Commercial
success measures are derived from the classical financial management criteria like ROI,
profit, or break even (Shenhar et al., 2001, p. 709). Killen et al. (2008a, p. 335) argued that
the effectiveness of a portfolio is ultimately determined by financial return generated from
project portfolio investments. Biedenbach and Müller (2012) also considered the
achievement to financial objectives as their success criteria whereas Martinsuo & Lehtonen
(2007) focused on the optimal financial return.
This study will measure the commercial in terms of financial success as well as market
success. Teller et al. (2014) also measured the achievement of amortization period, however
it’s considered hard to measure for the context in our study since the life time duration of
each project outcome may reach at least 15 years.
Dimension 6. Preparing for the Future
The benefit to the performing organization is not always regarding the immediate result as
described by the previous five dimensions but can be extended to future orientation, related
to how the project can help shape the organization’s future by opening new opportunities
(Shenhar et al., 2001, p. 710, Meskendahl, 2010, p. 810). This dimension examines the long-
term benefits and opportunities from the projects, which are mostly indirect and can only be
realized long after the projects have been completed. Preparing for the future is the longest-
term dimension that addresses the preparation for the organization’s future challenge

21
(Shenhar et al., 2001, p. 810). It can create leapfrog advantages for the performing
organization and open up opportunities (Shenhar et al., 2001, p. 811)
Typical perspectives highlighted by Shenhar et al. (2001, p. 713) are the creation of new
markets, development of new or improved products, processes and technologies. Meskendahl
(2010) adapted Shenhar et al. (2001)’s concept into portfolio context and also covered the
sufficiency of new technologies and competencies developed within the project portfolio. In
this study we will cover how the portfolio develops new technologies and competencies/skills
as well as how it help in shaping the future of the organization (create new market and
opportunities).
The six dimensions mentioned above are those who frequently appeared in current literature
and we considered sufficient to measure the project portfolio success. However there are
couple other dimensions used by previous research that are not adopted to be used in this
study with reasons stated in the next paragraph.
Other Dimensions
Teller et al. (2014) used the dimension of Economic Success that measured the success of
the performing organization or strategic business unit. It is argued that these dimensions are
not direct portfolio success and is something that comes as a result of the portfolio success.
Martinsuo and Lehtonen (2007) considered to measure whether the portfolio management
focuses on the right issues whereas the definition of “right issues” is considered vague and
therefore the concept is not used in this study.
Table 1 shows the comparison of dimension used in this study with the literature mentioned
in above narrative. Table 1 Comparison of Success Criteria Dimension
Project
SuccessSynergies Strategic Fit
Portfolio
Balance
Product
Success
Preparing for
the Future
Current Study X X X X X
Teller et al. (2014) X X X X X
Jonas et al, (2013) X X X X
Biedenbach and
Müller (2012)X X X X
Meskendahl (2010) X X X X X X
Unger et al (2010) X
Killen et al. (2008) X X X
Müller et al. (2008) X X
Martinsuo and
Lehtonen (2007)X X
Shenhar (2001) X X X
X
DimensionStudy
22
3.2 Organizational Learning
3.2.1 Definition
Organizations are reeling from discontinuities created by a growing level of globalization,
heightened volatility, hyper competition, demographic changes, and the explosion of
knowledge (Prange, 1999, p. 23). Hitt et al., (1998, p.24) claimed the birth of a “new
competitive landscape” due to two themes of drivers namely technological revolution that
led the intensive production of knowledge and shortened the products lifecycle, and
incremental globalization presented through international economic agreements and the
liberation of the emerging markets. Both of these factors shaped the new competitive
landscape characterized by the emergence of hyper competitive markets; the high need to
innovation; the focus on the needs and expectations of customers; in addition to that changes
in the roles of employees.
Concepts such as organizational learning have been introduced to the business and
organizational research community more than half century ago as an approach to address the
challenge of uncertainty that affects every decision making process. Through continuous
learning the organization can increase its “knowledge intensity”, which is a prerequisite for
coping with the previously mentioned challenges (Prange, 1999, p. 23). It could be said that
learning is now widely accepted as the currency of survival in an era of constant change
(Senge, 1997, p. 47). In the same sense, Prahalad and Hamel (1990, p. 82) argued that the
competitive advantage of a corporation is derived from the "core competencies" which in
turn are generated based on collective learning.
From a more empirical perspective a massive number of studies provided evidences about
the multiple positive impacts of learning on different aspects of organizational performance.
This includes the overall performance improvement (Lopez, et al. 2005); the reinforcement
of flexibility (Santos-Vijande, et al., 2012), the improvement of the capability of innovation
(Salim & Sulaiman, 2011) and many other outputs. Due to the claimed importance and role
of organizational learning, the numbers of publications in organizational learning (and
learning organization) have been growing as a “volcanic activity” (Bapuji & Crossan, 2004,
p.397).
In order to have a rough estimate of the growth of this phenomenon, we used EBSCOhost
database to develop a progress chart of the number of publications that include in the title
either the term “Organizational Learning” or “Learning Organization” (considering the (z)
and (s) spellings). The start date of the progress chart is chosen to be 1990 which is considered
as a milestone in the history of organizational learning after the issuance of Peter Senge’s
break through book "The Fifth Discipline: The Art and Practice of The Learning
Organization". Stimulated by this book, the concept of organizational learning has flourished
in the nineties decade (Garvin et al., 2008, p. 2).The publications types in the search include
articles, books, Master and PhD theses, periodic, conference papers, and news.
The results confirm the phenomenal growth in the interest of researchers in the organizational
learning discipline. While the total number of organizational learning publications was
around (400) till 1990, the number increased by approximately 15 times by the year 2000

23
with nearly (6000) publications, and by 2015 the total publications could be estimated as
more than (20,000).
Figure 2 Number of Publications with Organizational Learning/Learning Organization Topic
While the sharp and fast growth in the organizational learning publication is obvious, it’s
clear that until now there is no consensus in the literature on the nature of learning in
organizations (Probst & Büchel, 1997, p. 15), considering the mutual contributions from
different social disciplines to the concept of learning such as economic theory, industrial
economy, strategic management, organizational theory, and others (Garcia and Vañó, 2002,
p. 173), which indeed helped in shaping the concept of learning, nevertheless it may have
contributed to the complexity and vagueness of the concept.
One of the early attempts to define organizational learning was by Argyris (1977, p.120) who
defined it as "a process of detecting and correcting errors". Fiol and Lyles (1985, p.803)
focused on performance improvement by defining organizational learning as “A process of
improving actions through better understanding or knowledge”. Later Huber (1991, p. 89)
provided a landmark explanation by introducing the concept of “potential behaviors” rather
than specific or definite change in the behavior as an output of learning. He stated that “an
entity learns if, through its processing of information, the range of its potential behaviors is
changed”. A more recent definition was proposed by Dibella and Nevis (1998, p.28)
conceptualized learning as a capability and process in the same time that leads to improving
performance based on previous experience. On the other hand Huysman (2000, p.135)
stressed the knowledge component as the main output by defining organizational learning as
“the process through which an organization constructs knowledge or reconstructs existing
knowledge.”
Templeton et al. (2002, p.189) attempted to provide a comprehensive definition after
reviewing more than 70 definitions of organizational learning and reached this definition:
“organizational learning is the set of actions (knowledge acquisition, information
distribution, information interpretation, and organizational memory) within the organization
that intentionally and unintentionally influence positive organizational change”.
500350065009500
1250015500185002150024500
1990 1992 1994 1996 1998 2000 2002 2004 2006 2008 2010 2012 2015
Estimated Number of "Organizational
Learning/Learning Organization" Publications
(Cumulative)

24
While it is evident that the nature and output of learning is still highly debatable in the
discipline, the discussion about the link between individual learning and organizational
learning is not less questionable.
Most authors (e.g. Jyothibabu, et. al, 2012; Bapuji & Crossan, 2004; Senge, 1990) agree that
organizations learn through its members. However, the importance of individual learning for
organizational learning is still considered as obvious and subtle, obvious because all
organizations are composed of individuals; subtle because organizations can learn
independently of any specific individual but not independent of all individuals (Kim, 1993,
p. 37).Garcia and Vañó (2002, p. 175) argued that individual learning is the base level
towards organizational learning. Nevertheless we cannot consider that the sum of individual
learning equals the total organizational learning (Fiol & Lylos, 1985).
Senge (1990, p. 7) emphasize on the discipline of "Personal Mastery" (i.e. personal growth
and learning), considering it an “essential corner stone” in the learning organization. He
pointed out that organizations learn only through individuals who learn. However this may
not guarantee the learning of the organization, but without individual learning no
organizational learning can occur (Senge, 1990, p. 193).
Later in this chapter, we will elaborate more on the linkage between individual and
organizational learning in addition to the mediating role of group (or team) learning through
the comprehensive learning model of Crossan et al. (1999).
3.2.2 Types of Organizational Leaning
Several researchers in organizational learning focused on identifying the different types of
learning, mostly based on the depth of learning. Probably the most well-known classification
of learning is developed by Argyris & Schön (1978), the two researchers argued that two
types of leaning may occur in organizations, namely: Single-Loop learning, and Double-loop
learning. Single-loop learning involves that organizations modify the way of doing things in
order to achieve the same goals or ends (Argyris & Schön, 1978, p. 21), while Double-loop
learning is more dramatic, it involves not only finding other alternatives but also examining
the appropriateness and propriety of the chosen ends (Greenwood, 1998, p.1049). It is a
process of reflection on organizational norms themselves and very likely a restructuring of
strategies and assumptions associated with these norms (Argyris & Schön, 1978, p. 22).
Fiol & Lyles (1985) also addressed the depth of learning similarly by classifying learning
into Lower-level and Higher-level. The Lower-level learning occurs within a given
organizational structure, a given set of rules, and it leads to the development of some
rudimentary associations of behavior and outcomes, accordingly this type of learning has
partial and short term impact on the organizational performance (Fiol & Lyles, 1985, p. 807).
On the other hand, High-level learning aims to pursuit changes to the overall rules, norms
and systems rather than specific activities and it has long term effects on the organization as
a whole (Fiol & Lyles, 1985, p.808).
Many other researchers provided similar types but with different terms (Miner & Mezias,
1996, p. 89). For example Senge (1990)’s adaptive and generative learning has parallels to
the single and double loop learning; and the lower level and higher level learning
classifications (Siau & Erickson, 2008, p. 99). Accordingly we can say that most of the

25
classifications in the literature are bi-layer, the first one implies conducting few changes and
simple adjustments to the organizational behavior or the operating procedures in practice, the
other is more radical that implies major changes to one or more organizational system, or the
underlying principles that govern the mechanism of functioning.
3.2.3 Processes and Dimensions of Organizational Learning
Previous literature worked on identifying the processes and sub processes of learning and
provided models and frameworks that explain what are these processes, where they take
place, and how they interrelate.
We found that there are two frameworks in organizational learning literature that dominate
this perspective of studying learning. The first is Huber (1991) work and the other is Crossan
et al. (1999). In the following, we will explain both of the frameworks in details as they
provides the operational definition of how learning occurs in organization.
Huber (1991) Framework
This framework provided an explanation of the learning processes and constructs, in addition
to identifying the possible sources of knowledge, by incorporating the previous literature.
Huber pointed out that the learning processes are frequently interpersonal or social, but they
are occasionally more mechanical, and they can often be usefully viewed as logistical
processes (Huber, 1991, p. 89). The identified learning processes are:
Process 1. Knowledge Acquisition
This process implies the acquisition of knowledge from inside or outside the organization
through formal or informal processes (Huber, 1991, p. 91). Huber identified several sub
processes (or sub constructs) under this process according to the sources of where knowledge
could be acquired. According to Huber (1991, p. 91) part of the organizational knowledge is
a combination of the knowledge inherited at the conception of the organization and the
additional knowledge acquired prior to its birth, accordingly this learning is critical and it
affects to great extend the future of the organization and how it learns. Huber (1991, p. 91)
called this type of learning Congenital Learning. Another source of learning is the
Experimental Learning which takes place through the normal daily activities and experiences
of the organization. Usually this kind of learning occurs naturally. However, it could be
planned by the organization for specific type of knowledge (Huber, 1991, p. 91). Huber also
mentioned other sources of learning such as learning through Searching and Noticing by
scanning the external environment and monitoring organizational performance (Huber, 1991,
p. 97); Grafting knowledge by for example the acquisition of another organization (Huber,
1991, p. 97), and Vicarious Learning when the organization learns from other organization
experience or through consultants or suppliers (Huber, 19991, p. 96).
Process 2. Information Distribution
It is the process of delivering and communicating information throughout the organization.
Huber explained that information distribution is a determinant of the occurrence of learning
as the organizational units gather knowledge from other units and reproduce a “new”
knowledge (Huber, 1991, p. 100). This process is also a determinant of the breadth of learning
26
as it leads to more broadly based organizational learning. This is in contrast to the previous
idea that information distribution leads to new organizational learning (Huber, 1991, p. 101).
Process 3. Information Interpreting
Interpreting is the process of translating events, of developing models for understanding, of
bringing out meaning, and of assembling shared conceptual schemes (Daft & Weik, 1984, p.
286).Learning becomes more meaningful and valuable when several perspectives are given
to interpret information. It seems reasonable to conclude that more learning has occurred
when more of the organization's units understand the nature of the various interpretations
held by other units. (Huber, 1991, p. 102). Huber argued that several factors would impact
the process of interpreting and its quality such as the uniformity of prior cognitive maps
possessed by the organizational units; the uniformity of the framing of the information as it
is communicated; the richness of the media used to convey the information; the information
load on the interpreting units; and the amount of unlearning that might be necessary before a
new interpretation could be generated (Huber, 1991, p. 102).
Process 4. Organizational Memory
Organizational memory implies storing and retrieving the organizational information and
knowledge as to utilize it in future (Huber 1991, p. 105). In its most basic definition, it refers
to stored information from an organization's history that can be brought to bear on present
decisions (Walsh & Ungson, 1991, p. 61). Some authors like Argyris & Schön (1978, p. 11)
argued that organizational memory is only a metaphor. This means that organizations do not
literally remember.
The organizational memory takes many forms such as organizational culture, structure,
ecology, individuals through their implicit knowledge (Walsh & Ungson, 1991, p. 61). In his
framework, Huber stressed out the importance of demonstrating or using learning. Hence
what has been learned must be stored in memory and then brought forth from memory; both
the demonstrability and usability of learning depend on the effectiveness of the organization's
memory (Huber, 1991, p. 106), which is in its turn affected by several factors. Among those
factors are the way of distributing and interpreting the information, the method of retrieving
it, and the turnover of the individuals (Huber, 1991, p. 105).
Crossan et al. (1999) Framework
Crossan et al.´s framework (which is also called 4I’s framework) consists of four interrelated
processes which occurs through three learning levels. Below is an explanation of these
processes and their corresponding levels
Process 1. Intuiting
This is the preconscious recognition of the pattern and/or possibilities inherent in a personal
stream of experience (Weick, 1995, cited in Crossan et al., 1999, p. 525). This process affects
the manner in which individuals behave and also others in case they interact with him/her.
However, the recognizing the patterns occurs usually in spontaneous way based on previous
experience; however the recognition of possibilities is related to discovering relations

27
between factors or developing new ideas. In both cases intuiting is an essential and basic
process of learning (Crossan et al., 1999, p. 526)
Process 2. Interpreting
Whereas intuiting focuses on the subconscious process of developing insights, interpreting
begins with picking up on the conscious elements of the individual learning process (Crossan
et al., 1999, p. 526).Through the process of interpreting, individuals construct cognitive maps
about the data or information (Daft & Weick, 1984, p. 286).Individuals will perceive and
interpret the same stimulus differently, based on their established cognitive models and
values (Hambrick & Mason, 1984, p. 195). These differences and the possible equivocality
is reduced through interpreting by shared observations and discussion until a common
grammar and course of action can be agreed upon, and at this point, as the interpretive process
moves beyond the individual and becomes embedded within the workgroup, it becomes
integrative (Crossan et al., 1999, p. 528).
Process 3. Integrating
While the focus of interpreting is the change in the individual's understanding and actions,
the focus of integrating is coherent, collective action (Crossan et al., 1999, p. 528). Dialogue
and joint action are crucial to the development of this shared understanding and collective
action. The process of integrating will initially be ad hoc and informal, but if the coordinated
action taking is recurring and significant, it will be institutionalized (Crossan et al., 1999, p.
525).
Process 4. Institutionalizing
Institutionalizing is the process of embedding learning that has occurred by individuals and
groups into the organization, and it includes systems, structures, procedures, and strategy
(Crossan et al., 1999, p. 525). This process ensures that routinized actions occur. Tasks are
defined, actions specified, and organizational mechanisms put in place to ensure that certain
behaviors are in practice. (Crossan et al., 1999, p. 525).
As we can see the four processes takes a dynamic and complementary relationships, and they
spread over three levels. Jyothibabu et al., (2012) study argued through empirical research
that there is a positive relation between the three learning levels. This relationship between
processes and levels explain the dynamic nature of learning. Not only does learning occur
over time and across levels, but it also creates a tension between assimilating or exploring
new learning (feed forward learning) and exploiting or using what has already been learned
(feedback learning) (Crossan, et al. 1999, p. 532), as shown in Figure 3.

28
Figure 3 4I's Framework of organizational Learning
Source: Crossan et al. (1999, p. 532)
Crossan and Hulland (1997) operationalized the 4I framework through the “Strategic
Learning Assessment Map” (SLAM) (Crossan & Bapuji, 2003, p. 4). Consistent with the 4I
framework, the SLAM framework consist of five theoretical constructs: three learning stocks
(individual, group and organization) and two learning flows (feed-forward and feed-back)
(Bontis et al 2002, p. 441).
The concept of stocks of learning is explained by Bontis et al (2002, p.441) as “those that
reside within a level: individual, group, and organization”. However it is not quite clear what
does the “learning stock” mean in general, is it the knowledge, the capabilities that generate
knowledge, or both? Accordingly we established a personal communication with Prof. Mary
Crossan, a co-author of Bontis et al (2002) paper, to confirm our understanding.
Based on that we can conclude that stocks are any input, output of learning, or a process that
generates action or knowledge within one level, also importantly it is an input to the process
of learning between levels (M. Crossan, personal communication, November 26, 2015).That
means the capabilities for employees which are inputs to learning that would generate new
knowledge are learning stocks, and the process that would lead to a common understanding
within group is also a learning stock. Moreover, the output of learning that could be a
behavior (i.e. developed system to support the strategy) or new knowledge (e.g. the
knowledge of employee about doing the job) similarly considered a stock. These stocks can
be distinguished from the flows of learning across levels to create feed-forward and feed-
back.

29
The 4I represent a significant contributions to the organizational learning literature, we
consider it a comprehensive learning framework as it considers the different entities (or
levels) of learning and it explains clearly how the learning processes have a dynamic nature
occurring among the different levels. Mintzberg et al. (1998, p. 212) acknowledged the
framework as “particularly insightful” in their discussion of the organizational learning
school of strategy. However, there are only few empirical studies (e.g., Bontis et. al, 2002;
Al Hadla, 2013; Dicle & Köse, 2014) deployed this framework (or the SLAM) to
conceptualize the organizational learning
Thus in this study we are interested in deploying the five constructs of the SLAM framework
as dimensions of organizational learning as to develop the conceptual model and measure
organizational learning. These dimensions are defined in accordance with the four processes
of the 4I’s framework as below.
Dimension 1. Individual Learning Stock
The individual learning stock is the individual competence, capability, and motivation to
undertake the required tasks. (Bontis et al., 2002, p. 443). In this sense, the individuals have
to obtain the proper capabilities and skills that allow them to conduct the two processes of
intuiting and interpreting that have been explained above. However, the skills are not
sufficient, as the individuals need to be motivated and feel the energy to undertake these
processes. Thus the Individual Learning Stock dimension is measured through several
variables in the SLAM instrument among them: individual technical competence; individual
creative capability; individual motivation in terms of sense of accomplishment, confidence,
energy level, and growth ability.
Dimension 2. Group Learning Stock
The group learning stock is defined as group dynamics and the development of shared
understanding (Bontis et al., 2002, p. 443).Similarly, Senge (1990, p. 236) explained team
learning as a process of aligning and developing the capacity of a team to create the results
its members truly desire, and it builds on the disciplines of developing a shared vision and
the personal mastery. The Group Level captures the processes of interpreting and integrating
the individual thoughts and insights resulted from the intuiting as to move them up to a
common language and shared understanding. Thus, this dimension is measured in SLAM
instrument by: how group members share and understand each other’s ideas, successes,
failures and issues; dynamics in terms of conflict resolution, group adaptability, diversity
encouragement, and flexibility.
Dimension 3. Organizational Learning Stock
The organizational learning stock is defined as the alignment between the non-human
storehouses of learning including systems, structure, strategy, procedures, and culture, given
the competitive environment (Bontis et al., 2002, p. 443). The organizational level captures
the Integrating and institutionalizing processes of learning taking place, which leads to
embedding both individual learning and group learning in the non-human aspects of the
organization.

30
In this sense, the organizational learning stocks could be understood as the organizational
memory and this learning needs to be aligned so that systems, structures, and procedures
support a strategic orientation that positions an organization well within its competitive
environment (Bontis et al., 2002, p. 443). This dimension is measured in the SLAM
instrument by: future strategy alignment with the environment, organizational structure’s
alignment with strategy, effectiveness and efficiency of procedures; the quality and currency
of organizational systems; trust culture inside organization.
Dimension 4. Feed-Forward Learning (Flow)
Feed-forward learning is defined as whether and how individual learning feeds forward into
group learning and learning at the organizational level(e.g. changes to structure, systems,
products, strategy, procedures, culture) (Bontis et al., 2002, p. 445). In other words, the feed-
forward learning means whether the learning stocks are flowing from the lower level to the
upper level starting from individuals through the processes of intuiting, interpreting,
integrating, and to be finally institutionalized and thus a new organizational knowledge is
explored or constructed. It is measured in the SLAM instrument by: whether and how
knowledge is communicated between individuals and groups, how individuals affect groups
and the organization, and how group(s) affects organization.
Dimension 5. Feed-Back Learning (Flow)
Feed-back learning is defined as whether and how the learning that is embedded in the
organization (e.g. systems, structure and strategy) affects individual and group learning
(Bontis et al., 2002, p. 445). The feed-back learning represents the using of the organizational
memory or the exploitation of the embedded institutionalized learning by groups and
individuals. It is measured in the SLAM instrument by: how policy, procedures and system
affects individual work; how organizational reward system affects groups; whether group
decisions are supported by individuals; how the information systems (includes files and
database) support work; and the training system;
As a conclusion of the analysis of the previous presentation of organizational learning
literature, we can observe a set of common themes in approaching organizational learning,
as well as several problematic issues that accompanied the development of this concept. First,
organizational learning is a "process" or/and a "capability" that is practiced in (or used by)
organizations with the aim to achieve positive value or result, such as improving performance
improvement and adapting to environmental changes.
Second, learning in organizations takes place in three interrelated levels: individual, group
(or team), and organizational. Third, the debate around organizational learning could be
traced originally to the debate between the schools of individual learning, in its simple form,
whether learning is cognitive, i.e. implies change in the knowledge of human or organization
or is behavioral, i.e. it must result in changing an observable behavior (Leroy &
Ramanantsoa, 1997, p. 872-873).In this context, we can interpret that the definitions of
Templeton et al. (2002) and Huysman (2000) belong to the cognitive school while the
definitions of Argyris (1977) and DiBella & Nevis (1998) are closer to the behavioral school.

31
The definition of Huber (1991) could be considered as a moderate view as he suggested the
concept of potential change.
Finally, differences between researchers in approaching organizational learning from process
and mechanism perspective, the capabilities (i.e. inputs or facilitators of learning), or the
output and results perspectives added a new dimension of complexity and vagueness (See
Table 2).
Accordingly we propose the below definition of organizational learning and adopt it through
this study:
Organizational Learning is a continuous and dynamic process of exploiting an existing
knowledge, or constructing a new knowledge and embed it in the organization through the
sub processes of intuiting, interpreting, integrating and institutionalizing; that take place
among individuals, groups and the organization itself in planned or non-planned way, which
results in positive (or negative) change(s) in the behavior/knowledge of the
individuals/groups/organization.
We can see that this definition conceptualize learning as a normal process that is practiced
continuously by organization whether in intention to acquire knowledge, or naturally based
on the organization' experiences and activities; however the complexity of this process
requires a regulatory framework in order to maximize the positive outcomes of learning.
Also the definition explains that the learning process implies acquiring a new knowledge or
retrieving and using an existing knowledge through a dynamic process among individuals,
groups, and the organization. Moreover exploring (constructing) new knowledge through
feed-forward learning may result in changing the cumulative organizational knowledge only
or most likely it could also be accompanied by some behavioral change. Similarly, exploiting
the previous knowledge through feed-back learning may change the knowledge/behavior of
the groups and individuals. More over these changes may not be necessarily positive.
Table 2 shows the comparison of perspectives of organizational learning used in this study
with a sample of the relevant literature.
Table 2 Perspectives of Organizational Learning in Literature and Current Study
Perspective
Study
Learning
Processes
Learning
Types
Learning
Stocks
Learning
Flows
Learning
Capabilities
Current study X X
Bontis et al. (2002) X X
Crossan et al. (1999) X X X
DiBella & Nevis (1998) X
Crossan & Hulland (1997) X X X
Dixon, (1992) X
Huber (1991) X
Senge (1990) X X
Fiol & Lyles (1985) X
Argyris & Schön (1978) X

32
3.3 Organizational Learning and Project Portfolio Linkage
The ability to learn is raised as one of the major sources of sustainable competitive advantage
in many companies (Artto & Dietrich, 2004, p. 153). Hence, in their strategic business
management in multiple-projects environment framework, they incorporates learning
through flexible decision making processes, board meeting events or other communication
platform where a group of is gathered together. Those elements are central aspects that may
play an important role for knowledge-sharing meetings and meetings for learning (Artto &
Dietrich, 2004, p. 157).
Elonen & Arrto (2003, p. 398) identified problems in multi project environment and the
second priority problem out of seven is related to a lack of competent project managers and
other project personnel as the signage with the mismanagement of personnel competencies
as one of the causes. On portfolio level, Elonen & Arrto (2003, p. 400) mentioned that no
feedback given to project level to help guide projects to a right direction as one of problems
in managing multi-project environments. Feedback is also one of the flow elements in
Crossan & Hulland’s (1997) SLAM framework
Lycett et al. (2004, p. 291) mentioned that the knowledge transfer aspect has been neglected
in multi project management practices. Projects are considered a transient phenomenon and
very few companies have invested their resource on building the means to identify and build
upon transferable lessons in project management area (Cooper et al., 2002, p. 214) even
though transferring learning has been noted as one of the key factors leading to consistently
successful projects (Cooke-Davis, 2002, p. 189). The intense pressure of projects make
project managers just go on with the project and neglect learning process including learning
from the past failure (Cooper et al., 2002, p. 214). Knowledge transfer has only been given a
cursory reference and it is argued that knowledge and information sharing between projects
should be a cornerstone of effective multi project management (Lycett et al., 2004, p. 291).
Reich et al. (2014) demonstrated that knowledge management that is focused on knowledge
alignment, impacts business-related project performance. It can be argued that in a
projectized organization, one of the main performance criteria is the success of project
portfolio. The focused strategy would therefore entail attention to build project knowledge
stock, create an enabling environment and encourage the true practice of learning (Reich et
al., 2014, p. 598-599). Knowledge alignment cannot be achieved without knowledge sharing
because congruence of knowledges cannot readily be achieved without sharing (Reich et al.,
2014, p. 592). Knowledge sharing is part of the Learning Flow concept introduced in Bontis
et al. (2002, p. 445) study presented earlier as literature on organizational learning.
Killen et al.’s (2008b, p. 335) study indicated that project portfolio management and
organizational learning are dynamic capabilities enhancing an organization’s ability to
achieve and maintain competitive advantage. The study concluded that organizational
learning processes create a continual evolution and adaptation of the capability to manage
project portfolio (Killen et al., 2008b, p. 337). The organizational learning capability
becomes a pre-condition for the development and evolution of a sustainable project portfolio
management capability as it enables an organization to learn and adapt (Killen et al., 2008b,
p. 337) that will determine the outcomes of the portfolio (Killen et al., 2008b, p. 340).

33
Mainga et al. (2011) studied the perceived importance of different inter-project learning
mechanisms and their perceived impact in developing project competencies. They argued
that knowledge accumulated across a consecutive series of projects in project based firms
can enhance their market performance (Mainga et al., 2011, p. 94). The inter project learning
taken place in studied company mostly geared to improve the traditional project parameters
(capacities to make better estimates of project costs, schedules, and chose right project
methodology) (Mainga et al., 2011, pp. 111-112). Those parameters are part of the success
criteria established in Chapter 3.1.
3.4 Hypotheses and Conceptual Model
The hypotheses of this study are developed based on the presented literature about the linkage
between the Organizational Learning and Project Portfolio, the theoretical model of
organizational learning developed by Crossan & Hulland (1997), the empirical study of
Bontis et al. (2002) and the project portfolio success constructs suggested by several current
research
The first main hypothesis is concerned with learning stocks and their impact on the project
portfolio success. The relationships between the stocks of learning and business performance
have often been assumed, but there is few empirical evidence to support this perspective
(Bontis et al., 2002, p. 445). Bontis et al.’s (2002) study provided evidence of the positive
relationship between organisational learning stocks (individual, group and organisational)
and the organisational performance in general.
Also, several researchers argued (often without empirical evidence) for the important role of
learning and knowledge in project and portfolio management performance (see previous
section 3.3)
Accordingly, we assume in this study that as the level of learning stocks increases, the project
portfolio success is higher.
H1: There is positive impact of the Learning Stocks on the Project Portfolio Success
These main Hypotheses will be tested on each of the learning levels through three sub
hypotheses:
H1a: There is positive impact of the Individual Learning Stocks on the Project Portfolio
Success
H1b: There is positive impact of the Group Learning Stocks on the Project Portfolio Success
H1c: There is positive impact of the Organizational Learning Stocks on the Project Portfolio
Success
In the second hypothesis we combine the concepts of learning stocks and learning flows.
Bontis et al. (2002) concluded that there is a negative association between the misalignment
between flows and stocks of learning and the business performance. Misalignment exists
when the organization’s learning stocks level is different than its learning flows level. This
difference results in learning bottlenecks for the organization which has adverse effects on
the efficiency and effectiveness of learning.

34
We assume in this study that if the organization has the knowledge, advanced systems,
creative culture, and proper strategy but these components are not “flowing” efficiently and
systematically to groups and individuals, or/and not managed to be utilized by groups and
individuals this would cause a learning inertia that affects negatively the project portfolio
performance, as for example the established project management tools are not actively used
by project managers, or the previously lessons learned are not incorporated in the portfolio
performance assessment, this would negatively influence the project portfolio success.
In the same sense if the individuals have the capacity and motivation to do their work and
provide new ideas and insights, however these insights are not elaborated and utilized by the
organization directly or through broader discussions with groups of work that validate the
ideas or enrich them, this will deny the organization from getting benefits of individual and
group capabilities and ultimately this would have a negative impact on the project portfolio
success
H2: There is negative impact of the Misalignment between Learning stocks and flows
on the Project Portfolio Success
The conceptual model constructed for this study is depicted in Figure 4:
Figure 4 Conceptual Model
The literature review conducted in this chapter helped us to choose the most suitable
construct and dimension that will be translated into a questionnaire as measurement tools in
Chapter IV. The conceptual model and hypotheses drawn in this chapter are the basis for us
to arrange the usage of data measured by such questionnaire.
Average Project
Success
Project Portfolio
Success
Synergies
Strategic Fit
Portfolio Balance
Average Product
Success
Individual-Level
Learning Stocks
Group-Level
Feed-Forward
Learning Flows
Feed-Back
Organizational-
Level
Organizational
Learning
Mis
alig
nm
en
t
Preparing for the
Future
+
-

35
IV. EMPIRICAL STUDY
This chapter explains the practical method conducted for this study. We describe the
procedure used in designing the questionnaire, and provide explanations of the data
collection method and statistical analysis procedures.
4.1 Construct Measurement Method
4.1.1 Questionnaire Design
The data collection technique that has been found appropriate for this study is a standardized
questionnaire, which was carried out mainly as an online survey. The usage of internet based
system has significant advantage where the population is geographically dispersed as in this
study. The software will automatically tabulate the result (Saunders et al., 2012, p. 401) thus
removing mistakes in translating the data. Another advantage of online questionnaire method
is its low cost. It promotes efficiency and enable respondents to give answer at their own
pace and convenience. The disadvantages include less spontaneous response and the need of
constant follow up, especially given the short sampling period.
Since internet-mediated questionnaires are administered via a website, the layout and
structure needs to be attractive and easy to navigate for the respondent. Therefore we created
a highly structured questionnaire consisting of standardized questions that were grouped into
three main parts (I. Organizational Learning; II. Project Portfolio Success; III Demographic
Questions). An opening statement was attached to explain our research purpose and to seek
their agreement to participate in this research. Contact information of the researchers were
provided in case of respondents having any questions or issues. During the data collection,
several respondents have used the contact information to clarify several issues such as to
confirm the clarity of each statement as well as to discuss the implication of the study itself.
As previously outlined in the literature review, the organizational learning construct will
adopt the Strategic Learning Assessment Map (SLAM) framework proposed by Crossan and
Hulland (1997). Organizational learning components will be analyzed as: Learning Stocks
(Individual, Group, Organizational level) and Learning Flows (Feed-forward, Feed-back).
Accordingly, organizational learning misalignment is measured through the difference
between Learning Stocks and Learning Flows. However, we conducted our own analysis on
each item from the original study and adapted based on our study context. Some of the
statements were eliminated while others are rephrased to give clarity. The differences
between the original and current items as well as justification for its adaptation is explained
in Appendix 1
The project portfolio success is adopted from several studies as presented in Table 1. Most
of the questions were adopted from Teller et al. (2014). This study has been evolved since
the first time it was introduced in 2011 and we adopted the latest version where the project
portfolio success is a second order construct. The questionnaire was then complemented by
questions from Jonas et al. (2013), Biedenbach & Müller (2012) and Müller et al.(2008) for
constructs that are not covered by Teller et al. (2014). The final compilation of items used on
this study and its origin study can be found in Appendix 2.
36
All the items derived from previous research were measured by using the Likert scale,
ranging from 1 to 7, where 1 means that the respondent strongly disagrees with the statement
and 7 means that the respondent is strongly agrees with the statement. Leitz (2010, p. 265)
mentions that the desirable Likert-type response scale length are from 5 to 8 options and that
inclusion of a middle option increases the validity and reliability of a response scale.
Therefore we consider that the seven scale we used constituting an odd number with middle
option is appropriate. The seven point scale is used for both organizational learning and
project portfolio success measurement to maintain consistency and to avoid confusion of the
respondent
We aim to get true responses that are as close as possible to the real situation. Therefore, we
do not want to force respondent of answering the question that they have neither knowledge
nor experience about it. For such situation, we give an option of “Do not know”. Leitz (2010,
p. 266) encourages the practice of including “Do not know” in order not to encourage
respondents to choose a substantive response option when they hesitate. Moreover, to ensure
the consistency of the respondent’s answer, we reversed some of the questions. By doing
that, we could identify whether the respondents are truly reading all the statement and not
just blindly fill the questionnaire.
The demographic section is put as the last part as an effort to avoid the negative feeling about
the provision of personal information that might impact their behavior when answering the
questions after filling out the rest of the survey (Leitz, 2010, p. 257). While the first two
sections have been fully detailed earlier, the demographic questions consist of:
1. Gender and Age
The purpose of taking this data is to see whether the respondents we have are
reflecting the population by comparing the distribution percentage of gender and age
category.
2. Managerial level
The purpose is to see representativeness of each managerial level and to later on
identify if there is a different level of perception between each managerial level.
3. Duration of the respondent’s employment in current organization.
The purpose is to identify their familiarity with the organization and therefore to
which extent they have experienced the organizational learning and how much
knowledge they have on the organization’s project portfolio.
4.1.2 Pilot Test
A pilot study was conducted to test the suitability and clearness of the instructions, questions,
and statements prior to the full-scale research. Another purpose is to identify the technical
problems that might arise during the data collection period. In the exploratory stages of some
research projects, such as a pilot survey, a non-probability sample may be the most practical
(Saunders et al., 2012, p. 233). However, Saunders et al. (2012, p. 272) suggested to avoid
using members of respondents that will be targeted in the full scale research as it may affect
the representativeness of the result. Thus, we contacted professionals who are comparable
and have similar characteristics to the targeted respondent. Twelve (12) practitioners
participated on the pilot test and gave considerably good insight on the context.

37
From the pilot test result, we needed to modify and reduce several statements that were
considered as not suitable to the studied company’s nature, gave ambiguous meaning or were
unclear. We referred back to the original literature and ensured that the modification and
reduction will not destroy the purpose and what is supposed to be measured in that construct.
We also identified the need to provide a local language version of the questionnaire and the
average duration required by respondents to fully complete the whole questionnaire. Hence,
we included this in the final questionnaire.
4.2 Data Collection
4.2.1 Population and Sampling Technique
Population is the universe of units from where the sample is drawn (Bryman & Bell, 2015,
p. 187). The population in this study is all personnel that has high knowledge on project
portfolio. This criterion is only related to project portfolio since we assumed that
organizational learning is embedded in the organization’s operation and therefore is
experienced by all aspects of the organization. The population is then narrowed down into
managerial personnel and project management office personnel. We also limited the
minimum working duration for the personnel to ensure their knowledge level of the project
portfolio and experience level with organizational learning inside the organization. We
assumed that the appropriate threshold for a non-managerial and lower managerial position
is one year. For a middle and higher managerial position, we used lower threshold of six
months since we assumed people in those positions would seek out and learn more regarding
the organization before joining the organization itself. These threshold points were being
consulted with company representative prior to data elimination to confirm its suitability.
Census is the effort to enumerate the entire population (Bryman & Bell, 2015, p, 188). We
distributed the questionnaire to all personnel in the population that constitute as an effort to
conduct census. Therefore, when we interpret the result we will evaluate whether respondents
who agreed to participate in our survey are representative of the full census.
In order to obtain representative data and decrease biases of the analysis it is substantial to
attain a high response rate (Bryman & Bell, 2015, p. 199; Saunders et al., 2012, p. 267). It is
the total number of responses divided by the total number of people in the population (or
sampling in the research where sampling is used) after the exclusion of ineligible responses
Saunders et al., 2012, 680). The response rate we got was 70.3%. 123 responses out of 175
targeted respondents answered the questionnaire.
Another approach that we can take when we do not have access to the entire population is
sampling. There are two different sampling approaches: probability sampling that entails the
sample has been randomly selected and that every member in a population has an equal
chance of being included in the sample and non-probability sampling that a sample is not
randomly selected (Bryman & Bell, 2015, p. 187). We want to point out that these sampling
techniques could have been appropriate to use for this study as well. However, we had a
unique chance to reach the whole population; we decided that census will benefit this study
more as the result will have higher generalizability and representativeness.
38
4.2.2 Questionnaire Distribution
To distribute our questionnaire, an email with a web link to the web-based questionnaire was
sent to all identified respondents. The respondents were given the choice to administer their
response in English or Bahasa Indonesia. The English version can be found in Appendix 3
while the Bahasa Indonesia version can be found in Appendix 4. To increase the response
rate, we tried to give other options of questionnaire type so they can choose which form is
more comfortable for them to fill out. The other options are to fill out a Microsoft Word
based questionnaire then send the file to our email and hardcopy version.
4.3 Quality Criteria
The quality criteria includes validity to ensure whether we are measuring what we want to
measure (Muijs, 2012, p. 56) and reliability that refers to measure consistency (Bryman &
Bell, 2015, p. 169). On this study we will establish the three aspects of validity including
content validity, criterion validity and construct validity (Muijs, 2011, p. 56). Content
validity refers to whether the content of our measurement tools is right to measure the concept
(Muijs, 2012, p. 57). The criterion validity concerns with whether the measures able to make
accurate predictions (Saunders et al., 2012, p. 429). Construct validity refers to whether the
measurement tools actually measure the present of construct intended to be measured
(Saunders et al., 2012, p. 304).
The second quality criteria is reliability. Although there are many ways to test the reliability
of scales in a questionnaire, the most commonly used method to calculate reliability
coefficient is Cronbach’s Alpha. This statistical tool consists of an alpha coefficient, which
should have a value between 0 and 1 coefficient ought to be above at least 0,70 in order to
determine that the scales combined measure the same things (Saunders et al., 2012, p. 430,
Bryman & Bell, 2015, p. 169).
Generalizability concerns about whether the research can be applied to those other than the
ones who become respondent in the study (Bryman & Bell, 2015, p. 174-175). The
replication is defined as the possibility for future researchers to repeat a study (Bryman &
Bell, 2015, p. 50). Different reasons urge them to replicate or re-evaluate a research, such as
willingness to verify the findings or to extent the study in different contexts (Bryman & Bell,
2015, p. 50). The possibility to replicate is also an indication of the quality and validity of
the findings (Bryman & Bell, 2015, p. 176). Therefore all aspects of the research should be
explicitly explained in detailed manner concerning the methods (Bryman & Bell, 2015, p.
176). If not, it could lead to contingent questions regarding the research process or
impossibility to replicate a study (Bryman & Bell, 2015, p. 50)
The discussion on these four criteria specifically for this study will be elaborated more on
Chapter VIII after the conclusion

39
4.4 Model Validation - Quantitative Data Analysis
4.4.1 Descriptive Statistics
Descriptive statistics were used to analyze our data, as they permit us to describe and compare
variables numerically (Saunders et al., 2012, p. 502). The mainly used central tendency
measure is the mean. However we will also display the mode and median as part of our
descriptive analysis. Mean is the average of all numerical data, mode is the value that occurs
most frequently while median is the middle value of ranked data. From all the three values
we can further analyze the dispersion of the data that is also considered important (Saunders
et al., 2012, p. 506) in form of standard deviation.
Descriptive analysis was conducted for every statement in our questionnaire and used to help
our analysis. The result of the descriptive analysis may also help the organization to
understand their current position and realize their weaknesses. They might use it to focus on
specific development points as well as comparison shall they decide to reassess their
condition in the future.
4.4.2 Regression Analysis
In order to test our conceptual model, proved the relationship between constructs, we used
bivariate and multivariate regression analyses. The regression coefficient enables researcher
to assess strength of relationship between numerical dependent and independent variable(s)
(Saunders et al., 2012, p. 523). Therefore, this study employed regression analysis to examine
the relationship between the independent variables (Organizational Learning Stocks or
Organizational Learning Misalignment) with the dependent variable (Project Portfolio
Success). To process the collected data, the statistical analysis program SPSS was used. Since
most of our questionnaires were distributed digitally, the result did not have to be entered
manually to the statistic program and therefore human error is minimized.
Significance level is important in regression analysis since it measures the probability that
the occurred relationships are generalizable to the population (Bryman & Bell, 2015, p. 358).
A very low significant value (in this study we used criteria of less than 0.05) shows that the
resulted coefficient is unlikely occurred by chance alone. In reverse, a greater than 0.05 value
can be concluded as that the coefficient could have occurred by chance alone (Saunders et
al., 2012, 523). The strength of the relationship in the regression is measured by R-square,
which always is between 0 and 1 value. The value shows how much of the variance in the
dependent variable is explained by the independent variable(s) in term of percentage
(Saunders et al., 2012, p.523).
The result from the data collected and processed by using methods explain in this chapter
will be presented in Chapter V. The interpretation of the result will be further discussed in
Chapter VI and concluded in Chapter VII.

40
V. EMPIRICAL FINDINGS
This chapter presents findings and results from the survey, including the demographic data,
the descriptive statistics, and the statistical test result (Cronbach’s Alpha test result and
Regression Analysis result).
The questionnaire was distributed in two weeks period resulted into 129 responses being
received. We used the group email service to send the email to the entire managers in the
company. Therefore we had to filter the working duration once the responses were submitted.
Based on the working duration threshold, we eliminated 4 responses. We also reviewed all
the submitted responses to filter from abnormality and we found responses that had the same
values for sequential questions. We consider such responses invalid in order to ensure that
our entire responds expressed respondent’s real thinking. After elimination, we recorded 123
responses that we used for further data analysis. The response rate we counted was based on
these usable 123 responses only.
5.1 Demographics
Saunders et al. (2012, p. 267) stated that a representative sample is one that represents exactly
the population from which it is taken. Here, we will compare the distribution of age, gender,
working duration in the studied company, and managerial level proportion of our respondents
with the whole population. The gender distribution shows almost similar composition with
3% difference between the population and respondent (see Figure 5). It means that the
gathered data is good representation in terms of gender groups from our population
Figure 5 Gender Distribution Comparison
The age distribution is not showing the same proportion between the population and
respondent (see Figure 6). Younger employees are keener to participate in our study, showing
that the older group might not be represented enough in the responses that we gained.
However, if we rank the number of people for each category group, we have almost the same
order between the populations and respondents with only 2 groups (26-30 years old group
and 46-50 years old group) swapping places.

41
Figure 6 Age Distribution Comparison
On the managerial position distribution, the on the lower level of management category is
almost similar (see Figure 7). The group rank based on number of people in each category
group is identical. The first two highest level of management (CEO and Diretor) gave none
responses during the study.
Figure 7 Managerial Position Comparison
We took the data of how long the respondents have been working in the company (presented
in Figure 8) in order to filter the respondent’s knowledge on the organization’s project
portfolio as well as their experience and involvement with the organizational learning
processes. We assumed that the appropriate threshold for a non-managerial and lower
managerial position is 1 year and 6 months for a middle and higher managerial position as
previously mentioned in Chapter IV. Consequently, we eliminated responses below that
threshold point.

42
Figure 8 Working Duration Distribution
5.2 Cronbach’s Alpha
Cronbach’s Alpha test was conducted to test the internal consistency reliability of the
constructs that relates to the extent whether or not all variables of one construct are measuring
the same thing (Muijs, 2012, p. 217). It is a measure of correlations between those variables
and a higher correlation will result in a higher value (Muijs, 2012, p. 217). The alpha value
will range between 0 and 1 and we established a minimum score of 0.70 for this study based
on common practice. There might be possibility that not every construct reaches the desirable
value of Cronbach’s Alpha. In that situation, eliminating one or more item in the construct
might increase the alpha value. However, the result we gained shows that all constructs we
used passed the minimum threshold value, showing the internal reliability. Thus, all the
variables were still used for the study. The Cronbach’s Alpha values for each construct are
listed in Table 3.
Table 3 Cronbach’s Alpha Values
Construct Cronbach's Alpha Value No of Item
Learning Stocks 0.900 3
Individual Learning Stock 0.921 6
Group Learning Stock 0.920 8
Organizational Learning Stock 0.846 8
Learning Flows 0.872 2
Feed Forward Flow 0.893 7
Feed Back Flow 0.793 10
Project Portfolio Success 0.836 6
Average Project Success 0.935 4
Synergies 0.821 2
Strategic Fit 0.759 3
Portfolio Balance 0.938 4
Average Product Success 0.855 2
Preparing for the Future 0.782 2

43
After measuring the reliability of the constructs, we calculated the values for constructs
containing more than one item. By adding all items in each construct and dividing them by
the total number of items in the construct, we got the average value of the construct.
5.3 Descriptive Analysis
After measuring the reliability of our constructs with Cronbach’s Alpha, we retrieved
descriptive statistics for all the constructs to get an overview of the data collection result. The
summary of central tendency and standard deviation for each construct are depicted in Table
4 while the detail breakdown for each construct can be found in Appendix 5.
Table 4 Descriptive Statistic
Construct Mean Median Modus Standard
Deviation
Learning Stocks 4.39 4.47 5.09 0.95
Individual Learning Stock 4.81 5.00 5 1.07
Group Learning Stock 3.97 3.88 3.13 0.93
Organizational Learning Stock 4.38 4.38 5 0.96
Learning Flows 4.52 4.60 4.59 0.72
Feed Forward Flow 4.57 4.71 3.14 0.93
Feed Back Flow 4.47 4.30 4.60 1.17
Learning Misalignment 0.60 0.48 0.58 0.35
Project Portfolio Success 4.39 4.38 3.00 1.02
Average Project Success 4.58 4.00 4.00 1.18
Synergies 4.16 3.00 3.00 1.29
Strategic Fit 3.81 4.00 4.00 1.25
Portfolio Balance 4.24 3.25 3.25 1.47
Average Product Success 4.54 4.00 4.00 1.42
Preparing for the Future 5.04 4.50 5.00 1.62
From Table 4, we can see that all the means are between 3.81 and 5.04 for all the measured
construct except of learning misalignment since it was calculated by counting an absolute
value of difference between learning stocks and flows. We used a seven point Likert scale.
Thus, any value more than four can be considered as a high perception of the construct. Our
result shows that the mean value is centered in the middle of the scale. For misalignment, the
value can be considered small since it is only 10% of the maximum possible distance of 6 (in
the extreme case where one construct’s value is 1 and the other is 7).
Comparing the mean and median only, most of the constructs distribution (8 out of 15
constructs) were considered left skewed where they had a greater volume of data in the upper
portion and distortion to the left is caused by some extremely small values that pull the mean
downward so that the mean is less than the median (Berenson et al., 2012, p. 108). On the
other hand, the right skewed distribution have data concentration in the lower portion of
distribution and have extremely large values that pull the mean upward, made it greater than

44
median (Berenson et al., 2012, p. 108).There are two construct that can be considered as
having a normal distribution since their mean is the same or very close with median, which
are organizational learning stock and the overall project portfolio success.
In addition to this observation, we can notice that the highest central tendency measure of
learning stock is the individual stock while group stock has the lowest values. For the learning
flows, the feed forward flow is considered higher than the feedback flows. Comparing the
six dimensions of project portfolio success criteria, the success in preparing the future is
considered have the highest central tendency measures followed by average project success
and average product success while the lowest is for strategic fit. By looking at standard
deviation we can see the dispersion of our constructs around the mean. The values range of
our standard deviations is between 0.35to 1.62.
5.4 Regression Analysis
To test all of our hypotheses, we conducted five regression analyses with model summary
as shown in Table 6. Prior to conducting a regression, we have to ensure that we fulfill the
assumptions of regression (Berenson et al., 2012, p. 539) as follows:
• Linearity; requires that there are linear relationships between variables. This
assumption was proven by plotting the residuals versus the independent variable.
None of the plots shown any apparent pattern which proves that this assumption is
fulfilled (Berenson et al., 2012, p. 540).
• Independence of error; requires that the errors are independent. This assumption
only has to be fulfilled when data are collected over a period of time that is not the
case of this study.
• Normality; requires that the errors are normally distributed. This assumption was
proven by constructing normal probability plots of the residuals. All plots showed
that no substantial data deviate from the normal distribution line. This proves that this
assumption is fulfilled (Berenson et al., 2012, p. 541).
• Equal variance or homoscedasticity; requires that the variance of the errors be
constant for all data values. This assumption was also proven by the same plot used
to prove the linearity assumption. All plots showed that there are no major differences
in the variability of the residuals for different data values that proved this assumption
is fulfilled (Berenson et al., 2012, p. 541).
The first measure we have is “R” that measures how well the independent variable(s) predict
the dependent variable (Muijs, 2012, p. 141). However we took the square root of R to get
an accurate measure, the “R2” is also called a coefficient of multiple determinations
(Berenson et al., 2012, p. 584). The R2 value shows in percentage how many variations in the
dependent variable is explained by the variation in the independent variable(s). (Berenson et
al., 2012, p. 584). For example, the R2 value of H1a is 0.731 that means 73.1 % of the
variation in project portfolio success is explained by the variation in individual stock. Some
statistician suggest to use the value of adjusted R2 to compare different models that predict
the same dependent variables but different number of independent variables in the model and
the sample size as the measure also take into account both factors (Berenson et al., 2012, p.
585). Muijs (2012, p. 145) suggested a rough rule of thumb of how well a model fits the data
as shown in Table 5. All of our hypotheses show strong fit based on the rule of thumb.

45
Table 5 Regression Analysis Summary
Legend for Regression Analysis Variables: IS : Individual Stock
GS : Group Stock
OS : Organizational Stock
Misalignment : Learning Misalignment
PPS : Project Portfolio Success
Regression Residual Total Regression Residual Total Regression Residual
H1a 0.855 0.731 0.729 0.52897 92.132 33.857 125.989 1 121 122 92.132 0.280 329.268 0.000
H1b 0.886 0.785 0.783 0.47315 98.900 27.089 125.989 1 121 122 98.900 0.224 441.772 0.000
H1c 0.890 0.792 0.791 0.46510 99.815 26.174 125.989 1 121 122 99.815 0.216 461.436 0.000
Best Fitting
Model0.922 0.850 0.846 0.39917 107.028 18.961 125.989 3 119 122 35.676 0.159 223.906 0.000
H2 0.710 0.505 0.501 0.71810 63.593 62.396 125.989 1 121 122 63.593 0.516 123.321 0.000
Std Error
Constant 0.219
IS 0.045
Constant 0.188
GS 0.046
Constant 0.196
OS 0.044
Constant 0.174
IS 0.095
GS 0.064
OS 0.100
Constant 0.131
Misalignment 0.188
Degree of Freedom Mean SquareF Sig.
Hypothesis
Number
Unstandardized Coefficients Standardized Coeff.t Sig.
Collinearity
Hypothesis
NumberR R
2Adjusted
R2
Std Error
of the
Estimate
Sum of Squares
B Beta Tolerance VIF
H1a0.507
0.8552.310 0.023
0.809 18.146 0.000
H1b0.551
0.8862.937 0.004
0.967 21.018 0.000
H1c0.278
0.8901.418 0.159
0.940 21.481 0.000
Best Fitting
Model
0.031 0.176 0.860
0.279 0.295 4.336 0.000
0.390 0.370 4.100 0.000 0.156 4.424
0.273 3.667
0.330 0.303 3.297 0.001 0.150 4.657
H25.660
-0.71043.167 0.000
-2.085 -11.105 0.000

46
Table 6 Model Fit Rule of Thumb. Source: Muijs, 2012, p. 145
R2 / Adjusted R2 Value Fit
< 0.1 Poor Fit
0.11 – 0.3 Modest Fit
0.31 – 0.5 Moderate Fit
> 0.5 Strong Fit
The standard error of estimate value measures how much R is predicted to vary from one
sample to another (Muijs, 2012, p. 145). The standard error of estimate is a measure of the
accuracy of predictions and represents the average distance that the observed values fall from
the regression line. Conveniently, it tells us about how wrong the regression model is on
average using the units of the response variable. Smaller values are better because it indicates
that the observations are closer to the fitted line.
The sum of squares is associated with the three sources of variance: total, regression and
residual. The total variance is partitioned into the variance, which can be explained, by the
independent variables (Regression) and the variance, which is not explained by the
independent variables (Residual). The next columns are the degrees of freedom associated
with the sources of variance. The total variance has N-1 degrees of freedom where N is the
number of data/respondents (here, it is 123 data minus 1 resulting into 122). The Regression
degree of freedom corresponds to the number of coefficients estimated (including the
constant) minus by 1 (here, it is 2 coefficients for H1 and H2 while the best fitting model has
4 coefficients). Lastly, the error degree of freedom is the total minus the regression degrees
of freedom. The mean squares are sum of squares divided by their respective degree of
freedom.
The F-statistic is the Mean Square (Regression) divided by the Mean Square (Residual) and
the Sig. value shows the p-value associated with it. The p-value indicates the statistical
significance of the regression model that was run. Here, all regression models show values
less than 0.05. Overall, this indicates that the regression model statistically significantly
predicts the outcome variable. In other words, it is a good fit for the data.
From the coefficient table, the “B” value shows the unit change in value of the dependent
variable by each one unit change of the independent variable(s). The variable labeled constant
is the intercept (Muijs, 2012, p. 145). We will illustrate an example using the H1a result. The
value of project portfolio success will increase by 0.809 units when individual stock is
increased by 1 unit, given the constant value of 0.507. For the model related to H2, the value
of project portfolio success will decrease by 2.085units when misalignment is increase by 1
unit, given the constant value of 5.660. In the next column, the standard error for each of
these variables is given.
The Beta parameter is used when we want to see the effect size of each variable and the
variables were measured on different scales (Muijs, 2012, p. 145). To understand the meaning
of the value, we took the H1a result for example. If we increase individual learning stocks
by 1 standard deviation, project portfolio success will increase by 0.855 standard deviations.
Since our variables were all measured in the same 7-points Likert scale, we will use the
unstandardized coefficient of Beta value to compare the predictor effect between variables
in different regression model.

47
The final column (Sig.) shows the statistical significance of the relationship between each
independent variable and dependent variable. It shows how likely we would have found a
relationship this strong in our sample if there was not one in the population (Muijs, 2012, p.
146). It is considered statistically significant at the 0.01 level if it gives us values under 0.01.
From our result all of our inputted independent variables are statistically significant while
the ones who were not were the constant.
For H1 and H2, we conducted bivariate regression with only one independent variable for
each model. Then, we intended to find the best fitting model to predict project portfolio
success from the learning stocks by using a stepwise method. The stepwise method
essentially includes or removes one independent variable at each step, based on the
probability of F (p-value). We used the SPSS default criteria value for this regression. We
tried different regression methods such as Enter method and Backward method to verify the
Stepwise method’s result and all methods gave the same result. The best fitting model is the
model that gives the highest value of R2 or explains the variation the most. This best fitting
model is already shown in Table 6. Table 7 and 8 are the model summary comparisons of
each iteration calculated during the stepwise method.
Table 7 Stepwise Method Multiple Regression Model Summary Comparison
Table 8 Stepwise Method Multiple Regression Coefficients Table Comparison
We included a multicollinearity diagnostics when performing the multiple regressions only,
to measure the correlation level between the independent variables in the regression model.
The values for tolerance and the variance inflation factor (VIF) measures collinearity, where
the tolerance result will be between 0 and 1 and should be at least over 0.1 but preferably as
high as possible. VIF value should be as low as possible and not above 5. High
multicollinearity between independent variables means that they are highly correlated and it
is not possible to see how and to what extent the independent variables influence the
dependent variable. The tolerance value gained for this study is over 0.1 while the VIF value
is below 5 that mean the model does not have multicollinearity problem.
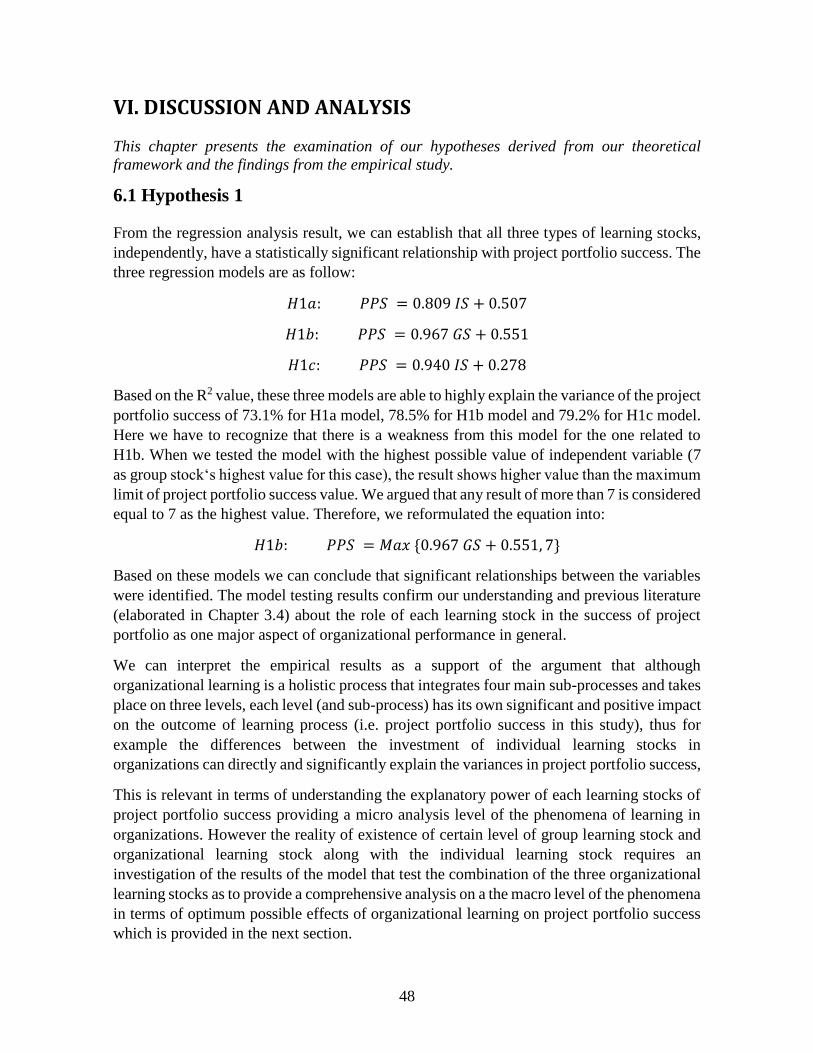
48
VI. DISCUSSION AND ANALYSIS
This chapter presents the examination of our hypotheses derived from our theoretical
framework and the findings from the empirical study.
6.1 Hypothesis 1
From the regression analysis result, we can establish that all three types of learning stocks,
independently, have a statistically significant relationship with project portfolio success. The
three regression models are as follow:
𝐻1𝑎: 𝑃𝑃𝑆 = 0.809 𝐼𝑆 + 0.507
𝐻1𝑏: 𝑃𝑃𝑆 = 0.967 𝐺𝑆 + 0.551
𝐻1𝑐: 𝑃𝑃𝑆 = 0.940 𝐼𝑆 + 0.278
Based on the R2 value, these three models are able to highly explain the variance of the project
portfolio success of 73.1% for H1a model, 78.5% for H1b model and 79.2% for H1c model.
Here we have to recognize that there is a weakness from this model for the one related to
H1b. When we tested the model with the highest possible value of independent variable (7
as group stock‘s highest value for this case), the result shows higher value than the maximum
limit of project portfolio success value. We argued that any result of more than 7 is considered
equal to 7 as the highest value. Therefore, we reformulated the equation into:
𝐻1𝑏: 𝑃𝑃𝑆 = 𝑀𝑎𝑥 {0.967 𝐺𝑆 + 0.551, 7}
Based on these models we can conclude that significant relationships between the variables
were identified. The model testing results confirm our understanding and previous literature
(elaborated in Chapter 3.4) about the role of each learning stock in the success of project
portfolio as one major aspect of organizational performance in general.
We can interpret the empirical results as a support of the argument that although
organizational learning is a holistic process that integrates four main sub-processes and takes
place on three levels, each level (and sub-process) has its own significant and positive impact
on the outcome of learning process (i.e. project portfolio success in this study), thus for
example the differences between the investment of individual learning stocks in
organizations can directly and significantly explain the variances in project portfolio success,
This is relevant in terms of understanding the explanatory power of each learning stocks of
project portfolio success providing a micro analysis level of the phenomena of learning in
organizations. However the reality of existence of certain level of group learning stock and
organizational learning stock along with the individual learning stock requires an
investigation of the results of the model that test the combination of the three organizational
learning stocks as to provide a comprehensive analysis on a the macro level of the phenomena
in terms of optimum possible effects of organizational learning on project portfolio success
which is provided in the next section.
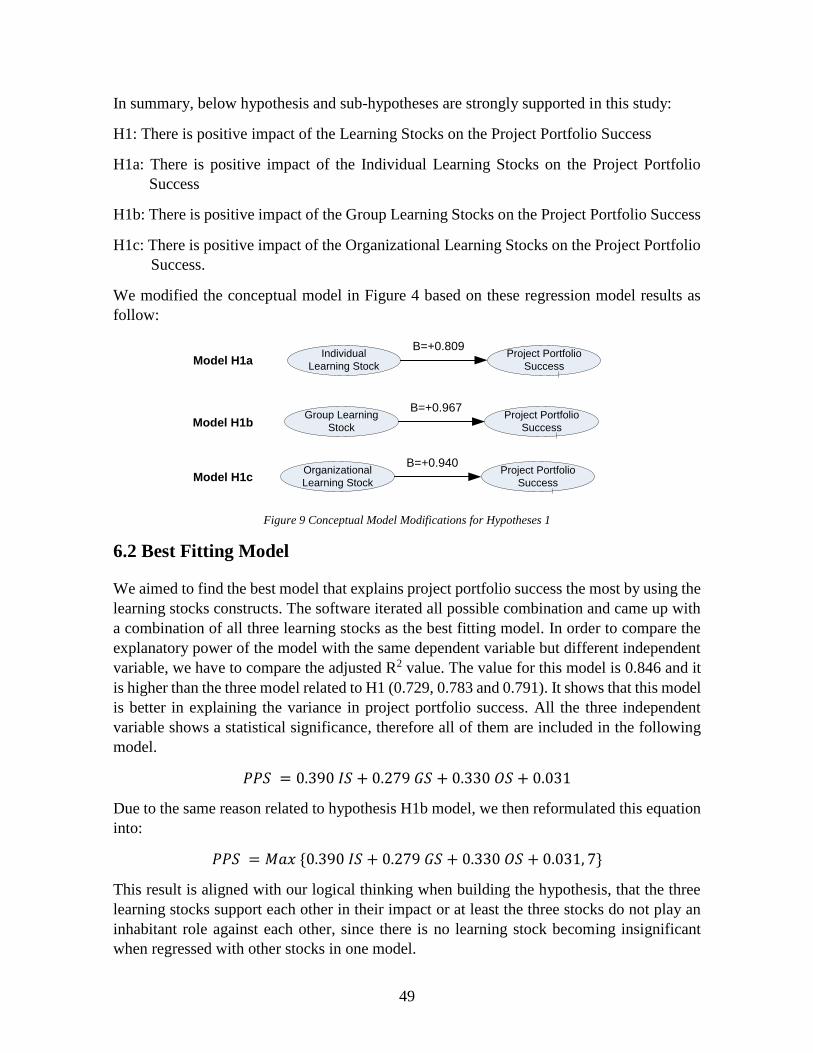
49
In summary, below hypothesis and sub-hypotheses are strongly supported in this study:
H1: There is positive impact of the Learning Stocks on the Project Portfolio Success
H1a: There is positive impact of the Individual Learning Stocks on the Project Portfolio
Success
H1b: There is positive impact of the Group Learning Stocks on the Project Portfolio Success
H1c: There is positive impact of the Organizational Learning Stocks on the Project Portfolio
Success.
We modified the conceptual model in Figure 4 based on these regression model results as
follow:
Figure 9 Conceptual Model Modifications for Hypotheses 1
6.2 Best Fitting Model
We aimed to find the best model that explains project portfolio success the most by using the
learning stocks constructs. The software iterated all possible combination and came up with
a combination of all three learning stocks as the best fitting model. In order to compare the
explanatory power of the model with the same dependent variable but different independent
variable, we have to compare the adjusted R2 value. The value for this model is 0.846 and it
is higher than the three model related to H1 (0.729, 0.783 and 0.791). It shows that this model
is better in explaining the variance in project portfolio success. All the three independent
variable shows a statistical significance, therefore all of them are included in the following
model.
𝑃𝑃𝑆 = 0.390 𝐼𝑆 + 0.279 𝐺𝑆 + 0.330 𝑂𝑆 + 0.031
Due to the same reason related to hypothesis H1b model, we then reformulated this equation
into:
𝑃𝑃𝑆 = 𝑀𝑎𝑥 {0.390 𝐼𝑆 + 0.279 𝐺𝑆 + 0.330 𝑂𝑆 + 0.031, 7}
This result is aligned with our logical thinking when building the hypothesis, that the three
learning stocks support each other in their impact or at least the three stocks do not play an
inhabitant role against each other, since there is no learning stock becoming insignificant
when regressed with other stocks in one model.
Project Portfolio
Success
Individual
Learning Stock
B=+0.809
B=+0.390
Individual
Learning Stock
Group Learning
Stock
Organizational
Learning Stock
B=+0.279
B=+0.330
Project Portfolio
Success
Group Learning
Stock
B=+0.967
Project Portfolio
Success
Organizational
Learning Stock
B=+0.940
Project Portfolio
Success
Project Portfolio
Success
Learning Stock and
Flow Misalignament
B=-2.085
Model H1a
Model H1b
Model H1c
Best Fitting
Model
Model H2
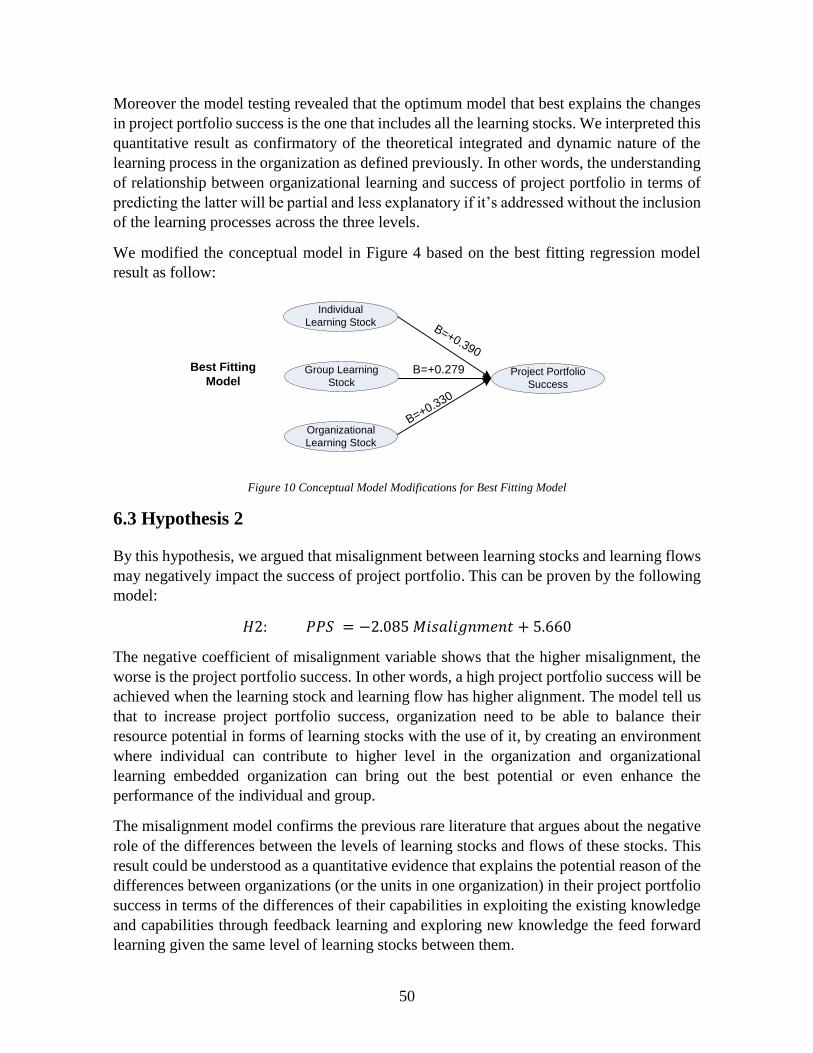
50
Moreover the model testing revealed that the optimum model that best explains the changes
in project portfolio success is the one that includes all the learning stocks. We interpreted this
quantitative result as confirmatory of the theoretical integrated and dynamic nature of the
learning process in the organization as defined previously. In other words, the understanding
of relationship between organizational learning and success of project portfolio in terms of
predicting the latter will be partial and less explanatory if it’s addressed without the inclusion
of the learning processes across the three levels.
We modified the conceptual model in Figure 4 based on the best fitting regression model
result as follow:
Figure 10 Conceptual Model Modifications for Best Fitting Model
6.3 Hypothesis 2
By this hypothesis, we argued that misalignment between learning stocks and learning flows
may negatively impact the success of project portfolio. This can be proven by the following
model:
𝐻2: 𝑃𝑃𝑆 = −2.085 𝑀𝑖𝑠𝑎𝑙𝑖𝑔𝑛𝑚𝑒𝑛𝑡 + 5.660
The negative coefficient of misalignment variable shows that the higher misalignment, the
worse is the project portfolio success. In other words, a high project portfolio success will be
achieved when the learning stock and learning flow has higher alignment. The model tell us
that to increase project portfolio success, organization need to be able to balance their
resource potential in forms of learning stocks with the use of it, by creating an environment
where individual can contribute to higher level in the organization and organizational
learning embedded organization can bring out the best potential or even enhance the
performance of the individual and group.
The misalignment model confirms the previous rare literature that argues about the negative
role of the differences between the levels of learning stocks and flows of these stocks. This
result could be understood as a quantitative evidence that explains the potential reason of the
differences between organizations (or the units in one organization) in their project portfolio
success in terms of the differences of their capabilities in exploiting the existing knowledge
and capabilities through feedback learning and exploring new knowledge the feed forward
learning given the same level of learning stocks between them.
Project Portfolio
Success
Individual
Learning Stock
B=+0.809
B=+0.390
Individual
Learning Stock
Group Learning
Stock
Organizational
Learning Stock
B=+0.279
B=+0.330
Project Portfolio
Success
Group Learning
Stock
B=+0.967
Project Portfolio
Success
Organizational
Learning Stock
B=+0.940
Project Portfolio
Success
Project Portfolio
Success
Learning Stock and
Flow Misalignament
B=-2.085
Model H1a
Model H1b
Model H1c
Best Fitting
Model
Model H2

51
In summary, below hypothesis is strongly supported in this study:
H2: There is negative impact of the Misalignment between Learning stocks and flows on the
Project Portfolio Success
We modified the conceptual model in Figure 4 based on the regression model result as follow:
Figure 11 Conceptual Model Modification for Hypothesis 2
At the end of Chapter III, we presented the conceptual model of this study in Figure 4. Since
all of our hypotheses are strongly supported by the empirical findings, no revision to the
conceptual model is required while the modification for each regression model were
illustrated in Figure 9-11.
These discussions will provide a basis for our conclusion in Chapter VII and will help us to
suggest opportunities for future researches in Chapter IX.
Project Portfolio
Success
Individual
Learning Stock
B=+0.809
B=+0.390
Individual
Learning Stock
Group Learning
Stock
Organizational
Learning Stock
B=+0.279
B=+0.330
Project Portfolio
Success
Group Learning
Stock
B=+0.967
Project Portfolio
Success
Organizational
Learning Stock
B=+0.940
Project Portfolio
Success
Project Portfolio
Success
Learning Stock and
Flow Misalignament
B=-2.085
Model H1a
Model H1b
Model H1c
Best Fitting
Model
Model H2

52
VII. CONCLUSIONS
In this chapter, we use the analysis result to answer our research questions, present the
theoretical contributions that this study makes to the field of research.as well as practical
recommendations resulting from this study that can be beneficial to organization in the area
of organizational learning and project portfolio.
7.1 General Conclusions
The main purpose of this study was to inspect the effects of organizational learning on project
portfolio success. In order to do so, we examined organizational learning as learning stocks
and learning flows. Learning Stock is intellectual capital, the knowledge exists in an
organization on a particular time that resides within a level: individual, group, and
organization (Bontis et al., 2002, p. 440). Learning Flow is how this Stock changes (flow)
overtime, whether in Feed-Forward flow (that individual learning affect the group or whole
organization learning) or Feed-Back flow (how the embedded learning inside an organization
affect the group and individual learning) (Bontis et al., 2002, p. 445). The concept of learning
stock and flow was deployed by using the Strategic Learning Assessment Map (SLAM)
proposed by Crossan & Hulland (1997) that we scrutinized prior to being used on this study
as part of our methodological contribution. Several items from the original study were
eliminated, integrated and modified. We examined criteria for project portfolio success from
various studies as well as the suitability of them to be used for this study. We inspected the
definitions and related elements for criteria they used and similar criteria were integrated.
The final compiled criteria of project portfolio success are: Average Project Success,
Synergies, Strategic Fit, Portfolio Balance, Average Product Success and Preparing for the
Future.
This study was conducted in an oil and gas company operated in Indonesia. Questionnaire
were distributed mainly through web. This gave us an opportunity to conduct a census by
reaching all member of population with an email containing the questionnaire web link. A
response rate of 70.3% with total number of 123 respondents was achieved. The demographic
data was used to see the representativeness of the respondents. Each organizational learning
and project portfolio success construct was tested for internal reliability assumption by using
Cronbach’s Alpha test and the test proved that all constructs fulfilled the assumption without
the need to reduce any questions from the questionnaire. The quantitative data were then used
to test our hypotheses by using regression analysis. After conducting this study, we are now
able to answer our research questions:
To what extent does Organizational Learning impact the Project Portfolio Success?
After we conduct all steps in research process, our findings show that all of our hypothesis
are proven to be true. The first conclusion is that independently, each learning stock type
(Individual, Group and Organizational) gives a significant positive impact to project portfolio
success. When we looked for the best model that gives the highest explanatory power, the
result showed that the combination of all three learning stocks in one model can explain
project portfolio success construct the most and it became our second conclusion. The third
conclusion is that the misalignment between learning stocks and flows gives negative impact

53
to the project portfolio success. All resulted models show a strong fit or high explanatory
power that shows that the independent variable(s) are good predictor(s) for the dependent
variable.
7.2 Theoretical and Methodological Contributions
The study gives theoretical contribution by providing and testing theory to understand the
role of the learning in organization in improving the level of Projects Portfolio Success. As
mentioned in our first chapter, we aimed to fill the theoretical gap of the study regarding the
direct relationship between the two concepts that includes investigation of the organizational
learning from the stocks and flow perspectives that consider the dynamic nature of the
learning phenomena in organizations.
As part of our methodological contribution, we revisited and reviewed Crossan & Hulland
(1997) SLAM framework resulting into an adapted measurement tools in form of
questionnaire as part. This new adapted questionnaire has 39 statements/questions compares
to the original 50 statements/ questions. For project portfolio success, we reviewed literature
and extracted project portfolio success from them. The result is the 6 dimensions with 17
statements/questions used for this study.
Contextually, we contribute one business study in social science in oil and gas sector that we
considered still small in number compares to another sector such as IT or construction. The
number of social science study in oil and gas sector is also considered limited compared to
practical studies that aim to find solution for practical daily operation.
7.3 Practical Implications
Our research can provide insight to the studied company in its way to manage the
organization learning since it is evident, based on this study result, can contribute to project
portfolio success. The resulted models show a strong fit or high explanatory power that shows
that practitioner can use the models confidently as predictor. In this section, we aim to give
practitioners idea on how to utilize the research data in enhancing the company’s
performance. Several parts of the data may indicate the weak and strong aspects of the studied
company and therefore those aspects may become the focus of the formulated strategy.
The study may also give suggestions if the organization plans to put more investment in
organizational learning with the intention to enhance the success of their project portfolio.
Based on the proven first hypothesis, all three learning stocks show statistically significant
positive impact. This may indicate the need to manage learning in organizations in general
and the studied company in special within a balanced view, i.e. to plan the practices of
learning based on a balanced investment in the capabilities of individuals and groups as well
as the embedding of learning in the organization’s systems, structure, culture and strategy
and the alignment between these non-human storehouses of learning.
From the descriptive analysis of the gathered data, it’s evident that company’s levels of group
learning capabilities and practices are not on the same level of the other two types of stocks.
Basically this is due to relatively weak practices in terms of group’s adaptability, readiness

54
to rethink the decision they made when presented with new information, and the insufficiency
of group conflict resolution techniques. It is recommended that the company pays attention
to these performance areas as to maintain a balanced organizational learning.
Although organizational learning stocks scored high in general, it is also noticeable that the
perception of respondents about the quality of the company’s strategy (i.e. clear, documented
and fits the future) is relatively weak. This is noticed from the average value of the question
“We have a Clear and Documented strategy that positions us well for the future” that
considered one of the lowest value as well as the value of “Strategic Fit” concept from project
portfolio success. The result indicates the need to conduct deeper investigation by the
company to further analyze and conceive the factors behind such perception. It is suggested
that the company establishes an “Internal Strategy Awareness Index” that measures in
detailed manner the perception and feedback of the managers and staff of the company’s
strategy. The company could take proper initiatives to enhance the level of awareness index.
Wide array of recommendations could be made to address the challenge of the strategy
quality, among these are:
Conduct internal “Strategy Learning and Dialogue” workshops as to continuously clarify
and explain the company’s direction and in the same time conduct strategy dialogue and
open conversations about the quality and appropriateness of the corporate strategy.
Crossan et al. (1999) argued that conversation can be used not only to convey established
meaning but also to evolve new meaning. It’s pivotal that dialogue suspends previous
assumptions and certainties to be effective (Isaacs, 1993, p. 33). Thus “Strategy Learning
and Dialogue” workshops shall aim to clarify and revise the basic assumptions of the
strategy development in terms of its fitness for the future and rapidly changing trends of
oil and gas industry.
Ensure that the strategy is well articulated and documented. Documenting the strategy
supports the aim of clarity and accuracy.
Ensure that the strategy is available and easily accessible internally through Intranet Portal
or distributing updated strategy booklets to the relevant internal stakeholders on yearly
basis.
We consider this study a call for the research community to elaborate more on the concept
of learning stocks and flows where the distinction between them is almost neglected within
the relevant discipline while in this study and the study of Bontis et al. (2002) the problem
of misalignment between learning stocks and flows have revealed a significant negative
association with different aspect of organizational performance due to what we call
“Learning Inertia”, that is the company does not effectively and efficiently utilize its learning
capabilities.
We suggest that the studied company may manage its organizational learning within this
perspective as to achieve the optimum alignment. Practically this would be achieved through
enhancing the communication channels within the staff and between the staff and the direct
line of authority to achieve better flows of new ideas and feedback.

55
Also the alignment between the organizational departments and units goals, needs and
abilities would support the goal of stocks-flows alignment. This is consistent with the
recommendation of Bontis et al. (2002, p.461) to bridge the chasm between departments such
as information systems (that focus on the flow of information), strategic management (that
sets strategic direction) and human resource management (that focuses on the development
of human capital).
It would also be beneficial to rename and restructure the role of the training department in
the studied company to the wider comprehensive “learning” role rather than the focus on
“training” of individuals which is one aspect of learning. In this case the organizational
learning department would play a two folds role a planning role which implies to set
development plan on all learning level and flows, and a coordination role as to put the plan
into action through coordinating the components of the organizational learning throughout
the organization.
In terms of project portfolio success, the descriptive analysis shows that the lowest mean of
success criteria is for strategic fit. Project portfolio itself is a means to achieve strategic
objectives (Project Management Institute, 2006, p.4), align project with business strategy
(Artto and Dietrich, 2004, p. 144; Kaiser, 2015, p. 126) and manifestation of business strategy
(Cooper et al., 2001, p. 361). It can be argued that strategic fit is the basis of the project
portfolio existence. Therefore, it is suggested to the organization to revise their system on
portfolio alignment or project prioritization that may enhance the selection of project that
best fit organization’s strategic fit.
We argue that the enhancement of the strategic fit in the studied company would be achieved
through the establishment and communication of a model that governs the continuous process
of cascading the company’s strategic direction into divisions’ and departments’ strategies
giving in parallel with the contribution of programs and projects that shall be clearly
established and linked to each of the cascaded objectives with the relevant weight of this
contribution.
The core of such model is aiming to build a strategic grid of two dimensions: the first is
organizational that breaks down the strategic goals of the company into the strategic goals of
lower level of the organization, and the second is logical and causal that ensures that each
project and program is contributing to one or more cascaded strategic objectives with
numerical value of contribution and in the sometime each strategic objectives is cascaded or
linked to a higher level strategic objective and supported by one or more project or programs.

56
VIII. QUALITY CRITERIA
In this chapter we discuss the quality criteria of our study. We reflect on to what extent our
concepts measured what we intended to and the consistency of our measures. Further, we
explain if our findings could be generalized to different settings and its possibilities to be
replicated in future research.
8.1 Validity
To ensure content validity, we used the measurement constructs from previous research for
each concept. We dig back to their sources when building the measurement constructs to
have a deeper understanding and rationale behind each constructs. We also verified our
measurement tools with academics in related subjects prior to the pilot test. The pilot test was
conducted to also enhance the content validity. From the pilot test, we found that several
statements need to be adjusted or modified as can be seen in detail in Appendix 1 and 2.
To establish both of the criterion validity and construct validity, a good knowledge of theory
is needed so we can decide on variables we are expected to predict and a measure of the
relationship between our measures and those factor. All the items used in the questionnaire
as the measurement tools are derived from validated questionnaire from previous literature
and therefore we argued that those items have fulfilled their validity assumptions.
8.2 Reliability
The Reliability of the study’s questionnaire is measured through the internal consistency,
which entails “correlating the responses to questions in the questionnaire with each other”,
thus determining the consistency of the constructs. As mentioned in Chapter IV, Cronbach’s
Alpha test was used to check the reliability. Based on the test result, the entire constructs
used in this study passed the minimum acceptable value of 0.70 (see table 3 for complete
result) and therefore fulfill the reliability assumption.
8.3 Generalizability
We used the census approach in this study since we had the opportunity to reach everyone in
the population. As discussed earlier, in terms of gender our respondent represent almost
similar proportion with the overall proportion of employee in the studied company. However
in terms of age and managerial level group, our respondent shows various deviation from the
population. Nevertheless the rank of the number of respondent in each category group are
similar. Therefore, these facts give us an argument to conclude that our findings can be
generalizable and are sufficient to determine the overall concept of organizational learning
and project portfolio success in the studied company. We acknowledge that our study is
conducted in only one organization. This fact limits the generalizability of the result.
However we believe that our study can give preliminary insights of the effects of the
organizational learning to project portfolio success and could encourage deeper research in
the future whether on the same industry sector or other sectors.

57
8.4 Replication
In order to allow replication of our study we tried to clearly outline all the steps we took when
conducting this study (construction of questionnaire, sampling method, statistical test method
and tools) in Chapter IV and how we interpreted the result in Chapter V and VI. Furthermore,
we also explained the rationale behind the chosen methods, concepts or tools. Thus, we can
conclude that we have given a foundation for future researcher to replicate our study.
The four criteria established above shows how this study tried to achieve the quality standard
of quantitative research. We consider that the study has fulfill the validity and reliability
requirement as well as ability to be replicated. However, there is limitation of its
generalizability due to the limited number of studied company.
58
IX. FUTURE RESEARCH
This chapter describes the opportunity for future research based on the limitation of this
particular study and the final result.
Most studies have limitations and as mentioned in Chapter I, this study is performed in only
one studied company. Even though our study findings are generalizable in this organization
due to our census method, the generalizability to other organization, industry, or geographical
areas may be limited. Therefore, we believe that using our proposed theoretical framework
and/or applying our conceptual model in other contexts might give valuable result. We
argued that it will be appropriate to apply the conceptual model and test our hypothesis on
another organization in oil and gas industry as well as those possess project portfolio in
another sector such as construction or IT. However, there are needs to revisit each variables
especially project portfolio success variables that might have context specific characteristics
and therefore, adjustments are needed. Applying the same model in other geographical areas
might or might not give different result due to the existence of culture difference that might
give effect to organizational learning practice. Moreover, we created a construct and
questionnaire for organizational learning and project portfolio success based on previous
study and those can be used separately by future research based on their needs.
This study intends to learn about the direct relationship between organizational learning and
project portfolio success. However, we thought that there can be more complex relationship
between the two concepts and intervening variable as well as moderating variable may exist.
An intervening variables or sometimes called mediating variables suggest that there is
variable in between the two studied variables that are affected by the first variable and in
turns affect the second variable (Bryman & Bell, 2015, p. 356; Saunders et al., 2012, p. 174),
while the moderating variables is another variables that affects the nature of the relationship
between the studied concepts (Saunders et al., 2012, p. 174). Communication system can be
one of the example of such variables.
Regarding the research design and on methodological point of view, future research can opt
for different choices as the ones we made for this study. Some implications of choosing
different choices have been pointed out in earlier chapters. Different philosophical
assumptions can be chosen and will result in different interpretation of the research question
as pointed out in Chapter II. The usage of a qualitative method or mixed method will also
give different insight to the result deeper understanding of the rationale behind the
relationship found. The longitudinal method might be appropriate when the researcher want
to test the relationship of organizational learning and project portfolio success over time. For
example, a longitudinal study is a good approach to study effects of applying new learning
policies by taking data before and after the policy implementation.

REFERENCES
Aalto, T. (2000). Strategies and methods for project portfolio management, Seminar in
Project Management. Helsinki University of Technology, Helsinki.
Adenfelt, M. (2010). Exploring the performance of transnational projects: shared knowledge,
coordination and communication. International Journal of Project Management, 28(6), 529-
538.
Al Hadla, M. (2013). The impact of organizational learning on strategic flexibility: A case
study of Syriatel Mobile Telecom. Master Thesis. Damascus: Damascus University.
Alsudiri, T., Al-Karaghouli, W., & Eldabi, T. (2013). Alignment of large project management
process to business strategy: A review and conceptual framework. Journal of Enterprise
Information Management, 26(5), 596-615.
Archer, N. P., &Ghasemzadeh, F. (1999). An integrated framework for project portfolio
selection. International Journal of Project Management, 17(4), 207-216.
Argyris, C. (1977). Double loop learning in organizations. Harvard Business Review,
September-October, 115-125.
Argyris, C, &Schön, D. A. (1978). Organizational learning; A theory of action perspective.
Reading, MA: Addison-Wesley
Artto, K. A., & Dietrich, P. H. (2004). Strategic business management through multiple
projects. The Wiley guide to managing projects, 144-176.
Badiru, A. B., & Osisanya, S. O. (2012). Project Management for the Oil and Gas Industry:
A World System Approach. Dayton: CRC Press.
Bapuji, H., & Crossan, M. (2004). From questions to answers reviewing organizational
learning research. Management Learning, 4(35), 397-417.
Berenson, M., Levine, D., Szabat, K. A., & Krehbiel, T. C. (2012). Basic business statistics:
Concepts and applications. New South Wales: Pearson Higher Education AU.
Biedenbach, T., & Müller, R. (2012). Absorptive, innovative and adaptive capabilities and
their impact on project and project portfolio performance. International Journal of Project
Management, 30(5), 621-635.
Blichfeldt, B. S., & Eskerod, P. (2008). Project portfolio management–There’s more to it
than what management enacts. International Journal of Project Management, 26(4), 357-
365.
Bontis, N., Crossan, M. M., & Hulland, J. (2002). Managing an organizational learning
system by aligning stocks and flows. Journal of management studies, 39(4), 437-469.
Box, S., & Platts, K. (2005). Business process management: establishing and maintaining
project alignment. Business Process Management Journal, 11(4), 370-387.

Bryman, A., & Bell, E. (2015). Business research methods. 4th Edition. Oxford: Oxford
University Press.
Cepeda, G., & Vera, D. (2007). Dynamic capabilities and operational capabilities: A
knowledge management perspective. Journal of Business Research, 60(5), 426-437.
Cooke-Davies, T. (2002). The “real” success factors on projects. International Journal of
Project Management, 20(3), 185-190.
Cooke‐Davies, T. (2004). Project success. The Wiley guide to managing projects, 99-122.
Cooper, R. G., Edgett, S. J., & Kleinschmidt, E. J. (1997). Portfolio management in new
product development: Lessons from the leaders--I.Research Technology Management, 40(5),
16.
Cooper, R. G., Edgett, S. J., & Kleinschmidt, E. J. (2000). New problems, new solutions:
making portfolio management more effective. Research-Technology Management, 43(2),
18-33.
Cooper, R. G., Edgett, S. J., & Kleinschmidt, E.J. (2001). Portfolio management for new
products, 2nd Edition. Cambridge, MA: Perseus Publishing.
Cooper, K. G., Lyneis, J. M., & Bryant, B. J. (2002). Learning to learn, from past to future.
International journal of project management, 20(3), 213-219.
Crossan, M. & Bapuji, H. (2003). Examining the link between knowledge management,
organizational learning and performance. In: the 5th International Conference on
Organizational Learning and Knowledge. Lancaster University, Lancaster, 30 May‐ 2 June.
Crossan, M. & Hulland, J. (1997). Measuring Organizational Learning. In:Academy of
Management Annual Meeting 1997. Boston, MA.
Crossan, M., Lane, H., & White, R. (1999). An organizational learning framework: From
intuition to institution. Academy of Management Review, 24(3), 522-537.
Daft, R. L., & Weick, K. E. (1984). Toward a Model of Organizations as Interpretation
Systems. Academy Of Management Review, 9(2), 284-295.
Dibella, A., & Nevis, E. (1998). How Organizations Learn: An Integrated Strategy for
Building Learning Capability. San Francisco: Jossey-Bass.
Dicle, Ü. & Köse, C. (2014). The Impact of Organizational Learning on Corporate
Sustainability and Strategy Formulation with the Moderating Effect of Industry
Type. Procedia - Social and Behavioral Sciences, 150, 958-967.
Dixon, N. (1992). Organizational learning a review of the literature with implications for
HRD professionals. Human Resource Development Quarterly, 3(1), 29-49.
Elonen, S., & Artto, K. A. (2003). Problems in managing internal development projects in
multi-project environments. International Journal of Project Management, 21(6), 395-402.

Ernst & Young (2014). Spotlight on oil and gas megaprojects [Report]. London: Ernst &
Young http://www.ey.com/Publication/vwLUAssets/EY-spotlight-on-oil-and-gas-
megaprojects/$FILE/EY-spotlight-on-oil-and-gas-megaprojects.pdf
Ernst & Young (2015). Portfolio management in oil and gas. Ernst & Young
http://www.ey.com/GL/en/Industries/Oil---Gas/EY-portfolio-management-in-oil-and-gas.
[Retrieved 2015-09-30].
Fiol, M., & Lyles, M. (1985). Organisational learning. Academy of management
review.4(10), 803- 813.
García, M. Ú., &Vañó, F. L. (2002). Organizational learning in a global market. Human
Systems Management, 21(3), 169-182.
Garvin, D. A., Edmondson, A. C., & Gino, F. (2008). Is Yours a Learning Organization?
Harvard Business Review, 86(3), 109-116
Ghauri, P. N., & Grønhaug, K. (2010). Research methods in business studies: A practical
guide. Michigan: Pearson Education.
Graziano, A. M., & Raulin, M. L. (2011). Research Methods: Pearson New International
Edition: A Process of Inquiry. Harlow:Pearson Higher Ed.
Greenwood, J (1998). The role of reflection in single and double loop learning. Journal of
Advanced Nursing, 27(5), 1048-1053.
Grix, J. (2002). Introducing students to the generic terminology of social research. Politics,
22(3), 175-186
Hambrick, D.C. & Mason, P.A. (1984). Upper echelons: The organization as a reflection of
its top managers. Academy of Management Review, 9(2), 193-106.
Haniff, A., & Fernie, S. (2008, November). Projects: where strategies collide. In CIB w55/65
International conference proceedings.
Hitt , M., Baibaia , K., & Samuel , D. (1998). Navigating in the new competitive landscape:
Building strategic flexibility and competitive advantage in the 21st century. Academy of
Management Executive, 12(4), 22-44.
Huber, G. (1991). Organizational learning: The contributing processes and the literature.
Organization Science, 2(1), 88-115.
Huysman, M. (2000). An organizational learning approach to the learning organization.
European Journal of Work and Organizational Psychology, 9 (2), 133 — 145
Isaacs, W. H. (1993). Dialogue, collective thinking, andorganizational learning.
Organizational Dynamics,22(2): 24-39.
Jamieson, A., & Morris, P. W. (2004). Moving from corporate strategy to project
strategy. The Wiley guide to managing projects, 177-205.

Jonas, D., Kock, A., & Gemunden, H. G. (2013). Predicting project portfolio success by
measuring management quality—a longitudinal study. Engineering Management, IEEE
Transactions on, 60(2), 215-226.
Jyothibabu, C., Pradhan, B.B. & Farooq, A. (2012). The learning entities in organisational
learning – an empirical study. Int. J. Learning and Intellectual Capital, 9(1/2), 211–225.
Kaiser, M. G., El Arbi, F., & Ahlemann, F. (2015). Successful project portfolio management
beyond project selection techniques: Understanding the role of structural
alignment. International Journal of Project Management, 33(1), 126-139.
Kerzner, H. R. (2013). Project management: a systems approach to planning, scheduling,
and controlling. 11th Edition. New York: John Wiley and Sons.
Killen, C. P., Hunt, R. A., & Kleinschmidt, E. J. (2008a). Project portfolio management for
product innovation. The International Journal of Quality and Reliability Management, 25(1),
24–38.
Killen, C. P., Hunt, R. A., & Kleinschmidt, E. J. (2008b). Learning investments and
organizational capabilities: case studies on the development of project portfolio management
capabilities. International Journal of Managing Projects in Business, 1(3), 334-351.
Kim, D. H. (1993).The link between individual and organizational learning. Sloan
Management Review (Fall), 37-50.
Leach, L. P. (2000). Critical chain project management. Norwood: Artech House.
Leitz, P. (2010). Research into questionnaire design: A summary of the
literature. International Journal of Market Research, 52(2), 249-272.
Leroy, F., & Ramanantsoa, B. (1997). The cognitive and behavioral dimensions of
organizational learning in a merger: an empirical study. Journal of Management
Studies, 34(6), 871-894.
Lopez, S., Peon, J., & Ordas, C. (2005). Organizational learning as a determining factor in
business performance. Learning Organization, 12(3), 227-245.
Lycett, M., Rassau, A., & Danson, J. (2004). Programme management: a critical
review. International Journal of Project Management, 22(4), 289-299.
Mainga, W., & Yan, L. (2009). An Exploratory study of Interproject learning mechanisms
and Project competencies of Consultancy firms in Sweden; perceptions of project
management practitioners. Master Thesis. Umea: Umea School of Business.
Mainga, W., Yan, L., Hamde, K., & Blomquist, T. (2011). Project learning and project
competencies in project based firms: Swedish consultancy firms as case study. World
Journal of Management, 3(2), 94-119.

Martinsuo, M., & Lehtonen, P. (2007). Role of single-project management in achieving
portfolio management efficiency. International Journal of Project Management, 25(1), 56-
65.
Mintzberg H, Ahlstrand B, & Lampel J. (1998). Strategy Safari: A guided tour through the
wilds of strategic management. New York: The Free Press.
Meskendahl, S. (2010). The influence of business strategy on project portfolio management
and its success—a conceptual framework. International Journal of Project
Management, 28(8), 807-817.
Miner, A. S., & Mezias, S. J.. (1996). Ugly Duckling No More: Pasts and Futures of
Organizational Learning Research. Organization Science, 7(1), 88–99
Muijs, D. (2012). Doing quantitative research in education with SPSS. Chicago: Sage.
Müller, R., Martinsuo, M., & Blomquist, T. (2008). Project portfolio control and portfolio
management performance in different contexts. Project Management Journal, 39(3), 28-42.
Nava, R. & Rivolta, T. (2013). Large project management in oil and gas. Bain and Company.
http://www.bain.com/publications/articles/large-project-management-in-oil-and-gas.aspx.
[Retrieved 2015-09-30].
Platje, A., Seidel, H., & Wadman, S. (1994). Project and portfolio planning cycle: project-
based management for the multiproject challenge. International Journal of Project
Management, 12(2), 100-106.
Porter, M. E. (1996). What Is Strategy? Harvard Business Review, 74(6), 61-78.
Prahalad, C. K., & Hamel, G. (1990). The core competence of the corporation. Harvard
Business Review, 68(3), 79-91.
Prange, C. (1999). Organizational learning – desperately seeking theory? In M. Easterby-
Smith, L. Araujo, & J. Burgoyne (Eds.), Organizational learning and the learning
organization: Developments in theory and practice. (pp. 24-44). London: SAGE.
Probst, G., & Büchel, B. S. (1997). Organizational learning: The competitive advantage of
the future. London:Prentice Hall.
Project Management Institute. (2006). The standard for portfolio management.
Pennsylvania: Project Management Institute, Incorporated.
Project Management Institute. (2013). A Guide to the Project Management Body of
Knowledge (PMBOK® Guide). Pennsylvania: Project Management Institute, Incorporated.
PWC (2014). Oil and Gas in Indonesia Investment and Taxation Guide [Report]. Jakarta:
PWCIndonesia.
http://www.pwc.com/id/en/publications/assets/oil_and_gas_guide_2014.pdf

Reich, B. H., Gemino, A., & Sauer, C. (2014). How knowledge management impacts
performance in projects: An empirical study. International Journal of Project
Management, 32(4), 590-602.
Salim, M., & Sulaiman, M. (2011). Organizational learning innovation and performance: A
study of Malaysian small and medium sized enterprises international.Journal of Business
And Management, 12(6), 118-125.
Santos-Vijande , M., López-Sánchez , J., & Trespala , J. (2012). How organizational learning
affects a firm's flexibility competitive strategy and performance. Journal of Business
Research, 65(8), 1079-1089.
Saunders, M., Lewis, P., & Thornhill, A. (2012). Research methods for business students.6th
Edition. New York: Pearson.
Senge, P. (1990). The fifth descipline: The art and practice of the learning
organization.London: Random Century.
Senge, P. (1997). The fifth discipline.Measuring Business Excellence, 1(3), 46 – 51.
Shenhar, A. J., Dvir, D., Levy, O., & Maltz, A. C. (2001). Project success: a multidimensional
strategic concept. Long range planning, 34(6), 699-725.
Shenhar, A. J., Dvir, D., Morris, P. W. G., & Pinto, J. K. (2004). How projects differ and
what to do about it. The Wiley guide to project, program and portfolio management, 1265-
1286.
Siau K. & Erickson J. (2008). Advanced Principles for Improving Database Design, Systems
Modeling, and Software Development. Hershey, PA: Information Science Reference -
Imprint of: IGI Publishing.
Söderlund, J. (2005). Developing project competence: empirical regularities in competitive
project operations. International Journal of Innovation Management, 9(04), 451-480.
Teller, J., Unger, B. N., Kock, A., & Gemünden, H. G. (2012). Formalization of project
portfolio management: the moderating role of project portfolio complexity. International
Journal of Project Management, 30(5), 596-607.
Teller, J., Kock, A., & Gemünden, H. G. (2014). Risk management in project portfolios is
more than managing project risks: a contingency perspective on risk management. Project
Management Journal, 45(4), 67-80.
Templeton, G., Lewis, B., & Snyder, A. (2002). Development of a measure for the
organizational learning construct . Journal of Management Information Systems, 19(2), 175-
218.
Turner, J. R., & Müller, R. (2003). On the nature of the project as a temporary
organization. International Journal of Project Management, 21(1), 1-8.
Unger, B. N., Gemünden, H. G., & Aubry, M. (2012). The three roles of a project portfolio
management office: Their impact on portfolio management execution and
success. International Journal of Project Management, 30(5), 608-620.
Walsh, J. P., & Ungson, G. R. (1991). Organizational Memory. The Academy of Management
Review, 16(1), 57–91.
Personal Communication
Crossan, M. (2015). RE: Clarification on "Learning Stock" Definition [e-mail] (personal
communication, November 26, 2015)
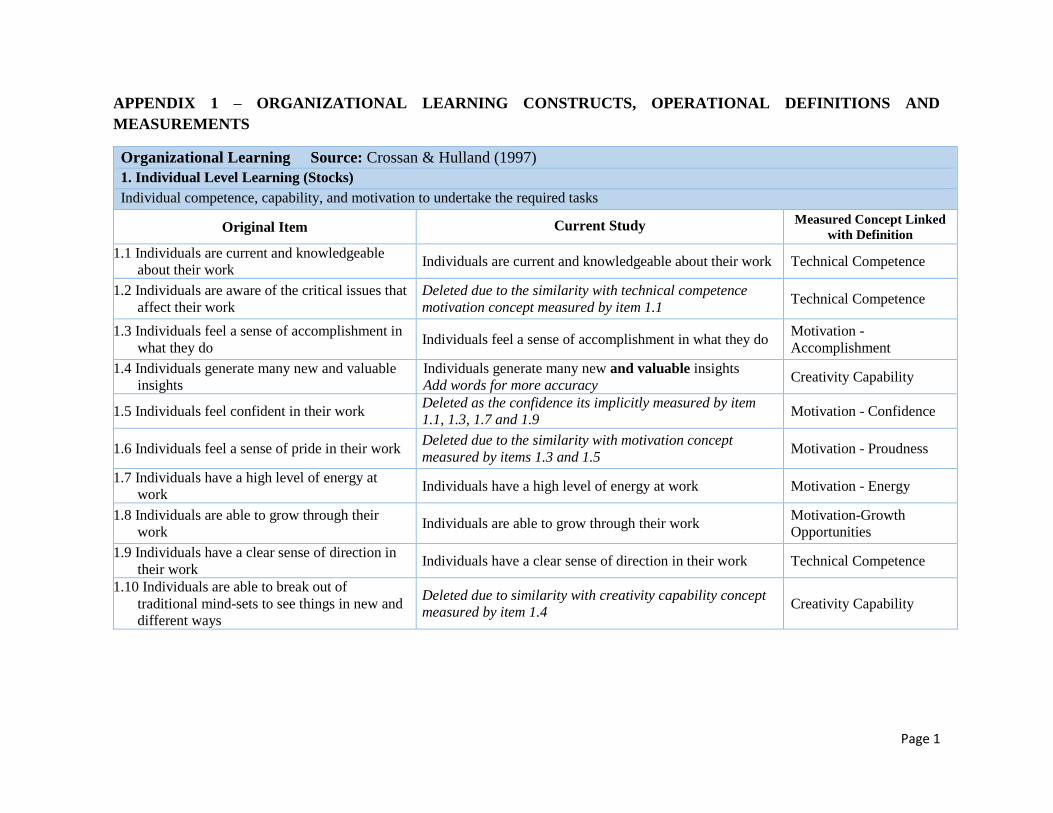
Page 1
APPENDIX 1 – ORGANIZATIONAL LEARNING CONSTRUCTS, OPERATIONAL DEFINITIONS AND
MEASUREMENTS
Organizational Learning Source: Crossan & Hulland (1997)
1. Individual Level Learning (Stocks)
Individual competence, capability, and motivation to undertake the required tasks
Original Item
Current Study Measured Concept Linked
with Definition
1.1 Individuals are current and knowledgeable
about their work Individuals are current and knowledgeable about their work Technical Competence
1.2 Individuals are aware of the critical issues that
affect their work
Deleted due to the similarity with technical competence
motivation concept measured by item 1.1 Technical Competence
1.3 Individuals feel a sense of accomplishment in
what they do Individuals feel a sense of accomplishment in what they do
Motivation -
Accomplishment
1.4 Individuals generate many new and valuable
insights
Individuals generate many new and valuable insights
Add words for more accuracy Creativity Capability
1.5 Individuals feel confident in their work Deleted as the confidence its implicitly measured by item
1.1, 1.3, 1.7 and 1.9 Motivation - Confidence
1.6 Individuals feel a sense of pride in their work Deleted due to the similarity with motivation concept
measured by items 1.3 and 1.5 Motivation - Proudness
1.7 Individuals have a high level of energy at
work Individuals have a high level of energy at work Motivation - Energy
1.8 Individuals are able to grow through their
work Individuals are able to grow through their work
Motivation-Growth
Opportunities
1.9 Individuals have a clear sense of direction in
their work Individuals have a clear sense of direction in their work Technical Competence
1.10 Individuals are able to break out of
traditional mind-sets to see things in new and
different ways
Deleted due to similarity with creativity capability concept
measured by item 1.4 Creativity Capability
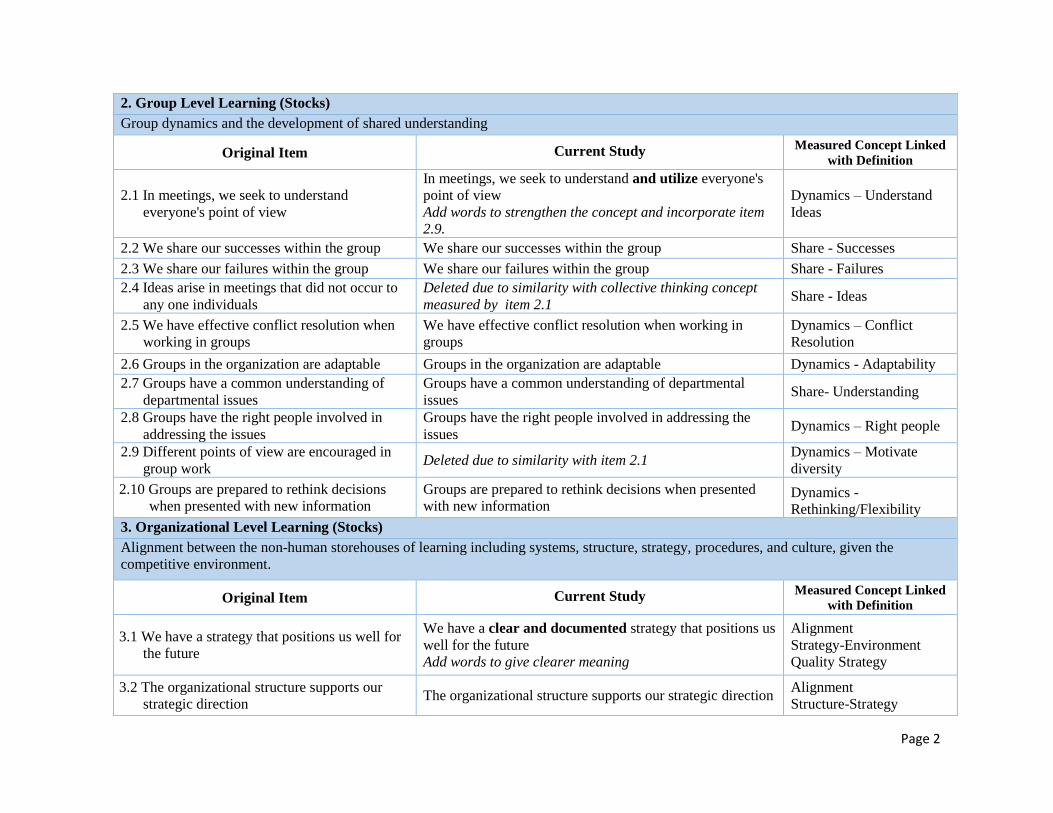
Page 2
2. Group Level Learning (Stocks)
Group dynamics and the development of shared understanding
Original Item
Current Study Measured Concept Linked
with Definition
2.1 In meetings, we seek to understand
everyone's point of view
In meetings, we seek to understand and utilize everyone's
point of view
Add words to strengthen the concept and incorporate item
2.9.
Dynamics – Understand
Ideas
2.2 We share our successes within the group We share our successes within the group Share - Successes
2.3 We share our failures within the group We share our failures within the group Share - Failures
2.4 Ideas arise in meetings that did not occur to
any one individuals
Deleted due to similarity with collective thinking concept
measured by item 2.1 Share - Ideas
2.5 We have effective conflict resolution when
working in groups
We have effective conflict resolution when working in
groups
Dynamics – Conflict
Resolution
2.6 Groups in the organization are adaptable Groups in the organization are adaptable Dynamics - Adaptability
2.7 Groups have a common understanding of
departmental issues
Groups have a common understanding of departmental
issues Share- Understanding
2.8 Groups have the right people involved in
addressing the issues
Groups have the right people involved in addressing the
issues Dynamics – Right people
2.9 Different points of view are encouraged in
group work Deleted due to similarity with item 2.1
Dynamics – Motivate
diversity
2.10 Groups are prepared to rethink decisions
when presented with new information
Groups are prepared to rethink decisions when presented
with new information Dynamics -
Rethinking/Flexibility
3. Organizational Level Learning (Stocks)
Alignment between the non-human storehouses of learning including systems, structure, strategy, procedures, and culture, given the
competitive environment.
Original Item
Current Study Measured Concept Linked
with Definition
3.1 We have a strategy that positions us well for
the future
We have a clear and documented strategy that positions us
well for the future
Add words to give clearer meaning
Alignment
Strategy-Environment
Quality Strategy
3.2 The organizational structure supports our
strategic direction The organizational structure supports our strategic direction
Alignment
Structure-Strategy
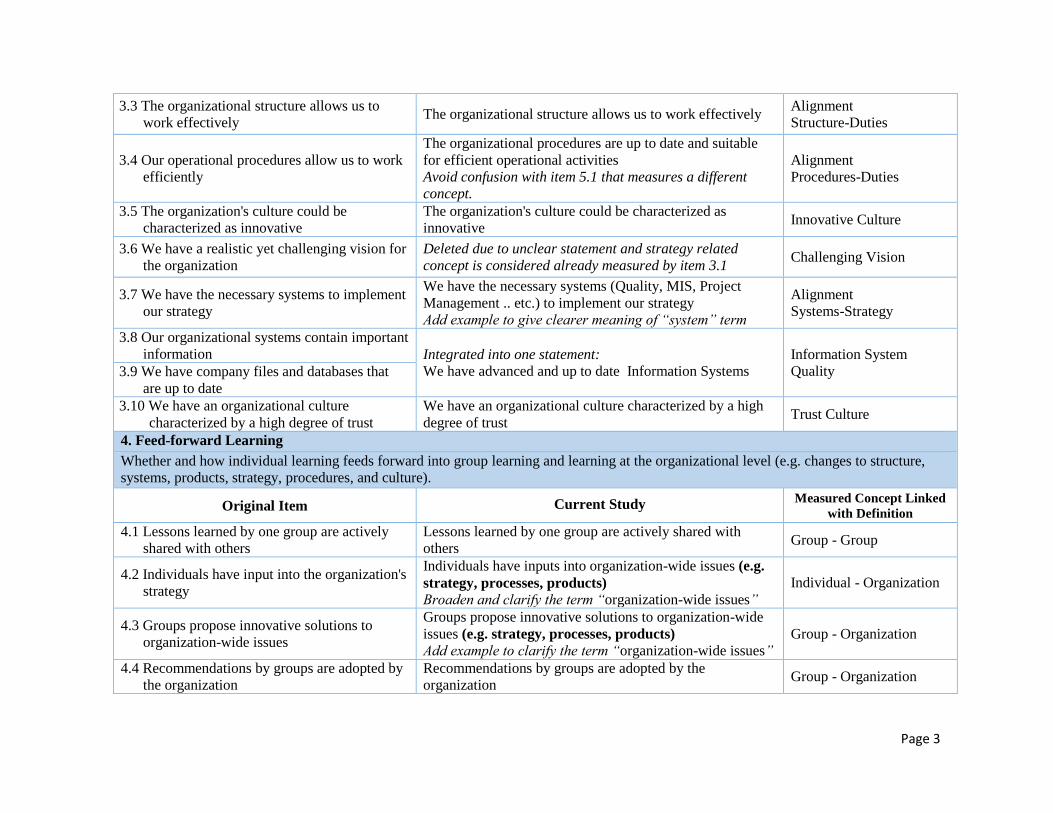
Page 3
3.3 The organizational structure allows us to
work effectively The organizational structure allows us to work effectively
Alignment
Structure-Duties
3.4 Our operational procedures allow us to work
efficiently
The organizational procedures are up to date and suitable
for efficient operational activities
Avoid confusion with item 5.1 that measures a different
concept.
Alignment
Procedures-Duties
3.5 The organization's culture could be
characterized as innovative
The organization's culture could be characterized as
innovative Innovative Culture
3.6 We have a realistic yet challenging vision for
the organization
Deleted due to unclear statement and strategy related
concept is considered already measured by item 3.1 Challenging Vision
3.7 We have the necessary systems to implement
our strategy
We have the necessary systems (Quality, MIS, Project
Management .. etc.) to implement our strategy
Add example to give clearer meaning of “system” term
Alignment
Systems-Strategy
3.8 Our organizational systems contain important
information Integrated into one statement:
We have advanced and up to date Information Systems
Information System
Quality 3.9 We have company files and databases that
are up to date
3.10 We have an organizational culture
characterized by a high degree of trust
We have an organizational culture characterized by a high
degree of trust Trust Culture
4. Feed-forward Learning
Whether and how individual learning feeds forward into group learning and learning at the organizational level (e.g. changes to structure,
systems, products, strategy, procedures, and culture).
Original Item
Current Study Measured Concept Linked
with Definition
4.1 Lessons learned by one group are actively
shared with others
Lessons learned by one group are actively shared with
others Group - Group
4.2 Individuals have input into the organization's
strategy
Individuals have inputs into organization-wide issues (e.g.
strategy, processes, products) Broaden and clarify the term “organization-wide issues”
Individual - Organization
4.3 Groups propose innovative solutions to
organization-wide issues
Groups propose innovative solutions to organization-wide
issues (e.g. strategy, processes, products)
Add example to clarify the term “organization-wide issues”
Group - Organization
4.4 Recommendations by groups are adopted by
the organization
Recommendations by groups are adopted by the
organization Group - Organization

Page 4
4.5 We do not "reinvent the wheel" Deleted due it caused confusion to respondent and does not
clearly aligned with the operational definition
4.6 Individuals compile information for
everyone to use.
Individuals seek to share and discuss their knowledge with
their group of work/other Groups
Rephrase since the original statement is considered unclear
Individual - Group
4.7 Individuals challenge the assumptions of the
group Individuals challenge the assumptions of the group Individual - Group
4.8 The company utilizes the intelligence of its
workforce
The company utilizes the intelligence of its workforce
Individual - Organization
4.9 The "left hand" of the organization knows
what the "right hand" is doing
Deleted due its accuracy in measuring feed forward
learning Alignment between Levels
4.10 Results of the group are used to improve
products, services and processes
Deleted due to item 4.3 and 4.4 that already measure the
same concept Group - Organization
5. Feed-Back Learning
Whether and how the learning that is embedded in the organization (e.g. systems, structure, strategy) affects individual and group learning
Original Item
Current Study Measured Concept Linked
with Definition
5.1 Policies and procedures aid individual work Policies and procedures aid individual work Organization Procedure -
Individual
5.2 Reward systems recognize the contribution
made by groups
Reward systems recognize the contribution made by
groups
Organization Systems -
Groups
5.3 Group decisions are supported by individuals Group decisions are supported by individuals Group Decisions -
Individual
5.4 Company goals are communicated
throughout the organization
Company goals are communicated throughout the
organization
Organization Strategy –
Group and Individual
5.5 Our recruiting practices enable us to attract
the best talents Our recruiting practices enable us to attract the best talents
Organization system –
Individual
5.6 Company files and database provide the
necessary information to do our work
Our Information Systems provide the necessary information
to do our work
Change term for a broader meaning
Organization Systems –
Group and Individual

Page 5
5.7 Information systems make it easy for
individuals to share information
Information systems make it easy for individuals and
groups to share information
Add words to give broader meaning
Organization Systems-
Individual
5.8 Training is readily available when it is
needed to improve knowledge and skills
Training is readily available when it is needed to improve
knowledge and skills
Organization training –
Group and Individual
5.9 Cross training, job rotation and special
assignments are used to develop a more
flexible workforce
Cross training, job rotation and special assignments are
used to develop a more flexible workforce
Organization training –
Group and Individual
5. 10 When making decisions for the future, we
do not seem to have any memory of the
past
When making decisions for the future, we do not seem to
have any memory of the past
Organization knowledge –
Group and Individual
(Reversed Statement)
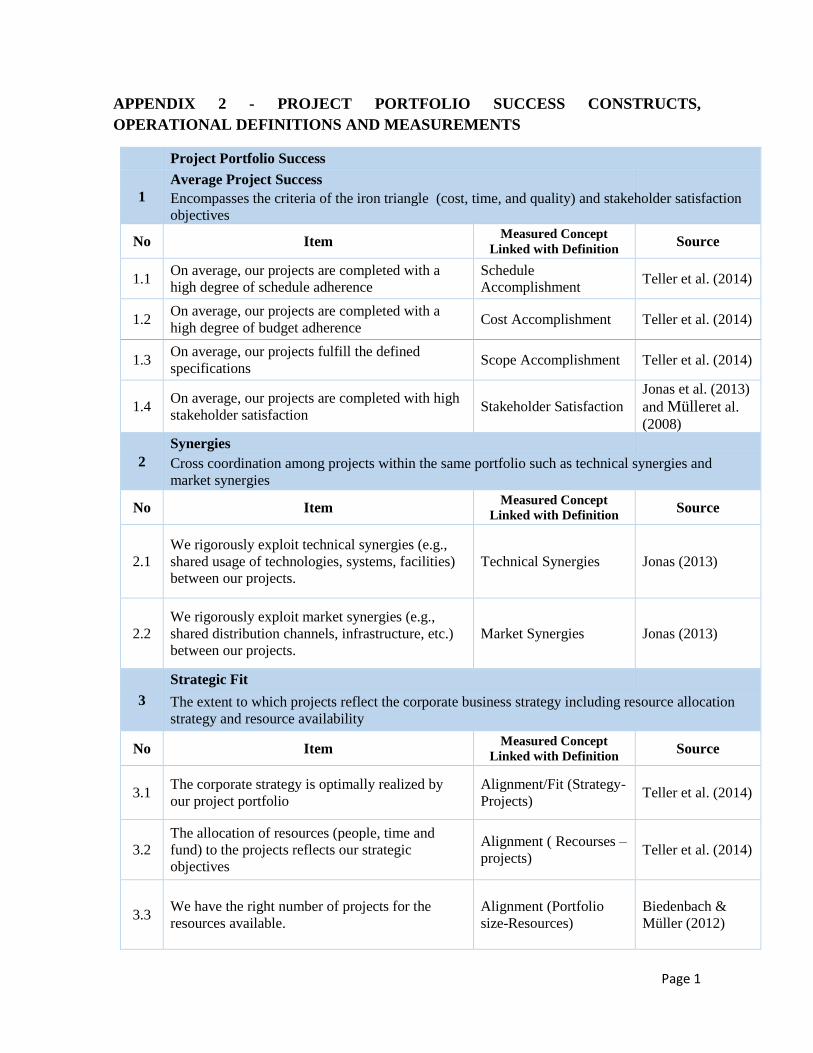
Page 1
APPENDIX 2 - PROJECT PORTFOLIO SUCCESS CONSTRUCTS,
OPERATIONAL DEFINITIONS AND MEASUREMENTS
Project Portfolio Success
1
Average Project Success
Encompasses the criteria of the iron triangle (cost, time, and quality) and stakeholder satisfaction
objectives
No Item Measured Concept
Linked with Definition Source
1.1 On average, our projects are completed with a
high degree of schedule adherence
Schedule
Accomplishment Teller et al. (2014)
1.2 On average, our projects are completed with a
high degree of budget adherence Cost Accomplishment Teller et al. (2014)
1.3 On average, our projects fulfill the defined
specifications Scope Accomplishment Teller et al. (2014)
1.4 On average, our projects are completed with high
stakeholder satisfaction Stakeholder Satisfaction
Jonas et al. (2013)
and Mülleret al.
(2008)
2
Synergies
Cross coordination among projects within the same portfolio such as technical synergies and
market synergies
No Item Measured Concept
Linked with Definition Source
2.1
We rigorously exploit technical synergies (e.g.,
shared usage of technologies, systems, facilities)
between our projects.
Technical Synergies Jonas (2013)
2.2
We rigorously exploit market synergies (e.g.,
shared distribution channels, infrastructure, etc.)
between our projects.
Market Synergies Jonas (2013)
3
Strategic Fit
The extent to which projects reflect the corporate business strategy including resource allocation
strategy and resource availability
No Item Measured Concept
Linked with Definition Source
3.1 The corporate strategy is optimally realized by
our project portfolio
Alignment/Fit (Strategy-
Projects) Teller et al. (2014)
3.2
The allocation of resources (people, time and
fund) to the projects reflects our strategic
objectives
Alignment ( Recourses –
projects) Teller et al. (2014)
3.3 We have the right number of projects for the
resources available.
Alignment (Portfolio
size-Resources)
Biedenbach &
Müller (2012)

Page 2
4 Portfolio Balance
The equilibrium between type of project inside an portfolio
No Item Measured Concept
Linked with Definition Source
4.1 There is a good balance in our project portfolio in
terms of new and existing technologies
Balance – Technology
type Teller et al. (2014)
4.2 There is a good balance in our project portfolio in
terms of high and low project risks Balance - Risk Teller et al. (2014)
4.3 There is a good balance in our project portfolio in
terms of long and short term project duration Balance - Duration
Biedenbach &
Müller (2012)
4.4 There is a good balance in our project portfolio in
terms of high and low monetary value project Balance - Value
Biedenbach &
Müller (2012)
5 Average Product Success
Encompasses the market success and commercial success of all projects in the portfolio
No Item Measured Concept
Linked with Definition Source
5.1 Our project results reach the level of market goals
planned in the project (e.g., market supply).
Market Target
Accomplishment Teller et al. (2014)
5.2 Our project results reach the level of financial
goals planned in the project (e.g., ROI).
Financial Target
Accomplishment Teller et al. (2014)
6 Preparing for the Future
The ability to quickly react to changes in the environment and seize opportunities in the long term
No Item Measured Concept
Linked with Definition Source
6.1 In our projects, we adequately develop new
technologies/skills Resource Development Teller et al. (2014)
6.2 The projects allow us to help shape the future of
our organization Long term contribution Teller et al. (2014)

Page 1
APPENDIX 3 - QUESTIONNAIRE (ENGLISH VERSION)
Dear Respondents,
We are two master students in Strategic Project Management major at Umeå School of Business and
Economics, Sweden. We are conducting research on Organizational Learning and Project Portfolio
and we would like to thank you for agreeing to take part in this survey. Be assured that all answers
you provide will be kept in strictest confidentiality.
By submitting this questionnaire, you give permission to us to use your response for the research. The
questionnaire comprises of 3 parts (Organizational Learning, Project Portfolio and Demographic) and
shall take 10-20 minutes to complete. If you find any issues and/or need to have discussion regarding
this questionnaire, you can contact us via email [email protected].
Best Regards,
Autie Minati Putri and Mostafa Al Hadla
------------------------------------------------------------------------------------------------------------------------
I. ORGANIZATIONAL LEARNING
This section comprises of 5 sub-sections, each uses the same scale of 1 to 7.
“1” represents that you are strongly disagree with the statement and “7” represents strongly agree.
You have a choice of not answering when you feel that you have no experience nor knowledge on
the item(s). Please tick "Do not know" option for such situation.
I.1 The following items relate to your observations of individuals within your organization.
Please choose one response per item.
Strongly Strongly
Disagree Agree
1 2 3 4 5 6 7
Do Not
Know
1. Individuals are current and knowledgeable about their work □ □ □ □ □ □ □ □
2. Individuals feel a sense of accomplishment in what they do □ □ □ □ □ □ □ □
3. Individuals generate many new and valuable insights □ □ □ □ □ □ □ □
4. Individuals have a high level of energy at work □ □ □ □ □ □ □ □
5. Individuals are able to grow through their work □ □ □ □ □ □ □ □
6. Individuals have a clear sense of direction in their work □ □ □ □ □ □ □ □
I.2 The following items relate to your observations of groups within your organization (i.e. your
department, your project group, your discipline group). Please choose one response per item.
Strongly Strongly
Disagree Agree
1 2 3 4 5 6 7
Do Not
Know
1. In meetings, we seek to understand and utilize everyone's
point of view □ □ □ □ □ □ □ □
2. We share our successes within the group □ □ □ □ □ □ □ □

Page 2
3. We share our failures within the group □ □ □ □ □ □ □ □
4. We have effective conflict resolution when working in groups □ □ □ □ □ □ □ □
5. Groups in the organization are adaptable □ □ □ □ □ □ □ □
6. Groups have a common understanding of departmental issues □ □ □ □ □ □ □ □
7. Groups have the right people involved in addressing the issues □ □ □ □ □ □ □ □ 8. Groups are prepared to rethink decisions when presented with
new information □ □ □ □ □ □ □ □
I.3 The following items relate to your organization's structure, culture, vision and strategic
direction. Please choose one response per item.
Strongly
Disagree Agree
1 2 3 4 5 6 7
Do Not
Know
1. We have a Clear and Documented strategy that positions us
well for the future □ □ □ □ □ □ □ □
2. The organizational structure supports our strategic direction □ □ □ □ □ □ □ □
3. The organizational structure allows us to work effectively □ □ □ □ □ □ □ □ 4. The organizational procedures are up to date and suitable for
efficient operational activities □ □ □ □ □ □ □ □
5. The organization's culture could be characterized as innovative □ □ □ □ □ □ □ □ 6. We have the necessary systems (Quality, MIS, Project
Management, etc.) to implement our strategy □ □ □ □ □ □ □ □
7. We have advanced and up to date Information Systems □ □ □ □ □ □ □ □ 8. We have an organizational culture characterized by a high
degree of trust □ □ □ □ □ □ □ □
I. 4 The following items relate to how you and your group influence the organization. Please
choose one response per item.
Strongly Strongly
Disagree Agree
1 2 3 4 5 6 7
Do Not
Know
1. Lessons learned by one group are actively shared with others □ □ □ □ □ □ □ □ 2. Individuals have inputs into organization-wide issues (e.g.
strategy, processes, products) □ □ □ □ □ □ □ □
3. Groups propose innovative solutions to organization-wide
issues (e.g. strategy, processes, products) □ □ □ □ □ □ □ □
4. Recommendations by groups are adopted by the organization □ □ □ □ □ □ □ □ 5. Individuals seek to share and discuss their knowledge with
their group of work/other Groups □ □ □ □ □ □ □ □
6. Individuals challenge the assumptions of the group □ □ □ □ □ □ □ □ 7. The company has systems in place to utilize the intelligence
of its workforce □ □ □ □ □ □ □ □
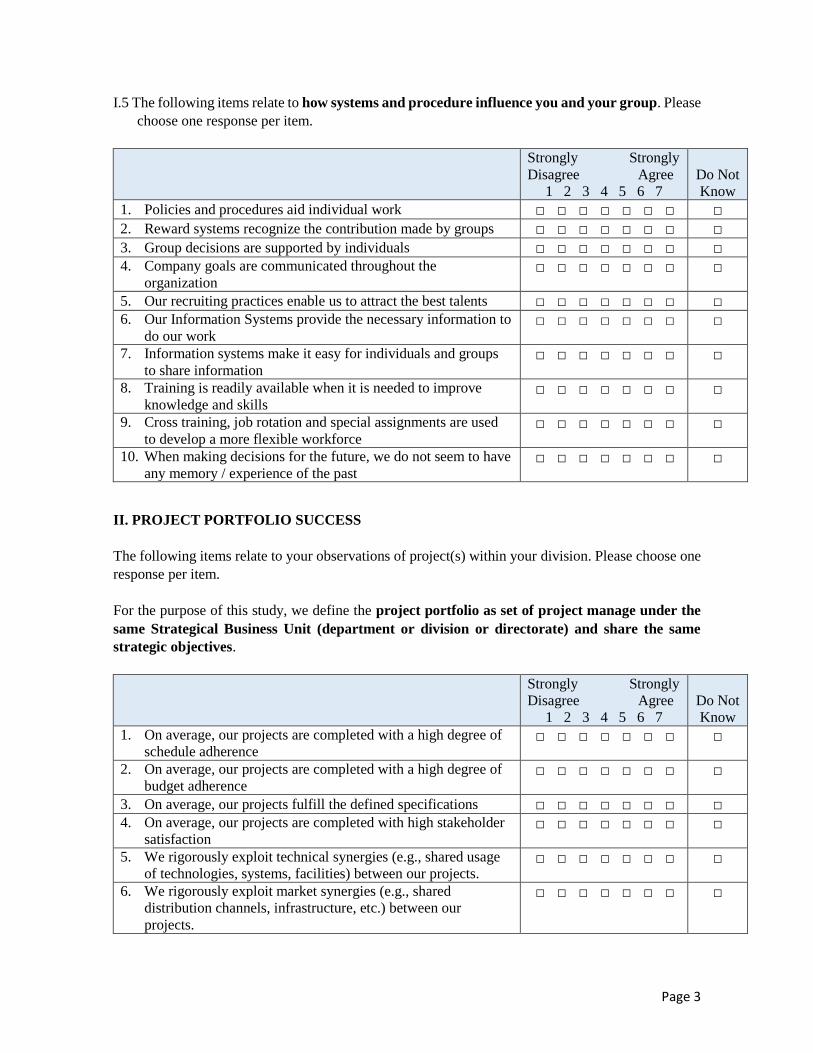
Page 3
I.5 The following items relate to how systems and procedure influence you and your group. Please
choose one response per item.
Strongly Strongly
Disagree Agree
1 2 3 4 5 6 7
Do Not
Know
1. Policies and procedures aid individual work □ □ □ □ □ □ □ □
2. Reward systems recognize the contribution made by groups □ □ □ □ □ □ □ □
3. Group decisions are supported by individuals □ □ □ □ □ □ □ □ 4. Company goals are communicated throughout the
organization □ □ □ □ □ □ □ □
5. Our recruiting practices enable us to attract the best talents □ □ □ □ □ □ □ □ 6. Our Information Systems provide the necessary information to
do our work □ □ □ □ □ □ □ □
7. Information systems make it easy for individuals and groups
to share information □ □ □ □ □ □ □ □
8. Training is readily available when it is needed to improve
knowledge and skills □ □ □ □ □ □ □ □
9. Cross training, job rotation and special assignments are used
to develop a more flexible workforce □ □ □ □ □ □ □ □
10. When making decisions for the future, we do not seem to have
any memory / experience of the past □ □ □ □ □ □ □ □
II. PROJECT PORTFOLIO SUCCESS
The following items relate to your observations of project(s) within your division. Please choose one
response per item.
For the purpose of this study, we define the project portfolio as set of project manage under the
same Strategical Business Unit (department or division or directorate) and share the same
strategic objectives.
Strongly Strongly
Disagree Agree
1 2 3 4 5 6 7
Do Not
Know
1. On average, our projects are completed with a high degree of
schedule adherence □ □ □ □ □ □ □ □
2. On average, our projects are completed with a high degree of
budget adherence □ □ □ □ □ □ □ □
3. On average, our projects fulfill the defined specifications □ □ □ □ □ □ □ □ 4. On average, our projects are completed with high stakeholder
satisfaction □ □ □ □ □ □ □ □
5. We rigorously exploit technical synergies (e.g., shared usage
of technologies, systems, facilities) between our projects. □ □ □ □ □ □ □ □
6. We rigorously exploit market synergies (e.g., shared
distribution channels, infrastructure, etc.) between our
projects.
□ □ □ □ □ □ □ □
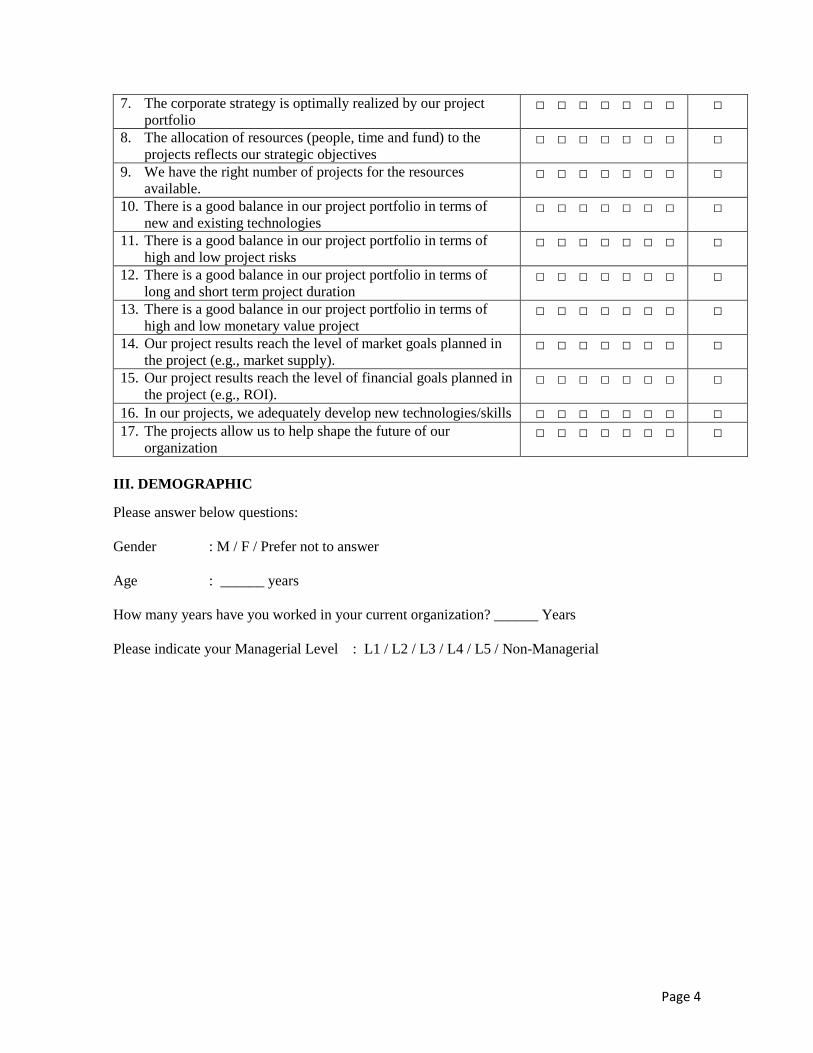
Page 4
7. The corporate strategy is optimally realized by our project
portfolio □ □ □ □ □ □ □ □
8. The allocation of resources (people, time and fund) to the
projects reflects our strategic objectives □ □ □ □ □ □ □ □
9. We have the right number of projects for the resources
available. □ □ □ □ □ □ □ □
10. There is a good balance in our project portfolio in terms of
new and existing technologies □ □ □ □ □ □ □ □
11. There is a good balance in our project portfolio in terms of
high and low project risks □ □ □ □ □ □ □ □
12. There is a good balance in our project portfolio in terms of
long and short term project duration □ □ □ □ □ □ □ □
13. There is a good balance in our project portfolio in terms of
high and low monetary value project □ □ □ □ □ □ □ □
14. Our project results reach the level of market goals planned in
the project (e.g., market supply). □ □ □ □ □ □ □ □
15. Our project results reach the level of financial goals planned in
the project (e.g., ROI). □ □ □ □ □ □ □ □
16. In our projects, we adequately develop new technologies/skills □ □ □ □ □ □ □ □ 17. The projects allow us to help shape the future of our
organization □ □ □ □ □ □ □ □
III. DEMOGRAPHIC
Please answer below questions:
Gender : M / F / Prefer not to answer
Age : ______ years
How many years have you worked in your current organization? ______ Years
Please indicate your Managerial Level : L1 / L2 / L3 / L4 / L5 / Non-Managerial

Page 1
APPENDIX 4 - QUESTIONNAIRE (BAHASA INDONESIA VERSION)
Dear Respondent,
Kami adalah dua mahasiswa master dalam program studi Strategis Manajemen Proyek di Umeå
School of Business and Economicsi, Swedia. Kami sedang melakukan penelitian tentang
Pembelajaran dalam Organisasi (Organizational Learning) dan Portfolio Proyek (Project Portfolio).
Kami ingin mengucapkan terima kasih untuk kesediaan anda berpartisipasi dalam survei ini. Kami
menjamin kerahasiaan semua jawaban yang diberikan oleh anda.
Kuesioner ini terdiri dari 3 bagian: Demografi, Pembelajaran dalam Organisasi (Organizational
Learning) dan Portofolio Proyek (Project Portfolio) dan waktu yang diperlukan untuk menyelesaikan
kuisioner ini sekitar 10-20 menit. Jika Anda menemukan masalah apapun dan / atau ingin berdiskusi
mengenai kuesioner ini, anda dapat menghubungi kami melalui email [email protected].
Autie Minati Putri and Mostafa Al Hadla
------------------------------------------------------------------------------------------------------------------------
I. ORGANIZATIONAL LEARNING
Bagian ini terdiri dari 5 sub-bagian, masing-masing menggunakan skala 1 hingga 7. "1" mewakili
bahwa anda sangat tidak setuju dengan pernyataan dan "7" mewakili sangat setuju. Anda memiliki
pilihan untuk tidak menjawab ketika Anda merasa bahwa tidak memiliki pengalaman atau
pengetahuan tentang pernyataan tersebut. Silahkan memilih pilihan "Tidak tahu" dalam situasi seperti
itu.
I.1 Pernyataan-pernyataan berikut terkait tentang pengamatan anda terhadap individu dalam
organisasi. Mohon memilih satu jawaban untuk tiap kalimat.
Strongly Strongly
Disagree Agree
1 2 3 4 5 6 7
Do Not
Know
1. Individu memiliki informasi dan pengetahuan terkini/terbaru
tentang pekerjaan mereka □ □ □ □ □ □ □ □
2. Individu memiliki kebanggan atas pencapaian dalam
pekerjaan mereka □ □ □ □ □ □ □ □
3. Individu menghasilkan banyak wawasan baru yang
bermanfaat □ □ □ □ □ □ □ □
4. Individu memiliki tingkat energi yang tinggi di tempat kerja □ □ □ □ □ □ □ □ 5. Individu dapat berkembang melalui pekerjaan mereka □ □ □ □ □ □ □ □ 6. Individu memiliki arah yang jelas dalam melaksanakan
pekerjaan mereka □ □ □ □ □ □ □ □

Page 2
I.2 Pernyataan-pernyataan berikut terkait tentang pengamatan anda terhadap grup kerja yang ada
dalam organisasi (contoh: departemen, grup proyek, grup disiplin kerja). Mohon memilih satu
jawaban untuk tiap kalimat.
Strongly Strongly
Disagree Agree
1 2 3 4 5 6 7
Do Not
Know
1. Dalam meeting, kami berusaha untuk memahami dan
memanfaatkan sudut pandang semua orang □ □ □ □ □ □ □ □
2. Kami berbagi keberhasilan dalam grup □ □ □ □ □ □ □ □ 3. Kami berbagi kegagalan dalam grup □ □ □ □ □ □ □ □ 4. Kami memiliki metode resolusi konflik yang efektif ketika
bekerja dalam grup □ □ □ □ □ □ □ □
5. Grup dalam organisasi mudah untuk beradaptasi □ □ □ □ □ □ □ □ 6. Grup memiliki pemahaman yang sama terhadap masalah
dalam departemen □ □ □ □ □ □ □ □
7. Grup memiliki orang-orang yang tepat untuk dilibatkan dalam
menangani masalah □ □ □ □ □ □ □ □
8. Grup siap untuk memikirkan kembali keputusan ketika
dihadapkan dengan informasi baru □ □ □ □ □ □ □ □
I.3 Pernyataan-pernyataan berikut terkait tentang struktur organisasi, budaya, visi dan strategi.
Mohon memilih satu jawaban untuk tiap kalimat.
Strongly Strongly
Disagree Agree
1 2 3 4 5 6 7
Do Not
Know
1. Kami memiliki strategi yang jelas dan terdokumentasi yang
membantu posisi kami di masa depan □ □ □ □ □ □ □ □
2. Struktur organisasi yang ada mendukung arah strategis kami □ □ □ □ □ □ □ □ 3. Struktur organisasi yang ada memungkinkan kami untuk
bekerja secara efektif □ □ □ □ □ □ □ □
4. Prosedur operasional yang dipakai merupakan yang
terkini/terbaru dan sesuai dengan efisiensi aktivitas
operasional
□ □ □ □ □ □ □ □
5. Budaya organisasi kami dapat dikarakterisasi sebagai inovatif □ □ □ □ □ □ □ □ 6. Kami memiliki sistem yang diperlukan (Manajemen Kualitas,
SIstem Informasi, Manajemen Proyek, dll) untuk menerapkan
strategi kami
□ □ □ □ □ □ □ □
7. Kami memiliki Sistem Informasi tingkat tinggi dan terkini □ □ □ □ □ □ □ □ 8. Kami memiliki budaya organisasi yang ditandai dengan
tingkat kepercayaan yang tinggi □ □ □ □ □ □ □ □

Page 3
I.4 Pernyataan-pernyataan berikut terkait tentang bagaimana anda dan grup anda mempengaruhi
organisasi anda. Mohon memilih satu jawaban untuk tiap kalimat.
Strongly Strongly
Disagree Agree
1 2 3 4 5 6 7
Do Not
Know
1. Pelajaran yang didapat satu grup, secara aktif dibagikan
dengan yang lain □ □ □ □ □ □ □ □
2. Individu memberikan masukan terhadap strategi organisasi
(strategi, proses, produk dll) □ □ □ □ □ □ □ □
3. Grup mengusulkan solusi inovatif terkait masalah yang
dihadapi organisasi (strategi, proses, produk dll) □ □ □ □ □ □ □ □
4. Rekomendasi dari grup dijalankan oleh organisasi □ □ □ □ □ □ □ □ 5. Individu berusaha untuk berbagi dan berdiskusi dengan
grupkerja mereka / grup lainnya □ □ □ □ □ □ □ □
6. Individu memberikan tantangan terhadap asumsi dalam
kelompok □ □ □ □ □ □ □ □
7. Perusahaan ini memiliki sistem untuk memanfaatkan
intelektual tenaga kerja mereka □ □ □ □ □ □ □ □
I.5 Pernyataan-pernyataan berikut terkait tentang bagaimana sistem dan prosedur yang ada
mempengaruhi anda dan grup anda. Mohon memilih satu jawaban untuk tiap kalimat.
Strongly Strongly
Disagree Agree
1 2 3 4 5 6 7
Do Not
Know
1. Kebijakan dan prosedur kerja yang ada membantu individu
dalam bekerja □ □ □ □ □ □ □ □
2. Sistem penghargaan yang berjalan memberikan penghargaan
terhadap kontribusi yang diberikan oleh grup □ □ □ □ □ □ □ □
3. Keputusan grup didukung oleh individu □ □ □ □ □ □ □ □ 4. Tujuan perusahaan dikomunikasikan ke seluruh organisasi □ □ □ □ □ □ □ □ 5. Praktek perekrutan kami memungkinkan kita untuk menarik
bakat-bakat terbaik □ □ □ □ □ □ □ □
6. Sistem Informasi kami memberikan informasi yang diperlukan
untuk melakukan pekerjaan □ □ □ □ □ □ □ □
7. Sistem informasi kemi memudahkan bagi individu dan grup
untuk berbagi informasi □ □ □ □ □ □ □ □
8. Pelatihan tersedia saat dibutuhkan untuk meningkatkan
pengetahuan dan keterampilan □ □ □ □ □ □ □ □
9. Pelatihan lintas bagian, rotasi pekerjaan dan penugasan khusus
digunakan untuk mengembangkan tenaga kerja yang lebih
fleksibel
□ □ □ □ □ □ □ □
10. Ketika membuat keputusan, kami seperti tidak memiliki
pengalaman yang serupa sebelumnya □ □ □ □ □ □ □ □

Page 4
II. PROJECT PORTFOLIO SUCCESS
Pernyataan-pernyataan terkait tentang pengamatan anda terhadap proyek-proyek dalam divisi Anda..
Mohon memilih satu jawaban untuk tiap kalimat.
Dalam penelitian ini, kami mendefinisikan portofolio proyek sebagai beberapa proyek yang dikelola
dalam satu Unit Bisnis Strategik (contoh: departemen atau divisi atau direktorat) dan berkaitan
dengan tujuan strategis yang sama.
Strongly Strongly
Disagree Agree
1 2 3 4 5 6 7
Do Not
Know
1. Rata-rata, proyek-proyek kami selesai sesuai dengan jadwal
yang direncanakan □ □ □ □ □ □ □ □
2. Rata-rata, proyek-proyek kami selesai sesuai dengan anggaran
yang direncanakan □ □ □ □ □ □ □ □
3. Rata-rata, proyek-proyek kami memenuhi spesifikasi yang
ditentukan □ □ □ □ □ □ □ □
4. Rata-rata, proyek-proyek kami selesai dengan tingkat
kepuasan stakeholder yang tinggi □ □ □ □ □ □ □ □
5. Terdapat sinergi teknis yang tinggi di anatara proyek-proyek
yang ada (contoh: penggunaan bersama teknologi, sistem,
fasilitas)
□ □ □ □ □ □ □ □
6. Terdapat sinergi pasar yang tinggi di antara proyek-proyek
yang ada (contoh: penggunaan bersama jalur distribusi,
infrastruktur)
□ □ □ □ □ □ □ □
7. Strategi perusahaan diwujudkan oleh portofolio proyek yang
ada □ □ □ □ □ □ □ □
8. Pengalokasian sumber daya (tenaga, waktu dan dana) terhadap
proyek mencerminkan tujuan strategis perusahaan □ □ □ □ □ □ □ □
9. Jumlah proyek yang ada sesuai dengan ketersediaan sumber
daya □ □ □ □ □ □ □ □
10. Terdapat keseimbangan yang baik dalam portfolio kami dalam
hal proyek yang menggunakan teknologi baru dan teknologi
yang sudah pernah digunakan perusahaan
□ □ □ □ □ □ □ □
11. Terdapat keseimbangan yang baik dalam portfolio kami dalam
hal proyek yang memiliki risiko tinggi dan risiko rendah □ □ □ □ □ □ □ □
12. Terdapat keseimbangan yang baik dalam portfolio kami dalam
hal proyek yang memiliki durasi panjang dan pendek □ □ □ □ □ □ □ □
13. Terdapat keseimbangan yang baik dalam portfolio kami dalam
hal proyek yang memiliki nilai moneter tinggi dan rendah □ □ □ □ □ □ □ □
14. Proyek-proyek yang ada mencapai target pasar yang
direncanakan (contoh: target suplai pasar) □ □ □ □ □ □ □ □
15. Proyek-proyek yang ada mencapai target finansial yang
direncanakan (contoh: ROI) □ □ □ □ □ □ □ □
16. Proyek-proyek yang ada membantu pengembangan teknologi
dan kompetensi baru □ □ □ □ □ □ □ □

Page 5
17. Proyek-proyek yang ada membantu membentuk masa depan
perusahaan □ □ □ □ □ □ □ □
III.DEMOGRAPHIC
Mohon mengisi pertanyaan berikut
Gender : L / P / Memilih untuk tidak menjawab
Usia : ______ tahun
Sudah berapa lama anda bekerja dalam perusahaan anda sekarang? ______ tahun
Apakah level manajerial anda saat ini? L1 / L2 / L3 / L4 / L5 / Non Manajerial

Page 1
APPENDIX 5 – DESCRIPTIVE ANALYSIS RESULT
I. ORGANIZATIONAL LEARNING
Individual Learning Stock Items No. of
Response Mean Median Modus St.Dev
1. Individuals are current and knowledgeable about their
work 123 5.06 6 6 1.31
2. Individuals feel a sense of accomplishment in what
they do 122 5.00 6 6 1.24
3. Individuals generate many new and valuable insights 123 5.11 6 6 1.10
4. Individuals have a high level of energy at work 123 4.02 4 4 1.31
5. Individuals are able to grow through their work 123 4.89 5 5 1.26
6. Individuals have a clear sense of direction in their work 121 4.79 6 6 1.50
TOTAL 4.81 5.00 5 1.07
Group Learning Stock Items No. of
Response Mean Median Modus St.Dev
1. In meetings, we seek to understand and utilize
everyone's point of view 122 4.05 5 5 1.07
2. We share our successes within the group 121 4.53 6 6 1.43
3. We share our failures within the group 120 4.31 6 6 1.32
4. We have effective conflict resolution when working in
groups 122 3.34 4 4 0.99
5. Groups in the organization are adaptable 123 3.46 4 4 0.90
6. Groups have a common understanding of departmental
issues 123 3.61 4 4 0.88
7. Groups have the right people involved in addressing
the issues 121 4.52 6 6 1.21
8. Groups are prepared to rethink decisions when
presented with new information 120 3.95 5 5 1.10
TOTAL 3.97 3.88 3.13 0.93
Organizational Learning Stock Items No. of
Response Mean Median Modus St.Dev
1. We have a Clear and Documented strategy that
positions us well for the future 121 3.42 4 4 1.07
2. The organizational structure supports our strategic
direction 123 4.12 5 5 1.42
3. The organizational structure allows us to work
effectively 121 4.07 5 5 1.45
4. The organizational procedures are up to date and
suitable for efficient operational activities 123 4.04 5 5 1.39
5. The organization's culture could be characterized as
innovative 119 4.06 4 4 1.12

Page 2
6. We have the necessary systems (Quality, MIS, Project
Management, etc.) to implement our strategy 123 5.33 7 7 2.12
7. We have advanced and up to date Information Systems 122 5.39 6 6 1.46
8. We have an organizational culture characterized by a
high degree of trust 121 4.61 5 5 1.28
TOTAL 4.38 4.38 5 0.96
Feed Forward Learning Flow Items No. of
Response Mean Median Modus St.Dev
1. Lessons learned by one group are actively shared with
others 123 5.12 6 6 1.36
2. Individuals have inputs into organization-wide issues
(e.g. strategy, processes, products) 123 3.95 5 5 1.33
3. Groups propose innovative solutions to organization-
wide issues (e.g. strategy, processes, products) 122 4.16 5 5 1.34
4. Recommendations by groups are adopted by the
organization 121 4.49 6 6 1.70
5. Individuals seek to share and discuss their knowledge
with their group of work/other Groups 123 4.48 5 5 1.00
6. Individuals challenge the assumptions of the group 122 5.14 6 6 1.32
7. The company has systems in place to utilize the
intelligence of its workforce 123 4.65 5 6 1.30
8. Lessons learned by one group are actively shared with
others 123 5.12 6 6 1.36
TOTAL 4.57 4.71 3.14 0.93
Feed Back Learning Flow Items No. of
Response Mean Median Modus St.Dev
1. Policies and procedures aid individual work 121 4.81 6 6 1.24
2. Reward systems recognize the contribution made by
groups 118 3.89 5 5 1.19
3. Group decisions are supported by individuals 122 4.09 4 4 0.87
4. Company goals are communicated throughout the
organization 123 4.66 5 5 0.98
5. Our recruiting practices enable us to attract the best
talents 121 3.89 5 5 1.46
6. Our Information Systems provide the necessary
information to do our work 122 5.11 6.5 7 1.92
7. Information systems make it easy for individuals and
groups to share information 121 5.03 6 6 1.36
8. Training is readily available when it is needed to
improve knowledge and skills 122 4.31 5.5 6 1.73
9. Cross training, job rotation and special assignments are
used to develop a more flexible workforce 123 4.04 6 6 2.13

Page 3
10. When making decisions for the future, we do not seem
to have any memory / experience of the past 120 4.87 6 6 1.43
TOTAL 4.47 4.30 4.60 1.17
II. PROJECT PORTFOLIO SUCCESS
Project Portfolio Success Item No. of
Response Mean Median Modus St.Dev
Average Project Success 4.58 4.00 4.00 1.18
1. On average, our projects are completed with a high
degree of schedule adherence 123 4.03 4 4 1.25
2. On average, our projects are completed with a high
degree of budget adherence 122 4.32 4 5 1.50
3. On average, our projects fulfill the defined
specifications 123 4.66 4 4 1.55
4. On average, our projects are completed with high
stakeholder satisfaction 117 5.31 4 6 1.23
Synergies 4.16 3.00 3.00 1.29
1. We rigorously exploit technical synergies (e.g., shared
usage of technologies, systems, facilities) between our
projects.
120 4.44 4 4 1.23
2. We rigorously exploit market synergies (e.g., shared
distribution channels, infrastructure, etc.) between our
projects.
116 3.88 3 2 1.37
Strategic Fit 3.81 4.00 4.00 1.25
1. The corporate strategy is optimally realized by our
project portfolio 118 3.72 3 3 1.32
2. The allocation of resources (people, time and fund) to
the projects reflects our strategic objectives 121 3.35 3 2 1.29
3. We have the right number of projects for the resources
available. 122 4.36 3 2 2.07
Portfolio Balance 4.24 3.25 3.25 1.47
1. There is a good balance in our project portfolio in
terms of new and existing technologies 117 4.73 4 6 1.51
2. There is a good balance in our project portfolio in
terms of high and low project risks 118 4.58 4 2 1.62
3. There is a good balance in our project portfolio in
terms of long and short term project duration 117 3.80 3 2 1.57
4. There is a good balance in our project portfolio in
terms of high and low monetary value project 117 3.85 3 2 1.60
Average Product Success 4.54 4.00 4.00 1.42
1. Our project results reach the level of market goals
planned in the project (e.g., market supply). 119 4.35 3 3 1.34
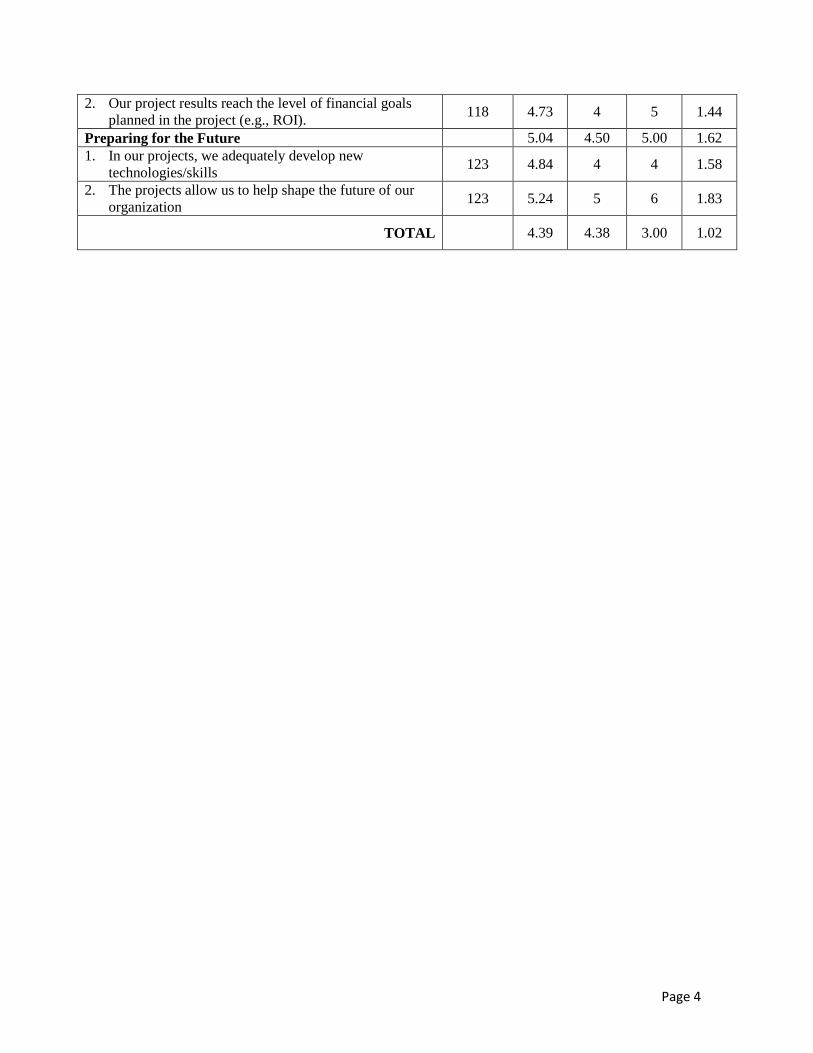
Page 4
2. Our project results reach the level of financial goals
planned in the project (e.g., ROI). 118 4.73 4 5 1.44
Preparing for the Future 5.04 4.50 5.00 1.62
1. In our projects, we adequately develop new
technologies/skills 123 4.84 4 4 1.58
2. The projects allow us to help shape the future of our
organization 123 5.24 5 6 1.83
TOTAL 4.39 4.38 3.00 1.02

Page 1
APPENDIX 6 – REGRESSION ANALYSIS SPSS RESULT
Regression H1a
Independent Variable: Individual Stock (IS)
Dependent Variable: Project Portfolio Success (PPS)
Variables Entered/Removeda
Model Variables Entered Variables Removed Method
1 ISb . Enter
a. Dependent Variable: PPS
b. All requested variables entered.
Model Summary
Model R R Square Adjusted R Square Std. Error of the Estimate
1 .855a .731 .729 .52897
a. Predictors: (Constant), IS
ANOVAa
Model Sum of Squares df Mean Square F Sig.
1 Regression 92.132 1 92.132 329.268 .000b
Residual 33.857 121 .280
Total 125.989 122
a. Dependent Variable: PPS
b. Predictors: (Constant), IS
Coefficientsa
Model
Unstandardized Coefficients Standardized Coefficients
t Sig. B Std. Error Beta
1 (Constant) .507 .219 2.310 .023
IS .809 .045 .855 18.146 .000
a. Dependent Variable: PPS

Page 2
Regression H1b
Independent Variable: Group Stock (GS)
Dependent Variable: Project Portfolio Success (PPS)
Variables Entered/Removeda
Model Variables Entered Variables Removed Method
1 GSb . Enter
a. Dependent Variable: PPS
b. All requested variables entered.
Model Summary
Model R R Square Adjusted R Square Std. Error of the Estimate
1 .886a .785 .783 .47315
a. Predictors: (Constant), GS
ANOVAa
Model Sum of Squares df Mean Square F Sig.
1 Regression 98.900 1 98.900 441.772 .000b
Residual 27.089 121 .224
Total 125.989 122
a. Dependent Variable: PPS
b. Predictors: (Constant), GS
Coefficientsa
Model
Unstandardized Coefficients Standardized Coefficients
t Sig. B Std. Error Beta
1 (Constant) .551 .188 2.937 .004
GS .967 .046 .886 21/018 .000
a. Dependent Variable: PPS

Page 3
Regression H1c
Independent Variable: Organizational Stock (GS)
Dependent Variable: Project Portfolio Success (PPS)
Variables Entered/Removeda
Model Variables Entered Variables Removed Method
1 OSb . Enter
a. Dependent Variable: PPS
b. All requested variables entered.
Model Summary
Model R R Square Adjusted R Square Std. Error of the Estimate
1 .890a .792 .791 .46510
a. Predictors: (Constant), OS
ANOVAa
Model Sum of Squares df Mean Square F Sig.
1 Regression 99.815 1 99.815 461.436 .000b
Residual 26.174 121 .216
Total 125.989 122
a. Dependent Variable: PPS
b. Predictors: (Constant), OS
Coefficientsa
Model
Unstandardized Coefficients Standardized Coefficients
t Sig. B Std. Error Beta
1 (Constant) .278 .196 1.418 .159
OS .940 .044 .890 21.481 .000
a. Dependent Variable: PPS

Page 4
Regression – Best Fitting Model
Independent Variable: Individual Stock (IS), Group Stock (GS), Organizational Stock (GS)
Dependent Variable: Project Portfolio Success (PPS)
Variables Entered/Removeda
Model Variables Entered Variables Removed Method
1 OS .
Stepwise (Criteria: Probability-of-F-to-enter <= .050,
Probability-of-F-to-remove >= .100).
2 IS .
Stepwise (Criteria: Probability-of-F-to-enter <= .050,
Probability-of-F-to-remove >= .100).
3 GS .
Stepwise (Criteria: Probability-of-F-to-enter <= .050,
Probability-of-F-to-remove >= .100).
a. Dependent Variable: PPS
Model Summary
Model R R Square Adjusted R Square Std. Error of the Estimate
1 .890a .792 .791 .46510
2 .914b .836 .833 .41526
3 .922c .850 .846 .39917
a. Predictors: (Constant), OS
b. Predictors: (Constant), OS, IS
c. Predictors: (Constant), OS, IS, GS
ANOVAa
Model Sum of Squares df Mean Square F Sig.
1 Regression 99.815 1 99.815 461.436 .000b
Residual 26.174 121 .216
Total 125.989 122
2 Regression 105.296 2 52.648 305.311 .000c
Residual 20.693 120 .172
Total 125.989 122
3 Regression 107.028 3 35.676 223.906 .000d
Residual 18.961 119 .159
Total 125.989 122
a. Dependent Variable: PPS
b. Predictors: (Constant), OS
c. Predictors: (Constant), OS, IS
d. Predictors: (Constant), OS, IS, GS
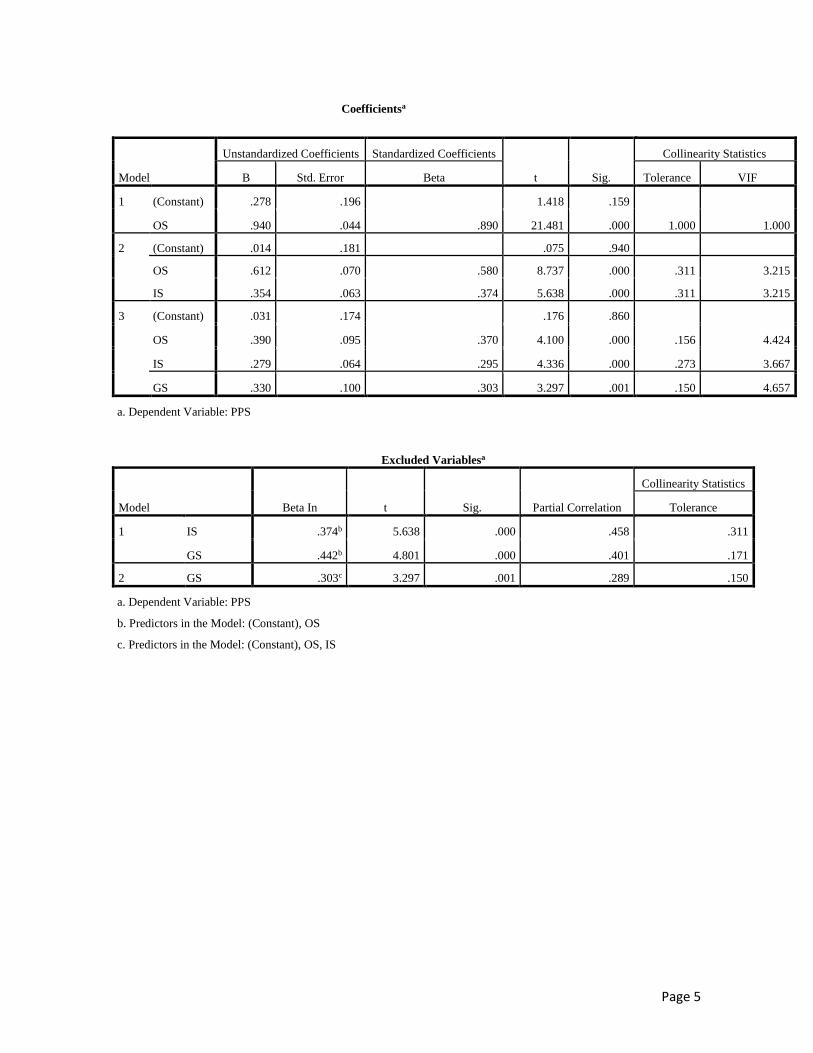
Page 5
Coefficientsa
Model
Unstandardized Coefficients Standardized Coefficients
t Sig.
Collinearity Statistics
B Std. Error Beta Tolerance VIF
1 (Constant) .278 .196 1.418 .159
OS .940 .044 .890 21.481 .000 1.000 1.000
2 (Constant) .014 .181 .075 .940
OS .612 .070 .580 8.737 .000 .311 3.215
IS .354 .063 .374 5.638 .000 .311 3.215
3 (Constant) .031 .174 .176 .860
OS .390 .095 .370 4.100 .000 .156 4.424
IS .279 .064 .295 4.336 .000 .273 3.667
GS .330 .100 .303 3.297 .001 .150 4.657
a. Dependent Variable: PPS
Excluded Variablesa
Model Beta In t Sig. Partial Correlation
Collinearity Statistics
Tolerance
1 IS .374b 5.638 .000 .458 .311
GS .442b 4.801 .000 .401 .171
2 GS .303c 3.297 .001 .289 .150
a. Dependent Variable: PPS
b. Predictors in the Model: (Constant), OS
c. Predictors in the Model: (Constant), OS, IS

Page 6
Regression H2
Independent Variable: Misalignment (MIS)
Dependent Variable: Project Portfolio Success (PPS)
Variables Entered/Removeda
Model Variables Entered Variables Removed Method
1 MISb . Enter
a. Dependent Variable: PPS
b. All requested variables entered.
Model Summary
Model R R Square Adjusted R Square Std. Error of the Estimate
1 .710a .505 .501 .71810
a. Predictors: (Constant), MIS
ANOVAa
Model Sum of Squares df Mean Square F Sig.
1 Regression 63.593 1 63.593 123.321 .000b
Residual 62.396 121 .516
Total 125.989 122
a. Dependent Variable: PPS
b. Predictors: (Constant), MIS
Coefficientsa
Model
Unstandardized Coefficients Standardized Coefficients
t Sig. B Std. Error Beta
1 (Constant) 5.660 .131 43.167 .000
MIS -2.085 .188 -.710 -11.105 .000
a. Dependent Variable: PPS


![Diabetologia, 60(3): 442-452 Poveda, A., Chen, Y ...umu.diva-portal.org/smash/get/diva2:1096961/FULLTEXT01.pdfdiometabolictraitsandotherpersonalcharacteristicsexist[9]. Methods Study](https://img.pdfslide.net/doc/110x75/5b35eff17f8b9a6b548dc538/diabetologia-603-442-452-poveda-a-chen-y-umudiva-1096961fulltext01pdfdiometabolictraitsandotherpersonalcharacteristicsexist9.jpg)