Embed Size (px)
Citation preview

Organizational Studies Department – Honors Thesis
Hire ME:
An examination and evaluation of the human capital transformations to recruit Generation Y into government service and retain them once they’re there
Neil Tambe
4/17/2009

Page | 1
Table of Contents Acknowledgements ....................................................................................................................................... 3
Abstract ......................................................................................................................................................... 4
Introduction ................................................................................................................................................... 5
Methods ........................................................................................................................................................ 7
Understanding Gen Y ................................................................................................................................. 12
Volunteerism and Public Service ............................................................................................................ 13
Workplace and Interpersonal Attributes ................................................................................................. 15
Alternative Viewpoints about Generation Y ........................................................................................... 16
Managing Workforce Relations .............................................................................................................. 17
Overview of Federal Human Capital’s History .......................................................................................... 18
Legislation............................................................................................................................................... 19
Building the cases ....................................................................................................................................... 22 Patsy Stevens – Office of Personnel Management ................................................................................. 23
Case #1 – National Aeronautics and Space Administration ................................................................... 24
NASA’s Unique Circumstances .......................................................................................................... 24
Recruitment/Onboarding ..................................................................................................................... 25
Retention/Culture/Leadership ............................................................................................................. 27
HR/Recruitment Communication ....................................................................................................... 28
Training and Development.................................................................................................................. 29
Stephanie Spence-Diamond ................................................................................................................ 30
Ashwin Lalendran ............................................................................................................................... 32
Case #2 – Department of State ................................................................................................................ 35
The Department’s Unique Challenges ................................................................................................ 35
Recruitment/Onboarding ..................................................................................................................... 37
Retention/Culture/Leadership ............................................................................................................. 38
HR/Recruitment Communication ....................................................................................................... 39
Training and Development.................................................................................................................. 40
Tamara Brooks .................................................................................................................................... 40
Adrienne O’Neal ................................................................................................................................. 42
Samuel Kleiner .................................................................................................................................... 44
Jessica Clayton .................................................................................................................................... 45
Analysis of Trend Data ............................................................................................................................... 46 Data from OPM’s Central Personnel Data File ...................................................................................... 47
Data from OPM’s Federal Human Capital Survey ................................................................................. 51
Discussion ................................................................................................................................................... 53

Page | 2
Research Methods ................................................................................................................................... 53
Generation Y insights ............................................................................................................................. 54
Recruitment/Onboarding ..................................................................................................................... 54
Retention/Culture/Leadership ............................................................................................................. 56
HR/Recruitment Communication ....................................................................................................... 58
Training and Development.................................................................................................................. 59
Conclusions on Gen Y ........................................................................................................................ 59
Government wide insights ...................................................................................................................... 60
Bibliography ............................................................................................................................................... 64
Appendix A – Figures and Tables............................................................................................................... 68
Appendix B – Data Tables and Charts ........................................................................................................ 73
Appendix C – Interview Guides.................................................................................................................. 95
Guide For Agency Officials .................................................................................................................... 95
Guide for Former Interns ........................................................................................................................ 96

Page | 3
Acknowledgements There are many people that I would like to thank and acknowledge in writing this labor-
of-love-of-a research paper. First and foremost, I thank my mentor Dr. Lynn Wooten for her
guidance, support, enthusiasm and willingness to meet at odd hours to provide feedback and
revisions. Her enthusiasm was matched by members of the Organizational Studies community;
though all members of the staff and faculty were supremely supportive, I’d like to individually
thank Dr. Rick Price and Catherine Philbin for their help and guidance during the past 15
months. I also thank Dr. Edie Goldenberg for her willingness to be my third-reader after trading
only a few e-mails with a student she barely knew at the time.
I’d also like to specially thank the staff of the Partnership for Public Service and the
research team in particular. Their tutelage—whether it was riding from interviews with John
Palguta and absorbing his knowledge, talking about survey questions with Joshua Joseph, getting
nerdy (willfully, of course) about designing bar graphs with Janelle Callahan, feeling energized
after talking to Judy England-Joseph and Sally Jaggar about performance metrics, video-
conferencing with Bob Lavigna about the Senior Executive Service or being constantly mentored
and challenged by Jonathan Kappler—was something that was instrumental in even attempting
this thesis and was the best work experience of my life thus far.
I’d also like to acknowledge some friends for their support and insight. Leslie Zaikis and
Tyrone Schiff were great thesis peers. I’d also like to thank Madeline Stano, Jennifer Howard,
Jason Raymond, Suneal Rao, Dhruv Menawat and Lainie Kokas for always seeing the sunnier
side when I would complain about my research. Finally, I’d like to shout to Jon Ilijic and Aaron
Ellis, two of my housemates and fraternity brothers who motivated me to keep working hard and
helped me think through my data and conclusions. Also, I shout out to the rest of my
housemates who had to put up with my thesis lunacy for the past several months. That my
parents, Girish and Anjali Tambe were encouraging is an understatement.
Most importantly, however, I’d like thank just over 1 million people I’ve never met: the
civil servants of the United States of America. It is their work and passion that prompted this
thesis and I am inspired by them daily. It was a frequent occurrence for me to become
overwhelmed and frustrated while writing this thesis, but when I would remember the sacrifices
and efforts of civil servants it gave me the drive to fight like hell and keep working. Why I get
out of bed in the morning is the aspiration to make the US Government the highest performing
organization in the world. The commitment of civil servants to create a better society renews
that desire when it falters.
Neil Tambe
March 2009

Page | 4
Abstract
One estimate predicts that 1/3 of the federal workforce will be retirement eligible by the year
2012. One approach to preparing for the retirement of the Baby Boomers is to recruit and retain
Generation Y workers. To understand federal human capital transformations to better recruit and
retain Generation Y workers I conducted a case study of two agencies—the Department of State
and the National Aeronautics and Space Administration (NASA). A case study using archival
data, personnel data and interviews reveals that the effects of federal human capital
transformations on the Generation Y work force are limited because transformations are centered
on recruitment and not retention. Moreover, I consider the effects limited because there has been
some visible increase in employment levels and accessions of Gen Y employees while there not
been visible decrease in voluntary separations or attrition of Gen Y employees. This may be
because of several reasons, such as larger human capital challenges facing these agencies besides
Gen Y recruitment and retention.

Page | 5
Introduction
The business of government is broad and sometimes under recognized. For example, a
civil servant keeps the official time of the country just as other federal employees fight terrorism
or ensure food safety. The civil service, the portion of the government workforce that keeps
government’s operations and services running, is a group that our nation could literally not
realistically live without. A large portion of the civil servants in the government workforce is
coming to the verge of retirement age, presenting a tremendous human capital challenge for
government human capital officials to address.
A report by the Partnership for Public Service estimates that 1/3 of the federal workforce
will be retirement eligible in the next 5 years (Partnership for Public Service, 2008). To make a
long story short, observers of federal human capital believe that an exodus of retirees out of
government service is possible, and are making provisions to try to prevent any upcoming brain
drain from affecting the business of government. Because of the possibility of a retirement
exodus crippling government agencies, it is necessary to create a pipeline for talent to bring in
the next generation of civil servants.
Preparing for a possible brain drain is no old issue, either. In 2001 the Government
Accountability Office (GAO), a government agency that works at the behest of congress to audit
the executive branch, released a report updating high-risk areas the government which needed to
be addressed quickly. In addition to topics already on the list, such as information security and
student financial aid programs, strategic human capital management was added a high-risk area
by GAO in 2001 and subsequent reports have outlined progress the government has made to
address human capital issues (Government Accountability Office, 2001). Human capital was
added as a high-risk area because ―federal agencies lacked a strategic approach to human capital

Page | 6
management that integrated human capital efforts with their missions and program goals,‖
(Government Accountability Office, 2008).
Plainly, if any sort of mass exodus—or even a slower, phased retirement of government
workers—from federal jobs is possible, government will need to be ready to fill vacancies with
skilled workers who can replace the retiring employees. I have observed that there are currently
two approaches circulating around federal human capital circles to address this issue: 1) recruit
and retain more Baby Boomers into government to begin a second career, 2) recruit and retain
new, younger Generation Y1 employees into government
2.
I will try to investigate the latter approach, the recruitment and retention of Generation Y
workers into government positions to prepare for and offset the retirement of the retiring Baby
Boom generation. The investigation of recruitment is aided by the investigation of retention
practices, because a purpose of recruiting talent is not only to attract the best employees possible,
but to keep and develop them. Overall, in this paper, I will investigate the effects and results of
transformations—the retooling and improvement of human capital systems, processes or
programs—in federal human capital practices on the recruitment and retention of Generation Y
workers since human capital was made a high-risk area by GAO.
The literature I examined about federal strategic human capital—GAO reports,
congressional testimonies and other white papers—provided high-level commentary about a few
topics. Those data sources tended to establish human capital as a priority for federal leadership,
recommend ways to improve federal human capital practices or provide updates on the
management of federal human capital.
1 In this paper I use Generation Y interchangeably with Gen Y
2 Generation X, the generation preceding Generation Y is excluded because it is a small generation and there are
fewer Generation X workers currently in the civil service because of the government’s reduction in hiring in the
1990’s. When Generation X was referred to in the literature, they usually fell under the category of older or mid-
career workers.
Page | 7
The literature I examined about Generation Y centered around two areas. First, the
literature described the attitudes and characteristics of the generation to provide HR professionals
with a background on Generation Y members and their behavior. Second, the literature made
recommendations to supervisors about how to communicate with, motivate and manage
members of Generation Y in the workplace. There was little written about how to create systems
to recruit and retain Gen Y workers and even less written about human capital transformations to
better recruit and retain Generation Y workers.
There was a gap in the literature because very little of the literature fused federal human
capital to Generation Y issues. I tried to add material to this gap by synthesizing material about
federal human capital and Generation Y, while also investigating federal human capital
systems—like recruitment or retention programs—intended to better recruit and retain
Generation Y workers. Also, I included an analysis of federal personnel data to try to get some
understanding of the effects of any transformations.
Methods
To present an integrated analysis of federal human capital as it relates to Generation Y
workers, I synthesized data across a diverse portfolio of sources. Also, I covered a variety of
topics outside of agency transformation, so that Generation Y recruitment and retention could be
understood in the context of the agencies studied and federal human capital more generally.
Before conducting a case study of agencies, I wanted to get a clear understanding of the
background information relevant to studying this topic. First, I wanted to understand the
characteristics and attitudes of Generation Y—so that I could frame the rest of my research and
thinking around themes that would be generation relevant—by reading about Generation Y,
specifically within the contexts of the workplace and public service.

Page | 8
Then, I wanted to understand federal human capital, broadly. This phase was aided by
the many government reports about human capital, mostly from the GAO, congressional
testimonies or legislation. To conclude my background research, I attempted to find information
about Generation Y in the federal government.
As my two case-study agencies, I selected the US Department of State (DoS) and the
National Aeronautics and Space Administration (NASA). First, I chose those agencies because
they both have a workforce with college-educated, professional workers. Also, the two agencies
have internship programs and other systems that provide some indication that the agencies are
interested in managing their Generation Y workforces. At first glance, these agencies also
showed traces of human capital transformations, according to my background research and my
personal familiarity with the organizations3.
Also, these agencies were interesting to study because of the contrasting characteristics of
the organizations’ workforces. For example, NASA has a high need for engineers while the
Department of State does not have a preferred major for its employees. Furthermore, the HR
structure of these organizations vary as DoS has two distinct workforces, the Civil and Foreign
Service, and NASA drives HR through each of its centers, like the Jet Propulsion Laboratory or
the Kennedy Space Center in Cape Canaveral Florida in addition to having a central HR office.
Finally, I chose these agencies because of their visibility and importance to government
work. First, the Department of State is a very prominent agency because of its historic
importance in US affairs abroad and because of its role in recent years after the beginning of the
wars in Iraq and Afghanistan. NASA is also important and visible, but for different reasons.
3 I had links to these agencies via an internship in Human Resources at the Department of State or networking
opportunities through an internship with the Partnership for Public Service, a D.C. based non-profit involved in
federal workforce issues. So, another prevailing reason for selecting these organizations is because I would
plausibly have better access to interview agency officials.

Page | 9
NASA is the US Space Agency and many technologies developed for spaceflight have been
converted for civilian purposes. NASA is among the frontrunners in government for research
and development in science and engineering. NASA also has public visibility because of its
missions involving human spaceflight or solar system exploration.
After conducting background research, I wanted to understand the intricacies of how the
case-study agencies underwent transformations to better recruit and retain Generation Y workers.
In other words, I wanted to fill in the gaps on the topics I was reading about in archival sources.
I did this by conducting telephone or in-person interviews with as many agency officials as
possible. These officials were junior or middle level employees and not executives in the
agencies studied. I also interviewed members of Generation Y with exposure to the agencies so
that I could get a different perspective on the human capital practices of the agencies I selected.
Finally, I attempted to see trends in federal human capital by examining government
personnel data. I did this to understand the effects of transformation efforts on the agencies’
workforces.
The primary dataset I used was from the Office of Personnel Management’s (OPM)
Central Personnel Data File, more commonly known as CPDF. This data is the main data source
on federal personnel made available to the public. The data covers employment numbers,
average salary, and average length of stay with the opportunity to filter the data according to
many demographic factors. The dataset also has similar flexibility when evaluating accessions
and separations totals. The online dataset is published at yearly intervals since 1998 and
quarterly intervals since early in the second Bush Administration
I used the employment, accessions and separations data. I captured the data at yearly
intervals using the information collected in September for each of those years, to accommodate

Page | 10
for seasonal variation. I also filtered the results to include only full-time, permanent employees.
I did this because I wanted to capture typical professional civil service workers, and not seasonal
or temporary employees. This also falls into practice with the analysis of other initiatives, like
the Partnership for Public Service’s Best Places to Work project.
I collected data in this way for three different groups of agencies: All
agencies/government-wide, the Department of State and NASA. I wanted to get all of these
groups so I could compare the individual agencies to each other and compare both agencies to
trends occurring government-wide. It should be noted, however, that the numbers from the
CPDF are not reflective of all government employees even when not selecting only full-time
permanent employees. The members of the military and the Department of State’s Foreign
Service, for example, are not included in the CPDF. Federal contractors, a ballooning portion of
the government workforce, are also not included. The tool I used to collect the data, named
FedScope, is hosted on the public Office of Personnel Management website. I collected data for
all years publically available online.
When taking data from the CPDF I broke down the data by agency and age group. Each
age group was in 5-year bands. Since data was collected over a 10-year period, the age groups
that fall within the range of Generation Y birth years could change over the course of the period
studied. To control for this problem, I calculated birth years for each age group in each year the
data was collected to determine which age groups could be considered to be in the Generation Y
cohort across the entire period studied. I did this by subtracting the upper and lower bounds of
each age band from the year the data was collected.
After calculating birth years for each age band’s upper and lower bound in each year of
the data, I matched the birth years against the range of birth years in Generation Y. Using 1978

Page | 11
as the first birth year of Generation Y, I selected the ―Less than 20‖, ―20-24‖ and ―25-29‖ as Gen
Y age groups because those groups fell into the Generation Y range of birth years a majority of
the time, when using the lower bound values.
Which age groups could be considered Generation Y?
Age band 1998 1999 2000 2001 2002 2003 2004 2005 2006 2007 2008
Usi
ng
up
per
bo
un
d Less
than 20 1978 1979 1980 1981 1982 1983 1984 1985 1986 1987 1988 20-24 1974 1975 1976 1977 1978 1979 1980 1981 1982 1983 1984 25-29 1969 1970 1971 1972 1973 1974 1975 1976 1977 1978 1979 30-34 1964 1965 1966 1967 1968 1969 1970 1971 1972 1973 1974
Age band 1998 1999 2000 2001 2002 2003 2004 2005 2006 2007 2008
Usi
ng
low
er b
ou
nd
Less than 20 1978 1979 1980 1981 1982 1983 1984 1985 1986 1987 1988
20-24 1978 1979 1980 1981 1982 1983 1984 1985 1986 1987 1988 25-29 1973 1974 1975 1976 1977 1978 1979 1980 1981 1982 1983 30-34 1968 1969 1970 1971 1972 1973 1974 1975 1976 1977 1978
Table 1 - Green cells are in the Gen Y age range
I conducted calculations or purposely disregarded bits of data while cleaning the dataset a
few times. Here is a summary of those methods:
The “Unspecified” Age Group – One of the age groups in the dataset was labeled
―unspecified‖. I disregarded this category because I could not attribute the data from that group
to any particular age group, Generation Y or otherwise. There were very few employees in this
category so disregarding this subset did not change the overall trends shown graphically.
Narrowing Separations – Separations from agencies were tallied in the CPDF. Separations
were broken down into many categories such as transferring out of the agency, quitting,
retirement or death. I disregarded all separations unless they were classified as quitting or
retirement because my premise was to understand voluntary attrition. Because it can be difficult
or a hassle to fire someone, transfers can be a method of de-facto termination from a government
position. However, since I was not able to determine the reason for any employee’s transfer, I
disregarded transfer data. I also disregarded the other categories of separation because my
reason for collecting separation was to get a flavor for people who left agencies voluntarily—for
the purpose of understanding retention. Overall, I summed separations categorized as
retirements or resignations to create a metric called ―voluntary separations‖.

Page | 12
SES hires – When comparing ratios of competitive service and excepted service hires, I did not
include SES hires in the comparison. I did this because they were a miniscule percentage of new
hires, and no Gen Y member would have enough experience to be considered for an SES
appointment.
State Department Foreign Service – Personnel data on the Foreign Service was not available
after 2005, so I eliminated Foreign Service Officer data completely from the dataset.
Additionally, I tried to get information from the strategic documents of agencies
themselves. In this effort, I tried to acquire human capital strategic plans and similar documents.
These documents vary between the agencies so the usefulness of these documents was mixed.
By looking at these documents and others like them, I tried to discern the role of generational
issues in strategic human capital management at these agencies.
Other pieces of data I tried to evaluate were surveys such as the Federal Human Capital
Survey, a survey administered to government employees to assess their attitudes on their jobs
and agencies. I was limited in my use of the Federal Human Capital Survey because I was not
able to break down the information in these datasets by age group and agency simultaneously;
only summary data was available.
In reality, I tried to find any information I could that might shed light into the state of
recruitment and retention at NASA or the Department of State. This includes examining those
agencies’ websites, recruitment materials or toolkits for HR practitioners. Even though these are
not sources that directly report human capital activities, they are materials that are inspired by the
values, programs and practices of an agency. Because they are influenced by agency human
capital practices, I decided to include them in my analysis.
Understanding Gen Y
To understand human capital in the context of Generation Y and its habits, preferences
and behaviors, an overview of Generation Y is necessary. To start, Generation Y has many

Page | 13
names in addition to Gen Y such as: millennial generation, generation me, the echo-boom
generation or the net generation. Gen Y follows Generation X in history. There are not any
commonly accepted dates for the beginning and end of Gen Y—likely because there were not
distinct historic events to serve as bookends for the generation, unlike the end of WWII to serve
as the beginning of the baby boom—but estimates usually do not precede 1978 or extend past the
early 2000s. So, roughly speaking the youngest Generation Y members are almost 10 years old
and the oldest members are in their early 30’s. Generation Y is the largest since the baby
boomers, and number approximately 80 million. In this paper, I only considered members of
Generation Y residing in the United States.
According to Dr. Jean M. Twenge in her book Generation Me: Why Today’s Young
Americans Are More Confident, Assertive, Entitled – and More Miserable Than Ever Before, a
research-based work on Gen Y psychology, Gen Y does have common traits and feelings.
―Generation Me has the highest self-esteem of any generation, but also the most depression. We
are more free and equal, but also more cynical. We expect to follow our dreams, but are anxious
about making that happen,‖ she says (Twenge, 2006, p. 212)
Volunteerism and Public Service
Conversely, Generation Y enjoys helping others. Volunteerism among youth has been on
the rise. Gen Y wants to help others and is the ―most socially conscious generation since the
1960’s,‖ (Tulgan & Martin, 2001). This is contrasted, however, by Gen Y’s general apathy
towards politics, public protest and voting. Gen Y shies away from these activities more than
previous generations because they feel that it is not worth their time to participate in these ways
if the difference they make is nominal or non-existent (Twenge, 2006, p. 138).

Page | 14
A report issued by the Partnership for Public Service and Universum USA in January of
2009 outlined additional information describing Generation Y attitudes, specifically towards
government employers and public service. One result found in the report is that
―government/public service‖ was the most selected among 46 industries in which undergrads
would ―ideally want to work‖ when choosing their first job after graduation. The
government/public service category was chosen by 17% of undergraduates surveyed, followed
by healthcare (13%), education (12%) and marketing/advertising (11%).
Because Generation Y has a spirit for volunteerism, it makes sense that they are
interested in public service careers. In fact, several government employers were identified as
being in the ideal 15 potential employers, as identified by survey respondents. The top three
employers were from the private sector, Google, Walt Disney and Apple Computer respectively;
the highest rated government employer was the Department of State, ranked 5th
. The other 4
government employers in the top 15 were Peace Corps (8th), NASA (9th), Central Intelligence
Agency (12th) and Federal Bureau of Investigation (14th). Volunteering provides an opportunity
to serve one’s community, country or world. Similarly, public service careers offer a meaningful
opportunity to give back and make an impact on the world.
Government fared well in the rankings because government provides several of the
qualities that undergraduates and Generation Y workers look for in an employer. The number
one quality was work/life balance. Other desired qualities were service to the public good and
having job stability. The study also expressed reasons that students avoid government/public
sector positions, such as the perception of a lower salary and the desire for an employer with
prestige—government can often have the reputation of ―red tape‖ or ―bureaucracy‖ (Partnership
for Public Service & Universum USA, 2009).

Page | 15
There has also been coverage of Generation Y and the workforce in the press. The
subject matter in this coverage, however, has dwelled on how to manage workforce relations
between the various generations instead of how to structure organizations to serve the needs of
Generation Y. Additionally, press coverage identifies Gen Y’s injection into the workforce as an
issue to address. In other words, the trade and popular press talks more about how Generation Y
is arriving or about how to get Generation Y to play well in the sandbox rather than how to build
a sandbox with Generation Y in mind.
Workplace and Interpersonal Attributes
First, press coverage identifies the arrival of Generation Y as an issue for HR
professionals and program managers to hold in their consciousness. These pieces try to
distinguish Generation Y from earlier, older generations. Several—sometimes conflicting
ideas—emerge in these papers: difference in upbringing, social consciousness,
confidence/independence, and interpersonal preferences.
Gen Y functions best in environments where they can be active participants in their work,
―One-on-one training should be Socratic and task-oriented—don’t just show them something but
have them do it themselves‖. Also, because of the ultra-competitive and unstable times that Gen
Y came of age, she suggests that good benefits are a great recruiting tool for Generation Y, even
as they enjoy flexible schedules and independence in their work (Twenge, 2006, p. 218).
The issues raised about upbringing highlight several areas. One idea is that Generation Y
prefers interactivity to authoritarian communication styles because they were brought up with
television, video games and the internet. Another is that Gen Y is accustomed to working in
―diverse‖ environments because pluralistic multiculturalism was a theme during their formative
years. Another is that Generation Y is defined partly by its responsiveness to technology and
Page | 16
being barraged with marketing messages and other sources of information en masse (Buckley,
Beu, Milorad, & Sigerstad, 2001).
Several sources speak about social consciousness. Gen Y wants to see impact on the
greater good in what they do and work for companies with a conscience (Yeaton, 2008). Also,
several sources describe Gen Y as liking support from supervisors and opportunities to develop
and learn. In their pursuit of changing the world, Gen Y members realize that constantly
developing their skill sets and marketing themselves is valuable and necessary. They value
feedback during this process (Hastings, 2008).
Ironically, sources also describe Gen Y as confident and independent. Gen Y does not
lack self-esteem and possess an entrepreneurial spirit. By one author, they are dubbed the ―my
generation‖ because they want to do it ―my way‖ (Oliver, 2000). However, Generation Y also is
accustomed to working in teams and possesses strong interpersonal skills (Solheim, 2007).
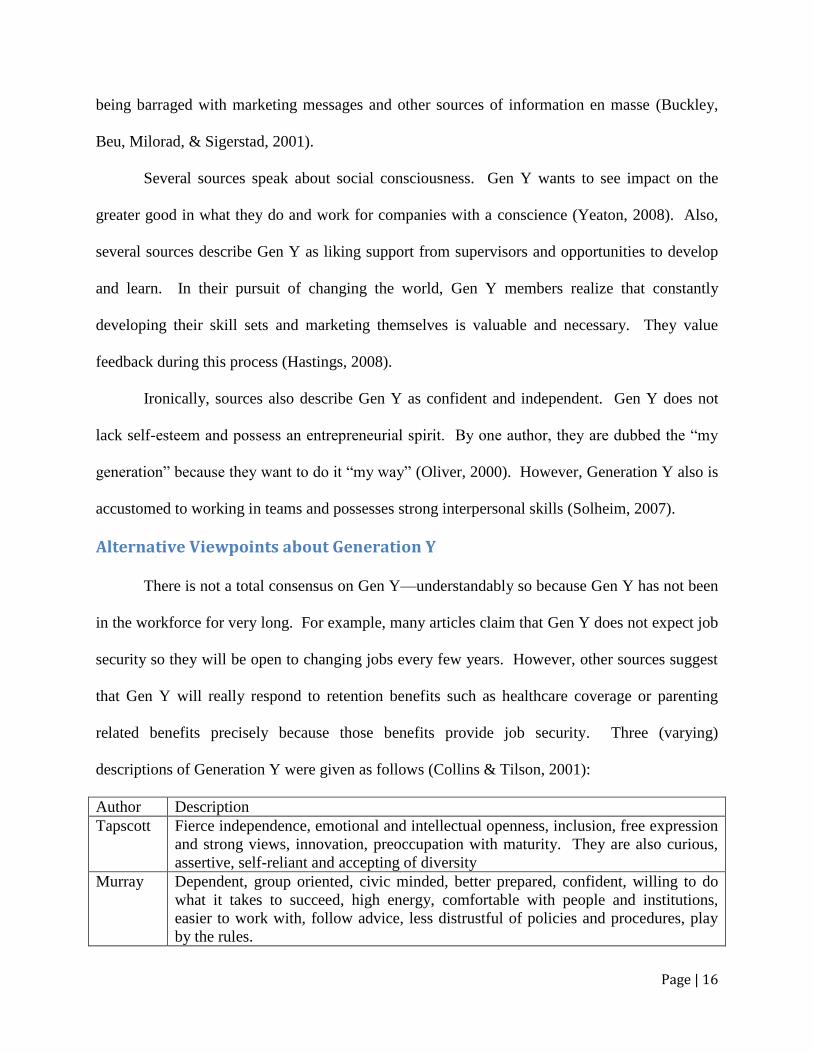
Alternative Viewpoints about Generation Y
There is not a total consensus on Gen Y—understandably so because Gen Y has not been
in the workforce for very long. For example, many articles claim that Gen Y does not expect job
security so they will be open to changing jobs every few years. However, other sources suggest
that Gen Y will really respond to retention benefits such as healthcare coverage or parenting
related benefits precisely because those benefits provide job security. Three (varying)
descriptions of Generation Y were given as follows (Collins & Tilson, 2001):
Author Description
Tapscott Fierce independence, emotional and intellectual openness, inclusion, free expression
and strong views, innovation, preoccupation with maturity. They are also curious,
assertive, self-reliant and accepting of diversity
Murray Dependent, group oriented, civic minded, better prepared, confident, willing to do
what it takes to succeed, high energy, comfortable with people and institutions,
easier to work with, follow advice, less distrustful of policies and procedures, play
by the rules.

Page | 17
O’Reilly Ambitious, warm, confident, upbeat, lacking in moral superiority, optimistic,
generally spoiled, self-centered, generous, practical, brilliant, civic minded.
There is also strong criticism of Generation Y, such as being ―de-skilled in areas such as
motivating oneself, persisting in the face of frustration, delaying gratification and controlling
impulsive behaviors…The reality is that this generation, raised by us baby boomers, fail in the
same way we did, by wanting respect without earning it. We learned (sometimes the hard way)
that we succeed only by hard work, respect for all, and learning and respecting a line of
authority. Hopefully Generation Y will learn as well.‖ (French, 2006). Certainly this criticism
suggests that there is room for improvement in the actions of Generation Y members.
Managing Workforce Relations
The industry and trade press provides many suggestions on how to take Generation Y’s
preferences into account when managing workforce relations. One of the most widely
recommended practices is to create mentoring programs between Gen Y and senior leaders,
formally or informally (Kehrli & Sopp, 2006). Another common recommendation is to use
technology appropriately to communicate with Generation Y workers effectively, especially as
many more tools become available via the web (Alch, 2000).
A more fundamental recommendation is to give Generation Y meaningful work to do
because they want to see impact and contribute to the work that they are doing. Along with
approaching Generation Y with meaningful projects, experts recommend providing Generation
Y with flexibility in the workplace. This includes work-life balance programs, flexible
scheduling and allowing for collaboration in projects (LaFave, 2008).
Certainly, there is not a full consensus on what it means to be Generation Y or the best
ways to manage workforce culture to accommodate Generation Y. However, there are a few

Page | 18
emergent themes. Generation Y was raised in a different world and some of their defining
features are their self-esteem, confidence and their desire to be included and valued. There are
several approaches for how to leverage these traits, such as mentoring, utilizing technology and
providing work-life balance.
Overview of Federal Human Capital’s History
Though most of the recent history regarding the federal Civil Service and federal human
capital comes after 2001, when human capital was placed on GAO’s High Risk List, legislation
which modernized the civil service was adopted in the 1970’s. The monumental legislation, the
Civil Service Reform Act of 1978, created the Office of Personnel Management, the Merit
Systems Protections Board and the National Labor Relations Board. The legislation also created
the Senior Executive Service, a cadre of elite executives (usually just under a political appointee
in rank) tapped for their leadership qualifications (US Office of Personnel Management). A
major feature of the Civil Service, the General Schedule pay system, was created in 1949 and is
the system that most of government still uses today to pay its employees (Office of Personnel
Management).
More recently in federal human capital history was the President’s Management Agenda
(PMA), the cornerstone of the President George W. Bush’s management reforms. Announced in
2001 and issued in 2002, the PMA was created with the intent to improve the management of
federal agencies and highlight the need for reform in several key areas of government
management, including human capital (Bush, 2002).
To measure the results of the agencies and departments, a scorecard was created. Each
agency reported to the Office of Management and Budget (OMB) and Office of Personnel
Management (OPM) and their progress and was ―graded‖ accordingly. The agency received a

Page | 19
rating on a ―stoplight‖ scale (red-yellow-green) after reporting on a quarterly basis. Results of
the progress of agencies and programs were described in reports and on a government website
(Government Accountability Office, 2006).
These management initiatives were created to increase the performance of government to
service its citizens and to drive government to create measurable results. In other words, the
initiatives were meant to help guide agencies towards greater fulfillment of their missions. One
tool in the human capital area to help agencies improve human capital was the Human Capital
Assessment and Accountability Framework (HCAAF), a framework created by OPM in
collaboration with OMB and GAO meant to focus and guide agencies in their efforts to improve
human capital by giving them a roadmap to follow (Office of Personnel Management).
Since the PMA was created by executive order—not being written into law, it is up to the
next president whether or not to continue the program—it is unclear what will happen to it now
that the Obama Administration has entered the White House. It may be retooled or discontinued.
Legislation
Federal workforce policy has undergone interesting transformations in the past 10-15
years. These legislative changes are the foundation for transformations currently happening in
federal human capital at the agency level. I outline some of the recent pieces of legislation to
give a flavor of what approaches have been taken to try improving federal human capital.
Arguably the most influential piece of recent human capital legislation was the Chief
Human Capital Officers Act of 2002. This bill created ―Chief Human Capital Officers‖, also
known as CHCOs, in 24 executive agencies and departments, which raised human capital to the
C-Suite of government agencies. The legislation also created the so-called ―CHCO Council‖, a

Page | 20
forum for CHCOs to tackle government-wide human capital issues and to share knowledge or
resources of which the OPM director would serve as chairman (CHCO Council).
Also contained within the CHCO Act were additional flexibilities for agencies to manage
human capital For example, authorizations were given to agencies to manage voluntary early
retirement authorities and voluntary separation incentive payments. Another flexibility was the
elimination of the so called ―rule of three‖, which allowed agencies to hire candidates from a
group of candidates split into groups according to their qualifications instead of making a hire
from only the top-three candidates (Oversight of Government Management, the Federal
Workforce and the District of Columbia Subcommittee, Senate Committee on Governmental
Affairs, 2004).
Another recent bill, National Defense Authorization Act for Fiscal Year 2004, gave
authority for creating an alternative personnel system for civilian employees at the Department
of Defense. This system called the National Security Personnel System deviated from the
General Schedule, the government’s standard personnel system for civil service employees,
because it allowed for performance based pay. (Sanders, 2003).
Workplace flexibilities were also an emphasis in recent legislative reforms. In November
of 2003, Congress raised the annual and aggregate limits of repayment for federal student loans,
$4000 and $20000 respectively, in the Federal Employee Student Loan Assistance Act
(Oversight of Government Management, the Federal Workforce and the District of Columbia
Subcommittee, Senate Committee on Governmental Affairs, 2004). Congress also authorized
flexibilities in the Federal Workplace Flexibility Act of 2004. Flexibilities in this bill included
compensatory time for travel, enhanced leave computation for individuals starting federal service
mid-career, and an increased focus on training within agencies (Oversight of Government

Page | 21
Management, the Federal Workforce and the District of Columbia Subcommittee, Senate
Committee on Homeland Security and Government Affairs, 2005).
Little federal human capital legislation, if any, specifically targets Generation Y or
Generation Y issues. Of course, some might consider some pieces of legislation, such as
increases of college loan repayment amounts as more beneficent towards Generation Y members
than other generations.
Agencies, with the approval of OPM, can work within the bounds of legislation to try to
better address their own needs. In other cases, individual agencies go directly to Congress to get
special authorities not provided across government. This was the case with NASA when it
secured additional authorities in the NASA Flexibility Act of 2004 (Oversight of Government
Management, the Federal Workforce and the District of Columbia Subcommittee, Senate
Committee on Homeland Security and Government Affairs, 2005).
Even though the actions of Congress and of individual agencies have been important to
improve strategic human capital in the federal government, according to government officials
more work is needed in several areas. Robert N. Goldenkoff, Director of Strategic Issues for the
GAO, outlined some of these challenges in a report titled Transforming Federal Recruiting and
Hiring Efforts (Government Accountability Office, 2008, p. 7) issued in May 2008:
While these actions are all steps in the right direction, our past work has found that
additional efforts are needed in the areas of strategic human capital planning,
diversity management, and the use of existing flexibilities…In addition, OPM,
working with and through the Chief Human Capital Officers Council, must use its
leadership position to vigorously and convincingly encourage continuous
improvement in agencies and provide appropriate assistance to support agencies’
recruitment and hiring efforts.
In the report, Goldenkoff also highlighted six specific areas of human capital management to be
improved: passive recruitment strategies, poor and insufficient workforce planning, unclear job
vacancy announcements, time-consuming and paperwork-intensive manual processes, imprecise

Page | 22
candidate assessment tools and ineffective use of existing hiring flexibilities (Government
Accountability Office, 2008, p. 4).
Building the cases
In federal human capital there are dynamics at the team level, bureau level, agency level
and the government-wide level. Even though there are dynamics at the various levels, the proper
unit of analysis is the agency level. Teams and bureaus are tied together by the agency because
they are plugged in to the mission of the agency and are confined in their practices by agency
human capital plans and procedures. Even though legislation is often passed government-wide,
the ways these policies are implemented vary based on the circumstances of each individual
agency.
That there are variations between the present statuses of agencies supports this claim. If
the proper unit of analysis was the government-wide level, there would be less variation between
agencies. Also, other stakeholders view the agency as the correct unit of analysis since human
capital data and assessments—such as the PMA Scorecard or the FHCS—are analyzed agency
by agency.
Generation Y is an important vehicle for human capital transformations because of their
skills and their numbers in the workforce. If government is trying to reinvent itself, recruiting
and retaining Gen Y is a strategic move because they do not have to worry about shedding
staff—retirements can take care of that—and Generation Y is the largest workforce to arrive
since the Baby Boom.
Even if government was undergoing a less critical transformation, the recruitment of
Generation Y would still be a strategic opportunity. Since the competition for attracting top
talent is intense, agencies must be poised to compete. In addition to the depletion of talent

Page | 23
through the retirement of the Baby Boomers making Gen Y a vehicle for human capital
transformation, simply competing for the best talent makes the recruitment and retention of
Generation Y a priority.
Now I will provide a more in-depth look at NASA and the Department of State. By
doing this, I wish to provide the necessary context for understanding human capital
transformations to better recruit and retain Generation Y, before examining what effects those
transformations might be having on the workforces of those agencies.
Before introducing the cases, however, I will summarize an interview with Patsy Stevens,
an OPM employee who worked closely on the Career Patterns project—a framework for helping
agencies understand the needs of their people depending on where they are in their career track.
Patsy Stevens – Office of Personnel Management
Ms. Stevens described branding itself as an employer of choice as a challenge and
priority for government, an effort the Career Patterns project aids. However, Career Patterns is
not an initiative specifically targeted towards Generation Y. Government needs to think
differently about all generations from Generation X to retirees. Government needs to think
differently about attracting talent, regardless of their age.
Career Patterns was not meant to be prescriptive. Instead it was envisioned and is
currently used as a tool that agencies could use so they could better understand their workforces
and potential recruits. By using this tool, they could hopefully better tailor all their activities—
such as websites, job applications, job descriptions, etc.—to the audience they are trying to
target.
A compelling reason not to be prescriptive is because of the individualized needs of each
agency. ―Government is like a big holding company, every agency has a different need,‖ she

Page | 24
said. Career Patterns outlines several scenarios and helps answer the questions of how to attract
a recruit’s interest and get employees to grow inside government. Additionally, there is a need
for private-sector insight and a need for knowledge management, she said.
Other concerns that deserve attention are turnover/retention and performance
management. Turnover used to be an issue of retirements so a lot of focus wasn’t put on it in the
past. ―We spend so much time and money getting people on board, we can’t lose sight on how
well we keep them,‖ she said. Also, performance management is something that has to be done
correctly. Hiring needs to focus more on strategic intent, she said.
Overall, Ms. Stevens presented government as aware of the various generations in the
workforce. The interview also confirmed the idea that different agencies have different needs—
one size does not fit all. Finally, Ms. Stevens suggested that issues of turnover and retention are
crucial and that it is difficult to understand these issues because in the past turnover and retention
issues were linked strongly to retirements, instead of voluntarily separating.
I will now present an in-depth look at two agencies: NASA and the Department of State.
These cases serve to help distinguish the agencies from each other, but both case studies are
centered on human capital practices to better recruit and retain Generation Y and using Gen Y as
a vehicle for human capital transformation.
Case #1 – National Aeronautics and Space Administration
NASA’s Unique Circumstances
The National Aeronautics and Space Administration has several unique circumstances
which frame its recruitment and retention of talent. The most influential factor on recruitment
and retention is probably the science and engineering (S&E) pipeline of talent. In 2001,
approximately 24% of NASA’s S&E talent was predicted be retirement eligible by the year

Page | 25
2006. Also, as of 2001 92% of NASA’s current S&E talent was in GS-13 positions or higher,
positions that are senior-level or supervisory. Overall, demand for S&E grads was increasing as
enrollment of S&E grads is declining (National Aeronautics and Space Administration, 2001).
Also, NASA is currently undergoing at least two major shifts in agency strategy. First,
NASA is shifting from a destination-based vision for space exploration to a science-based vision
for space exploration (Government Accountability Office, 2003, p. 2). In other words, they are
framing missions not about where they go but about what scientific discoveries are important,
crudely put. Also, NASA aims to retire the STS—also known as the space shuttle—from active
service in 2010 and recommence human spaceflight by 2015 (Government Accountability
Office, 2007). Both of these challenges depend on well managed human capital initiatives and
pose significant management challenges.
Finally, NASA’s organizational structure distinguishes it from the other agencies studied.
NASA has a central headquarters but it also has other centers of activity which function
interdependently with headquarters or the other centers4. For example, some centers use hiring
flexibilities differently or have different training programs depending on their needs and
location.
Recruitment/Onboarding
NASA has taken advantage of some of the authorities and flexibilities that it has been
granted. One of the areas which is most utilized by NASA is term appointments. Term
appointments allow an agency to make a temporary appointment for a period of 1-4 years where
a need is not permanent—a useful tool if a project is known to be ending or if future needs or
budget are uncertain. NASA has an expanded term appointment authority under the NASA
Flexibility Act of 2004 with the ability to make appointments for up to 6 years and the ability to
4 See Figure 1 for a diagram of NASA’s centers

Page | 26
non-competitively convert term appointees to career or career-conditional appointments under
certain conditions. NASA has increased its use of term appointments since the flexibility was
authorized (Government Accountability Office, 2008).
The GAO report also cited a use of recruitment and retention bonuses, which are
especially helpful in attracting or keeping employees who can be hired away by more
comprehensive compensation packages in the private-sector. NASA uses other targeted
authorities like pay incentives or relocation incentives to help recruit the best workers it can
(Government Accountability Office, 2007, p. 21).
However, some criticism has arisen that NASA has not made adequate use of its
additional flexibilities to give more recruitment or retention bonuses or that those bonuses have
been given disproportionally to members of the Senior Executive Service (Subcommittee on
Space and Aeronautics, Committee on Science, House of Representatives, 2006, p. 5). Term
appointments also have been criticized that they undermine the technical capacity of the agency
and prevent term appointees from expressing their opinions fully for fear of retribution
(Subcommittee on Space and Aeronautics, Committee on Science, House of Representatives,
2006, p. 26).
A program of increasing use is the Cooperative Education Program, which many entry-
level recruits have been hired through. Modeled like a Co-op program this program gives NASA
a chance to develop and train new employees and ensure that they are technically and
professionally proficient before making a permanent hire.
In 2001, NASA laid out a plan to improve recruiting at the Agency. Through this
process, it worked with many of its stakeholders to develop a model for recruiting. After
studying the issue, they developed a three-pronged model for doing recruiting in the future,

Page | 27
consisting of the following steps: Focus on the Candidate, Leverage Partnership and Alliances
and Tailor Recruitment Opportunities.
To focus on the candidate, as opposed to the process, the first step was to better connect
with candidates. This effort included recommendations to build a student website, incorporate
diverse media sources such as video and develop a buddy/friend program for high-potential
recruits, among others ideas. The report also directed NASA to make job offers in a timely
fashion and unify NASA’s presence while recruiting because recruiters from multiple centers at
the same recruiting events confused candidates.
Leveraging partnerships and alliances included University relationships and others. First,
since NASA has research grants at many top universities, the report directed NASA to leverage
their relationships with Principal Investigators to recommend high-potential students for
career/internship opportunities with the agency. NASA also wanted to form relationships with
trade associations and empower their own employees to be ambassadors for recruiting talent to
the agency.
NASA also wanted to tailor their programs to a specific audience. These
recommendations noted that recent graduates want growth opportunities, engineers want to see
their prototypes in action and scientists want to work with the leading people in their fields in
state-of-the-art facilities. The National Recruitment Initiative report also called for NASA to
capitalize on its brand recognition, develop recruitment metrics and engage in strategic
workforce planning (National Aeronautics and Space Administration, 2001).
Retention/Culture/Leadership
One of the most lauded components of NASA’s transformation effort in GAO reports is
their alignment of strategic human capital management with NASA’s broader mission and
objectives. They have done this by using input from its mission directorates, centers and union

Page | 28
leaders. ―These linkages allow NASA to assess and understand the extent to which its workforce
contributes to achieving the overarching mission,‖ (Government Accountability Office, 2007, p.
13). This alignment is attributed to NASA leadership’s efforts and awareness of strategic human
capital management.
Also critical to this effort is NASA’s commitment to adhere to a ―healthy centers
principle‖—all of NASA’s centers should be functioning well. To do this, the individual centers
have had to align their missions and human capital approaches to NASA’s broader mission and
its agency-wide objectives, which they have done successfully.
HR/Recruitment Communication
NASA’s human resources website contains a workforce plan that identifies NASA’s
priorities in strategic human capital management. The plan has three goals: understand mission
requirements, align the workforce with the mission and enable effective and efficient HR
operations. The three sub-goals of the plan are rather introspective and include many
components about better understanding the workforce and being able to measure its
competencies and capabilities better. There is also significant attention paid to training under the
second sub-goal of mission alignment (National Aeronautics and Space Administration, 2008).
Additionally, NASA’s human capital website—named ―NASAPeople‖—has many
resources for employees including links to HR policies, work and family programs and
information about employee awards. For HR practitioners in the agency there are desk guides
and a website specifically for providing recruiters with resources. There is also a page
specifically for student opportunities. A list of HR directors’ contact information at each NASA
center is also provided.
It is true that many organizations have websites for their HR departments. It is also true
that many companies have similar pages or documents on an intranet, rather than the internet.

Page | 29
That NASA has all these materials from a student site to HR desk guides publically available,
could be precisely the point—publically available implies that anyone from a potential recruit to
a congressional staffer to an interested citizen has the opportunity to understand more of NASA’s
inner workings.
The general NASA website also has features that may contribute to some of its stated
strategic human capital objectives, namely building on the recognition of the NASA brand.
First, the website tries to triage visitors directly towards the information that they are most
interested in—as students, NASA employees, policymakers etc. The website also provides many
opportunities to connect with NASA through the services on the multimedia page—including
Gen Y friendly services such as twitter, YouTube and flickr—or RSS feeds, another popular
medium for tech-conscious Gen Y’s.
The website seems to build on NASA’s brand because it provides many opportunities for
citizens to better understand NASA’s work, beyond its historic lunar programs. It incorporates
sections that allow people to see photos or learn about how NASA’s research is useful in
everyday life. A quick glance at the website reveals that NASA’s mission goes beyond human
spaceflight (National Aeronautics and Space Administration, 2009)5.
Training and Development
To help develop their workforce where it lacks skills and to help retain workers, NASA
also has development programs at its centers. These programs range from professional
development to mentoring. Some centers also have rotational programs to give students more
development and learning opportunities. Finally, NASA’s name recognition and reputation as a
excellent place to work in government helps them recruit and retain employees, generally
speaking (Government Accountability Office, 2007).
5 See Figure 2, Figure 3, Figure 4 and Figure 6 for screenshots of NASA’s website

Page | 30
Also, NASA has education programs which help develop the pipeline for talent and give
them an opportunity to tap short-term, part-time human capital at the same time. These
programs vary between centers and range from hands-on projects for undergraduates to
fellowship programs for graduate students (Government Accountability Office, 2007, p. 20).
I interviewed two people affiliated with NASA. The first interview summarized is Ms.
Stephanie Spence-Diamond, who is an HR professional at NASA headquarters with decades of
experience in several offices of different government agencies. The second interview
summarized is Ashwin Lalendran, a University of Michigan Aerospace Engineering
undergraduate who interned at NASA’s Ames Research Center in the summer of 2008.
Stephanie Spence-Diamond
During her time in government which has spanned over three decades, Stephanie Spence-
Diamond—A Human Capital Strategist in the Human Resource Management Division at NASA
Headquarters—has seen the role of the personnel office change. First it was strictly personnel,
then human resources, now it is human capital. Now it is much more of a management
responsibility, which is not something that all folks have embraced, she said.
People are aware of Generation Y issues, but it’s unclear about what to do. Generation Y
concerns are considered to be one small part of a larger idea of ―diversity‖, so as far as special
initiatives go, Gen Y is only considered to be included as one of many interest groups. It’s
difficult to give one group special attention, too, because it can cause backlash, pitting one group
against another. It could lead to an increase in angst in the workforce. Questions about how to
get different generations working together is also a concern. Different approaches to these issues
are being taken at different centers.
She said, issue has come up with some of the ―next-gens‖, and where they see themselves
in the work force. The Gen Y workers were called to do a presentation in front of agency

Page | 31
leaders, but follow-up still needs to happen. Follow-through is something that Stephanie had
noticed; it’s something the next-gens need to work on. Additionally, the Gen Yers get together
once a month at a reserved lunch table to talk about issues.
The workforce used to be really command and control. Now, it’s much more team-
oriented and collegial. The way of working has changed. And with that, supervisors aren’t born,
they are made. Tech supervising has been particularly difficult to develop.
Really, the successes of these transformations are determined by how they are
implemented into the workforce, she said. The use of automation in recruitment is an example of
this. If generations are at ease with it, it’s fine. The length of time can be frustrating. Getting
someone into a job is huge, how you onboard them is also key. In some ways systems have
taken over, but customer service hasn’t been upped with it.
At NASA patience can wear thin between older and Gen Y workers. The new trends are
to look at work as a series of projects—speaking from a young person’s perspective—rather than
a career. Also, careers don’t have as clear of a path; they are much more fluid. So, the trick isn’t
to engage just young people. Rather, it’s important to reengage everyone, even more senior
folks, because their excitement might also be waning.
On the topic of recruitment tools, there are recruitment bonuses, but also increases in step
on the General Schedule as a possible recruitment tool. IT/HR has been much more competitive
in offerings so that has helped get people as well. Also, re-calculating accrued leave has been
helpful in getting mid-level people. In this business of HR it’s hard to stay ahead of the game.
It’s made a difference for NASA so now they must stay ahead. They could use a few extra
things, but government-wide people are catching up.

Page | 32
It’s hard to determine if NASA and other agencies have been successful because the
metrics could be improved, and this is acknowledged. But, there could be pockets of success
within agencies. Leadership involvement has been huge in this whole effort because their
attention can’t always be garnered and is necessary for stewarding change.
On the front lines, NASA is looking for practical advice on how to give Gen Y feedback
and keep them engaged day-to-day. A practical guide would be useful, like a ―here’s 10 things
to do as a supervisor that would be reasonable with Gen Y.‖ There’s frustration on both sides;
feedback is hard to give anyway, and people who have tried have failed.
From her long career in federal human capital, Ms. Spence-Diamond was able to provide
a broad perspective on Gen Y issues. She described that Gen Y is considered to be one of the
many diverse groups that should be considered in human capital issues, instead of one that is
prioritized over the others. However, even though Gen Y is not claimed to be treated as a special
group, there is consciousness about generational issues. Also, she said that leadership mattered
in transformations and that it is hard to determine whether agencies are successful because
metrics could stand to be improved.
Ashwin Lalendran
Ashwin is an aerospace engineering undergraduate at the University of Michigan in the
class of 2009. He interned at NASA in the summer of 2008 at NASA’s Ames Research Center
in California. He currently is working on a research project on-campus with the Air Force
Research Laboratory (AFRL).
With recruiting, it seems to him that with NASA and AFRL their angle is to develop
relationships with faculty members who are principal investigators of a NASA research grant.
Then, those faculty members make recommendations for hires. That’s how Ashwin was hired.
The passion of the recruit becomes apparent, and professors make recommendations based on

Page | 33
who they think can have project success. And those faculty members want to help because they
receive a grant; it’s a give and take process.
Similarly, the AFRL uses competitions to solve engineering problems. It costs them
about $20,000 which is a drop in the bucket for their budget, in his opinion. There’s the
potential to recruit people and it is an educational program which develops talent in the pipeline.
As a student, he likes this sort of program it because it puts him in contact with senior people and
he finds that interaction meaningful.
Ashwin has also had problems with the recruitment process, however. For example, he
had to wait for a security clearance even when he was already on-site at Ames, for two weeks.
Once HR gets to you, however, you’re their only customer, he said. The position he had was not
defined very clearly, but thankfully they did ―create a position‖ for him. In his opinion, NASA
gets talent and fills in the holes that they have.
―Government is a very small community,‖ he said. At least in the defense sector, people
seem to know everyone. There’s a close knittedness and they have ―a genuine interest in
investing in people‖ and the programs to back it up. One example of a program was NASA
Academy, which is a leadership development program. Ashwin was sent to two conferences
during his internship. These are more examples that NASA cares about the people who share
their passion.
Housing was provided on site during his internship, and NASA picked him and the other
interns up at the airport. There were different programs at Ames with about 200 interns in total,
and the facility is very research oriented. During the year, they use the dormitory style housing
for visitors. There were interns in different programs during the internship such as NASA
Academy, Women in Engineering and ROTC.

Page | 34
The job itself was open-ended– with flexible hours. There wasn’t any ―you have to stick
to this schedule‖. The job also provided access to cool technologies. Moreover, there were
opportunities to succeed and Ashwin was treated just like any other person there. The peers and
supervisors were flexible and empowering. Not to mention that the people there were very
smart—intellectual accomplishment is held at a premium there, so it was a great opportunity to
learn, especially because the mentality was, if you want to get better, we’ll help you get better.
All of these were attributes of the job that Ashwin valued tremendously.
Ashwin noted that at NASA they struggle because they want to make the mission more
relevant to the public and to NASA employees, because NASA’s mission does not inspire young
people like the space race did in the 1960’s. But, their community is a university, research-park
type community with cool facilities—that environment seemed to inspire Ashwin.
When asked if he’d consider working there again, Ashwin gave a resounding yes in
response. This was because even at the entry-level he wasn’t treated like a number and NASA
was willing to invest in you, even spend money on you as an intern. There was also access to
technology and meaningful engineering projects; you start your career there with sound
engineering fundamentals.
There were some deterrents to wanting to work at NASA again, however. First, the
security clearance process was slow. Also, the process of application was one that required the
applicant to take serious initiative. The culture was also a bit like government, execution wasn’t
necessarily a valued concept and there was too much ―bullshit paperwork‖.
Overall, Ashwin really valued the meaningfulness of the work he received and that
NASA invested in him, even as an intern. However, he was turned off by the lack of
communication he received before he started his internship, that his security clearance was

Page | 35
delayed and that the culture of government could be frustrating. Now, I will outline a case about
the Department of State.
Case #2 – Department of State
The Department’s Unique Challenges
At the State Department, there are several factors to consider which make the agency’s
circumstances unique. To begin with, the State Department workforce is formally divided into
two workforces, the Civil Service and the Foreign Service. This reality complicates the
understanding of human capital at the State Department for observers and probably for officials
at the Department as well. Recruiting must also be a challenge, not only because there are two
workforces but because understanding the duties and lifestyle of a Foreign Service officer is not
easy, and then it must be contrasted to the work of a Civil Service officer. Managers at the State
Department must try to manage both types of workforces, many times within the same office.
Further complexity occurs because of the circumstances external to HR policies that
affect the State Department’s work. First, the State Department—one of the three initial cabinet
departments—has many political nuances and is a high profile agency where foreign policy is the
aspect of the Department’s work which garners attention—and is very scrutinized—in mass
media the media and in public debate, rather than the management of the agency.
Also problematic are the demands that policy makers make on the human resources of the
State Department. The need for diplomatic readiness has increased in the past decade because of
the wars in Iraq and Afghanistan. There is flux at the Department because of changing global
diplomatic priorities. These facts are not caused or controlled by human capital managers at the
Department and cannot be changed.

Page | 36
Some of the biggest challenges facing the State Department exist because of the State
Department’s global presence. In particular, the Department has struggled in meeting staffing
requirements for Foreign Service Officers (FSOs) at posts across the world. An ongoing
problem since the early 2000’s, the State Department has tried to act to address these staffing
problems. Recruiting and onboarding FSOs is particularly difficult because the FSO hiring
process is more comprehensive and rigorous than the process for Civil Service hiring.
In addition to lacking the adequate number of FSOs across the board, there is also a
staffing gap among mid-career FSOs. The pipeline for talent in the Foreign Service corps is a
straight pipeline with no mid-career hires—someone starts at the entry level and works their way
up. In the 1990’s there was a reduction in Foreign Service hiring so there is a currently a
shortfall of mid-career FSOs. This staffing gap is causing junior level FSOs to complete the
duties that would generally be assigned to a more experienced Officer. Out of necessity, junior
Officers are doing jobs which are literally out of their pay grade.
Another issue affecting human capital at the Department is former Secretary Rice’s call
to Transformational Diplomacy and the Global Diplomatic Repositioning initiative.
Transformational Diplomacy aims to take diplomacy out from the traditional embassy setting to
help partners around the globe create sustainable democratic systems or to help foreign citizens
improve their own lives. The Global Diplomatic Repositioning is an effort to redeploy staff from
places with declining diplomatic importance, like Western Europe, to the most mission-critical
parts of the world (Department Of State, 2007). Both these initiatives take effort and resources
and present human capital challenges, especially amidst a Foreign Service corps that is tightly
staffed and lacks bench strength.

Page | 37
Recruitment/Onboarding
One of the recent efforts to combat this problem was the Diplomatic Readiness Initiative
(DRI), launched by then Secretary Powell in 2002. The DRI intended to make up for staffing
gaps, provide training opportunities, increase the department’s ability to respond to emerging
crises and priorities and increase the diversity of the Foreign Service corps. Since 2002, the
department has hired 1000 new staff members above attrition and has worked to increase the
number of candidates from diverse backgrounds. However, the Department’s original estimate
of staffing needs quickly became outdated because of increased staffing commitments in Iraq
and Afghanistan. According to the Department and as reported in GAO reports, State needs over
1,000 new hires to meet its foreign language training needs and to respond to other emerging
priorities.
Since the DRI began the number of hardship posts—posts that are more uncomfortable or
dangerous—haves increased in the Foreign Service. The Department has had difficulty filling
these posts, especially because most of them filled on a voluntary basis. They have begun to try
tying promotions into the Senior Foreign Service—the Foreign Service’s closest analog to the
Senior Executive Service—more closely to serving at a hardship post or giving assignments
involuntarily (Office of the Inspector General, 2007).
Amidst the staffing issues and realignments, the State Department undertook a major
initiative to change the application procedure for becoming a FSO. The new system takes a
holistic ―total candidate‖ approach and substitutes the initial paper-based exam for a computer-
based test. The initiative was meant to modernize the process for vetting candidates while also
shortening the time-to-hire from 14 months to 7 months (Office of the Inspector General, 2007).
In a July 2008 congressional testimony, the Director General of the Foreign Service Amb. Harry
K. Thomas said that over 8000 applicants had taken the test since it was introduced in September

Page | 38
2007 (Oversight of Government Management, the Federal Workforce, and the District of
Columbia Subcommittee of the Senate and Homeland Security and Governmental Affairs
Committee, 2007).
One program, the Career Entry Program has grown rapidly within the Department. The
program is a two-year development program consisting of training, mentorship and rotational
assignments (Office of the Inspector General, 2007). The program is a manifestation of the
Federal Career Intern Program which allows for a two-year internship with the potential for a
permanent placement at the completion of the program (Office of Personnel Management).
Another program that the Department of State executes well is the Presidential
Management Fellows program. The program is a two-year fellowship program that candidates
apply for during their final year of graduate school. Finalists of the fellowship program apply to
specific agencies for a final placement. The Department of State has more interest from potential
Fellows than almost any other agency. In addition to the Presidential Management Fellowship,
the Department also boasts other fellowships to accelerate intake of more candidates such as the
Pickering and Rangel Fellows programs (Office of the Inspector General, 2007).
Retention/Culture/Leadership
The Department has had difficulty with HR staffing, morale and acquiring resources. In
the Inspector General’s report, it was noted that more trained professionals were needed to
provide HR services adequately and effectively (Office of the Inspector General, 2007). Also,
morale was noted as low in the Department. In a congressional hearing, Amb. Ronald Neumann
President of the American Academy of Diplomacy suggested that ―we're talking about an
institutional culture that we have to have a—probably a series of secretaries, a series of leaders
who demonstrate by their own action that they are fighting for their people, they are fighting for

Page | 39
their budget, and they are fighting for their welfare‖ was something that could boost morale at
the Department.
However, the stronger theme—as opposed to low morale—was a lack of resources. The
Department, to reach its human capital goals would simply need more resources and has
requested the necessary appropriations from Congress (Oversight of Government Management,
the Federal Workforce, and the District of Columbia Subcommittee of the Senate and Homeland
Security and Governmental Affairs Committee, 2007).
HR/Recruitment Communication
A major initiative of the Bureau of Human Resources comes specifically from the
Student Programs branch of the bureau. The branch developed a new careers website to try to
aggressively recruit more people to join the Department. The site provides information about all
opportunities at the Department of State as well as tools to help applicants decipher which
opportunities fit them best. The website also provides a link to a recruiting calendar for events
near them6.
Central HR also has a substantial recruiting presence on behalf of the Department. A
team of recruiters attends job fairs and professional events around the country to recruit for the
Department. The recruitment team also involves over 15 Foreign Service officers called
Diplomats-in-Residence. These Diplomats have tours of duty at college campuses around the
country and serve as liaisons for the Department directly among student populations. The
Department also has a large internship program; in congressional testimony Amb. Thomas stated
that they would begin tracking interns as potential civil service or Foreign Service candidates
(Oversight of Government Management, the Federal Workforce, and the District of Columbia
6 See Figure 5 for a screenshot of the careers.state.gov homepage

Page | 40
Subcommittee of the Senate and Homeland Security and Governmental Affairs Committee,
2007).
Training and Development
On the civil service side, there have also been challenges and transformations. One such
effort has been the assignment of Civil Service personnel for temporary assignments overseas, to
help fill hardship posts in places like Iraq or Afghanistan. Another new program for civil service
employees is a mid-level rotational program to enhance the development of civil service
employees. The Department also has a division called the Foreign Service Institute to train its
employees.
I interviewed four people affiliated with the Department of State. Tamara Brooks is the
first interview; she is the Chief of the Student Programs branch in the Bureau of Human
Resources at the Department. Student employment programs, including the Department’s
internship program, fall under her supervision. I also spoke with Adrienne O’Neal, a Foreign
Service Officer on a tour of duty as a Diplomat-in-Residence at the University of Michigan.
Finally, I spoke with Samuel Kleiner and Jessica Clayton, two undergraduates who interned with
the Department in the summer of 2007.
Tamara Brooks
Prior to the departure of Secretary Rice, there were two new fellowship programs being
developed at the Department of State. One of those programs focused around an attempt to
develop a relationship with schools that the Department didn’t already have a relationship with.
This fellowship program seeks students in good academic standing looking to enter graduate
schools. The creation of this program was initiated by Secretary Rice and overseen by the
Director General. Another program, dubbed the Distinguished Intern Program, has no set

Page | 41
number of schools, but candidates must be recommended by an ambassador or Diplomat-in-
Residence. There are opportunities domestically and overseas.
One of the challenges that Ms. Brooks faces is with recruiting Foreign Service
candidates. First, it is hard to narrow down the pool to those who are serious candidates.
Second, once the pool is narrowed it is a challenge to get those candidates to A100—the first
training course for new Foreign Service Officers. It’s a challenge to keep them interested and
engaged with the Department because of the time between extending an offer and onboarding the
candidate.
Streamlining the application process for Foreign Service applicants has also been a
challenge, especially driving down the time between application and a decision. The
redevelopment of the Foreign Service Officer Test has been helpful in this area. This challenge
is especially important because the Department just received word from Congress that they will
be able to double the number of Foreign Service Officers.
Government-wide, Brooks thinks that agencies could better express the nature of
Government work and that such explanation is needed. State has been successful, she said,
because the work is engaging and thusly students are able to be retained. Programs like the
fellowship program need to be created and/or promoted because Gen Y has the skills to do the
work. But, their imagination has to be captured first.
The Department has done well recruiting Gen Y candidates, using its internship program.
There were a record-breaking 7300 applicants for the summer 2009 internship programs. What
Brooks said she needed is more idea how the various initiatives and programs she oversees are
working. Also, more idea on what students’ experiences were like would also be helpful.

Page | 42
Getting better answers to the question: ―Is what we’re doing, working?‖ is important to her
efforts.
Ms. Brooks outlined several initiatives that the Department is doing to better recruit Gen
Y employees, including the creation of more fellowship programs and the updated Foreign
Service Officer Test and application procedure. She needs additional feedback, however, to
better ascertain if the efforts of her team are effective.
Adrienne O’Neal
As a Diplomat-in-Residence Ms. O’Neal takes appointments, makes presentations and
tries to communicate with and recruit for the Department in the surrounding community she is in.
Unlike some other DIRs across the country, she is considered a member of the faculty, which is
in her opinion quite advantageous.
―A strong sense of responsibility to public service‖ is what draws people to the State
Department, in her opinion. Young people see a role for themselves in public service. It’s also
become easier for the Department to recruit because more students these days have traveled
abroad and have a broader consciousness of other cultures. Parents aren’t often in favor of a
Foreign Service career, but now students are extremely globalized which helps the Department’s
recruitment efforts.
The aspect of the job that students most often want to know about is family life. They
want to know about marriage and what happens when you’re a Foreign Service officer. ―Money
has to be a secondary concern for a public service candidate…and it is‖. It’s not easy to go into
the profession, and most people are looking for a fit. Another aspect of what students are
looking for is prestige. Young people misguidedly believe that they will make policy in their
first assignment. Rather, they will be implementing policy, if they are involved with policy at

Page | 43
all. In her opinion, Gen Y wants participation and recognition and there is a drive to do
something that matters.
In communicating with students ―the website is never enough‖. Students want to ask
someone clarifying questions about something they saw on the website. This is especially true in
the case of the Foreign Service because conveying the complexities of a Foreign Service career
is difficult in the first place. There has also been a push towards using services like facebook or
chat rooms, but there is a tension for Boomers to use technology. In her opinion, the best way to
connect with a Gen Y recruit is to give the person many opportunities to interact and follow-up
with the candidate more personally.
In regards to the Civil Service, Ms. O’Neal doesn’t receive much response about that as a
DIR. Since Civil Service recruiting is done mostly through the web she isn’t as sought after a
resource as she is for the Foreign Service. Also, since she is a Foreign Service Officer, she feels
she can’t speak as well about Civil Service careers. She also commented however, that hiring
from the intern pool for the Civil Service is a popular practice at the Department. This is
because people want to hire someone they know and because security clearances are
unpredictable, it is a safer and simpler choice to hire someone who already has a clearance.
The aspects of recruiting that Ms. O’Neal would like to improve upon center around
relationships. First she said that she wishes she had more help to access student organizations.
More specifically, she thought that better relationships with faculty and faculty support would
lead to better access to students. In general, any advocates would be helpful because they
provide access to students. The general dissemination of information is also a challenge, but
bluntly spreading information about the Foreign Service is also problematic because that makes
the Department more likely to attract people who don’t have qualifications.

Page | 44
To summarize, Ms. O’Neal confirmed the issues that Gen Y value most in work, impact
and work-life balance. Also, she noted that a good website is not enough but that adding a
personal touch is also important when working with Gen Y. She emphasized the need to create
relationships through recruiting.
Samuel Kleiner
Sam applied to work at the Department because he had heard about State from a relative
and wanted to explore his interest in foreign affairs and expand his understanding of the field
through experiential learning. He wanted to understand what it was like inside the building and
what the culture of the institution was like. He wanted to see the institution itself function.
He noted that communication throughout the recruitment process was disorganized. He
wasn’t communicated with for months after his initial offer. What might have made it more
unclear was that there was no point person that he could talk to through HR and security
clearance processes. However, once he was able to speak to someone in his office he said that
she was very helpful.
What also would’ve been helpful was to get a better understanding of the internship so he
could hit the ground running on day one. Speaking to a former intern from the office would be
nice, he said. But even a booklet explaining the internship, the office or the Department would
be helpful even if that only allowed him to be familiar with Department of State lingo from his
first day. The expectations of the internship were unclear, in his opinion, and the onboarding
process could be better. There was a security briefing which jokingly equated to saying ―don’t
sexually harass people and don’t tell secrets to the Russians‖. Other than the security briefing,
he explained that little else was done to acquaint him to his office.
There were elements of the internship that Sam found educational. The work he did was
substantive because the staff in his office was ―barebones‖ and he did have a good relationship

Page | 45
with his supervisor. He also enjoyed the extra-curricular internship activities sponsored by the
Department—like tours of other agencies or a speaker series—because it gave him exposure to
other parts of the Department or of government at-large.
But it wasn’t always clear how the organization as a whole functioned or how his work
played into that. Sam also emphasized the importance of mentorship to him. Especially if you
aren’t getting paid, he said, mentorship is something of value that he would have enjoyed more
of, even if it was something like going out to lunch with a Foreign Service Officer a few times
during his internship. He was also surprised that he received little follow up from the
Department after completing his internship.
Overall, Sam really enjoyed having ―cool‖, meaningful projects to work on that he could
see his contribution to. He also valued the ability to form relationships with other interns at the
Department and understand the Department’s culture. But, the lack of initial communication and
follow up after his internships were turn-offs.
Jessica Clayton
Jessica heard about working at the Department of State from a high school teacher. What
she remembers about the recruitment/application process isn’t pleasant. She remembers a long
and tedious first round application which took a long time to complete. Also, other than getting
an acceptance letter, her only other interaction with the Department prior to beginning her
internship was her security clearance interview. Furthermore, even though she hadn’t received
word that her security clearance was processed, she moved to Washington D.C. in advance of the
commencement of her internship. After arriving in Washington, she called several offices to
eventually figure out that her clearance was approved, but it was frustrating that the office
responsible for security clearance had forgotten to call and notify her in the first place.

Page | 46
She liked the person that she worked directly under, especially because that person really
invested in her as an intern by helping her through her work and encouraging her to explore and
learn. At times her job duties were undesirable because she ended up doing some of the
quintessential intern duties like making coffee. She said she wasn’t able to get a great grasp of
what she would be doing if she were hired full time as a result. Like Sam, she enjoyed the intern
activities and would expand them.
While she was at the Department, she noticed that the people there were committed, and
were committed for the right reasons. Diplomats were not as arrogant or distant than she
expected them to be and she was pleasantly surprised by that. However, she was surprised by
the influence of the institution on how work is assigned and completed. She is very interested in
working for government or in public service—her interest is international development—but
would like to be a little bit more responsible for helping create the plan rather than mostly just
implementing it.
Overall, Jessica had problems with the hiring and onboarding processes but she was
pleasantly surprised by the people working for the Department. She is interested in working for
government but was jarred by the culture of the institution and was not able to completely
understand what her job might be if she started working full-time at the Department because her
internship had the quintessential intern duties.
Analysis of Trend Data7
To get a sense of the effects of human capital transformations on the Generation Y
workforce, I collected a sample of two sets of trend data from OPM: the Central Personnel Data
File (CPDF) and the Federal Human Capital Survey. I collected data on employment levels,
7 A complete set of tables and charts of the data can be found in Appendix B – Data Tables and Charts

Page | 47
accessions and separations from each agency and government at-large. I also made a few
calculations such as voluntary separation, attrition and hires above attrition. I collected these
measures to understand the effects of transformation on the Generation Y workforce. For
example, I wanted to know if hiring of Gen Y was increasing since 2001 and if attrition rates of
Gen Y age groups increased, decreased or were stable.
From the FHCS I identified a few questions that were highly correlated to job-
satisfaction, according to the report containing a summary of the data. I pulled the results from
these questions for NASA the State Department and the Under-30 age group. I present the data
in this way—to understand job-satisfaction—because of the ties between job-satisfaction and
employee retention.
Data from OPM’s Central Personnel Data File
Since 1998, levels of full-time permanent employees have been rising government-wide.
However, the increases have not been uniform8. Totals of junior and senior level workers have
risen whereas the number of mid-level workers has fallen. Government wide, the 25-29 year age
bracket has grown the most since 2001 with an 85.67% increase. Other Gen Y groups have also
seen increases since 2001. Conversely, since 1998 the amount of people aged 60-64 or 65 and
older have each grown by over 90%. Government is now saddled with one large group of aged
workers and a rising number of young professionals. That the amount of employees in younger
and older age brackets is rising confirms the notion of an aging government workforce and
demonstrates that recruiting Generation Y is probably an issue of which federal human capital
officials are aware.
8 See Figure 7

Page | 48
The Department of State shows similar trends, but the Department has grown by a larger
percentage since 1998 and has also seen much larger percentage growth in its Gen Y age groups
than government at large; over 150% increases since 1998 for both the 20-24 and 25-29 year age
groups9. Indeed, the number of employees in every age group has increased at the Department of
State, albeit not as much as the Gen Y age groups. NASA challenges this trend. The agency has
seen a decrease of 6.10% in full-time permanent employees since 1998. Additionally, all age
ranges below the age of 44 have decreased except the 25-29 age group which has increased .85%
since 1998 and 37.96% since 200110
. These figures demonstrate that the State Department and
NASA have had varying success or priority in recruiting and retaining Gen Y workers.
Accessions have been on an upward trend at the State Department and government-
wide11
. Moreover, the 25-29 year age group has had the most total accessions at State and in
Government since 2001. The 20-24 year age group and the 30-34 age groups have also seen
large percentage gains and overall gains. So, accessions are up in government and at the State
Department and the Gen Y age groups have been some of the groups that have been seeing the
largest increases.
NASA is quite the opposite12
. Every age group at NASA has seen decreases in the
amount of total accessions. At NASA the less than 20, 20-24 and 25-29 year age groups have
seen a drop in accessions of 48.78%, 33.61% and 23.08% respectively since 2001. On its face, it
seems like NASA could be suffering a drop in accessions, but these numbers could reflect an
increased reliance on term-appointment or other non-permanent hires. Given NASA’s reliance
9 See Figure 8
10 See Figure 9
11 See Figure 10 and Figure 11
12 See Figure 12

Page | 49
on term appointments, it is difficult to decipher the true impact of NASA’s programs to hire new
workers.
The new hires made at the Department of State, NASA and Government-wide trend
towards excepted service appointments, especially among new Gen Y hires13
. At the
Department of State approximately 20% of new hires were competitive service appointments in
2008, at NASA less than 10% of new full-time permanent hires were competitive service
appointments. This suggests that the Department and NASA are increasing use of hiring
flexibilities and authorities that were once unavailable or underutilized to hire Gen Y workers.
Overall, voluntary separations have increased at the Department of State and
government-wide, but these trends are more irregular than trends of total employment levels or
number of accessions14
. In addition to the general increase in separations, separations have also
increased among most of the Gen Y groups at the Department of State and Government wide.
Of course, retirements are a large portion of voluntary separations for employees in the higher
age brackets. At NASA voluntary separations have decreased for all age brackets from 20-49
years except the 25-29 year age group.
Attrition, calculated by dividing voluntary separations by total employees, has decreased
government-wide in every age group below the 55-59 year age group15
. The increase in attrition
for employees older than 55 is probably because of retirement. Mid-career workers have the
lowest rates of attrition; the rates of attrition for Gen Y groups are slightly higher. Among Gen
Y groups, the 25-29 year age group has the lowest rate of attrition. The Department of State had
attrition levels of Gen Y age groups which stayed near the government average—between 10%
13
See Figure 13, Figure 14 and Figure 15 14
See Figure 19 and Figure 20 15
See Figure 22

Page | 50
and 15%, but NASA’s rates of attrition were higher16
. This could be because NASA has
employees who tend to leave for graduate education or are hired away by other firms.
The data about voluntary separations suggest that many retention programs have not been
created, the effects of retention programs have not started to become visible or that the retention
programs that have been created are ineffective. This is because levels of voluntary separations
have not generally decreased and neither have levels of attrition. Furthermore, the Gen Y groups
have higher rates of attrition than the other age groups. It is difficult to draw strong conclusions
from this data, because they cannot be compared to levels of attrition over a longer period of
time.
Lastly, I calculated hires above attrition—which I also call net accessions—by
subtracting separations from accessions for each age group in each year17
. I also totaled the net
accessions for each age group to have a total hires above attrition line graph. The Department of
State and government at-large both had high rates of net accessions in the early 2000’s followed
by a lull in net accessions in the middle of the decade with resurgence in hires above attrition
during the past two years. For all three groups—the Department, NASA and Government
wide—Gen Y groups tended to be on the higher side of net accessions.
NASA slid in net accessions since 2001 with a monumental fall in net accessions from
2004 to 2005. Hires above attrition have risen since 2005 but have not broken into the positive.
Hires above attrition have been largest for the 20-24 year age group at NASA.
The hires above attrition data suggest a few things about Gen Y in the federal workforce.
First, the numbers of hires above attrition vary for NASA, the Department of State and
government-at large, showing that the agencies have had differing success with the recruitment
16
See Figure 23 and Figure 24 17
See Figure 25, Figure 26 and Figure 27

Page | 51
and retention of Gen Y workers. Also, that hires above attrition for Gen Y are higher relative to
other age groups might indicate that some of the programs to increase recruitment and retention
of Gen Y are having effects. Finally, the Department of State and government at-large have
shown slight increases in hires above attrition for Gen Y workers. However, it is difficult to
make a strong observation from this data because of the irregular behavior of the trends.
Even though the CPDF does give some indication about the effects of human capital
transformations on the workforce, the interpretation of the data is also problematic. There is no
way to tell exactly how agencies operate and how those operations are reflected in the data. For
example, because NASA has relied on term appointments—which would not be reflected in a
dataset of only full-time permanent employees—and Foreign Service employment data is not
reported in the CPDF makes it difficult to say exactly what the data means.
Data from OPM’s Federal Human Capital Survey
To get a better sense of job satisfaction at the Department of State and NASA, I extracted
agency breakouts of data from the 2008 Federal Human Capital Survey. I also took information
that was separated by age for employees aged 30 and younger. Unfortunately, data was not
available filtered by both agency and age.
To select questions to evaluate from the 74 question survey, I looked to the job
satisfaction index described in the 2008 summary report published by the Office of Personnel
Management. The job satisfaction index included 7 questions, 5 of which were marked as being
the strongest drivers of job satisfaction. These questions were: ―My work gives me a feeling of
personal accomplishment‖, ―I like the kind of work I do‖, ―How satisfied are you with your
opportunity to get a better job in your organization?‖, ―How satisfied are you with your
involvement in decisions that affect your work?‖ and ―Considering everything, how satisfied are

Page | 52
you with your pay?‖ Respondents answered on a 5-level likert item as to whether they agreed
with the statement or were satisfied, depending on the format of the question (Office of
Personnel Management, 2008).
Since 2004, all three groups—The Department of State, NASA and the Under-30
cohort—saw an increase in the feeling of personal accomplishment in their work. Compared to
the average for employees aged 30 or lower, the Department of State and NASA had higher
levels of personal accomplishment. The trends were similar for the question ―I like the kind of
work I do‖.
There was slightly more stratification between responses in the ――How satisfied are you
with your opportunity to get a better job in your organization?‖and ―How satisfied are you with
your involvement in decisions that affect your work?‖ questions. NASA had the highest ratings,
followed by State and the under-30 cohort. However, unlike the question about personal
accomplishment and liking the kind of work done, the separation between NASA, State and the
under-30 cohort was slightly larger.
Finally, with regard to pay, NASA had higher satisfaction. On this measure, the State
Department and the under-30 cohort had similar figures. Satisfaction with pay at NASA exceeds
that of the other two groups.
To summarize, NASA and State had higher ratings on the items in the job-satisfaction
index than the average for the under-30 cohort. Moreover, NASA had higher ratings than the
Department of State in some categories. This could be because of NASA’s pay, emphasis on
development or because they might be better at showing employees how their work connects to
the mission of the organization.

Page | 53
Of course, because the data I was able to collect were aggregate data, I could not
establish whether the ratings were statistically significant. I only present these observations as
rough indicators about job-satisfaction at the Department of State, NASA and the under-30
cohort, which indicate that job-satisfaction is higher at the Department of State and NASA than it
is for the under-30 cohort across government, but data was not available to compare these results
to the under-30 cohort within NASA and the State Department.
Discussion
From the data, I will try to cull out insights and make meaning of the information
available. First, I will try to make some remarks about research methods. I will follow with
what the data might mean for the recruitment and retention of Generation Y and finish with some
general observations about federal human capital.
Research Methods
What is problematic about my approach is how non-systematic a way my interview
subjects were selected. I would have liked to avoid this and have a more rigorous method for
selecting people to interview. However, this was impossible. First, the organizational structure
of each agency I tried to target—the Office of Personnel Management, the Department of State
and NASA—is different, preventing me from interviewing people in each agency with the same
job description. Second, not being a government insider, I depended on a small network of
people to introduce me to potential interviewees. Moreover, many government officials may not
be willing to take the time to answer the questions of an undergraduate writing a senior thesis;
they are busy and probably have higher priorities. Beyond the people I completed interviews
with, I contacted several others but was unable to schedule an interview.

Page | 54
Another problem is interview bias. For the most part—the former agency interns I
profiled could be an exception—the people I interviewed could have had a professional stake in
the responses they were giving. They have a disincentive to share information that paints their
agency in a negative light because they may want the agency to receive positive attention, and
they may feel uncomfortable being seen as a critic of their agency. This could be the case even
though I was not pressuring the official to answer any particular question or asking questions to
elicit sensitive information. Even though this was a possibility, I tried to accommodate for this
effect by interview multiple people from each agency and reading third-party accounts of agency
activities.
Finally, I would have liked to interview more people from each agency to confirm the
responses I received further. I acknowledge that the subjects are not a representative sample or
perfect representatives of their group. However, they do have something to add to the
conversation about federal human capital and my research was more thorough by interviewing
them.
Generation Y insights
I will now move to a discussion about the Gen Y relevant conclusions about the data I
found. I have followed the same format as the archival sections of my case studies to break
down the results into several areas of human capital. I will end by gleaning some government-
wide insights.
Recruitment/Onboarding
Transformations in recruitment are the most pursued type of human capital
transformation, as indicated by the archival and personnel data. There have been several
recruitment-oriented programs at each agency, such as internship programs, fellowship programs

Page | 55
and Gen Y relevant recruitment communications. The Diplomat-in-Residence program at the
Department of State and NASA’s recruiting partnerships with Principal Investigators at
universities also received high remarks. In addition, legislative changes have mostly influenced
the recruitment area of federal human capital; recruitment bonuses, hiring flexibilities, loan
repayments etc. are more closely related to recruitment than retention.
Both agencies have programs that recruit young workers, but each agency has had
varying successes in their ability to make Gen Y hires. The State Department has had favorable
trends in accessions, for example. NASA has not, but it is unclear whether that is because
NASA has begun to hire many of its new Gen Y candidates using term appointments or because
NASA just has had not had increased success recruiting.
Recruitment transformations might be more common because recruitment is less subject to
congressional interference and is easier for congress to refurbish than other parts of human
capital than retention. Recruitment is strongly tied to agency mission and the communication of
its mission, so perhaps agencies are able to improve recruitment without additional resources or
flexibilities, as compared to retention initiatives. Agencies are leveraging a strength by
bolstering recruitment activities because they have meaningful missions and organizational
mission is an attractor for Generation Y workers, making it easier to increase performance in
recruitment quickly.
Even though recruitment activities were increased at the agencies, onboarding and hiring
were areas that were not as addressed. Interns from both agencies were critical of the lack of
communication they had with HR professionals before they started their jobs and the problems
they had when acquiring a security clearance. Also, the State department Interns made
comments about how they were not onboarded well, an important step for Generation Y workers

Page | 56
because onboarding allows them to acquire a support network and communicate with office
leaders; activities that Gen Y workers appreciate. The new Foreign Service Officer Test and the
OPM 45 day hiring model are steps in the right direction for improving onboarding and hiring,
but for Generation Y they probably are still not smooth enough processes.
Even though recruitment transformations are more emphasized than retention
transformations, the agencies studied do not exhibit a recruitment approach which indicates the
recruitment of Generation Y workers as an explicit objective. For example, with the exception
of NASA’s recruitment initiative, there was no material from any source that explicitly identified
strategies to better recruit young workers or identified the recruitment of young workers
expressly as an objective. The agencies have some programs that probably are most geared
towards Generation Y and others that are at least incidental in helping to better recruit
Generation Y workers. These programs suggest that Generation Y is not absent from the
consciousness of human capital officials in government, at least, but they are not expressly a
priority.
CPDF data supports this claim, because accessions of Generation Y workers have
outpaced accessions of other age groups, but accessions of Gen Y groups follow the same
general trends of accessions in the agencies overall. Also, government-wide employment totals
have had visible increases in employment levels since 2001 and in net accessions since 2001.
There are effects on the Gen Y workforce but not effects that are dramatically different from the
trends of other age groups.
Retention/Culture/Leadership
Retention of Gen Y workers is not as emphasized as their recruitment. There are not as
many programs or initiatives described that would aid the retention of Generation Y workers.
Some of the examples of initiatives that might affect retention that were provided were training

Page | 57
and development, rotational or mentorship programs. Beyond employee development programs,
however, there are some opportunities to give retention bonuses to specific types of employees.
Retention is a difficult issue to address because there are fewer bona fide types of
initiatives for retaining employees other than pay, development programs and mentorship
programs. Other than that, based on the interviews with former interns of the agencies, retention
comes down to intangibles like office culture. Characteristics like the relationship with a
supervisor, the ability to do meaningful work or the quality of leadership within the agency
create that culture for Generation Y workers. So, perhaps because creating a culture cannot be
reduced to only to the manipulation of policies and programs, retention is not as easily
addressed. This is unfortunate because retention-oriented transformations that improve
workplace culture would probably also serve as a recruitment tool for agencies.
Even though retention is not as directly addressed as recruitment by the agencies studied,
retention was an issue identified as an area for improvement throughout my research. Agencies
may need to devote time and resources to this issue, especially because the agencies might not
have expert knowledge in crafting retention programs to Generation Y workers. Since
Generation Y is different from the previous generation, creating programs to retain Gen Y—such
as programs that increase work-life balance or provide opportunities to volunteer in the
community—might be very different than creating programs to retain previous generations
which changed careers less than is expected of Gen Y.
Of course, culture varies by agency. However, based on interviews and archival data,
leadership plays a role in setting the tone for the agency’s culture. People in leadership roles,
whether it is a supervisor or an agency-head, are the stewards of the culture as well as the
change-agents behind human capital transformations.

Page | 58
Retention of Generation Y workers does not seem as much a concern, also because
recruitment comes before retention in the HR value chain. Moreover, retention is not as widely
discussed in documents analyzing human capital government wide. Improving employee
retention is also a more difficult affair because retention can require cultural change in an
organization in addition to the creation of programs, systems or structures. For example, even if
a training program is developed because better training would improve retention, if continuous
employee development is not a value of the agency or organizations, employees will not utilize
the program fully. The initiatives that could be considered to improve retention are ad-hoc
because they are not integrated into larger human capital strategies, when compared to
recruitment initiatves. No comprehensive, integrated, efforts to improve retention at agencies
exist for Generation Y groups or other groups.
Overall, retention of Generation Y has not been tackled head-on, nor is it widely
discussed across government. The CPDF data on attrition fits this claim. Attrition levels of Gen
Y groups are erratic and higher than agency or government wide averages. Also, there has not
been visible decline in attrition for any age groups at the agencies or across government. Also, if
retention is tied to job-satisfaction, the FHCS data suggests that there are improvements to be
made, especially in the areas of pay satisfaction and the involvement of employees in decisions
made about their jobs.
HR/Recruitment Communication
Communication has been critical to the efforts of both agencies. First, the agencies try to
communicate using their recruitment pages to reach out to potential recruits. Both agencies
have updated their web materials which is especially important considering Generation Y’s use
of the web to find information about agencies and get information about the hiring process.
Also, these websites were likely created with Generation Y in mind because there are elements

Page | 59
which would specifically appeal to Generation Y such as testimonials of internship experiences
and an emphasis on the impact that the agency makes in society.
NASA is a good example of how to communicate with an agency’s own employees about
HR issues. The website was comprehensive and easy to navigate. This culture of transparency
could be leading to better management by supervisors and increased engagement between HR
officials and employees. This increased engagement could be one of the reasons that NASA
tended to have higher job-satisfaction scores in the FHCS data.
Training and Development
Training and development was not emphasized in the data. There are some training
programs but it does not seem like training and development has been a very high priority in
human capital transformations, given my research. There have been some innovation or calls to
action by GAO but overall, these programs have not been vigorously revisited. This could be
because HR professionals would rather use time and resources to hire more staff than use
resources to train and develop existing staff. Even though transformations to improve training
and development were not emphasized relative to other types of transformations, the need for
training and development was recognized by both agencies. For example, NASA has programs
through its centers and the State Department has the Foreign Service Institute.
Conclusions on Gen Y
Very few initiatives, if any, are espoused to be expressly for recruiting and retaining
Generation Y. There are several initiatives and mechanisms that are more geared towards
Generation Y than they are towards other groups, such as targeting in recruitment with tools such
as websites or on-campus recruitment mechanisms like Diplomats-in-Residence or NASA’s use
of Principal Investigators for referrals.

Page | 60
Recruitment of Generation Y is more addressed by initiatives at the agencies studied than
is retention. For example, both agencies have student-oriented webpages and have mechanisms
to directly recruit students. Both agencies have strong internship programs with a large amount
of talent potentially recruited through an internship experience. Also, the most utilized
flexibilities—hiring authorities—are more aligned with recruitment objectives than retention
objectives.
There are several potential reasons why the recruitment and retention of Generation Y is
not being directly addressed. First, Generation Y might not be a priority yet, because the group
is only beginning to enter the workforce. Perhaps like the Department of State, agencies have
larger human capital challenges to face like managing retirement, increased demands on human
capital or knowledge management. Maybe the fear of causing conflict between generations in
the workforce—due to favoritism—prevents one group from being prioritized over another.
Another reason could be that because the necessary legislative mandate or flexibilities have not
been enacted yet.
Government wide insights
Examining the cases also provides the opportunity to confirm some existing ideas about
federal human capital:
Leadership Matters – Distinguishing the two agencies, the role of leadership
seems to be different. Leadership provides the laser-focus needed when
swimming through human capital strategy development, garnering resources for a
strategy and implementing a strategy. Sustained attentive leadership is a must
because without strong leadership stewarding transformation, human capital falls
by the wayside. NASA case demonstrates the positive influence strong leadership
has on human capital transformation.
One size does not fit all – The two agencies studied are in much different
circumstances from each other and from government averages. Each has used the
tools they have differently to try solving the challenges of their respective
agencies. One size does not fit all.

Page | 61
Resources matter – As shown at the Department of State, a strategy alone does
not solve human capital problems. Whether it means tool kits, technology or
money to hire staff, human capital challenges cannot be solved without sufficient
resources because transforming human capital required time, effort, people and
money. A lack of resources—though they are inevitably several other factors—
has stifled the Department of State’s ability to transform.
Organization theory is relevant when contextualizing the challenge of transforming
government agencies. Two theories in particular, Neo-Institutional Theory and Population
Ecology, resonate especially well when trying to explain the difficulties that government
agencies face when trying to transform.
Neo-Institutional theory, which explains that the actions of organizations are determined
by its institutional expectations, is helpful because it helps show why government agencies might
be stifled by external factors when trying to transform themselves; they aspire to maintain
resources and legitimacy so they live up to an expectation of mediocrity (Meyer & Rowan,
1977). Anecdotally speaking, many people have a critical, negative attitude towards
government. People think of government as a system—that responds to challenges in a simple,
mechanical way—instead of as an organization that should respond proactively to new, complex
challenges. The public expects that government will be ineffective, and that government will act
in a certain way. This expectation causes government to act in the way that it is expected to act
and perform, instead of how it ideally should. In other words, the public’s expectations prevent
government from transforming itself because government is compelled to act as people expect it
to and those expectations do not include transformation.
Population ecology, which claims that organizations change little and that they rise and
fall as the result of Darwinian processes, also helps explain why government cannot transform
itself. Population ecology, in its Darwinian processes, presumes that strong organizations

Page | 62
survive and others die (Hannan & Freeman, 1977). In government, because of legislation and
politics, this Darwinian processes is hindered. Instead of relevance and performance dictating
which organizations or units survive, Congress makes the determination. This causes significant
lag in reorganizing Government agencies or their subcomponents or in reallocating resources
between agencies or their subcomponents. Because the processes described in population
ecology theory are not active and operational, it prevents government from transforming and
reorganizing itself.
Integrating the work of Hannan & Freeman and Meyer & Rowan, with the ideas of Max
Weber motivates additional questions. Perhaps government should radically reorganize itself—
with the help of Congressional legislation—to be less like a bureaucracy and more like other
modern forms of organization. With reorganization, perhaps the expectations of government will
change. Weber’s bureaucracy might be a dated form of organization and new organizational
forms might emerge. Reimagining the organizational form of government, though challenging,
could have benefits or could prevent current management issues from exacerbating.
The cases also raise broad questions about how federal human capital should be
managed. For example, if sustained, attentive leadership is a must, should the top human capital
official be a political appointee with a shelf life of 18-24 months, perhaps with limited
knowledge of federal human capital? Should Congress try to pass specific human capital
legislation or cede management authority to agencies if one size does not fit all? Would
government jobs really become tools of political patronage if congress relaxed its oversight?
While observing an interview of a Chief Human Capital Officer in the summer of 2008,
prior to beginning my research, I was struck by the response to a question asked by my
supervisor to the CHCO. My supervisor asked a question along the lines of brain drain and what

Page | 63
the official was doing to prepare for it. The official responded, ―I watch the spigot, not the
drain‖.
Despite all the challenges, an opportunity to reinvent the federal workforce like the one at
present is hard to recollect. Moreover, because of the new presidential administration, there
could be a new energy around public service; government could become ―cool‖ again, according
to one interviewee. Regardless of whether human capital transformations have had effect on the
recruitment and retention of Generation Y—or have had mixed results, as I have tried to
demonstrate—any transformations are an opportunity for reinvention just as they are a challenge
to overcome. We—whether we includes Congress, civil servants, political appointees, members
of the non-profit community or the captivated public—should try to think about the difficult road
ahead as an opportunity to enable significant human capital transformation; we should remember
to watch the spigot and not the drain.

Page | 64
Bibliography Alch, M. L. (2000, February). Get Read for the Net Generation. Training & Development , 54 (2), p. 32.
Brooks, T. (2009, December 12). Chief, Student Programs Branch - US Department of State. (N. Tambe,
Interviewer)
Buckley, R. M., Beu, D. S., Milorad, M. N., & Sigerstad, T. D. (2001, Spring). Managing Generation
NeXt: Individual and Organizational Perspectives. Review of Business .
Bush, G. W. (2002). The President's Management Agenda. Office of Management and Budget.
CHCO Council. (n.d.). CHCOC. Retrieved February 22, 2009, from
http://www.chcoc.gov/Documents/DisplayDocument.aspx?PublicDocID=5
Clayton, J. (2009, February 20). Former Department of State Intern. (N. Tambe, Interviewer)
Collins, D. E., & Tilson, E. R. (2001, Nov-Dec). A new generation on the horizon. (Teaching
Techniques). Radiologic Technology , 73 (2), p. 172.
Department Of State. (2007). Strategic Plan: Fiscal Years 2007-2012. Department Of State and United
States Agency for International Development. Department of State.
French, J. (2006, September). Generation Y advice off base. HRMagazine , 51 (9) . Society for Human
Resource Management.
Government Accountability Office. (2008). NASA Workforce: Briefing on National Aeronautics and
Space Administration's use of term appointments. Government Accountability Office.
Government Accountability Office. (2005). DOD’s National Security Personnel System Faces
Implementation Challenges. Government Accountability Office.
Government Accountability Office. (2001). High-Risk Series: An Update. Government Publication,
Washington D.C.
Government Accountability Office. (2003). Major Management Challenges and Program Risks: National
Aeronautics and Space Administration. Government Accountability Office.
Government Accountability Office. (2007). NASA: Progress Made on Strategic Human Capital
Management, but Future Program Challenges Remain. Government Accountability Office.
Government Accountability Office. (2006). President's Management Agenda: Review of OMB’s
Improved Financial Performance Scorecard. Government Accountability Office.
Government Accountability Office. (2007). Staffing and Foreign Language Shortfalls Persist Despite
Initiatives to Address Gaps. Washington D.C.: Government Accountability Office.
Government Accountability Office. (2008). Transforming Federal Recruiting and Hiring Efforts.
Government Accountability Office.
Government Accountability Office. (2008, May 8). U.S. GAO - Human Capital: Transforming Federal
Recruiting and Hiring Efforts:. Retrieved March 6, 2009, from Government Accountability Office
Website: http://www.gao.gov/products/GAO-08-762T

Page | 65
Hannan, M. T., & Freeman, J. (1977, March). The Population Ecology of Organizations. The American
Journal of Sociology , pp. 929-964.
Hastings, R. R. (2008, January). Millenials expect a lot from leaders. HRMagazine , 53 (1), p. 30.
James, K. C. (2003, December 16). New Performance-Based Pay System for the Senior Executive Service
- CPM 2003-19. Retrieved February 22, 2009, from http://www.opm.gov/oca/compmemo/2003/2003-
19.asp
Kehrli, S., & Sopp, T. (2006, May). Managing Generation Y: stop resisting and start embracing the
challenged Generation Y brings to the workplace. HRMagazine , 51 (5), p. 113.
Kleiner, S. (2009, February 20). Former Department of State Intern. (N. Tambe, Interviewer)
LaFave, C. (2008, February 1). The Ten-Minute Manager's Guide To...Hiriing (and Keeping) Gen Y.
Restaurants & Institutions , 118 (2), p. 22.
Lalendran, A. (2009, January 16). Former NASA Intern. (N. Tambe, Interviewer)
Meyer, J. W., & Rowan, B. (1977, September). Institutionalized Organizations: Formal Structure as Myth
and Ceremony. The American Journal of Sociology , pp. 340-363.
National Aeronautics and Space Administration. (2009, February 23). NASA - Home. Retrieved February
23, 2009, from http://www.nasa.gov
National Aeronautics and Space Administration. (2008, December). NASA 2008 Workforce Plan.
Retrieved February 22, 2009, from NASAPeople: http://nasapeople.nasa.gov/HCM/index_sbg.htm
National Aeronautics and Space Administration. (2008, December). NASAPeople. Retrieved February 22,
2009, from http://nasapeople.nasa.gov/default.htm
National Aeronautics and Space Administration. (2001). National Recruitment Initiative. NASA.
National Aeronautics and Space Administration. Workforce Strategy. NASA.
Office of Personnel Management. (n.d.). Career Intern Program Information. Retrieved February 24,
2009, from Office of Personnel Management website: http://www.opm.gov/careerintern/
Office of Personnel Management. (n.d.). Federal Human Capital Survey - 2008. Retrieved February 22,
2009, from U.S. Office of Personnel Management website: http://www.fhcs.opm.gov/2008/What/
Office of Personnel Management. (2008). Federal Human Capital Survey 2008. Washington D.C.: Office
of Personnel Management.
Office of Personnel Management. (1998-2008, September). FedScope. Central Personnel Data File . (N.
Tambe, Compiler)
Office of Personnel Management. (n.d.). HCAAF Resource Center: A Practicioner's Guide. Retrieved
February 22, 2009, from Office of Personnel Management website:
http://www.opm.gov/hcaaf_resource_center/6-2.asp
Office of Personnel Management. (n.d.). Office of Personnel Management. Retrieved February 22, 2009,
from Office of Personnel Management website: http://www.opm.gov/strategiccomp/html/HISTORY1.asp

Page | 66
Office of Personnel Management. (n.d.). OPM's Human Capital Framework. Retrieved February 22,
2009, from http://apps.opm.gov/HumanCapital/tool/index.cfm
Office of the Inspector General. (2007). Bureau of Human Resources. Office of the Inspector General.
Department of State.
Office of the Inspector General. (2007). Bureau of Human Resources, Part II. Department of State.
Oliver, R. W. (2000, January). 'My' Generation. Management Review , p. 12.
O'Neal, A. (2009, January 16). Diplomat-in-Residence - US Department of State. (N. Tambe,
Interviewer)
Oversight of Government Management, the Federal Workforce and the District of Columbia
Subcommittee, Senate Committee on Governmental Affairs. (2004, July 20). Building the 21st Century
Workforce: Assessing Progress in Human Capital Management. Washington D.C.
Oversight of Government Management, the Federal Workforce and the District of Columbia
Subcommittee, Senate Committee on Homeland Security and Government Affairs. (2005, April 21).
Employing Federal Workforce Flexibilites: A Progress Report. Washington D.C.
Oversight of Government Management, the Federal Workforce, and the District of Columbia
Subcommittee of the Senate and Homeland Security and Governmental Affairs Committee. (2007). A
Domestic Crisis With Global Implications: Reviewing the Human Capital Crisis at the State Department.
Washington D.C.
Partnership for Public Service & Universum USA. (2009). Great Expectations: What Students Want in an
Employer and How Federal Agencies Can Deliver It. Partnership for Public Service.
Partnership for Public Service. (2006). Back to School: Rethinking Federal Recruiting on College
Campuses. Washington D.C.: Partnership for Public Service.
Partnership for Public Service. (2008). Issue Brief: Brain Drain 2008. Washington D.C.: Partnership for
Public Service.
Partnership for Public Service. (2007). Making the Different: A Blueprint for Matching University
Students with Federal Opportunities. Washington D.C.: Partnership for Public Service.
Sanders, R. P. (2003, December 24). New Performance-Based Pay System for the Senior Executive
Service - CPM 2003-19. Retrieved February 22, 2009, from Office of Personnel Management website:
http://www.opm.gov/oca/compmemo/2003/2003-21.asp
Solheim, S. (2007, July 16). 7 Tips for Recruiting Generation Y. VARbusiness , 23 (14), p. 19.
Spence-Diamond, S. (2008, November 27). Human Capital Strategist, NASA Human Resources
Management Division . (N. Tambe, Interviewer)
Subcommittee on Space and Aeronautics, Committee on Science, House of Representatives. (2006). The
NASA Workforce: Does NASA have the Right Strategy and Policies to Retain and Build the Workforce it
Will Need? . Congressional Testimony, Washington D.C.
Tulgan, B., & Martin, C. A. (2001). Managing Generation Y: global citizens born in the late seventies
and early eighties. Human Resource Development Press.

Page | 67
Twenge, D. J. (2006). Generation Me: Why Today's Young American Are More Confident, Assertive,
Entitled--and More Miserable Than Ever Before. New York, NY: Free Press.
US Office of Personnel Management. (n.d.). Biography of an Ideal. Retrieved February 22, 2009, from
Office of Personnel Management Website:
http://www.opm.gov/BiographyofAnIdeal/PUevents1977p01.htm
Weber, M. (1978). Bureaucracy. In Economy And Society: An Outline of Interpretive Psychology.
Berkeley: University of California Press.
Yeaton, K. (2008, April). Recruiting and managing the 'why?' Generation: Gen Y. The CPA Journal , 78
(4), p. 68.

Page | 68
Appendix A – Figures and Tables
Figure 1 – Projects of NASA’s Centers

Page | 69
Figure 2 - NASA.gov homepage

Page | 70
Figure 3 - NASA.gov “Multimedia” page

Page | 71
Figure 4 - NASA.gov "Missions" page

Page | 72
Figure 6 - NASA.gov "About NASA" page
Figure 5 – The Department of State’s Careers webpage

Page | 73
Appendix B – Data Tables and Charts
Figure 7 - Total Employees (Government Wide)
Total Employees -Government Wide
Age Groups 1998 1999 2000 2001 2002 2003 2004 2005 2006 2007 2008
Less than 20 375 411 504 710 1114 719 720 649 593 531 779
20-24 12920 14059 15864 20128 27269 28039 29814 29131 28072 28623 33736
25-29 70473 63560 59009 59265 66663 71196 79214 85680 91465 97530 110038
30-34 146948 135523 127046 125064 126164 123084 121836 119025 116102 119346 131586
35-39 217789 210648 202182 193773 188826 179171 175921 172668 170402 167758 170671
40-44 269678 258493 249673 247200 248951 248426 249576 247002 238027 229776 227091
45-49 323524 312560 306966 303966 301105 294235 290892 287991 286140 286841 295048
50-54 295606 311838 323833 332686 324217 317395 314659 313940 311237 309043 310102
55-59 156162 164668 172450 185516 214075 228604 241796 249129 251750 246173 249713
60-64 66287 67980 69715 73500 80694 88549 93906 97839 102763 116626 128149
65 or more 22424 23090 24447 26736 29435 31678 33562 35101 36447 38679 42920
All Employees 1582187 1562841 1551698 1568647 1608587 1611103 1631901 1638156 1633000 1640927 1699833
0
50000
100000
150000
200000
250000
300000
350000
1998 1999 2000 2001 2002 2003 2004 2005 2006 2007 2008
# o
f Em
plo
yee
s
Total Employees - Government Wide
Less than 20
20-24
25-29
30-34
35-39
40-44
45-49
50-54
55-59
60-64

Page | 74
Figure 8 - Total Employees (DoS)
Total Employees - Department of State
1998 1999 2000 2001 2002 2003 2004 2005 2006 2007 2008
Less than 20 1 0 1 0 2 3 1 0 0 1 1
20-24 51 58 43 51 73 116 138 114 103 186 155
25-29 265 269 297 271 308 337 338 416 428 626 708
30-34 493 505 579 542 572 599 600 575 579 633 697
35-39 715 755 818 801 800 819 801 825 830 853 895
40-44 777 836 1,022 1,017 1,025 1,071 1,058 1,060 1,025 1,051 1,071
45-49 943 995 1,177 1,191 1,191 1,202 1,214 1,250 1,249 1,271 1,337
50-54 952 1,057 1,296 1,350 1,365 1,352 1,365 1,372 1,347 1,380 1,390
55-59 504 585 717 780 926 1,047 1,086 1,153 1,130 1,132 1,172
60-64 232 258 322 354 396 445 485 502 545 625 724
65 or more 87 112 153 168 186 206 213 226 244 257 284
All Employees 5,020 5,430 6,425 6,525 6,844 7,197 7,299 7,493 7,480 8,015 8,434
0
200
400
600
800
1,000
1,200
1,400
1,600
1998 1999 2000 2001 2002 2003 2004 2005 2006 2007 2008
# o
f Em
plo
yee
sTotal Employees - Department of State
Less than 20
20-24
25-29
30-34
35-39
40-44
45-49
50-54
55-59

Page | 75
Figure 9 - Total Employees (NASA)
Total Employees - NASA
1998 1999 2000 2001 2002 2003 2004 2005 2006 2007 2008
Less than 20 20 24 29 26 21 18 9 10 11 5 4
20-24 167 197 289 356 327 346 360 355 254 203 235
25-29 710 582 547 519 523 583 696 671 723 704 716
30-34 2,250 1,997 1,705 1,464 1,265 1,039 871 774 700 730 803
35-39 3,352 3,368 3,266 3,100 2,825 2,551 2,335 1,949 1,649 1,421 1,269
40-44 2,944 3,110 3,319 3,547 3,633 3,731 3,757 3,531 3,320 3,060 2,797
45-49 2,713 2,807 2,940 2,998 3,140 3,243 3,379 3,524 3,730 3,869 3,972
50-54 2,581 2,600 2,667 2,794 2,743 2,812 2,881 2,921 2,951 3,121 3,258
55-59 2,016 2,008 1,957 2,013 2,137 2,147 2,169 2,086 2,092 2,066 2,110
60-64 927 978 1,033 1,057 1,144 1,226 1,207 1,128 1,102 1,162 1,165
65 or more 342 378 409 450 518 572 622 555 527 551 594
All employees 18,022 18,049 18,161 18,324 18,276 18,268 18,286 17,504 17,059 16,892 16,923
0
500
1,000
1,500
2,000
2,500
3,000
3,500
4,000
4,500
1998 1999 2000 2001 2002 2003 2004 2005 2006 2007 2008
# o
f Em
plo
yee
sTotal Employees - NASA
Less than 20
20-24
25-29
30-34
35-39
40-44
45-49
50-54
55-59
60-64
65 or more

Page | 76
Figure 10 - Accessions (Government Wide)
Accessions - Government Wide
2001 2002 2003 2004 2005 2006 2007 2008
Less than 20 1,355 1,856 592 855 848 800 879 1,242
20-24 12,323 18,598 11,003 11,558 12,774 12,666 13,580 18,328
25-29 15,289 21,189 14,189 13,185 15,226 16,742 19,483 26,251
30-34 15,243 21,494 13,918 12,385 13,324 13,441 14,939 20,589
35-39 13,184 18,875 11,560 11,209 11,864 12,457 13,859 18,218
40-44 13,065 18,860 12,611 12,414 14,106 14,068 14,459 19,372
45-49 10,696 15,259 10,907 10,201 10,987 11,677 12,725 17,465
50-54 7,904 11,086 7,573 7,196 7,499 8,096 9,417 12,784
55-59 3,462 6,311 4,225 4,091 4,267 4,802 5,440 7,761
60-64 1,104 1,729 1,267 1,127 1,182 1,269 1,842 2,782
65 or more 528 690 412 311 308 327 478 687
All Employees 94,153 135,947 88,257 84,532 92,385 96,345 107,101 145,479
0
5,000
10,000
15,000
20,000
25,000
30,000
2001 2002 2003 2004 2005 2006 2007 2008
# o
f A
cce
ssio
ns
Accessions - Government Wide
Less than 20
20-24
25-29
30-34
35-39
40-44
45-49
50-54
55-59
60-64
65 or more

Page | 77
Figure 11 - Accessions (DoS)
Accessions - Department of State
2001 2002 2003 2004 2005 2006 2007 2008
Less than 20 1 2 1 4 1 2 4 8
20-24 38 34 51 70 44 62 91 71
25-29 61 72 85 65 73 162 180 157
30-34 33 63 68 51 67 135 97 84
35-39 44 47 43 33 44 99 74 85
40-44 43 57 40 47 55 58 77 69
45-49 44 46 48 33 44 46 69 69
50-54 39 38 39 26 32 45 56 59
55-59 14 29 35 17 21 18 37 54
60-64 7 5 11 9 7 9 12 20
65 or more 1 4 4 0 1 1 2 4
All Employees 325 397 425 355 389 637 699 680
0
20
40
60
80
100
120
140
160
180
200
2001 2002 2003 2004 2005 2006 2007 2008
# o
f A
cce
ssio
ns
Accessions - Department of State
Less than 20
20-24
25-29
30-34
35-39
40-44
45-49
50-54
55-59
60-64
65 or more

Page | 78
Figure 12 - Accessions (NASA)
Accessions - NASA
2001 2002 2003 2004 2005 2006 2007 2008
Less than 20 41 24 26 20 20 26 31 21
20-24 244 142 180 226 163 140 119 162
25-29 91 53 67 86 47 53 38 70
30-34 104 63 45 50 27 17 23 43
35-39 127 60 44 71 23 17 21 38
40-44 91 60 70 88 25 21 30 35
45-49 57 44 34 50 25 31 46 36
50-54 44 26 32 24 10 18 14 22
55-59 16 10 12 16 3 9 12 10
60-64 4 3 6 4 3 0 0 2
65 or more 1 1 3 0 2 0 1 0
All Employees 820 486 519 635 348 332 335 439
0
50
100
150
200
250
300
2001 2002 2003 2004 2005 2006 2007 2008
# o
f A
cce
ssio
ns
Accessions - NASA
Less than 20
20-24
25-29
30-34
35-39
40-44
45-49
50-54
55-59
60-64
65 or more

Page | 79
Figure 13 - New Gen Y Hires (Govt. Wide)
New Gen Y Hires - Govt. Wide
2001 2002 2003 2004 2005 2006 2007 2008
New Hire -
Competitive
Service
19,740 20,565 14,564 12,275 11,777 12,253 13,622 17,557
New Hire -
Excepted
Service
9,227 21,078 11,218 13,321 17,069 17,954 20,320 28,264
Figure 14 - All New Hires (Govt. Wide)
All New Hires - Govt. Wide
2001 2002 2003 2004 2005 2006 2007 2008
New Hire -
Competitive
Service
68,237 69,445 59,202 52,103 52,052 54,400 59,721 80,157
New Hire -
Excepted
Service
25,738 66,216 28,835 32,187 40,074 41,656 47,061 65,051
0%
20%
40%
60%
80%
100%
2001 2002 2003 2004 2005 2006 2007 2008
New Gen Y Hires - Govt. Wide
New Hire - Excepted Service
New Hire - Competitive Service
0%
20%
40%
60%
80%
100%
2001 2002 2003 2004 2005 2006 2007 2008
All New Hires - Govt. Wide
New Hire - Excepted Service
New Hire - Competitive Service

Page | 80
Figure 15 - New Gen Y Hires (DoS)
New Gen Y Hires - Department of State
2001 2002 2003 2004 2005 2006 2007 2008
New Hire -
Competitive Service 33 42 54 44 40 38 47 49
New Hire - Excepted
Service 67 66 84 157 283 188 228 187
Figure 16 - All New Hires (DoS)
All New Hires - Department of State
2001 2002 2003 2004 2005 2006 2007 2008
New Hire -
Competitive Service 224 280 290 215 245 220 257 287
New Hire - Excepted
Service 130 151 167 355 798 409 434 389
0%
20%
40%
60%
80%
100%
2001 2002 2003 2004 2005 2006 2007 2008
New Gen Y Hires - Department of State
New Hire - Excepted Service
New Hire - Competitive Service
0%
20%
40%
60%
80%
100%
2001 2002 2003 2004 2005 2006 2007 2008
All New Hires - Department of State
New Hire - Excepted Service
New Hire - Competitive Service

Page | 81
Figure 17 - New Gen Y Hires (NASA)
New Gen Y Hires - NASA
2001 2002 2003 2004 2005 2006 2007 2008
New Hire -
Competitive
Service
141 60 41 33 7 13 9 14
New Hire -
Excepted
Service
235 159 232 299 223 206 179 239
Figure 18 - All New Hires (NASA)
All New Hires - NASA
2001 2002 2003 2004 2005 2006 2007 2008
New Hire -
Competitive
Service
552 294 242 286 80 88 115 151
New Hire -
Excepted
Service
291 190 287 359 268 241 226 297
0%
20%
40%
60%
80%
100%
2001 2002 2003 2004 2005 2006 2007 2008
New Gen-y Hires - NASA
New Hire - Excepted Service
New Hire - Competitive Service
0%
20%
40%
60%
80%
100%
2001 2002 2003 2004 2005 2006 2007 2008
All New Hires - NASA
New Hire - Excepted Service
New Hire - Competitive Service

Page | 82
Figure 19 - Separations (Govt. Wide)
Separations - Government Wide
2001 2002 2003 2004 2005 2006 2007 2008
Less than 20 247 229 95 130 127 120 166 208
20-24 3,331 3,064 3,009 3,096 3,461 3,312 3,360 3,699
25-29 5,467 4,602 4,982 5,343 6,507 6,970 7,391 7,270
30-34 6,891 5,722 5,692 5,841 6,434 6,348 6,645 6,373
35-39 7,022 5,475 5,584 5,553 6,449 6,511 6,277 6,130
40-44 6,417 5,153 5,700 5,917 6,634 6,365 6,347 5,822
45-49 6,618 5,786 6,036 6,000 6,664 6,403 6,530 6,130
50-54 10,315 9,135 10,078 10,078 11,101 10,351 9,926 8,984
55-59 16,236 18,044 21,999 24,947 27,172 26,529 25,954 23,958
60-64 12,641 12,128 15,244 16,132 18,330 18,544 20,955 20,791
65 or more 5,315 5,292 7,198 7,105 8,287 8,475 9,080 8,907
All Employees 80,500 74,630 85,617 90,142 101,166 99,928 102,631 98,272
0
5,000
10,000
15,000
20,000
25,000
30,000
2001 2002 2003 2004 2005 2006 2007 2008
# o
f Se
par
atio
ns
Separations - Government Wide
Less than 20
20-24
25-29
30-34
35-39
40-44
45-49
50-54
55-59
60-64
65 or more

Page | 83
Figure 20 - Separations (DoS)
Separations - Department of State
2001 2002 2003 2004 2005 2006 2007 2008
Less than 20 0 0 0 0 0 0 1 5
20-24 12 1 13 14 17 12 13 19
25-29 29 13 25 28 22 37 17 37
30-34 19 7 14 24 33 43 33 33
35-39 12 11 1 20 22 62 21 32
40-44 32 5 2 21 23 38 24 20
45-49 23 15 8 14 17 35 27 16
50-54 20 8 13 21 38 58 26 28
55-59 60 69 79 112 96 150 94 82
60-64 42 29 40 61 65 98 66 76
65 or more 27 20 8 43 38 64 49 52
All Employees 276 178 203 358 371 597 371 400
0
20
40
60
80
100
120
140
160
2001 2002 2003 2004 2005 2006 2007 2008
# o
f Se
par
atio
ns
Separations - Department of State
Less than 20
20-24
25-29
30-34
35-39
40-44
45-49
50-54
55-59
60-64
65 or more

Page | 84
Figure 21 - Separations (NASA)
Separations - NASA
2001 2002 2003 2004 2005 2006 2007 2008
Less than 20 6 4 1 3 0 2 1 1
20-24 76 84 50 60 67 59 47 64
25-29 34 26 21 23 44 43 39 36
30-34 43 22 19 15 20 29 26 23
35-39 71 31 28 16 40 25 18 23
40-44 35 24 26 23 32 37 27 30
45-49 35 16 20 17 58 49 33 33
50-54 22 30 28 35 108 75 48 47
55-59 164 150 133 188 309 194 180 197
60-64 142 130 141 193 289 177 173 202
65 or more 60 66 96 101 205 128 127 119
All Employees 688 583 563 674 1,172 818 719 775
0
50
100
150
200
250
300
350
2001 2002 2003 2004 2005 2006 2007 2008
# o
f Se
par
atio
ns
Separations - NASA
Less than 20
20-24
25-29
30-34
35-39
40-44
45-49
50-54
55-59
60-64
65 or more

Page | 85
Figure 22 - Attrition (Govt. Wide)
Attrition - Government Wide
2001 2002 2003 2004 2005 2006 2007 2008
Less than 20 34.79% 20.56% 13.21% 18.06% 19.57% 20.24% 31.26% 26.70%
20-24 16.55% 11.24% 10.73% 10.38% 11.88% 11.80% 11.74% 10.96%
25-29 9.22% 6.90% 7.00% 6.75% 7.59% 7.62% 7.58% 6.61%
30-34 5.51% 4.54% 4.62% 4.79% 5.41% 5.47% 5.57% 4.84%
35-39 3.62% 2.90% 3.12% 3.16% 3.73% 3.82% 3.74% 3.59%
40-44 2.60% 2.07% 2.29% 2.37% 2.69% 2.67% 2.76% 2.56%
45-49 2.18% 1.92% 2.05% 2.06% 2.31% 2.24% 2.28% 2.08%
50-54 3.10% 2.82% 3.18% 3.20% 3.54% 3.33% 3.21% 2.90%
55-59 8.75% 8.43% 9.62% 10.32% 10.91% 10.54% 10.54% 9.59%
60-64 17.20% 15.03% 17.22% 17.18% 18.73% 18.05% 17.97% 16.22%
65 or more 19.88% 17.98% 22.72% 21.17% 23.61% 23.25% 23.48% 20.75%
All Employees 5.13% 4.64% 5.31% 5.52% 6.18% 6.12% 6.25% 5.78%
0.00%
5.00%
10.00%
15.00%
20.00%
25.00%
30.00%
35.00%
40.00%
2001 2002 2003 2004 2005 2006 2007 2008
% A
ttri
tio
nAttrition - Government Wide
Less than 20
20-24
25-29
30-34
35-39
40-44
45-49
50-54
55-59
60-64
65 or more
All Employees

Page | 86
Figure 23 - Attrition (DoS)
Attrition - Department of State
2001 2002 2003 2004 2005 2006 2007 2008
Less than 20 #DIV/0! 0.00% 0.00% 0.00% #DIV/0! #DIV/0! 100.00% 500.00%
20-24 23.53% 1.37% 11.21% 10.14% 14.91% 11.65% 6.99% 12.26%
25-29 10.70% 4.22% 7.42% 8.28% 5.29% 8.64% 2.72% 5.23%
30-34 3.51% 1.22% 2.34% 4.00% 5.74% 7.43% 5.21% 4.73%
35-39 1.50% 1.38% 0.12% 2.50% 2.67% 7.47% 2.46% 3.58%
40-44 3.15% 0.49% 0.19% 1.98% 2.17% 3.71% 2.28% 1.87%
45-49 1.93% 1.26% 0.67% 1.15% 1.36% 2.80% 2.12% 1.20%
50-54 1.48% 0.59% 0.96% 1.54% 2.77% 4.31% 1.88% 2.01%
55-59 7.69% 7.45% 7.55% 10.31% 8.33% 13.27% 8.30% 7.00%
60-64 11.86% 7.32% 8.99% 12.58% 12.95% 17.98% 10.56% 10.50%
65 or more 16.07% 10.75% 3.88% 20.19% 16.81% 26.23% 19.07% 18.31%
All Employees 4.23% 2.60% 2.82% 4.90% 4.95% 7.98% 4.63% 4.74%
0.00%
5.00%
10.00%
15.00%
20.00%
25.00%
30.00%
2001 2002 2003 2004 2005 2006 2007 2008
% A
ttri
tio
nAttrition - Department of State
20-24
25-29
30-34
35-39
40-44
45-49
50-54
55-59
60-64
65 or more
All Employees

Page | 87
Figure 24 - Attrition (NASA)
Attrition - NASA
2001 2002 2003 2004 2005 2006 2007 2008
Less than 20 23.08% 19.05% 5.56% 33.33% 0.00% 18.18% 20.00% 25.00%
20-24 21.35% 25.69% 14.45% 16.67% 18.87% 23.23% 23.15% 27.23%
25-29 6.55% 4.97% 3.60% 3.30% 6.56% 5.95% 5.54% 5.03%
30-34 2.94% 1.74% 1.83% 1.72% 2.58% 4.14% 3.56% 2.86%
35-39 2.29% 1.10% 1.10% 0.69% 2.05% 1.52% 1.27% 1.81%
40-44 0.99% 0.66% 0.70% 0.61% 0.91% 1.11% 0.88% 1.07%
45-49 1.17% 0.51% 0.62% 0.50% 1.65% 1.31% 0.85% 0.83%
50-54 0.79% 1.09% 1.00% 1.21% 3.70% 2.54% 1.54% 1.44%
55-59 8.15% 7.02% 6.19% 8.67% 14.81% 9.27% 8.71% 9.34%
60-64 13.43% 11.36% 11.50% 15.99% 25.62% 16.06% 14.89% 17.34%
65 or more 13.33% 12.74% 16.78% 16.24% 36.94% 24.29% 23.05% 20.03%
All Employees 3.75% 3.19% 3.08% 3.69% 6.70% 4.80% 4.26% 4.58%
0.00%
5.00%
10.00%
15.00%
20.00%
25.00%
30.00%
35.00%
40.00%
2001 2002 2003 2004 2005 2006 2007 2008
% A
ttri
tio
nAttrition - NASA
Less than 20
20-24
25-29
30-34
35-39
40-44
45-49
50-54
55-59
60-64

Page | 88
Figure 25 - Hires Above Attrition (Govt. Wide)
Hires Above Attrition - Government Wide
2001 2002 2003 2004 2005 2006 2007 2008
Less than 20 1,108 1,627 497 725 721 680 713 1,034
20-24 8,992 15,534 7,994 8,462 9,313 9,354 10,220 14,629
25-29 9,822 16,587 9,207 7,842 8,719 9,772 12,092 18,981
30-34 8,352 15,772 8,226 6,544 6,890 7,093 8,294 14,216
35-39 6,162 13,400 5,976 5,656 5,415 5,946 7,582 12,088
40-44 6,648 13,707 6,911 6,497 7,472 7,703 8,112 13,550
45-49 4,078 9,473 4,871 4,201 4,323 5,274 6,195 11,335
50-54 -2,411 1,951 -2,505 -2,882 -3,602 -2,255 -509 3,800
55-59 -12,774 -11,733 -17,774 -20,856 -22,905 -21,727 -20,514 -16,197
60-64 -11,537 -10,399 -13,977 -15,005 -17,148 -17,275 -19,113 -18,009
65 or more -4,787 -4,602 -6,786 -6,794 -7,979 -8,148 -8,602 -8,220
Total Net Accessions 13,653 61,317 2,640 -5,610 -8,781 -3,583 4,470 47,207
-30,000
-20,000
-10,000
0
10,000
20,000
30,000
40,000
50,000
60,000
70,000
2001 2002 2003 2004 2005 2006 2007 2008
Ne
t A
cce
ssio
ns
Hires Above Attrition - Government Wide
Less than 20
20-24
25-29
30-34
35-39
40-44
45-49
50-54
55-59
60-64
65 or more
Total Net Accessions

Page | 89
Figure 26 - Hires Above Attrition (DoS)
Hires Above Attrition - Department of State
2001 2002 2003 2004 2005 2006 2007 2008
Less than 20 1 2 1 4 1 2 3 3
20-24 26 33 38 56 27 50 78 52
25-29 32 59 60 37 51 125 163 120
30-34 14 56 54 27 34 92 64 51
35-39 32 36 42 13 22 37 53 53
40-44 11 52 38 26 32 20 53 49
45-49 21 31 40 19 27 11 42 53
50-54 19 30 26 5 -6 -13 30 31
55-59 -46 -40 -44 -95 -75 -132 -57 -28
60-64 -35 -24 -29 -52 -58 -89 -54 -56
65 or more -26 -16 -4 -43 -37 -63 -47 -48
Total Net Accessions 49 219 222 -3 18 40 328 280
-200
-100
0
100
200
300
400
2001 2002 2003 2004 2005 2006 2007 2008
Ne
t A
cce
ssio
ns
Hires Above Attrition - Department of State
Less than 20
20-24
25-29
30-34
35-39
40-44
45-49
50-54
55-59
60-64
65 or more
Total Net Accessions

Page | 90
Figure 27 - Hires Above Attrition (NASA)
Hires Above Attrition - NASA
2001 2002 2003 2004 2005 2006 2007 2008
Less than 20 35 20 25 17 20 24 30 20
20-24 168 58 130 166 96 81 72 98
25-29 57 27 46 63 3 10 -1 34
30-34 61 41 26 35 7 -12 -3 20
35-39 56 29 16 55 -17 -8 3 15
40-44 56 36 44 65 -7 -16 3 5
45-49 22 28 14 33 -33 -18 13 3
50-54 22 -4 4 -11 -98 -57 -34 -25
55-59 -148 -140 -121 -172 -306 -185 -168 -187
60-64 -138 -127 -135 -189 -286 -177 -173 -200
65 or more -59 -65 -93 -101 -203 -128 -126 -119
Total Net Accessions 132 -97 -44 -39 -824 -486 -384 -336
-1,000
-800
-600
-400
-200
0
200
400
2001 2002 2003 2004 2005 2006 2007 2008
Ne
t A
cce
ssio
ns
Hires Above Attrition - NASA
Less than 20
20-24
25-29
30-34
35-39
40-44
45-49
50-54
55-59
60-64
65 or more
Total Net Accessions

Page | 91
Table 2 - FHCS "High Impact" questions from Job-satisfaction Index
Strongly Agree/Very
Satisfied Agree/Satisfied
Neither Agree-Disagree/
Satisfied-Unsatisfied Disagree/Unsatisfied
Strongly Disagree/Very
Unsatisfied
Question Text Group 2008 2006 2004 2008 2006 2004 2008 2006 2004 2008 2006 2004 2008 2006 2004
My work gives me a
feeling of personal
accomplishment.
NASA 37.80% 35.50% 32.90% 40.50% 43.10% 43.90% 12.10% 12.20% 12.90% 6.60% 6.60% 6.90% 3.00% 2.60% 3.40%
State 33.30% 31.10% 30.60% 44.10% 45.90% 39.80% 14.20% 12.00% 17.30% 5.20% 7.40% 9.00% 3.20% 3.60% 3.30%
<30 25.70% 23.70% 20.60% 44.40% 42.50% 42.70% 17.60% 18.80% 18.50% 8.30% 10.20% 12.90% 4.00% 4.70% 5.20%
I like the kind of work I
do.
NASA 42.70% 39.90% 39.60% 40.80% 44.00% 44.00% 11.10% 10.40% 11.10% 4.00% 4.30% 3.90% 1.50% 1.50% 1.50%
State 42.90% 39.90% 37.00% 41.20% 42.90% 44.60% 10.90% 10.50% 12.30% 3.40% 4.50% 3.50% 1.60% 2.10% 2.60%
<30 31.80% 30.40% 30.00% 46.00% 44.10% 43.50% 14.80% 16.60% 15.70% 5.20% 7.10% 8.40% 2.20% 1.90% 2.40%
How satisfied are you with
your opportunity to get a
better job in your
organization?
NASA 14.90% 12.20% 11.40% 31.60% 32.70% 33.30% 27.80% 28.60% 28.10% 16.40% 17.10% 17.30% 9.30% 9.30% 9.90%
State 12.40% 12.40% 9.90% 34.40% 34.20% 33.20% 26.80% 28.50% 27.70% 16.00% 15.70% 19.50% 10.40% 9.20% 9.60%
<30 11.50% 10.40% 12.50% 35.60% 32.00% 30.40% 27.20% 28.10% 25.40% 15.40% 17.80% 18.90% 10.20% 11.70% 12.80%
How satisfied are you with
your involvement in
decisions that affect your
work?
NASA 19.40% 18.50% 17.70% 45.30% 45.30% 44.50% 18.60% 18.40% 18.90% 12.10% 14.10% 14.50% 4.60% 3.70% 4.40%
State 15.80% 15.00% 15.20% 46.60% 43.00% 42.80% 20.50% 21.80% 18.40% 12.50% 16.10% 18.90% 4.50% 4.10% 4.60%
<30 11.60% 12.70% 11.70% 43.80% 42.20% 41.80% 25.60% 24.30% 23.40% 13.30% 16.20% 16.80% 5.70% 4.60% 6.30%
Considering everything,
how satisfied are you with
your pay?
NASA 23.50% 23.10% 22.60% 48.30% 48.50% 48.70% 14.70% 15.20% 14.20% 10.20% 10.50% 11.10% 3.30% 2.70% 3.40%
State 15.50% 16.00% 18.50% 43.90% 48.00% 47.70% 19.30% 19.10% 16.90% 15.70% 13.20% 13.50% 5.60% 3.80% 3.40%
<30 14.00% 15.30% 15.30% 44.20% 45.40% 44.40% 18.00% 19.90% 17.90% 15.40% 13.20% 14.60% 8.40% 6.30% 7.80%

Page | 92
Table 3 - %Change Table (Total Employees)
Measure Age Group % Change '98 to '08 % Change '01 to '08
Total Employees - Govt. Wide Less than 20 107.73% 9.72%
Total Employees - Govt. Wide 20-24 161.11% 67.61%
Total Employees - Govt. Wide 25-29 56.14% 85.67%
Total Employees - Govt. Wide 30-34 -10.45% 5.21%
Total Employees - Govt. Wide 35-39 -21.63% -11.92%
Total Employees - Govt. Wide 40-44 -15.79% -8.13%
Total Employees - Govt. Wide 45-49 -8.80% -2.93%
Total Employees - Govt. Wide 50-54 4.90% -6.79%
Total Employees - Govt. Wide 55-59 59.91% 34.60%
Total Employees - Govt. Wide 60-64 93.32% 74.35%
Total Employees - Govt. Wide 65 or more 91.40% 60.53%
Total Employees - Govt. Wide All Employees 7.44% 8.36%
Total Employees - DoS Less than 20 0.00% #DIV/0!
Total Employees - DoS 20-24 203.92% 203.92%
Total Employees - DoS 25-29 167.17% 161.25%
Total Employees - DoS 30-34 41.38% 28.60%
Total Employees - DoS 35-39 25.17% 11.74%
Total Employees - DoS 40-44 37.84% 5.31%
Total Employees - DoS 45-49 41.78% 12.26%
Total Employees - DoS 50-54 46.01% 2.96%
Total Employees - DoS 55-59 132.54% 50.26%
Total Employees - DoS 60-64 212.07% 104.52%
Total Employees - DoS 65 or more 226.44% 69.05%
Total Employees - DoS All Employees 68.01% 29.26%
Total Employees - NASA Less than 20 -80.00% -84.62%
Total Employees - NASA 20-24 40.72% -33.99%
Total Employees - NASA 25-29 0.85% 37.96%
Total Employees - NASA 30-34 -64.31% -45.15%
Total Employees - NASA 35-39 -62.14% -59.06%
Total Employees - NASA 40-44 -4.99% -21.14%
Total Employees - NASA 45-49 46.41% 32.49%
Total Employees - NASA 50-54 26.23% 16.61%
Total Employees - NASA 55-59 4.66% 4.82%
Total Employees - NASA 60-64 25.67% 10.22%
Total Employees - NASA 65 or more 73.68% 32.00%
Total Employees - NASA All employees -6.10% -7.65%

Page | 93
Table 4 - %Change Table (Accessions)
Measure Age Group % Change '98 to '08 % Change '01 to '08
Accessions - Govt. Wide Less than 20 N/A -8.34%
Accessions - Govt. Wide 20-24 N/A 48.73%
Accessions - Govt. Wide 25-29 N/A 71.70%
Accessions - Govt. Wide 30-34 N/A 35.07%
Accessions - Govt. Wide 35-39 N/A 38.18%
Accessions - Govt. Wide 40-44 N/A 48.27%
Accessions - Govt. Wide 45-49 N/A 63.29%
Accessions - Govt. Wide 50-54 N/A 61.74%
Accessions - Govt. Wide 55-59 N/A 124.18%
Accessions - Govt. Wide 60-64 N/A 151.99%
Accessions - Govt. Wide 65 or more N/A 30.11%
Accessions - Govt. Wide All Employees N/A 54.51%
Accessions - DoS Less than 20 N/A 700.00%
Accessions - DoS 20-24 N/A 86.84%
Accessions - DoS 25-29 N/A 157.38%
Accessions - DoS 30-34 N/A 154.55%
Accessions - DoS 35-39 N/A 93.18%
Accessions - DoS 40-44 N/A 60.47%
Accessions - DoS 45-49 N/A 56.82%
Accessions - DoS 50-54 N/A 51.28%
Accessions - DoS 55-59 N/A 285.71%
Accessions - DoS 60-64 N/A 185.71%
Accessions - DoS 65 or more N/A 300.00%
Accessions - DoS All Employees N/A 109.23%
Accessions - NASA Less than 20 N/A -48.78%
Accessions - NASA 20-24 N/A -33.61%
Accessions - NASA 25-29 N/A -23.08%
Accessions - NASA 30-34 N/A -58.65%
Accessions - NASA 35-39 N/A -70.08%
Accessions - NASA 40-44 N/A -61.54%
Accessions - NASA 45-49 N/A -36.84%
Accessions - NASA 50-54 N/A -50.00%
Accessions - NASA 55-59 N/A -37.50%
Accessions - NASA 60-64 N/A -50.00%
Accessions - NASA 65 or more N/A -100.00%
Accessions - NASA
All
Employees N/A -46.46%

Page | 94
Table 5 - %Change Table (Separations)
Measure Age Group % Change '98 to '08 % Change '01 to '08
Separations - Govt. Wide Less than 20 N/A -15.79%
Separations - Govt. Wide 20-24 N/A 11.05%
Separations - Govt. Wide 25-29 N/A 32.98%
Separations - Govt. Wide 30-34 N/A -7.52%
Separations - Govt. Wide 35-39 N/A -12.70%
Separations - Govt. Wide 40-44 N/A -9.27%
Separations - Govt. Wide 45-49 N/A -7.37%
Separations - Govt. Wide 50-54 N/A -12.90%
Separations - Govt. Wide 55-59 N/A 47.56%
Separations - Govt. Wide 60-64 N/A 64.47%
Separations - Govt. Wide 65 or more N/A 67.58%
Separations - Govt. Wide All Employees N/A 22.08%
Separations - Department of State Less than 20 N/A #DIV/0!
Separations - Department of State 20-24 N/A 58.33%
Separations - Department of State 25-29 N/A 27.59%
Separations - Department of State 30-34 N/A 73.68%
Separations - Department of State 35-39 N/A 166.67%
Separations - Department of State 40-44 N/A -37.50%
Separations - Department of State 45-49 N/A -30.43%
Separations - Department of State 50-54 N/A 40.00%
Separations - Department of State 55-59 N/A 36.67%
Separations - Department of State 60-64 N/A 80.95%
Separations - Department of State 65 or more N/A 92.59%
Separations - Department of State All Employees N/A 44.93%
Separations - NASA Less than 20 N/A -83.33%
Separations - NASA 20-24 N/A -15.79%
Separations - NASA 25-29 N/A 5.88%
Separations - NASA 30-34 N/A -46.51%
Separations - NASA 35-39 N/A -67.61%
Separations - NASA 40-44 N/A -14.29%
Separations - NASA 45-49 N/A -5.71%
Separations - NASA 50-54 N/A 113.64%
Separations - NASA 55-59 N/A 20.12%
Separations - NASA 60-64 N/A 42.25%
Separations - NASA 65 or more N/A 98.33%
Separations - NASA All Employees N/A 12.65%

Page | 95
Appendix C – Interview Guides Guide For Agency Officials Audience Priority Question
Both 1 What are key items in the HC portfolio that put pressure on your staff?
Agency 1 What are key features of your workforce?
OPM 1
What is OPM's Identity when it comes to HC Transformation, what role
do you play?
Both 2
Who are the HC key players in this area and what stakeholders have an
interest in the issue?
Agency 2
What assets do you feel you have, whether its people, funding, legislative
flexibility, supportive leadership, etc…in other words what are elements
which ENABLE Transformation
OPM 2 Are there any priorities you have or mandates you are obliged to work on?
Agency 3 What are the factors that hold the agency back from transforming?
Agency 1
What are change initiatives that your agency has undertaken to improve
recruitment and retention? Were any considerations made for catering to
Gen Y or younger workers?
OPM 1
What are OPM's efforts--more generally--to combat the looming baby-
boomer retirement?
Agency 2
What programs, policies or tools have been created or modified to
transform recruitment and retention?
OPM 2
What prototypes/aids have you provided to agencies which were intended
to help with talent management issues? How were those tools made gen-
relevant?
Agency 3
What is the process for implementing these transformations? What factors
do you consider?
Agency 4
How are transformations informed--e.g. how do Gen Y viewpoints
become represented if there aren't that many in-house?
Both 5 What is your approach to measuring the results of HC transformation?
Both 1 What is your vision for talent management tin the 21st century?
Both 1
What have been some strategies or objectives? What have been
obligations to consider?
OPM 1
What has been OPMs role in getting agencies to take actions on HC
transformation to improve talent mgmt. of Gen Y workers?
Agency 2 Have there been any goals that you are tracking progress against?
Both 2
How do you stay accountable to transformation, internally and/or
externally?
OPM 2 What is preventing change from happening?
Agency 3 What have been your greatest needs when attempting this change?
Both 1
What are your upcoming challenges and efforts, especially in light of a
presidential transition?
Both 2 What are your biggest successes?
Both 3 What is on your wish list?
Both 1 What are initial outcomes and results?
Both 2
What are the general feelings of your key stakeholders regarding
attempted transformations?
Both 1 Who else do you think I should talk to?
Both 2 What data is provide able?
Both 3 How can I make my research more relevant to you?

Page | 96
Guide for Former Interns 1. How have you been touched? In terms of communications, interactions or opportunities?
2. What worked for you, what did you like about this part of the process?
3. What didn't work for you?
4. How could the agency have done better to be more likely to recruit or retain you in the future
during this part of the process?
Process Components (to be inquired about in questions 1-4)
Before you worked there Pre-Recruiting: What is your exposure to the agency which made you want to apply?
Recruiting: Before submitting an application
Application process: Applying to the agency
Interview/Accepting an offer: self-explanatory
While you worked there Orientation to the agency: Getting on board
Your actual job duties: Your day-to-day responsibilities
Activities at work, not directly tied to your job
After you worked there Debriefing
Ongoing communication with the agency
5. Planning to work there any time after graduation, why or why not?
6. Were there any programs that you utilized to get your job, or that you plan to use in the future?
7. What were your overall impressions of the agency?