Embed Size (px)
Citation preview
2013Annual Report
(Incorporated in Bermuda with Limited Liability)
Orient Overseas (International) Limited
Orient Overseas (International) Limited Annual Report 2013
Corporate profileOrient Overseas (International) Limited (“OOIL”), a company with total revenues in excess of US$6.0 billion, has principal business activities in container transport and logistics services. Listed on The Stock Exchange of Hong Kong, the OOIL Group has more than 320 offices in 65 countries.
Orient Overseas Container Line and OOCL are trade names for transportation provided separately by Orient Overseas Container Line Limited (“OOCLL”) and OOCL (Europe) Limited respectively and both are wholly-owned subsidiaries of OOIL. OOCL is one of the world’s largest integrated international transportation, logistics and terminal companies, and is an industry leader in the use of information technology and e-commerce to manage the entire cargo transport process. OOCL’s modern fleet today includes some of the youngest, largest, fuel efficient, and environmentally friendly vessels carrying cargo on hundreds of trade routes around the world providing a vital link in Global Trade.
Orient Overseas (International) Limited Annual Report 2013 1
Contents
1 Contents 2 Financial Highlights 3 Significant Events – 2013 6 Chairman’s Letter 10 Operations Review 14 Major Customers and Suppliers 16 Corporate Responsibility 23 Financial Review 38 Board of Directors 42 Senior Management 43 Shareholder Section 43 Financial Calendar 44 Shareholder Information 46 Corporate Governance Report 72 Report of the Directors
79 Index – Financial Information 80 Independent Auditor’s Report 81 Financial Statements 81 Consolidated Profit and Loss Account 82 Consolidated Statement of Comprehensive Income 83 Consolidated Balance Sheet 85 Balance Sheet 86 Consolidated Cash Flow Statement 87 Consolidated Statement of Changes in Equity 88 Notes to the Consolidated Accounts 145 Principal Subsidiaries, Associated Companies and Jointly Controlled Entities 155 Other Information 155 Fleet and Container Information 158 Terminal Information 159 10-Year Financial Summary 160 Corporate Information
Orient Overseas (International) Limited Annual Report 20132
Financial Highlights
2012 2013201120102009
2,000
1,000
0
-1,000
US$M
20%
10%
0%
-10%
Operating profit margin (R.H.S.)
Profit for the year (L.H.S.)
US$
2012 2013201120102009
10
8
6
4
2
0
-2
100%
80%
60%
40%
20%
0%
-20%
Return on Average Ordinary Shareholders’ Equity (R.H.S.)
Net Asset Value per Ordinary Share (L.H.S.)
US$M 2013 2012
Increase/(decrease)
%
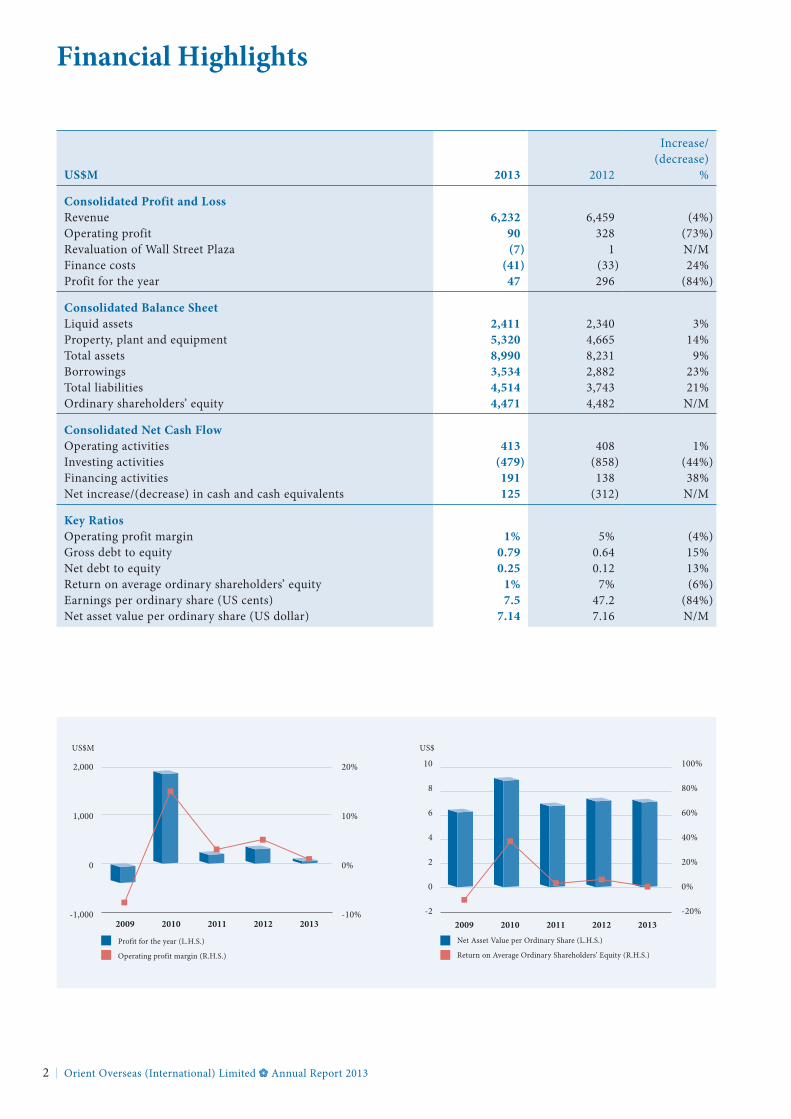
Consolidated profit and lossRevenue 6,232 6,459 (4%)Operating profit 90 328 (73%)Revaluation of Wall Street Plaza (7) 1 N/MFinance costs (41) (33) 24%Profit for the year 47 296 (84%)
Consolidated Balance SheetLiquid assets 2,411 2,340 3%Property, plant and equipment 5,320 4,665 14%Total assets 8,990 8,231 9%Borrowings 3,534 2,882 23%Total liabilities 4,514 3,743 21%Ordinary shareholders’ equity 4,471 4,482 N/M
Consolidated Net Cash flowOperating activities 413 408 1%Investing activities (479) (858) (44%)Financing activities 191 138 38%Net increase/(decrease) in cash and cash equivalents 125 (312) N/M
Key ratiosOperating profit margin 1% 5% (4%)Gross debt to equity 0.79 0.64 15%Net debt to equity 0.25 0.12 13%Return on average ordinary shareholders’ equity 1% 7% (6%)Earnings per ordinary share (US cents) 7.5 47.2 (84%)Net asset value per ordinary share (US dollar) 7.14 7.16 N/M
1
2 3 3
1
Significant Events – 2013
Orient Overseas (International) Limited Annual Report 2013 3
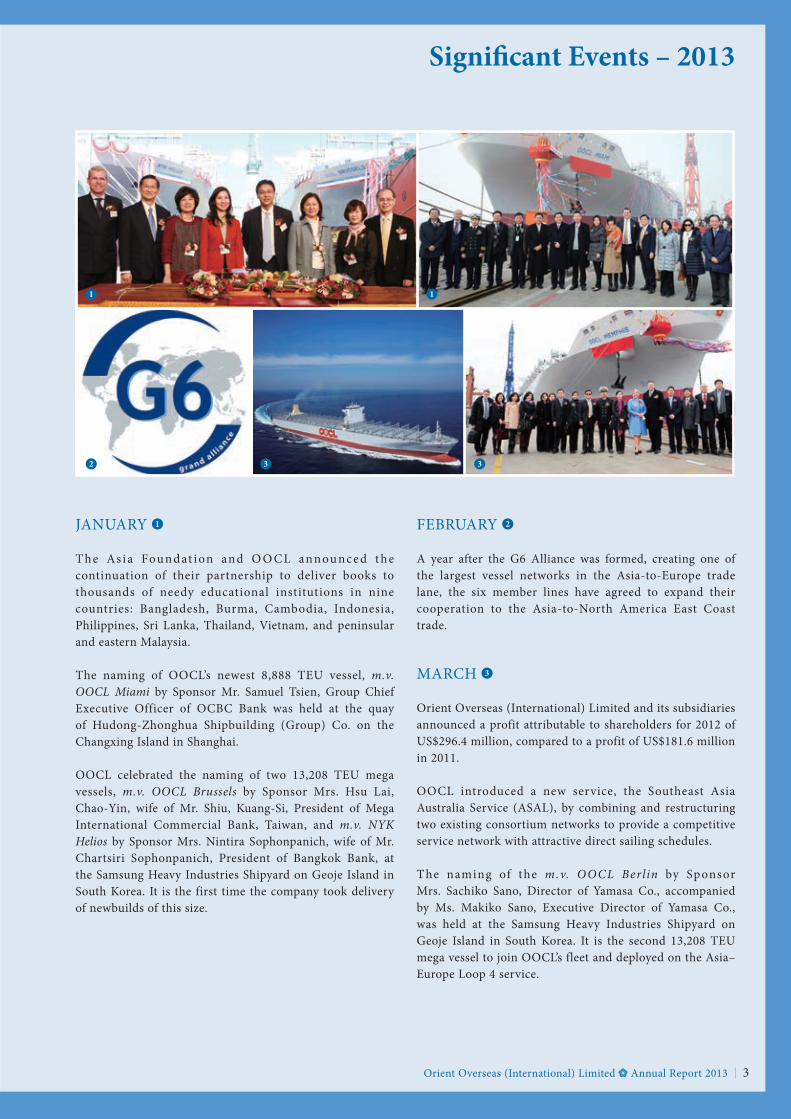
JANUARy 1
T he As i a Fou nd at i on and O O C L an nou nc e d t he continuation of their partnership to deliver books to thousands of needy educational institutions in nine countries: Bangladesh, Burma, Cambodia, Indonesia, Philippines, Sri Lanka, Thailand, Vietnam, and peninsular and eastern Malaysia.
The naming of OOCL’s newest 8,888 TEU vessel, m.v. OOCL Miami by Sponsor Mr. Samuel Tsien, Group Chief Executive Officer of OCBC Bank was held at the quay of Hudong-Zhonghua Shipbuilding (Group) Co. on the Changxing Island in Shanghai.
OOCL celebrated the naming of two 13,208 TEU mega vessels, m.v. OOCL Brussels by Sponsor Mrs. Hsu Lai, Chao-yin, wife of Mr. Shiu, Kuang-Si, President of Mega International Commercial Bank, Taiwan, and m.v. NYK Helios by Sponsor Mrs. Nintira Sophonpanich, wife of Mr. Chartsiri Sophonpanich, President of Bangkok Bank, at the Samsung Heavy Industries Shipyard on Geoje Island in South Korea. It is the first time the company took delivery of newbuilds of this size.
FEBRUARy 2
A year after the G6 Alliance was formed, creating one of the largest vessel networks in the Asia-to-Europe trade lane, the six member lines have agreed to expand their cooperation to the Asia-to-North America East Coast trade.
MARCH 3
Orient Overseas (International) Limited and its subsidiaries announced a profit attributable to shareholders for 2012 of US$296.4 million, compared to a profit of US$181.6 million in 2011.
OOCL introduced a new service, the Southeast Asia Australia Service (ASAL), by combining and restructuring two existing consortium networks to provide a competitive service network with attractive direct sailing schedules.
The naming of the m.v. O O CL Berlin by Sponsor Mrs. Sachiko Sano, Director of yamasa Co., accompanied by Ms. Makiko Sano, Executive Director of yamasa Co., was held at the Samsung Heavy Industries Shipyard on Geoje Island in South Korea. It is the second 13,208 TEU mega vessel to join OOCL’s fleet and deployed on the Asia–Europe Loop 4 service.
7 6 6
4 5
Significant Events – 2013
Orient Overseas (International) Limited Annual Report 20134
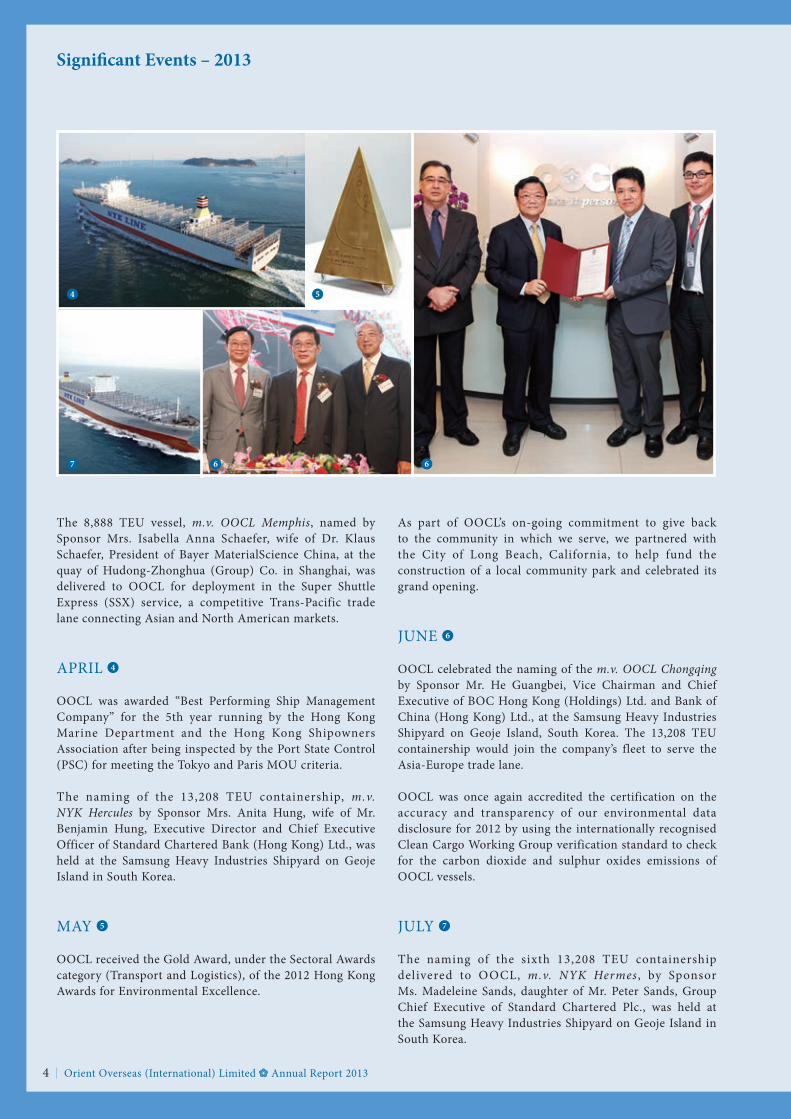
The 8,888 TEU vessel, m.v. OOCL Memphis, named by Sponsor Mrs. Isabella Anna Schaefer, wife of Dr. Klaus Schaefer, President of Bayer MaterialScience China, at the quay of Hudong-Zhonghua (Group) Co. in Shanghai, was delivered to OOCL for deployment in the Super Shuttle Express (SSX) service, a competitive Trans-Pacific trade lane connecting Asian and North American markets.
APRIL 4
OOCL was awarded “Best Performing Ship Management Company” for the 5th year running by the Hong Kong Marine Department and the Hong Kong Shipowners Association after being inspected by the Port State Control (PSC) for meeting the Tokyo and Paris MOU criteria.
The naming of the 13,208 TEU containership, m.v. NYK Hercules by Sponsor Mrs. Anita Hung, wife of Mr. Benjamin Hung, Executive Director and Chief Executive Officer of Standard Chartered Bank (Hong Kong) Ltd., was held at the Samsung Heavy Industries Shipyard on Geoje Island in South Korea.
MAy 5
OOCL received the Gold Award, under the Sectoral Awards category (Transport and Logistics), of the 2012 Hong Kong Awards for Environmental Excellence.
As part of OOCL’s on-going commitment to give back to the community in which we serve, we partnered with the City of Long Beach, California, to help fund the construction of a local community park and celebrated its grand opening.
JUNE 6
OOCL celebrated the naming of the m.v. OOCL Chongqing by Sponsor Mr. He Guangbei, Vice Chairman and Chief Executive of BOC Hong Kong (Holdings) Ltd. and Bank of China (Hong Kong) Ltd., at the Samsung Heavy Industries Shipyard on Geoje Island, South Korea. The 13,208 TEU containership would join the company’s fleet to serve the Asia-Europe trade lane.
OOCL was once again accredited the certification on the accuracy and transparency of our environmental data disclosure for 2012 by using the internationally recognised Clean Cargo Working Group verification standard to check for the carbon dioxide and sulphur oxides emissions of OOCL vessels.
JULy 7
The naming of the sixth 13,208 TEU containership delivered to OOCL, m.v. NYK Hermes , by Sponsor Ms. Madeleine Sands, daughter of Mr. Peter Sands, Group Chief Executive of Standard Chartered Plc., was held at the Samsung Heavy Industries Shipyard on Geoje Island in South Korea.
8 9 11
8 10
Significant Events – 2013
Orient Overseas (International) Limited Annual Report 2013 5
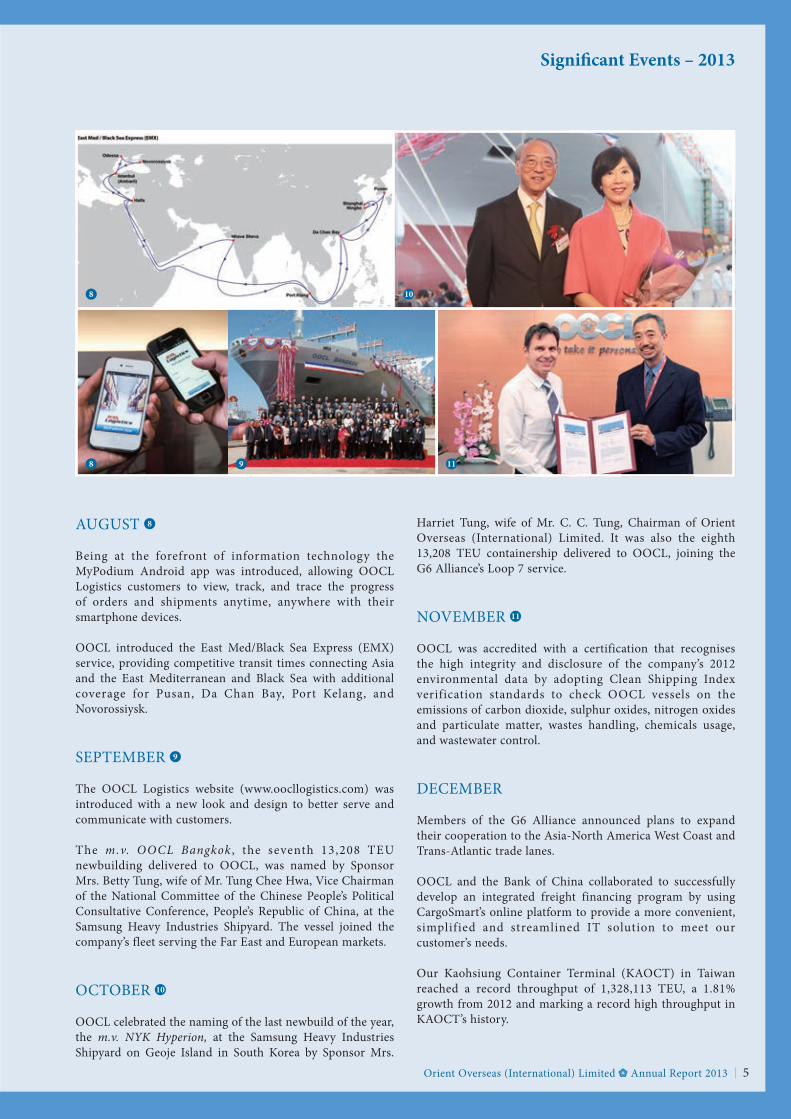
AUGUST 8
Being at the forefront of information technology the MyPodium Android app was introduced, allowing OOCL Logistics customers to view, track, and trace the progress of orders and shipments anytime, anywhere with their smartphone devices.
OOCL introduced the East Med/Black Sea Express (EMX) service, providing competitive transit times connecting Asia and the East Mediterranean and Black Sea with additional coverage for Pusan, Da Chan Bay, Port Kelang, and Novorossiysk.
SEPTEMBER 9
The OOCL Logistics website (www.oocllogistics.com) was introduced with a new look and design to better serve and communicate with customers.
The m.v. OOCL Bangkok , the seventh 13,208 TEU newbuilding delivered to OOCL, was named by Sponsor Mrs. Betty Tung, wife of Mr. Tung Chee Hwa, Vice Chairman of the National Committee of the Chinese People’s Political Consultative Conference, People’s Republic of China, at the Samsung Heavy Industries Shipyard. The vessel joined the company’s fleet serving the Far East and European markets.
OCTOBER 10
OOCL celebrated the naming of the last newbuild of the year, the m.v. NYK Hyperion, at the Samsung Heavy Industries Shipyard on Geoje Island in South Korea by Sponsor Mrs.
Harriet Tung, wife of Mr. C. C. Tung, Chairman of Orient Overseas (International) Limited. It was also the eighth 13,208 TEU containership delivered to OOCL, joining the G6 Alliance’s Loop 7 service.
NOVEMBER 11
OOCL was accredited with a certification that recognises the high integrity and disclosure of the company’s 2012 environmental data by adopting Clean Shipping Index verification standards to check OOCL vessels on the emissions of carbon dioxide, sulphur oxides, nitrogen oxides and particulate matter, wastes handling, chemicals usage, and wastewater control.
DECEMBER
Members of the G6 Alliance announced plans to expand their cooperation to the Asia-North America West Coast and Trans-Atlantic trade lanes.
OOCL and the Bank of China collaborated to successfully develop an integrated freight financing program by using CargoSmart’s online platform to provide a more convenient, simplified and streamlined IT solution to meet our customer’s needs.
Our Kaohsiung Container Terminal (KAOCT) in Taiwan reached a record throughput of 1,328,113 TEU, a 1.81% growth from 2012 and marking a record high throughput in KAOCT’s history.
Chairman’s letter
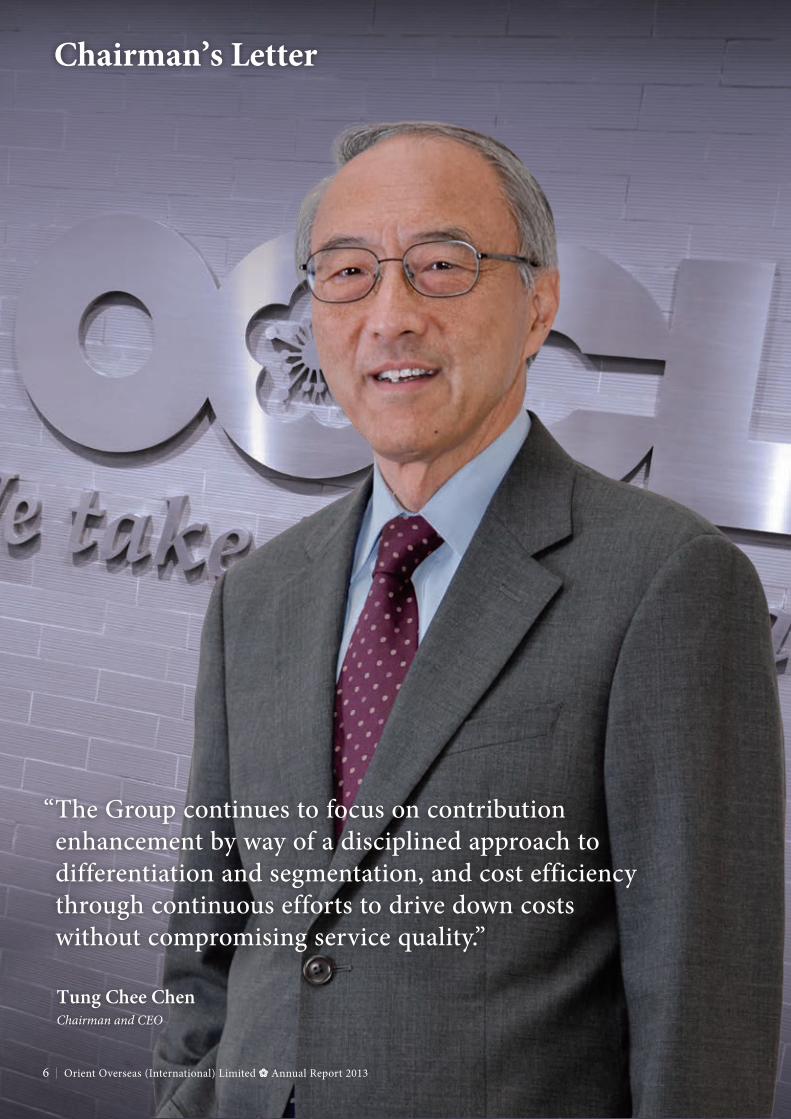
“The Group continues to focus on contribution enhancement by way of a disciplined approach to differentiation and segmentation, and cost efficiency through continuous efforts to drive down costs without compromising service quality.”
Tung Chee ChenChairman and CEO
Orient Overseas (International) Limited Annual Report 20136
Chairman’s Letter
Orient Overseas (International) Limited Annual Report 2013 7
The year 2013 was seemingly characterised by the US and Eurozone economies turning the corner. Optimism for the US recovery led to gains in the financial markets earlier in the year. In addition, the belief that the Eurozone had reached bottom, the positive expectations of Abenomics, and the underlying investor confidence in a moderate-but-sustainable growth environment in China injected a degree of positive sentiment into the markets. By the end of the year, many major equity markets reported healthy gains, reflecting investor forward optimism.
Looking back, the confidence in the financial markets during 2013 seems to have run ahead of the physical market. Seaborne trade growth for the liner industry was subdued in 2013. Freight levels were disappointing, especially during the first half of the year. During the second half of the year, both physical cargo movement and sentiment improved, resulting in a slightly better freight market. Although container shipping demand growth in 2013 was slower than earlier forecasts, capacity supply growth was also slower than forecasts. These conditions helped contribute to a mild recovery in rates during the second half of the year.
Looking ahead, the industry will continue to be challenged by supply and demand imbalances which will exert pressure on freight rates. At the same time, the persistently high bunker prices, the anticipation of newbuilding deliveries, and the emergence of even larger alliances have led the industry to look further into cost rationalisation through operational management efforts, and additional efficiency gains through building scale and forming alliances. I expect these industry trends to continue for the foreseeable future. The IMF forecasts a further improvement of global GDP growth to 3.6% in 2014, from 2.9% in 2013, and anticipates better prospects for developed economies such as the US and core Eurozone economies together with a deceleration of growth in emerging markets. These developments may inject some positive sentiment into the major East-West trades for the industry, which would hopefully help arrest any potential freight rate deterioration due to over capacity in these trades.
Orient Overseas (International) Limited and its subsidiaries (the “Group”) was profitable for the year, recording a profit attributable to shareholders for 2013 of US$47.0 million. Earnings per ordinary share in 2013 was US7.5 cents.
In 2012, the Group reported a profit of US$295.4 million. Earnings per ordinary share in 2012 was US47.2 cents.
The Board of Directors recommends the payment of a final ordinary dividend of US1.88 cents (HK$0.147) per share to shareholders for 2013. This represents a total ordinary dividend payout of 25% of the profit attributable to shareholders for 2013.
The liner shipping industry is intricately linked with world trade. Global trade growth, whether by way of economic growth or adjustments in the supply chain processes such as outsourcing, is the primary driver for liner shipping demand. Looking forward, the industry faces two challenges. On the demand side, the likelihood of global trade growth repeating its high growth performance during the last decade is low. In addition, much of the outsourcing processes of the major developed nations have been completed. The result is that global world trade growth and the multiplier effect on container demand will be under pressure. Economists forecast that GDP-to-container multiple for the half decade starting from 2013 may be half of that during the 2002 – 2007 period. On the supply side, high bunker costs have led to available technological improvements and the focus on economies of scale of larger vessels. Together with the immense capacity of the shipyards, it is perhaps unavoidable that the industry will and can continue to place newbuilding orders in an effort to gain unit cost competitiveness. While the average age of scrapping has become younger, it is typical for the industry to see enhanced scrapping only when the operating results become unsustainable. If the situation remains unchanged, the net effect of such supply and demand dynamics is that the overcapacity will become a multi-year challenge for the industry.
Orient Overseas (International) Limited Annual Report 20138
Chairman’s Letter
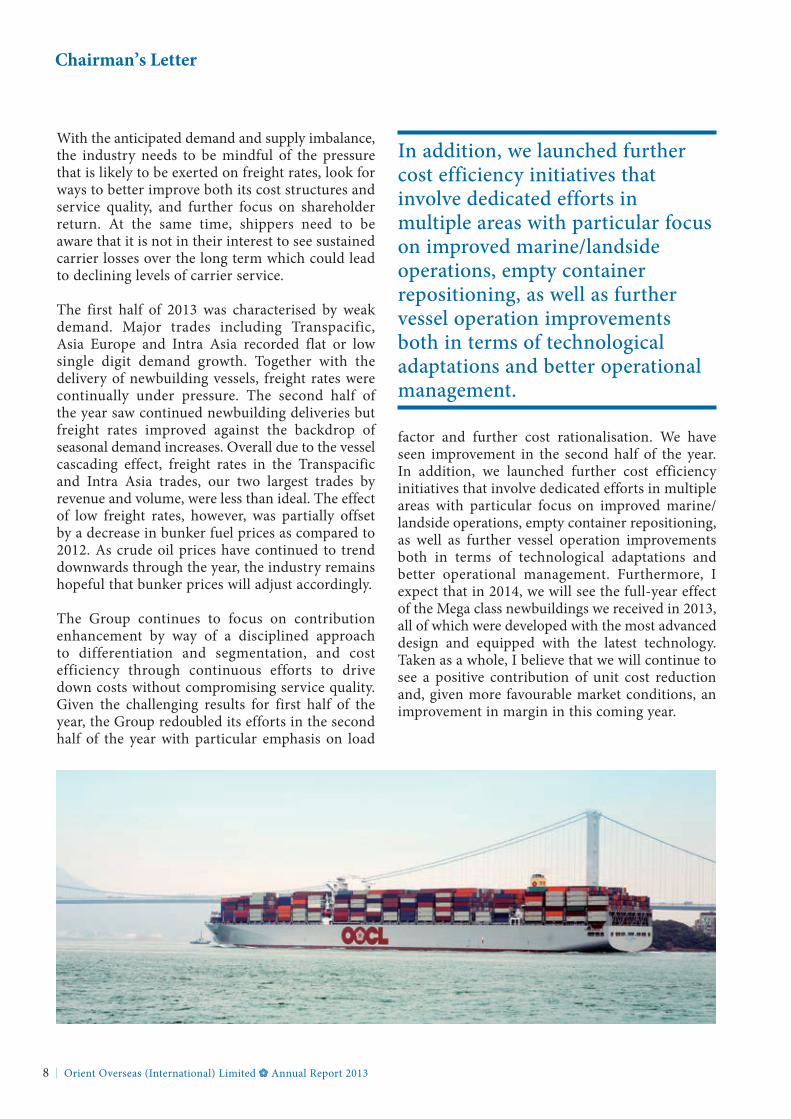
factor and further cost rationalisation. We have seen improvement in the second half of the year. In addition, we launched further cost efficiency initiatives that involve dedicated efforts in multiple areas with particular focus on improved marine/landside operations, empty container repositioning, as well as further vessel operation improvements both in terms of technological adaptations and better operational management. Furthermore, I expect that in 2014, we will see the full-year effect of the Mega class newbuildings we received in 2013, all of which were developed with the most advanced design and equipped with the latest technology. Taken as a whole, I believe that we will continue to see a positive contribution of unit cost reduction and, given more favourable market conditions, an improvement in margin in this coming year.
In addition, we launched further cost efficiency initiatives that involve dedicated efforts in multiple areas with particular focus on improved marine/landside operations, empty container repositioning, as well as further vessel operation improvements both in terms of technological adaptations and better operational management.
With the anticipated demand and supply imbalance, the industry needs to be mindful of the pressure that is likely to be exerted on freight rates, look for ways to better improve both its cost structures and service quality, and further focus on shareholder return. At the same time, shippers need to be aware that it is not in their interest to see sustained carrier losses over the long term which could lead to declining levels of carrier service.
The first half of 2013 was characterised by weak demand. Major trades including Transpacific, Asia Europe and Intra Asia recorded flat or low single digit demand growth. Together with the delivery of newbuilding vessels, freight rates were continually under pressure. The second half of the year saw continued newbuilding deliveries but freight rates improved against the backdrop of seasonal demand increases. Overall due to the vessel cascading effect, freight rates in the Transpacific and Intra Asia trades, our two largest trades by revenue and volume, were less than ideal. The effect of low freight rates, however, was partially offset by a decrease in bunker fuel prices as compared to 2012. As crude oil prices have continued to trend downwards through the year, the industry remains hopeful that bunker prices will adjust accordingly.
The Group continues to focus on contribution enhancement by way of a disciplined approach to differentiation and segmentation, and cost efficiency through continuous efforts to drive down costs without compromising service quality. Given the challenging results for first half of the year, the Group redoubled its efforts in the second half of the year with particular emphasis on load
Orient Overseas (International) Limited Annual Report 2013 9
Chairman’s Letter
The Group is working with the Port of Long Beach to combine and upgrade two shipping terminals. The Middle Harbor Redevelopment Project, with its final phase scheduled for completion in 2019, will be the most competitive, efficient and environmentally friendly container facility in North America. We expect the project to provide tangible benefits to OOCL’s competitiveness going forward.
After a period of consolidation and re-positioning, the Group continues to strengthen and grow its logistics business, particularly in the areas of international supply chain, import/export services, domestic transportation and warehousing services. The footprint of this business has grown to 130 offices in 30 countries. We expect the logistics business will become a meaningful contributor to the Group over the long term.
The Group remains committed to investing and developing industry-leading information technology. Our IT capability has allowed us to enjoy a meaningful competitive advantage both by being able to offer shipment transparency and achieve operational efficiency. We continue to upgrade our operating system and data analytics to enable better forward planning and yield management. In addition, we continue to build service platforms and third-party products which enable our customers to better manage their own supply chain needs. We believe these efforts are critical to enhancing product quality, improving our underlying business efficiency, and acting as a catalyst in helping us to think about how the industry will evolve.
Despite taper-related market reactions during the second half of the year, debt availability for capital expenditure programs remained accessible and cost-effective. We do not expect this to change in 2014. We remain focused and deliberate in our efforts to maintain a sustainable balance sheet that allows the Group the ability to retain the widest degree of initiative and flexibility as a competitive edge. We remain committed to ensuring an appropriate balance between adequate liquidity and efficient capital structure suitable to our industry.
Given the anticipated low growth rate in container demand and the resulting supply and demand dynamics, it is imperative that the industry focus on yield management, cost efficiency and service
quality. Alliance remains one of the key elements for carriers in terms of cost efficiency optimisation and improved service coverage, and is an integral part of the industry. We will continue to work with partners to ensure that our partnership and alliance products are efficient and competitive.
In 2014, we anticipate that further tonnage growth will lead to continued overcapacity. It is forecasted, however, that the demand growth in 2014 will outpace that of 2013. With the US recovery now a consensus, Eurozone recovery on more solid ground, and the current Chinese and Japanese economic growth trajectory, we should expect a healthier trade outlook despite recent uncertainty in emerging markets. This is especially true on the major East-West trades. Indeed, such development should mean improved outlook for the Transpacific, Asia Europe and Intra Asia trades and more positive results for the industry as a whole.
The Group continues to be an industry leader in terms of operational excellence and financial robustness. The Group is well placed for the future in its ability to deliver superior performance, upgrade its assets, and form effective alliances and partnerships in its determination to provide the best possible service quality at the most cost-efficient level possible. The industry has endured a volatile period since the global financial crisis in 2008. As the global economy reaches its next stage of development almost six years after the crisis, the Group today is even more focused and financially prepared to deliver superior products and services to its customers around the world. We look forward to furthering our position as one of the leading carriers in the industry.
C C tungChairmanHong Kong, 7th March 2014
The Middle Harbor Redevelopment Project with the Port of Long Beach when completed in 2019 will be the most competitive, efficient and environmentally friendly container facility in North America.
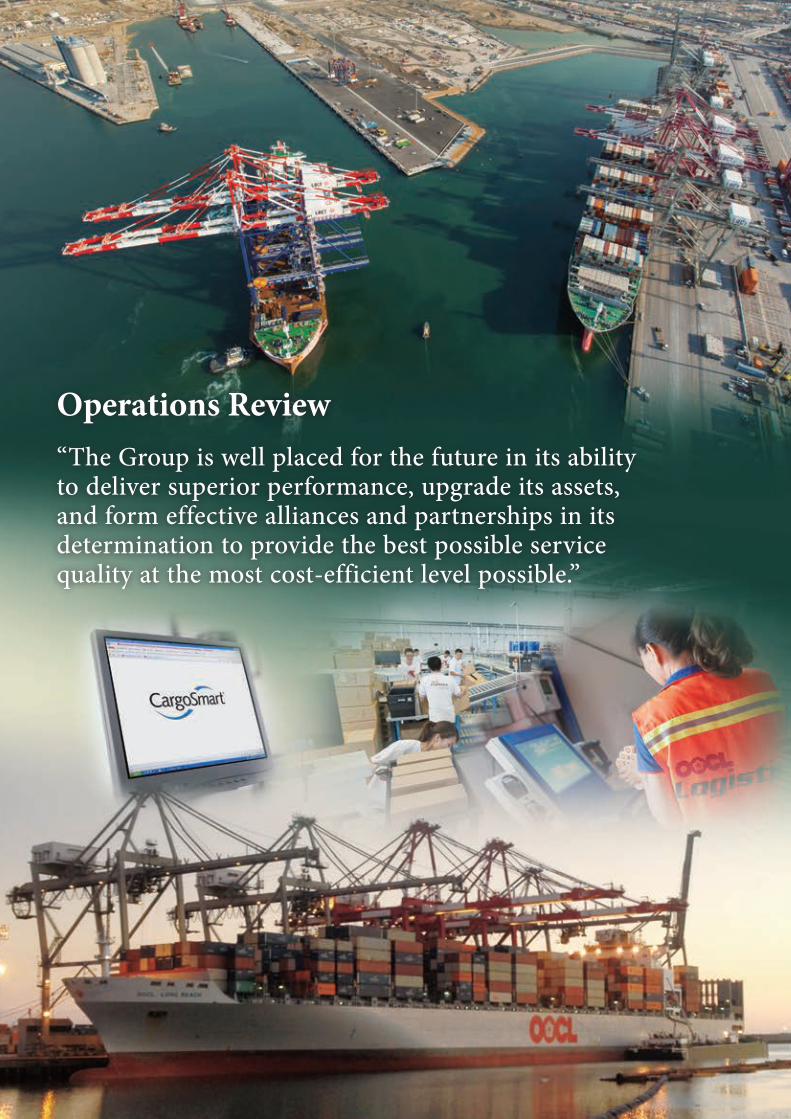
operations review“The Group is well placed for the future in its ability to deliver superior performance, upgrade its assets, and form effective alliances and partnerships in its determination to provide the best possible service quality at the most cost-efficient level possible.”
Operations Review
Orient Overseas (International) Limited Annual Report 2013 11
CoNtaiNer traNSport aND loGiStiCSThe capacity overhang in the industry continued to challenge the liner business in 2013. Industry newbuilding deliveries in 2013 reached a record high, with a total tonnage of nearly 1.4 million TEU. After scrapping of older tonnage totalling around 440,000 TEU in 2013, overall global capacity supply grew 5.7% in the market, against a global cargo demand growth of 4.2%.
The deployment of the largest newbuildings to the Asia-Europe trade triggered cascading into the Trans-Pacific trade, which in turn further displaced a considerable number of mid-sized ships to other trade lanes. This cascading effect brought considerable excess capacity to the Intra-Asia and Australasia trades as well as the Trans-Pacific trade, and added volatility to the market.
The influx of newbuildings also impacted productivity at many of the busiest terminals and ports around the world, especially those facilities that lack adequate investment and resources to effectively handle the ultra large containerships. To maintain quality customer service and, at the same time, optimise cost savings, carriers have been working more closely with terminal and port operators to alleviate the impact on customers’ global supply chain flow.
While cost efficiency enhancement is the primary focus of carriers in the prevailing challenging markets, closer cooperation with alliance partners is also an important element that allows carriers to optimise resources and offer competitive services to customers. In mid-2013, the world’s three largest carriers by tonnage, namely Maersk, MSC and CMA-CGM, announced plans to form the P3 consortium and intend to be operational in the second quarter of 2014. The G6 Alliance, in which OOCL is a member, is already active in the Asia-Europe and Trans-Pacific US East Coast Trades. The Alliance announced in December 2013 to expand cooperation to the Trans-Pacific US West Coast and the Trans-Atlantic Trades, and are in dialogue with relevant regulatory bodies. A possible strengthening in the cooperation between Evergreen Line and the CKyH consortium had also been reported by the media.
Supported by the rebound in the Trans-Pacific and Asia-Europe Trade volumes in the latter part of the year, and together with a deeper market penetration into the Intra-Asia and Australasia Trades, OOCL total liftings in the fourth quarter increased by 10% when compared to the same quarter of the previous year, overcoming the lifting decline during the early parts of 2013. Overall, 2013 annual volume increased 1.5% year-on-year. Rate level, however, was highly volatile and impacted by the surplus capacity. Total revenue in 2013 dropped 4.9%.
Operations Review
Orient Overseas (International) Limited Annual Report 201312
vessel utilisation. OOCL optimised deployment and expanded capacity in selected sectors, and continued to focus on unit cost efficiency through consortia arrangements. New tonnage impacted the Asia-Australia trade lane and brought instability in this market. Supply and demand however, reached a better balance toward the latter part of the year and brought revenue back to a more sustainable level.
SHip operatioNSAs at 31st December 2013, the OOCL fleet composition was as follows:
fleet No. of Vessels teU Capacity
Owned/Long Term Chartered 61 434,300Short Term Chartered 40 138,827Chartered Out (7) (77,021)
Operating Capacity 94 496,106
liftiNG (’000 teU) reVeNUe (US$ million)
Trade 2013 2012 Variance 2013 2012 Variance
Trans-Pacific 1,233 1,253 (1.6%) 1,921 1,989 (3.4%)Asia-Europe 844 885 (4.6%) 1,026 1,158 (11.4%)Trans-Atlantic 395 408 (3.2%) 615 660 (6.8%)Intra-Asia/Australasia 2,822 2,671 5.7% 2,047 2,092 (2.2%)
Total 5,294 5,217 1.5% 5,609 5,899 (4.9%)
Growth in 2013ooCl liner teU revenue revenue/teU
Q1 (0.3%) 3.6% 3.9%Q2 (2.6%) (9.8%) (7.3%)Q3 (0.9%) (10.1%) (9.4%)Q4 10.0% (1.6%) (10.5%)
Total 1.5% (4.9%) (6.3%)
trans-pacific – The Trans-Pacific Trade continued to face challenges in 2013 as tonnage cascaded into the trade creating excess supply. Eastbound market rate levels remained under pressure throughout the year as supply and demand continued to be out of balance. Competition also remained fierce for the US export market, bringing rates further down to unsustainable levels.
asia-europe – The rate level in the Asia-Europe westbound trade was characterised by volatility with frequent rate reductions and subsequent rate restoration programs. Mega size newbuildings continued to be deployed into the trade. The G6 Alliance expects its upsizing program for North Europe to be completed in the second half of 2014. After the G6 Alliance terminated the direct Asia-Black Sea service in August, OOCL continued the same direct coverage through cooperation with ZIM Line. OOCL reduced capacity between the Indian-subcontinent and North Europe from April 2013 due to the termination of a joint service.
trans-atlantic – Transatlantic trade volume saw limited growth in both directions in 2013. Capacity growth on both Eastbound and Westbound due to cascading put pressure on freight rates, leading to freight levels that were below that of 2012. Our volume declined on the Europe – US sector as capacity was reduced through the continuous suspension of the Atlantic Express Shuttle peak season loop and the termination of a slot purchase for the US Gulf and Mexico service in the second half of 2013. Load factor however, slightly improved.
intra-asia and australasia – The Intra-Asia market was seriously impacted by the combined effects of cascading vessels from other long haul trades and the softened demand growth in the Asian market. Freight rates, in particular for the Middle East and India, were under pressure due to unsatisfactory
Operations Review
Orient Overseas (International) Limited Annual Report 2013 13
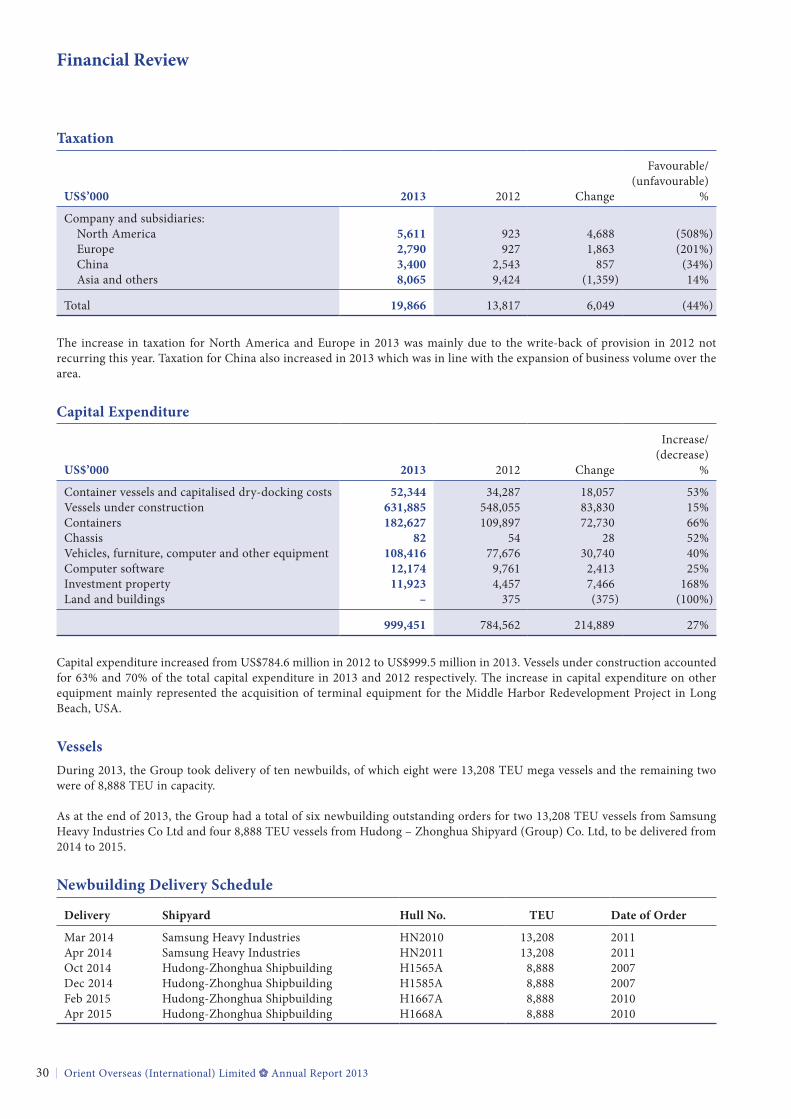
During the year of 2013, the Group took delivery of two ‘SX’ Class 8,888 TEU new vessels from HuDong Zhonghua Shipbuilding in China, and eight ‘Mega’ Class 13,208 TEU new vessels from Samsung Heavy Industries Co., Ltd. in South Korea. The ‘Mega’ Class 13,208 TEU vessels are currently the largest containerships operated by the Group.
Four ‘Mega’ Class 13,208 TEU vessels that were delivered in 2013, named ‘NyK Helios’, ‘NyK Hercules’, ‘NyK Hermes’ and ‘NyK Hyperion’, have all been chartered out to NyK Line under time charter arrangements and have joined the G6 Alliance’s Asia-Europe service.
No orders for new buildings were placed in year 2013. There are two remaining ‘Mega’ Class 13,208 TEU newbuildings to be delivered in the year 2014, and four SX Class 8,888 TEU newbuildings to be delivered in year 2014 and 2015.
As of the end of 2013, OOCL owned 54 vessels with an average age of 5.8 years and an average size of 7,279 TEU.
In view of high bunker prices in 2013, we continued to focus on bunker and cylinder oil saving programs. These programs included initiatives covering technology, optimal routing, continuous optimisation of speed, efficient use of shaft generator, minimum ballast, trim adjustment, and closer communication and coordination between shipboard and shoreside colleagues regarding berthing arrangements, terminal productivity, and intermodal connectivity.
environmental protectionWe remain supportive of international efforts to measure and control shipboard emissions. In 2013, we maintained an average sulphur content of 2.55% in our bunker consumption which compares favourably with the International Maritime Organization (IMO) prescribed standard of 3.5%. All our environment-friendly designed newbuildings from year 2011 onwards have been built with Alternative Maritime Power system (“AMP”) that allows shore based power alternatives. A retrofit program is also underway to allow some of our existing vessels shore power connections and reduced emissions.
In addition to regulatory compliance, we have been participating in various voluntary programs including the Green Flag Program at the Port of Long Beach, Vessel Speed Reduction Program at the Port of Los Angeles, and the Fair Winds Charter and Port Facilities & Light Dues Incentive Scheme in Hong Kong.
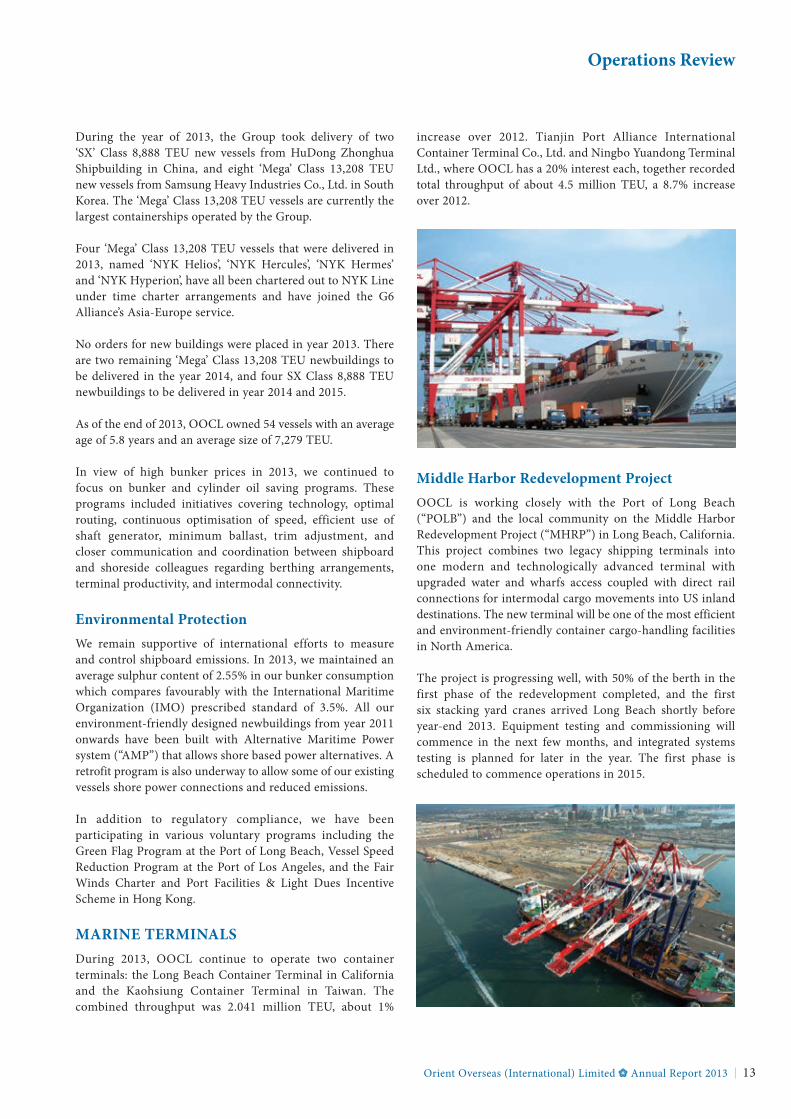
MariNe terMiNalSDuring 2013, OOCL continue to operate two container terminals: the Long Beach Container Terminal in California and the Kaohsiung Container Terminal in Taiwan. The combined throughput was 2.041 million TEU, about 1%
increase over 2012. Tianjin Port Alliance International Container Terminal Co., Ltd. and Ningbo yuandong Terminal Ltd., where OOCL has a 20% interest each, together recorded total throughput of about 4.5 million TEU, a 8.7% increase over 2012.
Middle Harbor redevelopment projectOOCL is working closely with the Port of Long Beach (“POLB”) and the local community on the Middle Harbor Redevelopment Project (“MHRP”) in Long Beach, California. This project combines two legacy shipping terminals into one modern and technologically advanced terminal with upgraded water and wharfs access coupled with direct rail connections for intermodal cargo movements into US inland destinations. The new terminal will be one of the most efficient and environment-friendly container cargo-handling facilities in North America.
The project is progressing well, with 50% of the berth in the first phase of the redevelopment completed, and the first six stacking yard cranes arrived Long Beach shortly before year-end 2013. Equipment testing and commissioning will commence in the next few months, and integrated systems testing is planned for later in the year. The first phase is scheduled to commence operations in 2015.
Operations Review
Orient Overseas (International) Limited Annual Report 201314
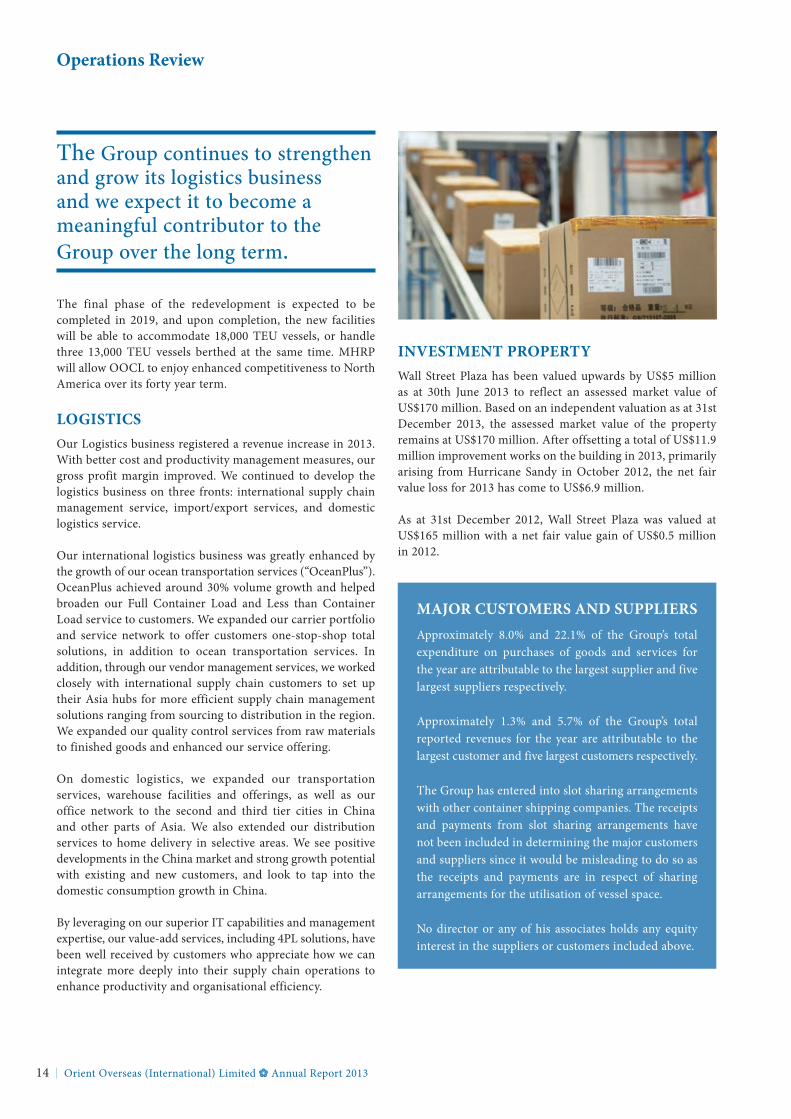
The Group continues to strengthen and grow its logistics business and we expect it to become a meaningful contributor to the Group over the long term.
The final phase of the redevelopment is expected to be completed in 2019, and upon completion, the new facilities will be able to accommodate 18,000 TEU vessels, or handle three 13,000 TEU vessels berthed at the same time. MHRP will allow OOCL to enjoy enhanced competitiveness to North America over its forty year term.
loGiStiCSOur Logistics business registered a revenue increase in 2013. With better cost and productivity management measures, our gross profit margin improved. We continued to develop the logistics business on three fronts: international supply chain management service, import/export services, and domestic logistics service.
Our international logistics business was greatly enhanced by the growth of our ocean transportation services (“OceanPlus”). OceanPlus achieved around 30% volume growth and helped broaden our Full Container Load and Less than Container Load service to customers. We expanded our carrier portfolio and service network to offer customers one-stop-shop total solutions, in addition to ocean transportation services. In addition, through our vendor management services, we worked closely with international supply chain customers to set up their Asia hubs for more efficient supply chain management solutions ranging from sourcing to distribution in the region. We expanded our quality control services from raw materials to finished goods and enhanced our service offering.
On domestic logistics, we expanded our transportation services, warehouse facilities and offerings, as well as our office network to the second and third tier cities in China and other parts of Asia. We also extended our distribution services to home delivery in selective areas. We see positive developments in the China market and strong growth potential with existing and new customers, and look to tap into the domestic consumption growth in China.
By leveraging on our superior IT capabilities and management expertise, our value-add services, including 4PL solutions, have been well received by customers who appreciate how we can integrate more deeply into their supply chain operations to enhance productivity and organisational efficiency.
iNVeStMeNt propertYWall Street Plaza has been valued upwards by US$5 million as at 30th June 2013 to reflect an assessed market value of US$170 million. Based on an independent valuation as at 31st December 2013, the assessed market value of the property remains at US$170 million. After offsetting a total of US$11.9 million improvement works on the building in 2013, primarily arising from Hurricane Sandy in October 2012, the net fair value loss for 2013 has come to US$6.9 million.
As at 31st December 2012, Wall Street Plaza was valued at US$165 million with a net fair value gain of US$0.5 million in 2012.
Major CUStoMerS aND SUpplierSApproximately 8.0% and 22.1% of the Group’s total expenditure on purchases of goods and services for the year are attributable to the largest supplier and five largest suppliers respectively.
Approximately 1.3% and 5.7% of the Group’s total reported revenues for the year are attributable to the largest customer and five largest customers respectively.
The Group has entered into slot sharing arrangements with other container shipping companies. The receipts and payments from slot sharing arrangements have not been included in determining the major customers and suppliers since it would be misleading to do so as the receipts and payments are in respect of sharing arrangements for the utilisation of vessel space.
No director or any of his associates holds any equity interest in the suppliers or customers included above.
Operations Review
Orient Overseas (International) Limited Annual Report 2013 15
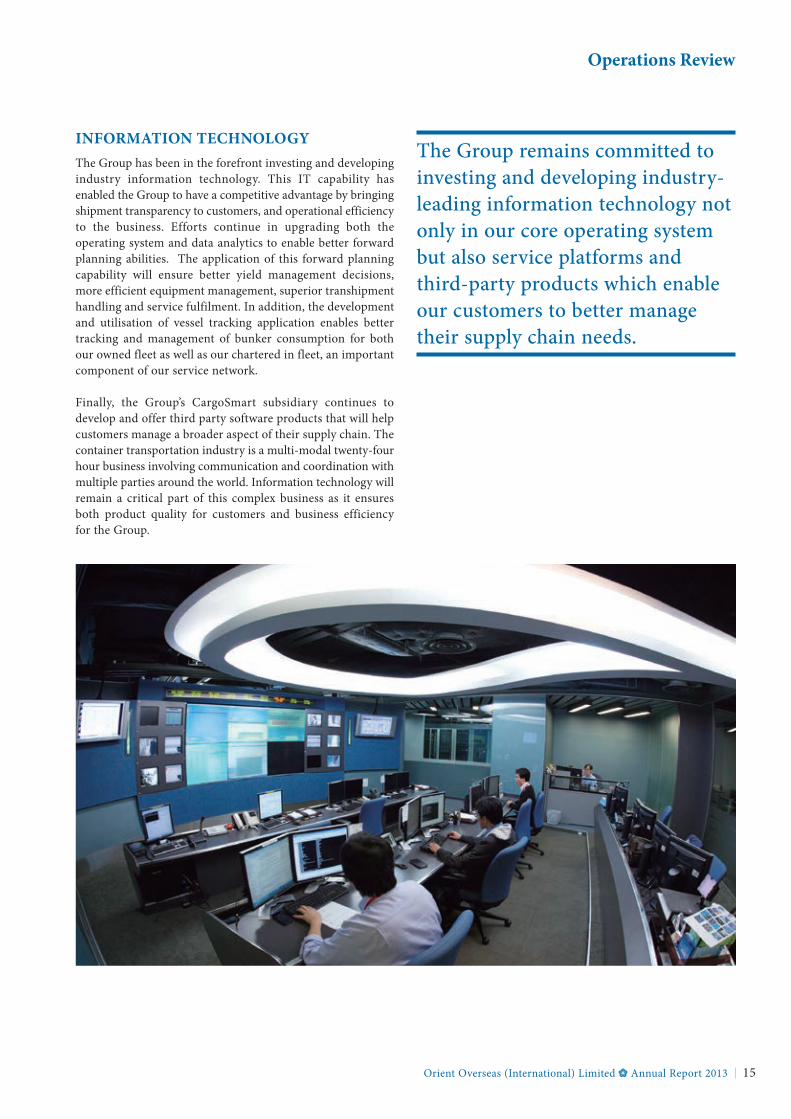
iNforMatioN teCHNoloGYThe Group has been in the forefront investing and developing industry information technology. This IT capability has enabled the Group to have a competitive advantage by bringing shipment transparency to customers, and operational efficiency to the business. Efforts continue in upgrading both the operating system and data analytics to enable better forward planning abilities. The application of this forward planning capability will ensure better yield management decisions, more efficient equipment management, superior transhipment handling and service fulfilment. In addition, the development and utilisation of vessel tracking application enables better tracking and management of bunker consumption for both our owned fleet as well as our chartered in fleet, an important component of our service network.
Finally, the Group’s CargoSmart subsidiary continues to develop and offer third party software products that will help customers manage a broader aspect of their supply chain. The container transportation industry is a multi-modal twenty-four hour business involving communication and coordination with multiple parties around the world. Information technology will remain a critical part of this complex business as it ensures both product quality for customers and business efficiency for the Group.
The Group remains committed to investing and developing industry-leading information technology not only in our core operating system but also service platforms and third-party products which enable our customers to better manage their supply chain needs.
16 Orient Overseas (International) Limited Annual Report 2013
Corporate responsibility
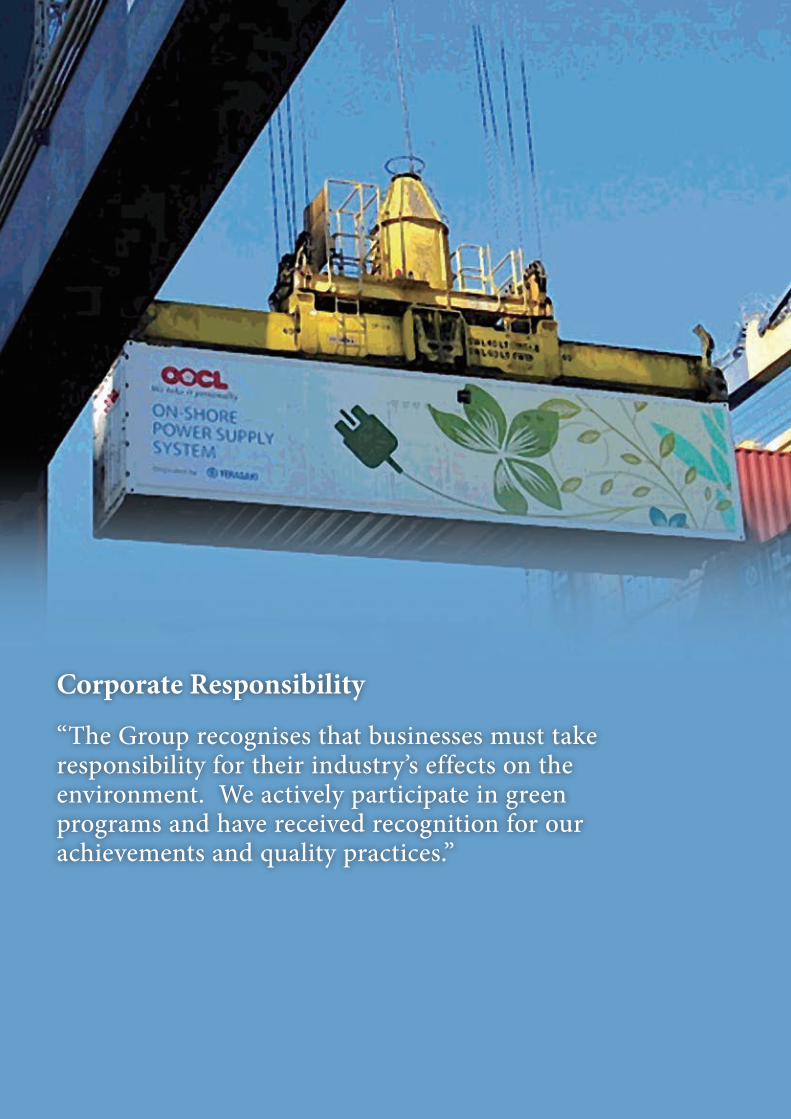
“The Group recognises that businesses must take responsibility for their industry’s effects on the environment. We actively participate in green programs and have received recognition for our achievements and quality practices.”
17Orient Overseas (International) Limited Annual Report 2013
Corporate Responsibility
The Group prides itself upon being a responsible corporate citizen and it employs the highest standards of business ethics in all that it does. Headed by a senior management Steering Committee and a Global Security, Safety and Environment Care Officer, the Group embraces the core values of Corporate Social Responsibility at all levels.
The Group places the utmost importance on environmental care and community support. Despite the current difficult economic environment, we must continue to address the long-term threat of climate change. We strive to play our part in tackling this global problem through engagement with organisations such as the Business Environment Council, the Clean Cargo Working Group and the World Wildlife Fund. Throughout the year, the Group has won awards and accolades for its environmental performance, and OOIL Group employees around the world have been actively supporting their local communities through various environmental initiatives.
environmental CareThe Group recognises that businesses must take responsibility for their industry’s effects on the environment. Our company is dedicated to meeting the needs of the present without compromising those of the future. We encourage sustainable economic development through innovative environmental care measures and believe that by taking a proactive role in caring for the environment, we can help minimise our carbon footprint, improve air quality and make the world a better place to live for ourselves and future generations.
We actively participate in green programs and have received recognition for our achievements and quality practices, including:
the Safety, Quality and environmental (SQe) Management System Certificate – OOCL was the first container shipping line in the world to have achieved the SQE certification which consolidates the ISM-Code, ISO 9001 and ISO 14001 requirements.
Vessel Speed reduction programs – Each year, OOCL has been fully compliant to reducing vessel speed when entering within both 20 and 40 nautical miles of the Port of Long Beach and Port of Los Angeles harbors. Our efforts have effectively contributed to improving the air quality by reducing emissions such as smog forming nitrogen oxides (NOx), diesel particulate matter and greenhouse gases. Port officials estimate that if all vessels comply with the program, the amount of NOx produced by container ships would be reduced by nearly 550 tons a year.
Ballast Water Management program – All container ships discharge ballast water, which can contain organisms that are harmful to the environment. We have a policy of exchanging ballast water only in the open sea (200 nautical miles away from the nearest coastline) and aim to achieve zero ballast water exchange when berthed at the port.
Hong Kong awards for environmental excellence – Gold award – OOCL received the Gold Award, under the Sectoral Awards category (Transport and Logistics), of the 2012 Hong Kong Awards for Environmental Excellence (HKAEE) on 2nd May 2013. The HKAEE is recognised by the community as one of the most prestigious and reputable environmental award schemes in Hong Kong. It encourages businesses and organisations to embrace green management and innovation and offering the opportunity to benchmark their environmental performance.
In this fifth annual award, 776 applicants competed in 11 industry sectors. In considering OOCL for the gold standing, the Award recognises a company’s commitment and drive to achieving environmental objectives through the entire organisation. This includes initiatives taken to sustain progressive environmental improvements and working with partner organisations to establish synergies to adopting greener business models and operations.
“Class of excellence” Wastewi$e label – OOCL received environmental recognition for our participation and performance in the Wastewi$e Label Scheme under the Hong Kong Awards for Environmental Excellence (HKAEE) program. Under the Scheme, participants must achieve at least nine goals or more, covering at least two of three Wastewi$e categories in order to be granted with the “Class of Excellence” Wastewi$e Label. The three categories include Waste Avoidance & Reduction Measures, Collection and Recycling of Recyclable Materials, and Purchase or Manufacture of Recycled Products.
Clean air action program (Caap) – OOCL won the 2013 San Pedro Ports Clean Air Action Plan (CAAP) Award in the category of ‘Air Quality Improvement Leadership at the Corporate Level’ on 18th July 2013. OOCL was in particular recognised for taking a proactive role in minimising the carbon footprint in the supply chain as well as efforts in working with stakeholders to improve the air quality in the local community.
asian Sustainability leadership awards – OOCL has again won two awards at the 2nd Asian Sustainability Leadership Awards organised by the Asian Confederation of Businesses on 24th September 2013. Over 2,500 entries were received from different parts of the world. An independent jury then shortlisted the entries and made the final selection. OOCL won awards for the “Best Overall Sustainable Performance” and “Best Business Eco-efficiency”.
18 Orient Overseas (International) Limited Annual Report 2013
Corporate Responsibility
Hang Seng Corporate Sustainability index – The Group is a founding constituent of, as well as listed in the Hang Seng Corporate Sustainability Index since its establishment in 2010. Only the top 30 companies are listed in the Index and they are recognised to have received the highest scores among all others on aspects including environmental care, social impact, and corporate governance. Since the Index’s inception, we remain a proud member to have been rated by the RepuTex Annual Review with an “AA” for our overall corporate sustainability performance.
Hong Kong Voluntary observing Ship Gold awards – On 28th May 2013, OOCL was presented with three Hong Kong Voluntary Observing Ship (VOS) Gold Awards by the Hong Kong Observatory (HKO) to recognise our vessel’s important contributions to providing marine climatological data needed to help identify prevailing weather conditions for preparing forecasts and warnings to the maritime community. In addition to the three VOS Gold Awards, both OOCL Long Beach and OOCL yokohama were presented with special certificates of recognition for being the two Hong Kong-flagged vessels that have successfully adopted specialised equipment to improve the accuracy, quality and frequency in ship weather reporting. As a Hong Kong-based company, taking part in the Hong Kong VOS program is a part of OOCL’s commitment to contributing back to the community.
Qualship 21 – Offered by the US Coast Guard, this program recognises high-quality ships for their excellent safety and antipollution standards and encourages quality operations. Most of OOCL’s vessels calling the US have already been Qualship 21 certified since 2004.
environmental Data Verification – OOCL has once again attained our certification on the integrity and disclosure of our 2012 environmental data by adopting Clean Cargo Working Group (CCWG) and Clean Shipping Index (CSI) verification standards, as part of our effort to meeting the needs of the shipping community’s green objectives and our continued commitment to a high standard of our data integrity and information management.
OOCL was accredited the Verification Certifications after audits conducted by DNV GL, a world leading classification society, by using internationally recognised and accepted verification guidelines to check OOCL vessels on a wide variety of scoring parameters, including emissions of carbon dioxide, sulphur oxides, nitrogen oxides and particulate matter, wastes handling, chemicals usage, and wastewater control.
The Group is committed to reducing emissions, promoting environmental care and conserving natural resources. We do this in all areas of our business – on land and at sea – from our vessels, to our terminals, offices and in our containers.
ooCl Vessels – The best way to reduce harmful emissions in the shipping industry is to reduce the consumption of fuel. Since 2001, OOCL has implemented a fuel saving program including weather routing systems, slow steaming (addition of extra vessels on service loops and travelling at slower speeds), minimising ballast water to help achieve a lighter vessel load, and achieving better trim of ship draughts by good stowage, thereby burning less fuel. By taking these measures, we have reduced our CO2 emissions by more than 30% since 2004. In addition to reducing our emissions, we are able to help our customers achieve a lower carbon footprint in their supply chains.
Since 2000, all our vessels have been installed with environment-friendly NOx-controlled propulsive engines while advanced slide fuel injection valves are also adopted to help reduce NOx emissions by 30%.
In the European Union (EU), we are fully compliant to the SOx Emissions Control Area’s (SECA) requirement of using 1.0% sulphur content fuel as required by the EU and International Maritime Organization (IMO), and 0.1% sulphur content for designated EU ports. OOCL operated vessels also consume fuel with sulphur content of 1% or lower in the North American ECA when regulation took effect on 1st August 2012. In addition, when sailing within 24 nautical miles of the California Baseline and at berth, our vessels comply with the 0.5% (for marine diesel oil) or 1.0% (for marine gasoline oil) sulphur content requirements to improve the environment in the community.
Moreover, OOCL is one of the leading carriers that voluntarily signed on to the Fair Winds Charter which encourages all vessels to use fuel of 0.5% sulphur content or less when berthed in Hong Kong. This charter, which started on 1st January 2011, also urges the Hong Kong SAR Government and government authorities in the Pearl River Delta to introduce regulation on the use of low sulphur fuel in order to create a level playing field for all compliers.
OOCL vessels also ensure that the sulphur content of our fuel is well below the IMO prescribed standard of 3.5% when sailing in the high seas. In 2013, OOCL achieved an average sulphur content of 2.55%.
All of OOCL’s new buildings currently under construction are installed with Alternative Maritime Power (AMP) Systems, also known as “Cold Ironing”, which allows the vessel to use shore supplied electricity instead of burning fuel when at berth.
19Orient Overseas (International) Limited Annual Report 2013
Corporate Responsibility
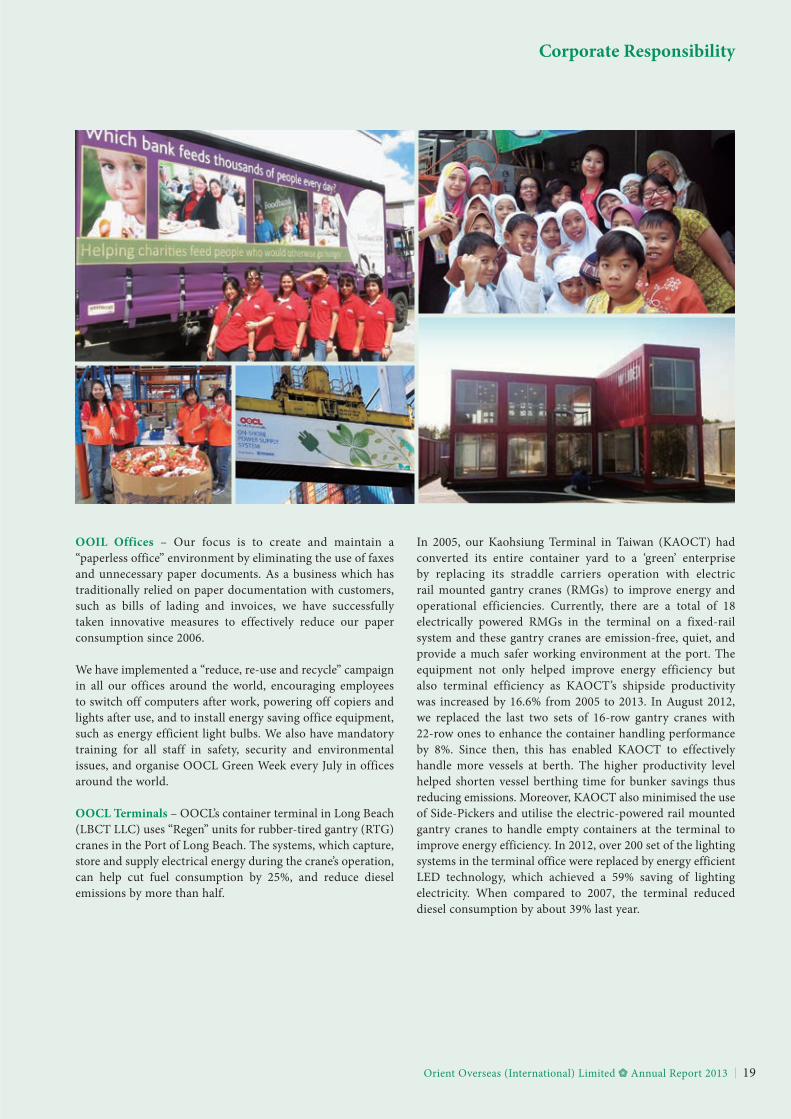
ooil offices – Our focus is to create and maintain a “paperless office” environment by eliminating the use of faxes and unnecessary paper documents. As a business which has traditionally relied on paper documentation with customers, such as bills of lading and invoices, we have successfully taken innovative measures to effectively reduce our paper consumption since 2006.
We have implemented a “reduce, re-use and recycle” campaign in all our offices around the world, encouraging employees to switch off computers after work, powering off copiers and lights after use, and to install energy saving office equipment, such as energy efficient light bulbs. We also have mandatory training for all staff in safety, security and environmental issues, and organise OOCL Green Week every July in offices around the world.
ooCl terminals – OOCL’s container terminal in Long Beach (LBCT LLC) uses “Regen” units for rubber-tired gantry (RTG) cranes in the Port of Long Beach. The systems, which capture, store and supply electrical energy during the crane’s operation, can help cut fuel consumption by 25%, and reduce diesel emissions by more than half.
In 2005, our Kaohsiung Terminal in Taiwan (KAOCT) had converted its entire container yard to a ‘green’ enterprise by replacing its straddle carriers operation with electric rail mounted gantry cranes (RMGs) to improve energy and operational efficiencies. Currently, there are a total of 18 electrically powered RMGs in the terminal on a fixed-rail system and these gantry cranes are emission-free, quiet, and provide a much safer working environment at the port. The equipment not only helped improve energy efficiency but also terminal efficiency as KAOCT’s shipside productivity was increased by 16.6% from 2005 to 2013. In August 2012, we replaced the last two sets of 16-row gantry cranes with 22-row ones to enhance the container handling performance by 8%. Since then, this has enabled KAOCT to effectively handle more vessels at berth. The higher productivity level helped shorten vessel berthing time for bunker savings thus reducing emissions. Moreover, KAOCT also minimised the use of Side-Pickers and utilise the electric-powered rail mounted gantry cranes to handle empty containers at the terminal to improve energy efficiency. In 2012, over 200 set of the lighting systems in the terminal office were replaced by energy efficient LED technology, which achieved a 59% saving of lighting electricity. When compared to 2007, the terminal reduced diesel consumption by about 39% last year.
20 Orient Overseas (International) Limited Annual Report 2013
Corporate Responsibility
Sustainable procurement policy – The Group is dedicated to promoting sustainable practices into our supply chain. Our Corporate Sustainable Procurement Policy has been implemented in every aspect of our business and at every stage of the supply chain.
ooCl Carbon Calculator – The OOCL Carbon Calculator is designed to assist OOCL customers in measuring the CO2 emissions in their supply chain. The scope of the calculator spans across vessels, trucks, feeders, barge and rail with over 70,000 port pairs recorded. OOCL spearheaded the project in 2010, partnering with the Department of Logistics and Maritime Studies of the Hong Kong Polytechnic University. The Calculator has been checked and verified for its methodology, accuracy and carbon footprint calculations by The American Bureau of Shipping (ABS) Consulting.
ooCl Containers – Today, OOCL only uses CFC-free refrigerants for all of our refrigerated (reefer) containers. OOCL’s newest reefer containers have one of the lowest power consumption in the industry, and we install ThermoKing “EcoPower” gensets for better energy efficiency. All our containers have been applied with tin-free paint and we are starting to introduce the use of eco-friendly bamboo floors instead of the traditional hardwood ones.
The Group’s achievements, in many aspects, have already greatly exceeded legal requirements and general industry standards in the countries where it operates. However, as a responsible and committed member of the international community, the Group continually strives for further improvement in all aspects of its business.
SecurityIn a world where global cargo security threats always increase the complexities of the international trade community, OOCL is strongly committed to the security of our operations against possible compromise and to the maintenance of the highest level of compliance in security related areas. From our offices to ports, warehouses, shore facilities and onboard our vessels, we work with the responsible authorities to ensure that every measure is in place to maintain the highest commercial and operational security standards possible at all times, while all employees are educated and regularly updated through security training.
The Group’s Corporate Security Policy and internal guidelines comply with the US Customs-Trade Partnership Against Terrorism (C-TPAT) initiative, EU Authorised Economic Operator (AEO) Program, and we actively work with various governments and authorities around the world to counter any act that would impinge upon maritime or cargo security. Under our policy, we have internal security checks to all of its holdings and our security profile has been validated by the US Customs and Border Protection agency through physical checks of the offices and facilities of the Group including terminals, warehouses, depots and vessels.
Our company meets the International Ship and Port Facility Security Code (ISPS Code), which ensures that security threats are detected and assessed and preventive measures are in place on our vessels and at our port facilities. A designated officer on each ship and at each port facility reports to the Company Security Officer who oversees the security plans, drills and training. With this in place, all our vessels continue to have an exemplary record containing zero breaches of security and totally clean detention records. In addition, to provide world-class quality and secure information to customers and partners, our Global Data Centre has also achieved and maintained ISO 27001 certification.
OOCL has been certified as a “Partners in Protection” (PIP) carrier by the Canada Border Services Agency (CBSA) Partners in Protection. It is a voluntary program established by the CBSA to enhance border security, combat organised crime and terrorism, detect and prevent contraband smuggling, and increase awareness of issues to secure the flow of legitimate goods and travelers across the US-Canadian border. OOCL applies anti-piracy measures before our vessels transit through High Risk Areas (HRA). One of the key measures is to maintain a 24-hour, 360-degree anti-piracy visual and radar watch and to deploy additional watch-keepers at the bridge and on deck while transiting the HRA to watch out for suspected pirate vessels. Physical measures are also utilised onboard, such as barbed wires, spikes, and night vision binoculars. Close communication is always maintained between ships and our Fleet Management Department (FMD) office. FMD’s 24-hour emergency hotline is always on standby mode in the case of any emergency.
21Orient Overseas (International) Limited Annual Report 2013
Corporate Responsibility
Community and educationAs a responsible corporate citizen the Group recognises that the societies in which its employees live and work contribute greatly to the company’s overall success. Care for these communities in which it operates is therefore a major corporate focus. The Group concentrates its community efforts on charity programs designed to provide well-rounded youth education, charity relief to the needy, and cultural entertainment to the whole community.
OOCL employees across the world are encouraged to give something back to the communities in which they live through charitable activities such as fundraising and volunteering by dedicating their time and efforts to help others in need. OOCL assists in transporting medical diagnostic equipment and supplies from the US to China to care for those children who need urgent treatments. In 2013, the Group donated US$127,000.
In addition to financial donations, the Group also contributes in kind. We offer transportation and logistics support to send relief to the affected areas. Assistance in the form of free transportation is often given to a number of charitable projects. In terms of sponsorship, our employees form volunteer teams to support various charitable organisations through community service, fundraising and donations. Some of the areas where the charity donations were made by the Group and its employees include: social services, orphanages, elderly homes, schools, children’s hospitals, cancer research, multiple sclerosis, and diabetes research. In keeping with the Group’s long tradition in supporting education, the Group, in partnership with The Tung Foundation, committed more than US$502,616 in 2013 to scholarships through The Tung OOCL Scholarship for students and our employees’ children.
employee informationAs a responsible corporate citizen employing the highest standards of business ethics in all that it does, the Group understands that the process begins with the well treatment of its employees. As a successful corporation, the Group appreciates that its success, growth and performance are attributable to the skills, dedication and teamwork of its employees. It regards people as its greatest asset and takes good care of them.
In the spirit of mutual respect, the Group is an equal opportunity employer with a clearly defined policy, covering areas such as treating all employees with fairness and dignity, promoting the corporate culture of encouraging open and frank communication throughout the organisation, investing in its employees and caring for their hopes and aspirations through people development programs and education, as well as recognising their efforts and achievements.
People development remains a cornerstone of the corporate culture and enables the effective operation of the Group’s career development policy through recruitment and internal promotion. The Group has channeled a great deal of time and effort into its various people development programs, supporting employee career development through job rotation, local and overseas job assignments, formal and informal learning and development opportunities and sponsorships for performance enhancement.
The Group employs an innovative approach to employee learning and management development. The Group recognises that on demand performance support to its employees is the key to help them deliver what customers need. Through the Group’s intranet, called “InfoNet”, the Group offers an all new string to its human resources bow, creating learner-centric platforms with interactive paths to training and self-improvement, as well as opening up learning opportunities to many more people within the business. Introduced in 2010, this new intranet portal also allows speedy sharing of company news and business updates while giving its employees a platform to exchange views and ideas. In 2011, the Group had a wide adoption of enterprise level collaboration tools in addition to conventional methods of communication such as email. OOCL Wiki and Tibbr have proven to be two of these very effective tools in the sharing of information and knowledge as well as collaboration amongst large groups of colleagues in our offices around the world. They have also helped us support accelerated learning by providing us with the means to leverage resources, ideas and hence solutions.
As at 31st December 2013, the Group had 9,210 full-time employees. Their salary and benefit levels are maintained at competitive levels. Employees are rewarded on a performance related basis within the general policy and framework of the Group’s salary and bonus schemes which are regularly reviewed. Other benefits including medical insurance and pension funds are also provided, and social and recreational activities are organised around the world.
22 Orient Overseas (International) Limited Annual Report 2013
Corporate Responsibility
In the interest of adhering to the highest ethical standards on an ongoing basis, the Group has a formulated Code of Conduct which serves as a guideline to ensure compliance with all local, national and international legal standards and to preclude offences under local, national and international laws, any breaches of confidentiality, non-disclosure requirements or intellectual property rights and any conflicts of interest, acts of bribery, corruption or political contribution and any other areas of deemed misconduct. The Group has set up procedures to identify, manage and control risks that may have an impact on the business of the Group. Established in 2006, the Group’s “Whistle Blower Policy” is one of the Group’s formalised procedures through which employees can anonymously file reports or register concerns and helps govern the reporting and thorough investigation of allegations of suspected improper activities.
The Group is an equal opportunity employer with policies not to discriminate against any employee or applicant for employment on the grounds of race, colour, religion, creed, age, sex, disability, pregnancy, childbirth and related medical condition, marital status, sexual orientation, veteran status and any other category as guided by local laws and legal regulations.
Financial Review
Orient Overseas (International) Limited Annual Report 2013 23
analysis of Consolidated profit and loss account
Summary of Group results
US$’000 2013 2012 Change
Favourable/(unfavourable)
%
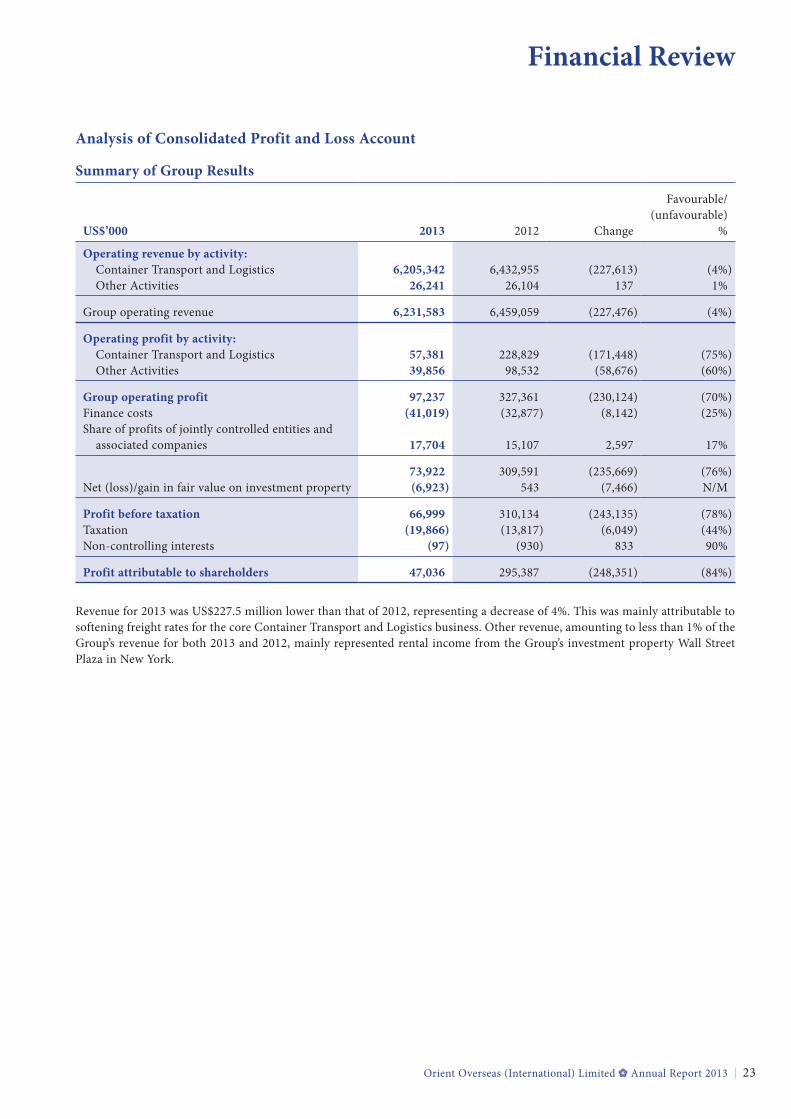
operating revenue by activity: Container Transport and Logistics 6,205,342 6,432,955 (227,613) (4%) Other Activities 26,241 26,104 137 1%
Group operating revenue 6,231,583 6,459,059 (227,476) (4%)
operating profit by activity: Container Transport and Logistics 57,381 228,829 (171,448) (75%) Other Activities 39,856 98,532 (58,676) (60%)
Group operating profit 97,237 327,361 (230,124) (70%)Finance costs (41,019) (32,877) (8,142) (25%)Share of profits of jointly controlled entities and associated companies 17,704 15,107 2,597 17%
73,922 309,591 (235,669) (76%)Net (loss)/gain in fair value on investment property (6,923) 543 (7,466) N/M
profit before taxation 66,999 310,134 (243,135) (78%)Taxation (19,866) (13,817) (6,049) (44%)Non-controlling interests (97) (930) 833 90%
profit attributable to shareholders 47,036 295,387 (248,351) (84%)
Revenue for 2013 was US$227.5 million lower than that of 2012, representing a decrease of 4%. This was mainly attributable to softening freight rates for the core Container Transport and Logistics business. Other revenue, amounting to less than 1% of the Group’s revenue for both 2013 and 2012, mainly represented rental income from the Group’s investment property Wall Street Plaza in New york.
Financial Review
Orient Overseas (International) Limited Annual Report 201324
Container transport and logistics
Summary of operating results
US$’000 2013 2012 Change
Favourable/(unfavourable)
%
liftings (teUs) 5,293,537 5,217,234 76,303 1%
revenue per teU (US$) 1,060 1,131 (71) (6%)
Operating revenue by location: Asia/Australia 4,329,270 4,501,763 (172,493) (4%) North America 967,880 1,043,213 (75,333) (7%) Europe 908,192 887,979 20,213 2%
operating revenue 6,205,342 6,432,955 (227,613) (4%)
Operating costs by items: Cargo costs (2,816,731) (2,756,490) (60,241) (2%) Bunker costs (1,126,471) (1,211,705) 85,234 7% Vessel and voyage costs (excluding Bunker) (1,040,042) (1,051,646) 11,604 1% Equipment and repositioning costs (775,548) (774,549) (999) N/M
operating costs (5,758,792) (5,794,390) 35,598 1%
Gross profit 446,550 638,565 (192,015) (30%)Other operating expenses (410,810) (430,318) 19,508 5%Other operating income, net 21,641 20,582 1,059 5%
operating profit 57,381 228,829 (171,448) (75%)
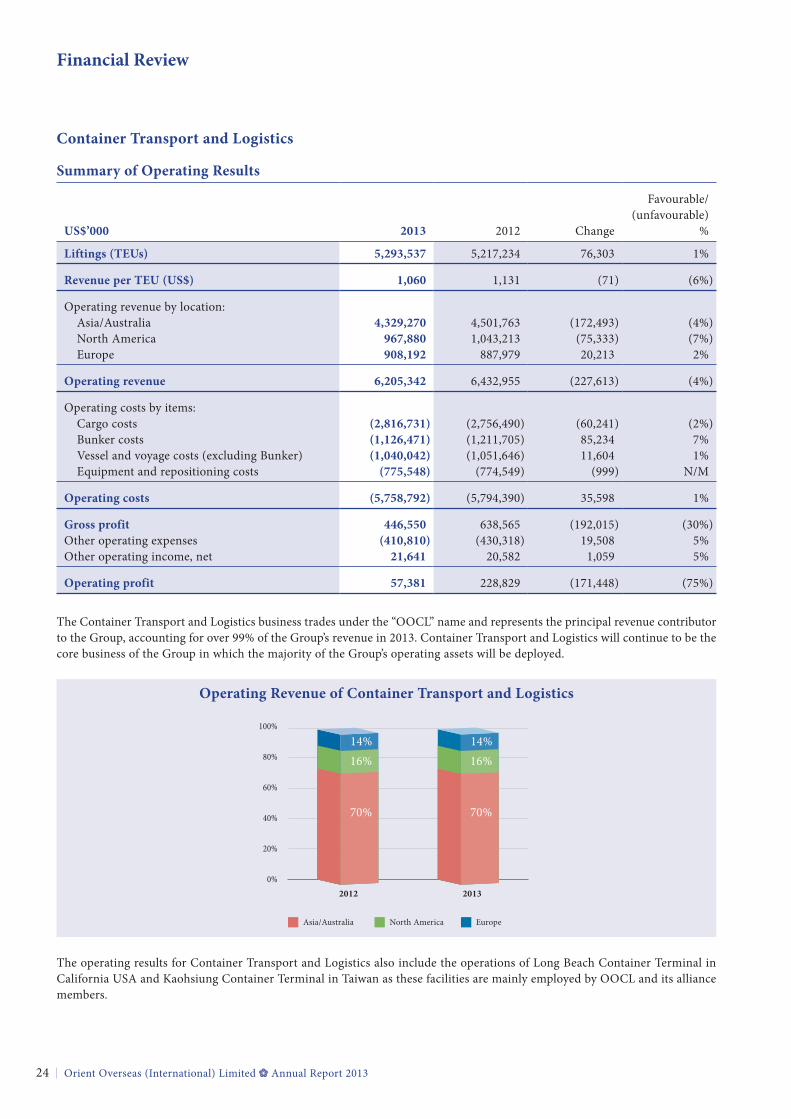
The Container Transport and Logistics business trades under the “OOCL” name and represents the principal revenue contributor to the Group, accounting for over 99% of the Group’s revenue in 2013. Container Transport and Logistics will continue to be the core business of the Group in which the majority of the Group’s operating assets will be deployed.
operating revenue of Container transport and logistics
2012 2013
100%
80%
60%
40%
20%
0%
North AmericaAsia/Australia Europe
70%
16%14%
70%
16%14%
The operating results for Container Transport and Logistics also include the operations of Long Beach Container Terminal in California USA and Kaohsiung Container Terminal in Taiwan as these facilities are mainly employed by OOCL and its alliance members.
Financial Review
Orient Overseas (International) Limited Annual Report 2013 25
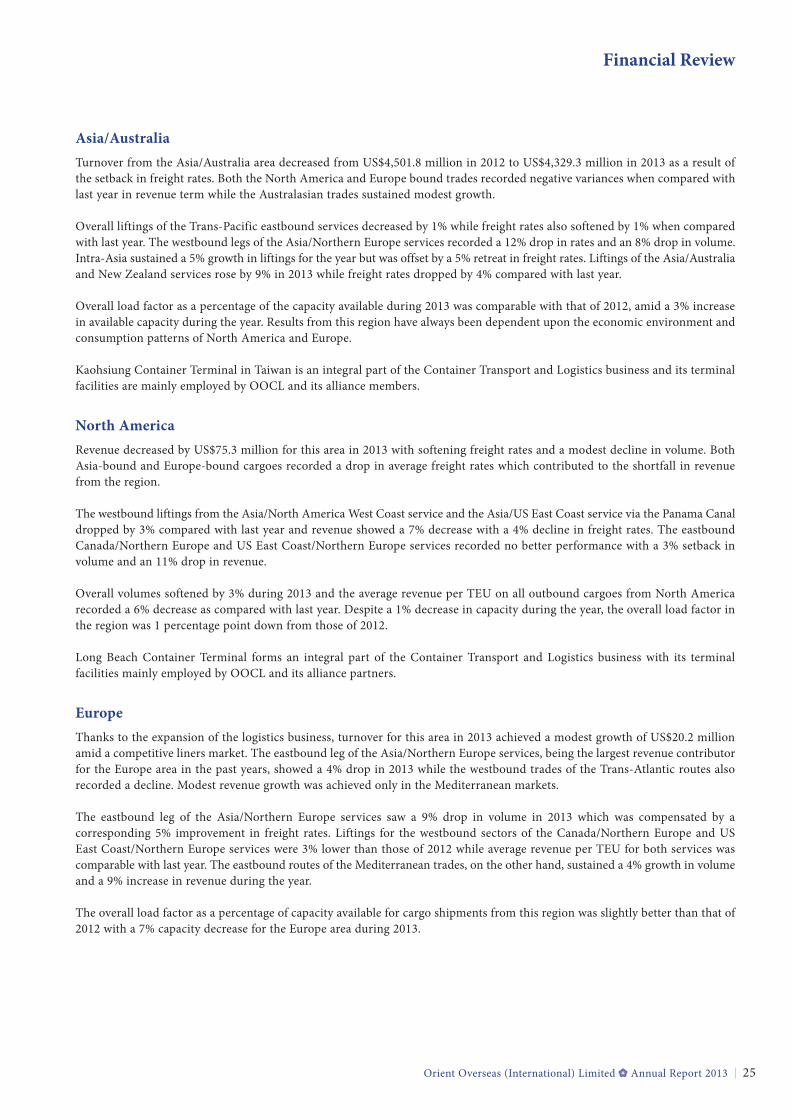
asia/australiaTurnover from the Asia/Australia area decreased from US$4,501.8 million in 2012 to US$4,329.3 million in 2013 as a result of the setback in freight rates. Both the North America and Europe bound trades recorded negative variances when compared with last year in revenue term while the Australasian trades sustained modest growth.
Overall liftings of the Trans-Pacific eastbound services decreased by 1% while freight rates also softened by 1% when compared with last year. The westbound legs of the Asia/Northern Europe services recorded a 12% drop in rates and an 8% drop in volume. Intra-Asia sustained a 5% growth in liftings for the year but was offset by a 5% retreat in freight rates. Liftings of the Asia/Australia and New Zealand services rose by 9% in 2013 while freight rates dropped by 4% compared with last year.
Overall load factor as a percentage of the capacity available during 2013 was comparable with that of 2012, amid a 3% increase in available capacity during the year. Results from this region have always been dependent upon the economic environment and consumption patterns of North America and Europe.
Kaohsiung Container Terminal in Taiwan is an integral part of the Container Transport and Logistics business and its terminal facilities are mainly employed by OOCL and its alliance members.
North americaRevenue decreased by US$75.3 million for this area in 2013 with softening freight rates and a modest decline in volume. Both Asia-bound and Europe-bound cargoes recorded a drop in average freight rates which contributed to the shortfall in revenue from the region.
The westbound liftings from the Asia/North America West Coast service and the Asia/US East Coast service via the Panama Canal dropped by 3% compared with last year and revenue showed a 7% decrease with a 4% decline in freight rates. The eastbound Canada/Northern Europe and US East Coast/Northern Europe services recorded no better performance with a 3% setback in volume and an 11% drop in revenue.
Overall volumes softened by 3% during 2013 and the average revenue per TEU on all outbound cargoes from North America recorded a 6% decrease as compared with last year. Despite a 1% decrease in capacity during the year, the overall load factor in the region was 1 percentage point down from those of 2012.
Long Beach Container Terminal forms an integral part of the Container Transport and Logistics business with its terminal facilities mainly employed by OOCL and its alliance partners.
europeThanks to the expansion of the logistics business, turnover for this area in 2013 achieved a modest growth of US$20.2 million amid a competitive liners market. The eastbound leg of the Asia/Northern Europe services, being the largest revenue contributor for the Europe area in the past years, showed a 4% drop in 2013 while the westbound trades of the Trans-Atlantic routes also recorded a decline. Modest revenue growth was achieved only in the Mediterranean markets.
The eastbound leg of the Asia/Northern Europe services saw a 9% drop in volume in 2013 which was compensated by a corresponding 5% improvement in freight rates. Liftings for the westbound sectors of the Canada/Northern Europe and US East Coast/Northern Europe services were 3% lower than those of 2012 while average revenue per TEU for both services was comparable with last year. The eastbound routes of the Mediterranean trades, on the other hand, sustained a 4% growth in volume and a 9% increase in revenue during the year.
The overall load factor as a percentage of capacity available for cargo shipments from this region was slightly better than that of 2012 with a 7% capacity decrease for the Europe area during 2013.
Financial Review
Orient Overseas (International) Limited Annual Report 201326
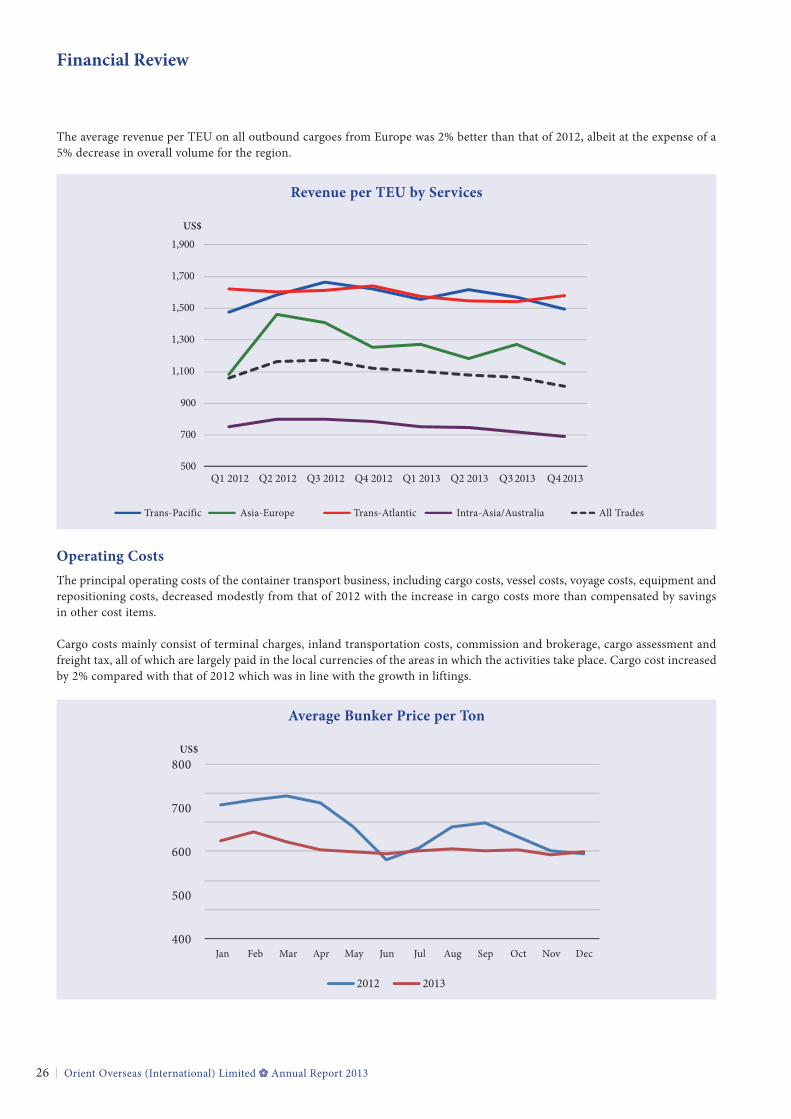
The average revenue per TEU on all outbound cargoes from Europe was 2% better than that of 2012, albeit at the expense of a 5% decrease in overall volume for the region.
revenue per teU by Services
Trans-Pacific
US$
Asia-Europe Trans-Atlantic Intra-Asia/Australia All Trades
500
700
900
1,100
1,300
1,500
1,700
1,900
Q3 2013 Q4 2013Q2 2013Q1 2013Q4 2012Q3 2012Q2 2012Q1 2012
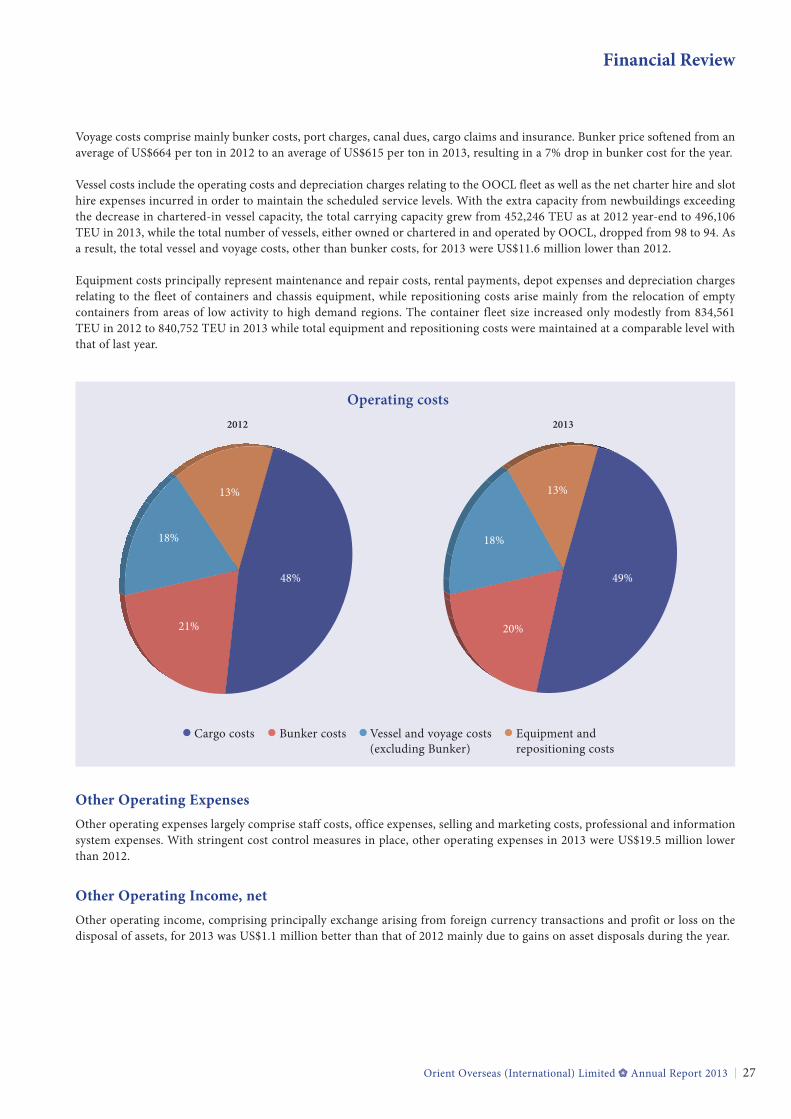
operating CostsThe principal operating costs of the container transport business, including cargo costs, vessel costs, voyage costs, equipment and repositioning costs, decreased modestly from that of 2012 with the increase in cargo costs more than compensated by savings in other cost items.
Cargo costs mainly consist of terminal charges, inland transportation costs, commission and brokerage, cargo assessment and freight tax, all of which are largely paid in the local currencies of the areas in which the activities take place. Cargo cost increased by 2% compared with that of 2012 which was in line with the growth in liftings.
average Bunker price per ton
400
500
600
700
800
2012 2013
Jan Feb Mar Apr May Jun Jul Aug Sep Oct Nov Dec
US$
Financial Review
Orient Overseas (International) Limited Annual Report 2013 27
Voyage costs comprise mainly bunker costs, port charges, canal dues, cargo claims and insurance. Bunker price softened from an average of US$664 per ton in 2012 to an average of US$615 per ton in 2013, resulting in a 7% drop in bunker cost for the year.
Vessel costs include the operating costs and depreciation charges relating to the OOCL fleet as well as the net charter hire and slot hire expenses incurred in order to maintain the scheduled service levels. With the extra capacity from newbuildings exceeding the decrease in chartered-in vessel capacity, the total carrying capacity grew from 452,246 TEU as at 2012 year-end to 496,106 TEU in 2013, while the total number of vessels, either owned or chartered in and operated by OOCL, dropped from 98 to 94. As a result, the total vessel and voyage costs, other than bunker costs, for 2013 were US$11.6 million lower than 2012.
Equipment costs principally represent maintenance and repair costs, rental payments, depot expenses and depreciation charges relating to the fleet of containers and chassis equipment, while repositioning costs arise mainly from the relocation of empty containers from areas of low activity to high demand regions. The container fleet size increased only modestly from 834,561 TEU in 2012 to 840,752 TEU in 2013 while total equipment and repositioning costs were maintained at a comparable level with that of last year.
2012 2013
13%
48%
21%
18% 18%
49%
20%
13%
Operating costs
Cargo costs Bunker costs Vessel and voyage costs(excluding Bunker)
Equipment andrepositioning costs
other operating expensesOther operating expenses largely comprise staff costs, office expenses, selling and marketing costs, professional and information system expenses. With stringent cost control measures in place, other operating expenses in 2013 were US$19.5 million lower than 2012.
other operating income, netOther operating income, comprising principally exchange arising from foreign currency transactions and profit or loss on the disposal of assets, for 2013 was US$1.1 million better than that of 2012 mainly due to gains on asset disposals during the year.
Financial Review
Orient Overseas (International) Limited Annual Report 201328
other activities
Summary of operating results
US$’000 2013 2012 Change
Favourable/(unfavourable)
%
Rental income 27,115 26,887 228 1%Elimination (874) (783) (91) N/M
operating revenue 26,241 26,104 137 1%Operating costs (13,254) (12,328) (926) (8%)Costs incurred by hurricane Sandy (974) (6,707) 5,733 85%
Gross profit 12,013 7,069 4,944 70%Investment income 8,929 33,785 (24,856) (74%)Interest income 11,208 19,176 (7,968) (42%)Distributions from investment in Hui Xian 10,223 43,697 (33,474) (77%)Others (2,517) (5,195) 2,678 52%
operating profit 39,856 98,532 (58,676) (60%)
The Group owns an approximately 600,000 sq ft office and commercial property, Wall Street Plaza, located at 88 Pine Street, New york, USA, an area popularly referred to as the “Wall Street area”. The building was constructed in 1972 and is operated as a multi-tenanted building. Approximately 21,000 sq ft is occupied by Group companies. The Group also invests funds surplus to operation in cash and bank deposit and, on a longer term basis, in equity and bond portfolios. The Group also owns 7.9% interest in Hui Xian Holdings Ltd which is the largest unit-holder of Hui Xian REIT, the first RMB-denominated REIT in Hong Kong.
Hurricane Sandy swept through the U.S. East Coast in late October 2012 causing extensive damage to the city of New york where Wall Street Plaza was located. Various costs were incurred to rebuild and restore the building back to its normal condition and the operating results of 2012 and 2013 were affected accordingly.
The operating profit from Other Activities for 2013 was US$58.7 million less than that of 2012 with lower contribution from investment activities recorded for the year.
rental incomeRental income from Wall Street Plaza was comparable to that of last year, with the building maintaining an occupancy rate of 95% as at the end of 2013.
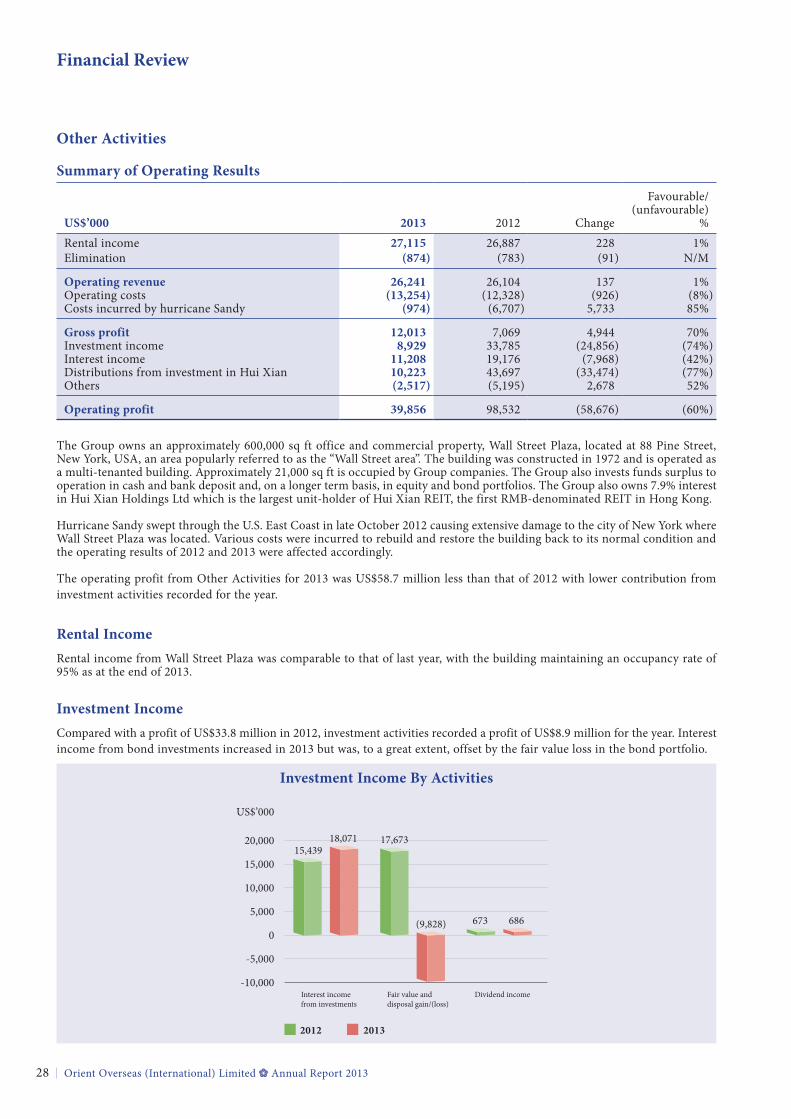
investment incomeCompared with a profit of US$33.8 million in 2012, investment activities recorded a profit of US$8.9 million for the year. Interest income from bond investments increased in 2013 but was, to a great extent, offset by the fair value loss in the bond portfolio.
investment income By activities
2012 2013
Interest incomefrom investments
Fair value and disposal gain/(loss)
Dividend income
US$’000
20,000
15,000
10,000
5,000
0
-5,000
-10,000
15,43918,071 17,673
673 686(9,828)
Financial Review
Orient Overseas (International) Limited Annual Report 2013 29
interest incomeInterest income was US$8.0 million lower in 2013 which was attributable to an average lower balance available for deposits compared with 2012.
Distributions from investment in Hui XianHui Xian Holdings Ltd declared a cash distribution in May 2013, of which the Group shared US$7.9 million. The Group also received distributions of US$2.3 million from its direct holding of Hui Xian REIT during the year, resulting in a total contribution of US$10.2 million from Hui Xian in 2013. In 2012, a distribution in specie of Hui Xian REIT valued at US$34.7 million was received from Hui Xian Ltd.
othersOther items include business and administration expenses for property management, exchange differences and other miscellaneous items.
finance CostsThe Group incurs interest expenses on bank loans, finance leases and, to a very small extent, bank overdrafts. These borrowings are variously secured against vessels, containers, chassis and terminal equipment owned by the Group. Finance costs also include fees on lease administration.
Finance costs increased by US$8.1 million as compared with 2012, principally a result of the higher average debt balance for the year.
Net (loss)/Gain in fair Value on investment propertyAs at 31st December 2013, the Group’s investment property, Wall Street Plaza, was valued at US$170 million, up from the US$165 million valuation at the end of 2012, by an independent valuer. After offsetting a total of US$11.9 million capital improvements to the building spent during the year, the net loss in fair value for 2013 was therefore US$6.9 million. In 2012, the property recorded a valuation gain of US$5.0 million which was offset against a total of US$4.5 million building improvement to result in a net gain in fair value of US$0.5 million.
Share of results of jointly Controlled entities and associated CompaniesShare of results of jointly controlled entities and associated companies mainly represents the Group’s investment in a depot joint venture in Qingdao and a 20% stake in two terminals located in Tianjin and Ningbo, which commenced operations in 2007. The share of US$17.7 million profit from jointly controlled entities and associated companies in 2013 was US$2.6 million higher than 2012.
profit before taxationPre-tax profit for the year was US$67.0 million compared with last year’s profit of US$310.1 million. The setback in earnings reflected the competitive market conditions of the Container Transport and Logistics business and a lower contribution from the investment activities.
Financial Review
Orient Overseas (International) Limited Annual Report 201330
taxation
US$’000 2013 2012 Change
Favourable/(unfavourable)
%
Company and subsidiaries: North America 5,611 923 4,688 (508%) Europe 2,790 927 1,863 (201%) China 3,400 2,543 857 (34%) Asia and others 8,065 9,424 (1,359) 14%
Total 19,866 13,817 6,049 (44%)
The increase in taxation for North America and Europe in 2013 was mainly due to the write-back of provision in 2012 not recurring this year. Taxation for China also increased in 2013 which was in line with the expansion of business volume over the area.
Capital expenditure
US$’000 2013 2012 Change
Increase/(decrease)
%
Container vessels and capitalised dry-docking costs 52,344 34,287 18,057 53%Vessels under construction 631,885 548,055 83,830 15%Containers 182,627 109,897 72,730 66%Chassis 82 54 28 52%Vehicles, furniture, computer and other equipment 108,416 77,676 30,740 40%Computer software 12,174 9,761 2,413 25%Investment property 11,923 4,457 7,466 168%Land and buildings – 375 (375) (100%)
999,451 784,562 214,889 27%
Capital expenditure increased from US$784.6 million in 2012 to US$999.5 million in 2013. Vessels under construction accounted for 63% and 70% of the total capital expenditure in 2013 and 2012 respectively. The increase in capital expenditure on other equipment mainly represented the acquisition of terminal equipment for the Middle Harbor Redevelopment Project in Long Beach, USA.
VesselsDuring 2013, the Group took delivery of ten newbuilds, of which eight were 13,208 TEU mega vessels and the remaining two were of 8,888 TEU in capacity.
As at the end of 2013, the Group had a total of six newbuilding outstanding orders for two 13,208 TEU vessels from Samsung Heavy Industries Co Ltd and four 8,888 TEU vessels from Hudong – Zhonghua Shipyard (Group) Co. Ltd, to be delivered from 2014 to 2015.
Newbuilding Delivery Schedule
Delivery Shipyard Hull No. teU Date of orderapr 2014 Samsung Heavy industries HN2010 13,208 2011
Mar 2014 Samsung Heavy Industries HN2010 13,208 2011Apr 2014 Samsung Heavy Industries HN2011 13,208 2011Oct 2014 Hudong-Zhonghua Shipbuilding H1565A 8,888 2007Dec 2014 Hudong-Zhonghua Shipbuilding H1585A 8,888 2007Feb 2015 Hudong-Zhonghua Shipbuilding H1667A 8,888 2010Apr 2015 Hudong-Zhonghua Shipbuilding H1668A 8,888 2010
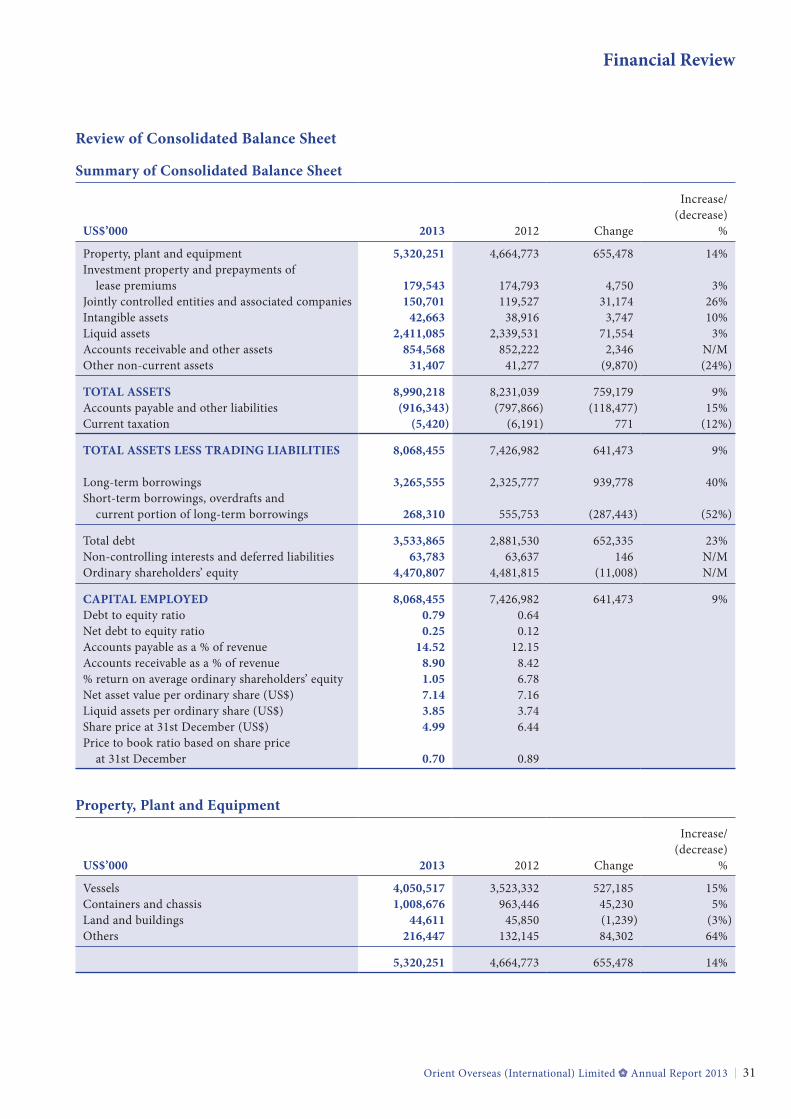
Financial Review
Orient Overseas (International) Limited Annual Report 2013 31
review of Consolidated Balance Sheet
Summary of Consolidated Balance Sheet
US$’000 2013 2012 Change
Increase/(decrease)
%
Property, plant and equipment 5,320,251 4,664,773 655,478 14%Investment property and prepayments of lease premiums 179,543 174,793 4,750 3%Jointly controlled entities and associated companies 150,701 119,527 31,174 26%Intangible assets 42,663 38,916 3,747 10%Liquid assets 2,411,085 2,339,531 71,554 3%Accounts receivable and other assets 854,568 852,222 2,346 N/MOther non-current assets 31,407 41,277 (9,870) (24%)
total aSSetS 8,990,218 8,231,039 759,179 9%Accounts payable and other liabilities (916,343) (797,866) (118,477) 15%Current taxation (5,420) (6,191) 771 (12%)
total aSSetS leSS traDiNG liaBilitieS 8,068,455 7,426,982 641,473 9%
Long-term borrowings 3,265,555 2,325,777 939,778 40%Short-term borrowings, overdrafts and current portion of long-term borrowings 268,310 555,753 (287,443) (52%)
Total debt 3,533,865 2,881,530 652,335 23%Non-controlling interests and deferred liabilities 63,783 63,637 146 N/MOrdinary shareholders’ equity 4,470,807 4,481,815 (11,008) N/M
Capital eMploYeD 8,068,455 7,426,982 641,473 9%Debt to equity ratio 0.79 0.64Net debt to equity ratio 0.25 0.12Accounts payable as a % of revenue 14.52 12.15Accounts receivable as a % of revenue 8.90 8.42% return on average ordinary shareholders’ equity 1.05 6.78Net asset value per ordinary share (US$) 7.14 7.16Liquid assets per ordinary share (US$) 3.85 3.74Share price at 31st December (US$) 4.99 6.44Price to book ratio based on share price at 31st December 0.70 0.89
property, plant and equipment
US$’000 2013 2012 Change
Increase/(decrease)
%
Vessels 4,050,517 3,523,332 527,185 15%Containers and chassis 1,008,676 963,446 45,230 5%Land and buildings 44,611 45,850 (1,239) (3%)Others 216,447 132,145 84,302 64%
5,320,251 4,664,773 655,478 14%
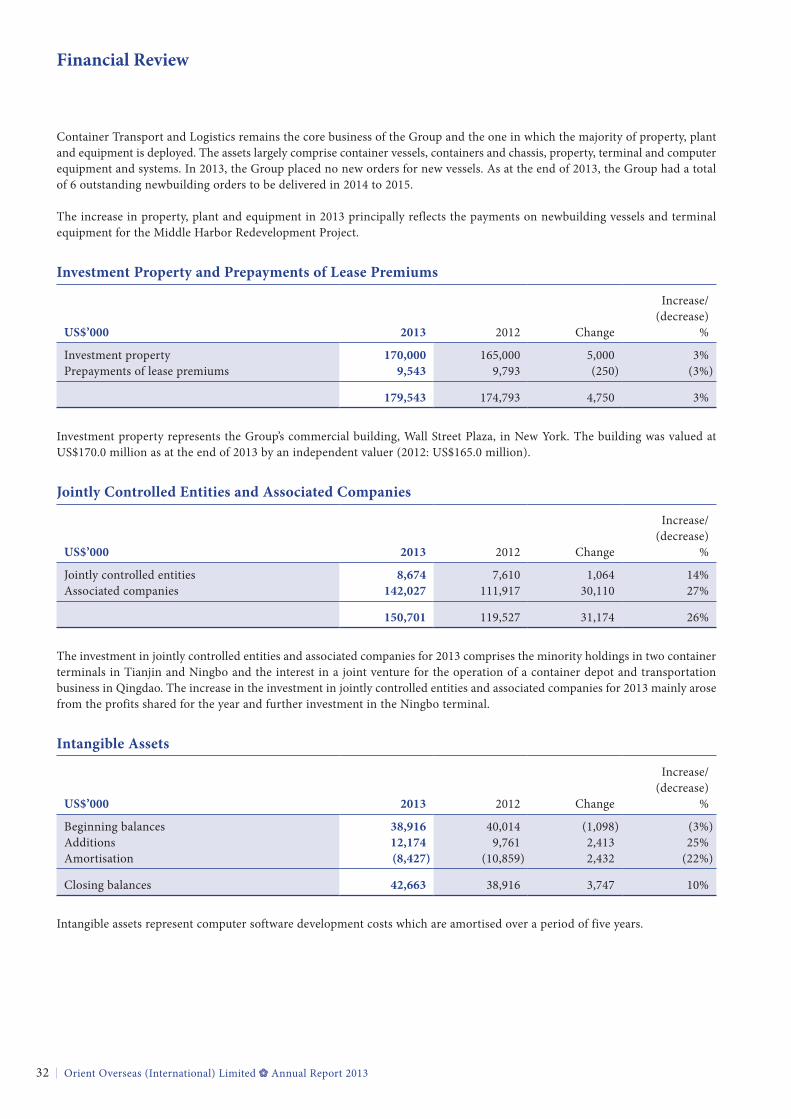
Financial Review
Orient Overseas (International) Limited Annual Report 201332
Container Transport and Logistics remains the core business of the Group and the one in which the majority of property, plant and equipment is deployed. The assets largely comprise container vessels, containers and chassis, property, terminal and computer equipment and systems. In 2013, the Group placed no new orders for new vessels. As at the end of 2013, the Group had a total of 6 outstanding newbuilding orders to be delivered in 2014 to 2015.
The increase in property, plant and equipment in 2013 principally reflects the payments on newbuilding vessels and terminal equipment for the Middle Harbor Redevelopment Project.
investment property and prepayments of lease premiums
US$’000 2013 2012 Change
Increase/(decrease)
%
Investment property 170,000 165,000 5,000 3%Prepayments of lease premiums 9,543 9,793 (250) (3%)
179,543 174,793 4,750 3%
Investment property represents the Group’s commercial building, Wall Street Plaza, in New york. The building was valued at US$170.0 million as at the end of 2013 by an independent valuer (2012: US$165.0 million).
jointly Controlled entities and associated Companies
US$’000 2013 2012 Change
Increase/(decrease)
%
Jointly controlled entities 8,674 7,610 1,064 14%Associated companies 142,027 111,917 30,110 27%
150,701 119,527 31,174 26%
The investment in jointly controlled entities and associated companies for 2013 comprises the minority holdings in two container terminals in Tianjin and Ningbo and the interest in a joint venture for the operation of a container depot and transportation business in Qingdao. The increase in the investment in jointly controlled entities and associated companies for 2013 mainly arose from the profits shared for the year and further investment in the Ningbo terminal.
intangible assets
US$’000 2013 2012 Change
Increase/(decrease)
%
Beginning balances 38,916 40,014 (1,098) (3%)Additions 12,174 9,761 2,413 25%Amortisation (8,427) (10,859) 2,432 (22%)
Closing balances 42,663 38,916 3,747 10%
Intangible assets represent computer software development costs which are amortised over a period of five years.
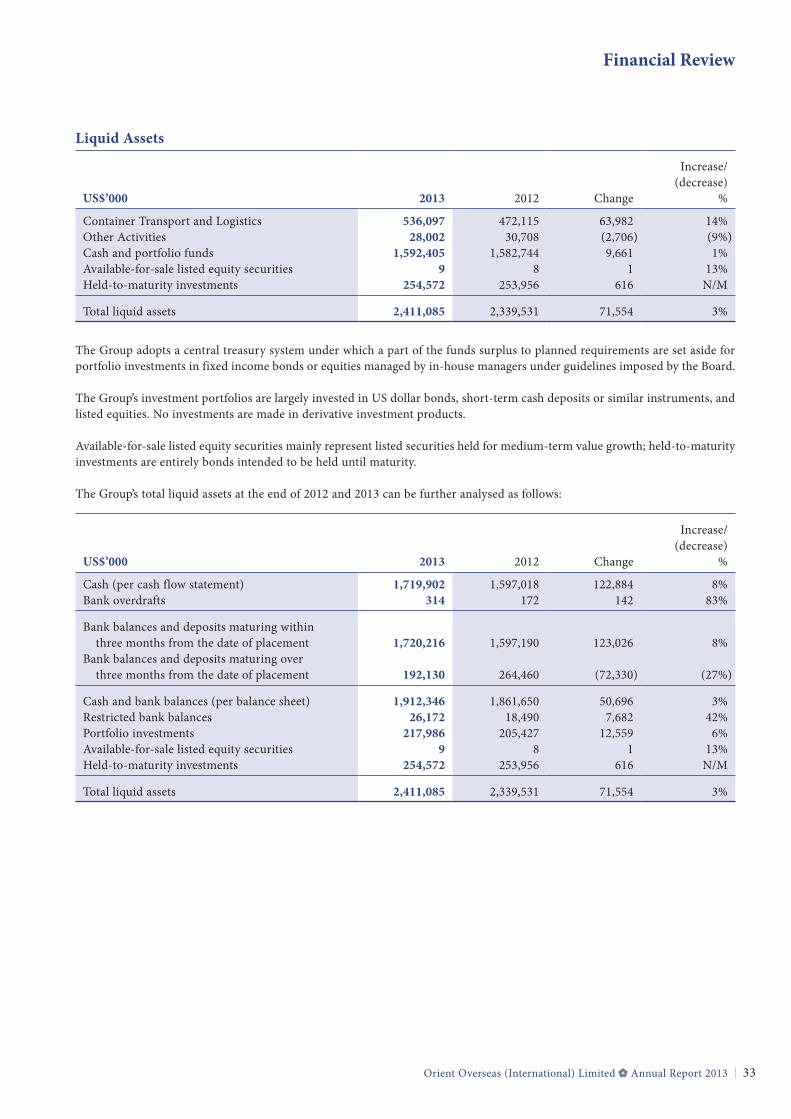
Financial Review
Orient Overseas (International) Limited Annual Report 2013 33
liquid assets
US$’000 2013 2012 Change
Increase/(decrease)
%
Container Transport and Logistics 536,097 472,115 63,982 14%Other Activities 28,002 30,708 (2,706) (9%)Cash and portfolio funds 1,592,405 1,582,744 9,661 1%Available-for-sale listed equity securities 9 8 1 13%Held-to-maturity investments 254,572 253,956 616 N/M
Total liquid assets 2,411,085 2,339,531 71,554 3%
The Group adopts a central treasury system under which a part of the funds surplus to planned requirements are set aside for portfolio investments in fixed income bonds or equities managed by in-house managers under guidelines imposed by the Board.
The Group’s investment portfolios are largely invested in US dollar bonds, short-term cash deposits or similar instruments, and listed equities. No investments are made in derivative investment products.
Available-for-sale listed equity securities mainly represent listed securities held for medium-term value growth; held-to-maturity investments are entirely bonds intended to be held until maturity.
The Group’s total liquid assets at the end of 2012 and 2013 can be further analysed as follows:
US$’000 2013 2012 Change
Increase/(decrease)
%
Cash (per cash flow statement) 1,719,902 1,597,018 122,884 8%Bank overdrafts 314 172 142 83%
Bank balances and deposits maturing within three months from the date of placement 1,720,216 1,597,190 123,026 8%Bank balances and deposits maturing over three months from the date of placement 192,130 264,460 (72,330) (27%)
Cash and bank balances (per balance sheet) 1,912,346 1,861,650 50,696 3%Restricted bank balances 26,172 18,490 7,682 42%Portfolio investments 217,986 205,427 12,559 6%Available-for-sale listed equity securities 9 8 1 13%Held-to-maturity investments 254,572 253,956 616 N/M
Total liquid assets 2,411,085 2,339,531 71,554 3%
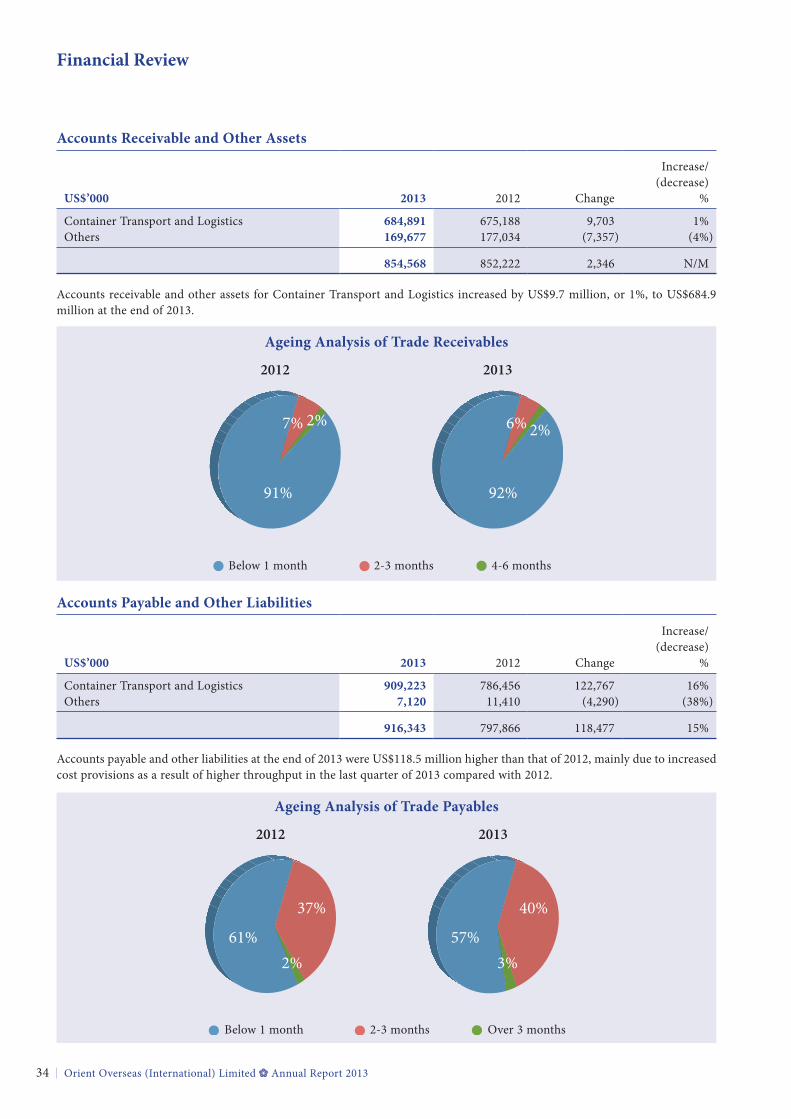
Financial Review
Orient Overseas (International) Limited Annual Report 201334
accounts receivable and other assets
US$’000 2013 2012 Change
Increase/(decrease)
%
Container Transport and Logistics 684,891 675,188 9,703 1%Others 169,677 177,034 (7,357) (4%)
854,568 852,222 2,346 N/M
Accounts receivable and other assets for Container Transport and Logistics increased by US$9.7 million, or 1%, to US$684.9 million at the end of 2013.
ageing analysis of trade receivables
2012 2013
91%
7% 2%
92%
2%6%
Below 1 month 2-3 months 4-6 months
accounts payable and other liabilities
US$’000 2013 2012 Change
Increase/(decrease)
%
Container Transport and Logistics 909,223 786,456 122,767 16%Others 7,120 11,410 (4,290) (38%)
916,343 797,866 118,477 15%
Accounts payable and other liabilities at the end of 2013 were US$118.5 million higher than that of 2012, mainly due to increased cost provisions as a result of higher throughput in the last quarter of 2013 compared with 2012.
ageing analysis of trade payables
Below 1 month 2-3 months Over 3 months
2012 2013
61%2%
37%
57%3%
40%
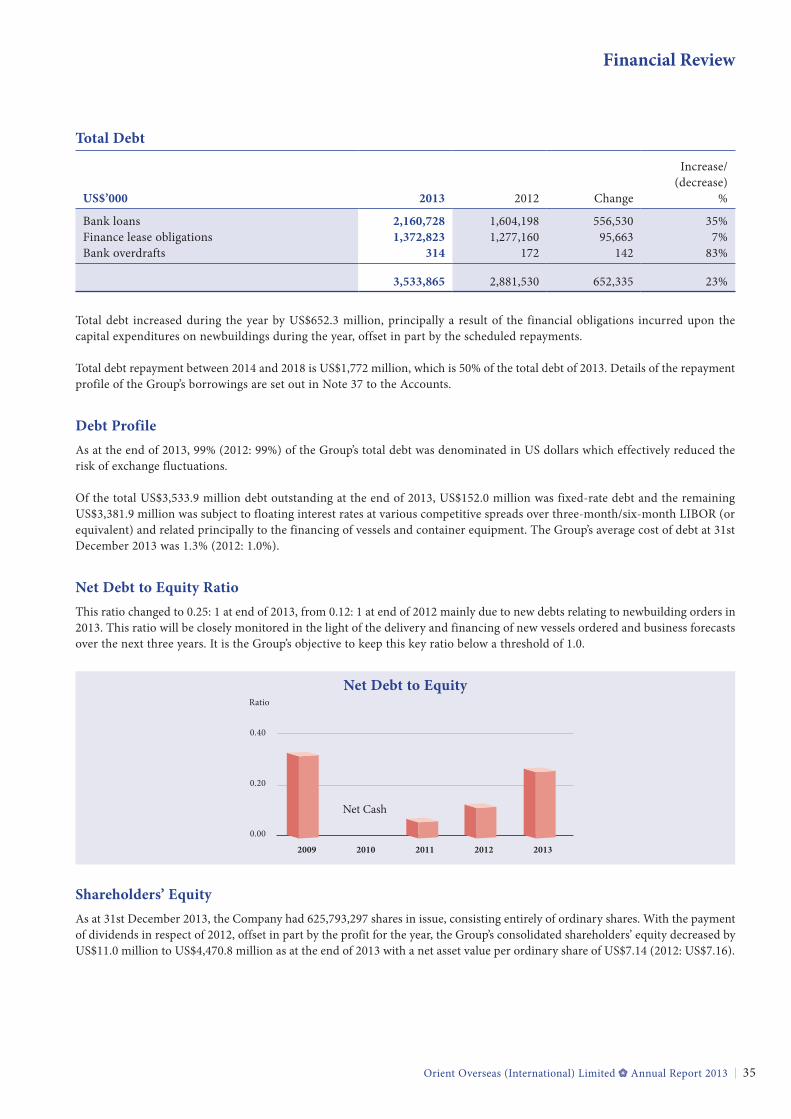
Financial Review
Orient Overseas (International) Limited Annual Report 2013 35
total Debt
US$’000 2013 2012 Change
Increase/(decrease)
%
Bank loans 2,160,728 1,604,198 556,530 35%Finance lease obligations 1,372,823 1,277,160 95,663 7%Bank overdrafts 314 172 142 83%
3,533,865 2,881,530 652,335 23%
Total debt increased during the year by US$652.3 million, principally a result of the financial obligations incurred upon the capital expenditures on newbuildings during the year, offset in part by the scheduled repayments.
Total debt repayment between 2014 and 2018 is US$1,772 million, which is 50% of the total debt of 2013. Details of the repayment profile of the Group’s borrowings are set out in Note 37 to the Accounts.
Debt profileAs at the end of 2013, 99% (2012: 99%) of the Group’s total debt was denominated in US dollars which effectively reduced the risk of exchange fluctuations.
Of the total US$3,533.9 million debt outstanding at the end of 2013, US$152.0 million was fixed-rate debt and the remaining US$3,381.9 million was subject to floating interest rates at various competitive spreads over three-month/six-month LIBOR (or equivalent) and related principally to the financing of vessels and container equipment. The Group’s average cost of debt at 31st December 2013 was 1.3% (2012: 1.0%).
Net Debt to equity ratioThis ratio changed to 0.25: 1 at end of 2013, from 0.12: 1 at end of 2012 mainly due to new debts relating to newbuilding orders in 2013. This ratio will be closely monitored in the light of the delivery and financing of new vessels ordered and business forecasts over the next three years. It is the Group’s objective to keep this key ratio below a threshold of 1.0.
Net Debt to equityRatio
0.40
0.20
0.00
2009 2010 2011 2012 2013
Net Cash
Shareholders’ equityAs at 31st December 2013, the Company had 625,793,297 shares in issue, consisting entirely of ordinary shares. With the payment of dividends in respect of 2012, offset in part by the profit for the year, the Group’s consolidated shareholders’ equity decreased by US$11.0 million to US$4,470.8 million as at the end of 2013 with a net asset value per ordinary share of US$7.14 (2012: US$7.16).
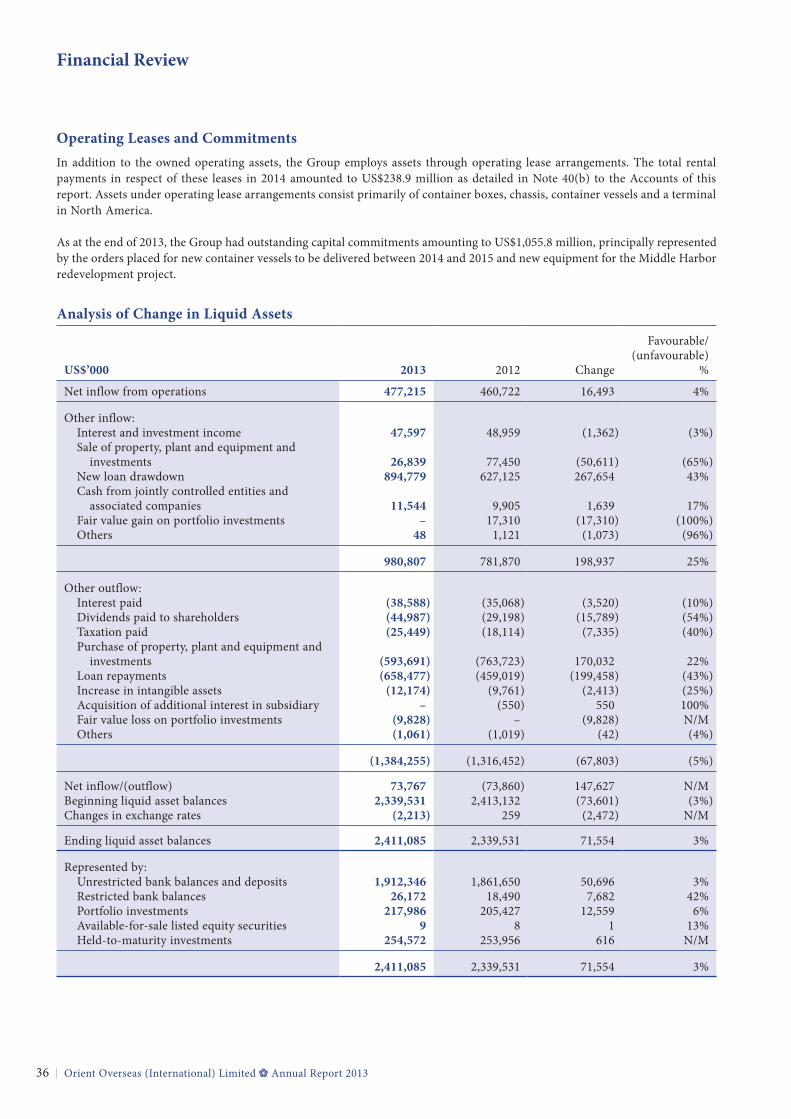
Financial Review
Orient Overseas (International) Limited Annual Report 201336
operating leases and CommitmentsIn addition to the owned operating assets, the Group employs assets through operating lease arrangements. The total rental payments in respect of these leases in 2014 amounted to US$238.9 million as detailed in Note 40(b) to the Accounts of this report. Assets under operating lease arrangements consist primarily of container boxes, chassis, container vessels and a terminal in North America.
As at the end of 2013, the Group had outstanding capital commitments amounting to US$1,055.8 million, principally represented by the orders placed for new container vessels to be delivered between 2014 and 2015 and new equipment for the Middle Harbor redevelopment project.
analysis of Change in liquid assets
US$’000 2013 2012 Change
Favourable/(unfavourable)
%
Net inflow from operations 477,215 460,722 16,493 4%
Other inflow: Interest and investment income 47,597 48,959 (1,362) (3%) Sale of property, plant and equipment and investments 26,839 77,450 (50,611) (65%) New loan drawdown 894,779 627,125 267,654 43% Cash from jointly controlled entities and associated companies 11,544 9,905 1,639 17% Fair value gain on portfolio investments – 17,310 (17,310) (100%) Others 48 1,121 (1,073) (96%)
980,807 781,870 198,937 25%
Other outflow: Interest paid (38,588) (35,068) (3,520) (10%) Dividends paid to shareholders (44,987) (29,198) (15,789) (54%) Taxation paid (25,449) (18,114) (7,335) (40%) Purchase of property, plant and equipment and investments (593,691) (763,723) 170,032 22% Loan repayments (658,477) (459,019) (199,458) (43%) Increase in intangible assets (12,174) (9,761) (2,413) (25%) Acquisition of additional interest in subsidiary – (550) 550 100% Fair value loss on portfolio investments (9,828) – (9,828) N/M Others (1,061) (1,019) (42) (4%)
(1,384,255) (1,316,452) (67,803) (5%)
Net inflow/(outflow) 73,767 (73,860) 147,627 N/MBeginning liquid asset balances 2,339,531 2,413,132 (73,601) (3%)Changes in exchange rates (2,213) 259 (2,472) N/M
Ending liquid asset balances 2,411,085 2,339,531 71,554 3%
Represented by: Unrestricted bank balances and deposits 1,912,346 1,861,650 50,696 3% Restricted bank balances 26,172 18,490 7,682 42% Portfolio investments 217,986 205,427 12,559 6% Available-for-sale listed equity securities 9 8 1 13% Held-to-maturity investments 254,572 253,956 616 N/M
2,411,085 2,339,531 71,554 3%
Financial Review
Orient Overseas (International) Limited Annual Report 2013 37
A net inflow of US$73.8 million was recorded in 2013 compared with a net outflow of US$73.9 million in 2012. Operating inflow of US$477.2 million for the year was US$16.5 million better than that of 2012 due to the favourable working capital movements. The capital payments and corresponding loan drawdown amounts in 2013 mainly reflected the scheduled stage payments arranged for the new ordered vessels. Total liquid asset balances increased to US$2,411.1 million at the end of 2013, against US$2,339.5 million in 2012.
liquidityAs at 31st December 2013, the Group had total liquid asset balances of US$2,411.1 million compared with debt obligations of US$268.3 million repayable in 2014. Total current assets at the end of 2013 amounted to US$2,844.0 million against total current liabilities of US$1,185.3 million. The Group’s shareholders’ equity contains no loan capital. The Group prepares and updates cashflow forecasts for asset acquisitions, project development requirements, as well as working capital needs, from time to time with the objective of maintaining a proper balance between a conservative liquidity level and an efficient investment of surplus funds.
Orient Overseas (International) Limited Annual Report 201338
Board of Directors
tUNG Chee ChenMr. TUNG Chee Chen, aged 71, has been appointed as the Chairman, President and Chief Executive Officer of the Company since October 1996. Mr. Tung chairs the Executive Committee and the Nomination Committee of the Company and is a member of the Remuneration Committee of the Company. On 7th August, 2013, he became the chairman and a member of the Inside Information Committee of the Company. He is also the chairman or a director of various subsidiaries of the Company. Mr. Tung graduated from the University of Liverpool, England, where he received his Bachelor of Science degree and acquired a Master’s degree in Mechanical Engineering at the Massachusetts Institute of Technology in the United States. Mr. Tung is an Independent Non-Executive Director of Cathay Pacific Airways Limited and U-Ming Marine Transport Corp., both are listed public companies. He was formerly an Independent Non-Executive Director of BOC Hong Kong (Holdings) Limited, PetroChina Company Limited, Sing Tao News Corporation Limited, Wing Hang Bank, Limited and Zhejiang Expressway Co., Ltd., all are companies listed in Hong Kong. Mr. Tung is a member of the Hong Kong Logistics Development Council and the Hong Kong-United States Business Council. Mr. Tung is the brother of Mr. Tung Chee Hwa who has an interest in a trust which has an indirect interest in Fortune Crest Inc. and Gala Way Company Inc. (substantial shareholders of the Company); the brother-in-law of Professor Roger King (a Non-Executive Director of the Company); and the uncle of Mr. Tung Lieh Cheung Andrew (an Executive Director of the Company) and Mr. Tung Lieh Sing Alan (an Executive Director and the Acting Chief Financial Officer of the Company). Mr. Tung is either a director or a director of a company which is a corporate director of certain substantial shareholders of the Company which have disclosure interests in the Company under the provisions of the Securities and Futures Ordinance.
tUNG lieh Cheung andrewMr. TUNG Lieh Cheung Andrew, aged 49, has been an Executive Director and a member of the Executive Committee of the Company since 2nd November, 2011. On 7th August, 2013, Mr. Tung became a member of the Inside Information Committee of the Company. He has been a Director and a member of the Executive Committee of Orient Overseas Container Line Limited (“OOCLL”), a wholly-owned subsidiary of the Company, since March 2006, and the Chief Executive Officer and Senior Managing Director of OOCLL since 1st July, 2012. Mr. Tung is also a director of Cargosmart (Hong Kong) Limited, a wholly-owned subsidiary of the Company as well as a director of various subsidiaries of the Company. Between 1993 and 1998, he has served the Group in various capacities including Director of Reefer Trade of OOCLL. The last position Mr. Tung held in Hong Kong Dragon Airlines Limited prior to joining OOCLL in 2006 was the Chief Operating Officer. Mr. Tung holds a Bachelor degree from Princeton University and a Master of Business Administration from Stanford University in the USA. He is currently a member of the Executive Committee of Hong Kong Shipowners Association. Mr. Tung was the Vice-Chairman of the International Chamber of Commerce Commission for Transport & Logistics. Mr. Tung is the son of Mr. Tung Chee Hwa who has an interest in a trust which has an indirect interest in Fortune Crest Inc. and Gala Way Company Inc. (substantial shareholders of the Company) and is the brother of Mr. Tung Lieh Sing Alan (an Executive Director and the Acting Chief Financial Officer of the Company). He is the nephew of Mr. Tung Chee Chen (the Chairman, President and Chief Executive Officer of the Company) who has an interest in a trust which has an indirect interest in Fortune Crest Inc. and Gala Way Company Inc. (substantial shareholders of the Company) and Professor Roger King (a Non-Executive Director of the Company). Mr. Tung is a director of certain substantial shareholders of the Company which have disclosure interests in the Company under the provisions of the Securities and Futures Ordinance.
Orient Overseas (International) Limited Annual Report 2013 39
Board of Directors
tUNG lieh Sing alanMr. TUNG Lieh Sing Alan, aged 46, has been an Executive Director of the Company since 1st May, 2005. Mr. Tung became the Acting Chief Financial Officer of the Company and a member of the Executive Committee and the Compliance Committee of the Company on 1st June, 2013. On 7th August, 2013, he was appointed a member of the Inside Information Committee of the Company. Mr. Tung has been with the Group in various capacities for twenty years and is a Director of various subsidiaries of the Company. Mr. Tung graduated from Princeton University, Politics Department with a Bachelor of Arts degree. Mr. Tung is the Chairman of the Hong Kong Shipowners Association and is a member of the Hong Kong Economic Development Commission and the Hong Kong Maritime Industry Council and the Greater Pearl River Delta Business Council. He is on the Executive Committee of the International Association of Dry Cargo Shipowners (Intercargo), the Chairman of the Advisory Committee of Center for Transport, Trade and Financial Studies of the City University of Hong Kong and a member of the Departmental Advisory Committee of Department of Logistics and Maritime Studies of The Hong Kong Polytechnic University. He did not hold directorships in any other public companies listed in Hong Kong and overseas in the last three years. Mr. Tung is the son of Mr. Tung Chee Hwa who has an interest in a trust which has an indirect interest in Fortune Crest Inc. and Gala Way Company Inc. (substantial shareholders of the Company) and is the brother of Mr. Tung Lieh Cheung Andrew (an Executive Director of the Company). He is the nephew of Mr. Tung Chee Chen (the Chairman, President and Chief Executive Officer of the Company) who has an interest in a trust which has an indirect interest in Fortune Crest Inc. and Gala Way Company Inc. (substantial shareholders of the Company) and Professor Roger King (a Non-Executive Director of the Company).
professor roger KiNGProfessor Roger KING, aged 73, has been a Non-Executive Director of the Company since March 2000 and was an Executive Director of the Company from 1992. He is a member of the Finance Committee of the Company since 4th March, 2008. He was a Director of Orient Overseas (Holdings) Limited (“OOHL”) from 1983 to 1992 and the Managing Director and Chief Operating Officer of OOHL from 1985 to 1987. Professor King is a graduate of the University of Michigan, BSEE; New york University, MSEE; Harvard Business School, AMP; and The Hong Kong University of Science and Technology (“HKUST”), PhD in Finance. He is an Adjunct Professor of Finance, Director of Tanoto Center for Asian Family Business and Entrepreneurship Studies and Director of Thompson Center for Business Case Studies at HKUST. He also worked in computer research and management consultancy at Bell Telephone Laboratories. Professor King is a member of the Supervisory Board of TNT Express N.V. (listed on the Amsterdam Stock Exchange) and the Honorary Consul of the Republic of Latvia in Hong Kong. Professor King was an Independent Non-Executive Director of Sincere Watch (Hong Kong) Limited (listed on the Hong Kong Stock Exchange) and Arrow Electronics, Inc. (listed on the New york Stock Exchange), a member of the Supervisory Board of TNT N.V. (listed on the Amsterdam Stock Exchange), Chairman and founder of System-Pro Computers Limited, one of the largest personal computer reseller in Hong Kong, Chairman of Pacific Coffee Limited and a member of the Standing Committee of Zhejiang Province People’s Political Consultative Conference. Professor King is the brother-in-law of Mr. Tung Chee Hwa who has an interest in a trust which has an indirect interest in Fortune Crest Inc. and Gala Way Company Inc. (substantial shareholders of the Company), and Mr. Tung Chee Chen (the Chairman, President and Chief Executive Officer of the Company) who has an interest in a trust which has an indirect interest in Fortune Crest Inc. and Gala Way Company Inc. (substantial shareholders of the Company) and the uncle of Mr. Tung Lieh Cheung Andrew (an Executive Director of the Company) and Mr. Tung Lieh Sing Alan (an Executive Director and the Acting Chief Financial Officer of the Company).
Orient Overseas (International) Limited Annual Report 201340
Board of Directors
CHoW philip Yiu WahMr. CHOW Philip yiu Wah, aged 66, is a Non-Executive Director of the Company since the re-designation from an Executive Director of the Company on 1st July, 2012. He is also a consultant of the Company since 1st July, 2012 with the term of his consultancy contract extended from 1st January, 2014 up to 30th June, 2014. He is a member of the Finance Committee and the Share Committee of the Company. Mr. Chow was an Executive Director of the Company from 1st December, 2003 to 30th June, 2012. Mr. Chow holds a Bachelor of Science degree in Chemistry and Physics from the University of Hong Kong and a Master of Business Administration degree from the Chinese University of Hong Kong. He did not hold directorships in any other public companies listed in Hong Kong and overseas in the last three years.
Simon MUrraYMr. Simon MURRAy, CBE, aged 73, has been an Independent Non-Executive Director of the Company since 1992 and was a Non-Executive Director of Orient Overseas (Holdings) Limited from 1989 until 1992. He serves as a member on the Audit Committee of the Company. He is the Chairman of General Enterprise Management Services International Limited (GEMS), a private equity fund management company. He is an Independent Non-Executive Director of Cheung Kong (Holdings) Limited and Wing Tai Properties Limited (formerly known as USI Holdings Limited), a Non-Executive Director of Greenheart Group Limited and IRC Limited, all are companies listed on The Stock Exchange of Hong Kong Limited. On 20th November, 2013, Mr. Murray was appointed an Independent Non-Executive Director of Spring Asset Management Limited, manager of Spring Real Estate Investment Trust which was listed on The Stock Exchange of Hong Kong Limited on 5th December, 2013. He is the Vice Chairman and an Independent Non-Executive Director of Essar Energy Plc and the Chairman and an Independent Non-Executive Director of Gulf Keystone Petroleum Ltd., both companies are listed in the United Kingdom and a Non-Executive Director of Compagnie Financière Richemont SA, a company listed in Switzerland. He was formerly an Independent Non-Executive Director of Hutchison Whampoa Limited, Arnhold Holdings Limited (renamed to Summit Ascent Holdings Limited after his resignation on 24th March, 2011) and a Non-Executive Chairman of Glencore International Plc (renamed to Glencore Xstrata Plc), all are companies listed in Hong Kong; an Independent Director of Sino-Forest Corporation, previously listed in Canada and a Non-Executive Director of Vodafone Group Plc, a company listed in the United Kingdom. Mr. Murray is a member of the Former Directors Committee of The Community Chest of Hong Kong and has been involved in a number of other charitable organisations, including Save The Children Fund and The China Coast Community Association.
CHaNG tsann rong ernestMr. CHANG Tsann Rong Ernest, aged 74, has been an Independent Non-Executive Director of the Company since 30th December, 2008. He is the chairman of the Remuneration Committee and a member of the Audit Committee, the Finance Committee, the Nomination Committee and the Share Committee of the Company. Mr. Chang was an Executive Director of the Company from 23rd December, 1988, a member of the Executive Committee from 30th October, 1996 and the Vice Chairman of the Company from 1st December, 2003, all until 30th June, 2006. He was a Non-Executive Director of the Company from 1st July, 2006 until 29th December, 2008. He is a Certified Public Accountant in Taiwan and holds a Master of Business Administration degree from Indiana State University, USA. He did not hold directorships in any other public companies listed in Hong Kong and overseas in the last three years.
Orient Overseas (International) Limited Annual Report 2013 41
Board of Directors
professor WoNG Yue Chim richardProfessor WONG yue Chim Richard, aged 61, has been an Independent Non-Executive Director of the Company since December 2003. He is the Chairman of the Audit Committee and a member of the Nomination Committee and the Remuneration Committee of the Company. He graduated from University of Chicago with Bachelor’s, Master’s and Ph.D. degrees in Economics and is Chair of Economics at The University of Hong Kong. He has been active in advancing economic research on policy issues in Hong Kong and China. He was awarded the Silver Bauhinia Star in 1999 by the Government of the Hong Kong Special Administrative Region for his contributions in education, housing, industry and technology development. He was appointed Justice of the Peace in July 2000. Professor Wong is currently an Independent Non-Executive Director of four other listed companies in Hong Kong, namely CK Life Sciences Int’l., (Holdings) Inc., Great Eagle Holdings Limited, Pacific Century Premium Developments Limited and Sun Hung Kai Properties Limited. He is an Independent Non-Executive Director of The Link Management Limited, the manager of The Link Real Estate Investment Trust, a Hong Kong listed company. He is an Independent Non-Executive Director of Industrial and Commercial Bank of China (Asia) Limited, a company previously listed on The Stock Exchange of Hong Kong Limited until withdrawal of its listing on 21st December, 2010.
CHeNG Wai Sun edwardMr. CHENG Wai Sun Edward, aged 58, has been an Independent Non-Executive Director of the Company since 19th March, 2009. He serves as a member on the Audit Committee of the Company. Mr. Cheng graduated from Cornell University with a Bachelor’s degree in Political Science and Economics, and Oxford University with a Bachelor’s degree in Jurisprudence and a Master’s degree. He was qualified as a solicitor in England and Wales as well as in Hong Kong. He is a Justice of the Peace and has been awarded the Silver Bauhinia Star by the Government of the Hong Kong Special Administrative Region. Mr. Cheng is an Executive Director, Chief Executive and Deputy Chairman of Wing Tai Properties Limited and an Independent Non-Executive Director of Television Broadcasts Limited, both listed on The Stock Exchange of Hong Kong Limited. Mr. Cheng has many years of public service experience in urban renewal, housing, finance, corruption prevention, technology and education. He is the Chairman of the University Grants Committee, a member of the board of The Airport Authority Hong Kong and a member of the Commission on Strategic Development of the Hong Kong Special Administrative Region Government. Mr. Cheng was the former Chairman of the Urban Renewal Authority and former member of the Advisory Committee on Corruption of the Independent Commission Against Corruption. He has also previously served on the Hong Kong Special Administrative Region Government’s Steering Committee on Innovation & Technology, the Council of the Hong Kong Institute of Education, the Council of the City University of Hong Kong, the Council of the Hong Kong Polytechnic University, the Executive Committee of the Hong Kong Housing Society, the Council of the Hong Kong Institute of Certified Public Accountants, the Securities and Futures Commission’s Takeovers and Mergers Panel and the Takeovers Appeal Committee, and was a part-time member of the Central Policy Unit.

Senior Management
Orient Overseas (International) Limited Annual Report 201342
erxin YaoMr. yao, aged 56, has been a Director of OOCL since January 2010 and a Director of Corporate Planning and Corporation Administration since January 2013. He holds a Bachelor of Arts from Toronto/Fudan University joint program and a Master of International Affairs from Columbia University. Mr. yao joined the Group in 1993 and has served the Group in various capacities for 20 years, including serving as Executive Vice-President and Head of Corporate Services of OOCL Logistics in Hong Kong, Managing Director of Orient Overseas Container Line (China) Co., Ltd. and OOCL Logistics (China) Limited based in Shanghai and President of OOCL (USA) Inc.
allan WongMr. Wong, aged 60, had been the Chief Executive Officer of OOCL Logistics since June 2004, was concurrently heading Corporate Sales Department of OOCL until 1st January 2013, appointed as OOCL Director in October 2000 and as Managing Director in November 2009 until he retired on 1st July 2013. Mr. Wong holds a Bachelor of Social Science and a Master of Business Administration from the Chinese University of Hong Kong. He joined the Group in 1976 and served the Group in various capacities for 37 years.
Michael KwokMr. Kwok, aged 59, has been the Chief Operating Officer of OOCL since July 2012, a Director of OOCL since August 2010 and Head of Regions Management since September 2013. He holds a Bachelor of Business Administration from Chinese University of Hong Kong. Mr. Kwok joined the Group in 1978 and has served the Group in various capacities for 35 years, including serving as Director of Intra Asia Trade, Head of Fleet Management and Corporate Logistics and Director of Trades.
Steve SiuMr. Siu, aged 56, has been the Chief Information Officer and a Director of OOCL since November 2006 and Chief Executive Officer of CargoSmart since January 2002. He holds a Bachelor of Science and a Master of Science from University of Essex, UK and a Master of Business Administration jointly organised by Northwestern University and The Hong Kong University of Science and Technology. Mr. Siu joined the Group in 1987 and has served the Group in various capacities for 26 years.
lammy leeMs. Lee, aged 52, has been the Company Secretary and Group Legal Advisor of OOIL since February 1997 and Compliance Officer of OOIL since June 2004. She was appointed a Director of OOCL and a member of the OOCL Executive Committee since 1st April 2011. Ms. Lee holds a Bachelor of Laws from Queen Mary College, University of London, a Barrister and member of Lincoln’s Inn and admitted as an advocate and solicitor of the High Court of Malaya. Ms. Lee joined the Group in 1988 and has served the Group in various capacities for 25 years.
Stephen NgMr. Ng, aged 55, has been the Director of Trades since July 2012, Director of Corporate Planning until June 2012 and a Director of OOCL since August 2010. He holds a Bachelor of Social Sciences from University of Hong Kong and a Master of Business Administration from Chinese University of Hong Kong. Mr. Ng joined the Group in 1987 and has served the Group in various capacities for 26 years. Before being transferred back to Hong Kong in 2010, he worked in California for seven years as Head of Trans-Pacific Trade.
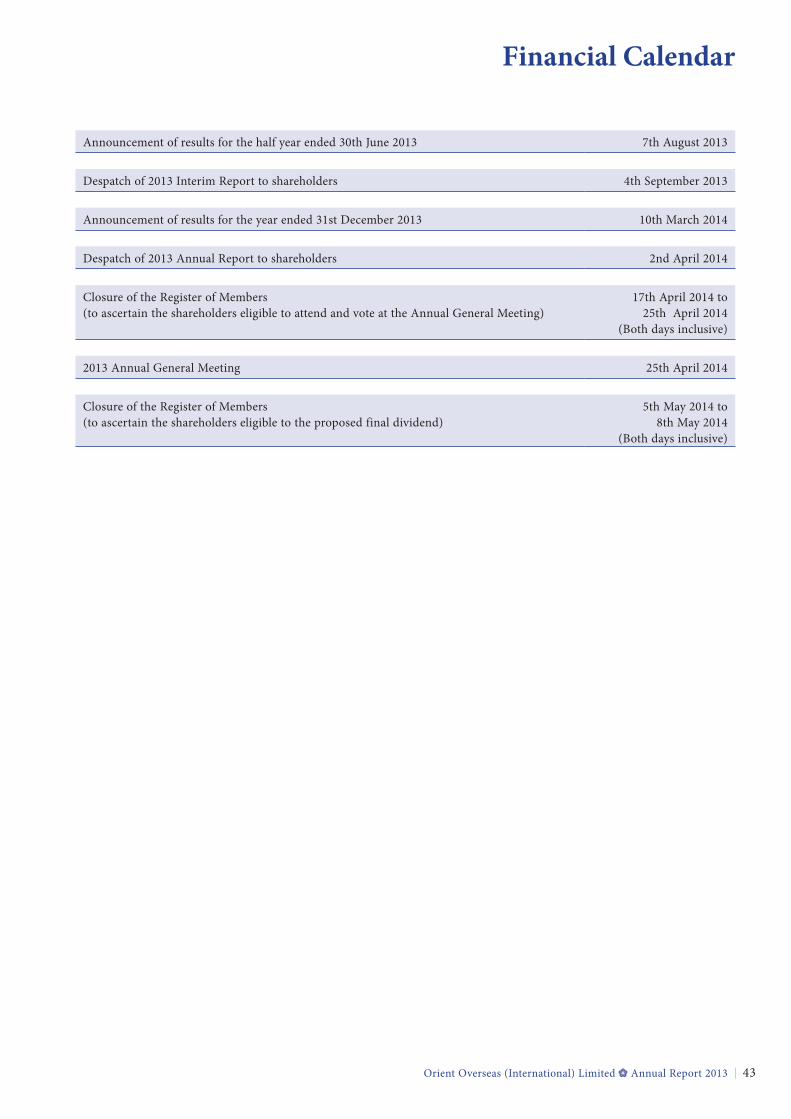
Financial Calendar
Orient Overseas (International) Limited Annual Report 2013 43
Announcement of results for the half year ended 30th June 2013 7th August 2013
Despatch of 2013 Interim Report to shareholders 4th September 2013
Announcement of results for the year ended 31st December 2013 10th March 2014
Despatch of 2013 Annual Report to shareholders 2nd April 2014
Closure of the Register of Members (to ascertain the shareholders eligible to attend and vote at the Annual General Meeting)
17th April 2014 to 25th April 2014
(Both days inclusive)
2013 Annual General Meeting 25th April 2014
Closure of the Register of Members (to ascertain the shareholders eligible to the proposed final dividend)
5th May 2014 to 8th May 2014
(Both days inclusive)
Shareholder Information
Orient Overseas (International) Limited Annual Report 201344
orDiNarY SHareSIssued shares 625,793,297 shares (as at 31st December, 2013)Nominal value per share US$0.10
aNNUal report
This annual report is available in both English and Chinese.
Shareholders can obtain copies by writing to:Computershare Hong Kong Investor Services Limited17M Floor, Hopewell Centre183 Queen’s Road East, Wanchai, Hong Kong
If you are not a shareholder, please write to:Orient Overseas (International) Limited33rd Floor, Harbour Centre25 Harbour RoadWanchai, Hong KongAttn: Company Secretary
This annual report is also available at our website at http://www.ooilgroup.com.
SHareHolDer SerViCeS
Any matters relating to your shareholding, including transfer of shares, change of name or address, and loss of share certificates should be addressed in writing to:
Computershare Hong Kong Investor Services Limited17M Floor, Hopewell Centre183 Queen’s Road East, Wanchai, Hong KongTelephone: (852) 2862 8555 Facsimile: (852) 2865 0990
SHareHolDer eNQUirieS
Any matters relating to shareholders’ rights should be addressed in writing to:Orient Overseas (International) Limited33rd Floor, Harbour Centre25 Harbour RoadWanchai, Hong KongAttn: Company Secretary
Our enquiry hotline is operational during normal office hours:Telephone: (852) 2833 3888 Facsimile: (852) 2531 8147
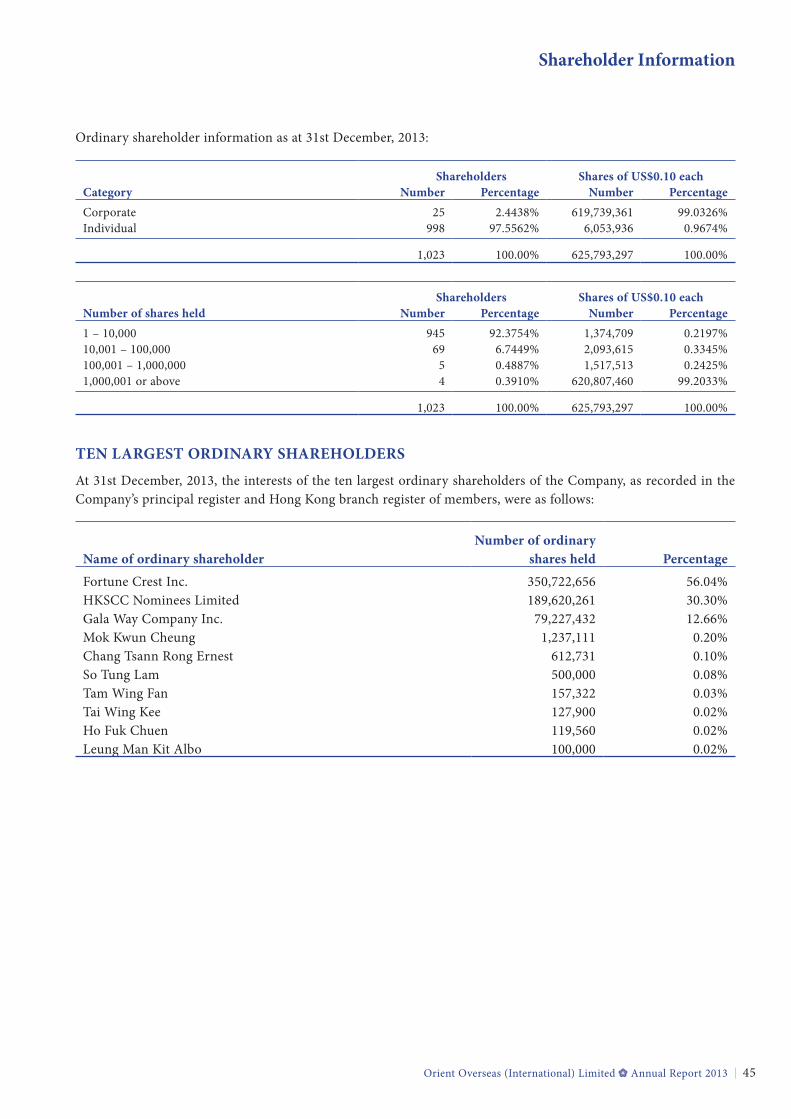
Shareholder Information
Orient Overseas (International) Limited Annual Report 2013 45
Ordinary shareholder information as at 31st December, 2013:
Shareholders Shares of US$0.10 eachCategory Number percentage Number percentage
Corporate 25 2.4438% 619,739,361 99.0326%Individual 998 97.5562% 6,053,936 0.9674%
1,023 100.00% 625,793,297 100.00%
Shareholders Shares of US$0.10 eachNumber of shares held Number percentage Number percentage
1 – 10,000 945 92.3754% 1,374,709 0.2197%10,001 – 100,000 69 6.7449% 2,093,615 0.3345%100,001 – 1,000,000 5 0.4887% 1,517,513 0.2425%1,000,001 or above 4 0.3910% 620,807,460 99.2033%
1,023 100.00% 625,793,297 100.00%
teN larGeSt orDiNarY SHareHolDerS
At 31st December, 2013, the interests of the ten largest ordinary shareholders of the Company, as recorded in the Company’s principal register and Hong Kong branch register of members, were as follows:
Name of ordinary shareholderNumber of ordinary
shares held percentage
Fortune Crest Inc. 350,722,656 56.04%HKSCC Nominees Limited 189,620,261 30.30%Gala Way Company Inc. 79,227,432 12.66%Mok Kwun Cheung 1,237,111 0.20%Chang Tsann Rong Ernest 612,731 0.10%So Tung Lam 500,000 0.08%Tam Wing Fan 157,322 0.03%Tai Wing Kee 127,900 0.02%Ho Fuk Chuen 119,560 0.02%Leung Man Kit Albo 100,000 0.02%
Corporate Governance Report
Orient Overseas (International) Limited Annual Report 201346
Corporate GoVerNaNCe CoDe
The Board of Directors (the “Board”) and management of the Company are committed to maintaining high standards of corporate governance and the Company considers that effective corporate governance makes an important contribution to corporate success and to the enhancement of shareholder value.
The Company has adopted its own corporate governance code (the “CG Code”), which in addition to applying the principles as set out in the Corporate Governance Code and Corporate Governance Report (the “SEHK Code”) contained in Appendix 14 to the Rules Governing the Listing of Securities on The Stock Exchange of Hong Kong Limited (the “Listing Rules”), also incorporates and conforms to local and international best practices. The CG Code sets out the corporate governance principles applied by the Company and its subsidiaries (the “Group”) and is constantly reviewed to ensure transparency, accountability and independence.
Throughout the year 2013, the Company complied with the SEHK Code, save for the following:
• Code provision
Code provision Deviation Considered reason for deviation
Separation of the roles of chairman and chief executive officer of a listed issuer.
Mr. TUNG Chee Chen currently assumes the role of both Chairman and Chief Executive Officer of the Company.
The executive members of the Board currently consist of chief executive officer of the principal division of the Group and there is an effective separation of the roles between the chief executive of its principal division and the Chief Executive Officer of the Company. The Board considers that further separation of the roles of the Chief Executive Officer and Chairman would represent duplication and is not necessary for the time being.
• recommended Best practices• the remuneration of senior management is disclosed in bands• operational results are announced and published quarterly instead of financial results
Corporate Governance Report
Orient Overseas (International) Limited Annual Report 2013 47
We have set out in this report our guiding principles and rationale for implementation of the CG Code as well as the status of the Company’s compliance with Appendix 14 to the Listing Rules during the year 2013:
a. BoarD of DireCtorS
1. Board Composition
The Board currently comprises of three Executive Directors, two Non-Executive Directors and four Independent Non-Executive Directors.
executive Directors
Mr. TUNG Chee Chen (Chairman, President and Chief Executive Officer)Mr. TUNG Lieh Cheung AndrewMr. TUNG Lieh Sing Alan* (Acting Chief Financial Officer)* appointed as the Acting Chief Financial Officer on 1st June, 2013
Non-executive Directors
Professor Roger KINGMr. CHOW Philip yiu Wah
independent Non-executive Directors
Mr. Simon MURRAyMr. CHANG Tsann Rong ErnestProfessor WONG yue Chim RichardMr. CHENG Wai Sun Edward
The biographical details of the Directors and the relevant relationships between them are set out on the Company’s website at http://www.ooilgroup.com and on pages 38 to 41 of this annual report.
The Directors have formal letters of appointment setting out the key terms and conditions of their appointment, and are for a fixed term of three years and subject to re-election by rotation at least once every three years. Mr. CHOW Philip yiu Wah has a consultancy contract with the Company which will expire on 30th June, 2014.
The Directors have extensive corporate and strategic planning experience and industry knowledge. All Independent Non-Executive Directors are financially independent from the Group bringing independent and diversified experience, competencies, skills and judgment to the Group’s strategy and policies through their informed contributions. The Board considers that there is a reasonable balance between Executive and Non-Executive Directors and has provided adequate checks and balances for safeguarding the interests of the shareholders and the Group.
The Company has received from each Independent Non-Executive Director a written annual confirmation of their independence and considers that all the Independent Non-Executive Directors have satisfied their independence to the Group up to the date of this annual report.
Corporate Governance Report
Orient Overseas (International) Limited Annual Report 201348
During the year 2013, the Board has complied with the Listing Rules’ requirement in having at least three Independent Non-Executive Directors representing at least one-third of the Board, including one with appropriate professional qualifications or accounting or related financial management expertise.
Among the members of the Board, Professor Roger KING (Non-Executive Director of the Company) is the brother-in-law of Mr. TUNG Chee Chen (Chairman, President and Chief Executive Officer of the Company), and both Mr. TUNG Lieh Cheung Andrew (Executive Director of the Company) and Mr. TUNG Lieh Sing Alan (Executive Director and Acting Chief Financial Officer of the Company) are the nephews of both Mr. TUNG Chee Chen and Professor Roger KING.
Directors’ and officers’ liabilities insurance
Since 1990, the Company has arranged insurance cover for directors’ and officers’ liabilities including cover for Directors, officers and senior management of the Group arising out of corporate activities.
2. Board and Management responsibilities
The Board is responsible for the overall strategic direction and management of the business and affairs of the Group with the objective of enhancing shareholder value and presenting a balanced, clear and understandable assessment of the Company’s performance, position and prospects in the annual and interim reports, and announcements and other financial disclosures as required under the Listing Rules, and reports to regulators any information required to be disclosed pursuant to statutory requirements.
The Board has a fiduciary duty and statutory responsibility towards the Company and the Group. Other responsibilities include formulation of the Group’s overall strategy and policies, setting of corporate and management targets and key operational initiatives, setting of policies on risk management pursuant to the Group’s strategic objectives, monitoring and control of operational and financial performance, and approval of budgets and major capital expenditures, major investments, material acquisitions and disposals of assets, corporate or financial restructuring, significant operational financial and management matters.
The Board delegates day-to-day management of the business of the Group to the management of the principal division under the leadership and supervision of the Chief Executive Officer, who will implement and report to the Board on adoption of the Company’s strategy, policies and objectives by the principal division of the Group.
The Board also delegates certain specific responsibilities to eight committees (Executive Committee, Audit Committee, Remuneration Committee, Nomination Committee, Compliance Committee, Finance Committee, Share Committee and Inside Information Committee (established on 7th August, 2013)). The composition and functions of each committee are described below. These committees have specific functions and authority to examine issues and report to the Board with their recommendations (if appropriate). The final decision rests with the Board, unless otherwise provided for in the terms of reference of the relevant committees.
The Company Secretary provides the Directors with updates on developments regarding the Listing Rules and other applicable regulatory requirements. Any Director may request the Company Secretary to organise independent professional advice at the expense of the Company to assist the Directors to effectively discharge their duties to the Company. No such independent professional advice was requested by any Director in 2013.
Corporate Governance Report
Orient Overseas (International) Limited Annual Report 2013 49
3. Chairman and Chief executive officer
Mr. TUNG Chee Chen is the Chairman and the Chief Executive Officer of the Company with the respective roles set out in writing.
a. The primary role of the Chairman is to provide leadership to the Board and to ensure that the Board functions effectively in the discharge of its responsibilities. His duties include to:
– ensure that Directors are briefed and have received timely, accurate, complete and clear information on issues to be discussed at Board meetings;
– ensure that the Board works effectively and performs its responsibilities, and that all key and appropriate issues were discussed in a timely manner and that good corporate governance practices and procedures are established, implemented and maintained;
– approve the agenda drawn up by the Company Secretary for each Board meeting taking into account any matters proposed by other Directors for inclusion in the agenda;
– promote a culture of openness and debate by facilitating the effective contribution of Non-Executive Directors (including Independent Non-Executive Directors) in particular and ensuring constructive relations between Executive and Non-Executive Directors; and encourage Directors with different views to voice their concerns, allow sufficient time for discussion of issues and ensure that Board decisions fairly reflect Board consensus;
– at least annually to hold meetings with the Non-Executive Directors (including Independent Non-Executive Directors) without the presence of the other Executive Directors;
– ensure effective communication with shareholders and that their views are communicated to the Board; and to
– attend the annual general meetings and invite the chairmen of the Audit Committee, the Remuneration Committee, the Nomination Committee and the other Board committees, or in the absence of the chairman of the respective Board committees, other members of the related Board committees to be available to answer questions at the annual general meetings.
In case of an equality of votes at any Board meetings, the Chairman shall be entitled to a second or casting vote.
Corporate Governance Report
Orient Overseas (International) Limited Annual Report 201350
b. The primary role of the Chief Executive Officer is to be responsible for the day-to-day management and operation of the Company and Group business. His duties include to:
– provide leadership and supervise the effective management of the principal division of the Group;
– monitor and control the operational and financial performance of the principal division of the Group;
– implement and report to the Board on the adoption of the Company’s strategy, policies and objectives by the principal division of the Group;
– provide information to the Board (as necessary) to enable the Board to monitor the performance of management and operation of the principal division of the Group; and to
– set up programmes for management development and succession planning for the principal division of the Group.
4. Board Meetings
Regular Board meetings are scheduled one year in advance to maximise the attendance of Directors. The Board meets at least four times each year and has a formal schedule of matters referred to it for consideration and decision. Additional meetings may be convened as and when necessary. Notice of at least fourteen days is served for regular Board meetings and reasonable notice is given for all other Board meetings. Directors are consulted and provided with an opportunity to include matters into the agenda for discussion at the Board meetings. The Company Secretary assists the Chairman in preparing the agenda for each Board meeting and to ensure that applicable rules and regulations regarding the meetings are observed. The final agenda together with the Board papers are distributed to the Directors at least three days before the Board meetings.
If a Director (who may also be a substantial shareholder of the Company) has a conflict of interest in any matter to be considered by the Board, the Company Secretary shall ensure that such matter is dealt with by a physical Board meeting rather than a written resolution. If considered appropriate, the Board meeting shall be attended by Independent Non-Executive Directors who have no material interest in the matter. The affected Director shall abstain from voting on any such resolution in which they or any of their associates have a material interest and shall not be counted in the quorum present at that Board meeting.
The Company Secretary shall ensure that the procedures and applicable rules and regulations are observed. Copies of all signed minutes of the Board are sent to the Directors for their record.
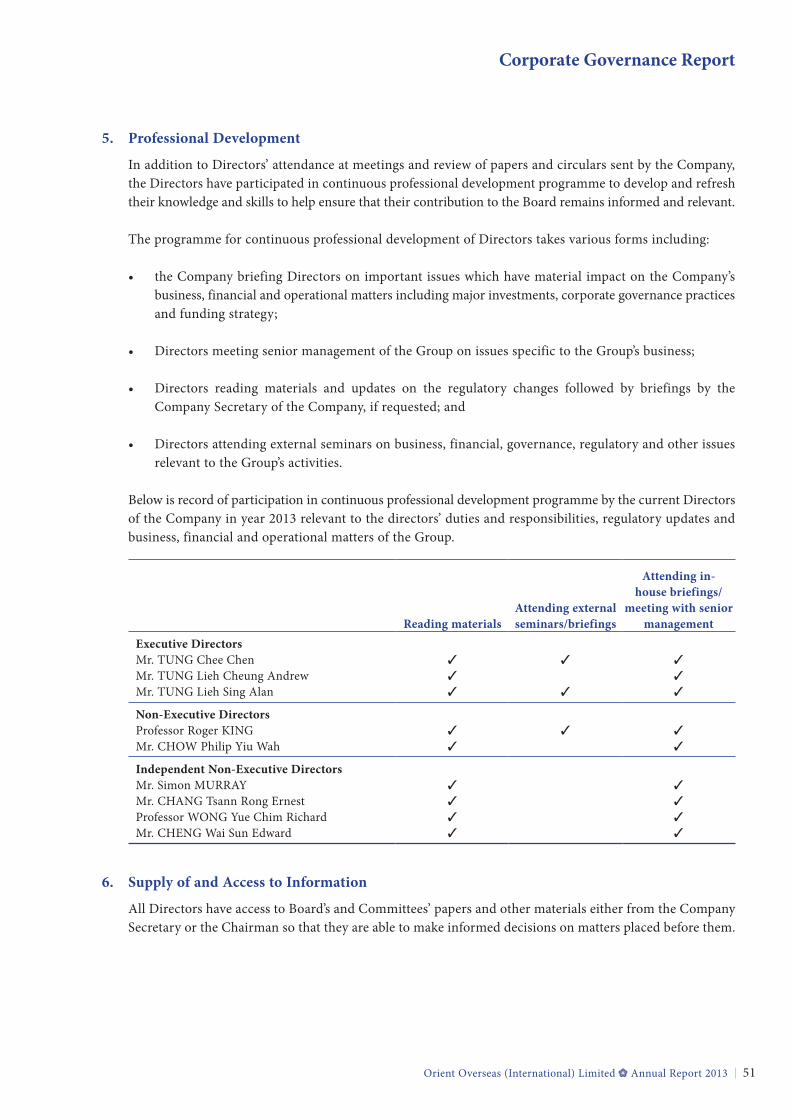
Corporate Governance Report
Orient Overseas (International) Limited Annual Report 2013 51
5. professional Development
In addition to Directors’ attendance at meetings and review of papers and circulars sent by the Company, the Directors have participated in continuous professional development programme to develop and refresh their knowledge and skills to help ensure that their contribution to the Board remains informed and relevant.
The programme for continuous professional development of Directors takes various forms including:
• the Company briefing Directors on important issues which have material impact on the Company’s business, financial and operational matters including major investments, corporate governance practices and funding strategy;
• Directors meeting senior management of the Group on issues specific to the Group’s business;
• Directors reading materials and updates on the regulatory changes followed by briefings by the Company Secretary of the Company, if requested; and
• Directors attending external seminars on business, financial, governance, regulatory and other issues relevant to the Group’s activities.
Below is record of participation in continuous professional development programme by the current Directors of the Company in year 2013 relevant to the directors’ duties and responsibilities, regulatory updates and business, financial and operational matters of the Group.
reading materialsattending external seminars/briefings
attending in-house briefings/
meeting with senior management
executive DirectorsMr. TUNG Chee Chen 3 3 3
Mr. TUNG Lieh Cheung Andrew 3 3
Mr. TUNG Lieh Sing Alan 3 3 3
Non-executive DirectorsProfessor Roger KING 3 3 3
Mr. CHOW Philip yiu Wah 3 3
independent Non-executive DirectorsMr. Simon MURRAy 3 3
Mr. CHANG Tsann Rong Ernest 3 3
Professor WONG yue Chim Richard 3 3
Mr. CHENG Wai Sun Edward 3 3
6. Supply of and access to information
All Directors have access to Board’s and Committees’ papers and other materials either from the Company Secretary or the Chairman so that they are able to make informed decisions on matters placed before them.
Corporate Governance Report
Orient Overseas (International) Limited Annual Report 201352
7. Nomination of Directors
The Nomination Committee was established in 2012. The Committee reviews the structure, size and composition (including the skills, knowledge, experience and from diversity perspective) of the Board regularly and makes recommendation to the Board. The Company follows a formal, considered and transparent procedure for the appointment of new Directors to the Board. The appointment of a new Director is a collective decision of the Board, taking into consideration the expertise, experience, integrity and commitment of that appointee to the principal division, the Company and the Group.
Each Director shall, after his appointment and semi-annually thereafter, disclose to the Board the number and nature of offices held by such Director in other public companies and organisations and any other significant commitments, together with the identity of the public companies and organisations and an indication of time involved.
At the annual general meeting of the Company held on 26th April, 2013 (the “2012 AGM”), Mr. TUNG Chee Chen, Mr. TUNG Lieh Sing Alan, Professor Roger KING and Professor Wong yue Chim Richard retired and were re-elected as Directors of the Company.
8. Board Committees
In addition to the Audit Committee, the Remuneration Committee and the Nomination Committee established in compliance with the Listing Rules, the other committees comprise of the Executive Committee, the Finance Committee, the Share Committee, the Compliance Committee and the Inside Information Committee (established on 7th August, 2013). Each committee has its own well defined scope of duties and terms of reference. The terms of reference of the Audit Committee, the Remuneration Committee and the Nomination Committee are available on the Company’s website and the HKExnews website. The Company Secretary shall also make available the terms of reference of all the committees to any shareholder upon receipt of a written request from such shareholder. The members of a committee are empowered to make decisions on matters within the terms of reference of such committee. Copies of all signed minutes of the committees are sent to the members of the respective committees and the Directors of the Company for their record.
a. executive Committee
The Executive Committee was established in 1996. All its members are Executive Directors. It currently comprises of Mr. TUNG Chee Chen (chairman of the Executive Committee), Mr. TUNG Lieh Cheung Andrew and Mr. TUNG Lieh Sing Alan (elected as a member of the Executive Committee on 1st June, 2013), with Ms. Lammy LEE as the secretary of the Executive Committee.
The Executive Committee operates as an executive management committee under the direct authority of the Board. Its primary duties include to:
– formulate strategies and policies and to set corporate and management targets and operational initiatives and policies on risk management for the principal division of the Group and plans and operational directions for the Group;
Corporate Governance Report
Orient Overseas (International) Limited Annual Report 2013 53
– monitor, control and manage operational and financial performance and business affairs of the principal division of the Group;
– review, discuss and approve (if appropriate) (i) press announcements, circulars and other documents (including inside information and financial information) required to be disclosed pursuant to the Listing Rules, regulatory or statutory requirements; (ii) submissions from the Compliance Committee, the Finance Committee and the Share Committee and, if appropriate, to recommend to the Board for consideration and approval;
– approve capital expenditure for a specified amount;
– liaise and consult with, advise and make recommendations to its subsidiaries and make such decisions with regard thereto as the Executive Committee shall in its absolute discretion think fit, and refer such matters as it thinks fit to the Board of the Company for consideration, approval and/or ratification, if necessary; and to
– report to the Board on its decisions, and any matters in respect of which it considers that action is needed, and its recommendations as to the steps to be taken.
b. audit Committee
The Audit Committee was established in 1992. All its members are Independent Non-Executive Directors. It currently comprises of Professor WONG yue Chim Richard (chairman of the Audit Committee), Mr. Simon MURRAy, Mr. CHANG Tsann Rong Ernest and Mr. CHENG Wai Sun Edward, with Mr. FUNG yee Chung Vincent, the Head of Internal Audit as the secretary and Ms. Lammy LEE as the assistant secretary.
The Audit Committee is delegated by the Board with the responsibility to provide an independent review and supervision of financial reporting and to ensure the effectiveness of the Group’s internal controls and the adequacy of the external and internal audits. To perform its duties, the Audit Committee is provided with sufficient resources and is supported by the Internal Audit Department to examine all matters relating to the Group’s adopted accounting principles and practices and to review all material financial, operational and compliance controls. The terms of reference of the Audit Committee are posted on the Company’s website.
The primary duties of the Audit Committee include to:
– recommend to the Board on the appointment, reappointment and removal of the external auditor, and to approve the remuneration and terms of engagement of the external auditor, and any questions of its resignation or dismissal;
– act as the key representative body overseeing the Company’s relations with the external auditor;
– seek from the external auditor, on an annual basis, information about policies and processes for maintaining independence and monitoring compliance with relevant requirements, including provision of non-audit services and requirements regarding rotation of audit partners and staff;
Corporate Governance Report
Orient Overseas (International) Limited Annual Report 201354
– discuss with the external auditor any recommendation arising from the audit, and to review the external auditor’s management letter, any material queries raised by the external auditor to management about accounting records, financial accounts or systems of control and management’s response, and to ensure that the Board will provide timely response to the issues raised in the external auditor’s management letter;
– establish and review from time to time the procedure to review and monitor the external auditor’s independence and objectivity, and the effectiveness of the audit process and the scope of the external auditor, and to discuss and understand the factors considered by the external auditor in determining the scope of the audit and reporting obligations before the audit commences;
– establish and review from time to time the policy relating to hiring of employees or former employees of the external auditors and monitor the application of such policy; and to consider whether as a result of such hiring there has been any impairment of the auditor’s judgment or independence in respect of the audit;
– establish and review from time to time the policy on engaging external auditors to supply non-audit services and to review such services do not impair the external auditor’s independence or objectivity in relation to non-audit services including whether the skills and experience of the external auditor make it a suitable supplier of non-audit services; whether there are safeguards in place to ensure that there is no threat to the objectivity and independence of the audit because the external auditor provides non-audit services; and the nature of the non-audit services, the related fee levels and fee levels individually and in total relative to the external auditor;
– review the Group’s financial and accounting policies and practices;
– review the Company’s annual, quarterly (if prepared for publication) and interim financial reports and significant financial reporting judgments contained in them, with particular focus on changes in accounting policies and practices, major judgmental areas, any significant audit adjustments, the going concern assumption and any qualifications, compliance with any applicable legal requirements and accounting standards, and compliance with the requirements of the Listing Rules and other legal requirements in relation to financial reporting;
– consider any significant or unusual items that are, or may need to be, reflected in the reports and accounts and to give due consideration to any matters that have been raised by the Financial Compliance Officer of the Company, the external auditor, the Head of Internal Audit Department or the staff responsible for the accounting and financial reporting function;
– review with the Group’s management, the external auditor and the internal auditor, the adequacy of the Group’s policies and procedures regarding internal control system (including financial, operational and compliance controls) and risk management system to ensure that such systems are effective with audit trails to protect the accuracy and integrity of financial data and to pursue relevant enquiries into matters having, or likely to have, a material effect on the business and financial conditions of the Group. The result of the review is to be reported in the Corporate Governance Report of the Company, including a Directors’ statement that they have conducted a review of its internal control system;
Corporate Governance Report
Orient Overseas (International) Limited Annual Report 2013 55
– discuss with the management the scope and quality of the internal control system and to ensure that management has performed its duty to have an effective internal control system including the adequacy of resources, staff qualifications and experience, training programmes and budget and experience of staff of the accounting and financial reporting function;
– review findings of internal investigation and management’s response of any suspected frauds or irregularities or failures of internal controls or infringements of laws, rules and regulations;
– review the scope and effectiveness of the internal audit functions and to review the results of the internal audit functions regularly with the internal auditor matters including planning of the Audit Committee meetings and, if required by the internal auditor, the internal audit programme; and to ensure co-ordination between the internal and external auditors and that the internal audit function is adequately resourced and has appropriate standing within the Company and to review and monitor its effectiveness;
– review the effectiveness and monitor the use of the whistleblowing policy and procedures for employees to raise concerns, in confidence, to the Audit Committee about improprieties in financial reporting, internal control and other matters; and to ensure that proper arrangements are in place for fair and independent investigation of these improprieties and for appropriate follow-up action;
– report to the Board on the matters raised in the SEHK Code; and to
– report to the Board, identifying and making recommendations on any matters where action or improvement is needed and to consider other topics identified and referred to the Audit Committee by the Board.
Under the Group’s whistleblowing policy, employees may report any concern regarding accounting, internal accounting controls and auditing matters to the Audit Committee without fear of dismissal or retaliation, in order to ensure that the Group complies with all the applicable laws and regulations, accounting standards, accounting controls and audit practices. The Audit Committee will review each complaint and decide on how the investigation should be conducted. In 2013, the Audit Committee received no complaint from employees.
The Audit Committee held two meetings during the year ended 31st December, 2013. The following is a summary of work performed by the Audit Committee during 2013:
(i) reviewed and discussed the annual accounts for 2012 and the interim accounts for 2013 with the external auditor and management of the Company, with recommendations to the Board for approval;
(ii) reviewed the significant audit and accounting issues arising from the external auditor’s statutory audit of the 2012 annual accounts and issues arising from the review of the 2013 interim accounts;
(iii) reviewed the impact of the new and revised accounting standards on the Company;
(iv) reviewed the external auditor’s audit strategy and approach;
Corporate Governance Report
Orient Overseas (International) Limited Annual Report 201356
(v) reviewed the non-audit services provided by the external auditor in 2012;
(vi) met with the external auditor without the presence of management to discuss issues from the audits and any other matters the external auditor might care to raise;
(vii) reviewed the Internal Audit Department’s audit objectives and approval of the annual internal audit plan;
(viii) reviewed the findings and recommendations of the Internal Audit Department on the audits carried out on the principal activities of the Group during the year 2012;
(ix) reviewed the effectiveness of the internal control systems;
(x) reviewed the relevant sections in the Corporate Governance Report for the year ended 31st December, 2012 concerning the Audit Committee;
(xi) reviewed the adequacy of the resources, staff qualifications and experience, training programmes and budget of the Company’s accounting and financial reporting function;
(xii) reviewed the continuing connected transactions and their annual caps; and
(xiii) reviewed the continuous implementation of the whistleblowing policy.
The minutes of the Audit Committee meetings are prepared by the secretary of the Audit Committee with details of all matters considered by the attendees and of decisions reached, including any concern raised by the attendees and dissenting views expressed. The final version of the minutes is sent to the attendees for their records. The minutes are open for inspection by the Committee members and the Board members.
c. remuneration Committee
The Remuneration Committee was established in 2005. A majority of its members are Independent Non-Executive Directors. It currently comprises of Mr. CHANG Tsann Rong Ernest (chairman of the Remuneration Committee), Mr. TUNG Chee Chen and Professor WONG yue Chim Richard, with Ms. Lammy LEE as the secretary of the Remuneration Committee.
The primary duties of the Remuneration Committee include to:
– review and recommend to the Board on the Company’s policy and structure of the remuneration of the Directors of the Company, senior management and employees of the Group including performance-based bonus scheme on the basis that they are fairly but responsibly rewarded for their individual contribution to the overall performance of the Company;
Corporate Governance Report
Orient Overseas (International) Limited Annual Report 2013 57
– establish and review a formal and transparent procedure for developing remuneration policy;
– (i) review and approve the management’s remuneration proposals with reference to the Board’s corporate goals and objectives; and determine with delegated responsibilities the remuneration packages of individual Executive Directors of the Company and senior management; and (ii) recommend to the Board on the remuneration of the Non-Executive Directors of the Company;
– consult the Chairman of the Board and/or Chief Executive Officer of the Company about their remuneration proposals for the other Executive Directors of the Company and senior management;
– review and approve compensation payable to the Executive Directors of the Company and senior management for any loss or termination of office or appointment to ensure that it is consistent with contractual terms and is otherwise fair and not excessive;
– review and approve compensation arrangements relating to dismissal or removal of Directors for misconduct to ensure that they are consistent with contractual terms and are otherwise reasonable and appropriate;
– ensure that no Director or any of his associates or senior management is involved in deciding his own remuneration; and to
– advise the Board any matters relating to the remuneration or reward of the Executive Directors of the Company or senior management or employees of the Group.
The Remuneration Committee held two meetings during the year ended 31st December, 2013. The following is a summary of work performed by the Remuneration Committee during 2013, including:
(i) reviewed the Company’s policy and remuneration structure for the Directors of the Company, and the senior management and employees of the Group;
(ii) reviewed the discretionary management bonus of the Executive Directors of the Company, and the senior management and employees of the Group for the year 2012; and
(iii) reviewed and recommended to the Board or determined with delegated responsibilities, as the case may be in accordance with the terms of reference of the Remuneration Committee, the remuneration packages of the Directors of the Company, and the senior management and employees of the Group for the year 2013.
No Director was involved in determining his own remuneration.
Corporate Governance Report
Orient Overseas (International) Limited Annual Report 201358
d. Nomination Committee
The Nomination Committee was established in 2012. A majority of its members of the Nomination Committee are Independent Non-Executive Directors and currently comprises of Mr. TUNG Chee Chen (chairman of the Nomination Committee), Mr. CHANG Tsann Rong Ernest and Professor WONG yue Chim Richard, with Ms. Lammy LEE as the secretary of the Nomination Committee.
The primary duties of the Nomination Committee include to:
– review and make recommendation to the Board on the Company’s policy for nomination of Directors;
– establish and review a formal, considered and transparent procedures for the appointment of new directors and have plans in place for orderly succession for appointments;
– review and report annually on implementation of the board diversity policy of the Company (the “Board Diversity Policy”), and progress (if relevant);
– review the structure, size and composition (including the skills, knowledge, experience and from diversity perspective) of the Board at least annually and recommend on any proposed changes to the Board to complement the Company’s corporate strategy;
– identify, nominate and recommend to the Board suitably qualified candidate, based on meritocracy and the Board Diversity Policy appropriate for the Company’s business and specific needs, to become a director of the Company either to fill a casual vacancy or as an addition to the existing Board;
– recommend to the Board on the appointment or re-appointment/re-election of Directors and succession planning for Directors to maintain a balance of skills, knowledge, experience and diversity of perspectives of the Board;
– assess and report to the Board the qualifications of any person proposed by a shareholder of the Company for election as a director of the Company to ensure compliance with the nomination policy of the Company and the requirements as provided in the Listing Rules are satisfied;
– assess the independence of Independent Non-Executive Directors of the Company;
– regularly review and report to the Board the contribution required from a Director of the Company to perform his responsibilities and whether he is spending sufficient time performing them; and to
– assess performance of the Executive Directors and conduct a regular evaluation of the Board’s performance by a member of the Nomination Committee, who is an Independent Non-Executive Director, and report results of the evaluation to the Board.
Corporate Governance Report
Orient Overseas (International) Limited Annual Report 2013 59
The Nomination Committee held two meetings and passed resolutions by way of written resolution during the year ended 31st December, 2013. The following is a summary of work performed by the Nomination Committee during 2013, including:
(i) reviewed the structure, size and composition of the Board of the Company;
(ii) assessed independence of the Independent Non-Executive Directors of the Company;
(iii) reviewed the contribution of the Directors of the Company for the year 2012;
(iv) evaluated performance of the Board and assessed performance of the Executive Directors of the Company by a member of the Nomination Committee who is an Independent Non-Executive Director of the Company in accordance with the terms of reference of the Nomination Committee;
(v) recommended re-election of the retiring directors at the annual general meeting of the Company held on 26th April, 2013;
(vi) recommended to the Board the appointment of Mr. TUNG Lieh Sing Alan as the Acting Chief Financial Officer and election as a member of the Executive Committee and the Compliance Committee of the Company;
(vii) recommended to the Board extension of the consultancy contract for Mr. CHOW Philip yiu Wah, a Non-Executive Director of the Company;
(viii) recommended the Board Diversity Policy to the Board; and
(ix) reviewed and recommended to the Board the amendments to the terms of reference of the Nomination Committee.
The Board Diversity Policy is summarized as follows:
– the Company ensures that its Board has the appropriate balance of skills, experience and diversity of perspective of the Board requires to support the execution of its business strategy and in order for the Board to be effective;
– selection of candidates will be based on a range of perspectives, including but not limited to age, culture and educational background, ethnicity, industry experience, skills, knowledge and length of service. The Board’s appointment should be based on meritocracy and diversity of perspectives appropriate for the Company’s business and specific needs and the contribution that the selected candidates will bring to the Board; and
– the Nomination Committee will take into consideration of the Board Diversity Policy in identifying and nominating suitably qualified candidates to become members of the Board.
Corporate Governance Report
Orient Overseas (International) Limited Annual Report 201360
e. Compliance Committee
The Compliance Committee was established in 2004 and currently comprises of Ms. Lammy LEE (chairperson of the Compliance Committee), Mr. TUNG Lieh Sing Alan, Mr. MOK yun Lee Paul and Mr. FUNG yee Chung Vincent. The Board has delegated the responsibility for monitoring the corporate governance compliance to the Compliance Committee.
The primary duties of the Compliance Committee include to:
– review, monitor and provide administrative support on the compliance control of the Group and compliance of the following corporate governance functions of the Company:
(a) on the Company’s policies and practices on corporate governance and make recommendations to the Board;
(b) on the training and continuous professional development of Directors and senior management of the Group;
(c) on the Company’s policies and practices on compliance with legal and regulatory requirements;
(d) on the development of the code of conduct and compliance manuals (if any) applicable to employees and Directors;
(e) on the Company’s compliance with the CG Code and the SEHK Code;
(f) to report the above items (a) to (e) to the Board regularly; and
(g) to prepare (i) the Corporate Governance Report covering all mandatory disclosure requirements as set out in the Listing Rules; and/or (ii) information required to be disclosed by the Compliance Committee in the Company’s results announcements, the annual reports, the interim reports and any other documents, pursuant to the Listing Rules;
– review and report to the Board regularly the shareholders’ communication policy to ensure its effectiveness; and to
– ensure the Company is in compliance with the Listing Rules including disclosure and compliance obligations for matters including notifiable transactions, connected transactions, continuing connected transactions, advance to an entity, financial assistance and guarantees to affiliated companies of the Company, loan agreements with covenants relating to specific performance of the controlling shareholder of the Company, breach of a loan agreement by the Company, disclosure of financial information pursuant to Appendix 16 to the Listing Rules, and general obligations of disclosure under Rule 13.09 of the Listing Rules.
Corporate Governance Report
Orient Overseas (International) Limited Annual Report 2013 61
The Compliance Committee held three meetings and passed resolutions by way of written resolution during the year ended 31st December, 2013. The following is a summary of work performed by the Compliance Committee during 2013, including:
(i) reviewed and reported to the Board on the amendments to the SEHK Code and the Listing Rules in relation to the board diversity policy and the environmental, social and governance reporting guidance;
(ii) reviewed and recommended to the Board the revisions to the Company’s CG Code;
(iii) reviewed the Company’s policies and practices on corporate governance and made recommendations to the Board;
(iv) reviewed the Company’s compliance with the CG Code and the SEHK Code and the disclosure requirements in the Corporate Governance Report;
(v) reviewed and monitored the Company’s policies and practices on compliance with legal and regulatory requirements, particularly in the areas of legal, financial and accounting, internal control and audit;
(vi) reviewed and monitored the code of conduct and compliance applicable to employees and Directors of the Company;
(vii) reviewed and recommended to the Board on the connected transaction in relation to the renewal of the consultancy contract of Mr. CHOW Philip yiu Wah, a Non-Executive Director of the Company;
(viii) reviewed and monitored the training and continuous professional development of Directors of the Company;
(ix) reviewed and reported to the Board on the renewal of the continuing connected transactions and the revision of the annual caps for years 2014, 2015 and 2016, and the significant contracts of the Group; and
(x) reviewed and reported to the Board on the effectiveness of the shareholders’ communication policy.
f. finance Committee
The Finance Committee was established in 1993 and currently comprises of Professor Roger KING, Mr. CHOW Philip yiu Wah and Mr. CHANG Tsann Rong Ernest, with Ms. Lammy LEE as the secretary of the Finance Committee.
The primary duties of the Finance Committee include to:
– assist in the financial requirements of the Group including financing, refinancing, leasing, purchase and sale of vessels, properties and equipment and the financing of the business operations of the Group;
Corporate Governance Report
Orient Overseas (International) Limited Annual Report 201362
– report to the Board on its decisions, and any matters in respect of which it considers that action is needed, and its recommendations as to the steps to be taken; and to
– discuss and review the disclosure obligations of the Company on financial, accounting or related issues on compliance with the Listing Rules and refer transactions with their recommendations to the Executive Committee of the Company for its endorsement and/or approval.
g. Share Committee
The Share Committee was established in 1992 and currently comprises of Mr. CHOW Philip yiu Wah and Mr. CHANG Tsann Rong Ernest, with Ms. Lammy LEE as the secretary of the Share Committee.
The primary duties of the Share Committee include to:
– deal with and grant approval on the removal of the ordinary shares of the Company from the Principal Register in Bermuda to the Branch Register in Hong Kong or vice versa;
– deal with share transactions including, but not limited to, share repurchases, issue of bonus shares, scrip dividend schemes, top up placings, share subscriptions and placement of the Company’s shares;
– give authorisation to the Company’s Principal Registrar and Branch Registrar to issue share certificates to shareholders who have reported loss of share certificates and in connection with the above share transactions; and to
– discuss and review the disclosure obligations of the Company on share transactions and compliance with the Listing Rules.
h. inside information Committee
The Inside Information Committee was established on 7th August, 2013 and currently comprises of Mr. TUNG Chee Chen (chairman of the Inside Information Committee), Mr. TUNG Lieh Cheung Andrew, Mr. TUNG Lieh Sing Alan and Ms. Lammy LEE.
The primary duties of the Inside Information Committee include to:
– ensure proper systems and controls are in place to collect, review and verify potential inside information;
– identify, assess and escalate potential inside information to the attention of the Board; report to the Board on the recommendation of the Inside Information Committee, and any matter in respect of which it considers that action is needed, and its recommendation as to the actions to be taken and what information to be disclosed;
– vet and clear announcements or other public disclosures; and
– supervise the Company’s compliance with continuing disclosure obligations.
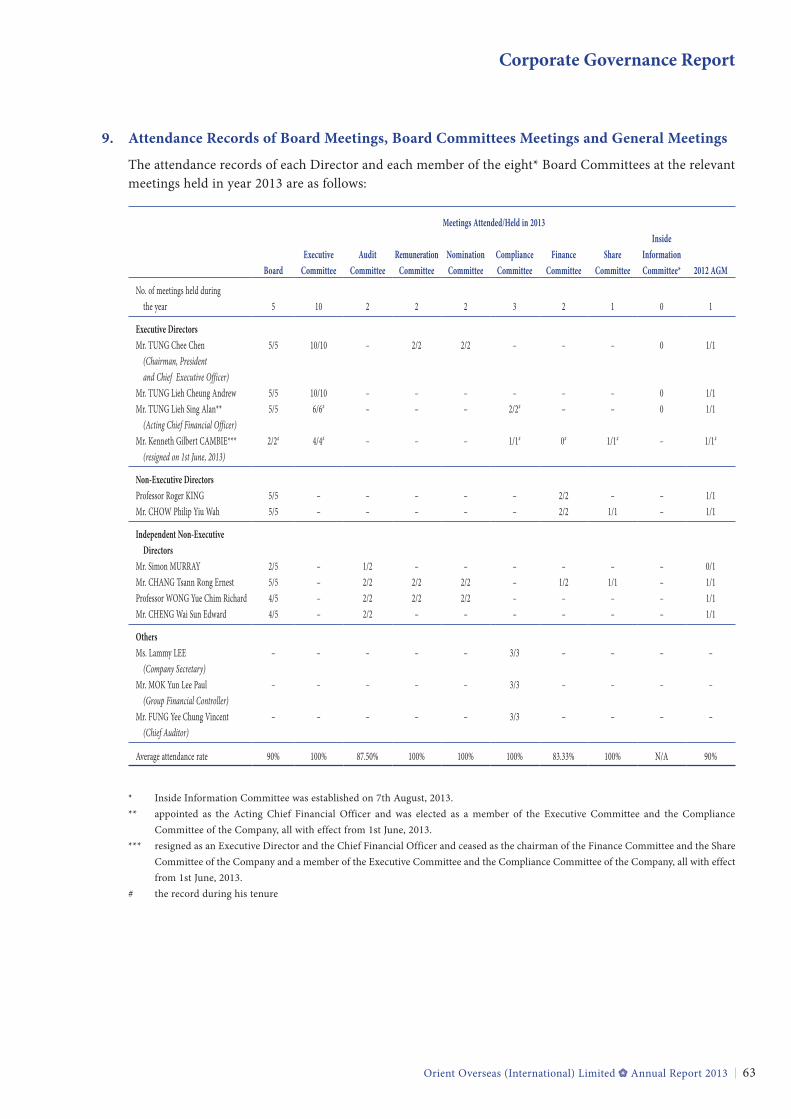
Corporate Governance Report
Orient Overseas (International) Limited Annual Report 2013 63
9. attendance records of Board Meetings, Board Committees Meetings and General Meetings
The attendance records of each Director and each member of the eight* Board Committees at the relevant meetings held in year 2013 are as follows:
Meetings attended/Held in 2013
Boardexecutive
Committeeaudit
Committeeremuneration
CommitteeNomination Committee
Compliance Committee
finance Committee
Share Committee
inside information Committee* 2012 aGM
No. of meetings held during the year 5 10 2 2 2 3 2 1 0 1
executive DirectorsMr. TUNG Chee Chen (Chairman, President and Chief Executive Officer)
5/5 10/10 – 2/2 2/2 – – – 0 1/1
Mr. TUNG Lieh Cheung Andrew 5/5 10/10 – – – – – – 0 1/1Mr. TUNG Lieh Sing Alan** (Acting Chief Financial Officer)
5/5 6/6# – – – 2/2# – – 0 1/1
Mr. Kenneth Gilbert CAMBIE*** (resigned on 1st June, 2013)
2/2# 4/4# – – – 1/1# 0# 1/1# – 1/1#
Non-executive DirectorsProfessor Roger KING 5/5 – – – – – 2/2 – – 1/1Mr. CHOW Philip yiu Wah 5/5 – – – – – 2/2 1/1 – 1/1
independent Non-executive DirectorsMr. Simon MURRAy 2/5 – 1/2 – – – – – – 0/1Mr. CHANG Tsann Rong Ernest 5/5 – 2/2 2/2 2/2 – 1/2 1/1 – 1/1Professor WONG yue Chim Richard 4/5 – 2/2 2/2 2/2 – – – – 1/1Mr. CHENG Wai Sun Edward 4/5 – 2/2 – – – – – – 1/1
othersMs. Lammy LEE (Company Secretary)
– – – – – 3/3 – – – –
Mr. MOK yun Lee Paul (Group Financial Controller)
– – – – – 3/3 – – – –
Mr. FUNG yee Chung Vincent (Chief Auditor)
– – – – – 3/3 – – – –
Average attendance rate 90% 100% 87.50% 100% 100% 100% 83.33% 100% N/A 90%
* Inside Information Committee was established on 7th August, 2013.** appointed as the Acting Chief Financial Officer and was elected as a member of the Executive Committee and the Compliance
Committee of the Company, all with effect from 1st June, 2013.*** resigned as an Executive Director and the Chief Financial Officer and ceased as the chairman of the Finance Committee and the Share
Committee of the Company and a member of the Executive Committee and the Compliance Committee of the Company, all with effect from 1st June, 2013.
# the record during his tenure
Corporate Governance Report
Orient Overseas (International) Limited Annual Report 201364
10. Securities transactions by Directors
The Company has adopted its own code of conduct regarding securities transactions by Directors on terms no less exacting than the required standard set out in the Model Code for Securities Transactions by Directors of Listed Issuers (the “Model Code”) contained in Appendix 10 to the Listing Rules.
All Directors have confirmed, following specific enquiry by the Company, that they have fully complied with the required standards set out in both the Company’s own code and the Model Code for the year ended 31st December, 2013.
11. Share interests of Directors and Senior Management
a. Directors
Directors’ interests in the shares of the Company are set out on pages 73 and 74 of this annual report.
b. Senior Management
As at 31st December, 2013, the number of shares of the Company held by the senior management of the Company are as follows:
Name Number of shares held
Mr. Michael KWOK –Mr. Erxin yAO 5,000Mr. Stephen NG –Mr. Steve SIU –Ms. Lammy LEE –
12. emoluments of Directors and Senior Management#
a. emoluments of Directors
The emoluments of the Directors of the Company for the year ended 31st December, 2013 are set out on page 113 of this annual report.
b. emoluments of Senior Management
The emoluments of the senior management of the Company for the year ended 31st December, 2013 are set out below (including a senior management who retired during the year 2013):
emolument bands (US$)Number of individuals
2013
256,401~320,500 1384,601~448,700 4448,701~512,800 1
Total 6
# biographical details of senior management are set out on page 42 of this annual report.
Corporate Governance Report
Orient Overseas (International) Limited Annual Report 2013 65
B. aCCoUNtaBilitY aND aUDit
1. external auditor
PricewaterhouseCoopers was re-appointed as the Company’s external auditor by shareholders at the 2012 AGM until the conclusion of the next annual general meeting.
The Company has established a policy on appointment of external auditor in providing non-audit services, setting out the principles by which an external auditor may be appointed to provide non-audit services, with a view to ensuring the independence of the external auditor.
The fee in respect of audit and non-audit services provided by the external auditors to the Company for the year ended 31st December, 2013 is set out on page 115 note 11 to the consolidated accounts of this annual report.
2. Directors’ and auditor’s acknowledgement
All Directors acknowledge their responsibility for preparing the accounts for the year ended 31st December, 2013.
PricewaterhouseCoopers, the auditor of the Company, acknowledges the reporting responsibilities in the auditor’s report on the financial statements for the year ended 31st December, 2013.
3. internal Controls
The Board is responsible for maintaining sound and effective internal control systems for the Group, and through the Audit Committee, conducts reviews of the effectiveness of such systems at least annually, covering all material controls including financial, operational and compliance controls and risk management functions. The process used in reviewing the effectiveness of these internal control systems includes discussion with management on risk areas identified by management of the Company and principal division and review of significant issues arising from internal and external audits. The Company’s internal control systems comprise a well established organisational structure and comprehensive policies and standards. Procedures have been designed to safeguard assets against unauthorised use or disposition, to maintain proper accounting records, for assurance of the reliability of financial information for internal use or publication, and to ensure compliance with applicable laws and regulations. The purpose of the Company’s internal control is to provide reasonable, but not absolute, assurance against material misstatement or loss and to manage rather than eliminate risks of failure in operational systems and achievement of the Company’s objectives.
The Board has established the following measures to provide effective internal controls:
– a distinct organisational structure for the principal division with defined authority responsibilities and control/measures;
– an annual budget for the principal division allocating resources in accordance with identified and prioritised business opportunities. The annual budget for the principal division is approved by the Board on an annual basis;
Corporate Governance Report
Orient Overseas (International) Limited Annual Report 201366
– a comprehensive management accounting system for the principal division to provide financial and operational performance indicators to the relevant management, and financial information for reporting and disclosure purposes. Actual operational results are measured against budget each month. Detailed forecasts for the year and long-term forecasts of profit and loss, cash flow and balance sheets are regularly reviewed and updated. Variances to budget are analysed and explained and appropriate action taken, if necessary;
– systems and procedures are in place to identify, measure, manage and control risks including business, compliance, operational, financial and information services risks that may have an impact on the Group and the principal division. Exposure to these risks is monitored by the Executive Committee and the management of the principal division;
– clearly defined procedures are in place for the control of capital and major expenditure commitments, off-balance sheet financial instruments and the supervision, control and review of the investment portfolio; and
– the Internal Audit Department performs independent reviews of the risks and controls identified to provide reasonable assurance to management of the Company and principal division and the Audit Committee that controls have been set in place and adequately addressed.
The internal audit function, which is centrally controlled, monitors compliance with policies and standards as well as the effectiveness of internal control structures across the Company and the Group. To preserve the independence of the internal audit function, the Head of Internal Audit reports functionally to the Audit Committee whose chairman is an Independent Non-Executive Director who has direct access to the Board. Using a risk-based approach, the Internal Audit Department plans its internal audit schedules annually in consultation with, but independent of, management of the Company and the principal division. The Internal Audit Department has unrestricted access to information that allows it to review all aspects of the Group’s risk management, control and governance processes. Independent reviews of different financial, business and functional operations and activities are conducted with audit resources being focused on high risk areas. Ad hoc reviews are also conducted on areas of concern identified by the Audit Committee and management of the Company and the principal division. The management of the Company and the principal division including the affected subsidiary are notified of the deficiencies noted for rectification, and the Internal Audit Department follows up with the implementation of audit recommendations.
The Audit Committee on behalf of the Board assesses the effectiveness of the internal control system including detecting fraud and other irregularities by reviewing the Internal Audit Department’s work and findings. On a yearly basis, the Internal Audit Department summarises the major audit findings and other relevant information that have come to the Internal Audit Department’s attention during the course of the audits and reports to the Audit Committee.
Corporate Governance Report
Orient Overseas (International) Limited Annual Report 2013 67
According to the 2013 Internal Audit report, the Group’s internal control system is functioning effectively, there was no significant weakness found in the course of the audits carried out during the year, and there is no change in the nature and extent of significant risks as well as the scope and quality of management’s ongoing monitoring of the risks and the internal control system. The Audit Committee has concluded that the Group has maintained sound and effective internal controls to safeguard the Group’s assets, and there is an ongoing process in place for identifying, evaluating and managing the significant risks faced by the Group. The Board, therefore, is of the view that there are no significant frauds, irregularities, internal control deficiencies or suspected infringement of laws, rules and regulations that cause the Board to believe that the systems of internal control are ineffective or inadequate, and there are no significant areas of concern which may affect shareholders. The Board is satisfied that the Company and the Group have fully complied with the code provisions on internal control as set forth in the SEHK Code for the year ended 31st December, 2013.
To ensure on-going compliance with the SEHK Code, the Audit Committee reviewed the adequacy of staffing of the accounting and financial reporting function on behalf of the Board and was satisfied with the adequacy of resources, staff qualifications and experience, training programmes and budget of the Company’s accounting and financial reporting function.
The Company has implemented the following procedures and internal controls for the handling and dissemination of inside information:
a) it monitors any inside information and makes appropriate announcement as required by the Listing Rules;
b) it conducts its affairs by reference to the “Guidelines on Disclosure of Inside Information” issued by the Securities and Futures Commission;
c) it has established procedures for handling external affairs about the Group; and
d) it has established guidelines to be followed by senior management and employees in dealing with confidential and inside information.
C. CoMMUNiCatioN WitH SHareHolDerS
The Company attaches great importance to communications with shareholders. Extensive information on the Group’s activities, business strategies and developments is provided in the Company’s annual reports and interim reports. Shareholders of the Company are encouraged to attend the annual general meetings of the Company which offer a valuable forum for dialogue and interaction with management. The Chairman of the Board and the chairmen of the Audit Committee, the Remuneration Committee, the Nomination Committee and other Board committees, or in their absence, another member of the relevant committee, are available at the annual general meetings to answer questions from shareholders on the business of the Group. A separate resolution is proposed by the Chairman in respect of each issue at the general meetings.
The Company has also established a shareholders’ communication policy to ensure shareholders are provided with ready, equal and timely access to balanced and understandable information about the Company. The policy is regularly reviewed to ensure its effectiveness and is available on written request to the Company Secretary.
Corporate Governance Report
Orient Overseas (International) Limited Annual Report 201368
The most recent shareholders’ meeting of the Company was the 2012 AGM held at the Renaissance Harbour View Hotel, Wanchai, Hong Kong on 26th April, 2013, at which the following ordinary resolutions were passed with the voting results as follows:
Number of Votes (%)ordinary resolutions for against
1. To consider and adopt the audited Financial Statements and the Reports of the Directors and the Auditor for the year ended 31st December, 2012.
529,077,402 (99.999998%)
10 (0.000002%)
2. To declare a final dividend for the year ended 31st December, 2012. 527,777,002 (99.753835%)
1,302,410 (0.246165%)
3(a). To re-elect Mr. TUNG Chee Chen as Director. 505,082,951(95.464933%)
23,993,995(4.535067%)
3(b). To re-elect Mr. TUNG Lieh Sing Alan as Director. 510,499,520(96.792608%)
16,916,292(3.207392%)
3(c). To re-elect Professor Roger KING as Director. 510,400,554(96.469464%)
18,679,358(3.530536%)
3(d). To re-elect Professor Wong yue Chim Richard as Director. 461,177,076(87.159027%)
67,944,336(12.840973%)
4. To authorise the Board of Directors to fix the Directors’ remuneration. 524,199,279(99.975185%)
130,110(0.024815%)
5. To re-appoint PricewaterhouseCoopers as Auditor and to authorise the Board of Directors to fix their remuneration.
513,033,162(96.981894%)
15,965,750(3.018106%)
6(a). To grant a general mandate to the Directors to allot, issue and deal with the Company’s shares.
457,170,053(86.408507%)
71,909,859(13.591493%)
6(b). To grant a general mandate to the Directors to repurchase the Company’s shares.
528,980,379(99.999998%)
10(0.000002%)
6(c). To extend the general mandate to issue shares to cover the shares repurchased by the Company under Resolution No. 6(b).
456,645,072(86.309119%)
72,435,840(13.690881%)
Since the publication of the Company’s 2010 interim report, the Company has offered to the shareholders of the Company the following options to choose the language and means of receipt of the corporate communications of the Company in support of environment protection and for the purpose of saving printing and mailing costs:
(1) to read the corporate communication published on the Company’s website at http://www.ooilgroup.com in place of receiving printed copies, and receive an e-mail notification or a printed notification letter (as the case may be) of the publication of the corporate communication on website; or
(2) to receive either the printed English version, the printed Chinese version or both the printed English and Chinese versions of the Company’s corporate communication.
Corporate Governance Report
Orient Overseas (International) Limited Annual Report 2013 69
D. SHareHolDerS’ riGHtS
1. Convening a special general meeting
Pursuant to the Bermuda Companies Act and the Company’s Bye-law, the shareholder(s) of the Company holding not less than one-tenth of the paid up capital of the Company having the right to vote at general meetings of the Company shall have the right, by written requisition sent to the Company’s registered office at Clarendon House, 2 Church Street, Hamilton HM11, Bermuda and to the Company’s principal office at 33rd Floor, Harbour Centre, 25 Harbour Road, Wanchai, Hong Kong, for the attention of the Company Secretary of the Company, to require a special general meeting (the “SGM”) to be called by the Board for the transaction of any business specified in such requisition.
The written requisition must state the purposes of the general meeting, signed by the shareholder(s) concerned and may consist of several documents in like form, each signed by one or more of those shareholders.
Upon receipt of confirmation from the Company’s branch share registrar (the “Registrar”) that the shareholder(s) submitting the requisition is/are qualified to attend and vote at any general meeting, the Company will convene a SGM by serving sufficient notice in accordance with the statutory requirements to all the registered shareholders.
2. putting forward proposals at general meetings
The shareholder(s) of the Company holding (i) not less than one-twentieth of the total voting rights of all shareholders having the right to vote at the general meeting of the Company; or (ii) not less than 100 shareholders of the Company, can submit:
(i) a written request stating the resolution intended to be moved at an annual general meeting; or
(ii) a statement of not more than 1,000 words with respect to the matter referred to in any proposed resolution or the business to be dealt with at a particular general meeting.
The written request/statement must be signed by the shareholder(s) concerned and deposited at the Company’s registered office at Clarendon House, 2 Church Street, Hamilton HM11, Bermuda and to the Company’s principal office at 33rd Floor, Harbour Centre, 25 Harbour Road, Wanchai, Hong Kong, for the attention of the Company Secretary of the Company, not less than six weeks before the annual general meeting in the case of a requisition requiring notice of a resolution and not less than one week before the general meeting in the case of any other requisition.
Upon receipt of confirmation from the Registrar of the Company that the shareholder(s) making the proposal is/are qualified to attend and vote at the general meeting, the Company will:
(i) include the resolution in the agenda for the annual general meeting; or
(ii) circulate the statement for the general meeting,
provided that the shareholder(s) concerned have deposited a sum of money sufficient to meet the Company’s expenses in serving the notice of the resolution and/or circulating the statement to all the registered shareholders.
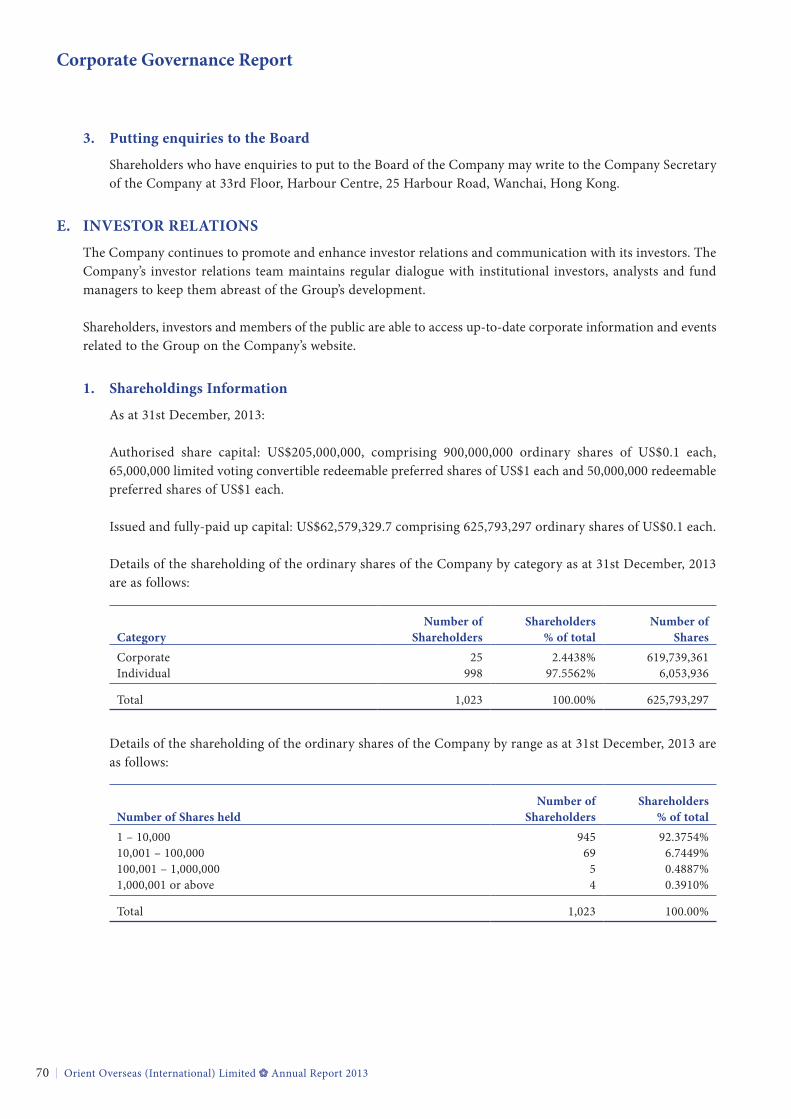
Corporate Governance Report
Orient Overseas (International) Limited Annual Report 201370
3. putting enquiries to the Board
Shareholders who have enquiries to put to the Board of the Company may write to the Company Secretary of the Company at 33rd Floor, Harbour Centre, 25 Harbour Road, Wanchai, Hong Kong.
e. iNVeStor relatioNS
The Company continues to promote and enhance investor relations and communication with its investors. The Company’s investor relations team maintains regular dialogue with institutional investors, analysts and fund managers to keep them abreast of the Group’s development.
Shareholders, investors and members of the public are able to access up-to-date corporate information and events related to the Group on the Company’s website.
1. Shareholdings information
As at 31st December, 2013:
Authorised share capital: US$205,000,000, comprising 900,000,000 ordinary shares of US$0.1 each, 65,000,000 limited voting convertible redeemable preferred shares of US$1 each and 50,000,000 redeemable preferred shares of US$1 each.
Issued and fully-paid up capital: US$62,579,329.7 comprising 625,793,297 ordinary shares of US$0.1 each.
Details of the shareholding of the ordinary shares of the Company by category as at 31st December, 2013 are as follows:
CategoryNumber of
ShareholdersShareholders
% of totalNumber of
Shares
Corporate 25 2.4438% 619,739,361Individual 998 97.5562% 6,053,936
Total 1,023 100.00% 625,793,297
Details of the shareholding of the ordinary shares of the Company by range as at 31st December, 2013 are as follows:
Number of Shares heldNumber of
ShareholdersShareholders
% of total
1 – 10,000 945 92.3754%10,001 – 100,000 69 6.7449%100,001 – 1,000,000 5 0.4887%1,000,001 or above 4 0.3910%
Total 1,023 100.00%
Corporate Governance Report
Orient Overseas (International) Limited Annual Report 2013 71
2. public float
Based on information that is publicly available to the Company and within the knowledge of the Directors, the percentage of its public float exceeds 25% as at 31st December, 2013.
3. financial Calendar
Important dates for the coming financial year are set out on page 43 of this annual report.
4. Memorandum of association and Bye-laws
There are no changes to the memorandum of association and bye-laws of the Company (the “Constitutional Documents”) during the year. The consolidated version of the Constitutional Documents is available on the Company’s website and the HKExnews website.
Report of the Directors
Orient Overseas (International) Limited Annual Report 201372
The Board of Directors of the Company presents this report together with the audited accounts for the year ended 31st December, 2013.
priNCipal aCtiVitieSThe principal activity of the Company is investment holding and the activities of its principal subsidiaries, associated companies and jointly controlled entities are set out on pages 145 to 154 of this annual report.
GroUp reSUltSThe consolidated results of the Company and its subsidiaries (collectively referred to as the “Group”) are set out on page 81 of this annual report.
DiViDeNDSThe Board of Directors of the Company did not declare the payment of an interim dividend for the year ended 31st December, 2013.
The Board of Directors of the Company has recommended the payment of a final dividend of US1.88 cents (HK$0.147 at the exchange rate of US$1: HK$7.8) per ordinary share for the year ended 31st December, 2013 to be paid on 6th June, 2014 to the shareholders of the Company whose names appear on the register of members of the Company on 8th May, 2014. Shareholders should complete the dividend election form (if applicable) and return it to the Company’s Hong Kong branch share registrar, Computershare Hong Kong Investor Services Limited, not later than 4:30 p.m. on 28th May, 2014.
DireCtorSThe Directors of the Company during the year and up to the date of this report were:
executive DirectorsMr. TUNG Chee Chen (Chairman, President and Chief Executive Officer)Mr. TUNG Lieh Cheung AndrewMr. TUNG Lieh Sing Alan (Acting Chief Financial Officer) *Mr. Kenneth Gilbert CAMBIE (Chief Financial Officer) *** appointed as the Acting Chief Financial Officer on 1st June, 2013** resigned as the Executive Director and Chief Financial Officer on 1st June, 2013
Non-executive DirectorsProfessor Roger KINGMr. CHOW Philip yiu Wah
independent Non-executive DirectorsMr. Simon MURRAyMr. CHANG Tsann Rong ErnestProfessor WONG yue Chim RichardMr. CHENG Wai Sun Edward
In accordance with the provisions of the Company’s Bye-laws, Mr. Tung Lieh Cheung Andrew, Mr. Chow Philip yiu Wah and Mr. Simon Murray will retire by rotation at the annual general meeting of the Company to be held on 25th April, 2014 (the “Annual General Meeting”) and, being eligible, will offer themselves for re-election.
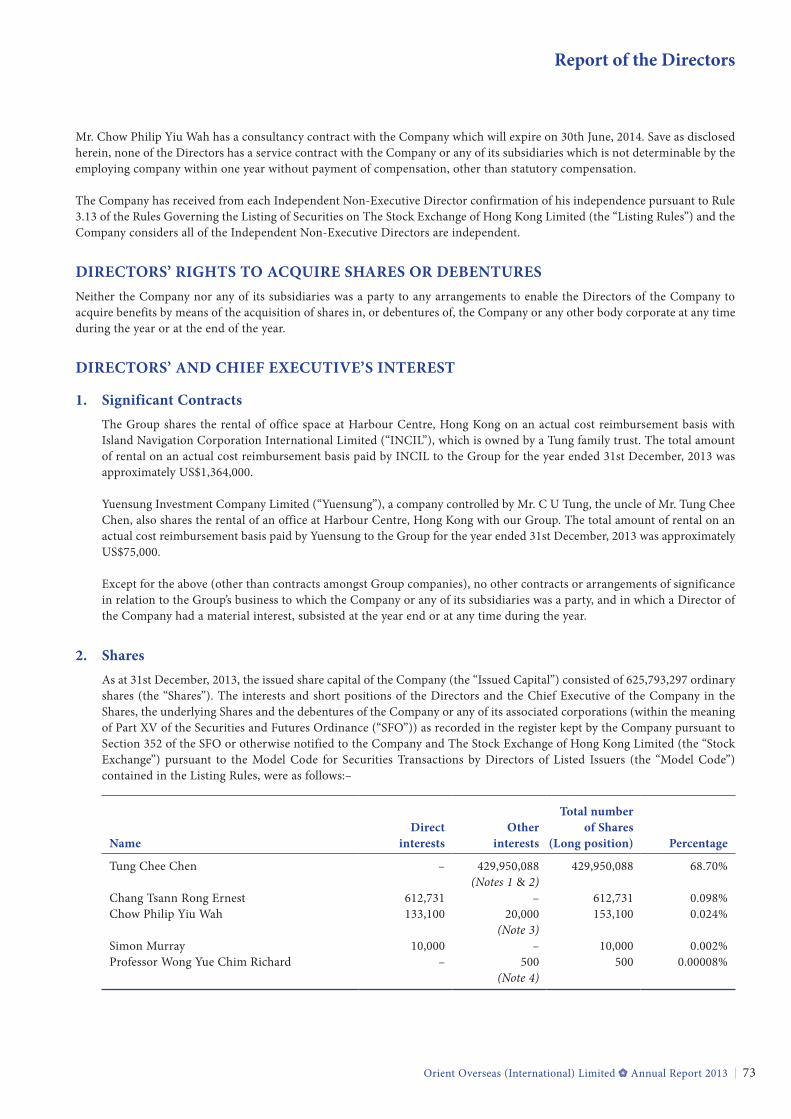
Report of the Directors
Orient Overseas (International) Limited Annual Report 2013 73
Mr. Chow Philip yiu Wah has a consultancy contract with the Company which will expire on 30th June, 2014. Save as disclosed herein, none of the Directors has a service contract with the Company or any of its subsidiaries which is not determinable by the employing company within one year without payment of compensation, other than statutory compensation.
The Company has received from each Independent Non-Executive Director confirmation of his independence pursuant to Rule 3.13 of the Rules Governing the Listing of Securities on The Stock Exchange of Hong Kong Limited (the “Listing Rules”) and the Company considers all of the Independent Non-Executive Directors are independent.
DireCtorS’ riGHtS to aCQUire SHareS or DeBeNtUreSNeither the Company nor any of its subsidiaries was a party to any arrangements to enable the Directors of the Company to acquire benefits by means of the acquisition of shares in, or debentures of, the Company or any other body corporate at any time during the year or at the end of the year.
DireCtorS’ aND CHief eXeCUtiVe’S iNtereSt
1. Significant ContractsThe Group shares the rental of office space at Harbour Centre, Hong Kong on an actual cost reimbursement basis with Island Navigation Corporation International Limited (“INCIL”), which is owned by a Tung family trust. The total amount of rental on an actual cost reimbursement basis paid by INCIL to the Group for the year ended 31st December, 2013 was approximately US$1,364,000.
yuensung Investment Company Limited (“yuensung”), a company controlled by Mr. C U Tung, the uncle of Mr. Tung Chee Chen, also shares the rental of an office at Harbour Centre, Hong Kong with our Group. The total amount of rental on an actual cost reimbursement basis paid by yuensung to the Group for the year ended 31st December, 2013 was approximately US$75,000.
Except for the above (other than contracts amongst Group companies), no other contracts or arrangements of significance in relation to the Group’s business to which the Company or any of its subsidiaries was a party, and in which a Director of the Company had a material interest, subsisted at the year end or at any time during the year.
2. SharesAs at 31st December, 2013, the issued share capital of the Company (the “Issued Capital”) consisted of 625,793,297 ordinary shares (the “Shares”). The interests and short positions of the Directors and the Chief Executive of the Company in the Shares, the underlying Shares and the debentures of the Company or any of its associated corporations (within the meaning of Part XV of the Securities and Futures Ordinance (“SFO”)) as recorded in the register kept by the Company pursuant to Section 352 of the SFO or otherwise notified to the Company and The Stock Exchange of Hong Kong Limited (the “Stock Exchange”) pursuant to the Model Code for Securities Transactions by Directors of Listed Issuers (the “Model Code”) contained in the Listing Rules, were as follows:–
NameDirect
interestsother
interests
total number of Shares
(long position) percentage
Tung Chee Chen – 429,950,088(Notes 1 & 2)
429,950,088 68.70%
Chang Tsann Rong Ernest 612,731 – 612,731 0.098%Chow Philip yiu Wah 133,100 20,000
(Note 3)153,100 0.024%
Simon Murray 10,000 – 10,000 0.002%Professor Wong yue Chim Richard – 500
(Note 4)500 0.00008%
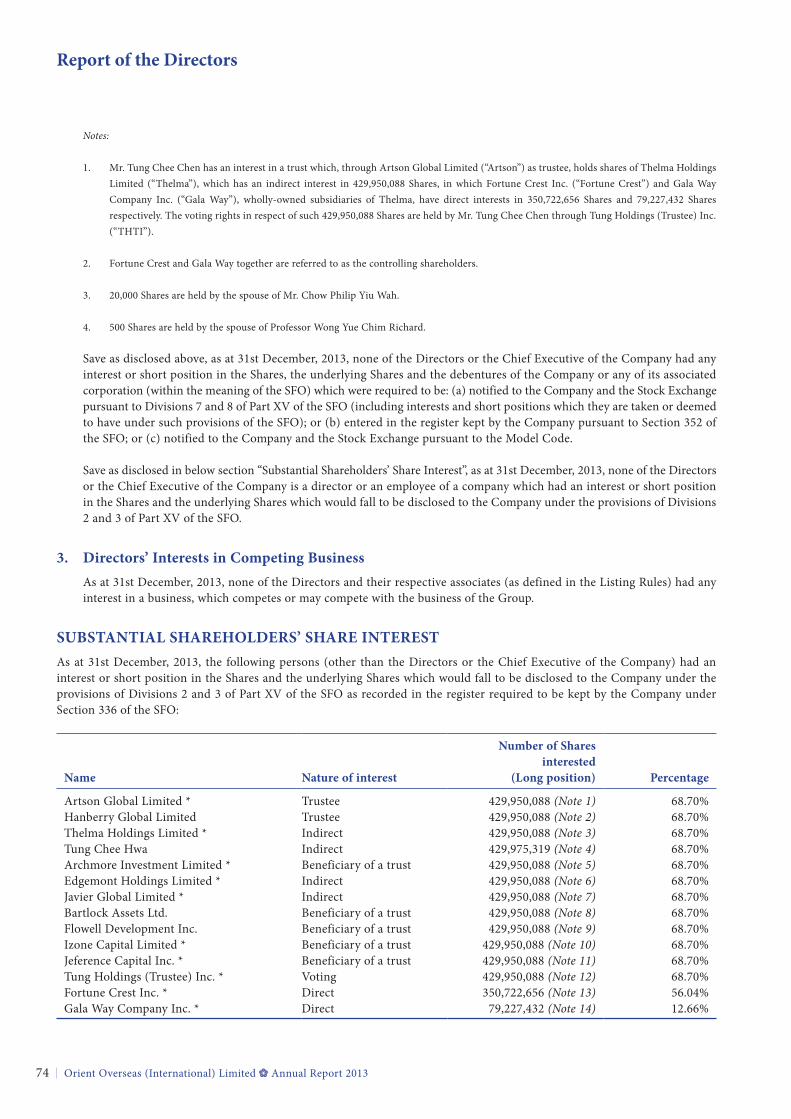
Report of the Directors
Orient Overseas (International) Limited Annual Report 201374
Notes:
1. Mr. Tung Chee Chen has an interest in a trust which, through Artson Global Limited (“Artson”) as trustee, holds shares of Thelma Holdings Limited (“Thelma”), which has an indirect interest in 429,950,088 Shares, in which Fortune Crest Inc. (“Fortune Crest”) and Gala Way Company Inc. (“Gala Way”), wholly-owned subsidiaries of Thelma, have direct interests in 350,722,656 Shares and 79,227,432 Shares respectively. The voting rights in respect of such 429,950,088 Shares are held by Mr. Tung Chee Chen through Tung Holdings (Trustee) Inc. (“THTI”).
2. Fortune Crest and Gala Way together are referred to as the controlling shareholders.
3. 20,000 Shares are held by the spouse of Mr. Chow Philip yiu Wah.
4. 500 Shares are held by the spouse of Professor Wong yue Chim Richard.
Save as disclosed above, as at 31st December, 2013, none of the Directors or the Chief Executive of the Company had any interest or short position in the Shares, the underlying Shares and the debentures of the Company or any of its associated corporation (within the meaning of the SFO) which were required to be: (a) notified to the Company and the Stock Exchange pursuant to Divisions 7 and 8 of Part XV of the SFO (including interests and short positions which they are taken or deemed to have under such provisions of the SFO); or (b) entered in the register kept by the Company pursuant to Section 352 of the SFO; or (c) notified to the Company and the Stock Exchange pursuant to the Model Code.
Save as disclosed in below section “Substantial Shareholders’ Share Interest”, as at 31st December, 2013, none of the Directors or the Chief Executive of the Company is a director or an employee of a company which had an interest or short position in the Shares and the underlying Shares which would fall to be disclosed to the Company under the provisions of Divisions 2 and 3 of Part XV of the SFO.
3. Directors’ interests in Competing BusinessAs at 31st December, 2013, none of the Directors and their respective associates (as defined in the Listing Rules) had any interest in a business, which competes or may compete with the business of the Group.
SUBStaNtial SHareHolDerS’ SHare iNtereStAs at 31st December, 2013, the following persons (other than the Directors or the Chief Executive of the Company) had an interest or short position in the Shares and the underlying Shares which would fall to be disclosed to the Company under the provisions of Divisions 2 and 3 of Part XV of the SFO as recorded in the register required to be kept by the Company under Section 336 of the SFO:
Name Nature of interest
Number of Shares interested
(long position) percentage
Artson Global Limited * Trustee 429,950,088 (Note 1) 68.70%Hanberry Global Limited Trustee 429,950,088 (Note 2) 68.70%Thelma Holdings Limited * Indirect 429,950,088 (Note 3) 68.70%Tung Chee Hwa Indirect 429,975,319 (Note 4) 68.70%Archmore Investment Limited * Beneficiary of a trust 429,950,088 (Note 5) 68.70%Edgemont Holdings Limited * Indirect 429,950,088 (Note 6) 68.70%Javier Global Limited * Indirect 429,950,088 (Note 7) 68.70%Bartlock Assets Ltd. Beneficiary of a trust 429,950,088 (Note 8) 68.70%Flowell Development Inc. Beneficiary of a trust 429,950,088 (Note 9) 68.70%Izone Capital Limited * Beneficiary of a trust 429,950,088 (Note 10) 68.70%Jeference Capital Inc. * Beneficiary of a trust 429,950,088 (Note 11) 68.70%Tung Holdings (Trustee) Inc. * Voting 429,950,088 (Note 12) 68.70%Fortune Crest Inc. * Direct 350,722,656 (Note 13) 56.04%Gala Way Company Inc. * Direct 79,227,432 (Note 14) 12.66%
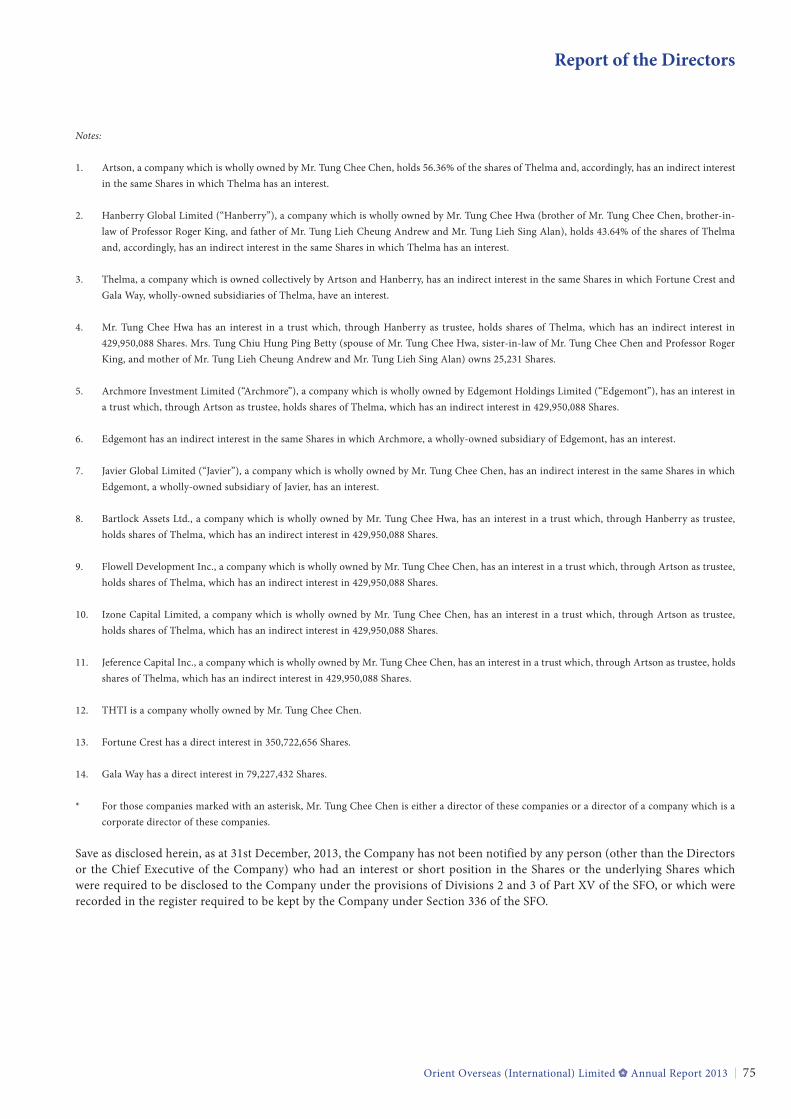
Report of the Directors
Orient Overseas (International) Limited Annual Report 2013 75
Notes:
1. Artson, a company which is wholly owned by Mr. Tung Chee Chen, holds 56.36% of the shares of Thelma and, accordingly, has an indirect interest in the same Shares in which Thelma has an interest.
2. Hanberry Global Limited (“Hanberry”), a company which is wholly owned by Mr. Tung Chee Hwa (brother of Mr. Tung Chee Chen, brother-in-law of Professor Roger King, and father of Mr. Tung Lieh Cheung Andrew and Mr. Tung Lieh Sing Alan), holds 43.64% of the shares of Thelma and, accordingly, has an indirect interest in the same Shares in which Thelma has an interest.
3. Thelma, a company which is owned collectively by Artson and Hanberry, has an indirect interest in the same Shares in which Fortune Crest and Gala Way, wholly-owned subsidiaries of Thelma, have an interest.
4. Mr. Tung Chee Hwa has an interest in a trust which, through Hanberry as trustee, holds shares of Thelma, which has an indirect interest in 429,950,088 Shares. Mrs. Tung Chiu Hung Ping Betty (spouse of Mr. Tung Chee Hwa, sister-in-law of Mr. Tung Chee Chen and Professor Roger King, and mother of Mr. Tung Lieh Cheung Andrew and Mr. Tung Lieh Sing Alan) owns 25,231 Shares.
5. Archmore Investment Limited (“Archmore”), a company which is wholly owned by Edgemont Holdings Limited (“Edgemont”), has an interest in a trust which, through Artson as trustee, holds shares of Thelma, which has an indirect interest in 429,950,088 Shares.
6. Edgemont has an indirect interest in the same Shares in which Archmore, a wholly-owned subsidiary of Edgemont, has an interest.
7. Javier Global Limited (“Javier”), a company which is wholly owned by Mr. Tung Chee Chen, has an indirect interest in the same Shares in which Edgemont, a wholly-owned subsidiary of Javier, has an interest.
8. Bartlock Assets Ltd., a company which is wholly owned by Mr. Tung Chee Hwa, has an interest in a trust which, through Hanberry as trustee, holds shares of Thelma, which has an indirect interest in 429,950,088 Shares.
9. Flowell Development Inc., a company which is wholly owned by Mr. Tung Chee Chen, has an interest in a trust which, through Artson as trustee, holds shares of Thelma, which has an indirect interest in 429,950,088 Shares.
10. Izone Capital Limited, a company which is wholly owned by Mr. Tung Chee Chen, has an interest in a trust which, through Artson as trustee, holds shares of Thelma, which has an indirect interest in 429,950,088 Shares.
11. Jeference Capital Inc., a company which is wholly owned by Mr. Tung Chee Chen, has an interest in a trust which, through Artson as trustee, holds shares of Thelma, which has an indirect interest in 429,950,088 Shares.
12. THTI is a company wholly owned by Mr. Tung Chee Chen.
13. Fortune Crest has a direct interest in 350,722,656 Shares.
14. Gala Way has a direct interest in 79,227,432 Shares.
* For those companies marked with an asterisk, Mr. Tung Chee Chen is either a director of these companies or a director of a company which is a corporate director of these companies.
Save as disclosed herein, as at 31st December, 2013, the Company has not been notified by any person (other than the Directors or the Chief Executive of the Company) who had an interest or short position in the Shares or the underlying Shares which were required to be disclosed to the Company under the provisions of Divisions 2 and 3 of Part XV of the SFO, or which were recorded in the register required to be kept by the Company under Section 336 of the SFO.
Report of the Directors
Orient Overseas (International) Limited Annual Report 201376
CoNNeCteD traNSaCtioNSDuring the year ended 31st December, 2013, the Group had the following continuing connected transactions (the “Continuing Connected Transactions”) constituted by the following agreements entered into by OOCL (Taiwan) Co., Ltd. (“OTWL”), the Group’s Taiwanese subsidiary and acting as the general agent for the carrier of the Group in Taiwan:
a) CMt Master agreementPursuant to a master agreement dated 29th June, 2005, as supplemented by the supplemental agreements dated 10th December, 2007 and 15th December, 2010, all entered into between OTWL and Chinese Maritime Transport Ltd. (“CMT”), CMT agreed to provide and to procure members of the CMT group to provide various services to the Group including (i) trucking service; (ii) leasing of equipment (including chassis and tractors); (iii) maintenance and repair services for generator sets and chassis; (iv) freight station depot and container storage facilities; (v) container yard and gate services; (vi) crew manning services; and (vii) container inspection services, for successive periods of three years expired on 31st December, 2013 subject to the annual caps of not exceeding US$43,000,000, US$45,200,000 and US$47,500,000 for the years 2011, 2012 and 2013 respectively.
During the year 2013, US$31,979,000 was paid by OTWL to the CMT group for the aforesaid services.
On 4th December, 2013, OTWL and CMT agreed to renew the term of the master agreement for three years commencing from 1st January, 2014 for the provision of the aforesaid services other than container inspection services, by CMT to the Group and to revise the annual caps to not exceeding US$50,000,000, US$52,500,000 and US$55,000,000 for the years 2014, 2015 and 2016 respectively.
b) aii Master agreementPursuant to a master agreement dated 29th June, 2005, as supplemented by the supplemental agreement dated 10th December, 2007 and 15th December, 2010, all entered into between OTWL and Associated International Inc. (“AII”), AII agreed to provide and to procure members of the AII group to provide various services to the Group including (i) provision of office premises; and (ii) freight station depot and container storage facilities, for successive periods of three years expired on 31st December, 2013 subject to the annual caps of not exceeding US$2,700,000 for the years 2011, 2012 and 2013 respectively.
During the year 2013, US$1,436,000 was paid by OTWL to the AII group for the aforesaid services.
On 4th December, 2013, OTWL and AII agreed to renew the term of the master agreement for three years commencing from 1st January, 2014 for the provision of the aforesaid services by AII to the Group and to revise the annual caps to not exceeding US$2,800,000 for the years 2014, 2015 and 2016 respectively.
Mr. John Peng is the controlling shareholder of CMT and AII, and the brother-in-law of Mr. Tung Chee Chen who is an Executive Director, Chairman, President and Chief Executive Officer of the Company; the brother-in-law of Professor Roger King, a Non-Executive Director of the Company; the uncle of Mr. Tung Lieh Cheung Andrew, an Executive Director of the Company, and Mr. Tung Lieh Sing Alan, an Executive Director and the Acting Chief Financial Officer of the Company; and the brother-in-law of Mr. Tung Chee Hwa who has an interest in a trust which has an indirect interest in certain substantial shareholders of the Company. Mr. Peng and accordingly CMT and AII are therefore connected persons of the Company as defined in the Listing Rules.
Pursuant to Rule 14A.37 of the Listing Rules, the Independent Non-Executive Directors of the Company, namely Mr. Simon Murray, Mr. Chang Tsann Rong Ernest, Professor Wong yue Chim Richard and Mr. Cheng Wai Sun Edward, have reviewed the Continuing Connected Transactions and confirmed that the Continuing Connected Transactions have been entered into (a) in the ordinary and usual course of business of the Group; (b) on normal commercial terms or on terms no less favourable to the Group than terms available to or from independent third parties; and (c) in accordance with the relevant agreements governing them on terms that are fair and reasonable and in the interests of the shareholders of the Company as a whole.
Report of the Directors
Orient Overseas (International) Limited Annual Report 2013 77
The Company’s auditor was engaged to report on the Group’s Continuing Connected Transactions in accordance with Hong Kong Standard on Assurance Engagements 3000 “Assurance Engagements Other Than Audits or Reviews of Historical Financial Information” and with reference to Practice Note 740 “Auditor’s Letter on Continuing Connected Transactions under the Hong Kong Listing Rules” issued by the Hong Kong Institute of Certified Public Accountants. The auditor has issued his unqualified letter containing the findings and conclusions in respect of the Continuing Connected Transactions as disclosed above in accordance with Rule 14A.38 of the Listing Rules and nothing has come to their attention that causes them to believe that the disclosed Continuing Connected Transactions:
(i) have not been approved by the Board of Directors of the Company;
(ii) were not entered into, in all material respects, in accordance with the relevant agreements governing the transactions; and
(iii) have exceeded the maximum aggregate annual caps in respect of each of the disclosed Continuing Connected Transactions.
pUrCHaSe, Sale or reDeMptioN of SHareSDuring the year ended 31st December, 2013, the Company has not redeemed any of its Shares and neither the Company nor any of its subsidiaries has purchased or sold any of the Company’s Shares.
pre-eMptiVe riGHtSNo pre-emptive rights exist under Bermudan law in relation to the issue of new shares by the Company.
reSerVeSMovements during the year in the reserves of the Group and the Company are set out in note 36 to the consolidated accounts on pages 137 and 138 of this annual report.
Corporate GoVerNaNCeThe Board and management of the Company are committed to maintaining high standards of corporate governance and the Company considers that effective corporate governance makes an important contribution to corporate success and to the enhancement of shareholder value.
The Company has adopted its own corporate governance code (the “CG Code”), which in addition to applying the principles as set out in the Corporate Governance Code and Corporate Governance Report (the “SEHK Code”) contained in Appendix 14 to the Listing Rules, also incorporates and conforms to local and international best practices. The CG Code sets out the corporate governance principles applied by the Company and its subsidiaries and is constantly reviewed to ensure transparency, accountability and independence. Further information on the CG Code is set out in the corporate governance report (the “Corporate Governance Report”) on pages 46 to 71 of this annual report.
Throughout the year of 2013, the Company complied with the SEHK Code, except as set out in the Corporate Governance Report on page 46.
pUBliC floatBased on information that is publicly available to the Company and within the knowledge of the Directors of the Company, as at the date of this report, there is sufficient public float of more than 25% of the Company’s issued Shares as required under the Listing Rules.
propertY, plaNt aND eQUipMeNtParticulars of the movements in property, plant and equipment are set out in note 16 to the consolidated accounts on pages 118 and 119 of this annual report.
Report of the Directors
Orient Overseas (International) Limited Annual Report 201378
DoNatioNSDonations made by the Group during the year amount to US$127,000.
aNNUal GeNeral MeetiNGThe Annual General Meeting will be held on 25th April, 2014.
A circular containing, inter alia, (i) a notice convening the Annual General Meeting; (ii) details of the retiring Directors to be re-elected at the Annual General Meeting; (iii) the general mandate to authorise the allotment of and otherwise dealing with shares of all classes in the capital of the Company and securities convertible into shares and options, warrants or similar rights to subscribe for shares or such convertible securities and (iv) the general mandate to authorise the repurchase of the Company’s securities together with a proxy form will be distributed to the shareholders of the Company on around 20th March, 2014.
CoMpaNY SeCretarYThe Company Secretary of the Company is Ms. Lee Chee Fun Lammy, Barrister.
aUDitorThe Group’s financial accounts have been audited by PricewaterhouseCoopers who will retire at the Annual General Meeting and, being eligible, offer themselves for re-appointment.
On behalf of the Boardorient overseas (international) limitedtung Chee ChenChairman
Hong Kong, 7th March, 2014
Orient Overseas (International) Limited Annual Report 2013 79
Index – Financial Information
Content Page no.Independent Auditor’s Report 80Consolidated Profit and Loss Account 81Consolidated Statement of Comprehensive Income 82Consolidated Balance Sheet 83Balance Sheet 85Consolidated Cash Flow Statement 86Consolidated Statement of Changes in Equity 87Notes to the Consolidated Accounts1. General information 882. Summary of significant accounting policies 883. Financial risk management 1014. Critical accounting estimates and judgements 1075. Revenue and segment information 1086. Operating costs 1117. Other operating income 1128. Other operating expenses 1129. Employee benefit expense 11210. Directors’ and management’s emoluments 11311. Operating profit 11512. Finance costs 11513. Taxation 11614. Earnings per ordinary share 11715. Dividends 11716. Property, plant and equipment 11817. Investment property 12018. Prepayments of lease premiums 12119. Subsidiaries 12120. Jointly controlled entities 12221. Associated companies 12222. Intangible assets 12323. Deferred taxation assets/(liabilities) 12424. Pension and retirement benefits 12525. Restricted bank balances 12926. Available-for-sale financial assets 13027. Held-to-maturity investments 13028. Other non-current assets 13129. Inventories 13130. Debtors and prepayments 13231. Amount due from an associated company 13432. Portfolio investments 13433. Derivative financial instruments 13534. Cash and bank balances 13635. Share capital 13736. Reserves 13737. Borrowings 13838. Creditors and accruals 14039. Amounts due to jointly controlled entities 14140. Commitments 14141. Financial guarantees 14342. Notes to consolidated cash flow statement 14343. Approval of accounts 144Principal Subsidiaries, Associated Companies and Jointly Controlled Entities 145
Independent Auditor’s Report
Orient Overseas (International) Limited Annual Report 201380
to the Shareholders oforient overseas (international) limited(Incorporated in Bermuda with limited liability)
We have audited the consolidated accounts of Orient Overseas (International) Limited (the “Company”) and its subsidiaries (together the “Group”) set out on pages 81 to 154, which comprise the consolidated and company balance sheets as at 31st December 2013, and the consolidated profit and loss account, the consolidated statement of comprehensive income, the consolidated cash flow statement and the consolidated statement of changes in equity for the year then ended, and a summary of significant accounting policies and other explanatory information.
DireCtorS’ reSpoNSiBilitY for tHe CoNSoliDateD aCCoUNtSThe Directors of the Company are responsible for the preparation of consolidated accounts that give a true and fair view in accordance with Hong Kong Financial Reporting Standards issued by the Hong Kong Institute of Certified Public Accountants and the disclosure requirements of the Hong Kong Companies Ordinance, and for such internal control as the Directors determine is necessary to enable the preparation of consolidated accounts that are free from material misstatement, whether due to fraud or error.
aUDitor’S reSpoNSiBilitYOur responsibility is to express an opinion on these consolidated accounts based on our audit and to report our opinion solely to you, as a body, in accordance with Section 90 of the Companies Act 1981 of Bermuda and for no other purpose. We do not assume responsibility towards or accept liability to any other person for the contents of this report.
We conducted our audit in accordance with Hong Kong Standards on Auditing issued by the Hong Kong Institute of Certified Public Accountants. Those standards require that we comply with ethical requirements and plan and perform the audit to obtain reasonable assurance about whether the consolidated accounts are free from material misstatement.
An audit involves performing procedures to obtain audit evidence about the amounts and disclosures in the consolidated accounts. The procedures selected depend on the auditor’s judgement, including the assessment of the risks of material misstatement of the consolidated accounts, whether due to fraud or error. In making those risk assessments, the auditor considers internal control relevant to the entity’s preparation of consolidated accounts that give a true and fair view in order to design audit procedures that are appropriate in the circumstances, but not for the purpose of expressing an opinion on the effectiveness of the entity’s internal control. An audit also includes evaluating the appropriateness of accounting policies used and the reasonableness of accounting estimates made by the Directors, as well as evaluating the overall presentation of the consolidated accounts.
We believe that the audit evidence we have obtained is sufficient and appropriate to provide a basis for our audit opinion.
opiNioNIn our opinion, the consolidated accounts give a true and fair view of the state of affairs of the Company and of the Group as at 31st December 2013, and of the profit and cash flows of the Group for the year then ended in accordance with Hong Kong Financial Reporting Standards and have been properly prepared in accordance with the disclosure requirements of the Hong Kong Companies Ordinance.
pricewaterhouseCoopersCertified Public Accountants
Hong Kong, 7th March 2014
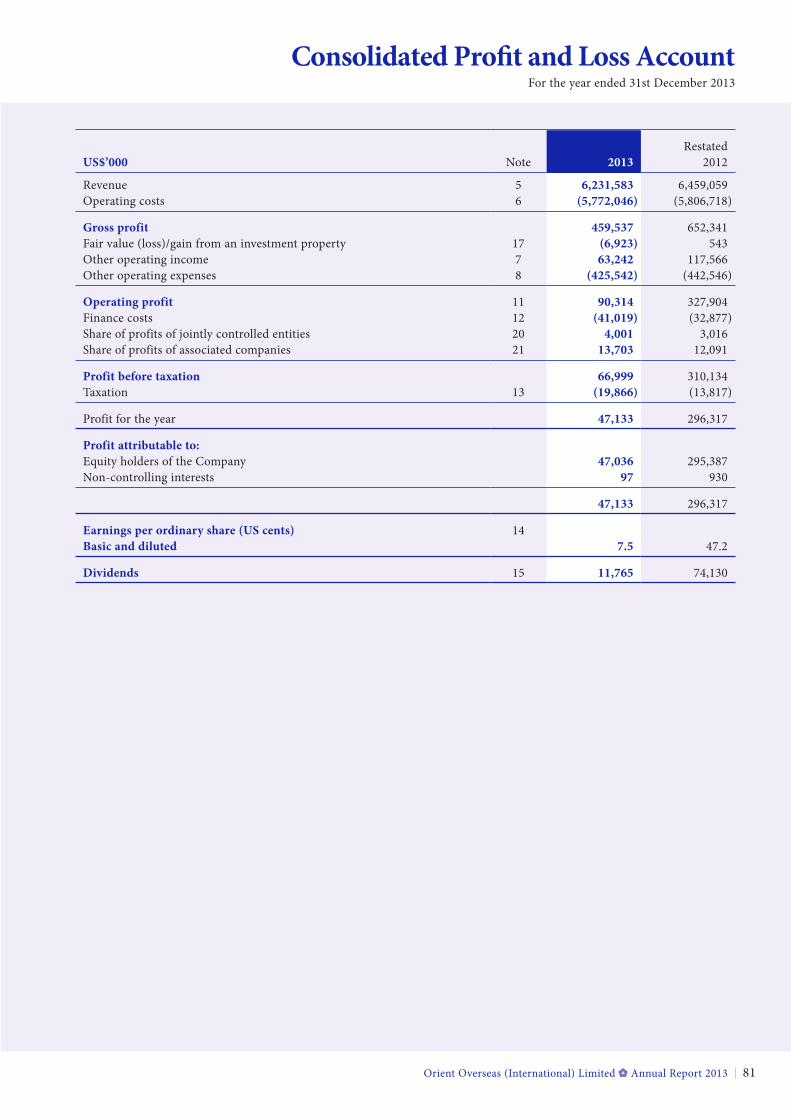
Orient Overseas (International) Limited Annual Report 2013 81
Consolidated Profit and Loss AccountFor the year ended 31st December 2013
US$’000 Note 2013Restated
2012
Revenue 5 6,231,583 6,459,059Operating costs 6 (5,772,046) (5,806,718)
Gross profit 459,537 652,341Fair value (loss)/gain from an investment property 17 (6,923) 543Other operating income 7 63,242 117,566Other operating expenses 8 (425,542) (442,546)
operating profit 11 90,314 327,904Finance costs 12 (41,019) (32,877)Share of profits of jointly controlled entities 20 4,001 3,016Share of profits of associated companies 21 13,703 12,091
profit before taxation 66,999 310,134Taxation 13 (19,866) (13,817)
Profit for the year 47,133 296,317
profit attributable to: Equity holders of the Company 47,036 295,387Non-controlling interests 97 930
47,133 296,317
earnings per ordinary share (US cents) 14Basic and diluted 7.5 47.2
Dividends 15 11,765 74,130
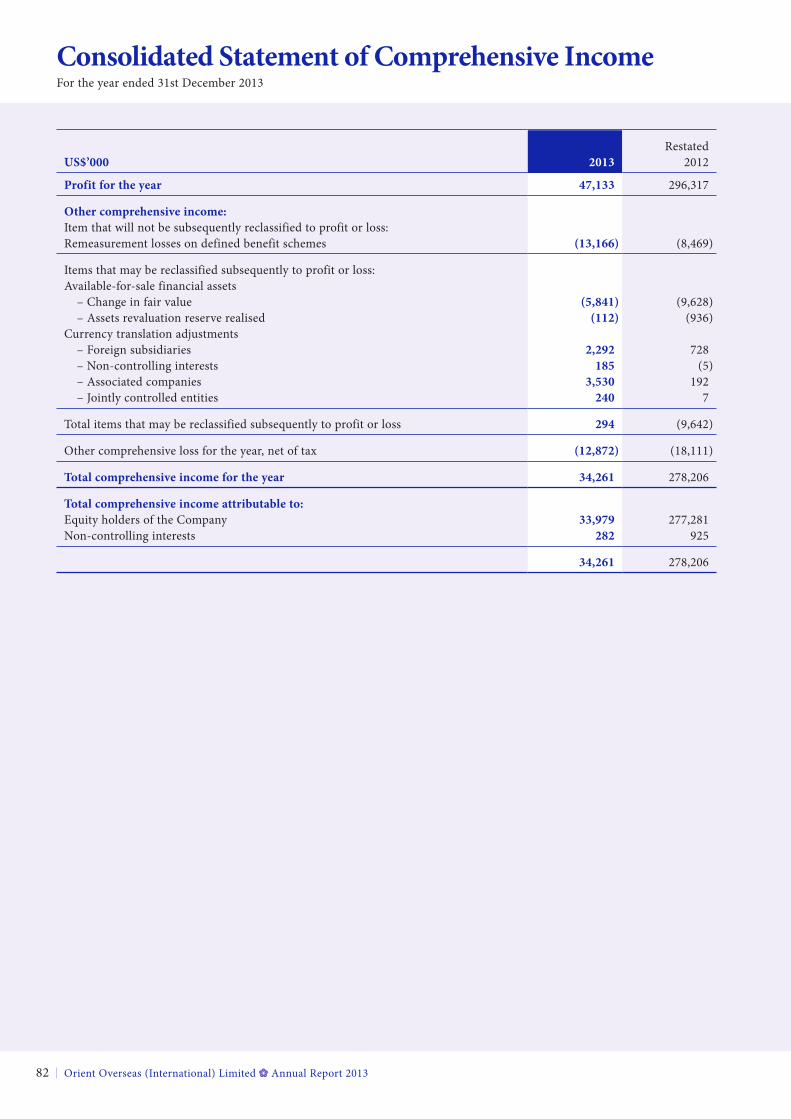
Consolidated Statement of Comprehensive IncomeFor the year ended 31st December 2013
Orient Overseas (International) Limited Annual Report 201382
US$’000 2013Restated
2012
profit for the year 47,133 296,317
other comprehensive income: Item that will not be subsequently reclassified to profit or loss: Remeasurement losses on defined benefit schemes (13,166) (8,469)
Items that may be reclassified subsequently to profit or loss: Available-for-sale financial assets – Change in fair value (5,841) (9,628) – Assets revaluation reserve realised (112) (936)Currency translation adjustments – Foreign subsidiaries 2,292 728 – Non-controlling interests 185 (5) – Associated companies 3,530 192 – Jointly controlled entities 240 7
Total items that may be reclassified subsequently to profit or loss 294 (9,642)
Other comprehensive loss for the year, net of tax (12,872) (18,111)
total comprehensive income for the year 34,261 278,206
total comprehensive income attributable to: Equity holders of the Company 33,979 277,281Non-controlling interests 282 925
34,261 278,206
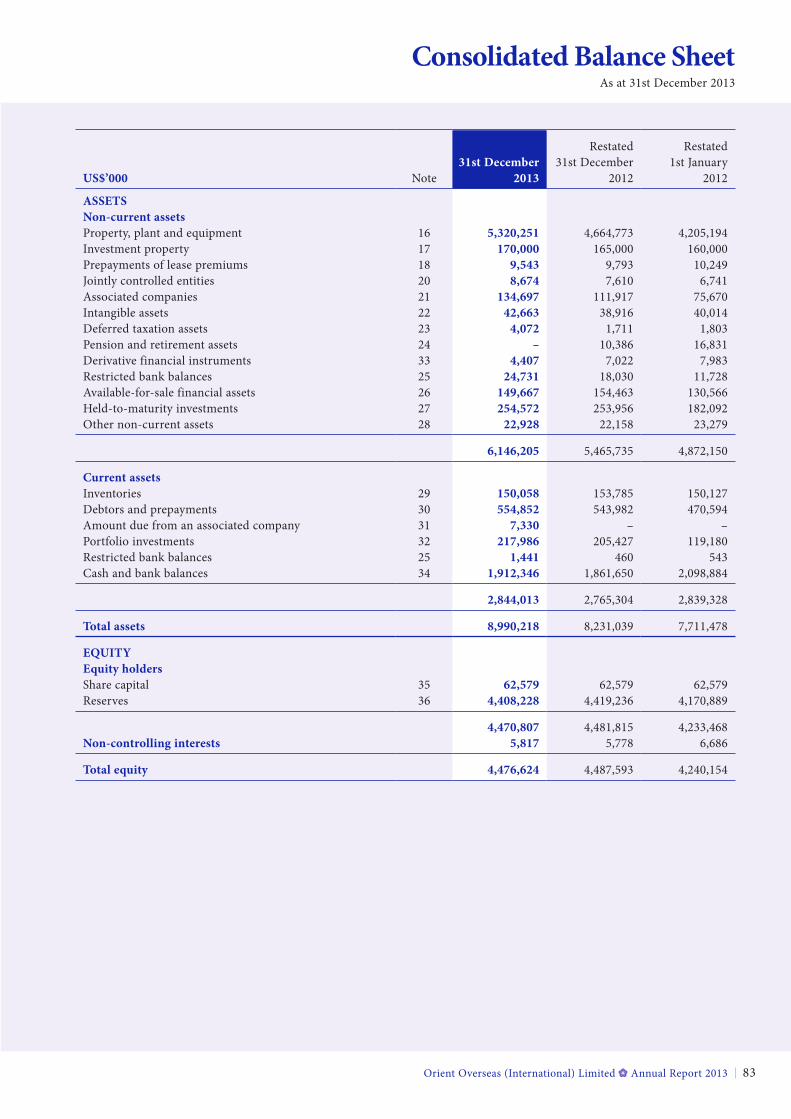
Orient Overseas (International) Limited Annual Report 2013 83
Consolidated Balance SheetAs at 31st December 2013
Restated Restated31st December 31st December 1st January
US$’000 Note 2013 2012 2012
aSSetSNon-current assetsProperty, plant and equipment 16 5,320,251 4,664,773 4,205,194Investment property 17 170,000 165,000 160,000Prepayments of lease premiums 18 9,543 9,793 10,249Jointly controlled entities 20 8,674 7,610 6,741Associated companies 21 134,697 111,917 75,670Intangible assets 22 42,663 38,916 40,014Deferred taxation assets 23 4,072 1,711 1,803Pension and retirement assets 24 – 10,386 16,831Derivative financial instruments 33 4,407 7,022 7,983Restricted bank balances 25 24,731 18,030 11,728Available-for-sale financial assets 26 149,667 154,463 130,566Held-to-maturity investments 27 254,572 253,956 182,092Other non-current assets 28 22,928 22,158 23,279
6,146,205 5,465,735 4,872,150
Current assetsInventories 29 150,058 153,785 150,127Debtors and prepayments 30 554,852 543,982 470,594Amount due from an associated company 31 7,330 – –Portfolio investments 32 217,986 205,427 119,180Restricted bank balances 25 1,441 460 543Cash and bank balances 34 1,912,346 1,861,650 2,098,884
2,844,013 2,765,304 2,839,328
total assets 8,990,218 8,231,039 7,711,478
eQUitYequity holdersShare capital 35 62,579 62,579 62,579Reserves 36 4,408,228 4,419,236 4,170,889
4,470,807 4,481,815 4,233,468Non-controlling interests 5,817 5,778 6,686
total equity 4,476,624 4,487,593 4,240,154
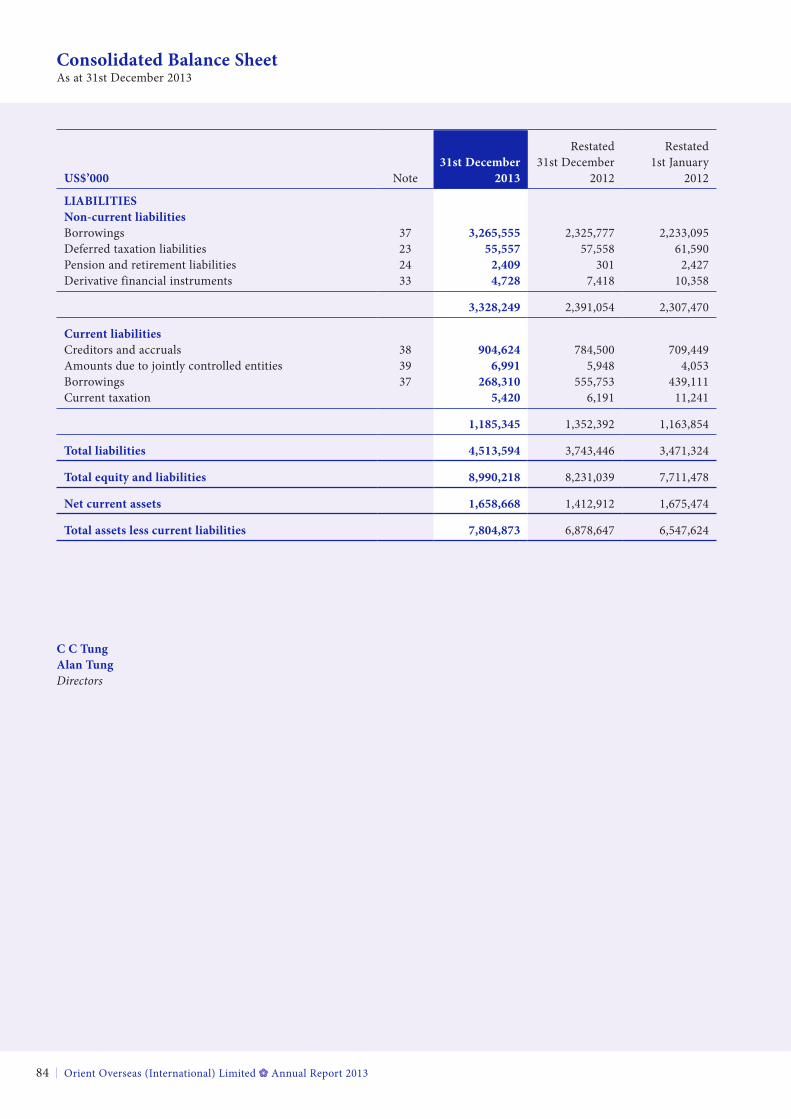
Orient Overseas (International) Limited Annual Report 201384
Consolidated Balance SheetAs at 31st December 2013
Restated Restated31st December 31st December 1st January
US$’000 Note 2013 2012 2012
liaBilitieSNon-current liabilitiesBorrowings 37 3,265,555 2,325,777 2,233,095Deferred taxation liabilities 23 55,557 57,558 61,590Pension and retirement liabilities 24 2,409 301 2,427Derivative financial instruments 33 4,728 7,418 10,358
3,328,249 2,391,054 2,307,470
Current liabilitiesCreditors and accruals 38 904,624 784,500 709,449Amounts due to jointly controlled entities 39 6,991 5,948 4,053Borrowings 37 268,310 555,753 439,111Current taxation 5,420 6,191 11,241
1,185,345 1,352,392 1,163,854
total liabilities 4,513,594 3,743,446 3,471,324
total equity and liabilities 8,990,218 8,231,039 7,711,478
Net current assets 1,658,668 1,412,912 1,675,474
total assets less current liabilities 7,804,873 6,878,647 6,547,624
C C tungalan tungDirectors
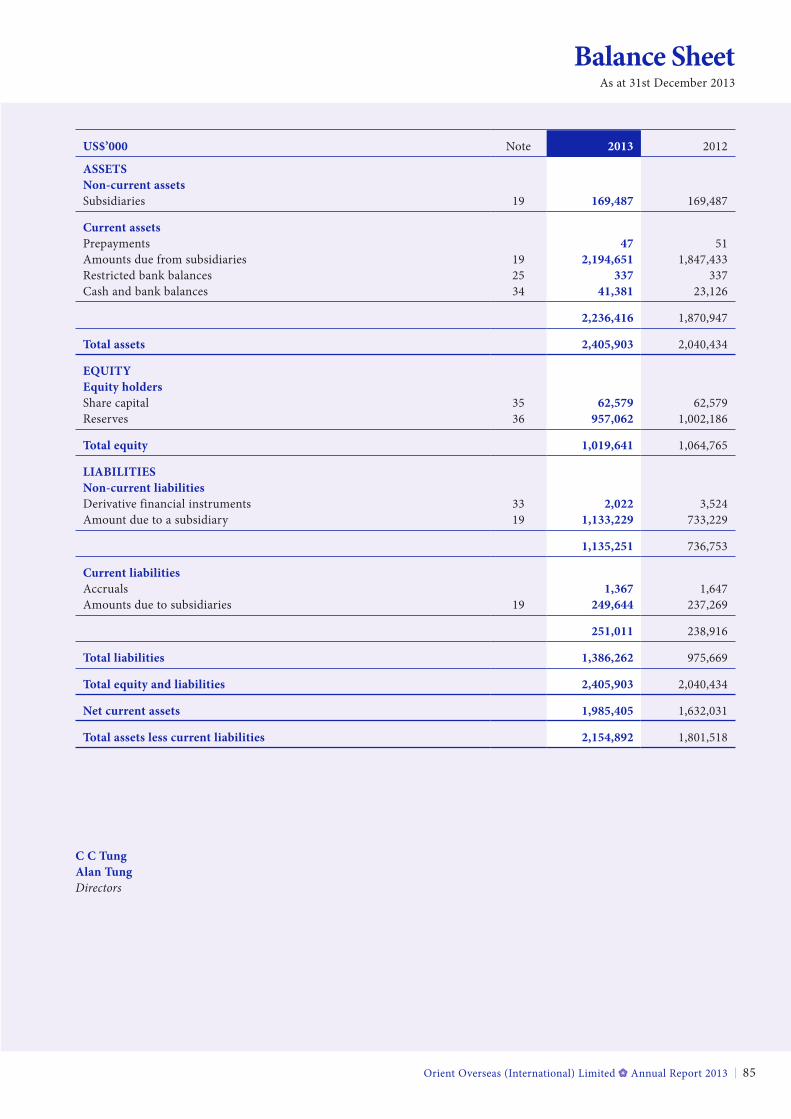
Orient Overseas (International) Limited Annual Report 2013 85
Balance SheetAs at 31st December 2013
US$’000 Note 2013 2012
aSSetS Non-current assets Subsidiaries 19 169,487 169,487
Current assets Prepayments 47 51Amounts due from subsidiaries 19 2,194,651 1,847,433Restricted bank balances 25 337 337Cash and bank balances 34 41,381 23,126
2,236,416 1,870,947
total assets 2,405,903 2,040,434
eQUitY equity holders Share capital 35 62,579 62,579Reserves 36 957,062 1,002,186
total equity 1,019,641 1,064,765
liaBilitieS Non-current liabilities Derivative financial instruments 33 2,022 3,524Amount due to a subsidiary 19 1,133,229 733,229
1,135,251 736,753
Current liabilities Accruals 1,367 1,647Amounts due to subsidiaries 19 249,644 237,269
251,011 238,916
total liabilities 1,386,262 975,669
total equity and liabilities 2,405,903 2,040,434
Net current assets 1,985,405 1,632,031
total assets less current liabilities 2,154,892 1,801,518
C C tungalan tungDirectors
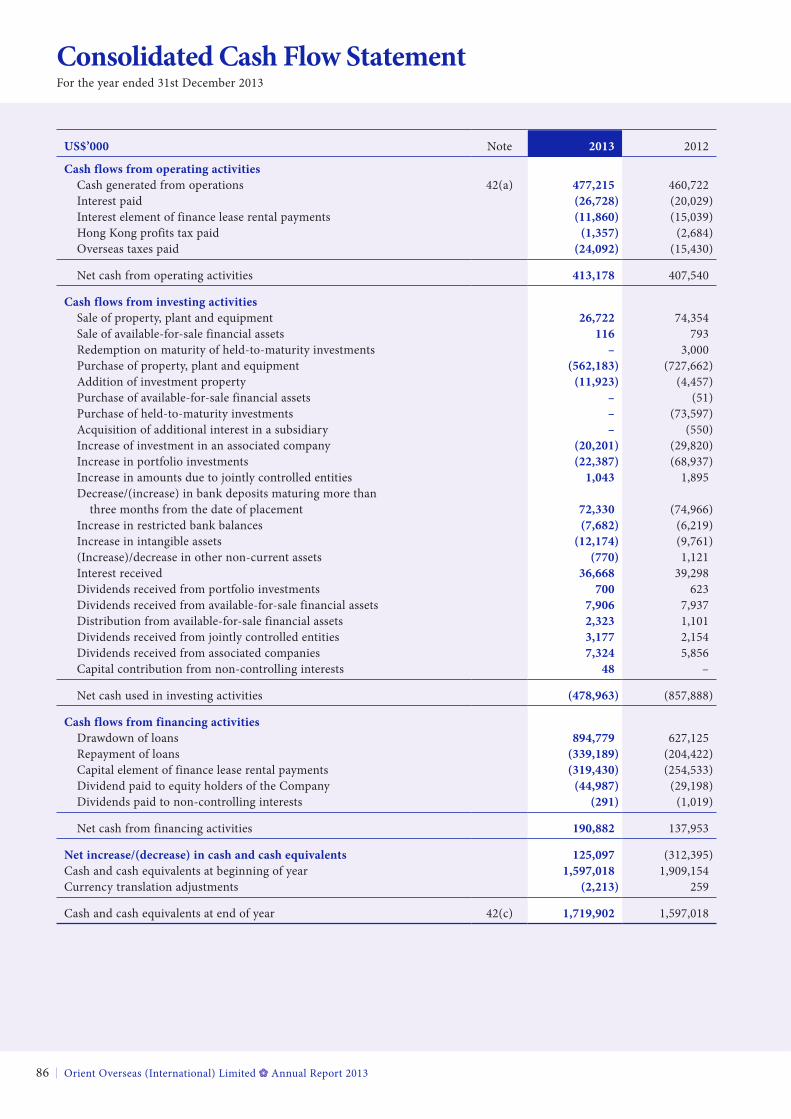
Consolidated Cash Flow StatementFor the year ended 31st December 2013
Orient Overseas (International) Limited Annual Report 201386
US$’000 Note 2013 2012
Cash flows from operating activities Cash generated from operations 42(a) 477,215 460,722 Interest paid (26,728) (20,029) Interest element of finance lease rental payments (11,860) (15,039) Hong Kong profits tax paid (1,357) (2,684) Overseas taxes paid (24,092) (15,430)
Net cash from operating activities 413,178 407,540
Cash flows from investing activities Sale of property, plant and equipment 26,722 74,354 Sale of available-for-sale financial assets 116 793 Redemption on maturity of held-to-maturity investments – 3,000 Purchase of property, plant and equipment (562,183) (727,662) Addition of investment property (11,923) (4,457) Purchase of available-for-sale financial assets – (51) Purchase of held-to-maturity investments – (73,597) Acquisition of additional interest in a subsidiary – (550) Increase of investment in an associated company (20,201) (29,820) Increase in portfolio investments (22,387) (68,937) Increase in amounts due to jointly controlled entities 1,043 1,895 Decrease/(increase) in bank deposits maturing more than three months from the date of placement 72,330 (74,966) Increase in restricted bank balances (7,682) (6,219) Increase in intangible assets (12,174) (9,761) (Increase)/decrease in other non-current assets (770) 1,121 Interest received 36,668 39,298 Dividends received from portfolio investments 700 623 Dividends received from available-for-sale financial assets 7,906 7,937 Distribution from available-for-sale financial assets 2,323 1,101 Dividends received from jointly controlled entities 3,177 2,154 Dividends received from associated companies 7,324 5,856 Capital contribution from non-controlling interests 48 –
Net cash used in investing activities (478,963) (857,888)
Cash flows from financing activities Drawdown of loans 894,779 627,125 Repayment of loans (339,189) (204,422) Capital element of finance lease rental payments (319,430) (254,533) Dividend paid to equity holders of the Company (44,987) (29,198) Dividends paid to non-controlling interests (291) (1,019)
Net cash from financing activities 190,882 137,953
Net increase/(decrease) in cash and cash equivalents 125,097 (312,395)Cash and cash equivalents at beginning of year 1,597,018 1,909,154Currency translation adjustments (2,213) 259
Cash and cash equivalents at end of year 42(c) 1,719,902 1,597,018
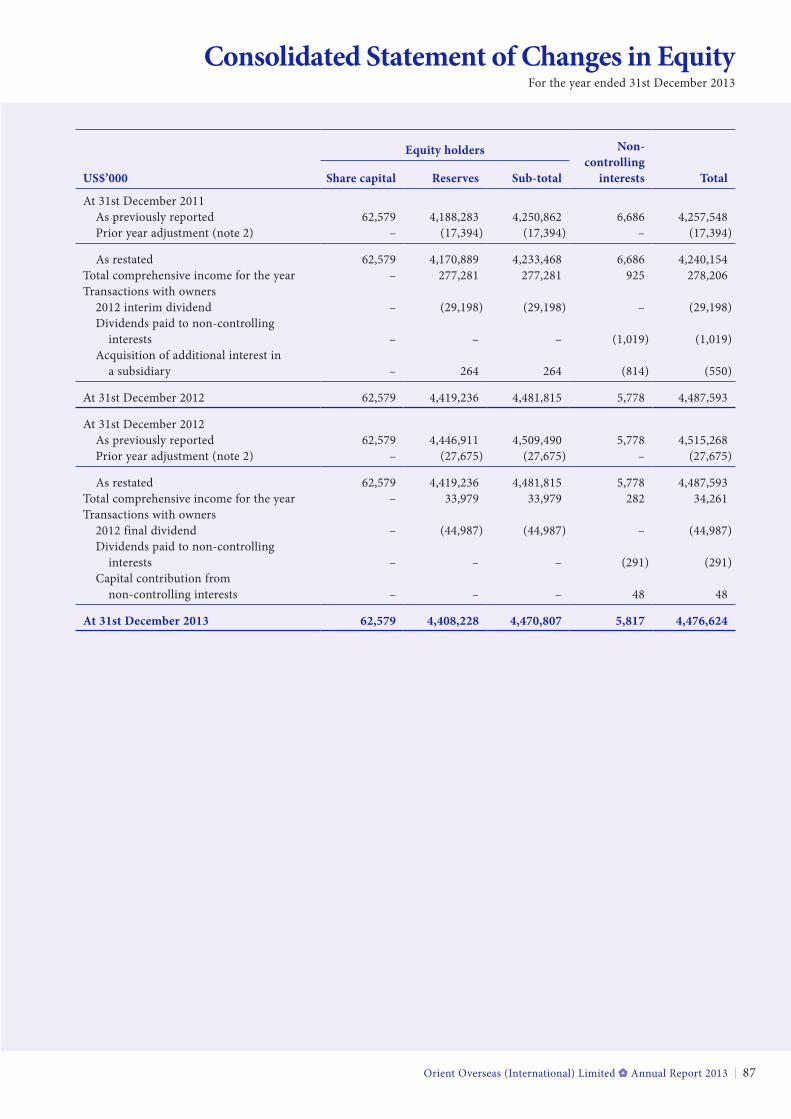
Orient Overseas (International) Limited Annual Report 2013 87
Consolidated Statement of Changes in EquityFor the year ended 31st December 2013
US$’000
equity holders Non-controlling
interests total
Share capital reserves Sub-total
At 31st December 2011 As previously reported 62,579 4,188,283 4,250,862 6,686 4,257,548 Prior year adjustment (note 2) – (17,394) (17,394) – (17,394)
As restated 62,579 4,170,889 4,233,468 6,686 4,240,154Total comprehensive income for the year – 277,281 277,281 925 278,206Transactions with owners 2012 interim dividend – (29,198) (29,198) – (29,198) Dividends paid to non-controlling interests – – – (1,019) (1,019) Acquisition of additional interest in a subsidiary – 264 264 (814) (550)
At 31st December 2012 62,579 4,419,236 4,481,815 5,778 4,487,593
At 31st December 2012 As previously reported 62,579 4,446,911 4,509,490 5,778 4,515,268 Prior year adjustment (note 2) – (27,675) (27,675) – (27,675)
As restated 62,579 4,419,236 4,481,815 5,778 4,487,593Total comprehensive income for the year – 33,979 33,979 282 34,261Transactions with owners 2012 final dividend – (44,987) (44,987) – (44,987) Dividends paid to non-controlling interests – – – (291) (291) Capital contribution from non-controlling interests – – – 48 48
at 31st December 2013 62,579 4,408,228 4,470,807 5,817 4,476,624
Notes to the Consolidated Accounts
Orient Overseas (International) Limited Annual Report 201388
1. General informationOrient Overseas (International) Limited (“the Company”) is a limited liability company incorporated in Bermuda. The address of its registered office is 33rd floor, Harbour Centre, No. 25 Harbour Road, Wanchai, Hong Kong.
The principal activity of the Company is investment holding and the activities of its principal subsidiaries, associated companies and jointly controlled entities are set out on pages 145 to 154 of the accounts.
The Company has its listing on the Main Board of The Stock Exchange of Hong Kong Limited.
2. Summary of significant accounting policiesThe significant accounting policies applied in the preparation of these consolidated accounts are set out below. These policies have been consistently applied to both years presented, unless otherwise stated.
2.1 Basis of preparationThe consolidated accounts have been prepared in accordance with Hong Kong Financial Reporting Standards (“HKFRS”). They have been prepared under the historical cost convention, as modified by the revaluation of investment property, available-for-sale financial assets, portfolio investments and derivative financial instruments which are carried at fair value.
The preparation of accounts in conformity with HKFRS requires the use of certain critical accounting estimates. It also requires management to exercise its judgement in the process of applying the Group’s accounting policies. The areas involving a higher degree of judgement or complexity, or areas where assumptions and estimates are significant to the consolidated accounts, are disclosed in note 4.
the adoption of revised HKfrS
In 2013, the Group adopted the new and amendments of HKFRS below, which are relevant to its operations.
New standards and amendments
HKAS 1 Amendment Presentation of Financial StatementsHKAS 19 Amendment Employee BenefitsHKAS 27 (2011) Separate Financial StatementsHKAS 28 (2011) Associates and Joint VenturesHKFRS 7 Amendment Financial Instruments: Disclosures – Offsetting Financial Assets and
Financial LiabilitiesHKFRS 10 Consolidated Financial StatementsHKFRS 10 Amendment Consolidated Financial Statements – Transition GuidanceHKFRS 11 Joint ArrangementsHKFRS 11 Amendment Joint Arrangements – Transition GuidanceHKFRS 12 Disclosure of Interests in Other EntitiesHKFRS 12 Amendment Disclosure of Interests in Other Entities – Transition GuidanceHKFRS 13 Fair Value MeasurementsHKFRSs Annual Improvements 2009-2011 Reporting Cycle
Excepted for HKAS 19 Amendment and HKFRS 13 mentioned below, there are no other new standards, amendments and improvements that are effective for the first time for 2013 that would have a material impact on the Group.
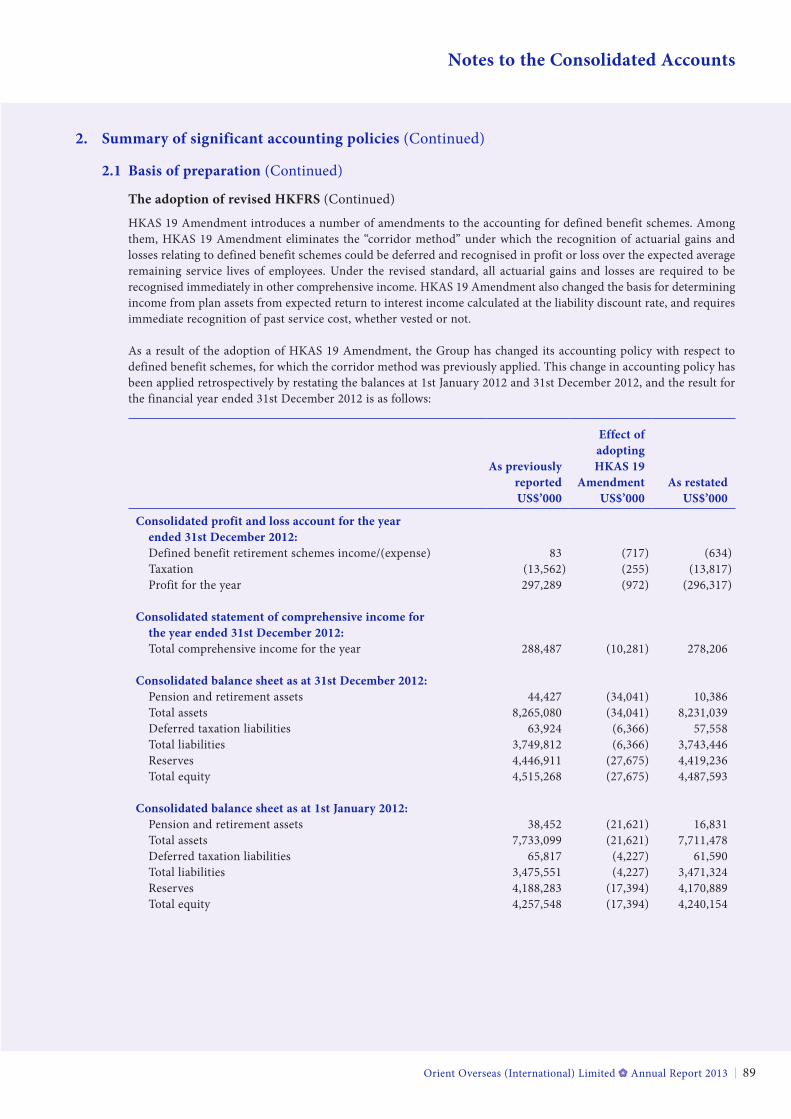
Orient Overseas (International) Limited Annual Report 2013 89
Notes to the Consolidated Accounts
2. Summary of significant accounting policies (Continued)
2.1 Basis of preparation (Continued)
the adoption of revised HKfrS (Continued)
HKAS 19 Amendment introduces a number of amendments to the accounting for defined benefit schemes. Among them, HKAS 19 Amendment eliminates the “corridor method” under which the recognition of actuarial gains and losses relating to defined benefit schemes could be deferred and recognised in profit or loss over the expected average remaining service lives of employees. Under the revised standard, all actuarial gains and losses are required to be recognised immediately in other comprehensive income. HKAS 19 Amendment also changed the basis for determining income from plan assets from expected return to interest income calculated at the liability discount rate, and requires immediate recognition of past service cost, whether vested or not.
As a result of the adoption of HKAS 19 Amendment, the Group has changed its accounting policy with respect to defined benefit schemes, for which the corridor method was previously applied. This change in accounting policy has been applied retrospectively by restating the balances at 1st January 2012 and 31st December 2012, and the result for the financial year ended 31st December 2012 is as follows:
as previously reported
effect of adopting HKaS 19
amendment as restatedUS$’000 US$’000 US$’000
Consolidated profit and loss account for the year ended 31st December 2012: Defined benefit retirement schemes income/(expense) 83 (717) (634) Taxation (13,562) (255) (13,817) Profit for the year 297,289 (972) (296,317)
Consolidated statement of comprehensive income for the year ended 31st December 2012: Total comprehensive income for the year 288,487 (10,281) 278,206
Consolidated balance sheet as at 31st December 2012: Pension and retirement assets 44,427 (34,041) 10,386 Total assets 8,265,080 (34,041) 8,231,039 Deferred taxation liabilities 63,924 (6,366) 57,558 Total liabilities 3,749,812 (6,366) 3,743,446 Reserves 4,446,911 (27,675) 4,419,236 Total equity 4,515,268 (27,675) 4,487,593
Consolidated balance sheet as at 1st january 2012: Pension and retirement assets 38,452 (21,621) 16,831 Total assets 7,733,099 (21,621) 7,711,478 Deferred taxation liabilities 65,817 (4,227) 61,590 Total liabilities 3,475,551 (4,227) 3,471,324 Reserves 4,188,283 (17,394) 4,170,889 Total equity 4,257,548 (17,394) 4,240,154
Orient Overseas (International) Limited Annual Report 201390
Notes to the Consolidated Accounts
2. Summary of significant accounting policies (Continued)
2.1 Basis of preparation (Continued)
the adoption of revised HKfrS (Continued)
The effect of the change in this accounting policy on the cash flow statement and on earnings per share was not significant.
HKFRS 13 “Fair Value Measurements” measurement and disclosure requirements are applicable for the Group for the year ended 31st December 2013.
Standard, amendments and interpretation to existing standards that are relevant but not yet effective to the Group
New standard, amendments and interpretation
effective for accounting periods
beginning on or after
HKAS 32 Amendment Financial Instruments: Presentation – Offsetting Financial Assets and Financial Liabilities
1st January 2014
HKAS 36 Amendment Recoverable amount disclosures for non-financial assets 1st January 2014HK(IFRIC) – Int 21 Levies 1st January 2014HKFRSs Annual Improvements 2010-2012 Reporting Cycle 1st July 2014HKFRSs Annual Improvements 2011-2013 Reporting Cycle 1st July 2014HKFRS 7 Amendment Financial Instruments: Disclosures – Mandatory Effective
Date of HKFRS 9 and Transitional DisclosuresNot yet determined*
HKFRS 9 Financial Instruments Not yet determined*
* For those in connection with HKFRS 9, the mandatory effective date will be determined when the outstanding phases of HKFRS 9 are finalised.
The Group has not early adopted the above standard, amendments and interpretation and is not yet in a position to state whether substantial changes to the Group’s accounting policies and presentation of accounts will result.
2.2 ConsolidationThe consolidated accounts include the accounts of the Company and its subsidiaries made up to 31st December.
The consolidated accounts also include the Group’s attributable share of post-acquisition results and reserves of its jointly controlled entities and associated companies.
(a) Subsidiaries
A subsidiary is an entity (including a structured entity) over which the Group has control. The Group controls an entity when the Group is exposed to, or has rights to, variable returns from its involvement with the entity and has the ability to affect those returns through its power over the entity. Subsidiaries are consolidated from the date on which control is transferred to the Group. They are de-consolidated from the date that control ceases.
The Group uses the acquisition method of accounting to account for business combinations. The consideration transferred for the acquisition of a subsidiary is the fair values of the assets transferred, the liabilities incurred and the equity interests issued by the Group. The consideration transferred includes the fair value of any asset or liability resulting from a contingent consideration arrangement. Acquisition-related costs are expensed as incurred. Identifiable assets acquired and liabilities and contingent liabilities assumed in a business combination are measured initially at their fair values at the acquisition date. On an acquisition-by-acquisition basis, the Group recognises any non-controlling interest in the acquiree either at fair value or at the non-controlling interest’s proportionate share of the acquiree’s identifiable net assets.
Orient Overseas (International) Limited Annual Report 2013 91
Notes to the Consolidated Accounts
2. Summary of significant accounting policies (Continued)
2.2 Consolidation (Continued)
(a) Subsidiaries (Continued)
The excess of the consideration transferred, the amount of any non-controlling interest in the acquiree and the acquisition-date fair value of any previous equity interest in the acquiree over the fair value of the identifiable net assets acquired is recorded as goodwill. If the total of consideration transferred, non-controlling interest recognised and previously held interest measured is less than the fair value of the net assets of the subsidiary acquired in the case of a bargain purchase, the difference is recognised directly in the consolidated profit and loss account.
Inter-company transactions, balances and unrealised gains on transactions between group companies are eliminated. Unrealised losses are also eliminated unless the transaction provides evidence of an impairment of the asset transferred.
In the Company’s balance sheet, the investments in subsidiaries are stated at cost less provision for impairment losses. The results of subsidiaries are recognised by the Company on the basis of dividend received and receivable.
(b) transactions with non-controlling interests
Transactions with non-controlling interests that do not result in a loss of control are accounted for as equity transactions – that is, as transactions with the owners of the subsidiary in their capacity as owners. The difference between any consideration paid and the relevant share acquired of the carrying value of net assets of the subsidiary is recorded in equity. Gains or losses on disposals to non-controlling interests are also recorded in equity.
When the Group ceases to have control, any retained interest in the entity is remeasured to its fair value, with the change in carrying amount recognised in profit or loss. The fair value is the initial carrying amount for the purposes of subsequent accounting for the retained interest as an associate, joint venture or financial asset. In addition, any amounts previously recognised in other comprehensive income in respect of that entity are accounted for as if the Group had directly disposed of the related assets or liabilities. This may mean that amounts previously recognised in other comprehensive income are reclassified to profit or loss.
(c) joint arrangements
Joint arrangements are classified as either joint operations or joint ventures depending on the contractual rights and obligations of each investor. The Group has assessed the nature of its joint arrangements and determined them to be joint ventures. Joint ventures are accounted for using the equity method.
Under the equity method of accounting, interests in joint ventures are initially recognised at cost and adjusted thereafter to recognise the Group’s share of the post-acquisition profits or losses and movements in other comprehensive income. When the Group’s share of losses in a joint venture equals or exceeds its interests in the joint ventures (which includes any long-term interests that, in substance, form part of the Group’s net investment in the joint ventures), the Group does not recognise further losses, unless it has incurred obligations or made payments on behalf of the joint ventures.
Unrealised gains on transactions between the Group and its joint ventures are eliminated to the extent of the Group’s interest in the joint ventures. Unrealised losses are also eliminated unless the transaction provides evidence of an impairment of the asset transferred.
Orient Overseas (International) Limited Annual Report 201392
Notes to the Consolidated Accounts
2. Summary of significant accounting policies (Continued)
2.2 Consolidation (Continued)
(d) associated companies
Associated companies are all entities over which the Group has significant influence but not control, generally accompanying a shareholding of between 20% and 50% of the voting rights. Investments in associated companies are accounted for by the equity method of accounting and are initially recognised at cost. The Group’s investments in associated companies include goodwill (net of any accumulated impairment loss) identified on acquisition.
If the ownership interest in an associate is reduced but significant influence is retained, only a proportionate share of the amounts previously recognised in other comprehensive income are reclassified to profit or loss where appropriate.
The Group’s share of its associated companies’ post-acquisition profits or losses is recognised in the consolidated profit and loss account, and its share of post-acquisition movements in reserves is recognised in reserves. The cumulative post-acquisition movements are adjusted against the carrying amount of the investment. When the Group’s share of losses in an associated company equals or exceeds its interest in the associated company, including any other unsecured receivables, the Group does not recognise further losses, unless it has incurred obligations or made payments on behalf of the associated company.
Profits and losses resulting from upstream and downstream transactions between the Group and its associate are recognised in the Group’s financial statements only to the extent of unrelated investor’s interests in the associates. Unrealised losses are also eliminated unless the transaction provides evidence of an impairment of the asset transferred. Accounting policies of associated companies have been changed where necessary to ensure consistency with the policies adopted by the Group.
2.3 property, plant and equipmentAll property, plant and equipment are stated at historical cost less depreciation and impairment losses. Historical cost includes expenditure that is directly attributable to the acquisition of the items. Subsequent costs are included in the asset’s carrying amount or recognised as a separate asset, as appropriate, only when it is probable that future economic benefits associated with the item will flow to the Group and the cost of the item can be measured reliably. All other repairs and maintenance are charged to the consolidated profit and loss account during the financial period in which they are incurred.
No depreciation is provided for assets under construction and freehold land.
Vehicles, computer and other equipment include terminal equipment and improvements.
Depreciation of property, plant and equipment is calculated using the straight-line method to allocate their costs to their residual values over their estimated useful lives, as follows:
Container vessels 25 yearsContainers 5 to 12 yearsChassis 10 to 12 yearsTerminal equipment and improvements 10 to 15 yearsFreehold buildings Not exceeding 75 yearsLeasehold buildings Over period of the leaseLeasehold improvements Over period of the leaseFurnitures, vehicles, computers and other equipment 3 to 15 years
Orient Overseas (International) Limited Annual Report 2013 93
Notes to the Consolidated Accounts
2. Summary of significant accounting policies (Continued)
2.3 property, plant and equipment (Continued)The residual values of the assets and their useful lives are reviewed and adjusted if appropriate, at each balance sheet date.
The carrying amount of an asset is written down immediately to its recoverable amount if the carrying amount of the asset is greater than its estimated recoverable amount.
Gains and losses on disposals are determined as the difference between the net disposal proceeds and the carrying amounts of the assets and are dealt with in the consolidated profit and loss account.
2.4 investment propertyProperty that is held for long-term rental yields or for capital appreciation or both, and that is not occupied by the companies in the Group, is classified as investment property. Investment property comprises freehold land, land held under operating leases and buildings held under finance leases. Land held under operating leases are classified and accounted for as investment property when the rest of the definition of investment property is met. The operating lease is accounted for as if it were a finance lease.
Investment property is initially measured at cost, including related transaction costs and where applicable borrowing costs. After initial recognition, investment property is carried at fair value. Fair value is based on valuation carried out semi-annually by an independent external valuer. Changes in fair values are recognised in the consolidated profit and loss account.
2.5 Vessel repairs and surveysUpon acquisition of a vessel, the components of the vessel which are required to be replaced at the next dry-docking are identified and their costs are depreciated over the period to the next estimated dry-docking date, usually ranging from three to five years. Costs incurred on subsequent dry-docking of vessels are capitalised and depreciated over the period to the next estimated dry-docking date. When significant dry-docking costs incurred prior to the expiry of the depreciation period, the remaining costs of the previous dry-docking are written off immediately.
2.6 intangible assets
(a) Goodwill
Goodwill represents the excess of the cost of an acquisition over the fair value of the Group’s share of the net identifiable assets of the acquired subsidiary, associated company or jointly controlled entity at the effective date of acquisition.
Goodwill on acquisition of a foreign operation is treated as an asset of the foreign operation.
Goodwill arising on acquisition of subsidiaries is retained at the carrying amount as an intangible asset. Goodwill arising on acquisition of associated companies and jointly controlled entities is included within investments in associated companies and jointly controlled entities respectively and is tested for impairment as part of overall balance. Separately recognised goodwill is subject to impairment review annually and when there are indications that the carrying value may not be recoverable. If the cost of acquisition is less than the fair value of the Group’s share of the net identifiable assets of the acquired company, the difference is recognised in the consolidated profit and loss account.
The profit or loss on disposal of subsidiaries, associated companies or jointly controlled entities is calculated by reference to the net assets at the date of disposal including the attributable amount of goodwill but does not include any attributable goodwill previously eliminated against reserves.
Orient Overseas (International) Limited Annual Report 201394
Notes to the Consolidated Accounts
2. Summary of significant accounting policies (Continued)
2.6 intangible assets (Continued)
(b) Computer software
Costs associated with maintaining computer software programmes are recognised as an expense as incurred. Costs that are directly associated with the production of identifiable and unique software products controlled by the Group, and that will probably generate economic benefits exceeding costs beyond one year, are recognised as intangible assets. Direct costs include the software development employee costs and an appropriate portion of relevant overheads.
Computer software development costs recognised as assets are stated at cost less accumulated amortisation. Amortisation is calculated on the straight-line basis over their estimated useful life of five years.
2.7 impairment of investments in subsidiaries and non-financial assetsAssets that have an indefinite useful life are not subject to amortisation, and are at least tested annually for impairment. Assets that are subject to amortisation are reviewed for impairment whenever events or changes in circumstances indicate that the carrying amount may not be recoverable. An impairment loss is recognised for the amount by which the carrying amount of the asset exceeds its recoverable amount. The recoverable amount is the higher of the fair value of an asset less costs to sell and value in use. For the purposes of assessing impairment, assets are grouped at the lowest levels for which there are separately identifiable cash flows (cash generating units). Non-financial assets other than goodwill that suffered an impairment are reviewed for possible reversal of the impairment at each reporting date.
Impairment testing of the investments in subsidiaries is required upon receiving dividends from these investments if the dividend exceeds the total comprehensive income of the subsidiary in the period the dividend is declared or if the carrying amount of the investment in the separate account exceeds the carrying amount in the consolidated accounts of the investee’s net assets including goodwill.
2.8 investmentsThe Group classifies its investments into the following categories: portfolio investments, loans and receivables, held-to-maturity investments and available-for-sale financial assets. The classification depends on the purpose for which the investments were acquired. Management determines the classification of its investments at initial recognition and re-evaluates this designation at every reporting date.
(a) portfolio investments
Portfolio investments include financial assets held for trading and those designated at fair value through profit or loss at inception. A financial asset is classified in this category if acquired principally for the purpose of selling in the short term or if so designated by management. Assets in this category are classified as current assets if they are either held for trading or are expected to be realised within 12 months from the balance sheet date.
(b) loans and receivables
Loans and receivables are non-derivative financial assets with fixed or determinable payments that are not quoted in an active market. They arise when the Group provides money or services directly to a debtor with no intention of trading the receivable. They are included in current assets, except for maturities greater than 12 months after the balance sheet date; which are classified as non-current assets.
Orient Overseas (International) Limited Annual Report 2013 95
Notes to the Consolidated Accounts
2. Summary of significant accounting policies (Continued)
2.8 investments (Continued)
(c) Held-to-maturity investments
Held-to-maturity investments are non-derivative financial assets with fixed or determinable payments and fixed maturities that the Group’s management has the positive intention and ability to hold to maturity. If the Group were to sell other than an insignificant amount of held-to-maturity investments, the whole category would be reclassified as available-for-sale financial assets. Held-to-maturity investments are included in non-current assets, except for those with maturities less than 12 months from the balance sheet date; which are classified as current assets.
(d) available-for-sale financial assets
Available-for-sale financial assets are non-derivatives that are either designated in this category or not classified in any of the other categories. They are included in non-current assets unless management intends to dispose of the investment within 12 months of the balance sheet date.
Interest on available-for-sale financial assets calculated using the effective interest method is recognised in the profit and loss account as part of other income. Dividends on available-for-sale equity instruments are recognised in the profit and loss account as part of other income when the Group’s right to receive payments is established.
(e) recognition and measurement
Regular way purchases and sales of investments are recognised on trade-date – the date on which the Group commits to purchase or sell the asset. Investments are initially recognised at fair value plus transaction costs for all financial assets not carried at fair value through profit or loss. Investments are derecognised when the rights to receive cash flows from the investments have expired or have been transferred and the Group has transferred substantially all risks and rewards of ownership. Available-for-sale financial assets and portfolio investments are subsequently carried at fair value. Loans and receivables and held-to-maturity investments are carried at amortised cost using the effective interest method less impairment losses, if any.
Realised and unrealised gains and losses arising from changes in the fair value of the portfolio investments are included in the consolidated profit and loss account in the period in which they arise. Unrealised gains and losses arising from changes in the fair value of non-monetary securities classified as available-for-sale financial assets are recognised in other comprehensive income. When securities classified as available-for-sale financial assets are sold or impaired, the accumulated fair value adjustments are included in the consolidated profit and loss account as gains and losses from available-for-sale financial assets.
The fair values of quoted investments are based on current bid prices. If the market for a financial asset is not active (and for unlisted securities), the Group establishes fair value by using valuation techniques. These include the use of recent arm’s length transactions, reference to other instruments that are substantially the same, discounted cash flow analysis, and option pricing models refined to reflect the issuer’s specific circumstances.
The Group may choose to reclassify a non-derivative trading financial asset out of the portfolio investments category if the financial asset is no longer held for the purpose of selling it in the near term. Financial assets other than loans and receivables are permitted to be reclassified out of the held for trading category only in rare circumstances arising from a single event that is unusual and highly unlikely to recur in the near term. In addition, the Group may choose to reclassify financial assets that would meet the definition of loans and receivables or held-to-maturity investments out of the portfolio investments or available-for-sale financial assets categories if the Group has the intention and ability to hold these financial assets for the foreseeable future or until maturity at the date of reclassification.
Orient Overseas (International) Limited Annual Report 201396
Notes to the Consolidated Accounts
2. Summary of significant accounting policies (Continued)
2.8 investments (Continued)
(e) recognition and measurement (Continued)
Reclassifications are made at fair value as of the reclassification date. Fair value becomes the new cost or amortised cost as applicable, and no reversals of fair value gains or losses recorded before reclassification date are subsequently made. Effective interest rates for financial assets reclassified to loans and receivables and held-to-maturity categories are determined at the reclassification date. Further increases in estimates of cash flows adjust effective interest rates prospectively.
The Group assesses at each balance sheet date whether there is objective evidence that a financial asset or a group of financial assets is impaired. In the case of equity securities classified as available-for-sale financial assets, a significant or prolonged decline in the fair value of the securities below its cost is considered in determining whether the securities are impaired. If any such evidence exists for available-for-sale financial assets, the cumulative loss measured as the difference between the acquisition cost and the current fair value, less any impairment loss on that financial asset previously recognised in the consolidated profit and loss account is removed from equity and recognised in the consolidated profit and loss account. Impairment losses recognised in the consolidated profit and loss account on equity instruments are not reversed through the consolidated profit and loss account.
Impairment on held-to-maturity investments is considered at both an individual and collective level. The individual impairment allowance is measured as the difference between the asset’s carrying amount and the present value of estimated future cash flows, discounted at asset’s original effective interest rate, where the effect of discounting is material.
For loans and receivables category, the amount of the loss is measured as the difference between the asset’s carrying amount and the present value of estimated future cash flows (excluding future credit losses that have not been incurred) discounted at the financial asset’s original effective interest rate. The carrying amount of the asset is reduced and the amount of the loss is recognised in the consolidated profit and loss account. If a loan or held-to-maturity investment has a variable interest rate, the discount rate for measuring any impairment loss is the current effective interest rate determined under the contract. As a practical expedient, the Group may measure impairment on the basis of an instrument’s fair value using an observable market price.
(f) offsetting financial instruments
Financial assets and liabilities are offset and the net amount reported in the balance sheet when there is a legally enforceable right to offset the recognised amounts and there is an intention to settle on a net basis or realise the asset and settle the liability simultaneously.
2.9 inventoriesInventories mainly comprise bunkers and consumable stores. Cost is calculated on weighted average basis. Inventories are stated at the lower of cost and net realisable value. Net realisable value is the estimated selling price in the ordinary course of business, less the costs of completion and selling expenses.
2.10 DebtorsDebtors are recognised initially at fair value and subsequently measured at amortised cost using the effective interest method, less provision for impairment. A provision for impairment of debtors is established when there is objective evidence that the Group will not be able to collect all amounts due according to the original terms of receivables. The amount of the provision is the difference between the asset’s carrying amount and the present value of estimated future cash flows, discounted at the effective interest rate. The amount of the provision is recognised in the consolidated profit and loss account.
If collection of debtors is expected in one year or less (or in the normal operating cycle of the business if longer), they are classified as current assets. If not, they are presented as non-current assets.
Orient Overseas (International) Limited Annual Report 2013 97
Notes to the Consolidated Accounts
2. Summary of significant accounting policies (Continued)
2.11 Cash and cash equivalentsCash and cash equivalents include cash in hand, deposits held at call with banks with original maturities of three months or less and net of bank overdrafts. Bank overdrafts are shown within borrowings in current liabilities on the consolidated balance sheet.
2.12 Share capitalOrdinary shares are classified as equity.
Incremental costs directly attributable to the issue of new shares are shown in equity as a deduction, net of tax, from the proceeds.
2.13 CreditorsTrade creditors are obligations to pay for goods or services that have been acquired in the ordinary course of business from suppliers. Creditors are classified as current liabilities if payment is due within one year or less or in the normal operating cycle of the business if longer. If not, they are presented as non-current liabilities.
Trade creditors are recognised initially at fair value and subsequently measured at amortised cost using the effective interest method.
2.14 BorrowingsBorrowings are recognised initially at fair value, net of transaction costs incurred. Borrowings are subsequently stated at amortised cost; any difference between the proceeds net of transaction costs and the redemption value is recognised in the consolidated profit and loss account over the period of the borrowings using the effective interest method.
Borrowings are classified as current liabilities unless the Group has an unconditional right to defer settlement of the liability for at least twelve months after the balance sheet date.
Fees paid on the establishment of loan facilities are recognised as transaction costs of the loan to the extent that it is probable that some or all of the facility will be drawn down. In this case, the fee is deferred until the draw-down occurs. To the extent there is no evidence that it is probable that some or all of the facility will be drawn down, the fee is capitalised as a pre-payment for liquidity services and amortised over the period of the facility to which it relates.
2.15 Current and deferred taxationThe tax expense for the year comprises current and deferred tax. Tax is recognised in the consolidated profit and loss account, except to the extent that it relates to item recognised in other comprehensive income or directly in equity. In this case the tax is also recognised in other comprehensive income or directly in equity, respectively.
The current income tax charge is calculated on the basis of the tax laws enacted or substantively enacted at the balance sheet date in the countries where the Company’s subsidiaries, jointly controlled entities and associated companies operate and generate taxable income. Management periodically evaluates positions taken in tax returns with respect to situations in which applicable tax regulation is subject to interpretation. It establishes provisions where appropriate on the basis of amounts expected to be paid to the tax authorities.
Deferred taxation is provided in full, using the liability method, on temporary differences arising between the tax bases of assets and liabilities and their carrying amounts in the consolidated accounts. However, if the deferred taxation arises from initial recognition of an asset or liability in a transaction other than a business combination that at the time of the transaction affects neither accounting nor taxable profit or loss, it is not accounted for. Deferred taxation is determined using tax rates that have been enacted or substantively enacted by the balance sheet date and are expected to apply when the related deferred taxation asset is realised or the deferred taxation liability is settled.
Orient Overseas (International) Limited Annual Report 201398
Notes to the Consolidated Accounts
2. Summary of significant accounting policies (Continued)
2.15 Current and deferred taxation (Continued)Deferred taxation assets are recognised to the extent that it is probable that future taxable profit will be available against which the temporary differences can be utilised.
Deferred taxation is provided on temporary differences arising on investments in subsidiaries, associated companies and jointly controlled entities, except where the timing of the reversal of the temporary difference is controlled by the Group and it is probable that the temporary difference will not reverse in the foreseeable future.
Deferred income tax assets and liabilities are offset when there is a legally enforceable right to offset current tax assets against current tax liabilities and when the deferred income tax assets and liabilities related to income taxes levied by the same taxation authority on either the taxable entity or different taxable entities where there is an intention to settle the balances on a net basis.
2.16 employee benefits
(a) pension obligations
The Group operates a number of defined benefit and defined contribution pension and retirement benefit schemes in the main countries in which the Group operates. These schemes are generally funded by payments from employees and by relevant group companies, taking into account of the recommendations of independent qualified actuaries where required.
A defined benefit plan is a pension plan that is not a defined contribution plan. Typically defined benefit plans define an amount of pension benefit that an employee will receive on retirement, usually dependent on one or more factors such as age, years of service and compensation.
Typically defined benefit plans define an amount of pension benefit that an employee will receive on retirement, usually dependent on one or more factors such as age, years of service and compensation.
The liability recognised in the balance sheet in respect of defined benefit pension plans is the present value of the defined benefit obligation at the end of the reporting period less the fair value of plan assets. The defined benefit obligation is calculated annually by independent actuaries using the projected expected benefit payments. The present value of the defined benefit obligation is determined by discounting the estimated future cash outflows using interest rates of corporate bonds that are denominated in the currency in which the benefits will be paid, and that have terms to maturity approximating to the terms of the related pension obligation. In countries where there is no deep market in such bonds, the market rates on government bonds are used.
Actuarial gains and losses arising from experience adjustments and changes in actuarial assumptions are charged or credited to equity in other comprehensive income in the period in which they arise.
Past-service costs are recognised immediately in income.
Contributions under the defined contribution schemes are recognised as employee benefit expense when they are due and are reduced by contributions forfeited by those employees who leave the scheme prior to vesting fully in the contributions. Prepaid contributions are recognised as an asset to the extent that a cash refund or a reduction in the future payments is available.
(b) Bonus plans
The Group recognises a liability and an expense for bonuses, based on a formula that takes into consideration the profit attributable to the Company’s shareholders after certain adjustments. The Group recognises a provision where contractually obliged or where there is a past practice that has created a constructive obligation.
Orient Overseas (International) Limited Annual Report 2013 99
Notes to the Consolidated Accounts
2. Summary of significant accounting policies (Continued)
2.16 employee benefits (Continued)
(c) employee leave entitlements
Employee entitlements to annual leave are recognised when they accrue to employees. A provision is made for the estimated liability for annual leave as a result of services rendered by employees up to the balance sheet date. Employee entitlements to sick leave and maternity leave are not recognised until the time of leave.
2.17 provisionsProvisions are recognised when the Group has a present legal or constructive obligation as a result of past events; it is probable that an outflow of resources will be required to settle the obligation; and the amount can be reliably estimated.
Where there are a number of similar obligations, the likelihood that an outflow will be required in settlement is determined by considering the class of obligations as a whole. A provision is recognised even if the likelihood of an outflow with respect to any one item included in the same class of obligations may be small.
2.18 insurance contractsThe Group regards its financial guarantees provided to its subsidiaries as insurance contracts. The Group assesses at each balance sheet date the liabilities under its insurance contracts using current estimates of future cash flows. Changes in carrying amount of these insurance liabilities are recognised in the consolidated profit and loss account.
2.19 Segment informationOperating segments are reported in a manner consistent with the internal reporting provided to the chief operating decision-maker. The chief operating decision-maker, who is responsible for allocating resources and assessing performance of the operating segments and making strategic decisions, has been identified as the Board of Directors.
2.20 foreign currency translation
(a) functional and presentation currency
Items included in the accounts of each of the Group’s entities are measured using the currency of the primary economic environment in which the entity operates (the “functional currency”). The consolidated accounts are presented in US dollar, which is the Company’s functional currency and the Group’s presentation currency.
(b) transactions and balances
Foreign currency transactions are translated into the functional currency using the exchange rates prevailing at the dates of the transactions. Foreign exchange gains and losses resulting from the settlement of such transactions and from the translation at year-end exchange rates of monetary assets and liabilities denominated in foreign currencies are recognised in the consolidated profit and loss account.
Translation differences on non-monetary items, such as equities held at fair value through profit or loss, are reported as part of the fair value gain or loss. Translation differences on non-monetary items, such as equities classified as available-for-sale financial assets, are included in the assets revaluation reserve in other comprehensive income.
Orient Overseas (International) Limited Annual Report 2013100
Notes to the Consolidated Accounts
2. Summary of significant accounting policies (Continued)
2.20 foreign currency translation (Continued)
(c) Group companies
The results and financial position of all the group entities (none of which has the currency of a hyperinflationary economy) that have a functional currency different from the presentation currency are translated into the presentation currency as follows:
(i) assets and liabilities for each balance sheet presented are translated at the closing rate at the date of that balance sheet;
(ii) income and expenses for each profit and loss account are translated at average exchange rates (unless this average is not a reasonable approximation of the cumulative effect of the rates prevailing on the transaction dates, in which case income and expenses are translated at the rates prevailing on the dates of the transactions); and
(iii) all resulting exchange differences are recognised in other comprehensive income.
On consolidation, exchange differences arising from the translation of the net investment in foreign entities, and of borrowings and other currency instruments designated as hedges of such investments, are taken to other comprehensive income. When a foreign operation is sold, such exchange differences are recognised in the consolidated profit and loss account as part of the gain or loss on sale.
Goodwill and fair value adjustments arising on the acquisition of a foreign entity are treated as assets and liabilities of the foreign entity and translated at the closing rate.
2.21 revenue recognitionRevenue comprises the fair value of the consideration received or receivable for the sale of services, net of value-added tax, rebates and discounts and after eliminating sales within the Group. The Group recognises revenue when the amount of revenue can be reliably measured, it is probable that future economic benefits will flow to the entity and when specific criteria have been met for each of the Group’s activities as described below. Revenue is recognised as follows:
(a) Freight revenues from the operation of the container transport are recognised on a percentage of completion basis, which is determined on the time proportion method of each individual vessel voyage.
(b) Revenues from logistics business are recognised when services are rendered or on an accrual basis.
(c) Revenues from the operation of container terminals and provision of other services are recognised when services are rendered or on an accrual basis.
(d) Rental income under operating leases is recognised over the periods of the respective leases on a straight-line basis.
(e) Interest income is recognised on a time-proportion basis using the effective interest method.
(f) Dividend income is recognised when the right to receive payment is established.
Orient Overseas (International) Limited Annual Report 2013 101
Notes to the Consolidated Accounts
2. Summary of significant accounting policies (Continued)
2.22 leases
(a) operating lease
Leases in which a significant portion of the risks and rewards of ownership are retained by the lessor are classified as operating leases. Payments made under operating leases, net of any incentives received from the lessor, are charged to the consolidated profit and loss account on a straight-line basis over the period of the lease.
The up-front prepayments made for the leasehold land and land use rights are expensed in the consolidated profit and loss account on a straight-line basis over the period of the lease or where there is impairment, the impairment is expensed in the consolidated profit and loss account.
(b) finance lease
Leases of assets where the Group has substantially all the risks and rewards of ownership are classified as finance leases. Finance leases are capitalised at the lease’s commencement at the lower of the fair value of the leased assets and the present value of the minimum lease payments. Each lease payment is allocated between the liability and finance charges so as to achieve a constant rate on the balance outstanding. The corresponding rental obligations, net of finance charges, are included in current and non-current borrowings. The interest element of the finance cost is recognised in the consolidated profit and loss account over the lease period so as to produce a constant periodic rate of interest on the remaining balances of the liability for each period.
2.23 Borrowing costsBorrowing costs are expensed in the consolidated profit and loss account in the period in which they are incurred, except to the extent that they are capitalised as being directly attributable to the acquisition, construction or production of a qualifying asset which necessarily takes a substantial period of time to get ready for its intended use or sale.
The capitalisation of borrowing costs as part of the cost of a qualifying asset commences when expenditure for the asset is being incurred, borrowing costs are being incurred and activities that are necessary to prepare the asset for its intended use or sale are in progress. Capitalisation of borrowing costs is suspended or ceases when substantially all the activities necessary to prepare the qualifying asset for its intended use or sale are interrupted or completed.
2.24 Derivative financial instrumentsDerivative financial instruments are initially recognised at fair value on the date a derivative contract is entered into and are subsequently remeasured at their fair value. Changes in fair value are recognised in the consolidated profit and loss account.
2.25 Dividend distributionDividend distribution to the Company’s equity holders is recognised as a liability in the Group’s and the Company’s accounts in the period in which the dividends are approved by the Company’s Directors/equity holders.
3. financial risk management
3.1 financial risk factorsThe Group’s activities expose it to a variety of financial risks: foreign exchange risk, price risk, credit risk, liquidity risk and cash flow and fair value interest-rate risk. The Group’s overall risk management policy focuses on the unpredictability of financial markets and seeks to minimise potential adverse effects on the Group’s financial performance.
Orient Overseas (International) Limited Annual Report 2013102
Notes to the Consolidated Accounts
3. financial risk management (Continued)
3.1 financial risk factors (Continued)The Group has regularly monitored current and expected liquidity requirements against the cash on hand, expected net operating cash flow, committed facilities and its compliance with loan covenants, to ensure the Group’s liquidity requirements can be met in the short and longer term.
The Group has paid ongoing attention on credit quality of counterparties, in particular major customers and financial institutions with relationship in terms of debt securities, derivatives and cash transactions. Credit qualities of respective counterparties are disclosed in respective notes to the consolidated accounts.
(a) foreign exchange risk
The Group operates internationally and is exposed to foreign exchange risk arising from various currency exposures, primarily with respect to fluctuation in the exchange rates of foreign currencies to the US dollar. Foreign currency exposures are covered by forward contracts and options whenever appropriate.
Income and expenses from container transport and logistics activities are mainly denominated in US dollar and in various currencies, mainly including Euro, Canadian dollar, Japanese yen and Renminbi.
To limit currency exposure, the US dollar based activities are financed primarily by loans in US dollar. With all other variables held constant, an average change in the US dollar exchange rate of 1%, compared with all other non-US dollar related currencies, has a positive/negative effect on the results for 2013 of approximately US$10.4 million (2012: US$13.1 million).
(b) price risk
The container transport and logistics activities are sensitive to economic fluctuations. The Group is exposed to freight rate risk. The Group’s revenue will increase/decrease by US$54.3 million (2012: US$56.3 million) for 1% increase/reduction of the average container freight rates with all other variables held constant.
The Group is exposed to bunker price risk for its container transport and logistics activities. Bunker cost is one of the major cost components of container transport and logistics activities. An increase in bunker price can only be partially compensated through freight surcharge bunker price adjustment. With all other variables held constant, the operating cost will be increased by approximately US$1.8 million (2012: US$1.8 million) for one US dollar increase in bunker price per ton.
The Group is also exposed to equity/debt securities price risk because of investments held by the Group include available-for-sale financial assets or portfolio investments which are accounted at fair value through profit or loss. To manage its price risk arising from investments in equity/debt securities, the Group diversifies its portfolio. If the prices of the respective quoted equity/debt securities of the Group had been increased/decreased by 1% and all other variables held constant, the profit after taxation and the other comprehensive income of the Group for the year ended 31st December 2013 would increase/decrease by US$2.1 million (2012: US$2.0 million) and US$0.4 million (2012: US$0.4 million) respectively as a result of the changes in fair value of equity/debt securities under portfolio investments and equity securities classified as available-for-sale.
(c) Credit risk
The Group has no significant concentration of credit risk. It has policies in place to ensure that services are provided to customers with an appropriate credit history.
The extent of the Group’s credit exposure is represented by the aggregate balance of cash and bank balances, portfolio investments, held-to-maturity investments, derivative financial instruments, restricted bank balances, other deposits and debtors and prepayments. The credit quality of these exposures is disclosed in relevant notes to the consolidated accounts.
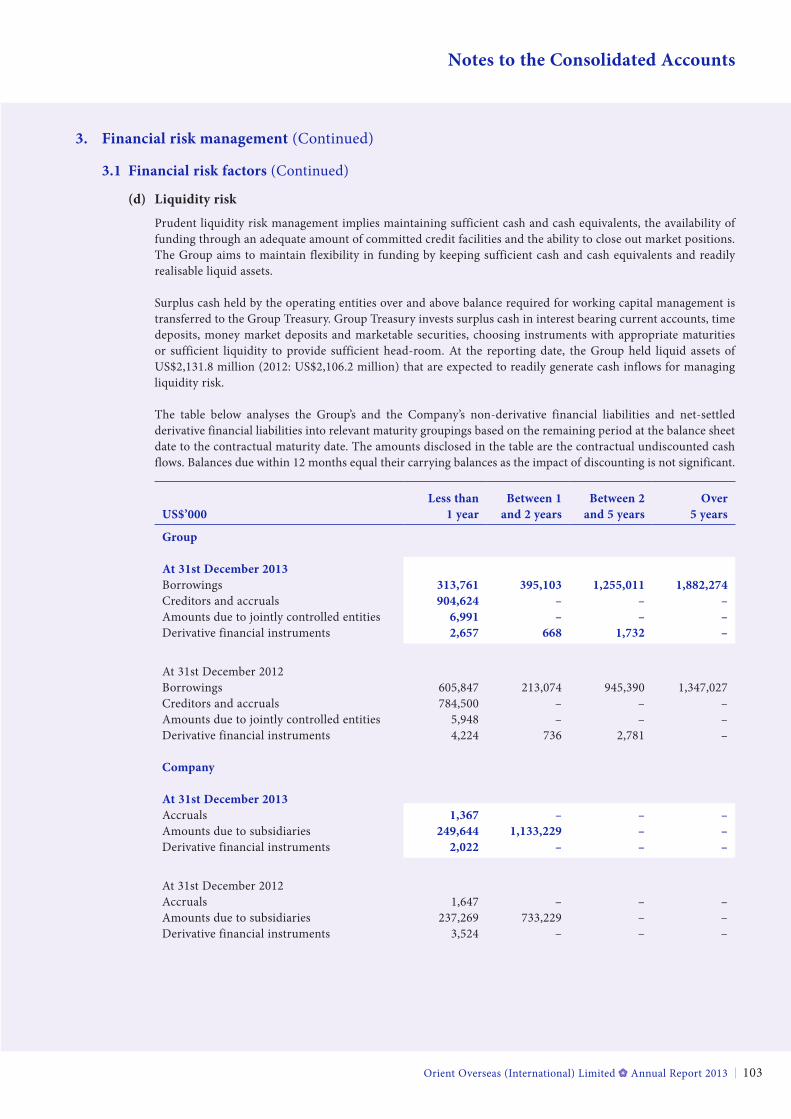
Orient Overseas (International) Limited Annual Report 2013 103
Notes to the Consolidated Accounts
3. financial risk management (Continued)
3.1 financial risk factors (Continued)
(d) liquidity risk
Prudent liquidity risk management implies maintaining sufficient cash and cash equivalents, the availability of funding through an adequate amount of committed credit facilities and the ability to close out market positions. The Group aims to maintain flexibility in funding by keeping sufficient cash and cash equivalents and readily realisable liquid assets.
Surplus cash held by the operating entities over and above balance required for working capital management is transferred to the Group Treasury. Group Treasury invests surplus cash in interest bearing current accounts, time deposits, money market deposits and marketable securities, choosing instruments with appropriate maturities or sufficient liquidity to provide sufficient head-room. At the reporting date, the Group held liquid assets of US$2,131.8 million (2012: US$2,106.2 million) that are expected to readily generate cash inflows for managing liquidity risk.
The table below analyses the Group’s and the Company’s non-derivative financial liabilities and net-settled derivative financial liabilities into relevant maturity groupings based on the remaining period at the balance sheet date to the contractual maturity date. The amounts disclosed in the table are the contractual undiscounted cash flows. Balances due within 12 months equal their carrying balances as the impact of discounting is not significant.
less than Between 1 Between 2 overUS$’000 1 year and 2 years and 5 years 5 years
Group
at 31st December 2013Borrowings 313,761 395,103 1,255,011 1,882,274Creditors and accruals 904,624 – – –Amounts due to jointly controlled entities 6,991 – – –Derivative financial instruments 2,657 668 1,732 –
At 31st December 2012Borrowings 605,847 213,074 945,390 1,347,027Creditors and accruals 784,500 – – –Amounts due to jointly controlled entities 5,948 – – –Derivative financial instruments 4,224 736 2,781 –
Company
at 31st December 2013Accruals 1,367 – – –Amounts due to subsidiaries 249,644 1,133,229 – –Derivative financial instruments 2,022 – – –
At 31st December 2012Accruals 1,647 – – –Amounts due to subsidiaries 237,269 733,229 – –Derivative financial instruments 3,524 – – –
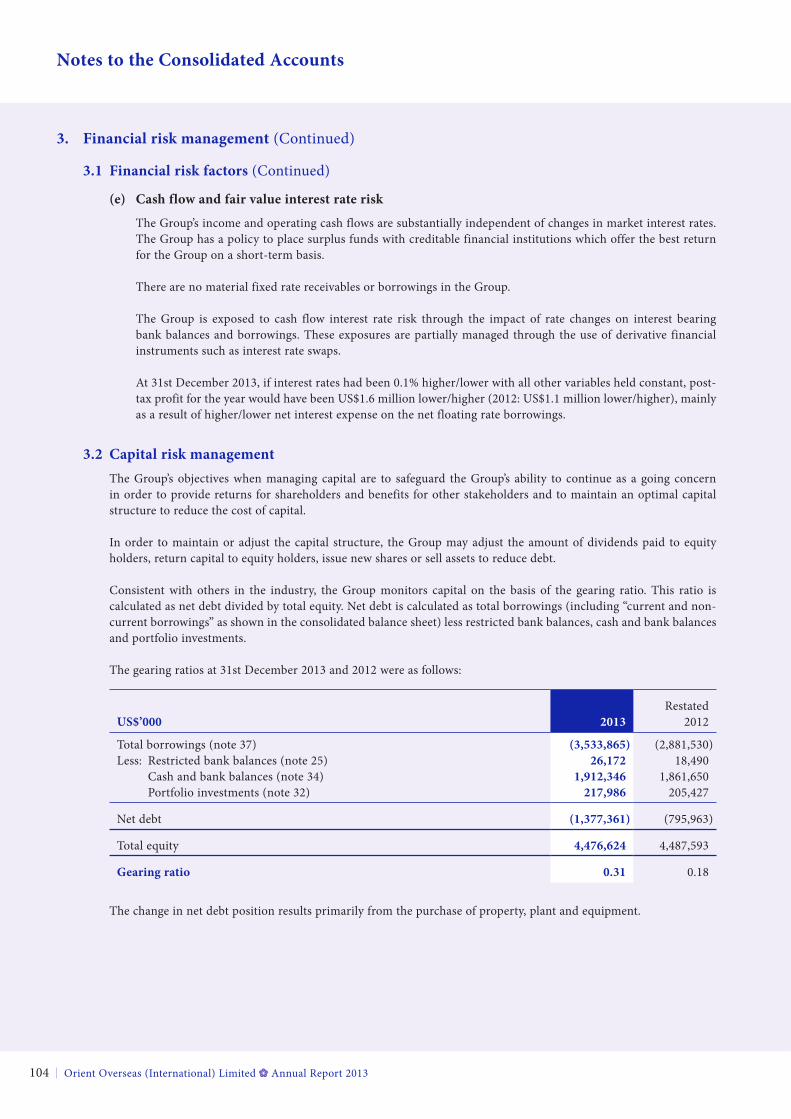
Orient Overseas (International) Limited Annual Report 2013104
Notes to the Consolidated Accounts
3. financial risk management (Continued)
3.1 financial risk factors (Continued)
(e) Cash flow and fair value interest rate risk
The Group’s income and operating cash flows are substantially independent of changes in market interest rates. The Group has a policy to place surplus funds with creditable financial institutions which offer the best return for the Group on a short-term basis.
There are no material fixed rate receivables or borrowings in the Group.
The Group is exposed to cash flow interest rate risk through the impact of rate changes on interest bearing bank balances and borrowings. These exposures are partially managed through the use of derivative financial instruments such as interest rate swaps.
At 31st December 2013, if interest rates had been 0.1% higher/lower with all other variables held constant, post-tax profit for the year would have been US$1.6 million lower/higher (2012: US$1.1 million lower/higher), mainly as a result of higher/lower net interest expense on the net floating rate borrowings.
3.2 Capital risk managementThe Group’s objectives when managing capital are to safeguard the Group’s ability to continue as a going concern in order to provide returns for shareholders and benefits for other stakeholders and to maintain an optimal capital structure to reduce the cost of capital.
In order to maintain or adjust the capital structure, the Group may adjust the amount of dividends paid to equity holders, return capital to equity holders, issue new shares or sell assets to reduce debt.
Consistent with others in the industry, the Group monitors capital on the basis of the gearing ratio. This ratio is calculated as net debt divided by total equity. Net debt is calculated as total borrowings (including “current and non-current borrowings” as shown in the consolidated balance sheet) less restricted bank balances, cash and bank balances and portfolio investments.
The gearing ratios at 31st December 2013 and 2012 were as follows:
RestatedUS$’000 2013 2012
Total borrowings (note 37) (3,533,865) (2,881,530)Less: Restricted bank balances (note 25) 26,172 18,490 Cash and bank balances (note 34) 1,912,346 1,861,650 Portfolio investments (note 32) 217,986 205,427
Net debt (1,377,361) (795,963)
Total equity 4,476,624 4,487,593
Gearing ratio 0.31 0.18
The change in net debt position results primarily from the purchase of property, plant and equipment.
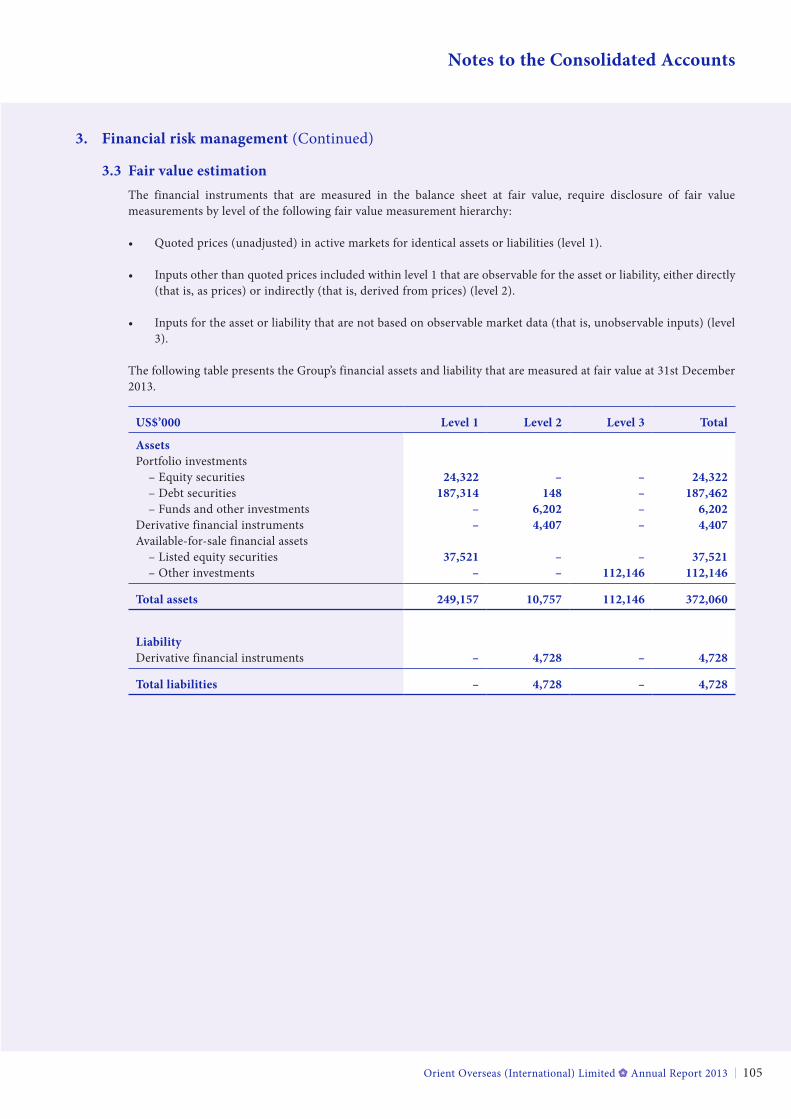
Orient Overseas (International) Limited Annual Report 2013 105
Notes to the Consolidated Accounts
3. financial risk management (Continued)
3.3 fair value estimation The financial instruments that are measured in the balance sheet at fair value, require disclosure of fair value measurements by level of the following fair value measurement hierarchy:
• Quoted prices (unadjusted) in active markets for identical assets or liabilities (level 1).
• Inputs other than quoted prices included within level 1 that are observable for the asset or liability, either directly (that is, as prices) or indirectly (that is, derived from prices) (level 2).
• Inputs for the asset or liability that are not based on observable market data (that is, unobservable inputs) (level 3).
The following table presents the Group’s financial assets and liability that are measured at fair value at 31st December 2013.
US$’000 level 1 level 2 level 3 total
assetsPortfolio investments – Equity securities 24,322 – – 24,322 – Debt securities 187,314 148 – 187,462 – Funds and other investments – 6,202 – 6,202Derivative financial instruments – 4,407 – 4,407Available-for-sale financial assets – Listed equity securities 37,521 – – 37,521 – Other investments – – 112,146 112,146
total assets 249,157 10,757 112,146 372,060
liabilityDerivative financial instruments – 4,728 – 4,728
total liabilities – 4,728 – 4,728
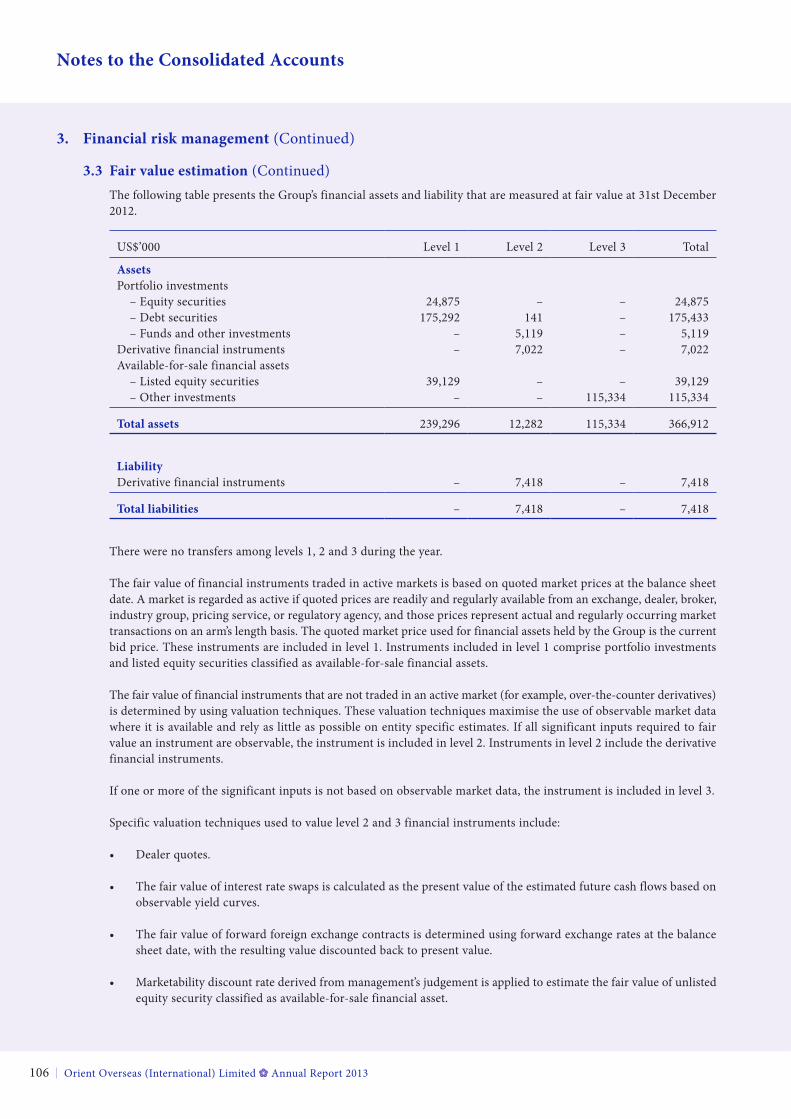
Orient Overseas (International) Limited Annual Report 2013106
Notes to the Consolidated Accounts
3. financial risk management (Continued)
3.3 fair value estimation (Continued)The following table presents the Group’s financial assets and liability that are measured at fair value at 31st December 2012.
US$’000 Level 1 Level 2 Level 3 Total
assetsPortfolio investments – Equity securities 24,875 – – 24,875 – Debt securities 175,292 141 – 175,433 – Funds and other investments – 5,119 – 5,119Derivative financial instruments – 7,022 – 7,022Available-for-sale financial assets – Listed equity securities 39,129 – – 39,129 – Other investments – – 115,334 115,334
total assets 239,296 12,282 115,334 366,912
liabilityDerivative financial instruments – 7,418 – 7,418
total liabilities – 7,418 – 7,418
There were no transfers among levels 1, 2 and 3 during the year.
The fair value of financial instruments traded in active markets is based on quoted market prices at the balance sheet date. A market is regarded as active if quoted prices are readily and regularly available from an exchange, dealer, broker, industry group, pricing service, or regulatory agency, and those prices represent actual and regularly occurring market transactions on an arm’s length basis. The quoted market price used for financial assets held by the Group is the current bid price. These instruments are included in level 1. Instruments included in level 1 comprise portfolio investments and listed equity securities classified as available-for-sale financial assets.
The fair value of financial instruments that are not traded in an active market (for example, over-the-counter derivatives) is determined by using valuation techniques. These valuation techniques maximise the use of observable market data where it is available and rely as little as possible on entity specific estimates. If all significant inputs required to fair value an instrument are observable, the instrument is included in level 2. Instruments in level 2 include the derivative financial instruments.
If one or more of the significant inputs is not based on observable market data, the instrument is included in level 3.
Specific valuation techniques used to value level 2 and 3 financial instruments include:
• Dealer quotes.
• The fair value of interest rate swaps is calculated as the present value of the estimated future cash flows based on observable yield curves.
• The fair value of forward foreign exchange contracts is determined using forward exchange rates at the balance sheet date, with the resulting value discounted back to present value.
• Marketability discount rate derived from management’s judgement is applied to estimate the fair value of unlisted equity security classified as available-for-sale financial asset.
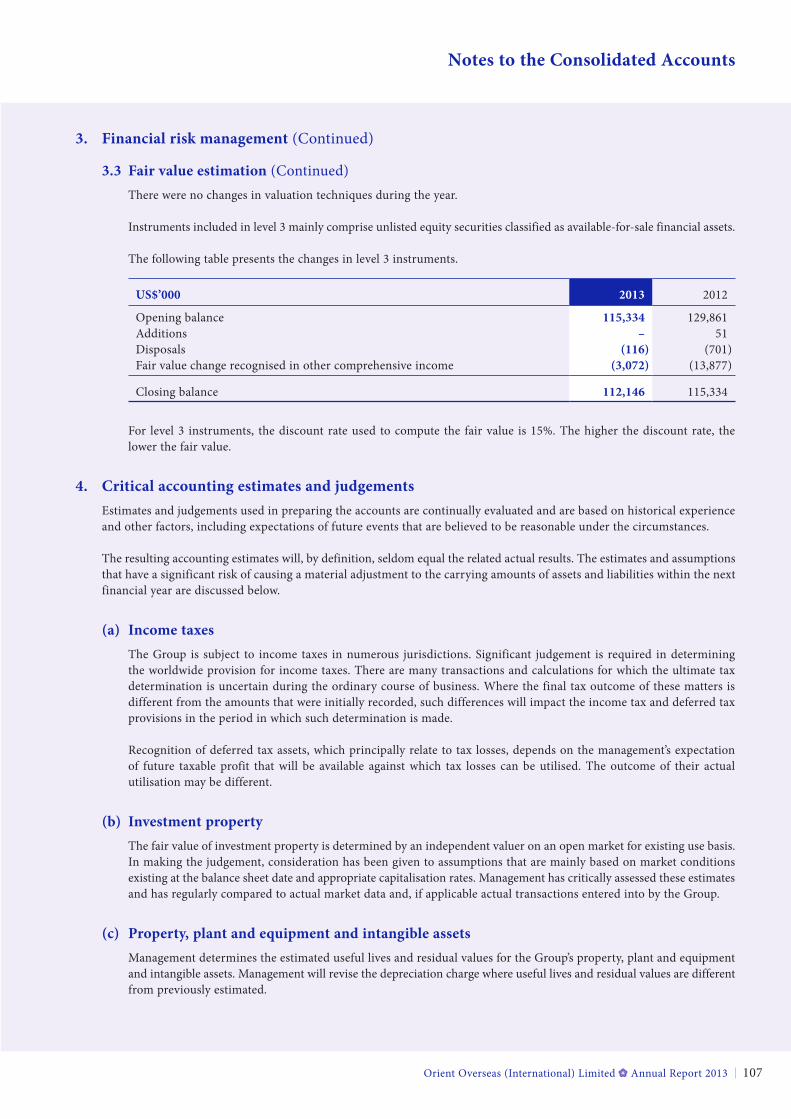
Orient Overseas (International) Limited Annual Report 2013 107
Notes to the Consolidated Accounts
3. financial risk management (Continued)
3.3 fair value estimation (Continued)There were no changes in valuation techniques during the year.
Instruments included in level 3 mainly comprise unlisted equity securities classified as available-for-sale financial assets.
The following table presents the changes in level 3 instruments.
US$’000 2013 2012
Opening balance 115,334 129,861Additions – 51Disposals (116) (701)Fair value change recognised in other comprehensive income (3,072) (13,877)
Closing balance 112,146 115,334
For level 3 instruments, the discount rate used to compute the fair value is 15%. The higher the discount rate, the lower the fair value.
4. Critical accounting estimates and judgementsEstimates and judgements used in preparing the accounts are continually evaluated and are based on historical experience and other factors, including expectations of future events that are believed to be reasonable under the circumstances.
The resulting accounting estimates will, by definition, seldom equal the related actual results. The estimates and assumptions that have a significant risk of causing a material adjustment to the carrying amounts of assets and liabilities within the next financial year are discussed below.
(a) income taxesThe Group is subject to income taxes in numerous jurisdictions. Significant judgement is required in determining the worldwide provision for income taxes. There are many transactions and calculations for which the ultimate tax determination is uncertain during the ordinary course of business. Where the final tax outcome of these matters is different from the amounts that were initially recorded, such differences will impact the income tax and deferred tax provisions in the period in which such determination is made.
Recognition of deferred tax assets, which principally relate to tax losses, depends on the management’s expectation of future taxable profit that will be available against which tax losses can be utilised. The outcome of their actual utilisation may be different.
(b) investment propertyThe fair value of investment property is determined by an independent valuer on an open market for existing use basis. In making the judgement, consideration has been given to assumptions that are mainly based on market conditions existing at the balance sheet date and appropriate capitalisation rates. Management has critically assessed these estimates and has regularly compared to actual market data and, if applicable actual transactions entered into by the Group.
(c) property, plant and equipment and intangible assetsManagement determines the estimated useful lives and residual values for the Group’s property, plant and equipment and intangible assets. Management will revise the depreciation charge where useful lives and residual values are different from previously estimated.
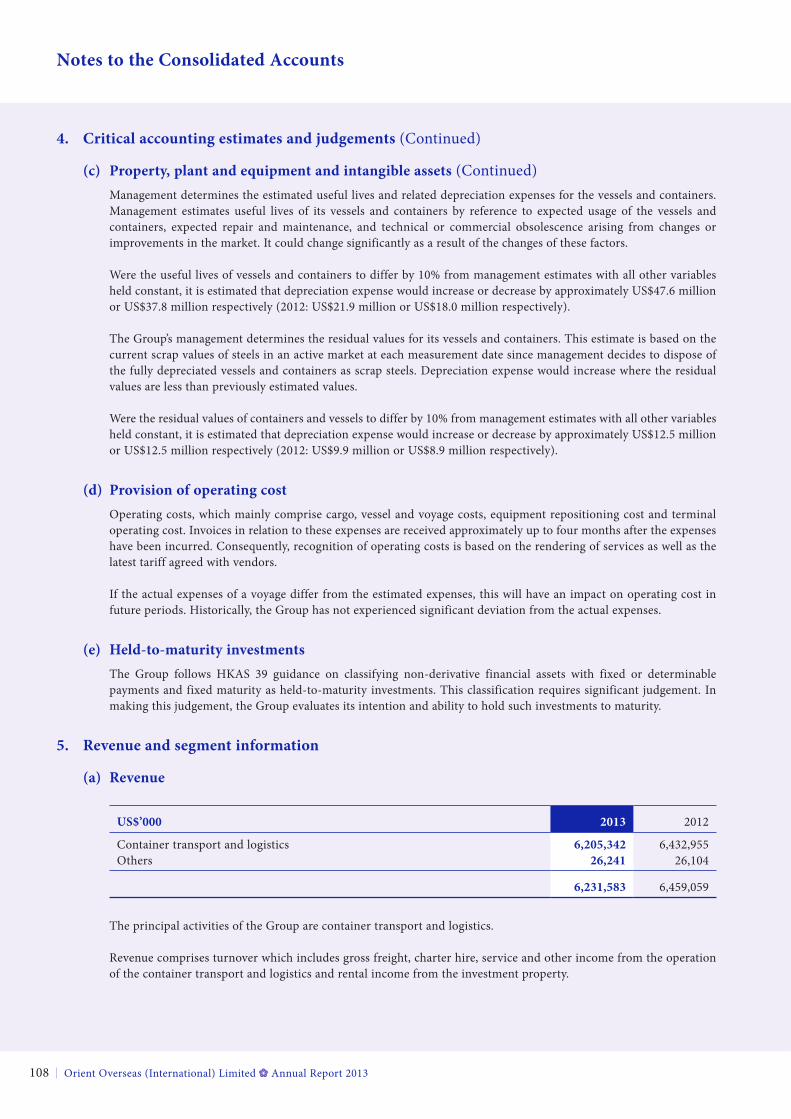
Orient Overseas (International) Limited Annual Report 2013108
Notes to the Consolidated Accounts
4. Critical accounting estimates and judgements (Continued)
(c) property, plant and equipment and intangible assets (Continued)Management determines the estimated useful lives and related depreciation expenses for the vessels and containers. Management estimates useful lives of its vessels and containers by reference to expected usage of the vessels and containers, expected repair and maintenance, and technical or commercial obsolescence arising from changes or improvements in the market. It could change significantly as a result of the changes of these factors.
Were the useful lives of vessels and containers to differ by 10% from management estimates with all other variables held constant, it is estimated that depreciation expense would increase or decrease by approximately US$47.6 million or US$37.8 million respectively (2012: US$21.9 million or US$18.0 million respectively).
The Group’s management determines the residual values for its vessels and containers. This estimate is based on the current scrap values of steels in an active market at each measurement date since management decides to dispose of the fully depreciated vessels and containers as scrap steels. Depreciation expense would increase where the residual values are less than previously estimated values.
Were the residual values of containers and vessels to differ by 10% from management estimates with all other variables held constant, it is estimated that depreciation expense would increase or decrease by approximately US$12.5 million or US$12.5 million respectively (2012: US$9.9 million or US$8.9 million respectively).
(d) provision of operating costOperating costs, which mainly comprise cargo, vessel and voyage costs, equipment repositioning cost and terminal operating cost. Invoices in relation to these expenses are received approximately up to four months after the expenses have been incurred. Consequently, recognition of operating costs is based on the rendering of services as well as the latest tariff agreed with vendors.
If the actual expenses of a voyage differ from the estimated expenses, this will have an impact on operating cost in future periods. Historically, the Group has not experienced significant deviation from the actual expenses.
(e) Held-to-maturity investmentsThe Group follows HKAS 39 guidance on classifying non-derivative financial assets with fixed or determinable payments and fixed maturity as held-to-maturity investments. This classification requires significant judgement. In making this judgement, the Group evaluates its intention and ability to hold such investments to maturity.
5. revenue and segment information
(a) revenue
US$’000 2013 2012
Container transport and logistics 6,205,342 6,432,955Others 26,241 26,104
6,231,583 6,459,059
The principal activities of the Group are container transport and logistics.
Revenue comprises turnover which includes gross freight, charter hire, service and other income from the operation of the container transport and logistics and rental income from the investment property.
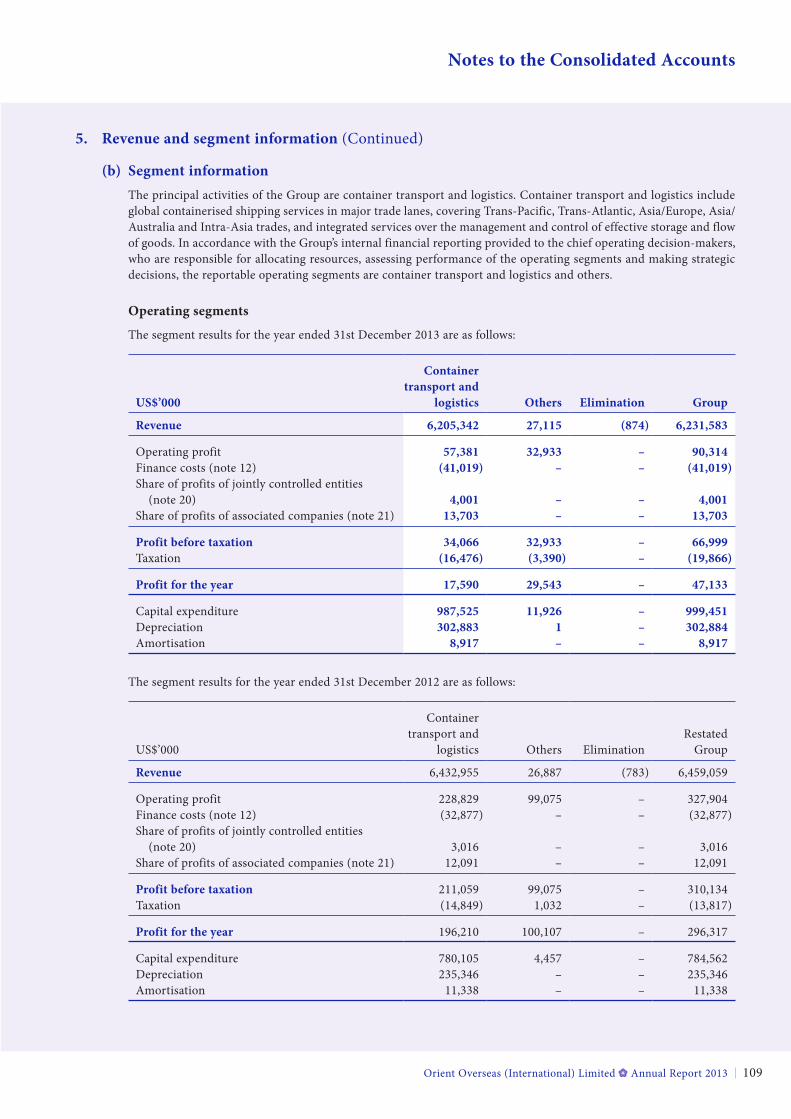
Orient Overseas (International) Limited Annual Report 2013 109
Notes to the Consolidated Accounts
5. revenue and segment information (Continued)
(b) Segment informationThe principal activities of the Group are container transport and logistics. Container transport and logistics include global containerised shipping services in major trade lanes, covering Trans-Pacific, Trans-Atlantic, Asia/Europe, Asia/Australia and Intra-Asia trades, and integrated services over the management and control of effective storage and flow of goods. In accordance with the Group’s internal financial reporting provided to the chief operating decision-makers, who are responsible for allocating resources, assessing performance of the operating segments and making strategic decisions, the reportable operating segments are container transport and logistics and others.
operating segments
The segment results for the year ended 31st December 2013 are as follows:
US$’000
Container transport and
logistics others elimination Group
revenue 6,205,342 27,115 (874) 6,231,583
Operating profit 57,381 32,933 – 90,314Finance costs (note 12) (41,019) – – (41,019)Share of profits of jointly controlled entities (note 20) 4,001 – – 4,001Share of profits of associated companies (note 21) 13,703 – – 13,703
profit before taxation 34,066 32,933 – 66,999Taxation (16,476) (3,390) – (19,866)
profit for the year 17,590 29,543 – 47,133
Capital expenditure 987,525 11,926 – 999,451Depreciation 302,883 1 – 302,884Amortisation 8,917 – – 8,917
The segment results for the year ended 31st December 2012 are as follows:
US$’000
Container transport and
logistics Others EliminationRestated
Group
revenue 6,432,955 26,887 (783) 6,459,059
Operating profit 228,829 99,075 – 327,904Finance costs (note 12) (32,877) – – (32,877)Share of profits of jointly controlled entities (note 20) 3,016 – – 3,016Share of profits of associated companies (note 21) 12,091 – – 12,091
profit before taxation 211,059 99,075 – 310,134Taxation (14,849) 1,032 – (13,817)
profit for the year 196,210 100,107 – 296,317
Capital expenditure 780,105 4,457 – 784,562Depreciation 235,346 – – 235,346Amortisation 11,338 – – 11,338
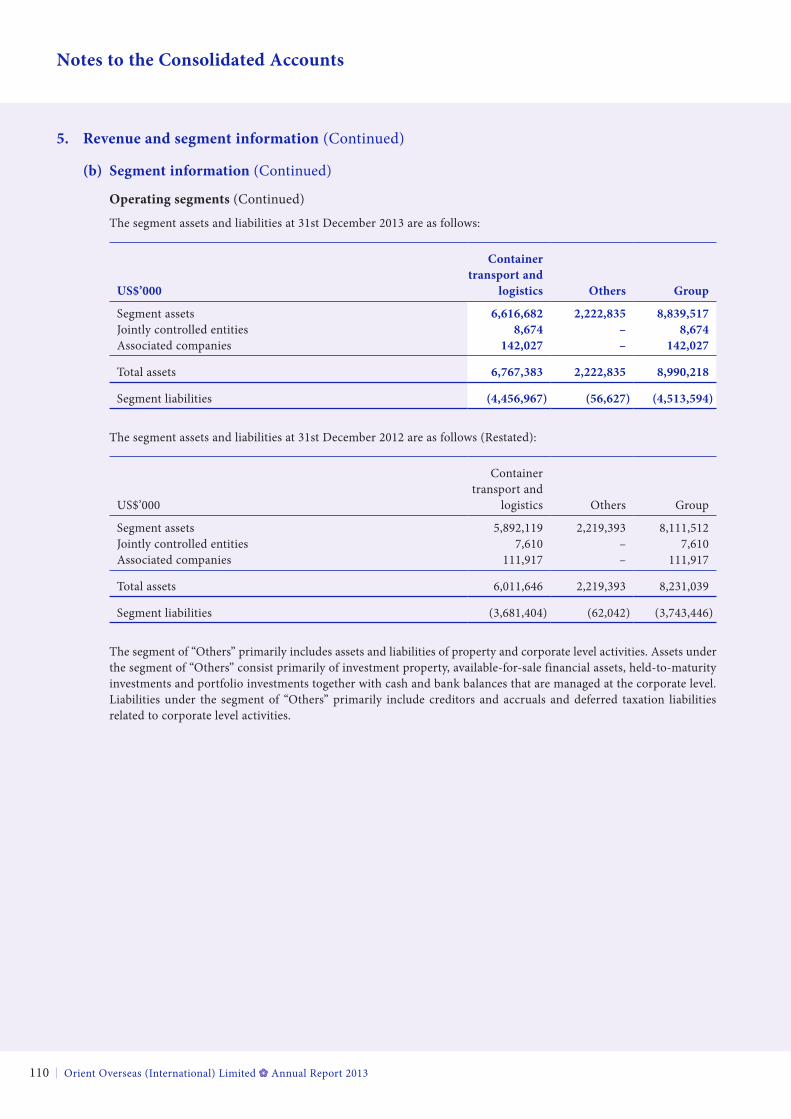
Orient Overseas (International) Limited Annual Report 2013110
Notes to the Consolidated Accounts
5. revenue and segment information (Continued)
(b) Segment information (Continued)
operating segments (Continued)
The segment assets and liabilities at 31st December 2013 are as follows:
US$’000
Container transport and
logistics others Group
Segment assets 6,616,682 2,222,835 8,839,517Jointly controlled entities 8,674 – 8,674Associated companies 142,027 – 142,027
Total assets 6,767,383 2,222,835 8,990,218
Segment liabilities (4,456,967) (56,627) (4,513,594)
The segment assets and liabilities at 31st December 2012 are as follows (Restated):
US$’000
Container transport and
logistics Others Group
Segment assets 5,892,119 2,219,393 8,111,512Jointly controlled entities 7,610 – 7,610Associated companies 111,917 – 111,917
Total assets 6,011,646 2,219,393 8,231,039
Segment liabilities (3,681,404) (62,042) (3,743,446)
The segment of “Others” primarily includes assets and liabilities of property and corporate level activities. Assets under the segment of “Others” consist primarily of investment property, available-for-sale financial assets, held-to-maturity investments and portfolio investments together with cash and bank balances that are managed at the corporate level. Liabilities under the segment of “Others” primarily include creditors and accruals and deferred taxation liabilities related to corporate level activities.
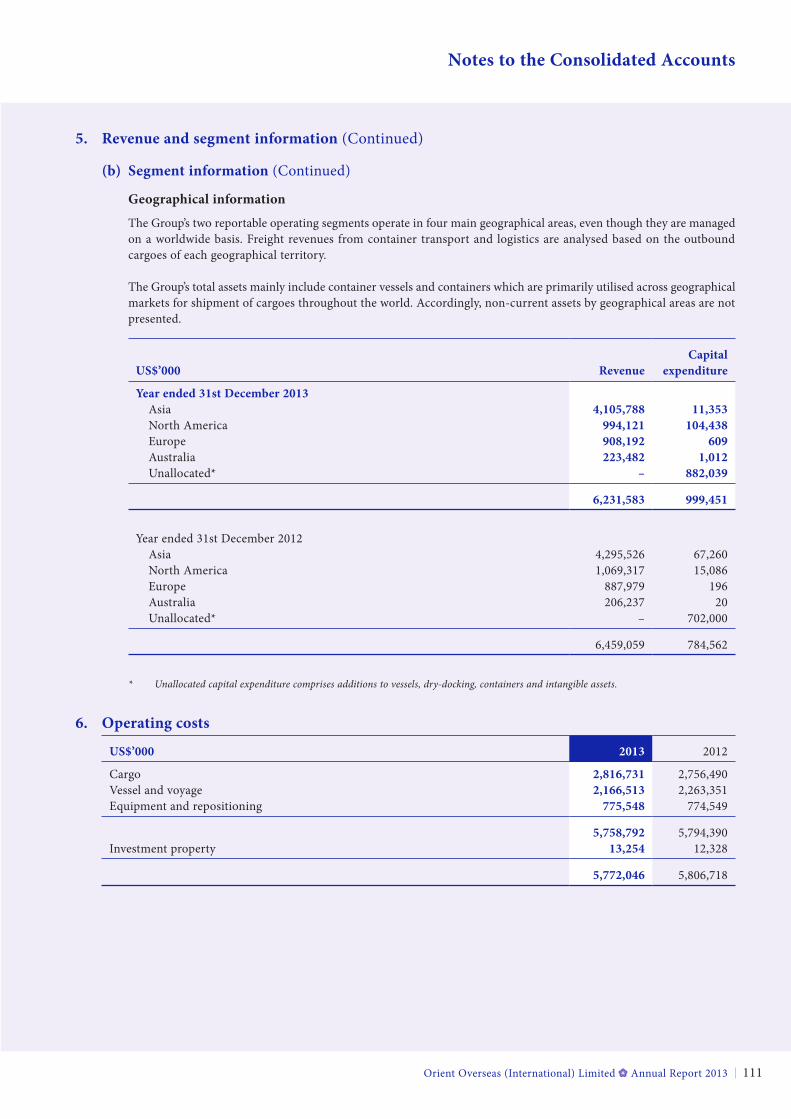
Orient Overseas (International) Limited Annual Report 2013 111
Notes to the Consolidated Accounts
5. revenue and segment information (Continued)
(b) Segment information (Continued)
Geographical information
The Group’s two reportable operating segments operate in four main geographical areas, even though they are managed on a worldwide basis. Freight revenues from container transport and logistics are analysed based on the outbound cargoes of each geographical territory.
The Group’s total assets mainly include container vessels and containers which are primarily utilised across geographical markets for shipment of cargoes throughout the world. Accordingly, non-current assets by geographical areas are not presented.
US$’000 revenueCapital
expenditure
Year ended 31st December 2013 Asia 4,105,788 11,353 North America 994,121 104,438 Europe 908,192 609 Australia 223,482 1,012 Unallocated* – 882,039
6,231,583 999,451
year ended 31st December 2012 Asia 4,295,526 67,260 North America 1,069,317 15,086 Europe 887,979 196 Australia 206,237 20 Unallocated* – 702,000
6,459,059 784,562
* Unallocated capital expenditure comprises additions to vessels, dry-docking, containers and intangible assets.
6. operating costs
US$’000 2013 2012
Cargo 2,816,731 2,756,490Vessel and voyage 2,166,513 2,263,351Equipment and repositioning 775,548 774,549
5,758,792 5,794,390Investment property 13,254 12,328
5,772,046 5,806,718
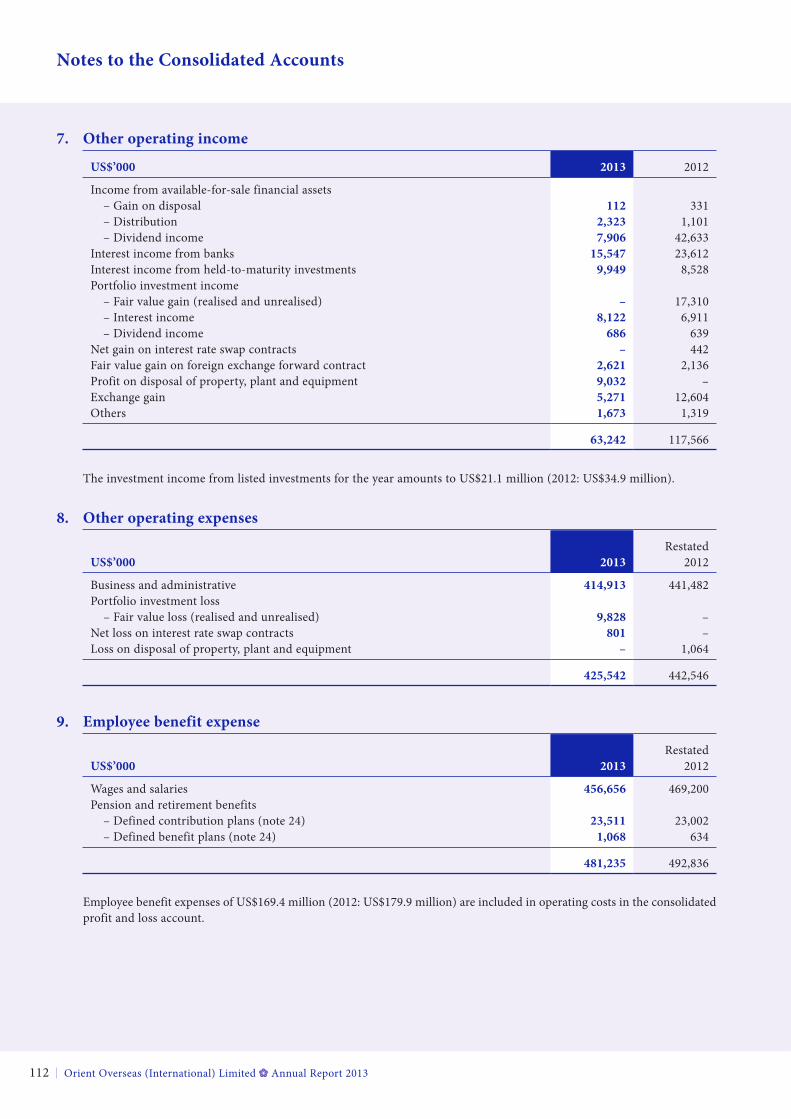
Orient Overseas (International) Limited Annual Report 2013112
Notes to the Consolidated Accounts
7. other operating income
US$’000 2013 2012
Income from available-for-sale financial assets – Gain on disposal 112 331 – Distribution 2,323 1,101 – Dividend income 7,906 42,633Interest income from banks 15,547 23,612Interest income from held-to-maturity investments 9,949 8,528Portfolio investment income – Fair value gain (realised and unrealised) – 17,310 – Interest income 8,122 6,911 – Dividend income 686 639Net gain on interest rate swap contracts – 442Fair value gain on foreign exchange forward contract 2,621 2,136Profit on disposal of property, plant and equipment 9,032 –Exchange gain 5,271 12,604Others 1,673 1,319
63,242 117,566
The investment income from listed investments for the year amounts to US$21.1 million (2012: US$34.9 million).
8. other operating expenses
RestatedUS$’000 2013 2012
Business and administrative 414,913 441,482Portfolio investment loss – Fair value loss (realised and unrealised) 9,828 –Net loss on interest rate swap contracts 801 –Loss on disposal of property, plant and equipment – 1,064
425,542 442,546
9. employee benefit expense
RestatedUS$’000 2013 2012
Wages and salaries 456,656 469,200Pension and retirement benefits – Defined contribution plans (note 24) 23,511 23,002 – Defined benefit plans (note 24) 1,068 634
481,235 492,836
Employee benefit expenses of US$169.4 million (2012: US$179.9 million) are included in operating costs in the consolidated profit and loss account.
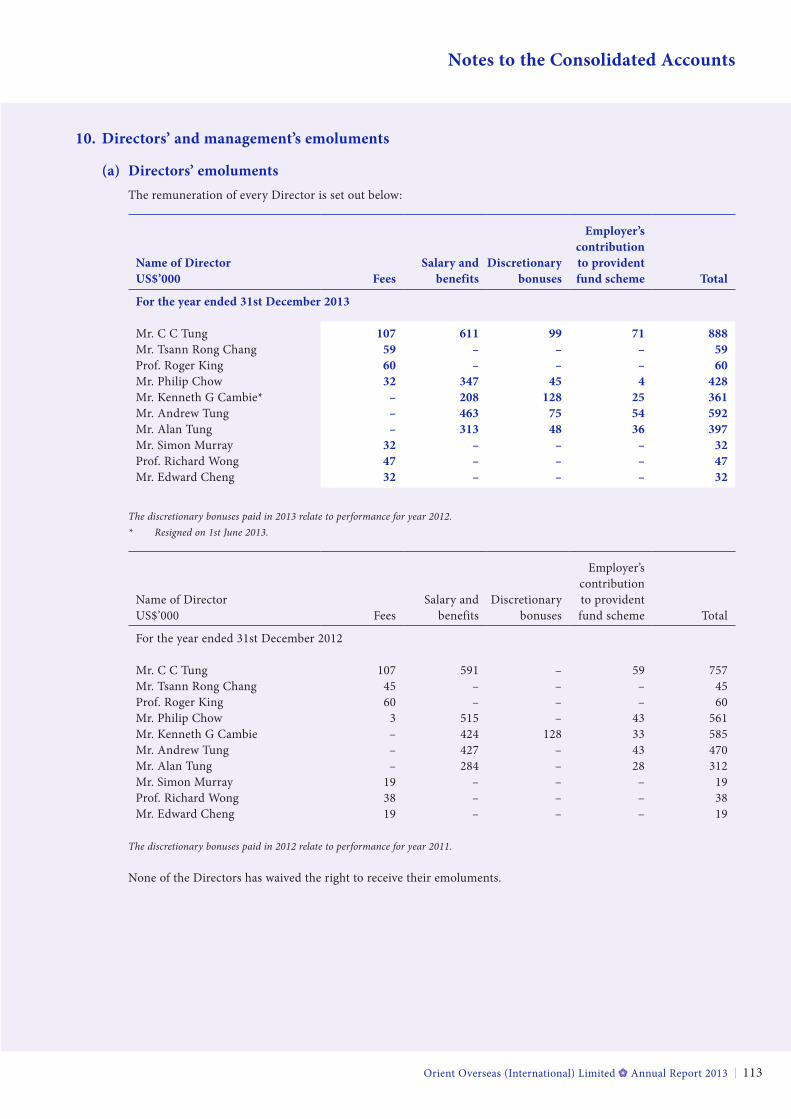
Orient Overseas (International) Limited Annual Report 2013 113
Notes to the Consolidated Accounts
10. Directors’ and management’s emoluments
(a) Directors’ emolumentsThe remuneration of every Director is set out below:
Name of DirectorUS$’000 fees
Salary and benefits
Discretionary bonuses
employer’s contribution to provident fund scheme total
for the year ended 31st December 2013
Mr. C C Tung 107 611 99 71 888Mr. Tsann Rong Chang 59 – – – 59Prof. Roger King 60 – – – 60Mr. Philip Chow 32 347 45 4 428Mr. Kenneth G Cambie* – 208 128 25 361Mr. Andrew Tung – 463 75 54 592Mr. Alan Tung – 313 48 36 397Mr. Simon Murray 32 – – – 32Prof. Richard Wong 47 – – – 47Mr. Edward Cheng 32 – – – 32
The discretionary bonuses paid in 2013 relate to performance for year 2012.* Resigned on 1st June 2013.
Name of DirectorUS$’000 Fees
Salary and benefits
Discretionary bonuses
Employer’s contribution to provident fund scheme Total
For the year ended 31st December 2012
Mr. C C Tung 107 591 – 59 757Mr. Tsann Rong Chang 45 – – – 45Prof. Roger King 60 – – – 60Mr. Philip Chow 3 515 – 43 561Mr. Kenneth G Cambie – 424 128 33 585Mr. Andrew Tung – 427 – 43 470Mr. Alan Tung – 284 – 28 312Mr. Simon Murray 19 – – – 19Prof. Richard Wong 38 – – – 38Mr. Edward Cheng 19 – – – 19
The discretionary bonuses paid in 2012 relate to performance for year 2011.
None of the Directors has waived the right to receive their emoluments.
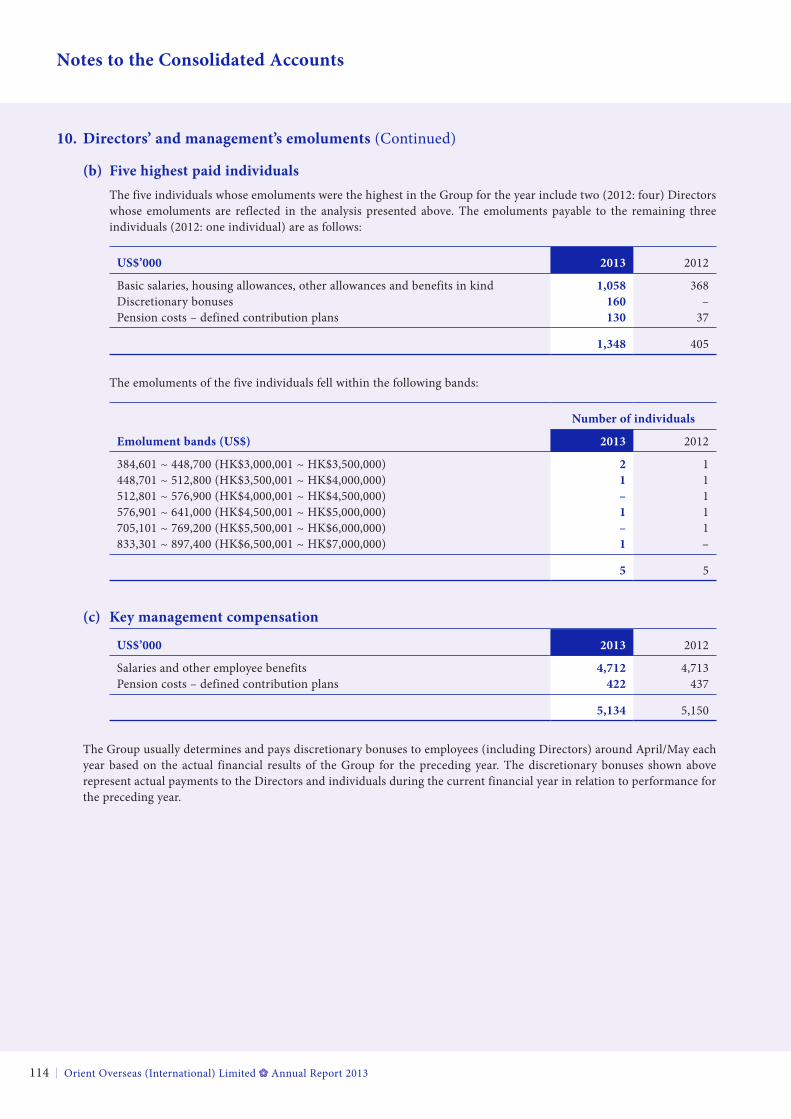
Orient Overseas (International) Limited Annual Report 2013114
Notes to the Consolidated Accounts
10. Directors’ and management’s emoluments (Continued)
(b) five highest paid individualsThe five individuals whose emoluments were the highest in the Group for the year include two (2012: four) Directors whose emoluments are reflected in the analysis presented above. The emoluments payable to the remaining three individuals (2012: one individual) are as follows:
US$’000 2013 2012
Basic salaries, housing allowances, other allowances and benefits in kind 1,058 368Discretionary bonuses 160 –Pension costs – defined contribution plans 130 37
1,348 405
The emoluments of the five individuals fell within the following bands:
Number of individuals
emolument bands (US$) 2013 2012
384,601 ~ 448,700 (HK$3,000,001 ~ HK$3,500,000) 2 1448,701 ~ 512,800 (HK$3,500,001 ~ HK$4,000,000) 1 1512,801 ~ 576,900 (HK$4,000,001 ~ HK$4,500,000) – 1576,901 ~ 641,000 (HK$4,500,001 ~ HK$5,000,000) 1 1705,101 ~ 769,200 (HK$5,500,001 ~ HK$6,000,000) – 1833,301 ~ 897,400 (HK$6,500,001 ~ HK$7,000,000) 1 –
5 5
(c) Key management compensation
US$’000 2013 2012
Salaries and other employee benefits 4,712 4,713Pension costs – defined contribution plans 422 437
5,134 5,150
The Group usually determines and pays discretionary bonuses to employees (including Directors) around April/May each year based on the actual financial results of the Group for the preceding year. The discretionary bonuses shown above represent actual payments to the Directors and individuals during the current financial year in relation to performance for the preceding year.
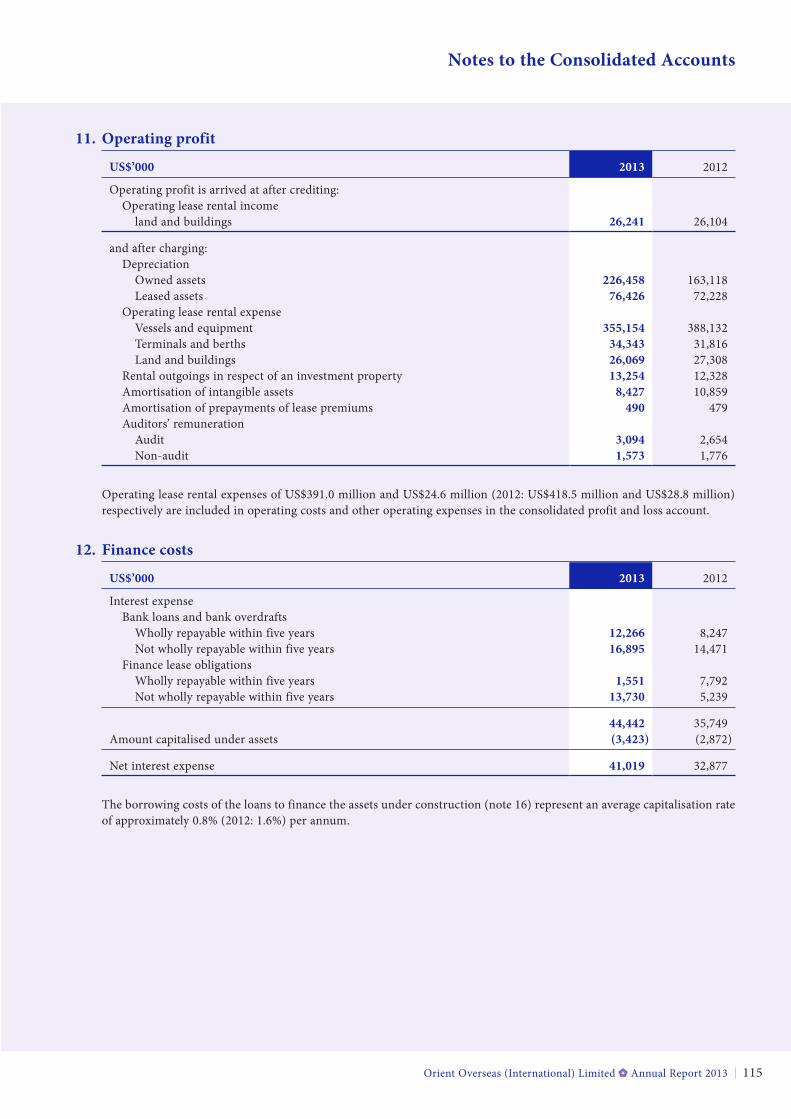
Orient Overseas (International) Limited Annual Report 2013 115
Notes to the Consolidated Accounts
11. operating profit
US$’000 2013 2012
Operating profit is arrived at after crediting: Operating lease rental income land and buildings 26,241 26,104
and after charging: Depreciation Owned assets 226,458 163,118 Leased assets 76,426 72,228 Operating lease rental expense Vessels and equipment 355,154 388,132 Terminals and berths 34,343 31,816 Land and buildings 26,069 27,308 Rental outgoings in respect of an investment property 13,254 12,328 Amortisation of intangible assets 8,427 10,859 Amortisation of prepayments of lease premiums 490 479 Auditors’ remuneration Audit 3,094 2,654 Non-audit 1,573 1,776
Operating lease rental expenses of US$391.0 million and US$24.6 million (2012: US$418.5 million and US$28.8 million) respectively are included in operating costs and other operating expenses in the consolidated profit and loss account.
12. finance costs
US$’000 2013 2012
Interest expense Bank loans and bank overdrafts Wholly repayable within five years 12,266 8,247 Not wholly repayable within five years 16,895 14,471 Finance lease obligations Wholly repayable within five years 1,551 7,792 Not wholly repayable within five years 13,730 5,239
44,442 35,749Amount capitalised under assets (3,423) (2,872)
Net interest expense 41,019 32,877
The borrowing costs of the loans to finance the assets under construction (note 16) represent an average capitalisation rate of approximately 0.8% (2012: 1.6%) per annum.
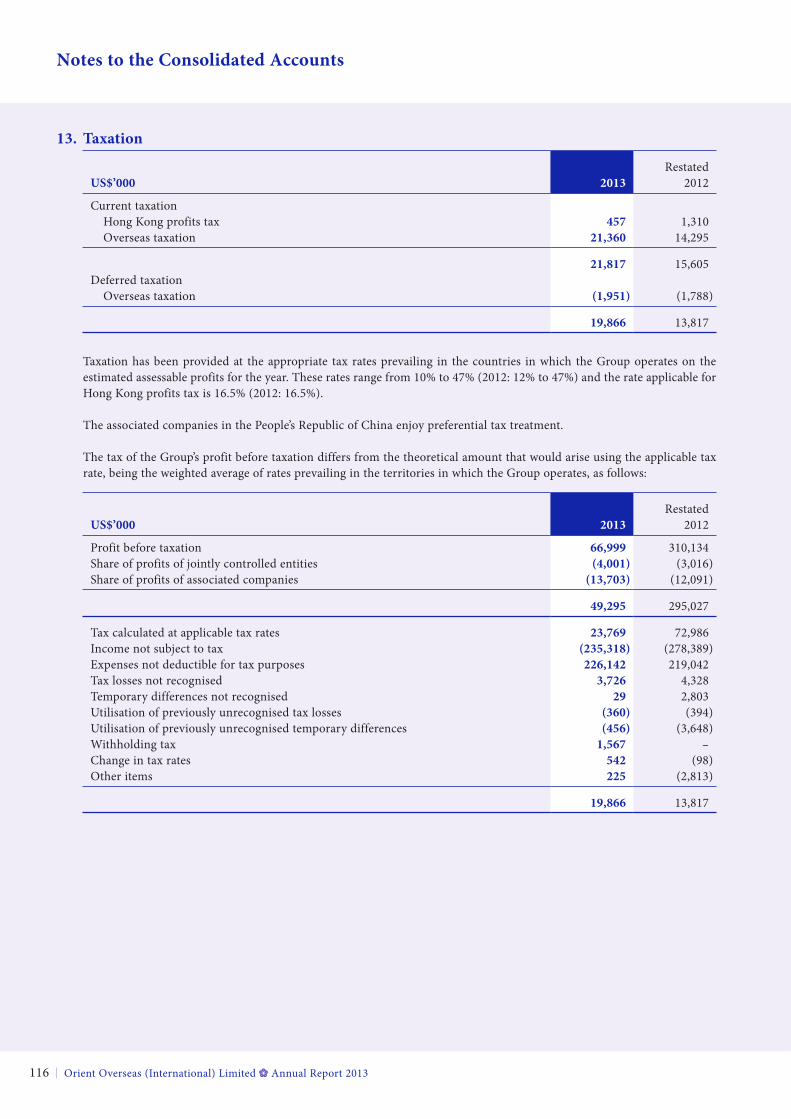
Orient Overseas (International) Limited Annual Report 2013116
Notes to the Consolidated Accounts
13. taxation
RestatedUS$’000 2013 2012
Current taxation Hong Kong profits tax 457 1,310 Overseas taxation 21,360 14,295
21,817 15,605Deferred taxation Overseas taxation (1,951) (1,788)
19,866 13,817
Taxation has been provided at the appropriate tax rates prevailing in the countries in which the Group operates on the estimated assessable profits for the year. These rates range from 10% to 47% (2012: 12% to 47%) and the rate applicable for Hong Kong profits tax is 16.5% (2012: 16.5%).
The associated companies in the People’s Republic of China enjoy preferential tax treatment.
The tax of the Group’s profit before taxation differs from the theoretical amount that would arise using the applicable tax rate, being the weighted average of rates prevailing in the territories in which the Group operates, as follows:
RestatedUS$’000 2013 2012
Profit before taxation 66,999 310,134Share of profits of jointly controlled entities (4,001) (3,016)Share of profits of associated companies (13,703) (12,091)
49,295 295,027
Tax calculated at applicable tax rates 23,769 72,986Income not subject to tax (235,318) (278,389)Expenses not deductible for tax purposes 226,142 219,042Tax losses not recognised 3,726 4,328Temporary differences not recognised 29 2,803Utilisation of previously unrecognised tax losses (360) (394)Utilisation of previously unrecognised temporary differences (456) (3,648)Withholding tax 1,567 –Change in tax rates 542 (98)Other items 225 (2,813)
19,866 13,817
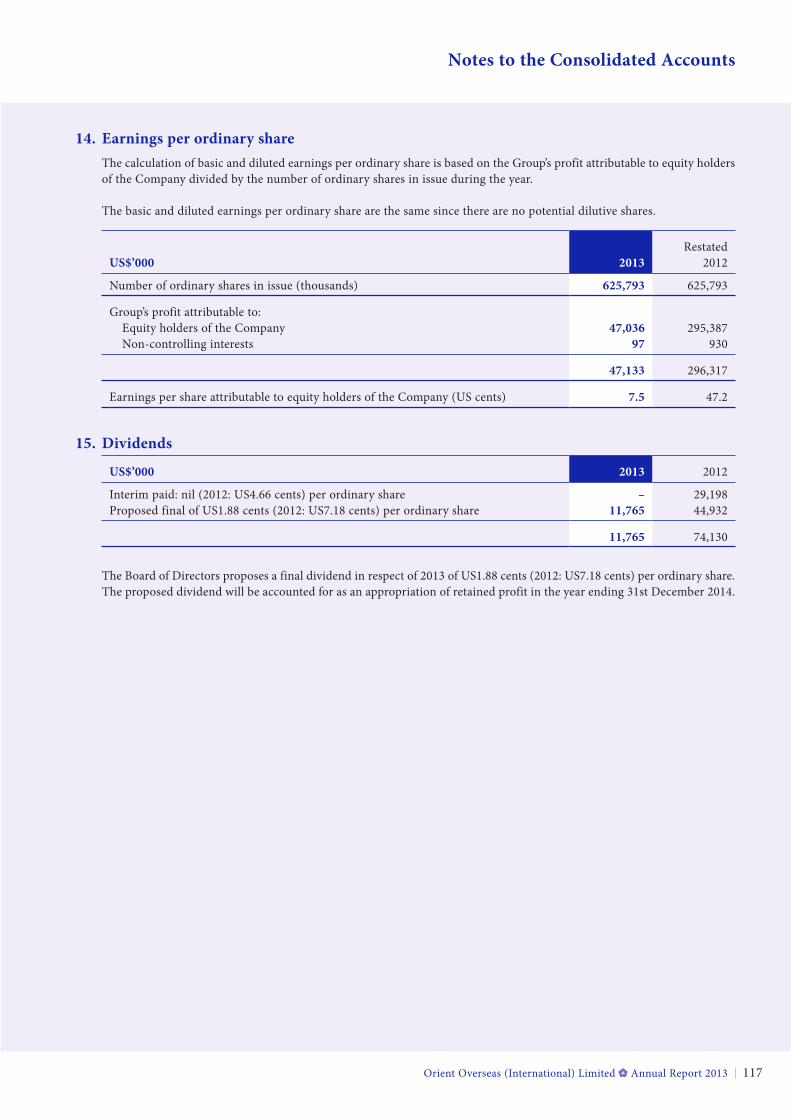
Orient Overseas (International) Limited Annual Report 2013 117
Notes to the Consolidated Accounts
14. earnings per ordinary shareThe calculation of basic and diluted earnings per ordinary share is based on the Group’s profit attributable to equity holders of the Company divided by the number of ordinary shares in issue during the year.
The basic and diluted earnings per ordinary share are the same since there are no potential dilutive shares.
RestatedUS$’000 2013 2012
Number of ordinary shares in issue (thousands) 625,793 625,793
Group’s profit attributable to: Equity holders of the Company 47,036 295,387 Non-controlling interests 97 930
47,133 296,317
Earnings per share attributable to equity holders of the Company (US cents) 7.5 47.2
15. Dividends
US$’000 2013 2012
Interim paid: nil (2012: US4.66 cents) per ordinary share – 29,198Proposed final of US1.88 cents (2012: US7.18 cents) per ordinary share 11,765 44,932
11,765 74,130
The Board of Directors proposes a final dividend in respect of 2013 of US1.88 cents (2012: US7.18 cents) per ordinary share. The proposed dividend will be accounted for as an appropriation of retained profit in the year ending 31st December 2014.
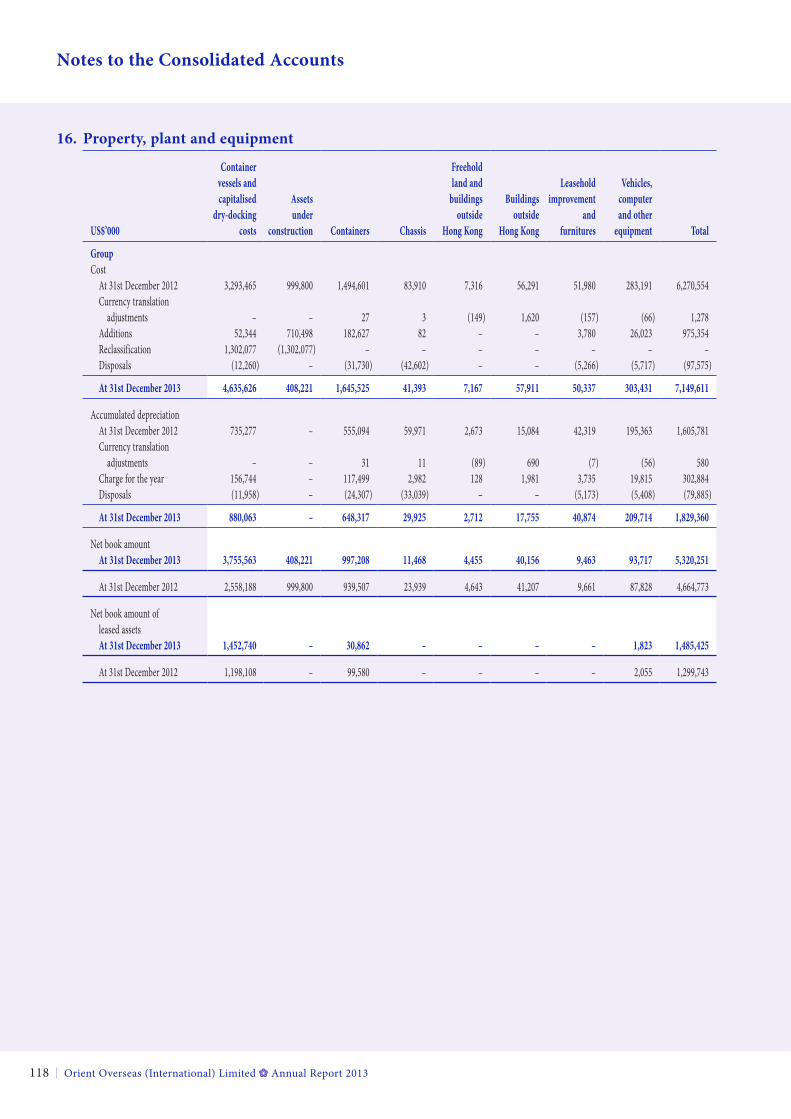
Orient Overseas (International) Limited Annual Report 2013118
Notes to the Consolidated Accounts
16. property, plant and equipment
Container freeholdvessels and land and leasehold Vehicles,capitalised assets buildings Buildings improvement computer
dry-docking under outside outside and and otherUS$’000 costs construction Containers Chassis Hong Kong Hong Kong furnitures equipment total
GroupCost At 31st December 2012 3,293,465 999,800 1,494,601 83,910 7,316 56,291 51,980 283,191 6,270,554 Currency translation adjustments – – 27 3 (149) 1,620 (157) (66) 1,278 Additions 52,344 710,498 182,627 82 – – 3,780 26,023 975,354 Reclassification 1,302,077 (1,302,077) – – – – – – – Disposals (12,260) – (31,730) (42,602) – – (5,266) (5,717) (97,575)
at 31st December 2013 4,635,626 408,221 1,645,525 41,393 7,167 57,911 50,337 303,431 7,149,611
Accumulated depreciation At 31st December 2012 735,277 – 555,094 59,971 2,673 15,084 42,319 195,363 1,605,781 Currency translation adjustments – – 31 11 (89) 690 (7) (56) 580 Charge for the year 156,744 – 117,499 2,982 128 1,981 3,735 19,815 302,884 Disposals (11,958) – (24,307) (33,039) – – (5,173) (5,408) (79,885)
at 31st December 2013 880,063 – 648,317 29,925 2,712 17,755 40,874 209,714 1,829,360
Net book amount at 31st December 2013 3,755,563 408,221 997,208 11,468 4,455 40,156 9,463 93,717 5,320,251
At 31st December 2012 2,558,188 999,800 939,507 23,939 4,643 41,207 9,661 87,828 4,664,773
Net book amount of leased assets at 31st December 2013 1,452,740 – 30,862 – – – – 1,823 1,485,425
At 31st December 2012 1,198,108 – 99,580 – – – – 2,055 1,299,743
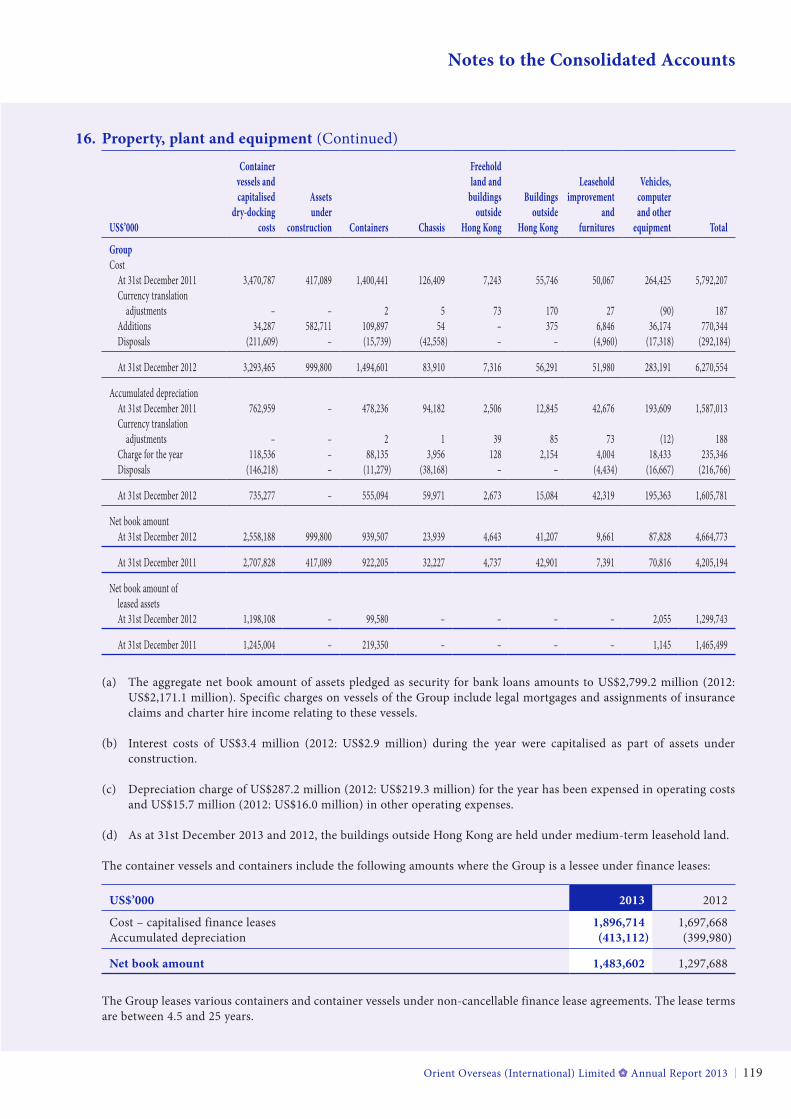
Orient Overseas (International) Limited Annual Report 2013 119
Notes to the Consolidated Accounts
16. property, plant and equipment (Continued)
Container freeholdvessels and land and leasehold Vehicles,capitalised assets buildings Buildings improvement computer
dry-docking under outside outside and and otherUS$’000 costs construction Containers Chassis Hong Kong Hong Kong furnitures equipment total
GroupCost At 31st December 2011 3,470,787 417,089 1,400,441 126,409 7,243 55,746 50,067 264,425 5,792,207 Currency translation adjustments – – 2 5 73 170 27 (90) 187 Additions 34,287 582,711 109,897 54 – 375 6,846 36,174 770,344 Disposals (211,609) – (15,739) (42,558) – – (4,960) (17,318) (292,184)
At 31st December 2012 3,293,465 999,800 1,494,601 83,910 7,316 56,291 51,980 283,191 6,270,554
Accumulated depreciation At 31st December 2011 762,959 – 478,236 94,182 2,506 12,845 42,676 193,609 1,587,013 Currency translation adjustments – – 2 1 39 85 73 (12) 188 Charge for the year 118,536 – 88,135 3,956 128 2,154 4,004 18,433 235,346 Disposals (146,218) – (11,279) (38,168) – – (4,434) (16,667) (216,766)
At 31st December 2012 735,277 – 555,094 59,971 2,673 15,084 42,319 195,363 1,605,781
Net book amount At 31st December 2012 2,558,188 999,800 939,507 23,939 4,643 41,207 9,661 87,828 4,664,773
At 31st December 2011 2,707,828 417,089 922,205 32,227 4,737 42,901 7,391 70,816 4,205,194
Net book amount of leased assets At 31st December 2012 1,198,108 – 99,580 – – – – 2,055 1,299,743
At 31st December 2011 1,245,004 – 219,350 – – – – 1,145 1,465,499
(a) The aggregate net book amount of assets pledged as security for bank loans amounts to US$2,799.2 million (2012: US$2,171.1 million). Specific charges on vessels of the Group include legal mortgages and assignments of insurance claims and charter hire income relating to these vessels.
(b) Interest costs of US$3.4 million (2012: US$2.9 million) during the year were capitalised as part of assets under construction.
(c) Depreciation charge of US$287.2 million (2012: US$219.3 million) for the year has been expensed in operating costs and US$15.7 million (2012: US$16.0 million) in other operating expenses.
(d) As at 31st December 2013 and 2012, the buildings outside Hong Kong are held under medium-term leasehold land.
The container vessels and containers include the following amounts where the Group is a lessee under finance leases:
US$’000 2013 2012
Cost – capitalised finance leases 1,896,714 1,697,668Accumulated depreciation (413,112) (399,980)
Net book amount 1,483,602 1,297,688
The Group leases various containers and container vessels under non-cancellable finance lease agreements. The lease terms are between 4.5 and 25 years.
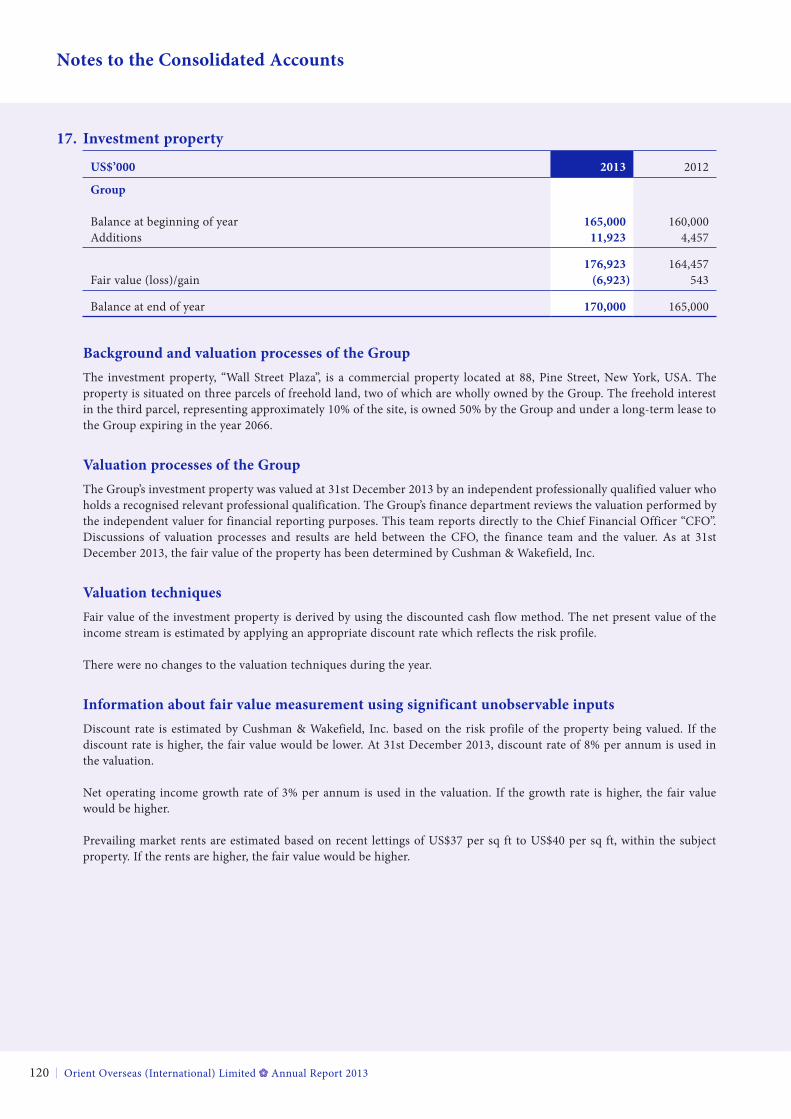
Orient Overseas (International) Limited Annual Report 2013120
Notes to the Consolidated Accounts
17. investment property
US$’000 2013 2012
Group
Balance at beginning of year 165,000 160,000Additions 11,923 4,457
176,923 164,457Fair value (loss)/gain (6,923) 543
Balance at end of year 170,000 165,000
Background and valuation processes of the GroupThe investment property, “Wall Street Plaza”, is a commercial property located at 88, Pine Street, New york, USA. The property is situated on three parcels of freehold land, two of which are wholly owned by the Group. The freehold interest in the third parcel, representing approximately 10% of the site, is owned 50% by the Group and under a long-term lease to the Group expiring in the year 2066.
Valuation processes of the GroupThe Group’s investment property was valued at 31st December 2013 by an independent professionally qualified valuer who holds a recognised relevant professional qualification. The Group’s finance department reviews the valuation performed by the independent valuer for financial reporting purposes. This team reports directly to the Chief Financial Officer “CFO”. Discussions of valuation processes and results are held between the CFO, the finance team and the valuer. As at 31st December 2013, the fair value of the property has been determined by Cushman & Wakefield, Inc.
Valuation techniquesFair value of the investment property is derived by using the discounted cash flow method. The net present value of the income stream is estimated by applying an appropriate discount rate which reflects the risk profile.
There were no changes to the valuation techniques during the year.
information about fair value measurement using significant unobservable inputsDiscount rate is estimated by Cushman & Wakefield, Inc. based on the risk profile of the property being valued. If the discount rate is higher, the fair value would be lower. At 31st December 2013, discount rate of 8% per annum is used in the valuation.
Net operating income growth rate of 3% per annum is used in the valuation. If the growth rate is higher, the fair value would be higher.
Prevailing market rents are estimated based on recent lettings of US$37 per sq ft to US$40 per sq ft, within the subject property. If the rents are higher, the fair value would be higher.
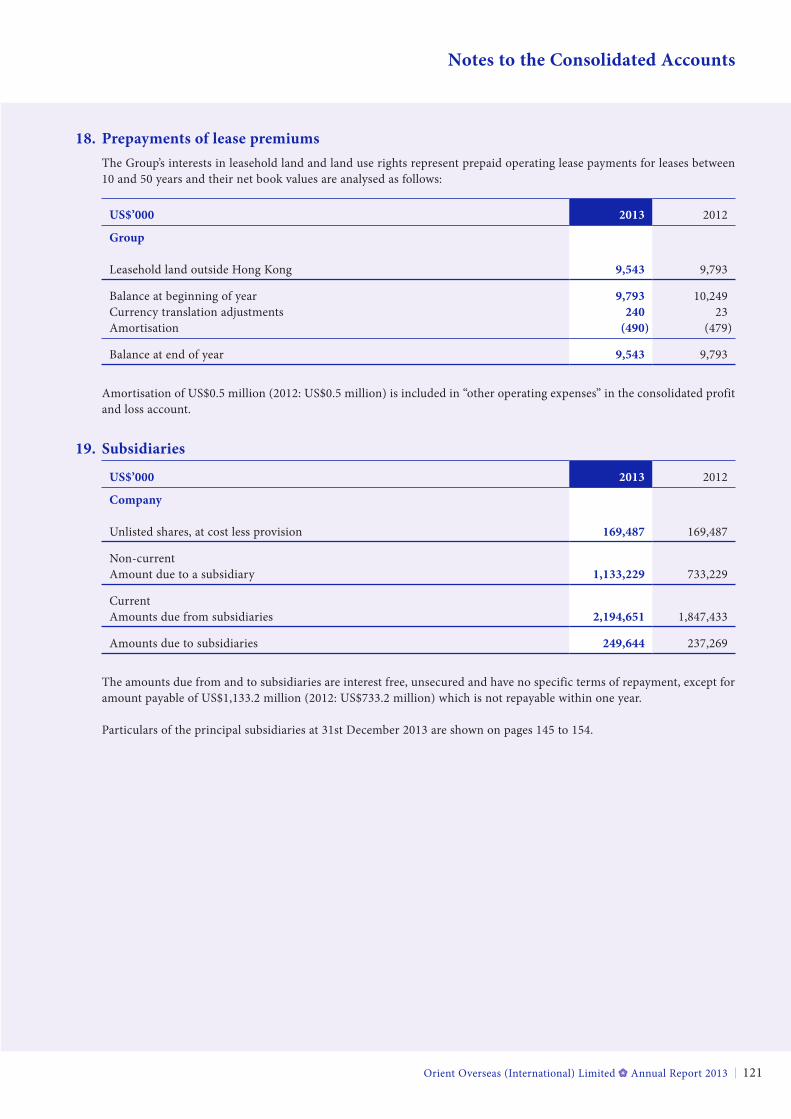
Orient Overseas (International) Limited Annual Report 2013 121
Notes to the Consolidated Accounts
18. prepayments of lease premiumsThe Group’s interests in leasehold land and land use rights represent prepaid operating lease payments for leases between 10 and 50 years and their net book values are analysed as follows:
US$’000 2013 2012
Group
Leasehold land outside Hong Kong 9,543 9,793
Balance at beginning of year 9,793 10,249Currency translation adjustments 240 23Amortisation (490) (479)
Balance at end of year 9,543 9,793
Amortisation of US$0.5 million (2012: US$0.5 million) is included in “other operating expenses” in the consolidated profit and loss account.
19. Subsidiaries
US$’000 2013 2012
Company
Unlisted shares, at cost less provision 169,487 169,487
Non-currentAmount due to a subsidiary 1,133,229 733,229
CurrentAmounts due from subsidiaries 2,194,651 1,847,433
Amounts due to subsidiaries 249,644 237,269
The amounts due from and to subsidiaries are interest free, unsecured and have no specific terms of repayment, except for amount payable of US$1,133.2 million (2012: US$733.2 million) which is not repayable within one year.
Particulars of the principal subsidiaries at 31st December 2013 are shown on pages 145 to 154.
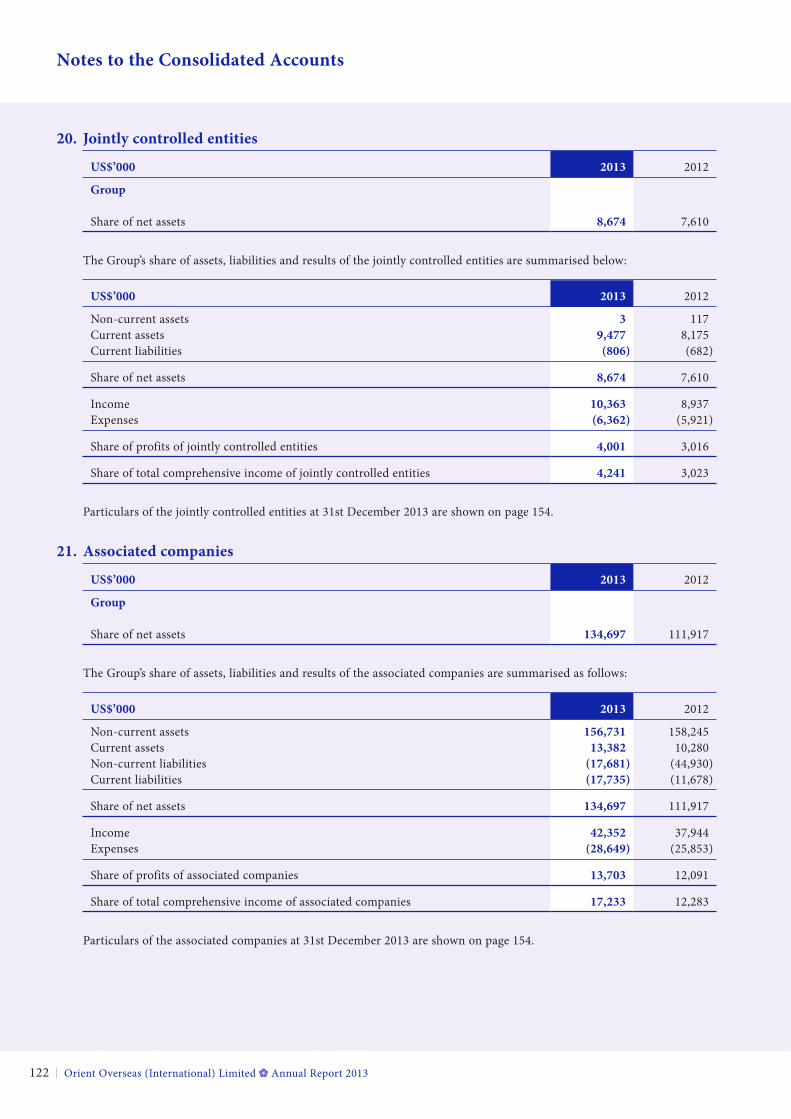
Orient Overseas (International) Limited Annual Report 2013122
Notes to the Consolidated Accounts
20. jointly controlled entities
US$’000 2013 2012
Group
Share of net assets 8,674 7,610
The Group’s share of assets, liabilities and results of the jointly controlled entities are summarised below:
US$’000 2013 2012
Non-current assets 3 117Current assets 9,477 8,175Current liabilities (806) (682)
Share of net assets 8,674 7,610
Income 10,363 8,937Expenses (6,362) (5,921)
Share of profits of jointly controlled entities 4,001 3,016
Share of total comprehensive income of jointly controlled entities 4,241 3,023
Particulars of the jointly controlled entities at 31st December 2013 are shown on page 154.
21. associated companies
US$’000 2013 2012
Group
Share of net assets 134,697 111,917
The Group’s share of assets, liabilities and results of the associated companies are summarised as follows:
US$’000 2013 2012
Non-current assets 156,731 158,245Current assets 13,382 10,280Non-current liabilities (17,681) (44,930)Current liabilities (17,735) (11,678)
Share of net assets 134,697 111,917
Income 42,352 37,944Expenses (28,649) (25,853)
Share of profits of associated companies 13,703 12,091
Share of total comprehensive income of associated companies 17,233 12,283
Particulars of the associated companies at 31st December 2013 are shown on page 154.
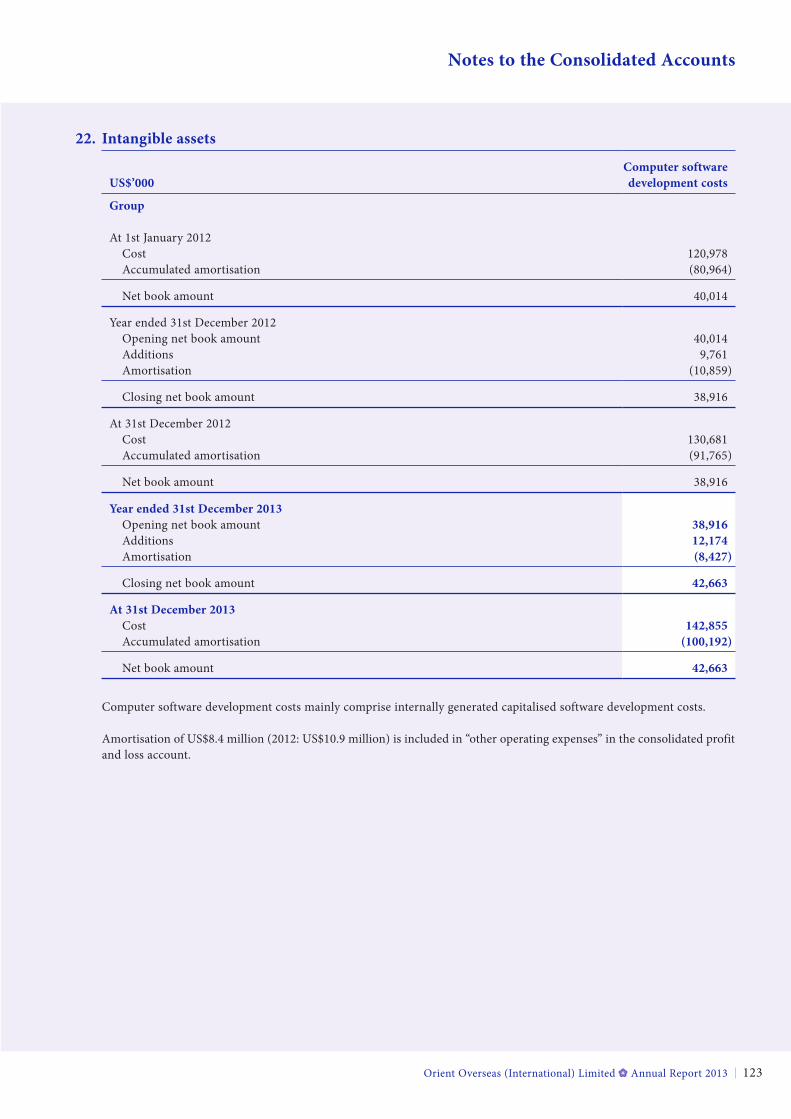
Orient Overseas (International) Limited Annual Report 2013 123
Notes to the Consolidated Accounts
22. intangible assets
Computer softwareUS$’000 development costs
Group
At 1st January 2012 Cost 120,978 Accumulated amortisation (80,964)
Net book amount 40,014
year ended 31st December 2012 Opening net book amount 40,014 Additions 9,761 Amortisation (10,859)
Closing net book amount 38,916
At 31st December 2012 Cost 130,681 Accumulated amortisation (91,765)
Net book amount 38,916
Year ended 31st December 2013 Opening net book amount 38,916 Additions 12,174 Amortisation (8,427)
Closing net book amount 42,663
at 31st December 2013 Cost 142,855 Accumulated amortisation (100,192)
Net book amount 42,663
Computer software development costs mainly comprise internally generated capitalised software development costs.
Amortisation of US$8.4 million (2012: US$10.9 million) is included in “other operating expenses” in the consolidated profit and loss account.
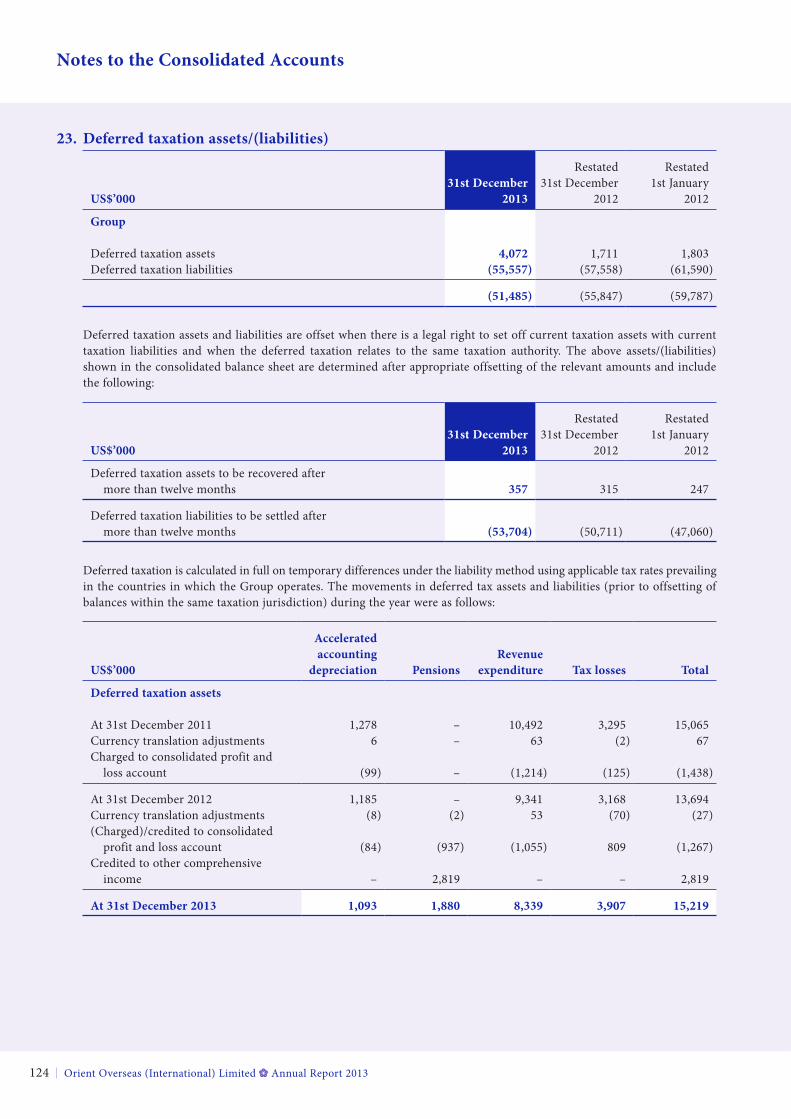
Orient Overseas (International) Limited Annual Report 2013124
Notes to the Consolidated Accounts
23. Deferred taxation assets/(liabilities)
Restated Restated31st December 31st December 1st January
US$’000 2013 2012 2012
Group
Deferred taxation assets 4,072 1,711 1,803Deferred taxation liabilities (55,557) (57,558) (61,590)
(51,485) (55,847) (59,787)
Deferred taxation assets and liabilities are offset when there is a legal right to set off current taxation assets with current taxation liabilities and when the deferred taxation relates to the same taxation authority. The above assets/(liabilities) shown in the consolidated balance sheet are determined after appropriate offsetting of the relevant amounts and include the following:
Restated Restated31st December 31st December 1st January
US$’000 2013 2012 2012
Deferred taxation assets to be recovered after more than twelve months 357 315 247
Deferred taxation liabilities to be settled after more than twelve months (53,704) (50,711) (47,060)
Deferred taxation is calculated in full on temporary differences under the liability method using applicable tax rates prevailing in the countries in which the Group operates. The movements in deferred tax assets and liabilities (prior to offsetting of balances within the same taxation jurisdiction) during the year were as follows:
US$’000
accelerated accounting
depreciation pensionsrevenue
expenditure tax losses total
Deferred taxation assets
At 31st December 2011 1,278 – 10,492 3,295 15,065Currency translation adjustments 6 – 63 (2) 67Charged to consolidated profit and loss account (99) – (1,214) (125) (1,438)
At 31st December 2012 1,185 – 9,341 3,168 13,694Currency translation adjustments (8) (2) 53 (70) (27)(Charged)/credited to consolidated profit and loss account (84) (937) (1,055) 809 (1,267)Credited to other comprehensive income – 2,819 – – 2,819
at 31st December 2013 1,093 1,880 8,339 3,907 15,219
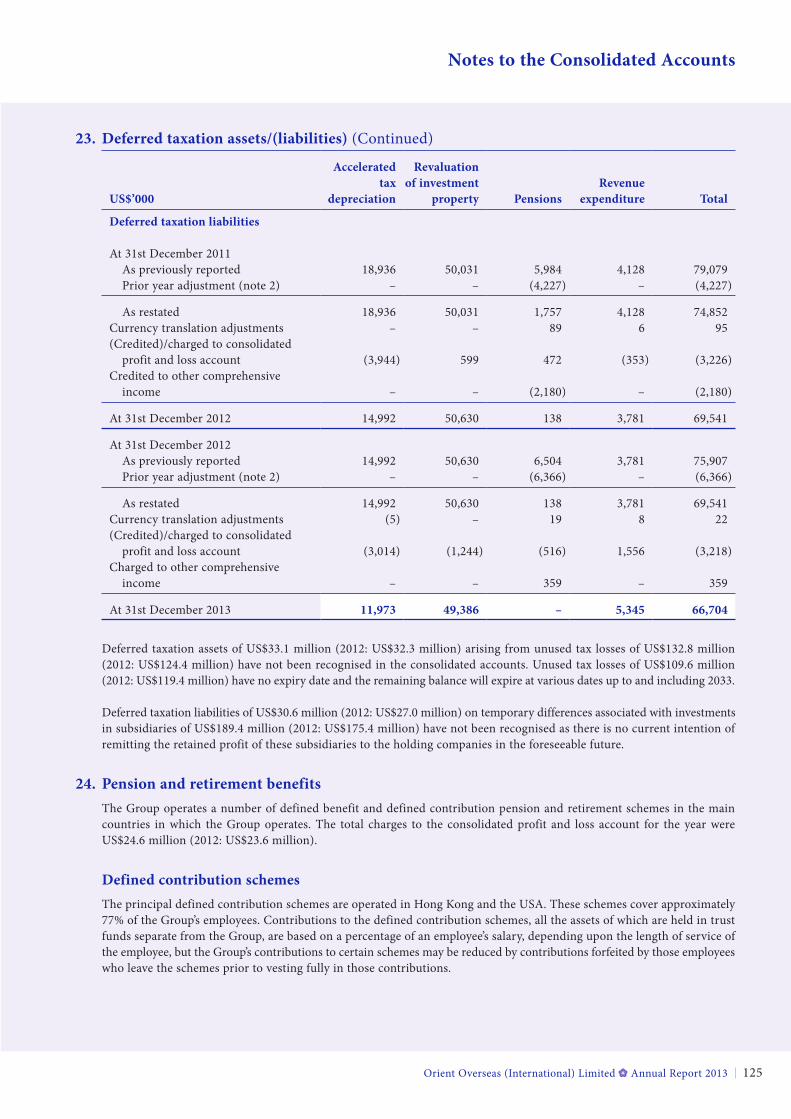
Orient Overseas (International) Limited Annual Report 2013 125
Notes to the Consolidated Accounts
23. Deferred taxation assets/(liabilities) (Continued)
US$’000
accelerated tax
depreciation
revaluation of investment
property pensionsrevenue
expenditure total
Deferred taxation liabilities
At 31st December 2011 As previously reported 18,936 50,031 5,984 4,128 79,079 Prior year adjustment (note 2) – – (4,227) – (4,227)
As restated 18,936 50,031 1,757 4,128 74,852Currency translation adjustments – – 89 6 95(Credited)/charged to consolidated profit and loss account (3,944) 599 472 (353) (3,226)Credited to other comprehensive income – – (2,180) – (2,180)
At 31st December 2012 14,992 50,630 138 3,781 69,541
At 31st December 2012 As previously reported 14,992 50,630 6,504 3,781 75,907 Prior year adjustment (note 2) – – (6,366) – (6,366)
As restated 14,992 50,630 138 3,781 69,541Currency translation adjustments (5) – 19 8 22(Credited)/charged to consolidated profit and loss account (3,014) (1,244) (516) 1,556 (3,218)Charged to other comprehensive income – – 359 – 359
At 31st December 2013 11,973 49,386 – 5,345 66,704
Deferred taxation assets of US$33.1 million (2012: US$32.3 million) arising from unused tax losses of US$132.8 million (2012: US$124.4 million) have not been recognised in the consolidated accounts. Unused tax losses of US$109.6 million (2012: US$119.4 million) have no expiry date and the remaining balance will expire at various dates up to and including 2033.
Deferred taxation liabilities of US$30.6 million (2012: US$27.0 million) on temporary differences associated with investments in subsidiaries of US$189.4 million (2012: US$175.4 million) have not been recognised as there is no current intention of remitting the retained profit of these subsidiaries to the holding companies in the foreseeable future.
24. pension and retirement benefitsThe Group operates a number of defined benefit and defined contribution pension and retirement schemes in the main countries in which the Group operates. The total charges to the consolidated profit and loss account for the year were US$24.6 million (2012: US$23.6 million).
Defined contribution schemesThe principal defined contribution schemes are operated in Hong Kong and the USA. These schemes cover approximately 77% of the Group’s employees. Contributions to the defined contribution schemes, all the assets of which are held in trust funds separate from the Group, are based on a percentage of an employee’s salary, depending upon the length of service of the employee, but the Group’s contributions to certain schemes may be reduced by contributions forfeited by those employees who leave the schemes prior to vesting fully in those contributions.
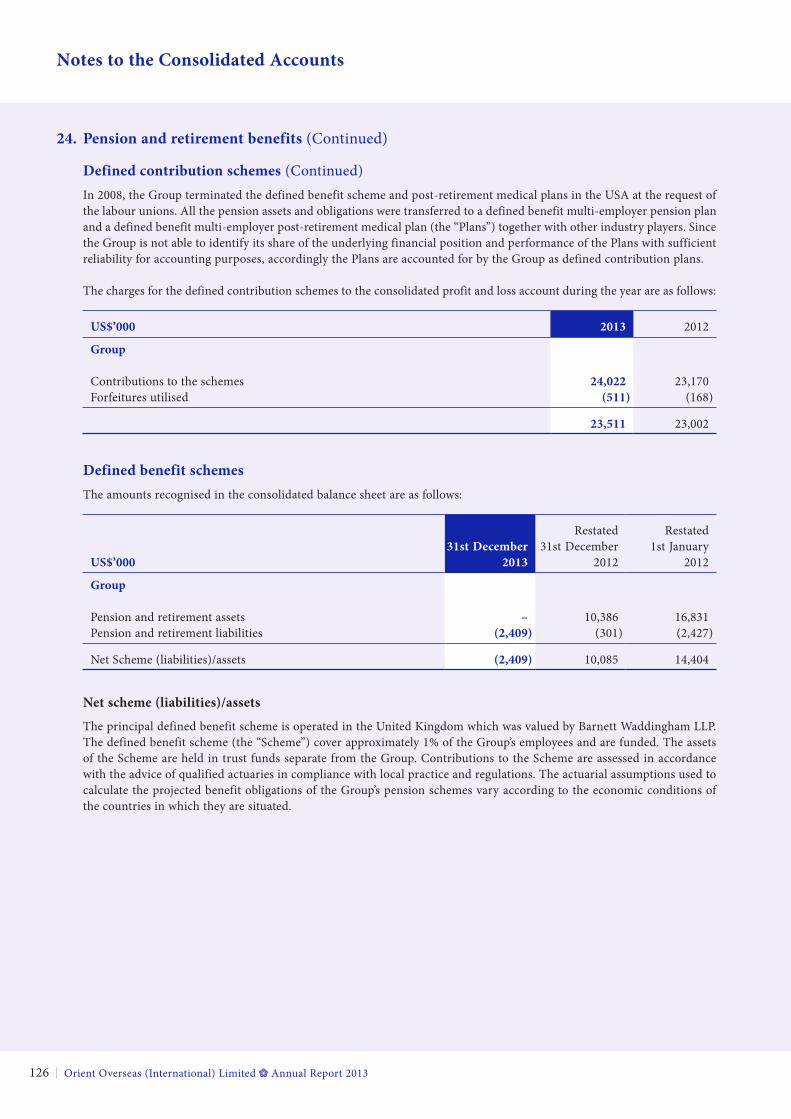
Orient Overseas (International) Limited Annual Report 2013126
Notes to the Consolidated Accounts
24. pension and retirement benefits (Continued)
Defined contribution schemes (Continued)In 2008, the Group terminated the defined benefit scheme and post-retirement medical plans in the USA at the request of the labour unions. All the pension assets and obligations were transferred to a defined benefit multi-employer pension plan and a defined benefit multi-employer post-retirement medical plan (the “Plans”) together with other industry players. Since the Group is not able to identify its share of the underlying financial position and performance of the Plans with sufficient reliability for accounting purposes, accordingly the Plans are accounted for by the Group as defined contribution plans.
The charges for the defined contribution schemes to the consolidated profit and loss account during the year are as follows:
US$’000 2013 2012
Group
Contributions to the schemes 24,022 23,170Forfeitures utilised (511) (168)
23,511 23,002
Defined benefit schemesThe amounts recognised in the consolidated balance sheet are as follows:
Restated Restated31st December 31st December 1st January
US$’000 2013 2012 2012
Group
Pension and retirement assets – 10,386 16,831Pension and retirement liabilities (2,409) (301) (2,427)
Net Scheme (liabilities)/assets (2,409) 10,085 14,404
Net scheme (liabilities)/assets
The principal defined benefit scheme is operated in the United Kingdom which was valued by Barnett Waddingham LLP. The defined benefit scheme (the “Scheme”) cover approximately 1% of the Group’s employees and are funded. The assets of the Scheme are held in trust funds separate from the Group. Contributions to the Scheme are assessed in accordance with the advice of qualified actuaries in compliance with local practice and regulations. The actuarial assumptions used to calculate the projected benefit obligations of the Group’s pension schemes vary according to the economic conditions of the countries in which they are situated.
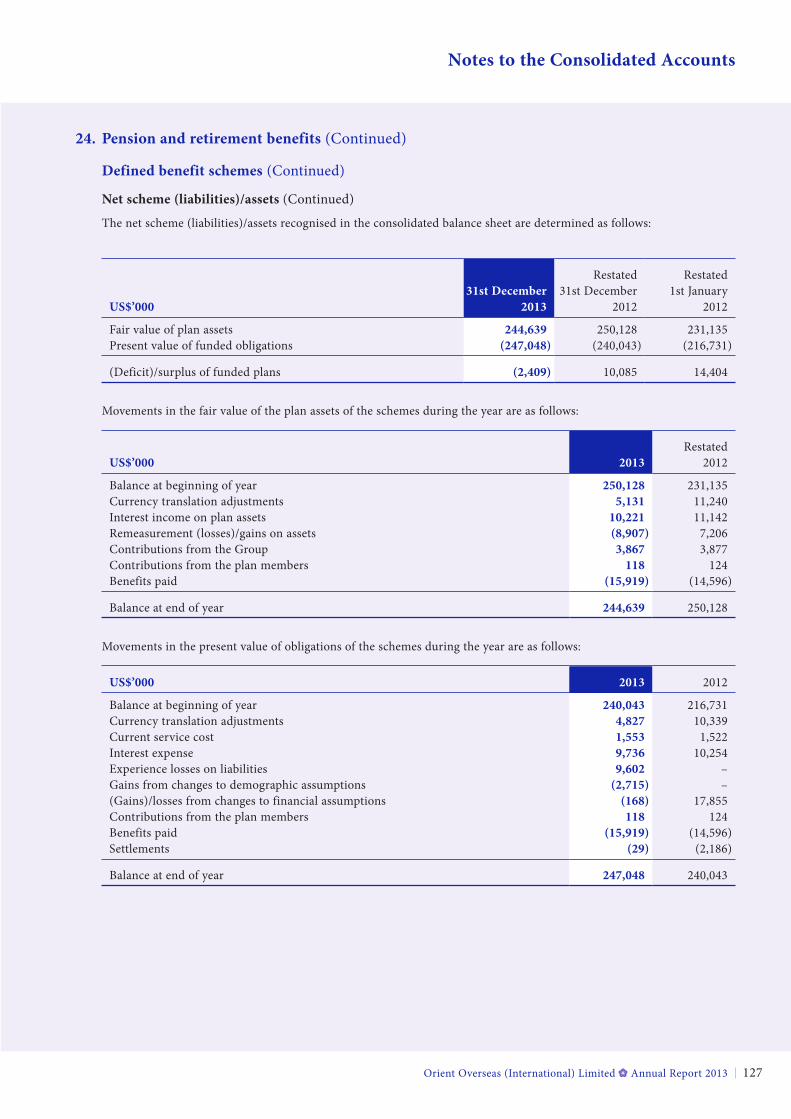
Orient Overseas (International) Limited Annual Report 2013 127
Notes to the Consolidated Accounts
24. pension and retirement benefits (Continued)
Defined benefit schemes (Continued)
Net scheme (liabilities)/assets (Continued)
The net scheme (liabilities)/assets recognised in the consolidated balance sheet are determined as follows:
Restated Restated31st December 31st December 1st January
US$’000 2013 2012 2012
Fair value of plan assets 244,639 250,128 231,135Present value of funded obligations (247,048) (240,043) (216,731)
(Deficit)/surplus of funded plans (2,409) 10,085 14,404
Movements in the fair value of the plan assets of the schemes during the year are as follows:
RestatedUS$’000 2013 2012
Balance at beginning of year 250,128 231,135Currency translation adjustments 5,131 11,240Interest income on plan assets 10,221 11,142Remeasurement (losses)/gains on assets (8,907) 7,206Contributions from the Group 3,867 3,877Contributions from the plan members 118 124Benefits paid (15,919) (14,596)
Balance at end of year 244,639 250,128
Movements in the present value of obligations of the schemes during the year are as follows:
US$’000 2013 2012
Balance at beginning of year 240,043 216,731Currency translation adjustments 4,827 10,339Current service cost 1,553 1,522Interest expense 9,736 10,254Experience losses on liabilities 9,602 –Gains from changes to demographic assumptions (2,715) –(Gains)/losses from changes to financial assumptions (168) 17,855Contributions from the plan members 118 124Benefits paid (15,919) (14,596)Settlements (29) (2,186)
Balance at end of year 247,048 240,043
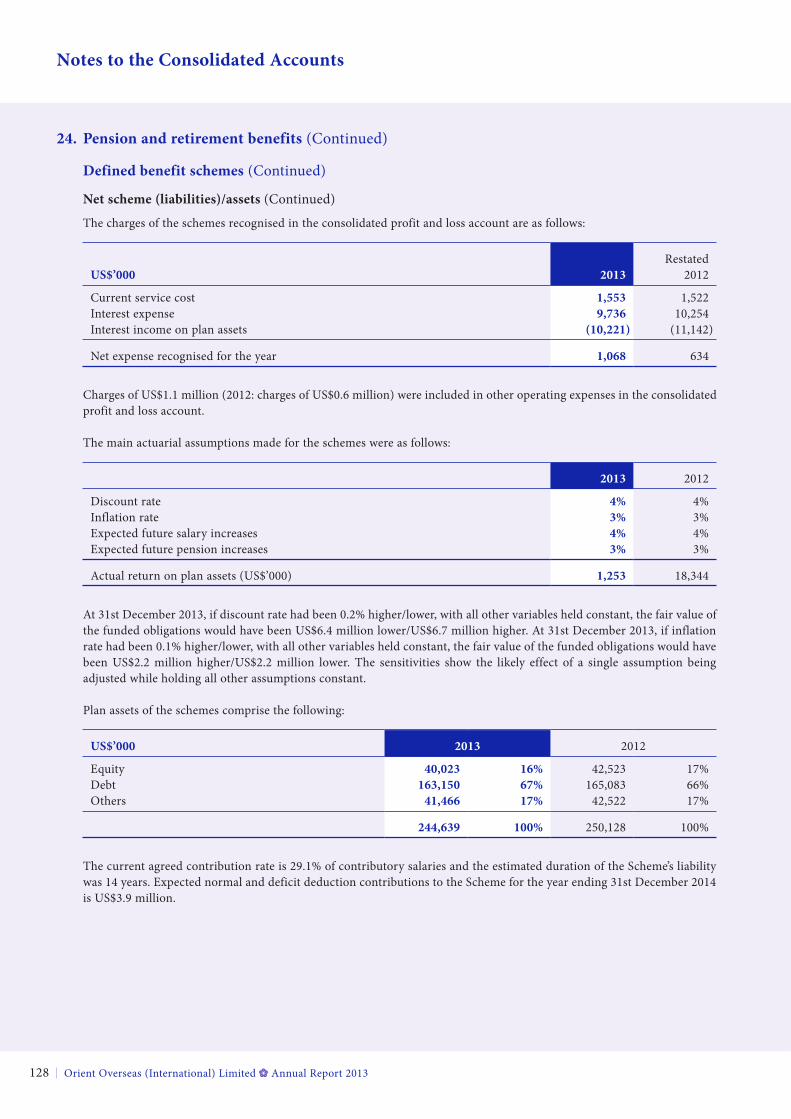
Orient Overseas (International) Limited Annual Report 2013128
Notes to the Consolidated Accounts
24. pension and retirement benefits (Continued)
Defined benefit schemes (Continued)
Net scheme (liabilities)/assets (Continued)
The charges of the schemes recognised in the consolidated profit and loss account are as follows:
RestatedUS$’000 2013 2012
Current service cost 1,553 1,522Interest expense 9,736 10,254Interest income on plan assets (10,221) (11,142)
Net expense recognised for the year 1,068 634
Charges of US$1.1 million (2012: charges of US$0.6 million) were included in other operating expenses in the consolidated profit and loss account.
The main actuarial assumptions made for the schemes were as follows:
2013 2012
Discount rate 4% 4%Inflation rate 3% 3%Expected future salary increases 4% 4%Expected future pension increases 3% 3%
Actual return on plan assets (US$’000) 1,253 18,344
At 31st December 2013, if discount rate had been 0.2% higher/lower, with all other variables held constant, the fair value of the funded obligations would have been US$6.4 million lower/US$6.7 million higher. At 31st December 2013, if inflation rate had been 0.1% higher/lower, with all other variables held constant, the fair value of the funded obligations would have been US$2.2 million higher/US$2.2 million lower. The sensitivities show the likely effect of a single assumption being adjusted while holding all other assumptions constant.
Plan assets of the schemes comprise the following:
US$’000 2013 2012
Equity 40,023 16% 42,523 17%Debt 163,150 67% 165,083 66%Others 41,466 17% 42,522 17%
244,639 100% 250,128 100%
The current agreed contribution rate is 29.1% of contributory salaries and the estimated duration of the Scheme’s liability was 14 years. Expected normal and deficit deduction contributions to the Scheme for the year ending 31st December 2014 is US$3.9 million.
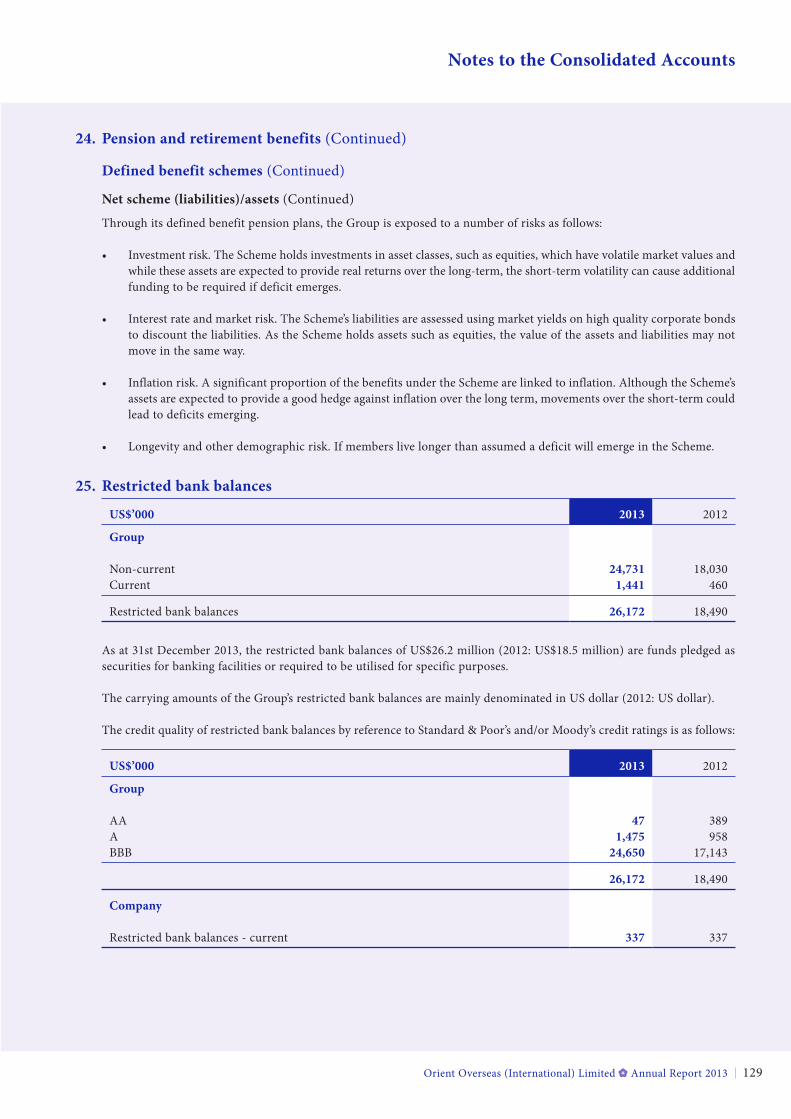
Orient Overseas (International) Limited Annual Report 2013 129
Notes to the Consolidated Accounts
24. pension and retirement benefits (Continued)
Defined benefit schemes (Continued)
Net scheme (liabilities)/assets (Continued)
Through its defined benefit pension plans, the Group is exposed to a number of risks as follows:
• Investment risk. The Scheme holds investments in asset classes, such as equities, which have volatile market values and while these assets are expected to provide real returns over the long-term, the short-term volatility can cause additional funding to be required if deficit emerges.
• Interest rate and market risk. The Scheme’s liabilities are assessed using market yields on high quality corporate bonds to discount the liabilities. As the Scheme holds assets such as equities, the value of the assets and liabilities may not move in the same way.
• Inflation risk. A significant proportion of the benefits under the Scheme are linked to inflation. Although the Scheme’s assets are expected to provide a good hedge against inflation over the long term, movements over the short-term could lead to deficits emerging.
• Longevity and other demographic risk. If members live longer than assumed a deficit will emerge in the Scheme.
25. restricted bank balances
US$’000 2013 2012
Group
Non-current 24,731 18,030Current 1,441 460
Restricted bank balances 26,172 18,490
As at 31st December 2013, the restricted bank balances of US$26.2 million (2012: US$18.5 million) are funds pledged as securities for banking facilities or required to be utilised for specific purposes.
The carrying amounts of the Group’s restricted bank balances are mainly denominated in US dollar (2012: US dollar).
The credit quality of restricted bank balances by reference to Standard & Poor’s and/or Moody’s credit ratings is as follows:
US$’000 2013 2012
Group
AA 47 389A 1,475 958BBB 24,650 17,143
26,172 18,490
Company
Restricted bank balances - current 337 337
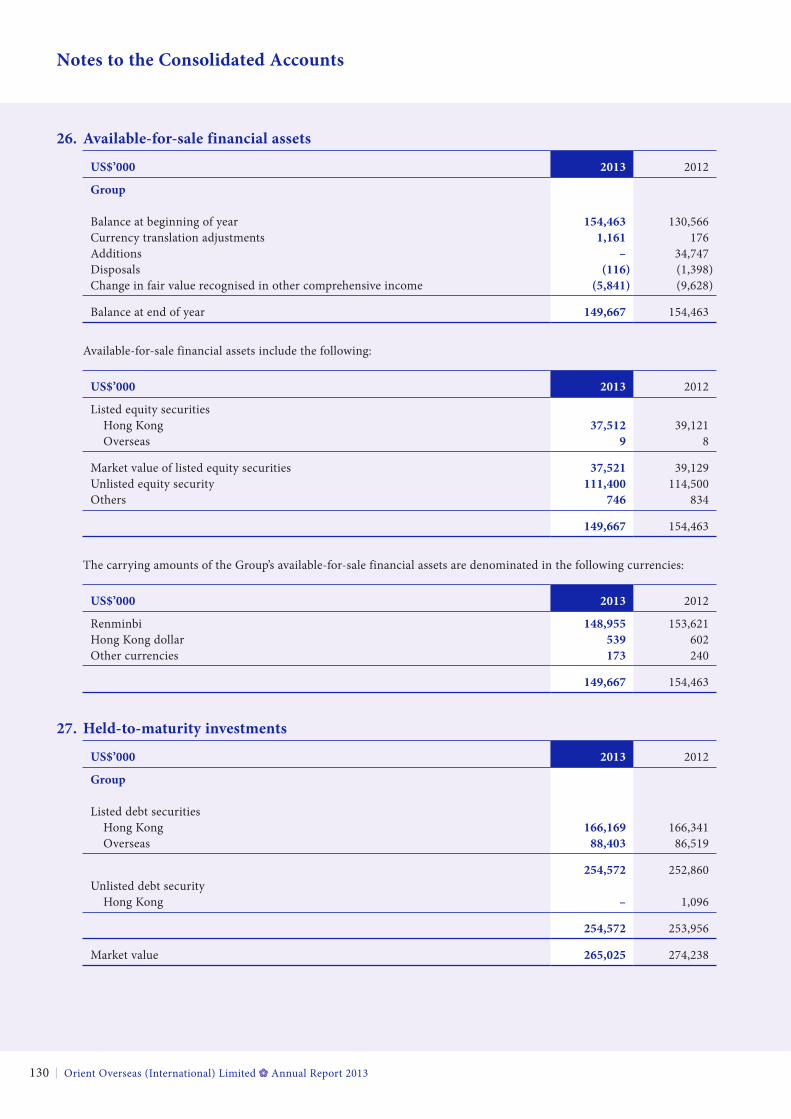
Orient Overseas (International) Limited Annual Report 2013130
Notes to the Consolidated Accounts
26. available-for-sale financial assets
US$’000 2013 2012
Group
Balance at beginning of year 154,463 130,566Currency translation adjustments 1,161 176Additions – 34,747Disposals (116) (1,398)Change in fair value recognised in other comprehensive income (5,841) (9,628)
Balance at end of year 149,667 154,463
Available-for-sale financial assets include the following:
US$’000 2013 2012
Listed equity securities Hong Kong 37,512 39,121 Overseas 9 8
Market value of listed equity securities 37,521 39,129Unlisted equity security 111,400 114,500Others 746 834
149,667 154,463
The carrying amounts of the Group’s available-for-sale financial assets are denominated in the following currencies:
US$’000 2013 2012
Renminbi 148,955 153,621Hong Kong dollar 539 602Other currencies 173 240
149,667 154,463
27. Held-to-maturity investments
US$’000 2013 2012
Group
Listed debt securities Hong Kong 166,169 166,341 Overseas 88,403 86,519
254,572 252,860Unlisted debt security Hong Kong – 1,096
254,572 253,956
Market value 265,025 274,238
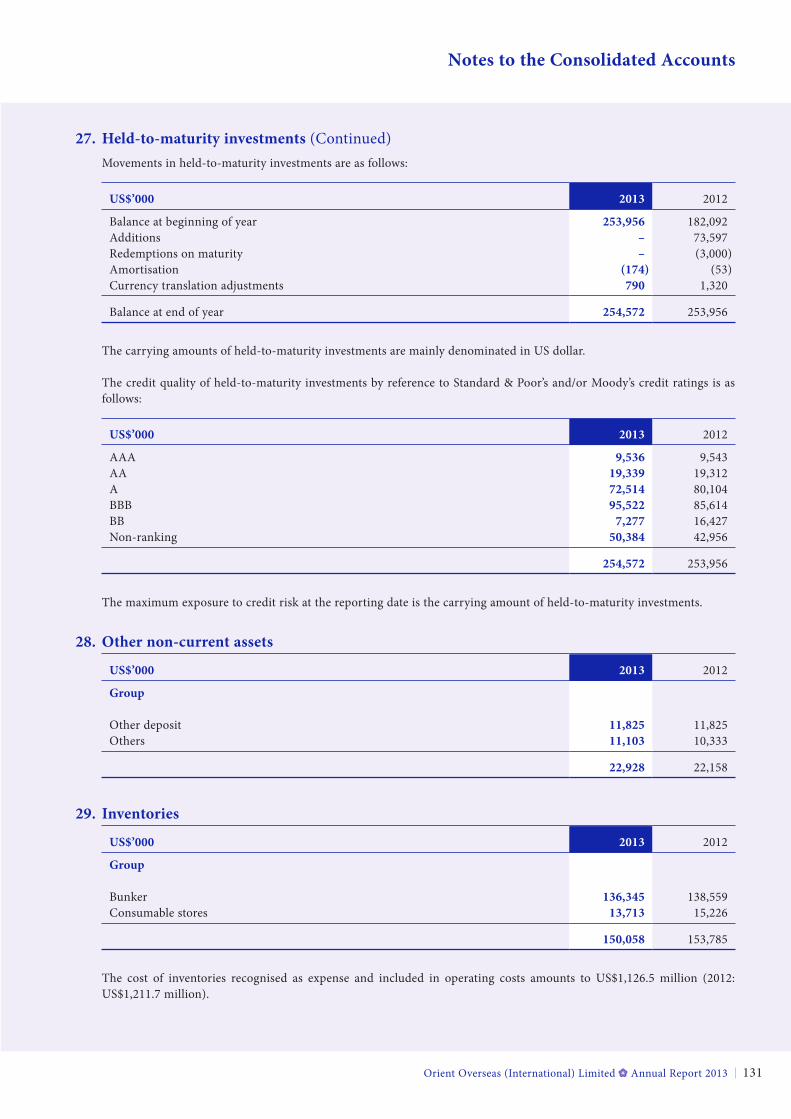
Orient Overseas (International) Limited Annual Report 2013 131
Notes to the Consolidated Accounts
27. Held-to-maturity investments (Continued)Movements in held-to-maturity investments are as follows:
US$’000 2013 2012
Balance at beginning of year 253,956 182,092Additions – 73,597Redemptions on maturity – (3,000)Amortisation (174) (53)Currency translation adjustments 790 1,320
Balance at end of year 254,572 253,956
The carrying amounts of held-to-maturity investments are mainly denominated in US dollar.
The credit quality of held-to-maturity investments by reference to Standard & Poor’s and/or Moody’s credit ratings is as follows:
US$’000 2013 2012
AAA 9,536 9,543AA 19,339 19,312A 72,514 80,104BBB 95,522 85,614BB 7,277 16,427Non-ranking 50,384 42,956
254,572 253,956
The maximum exposure to credit risk at the reporting date is the carrying amount of held-to-maturity investments.
28. other non-current assets
US$’000 2013 2012
Group
Other deposit 11,825 11,825Others 11,103 10,333
22,928 22,158
29. inventories
US$’000 2013 2012
Group
Bunker 136,345 138,559Consumable stores 13,713 15,226
150,058 153,785
The cost of inventories recognised as expense and included in operating costs amounts to US$1,126.5 million (2012: US$1,211.7 million).
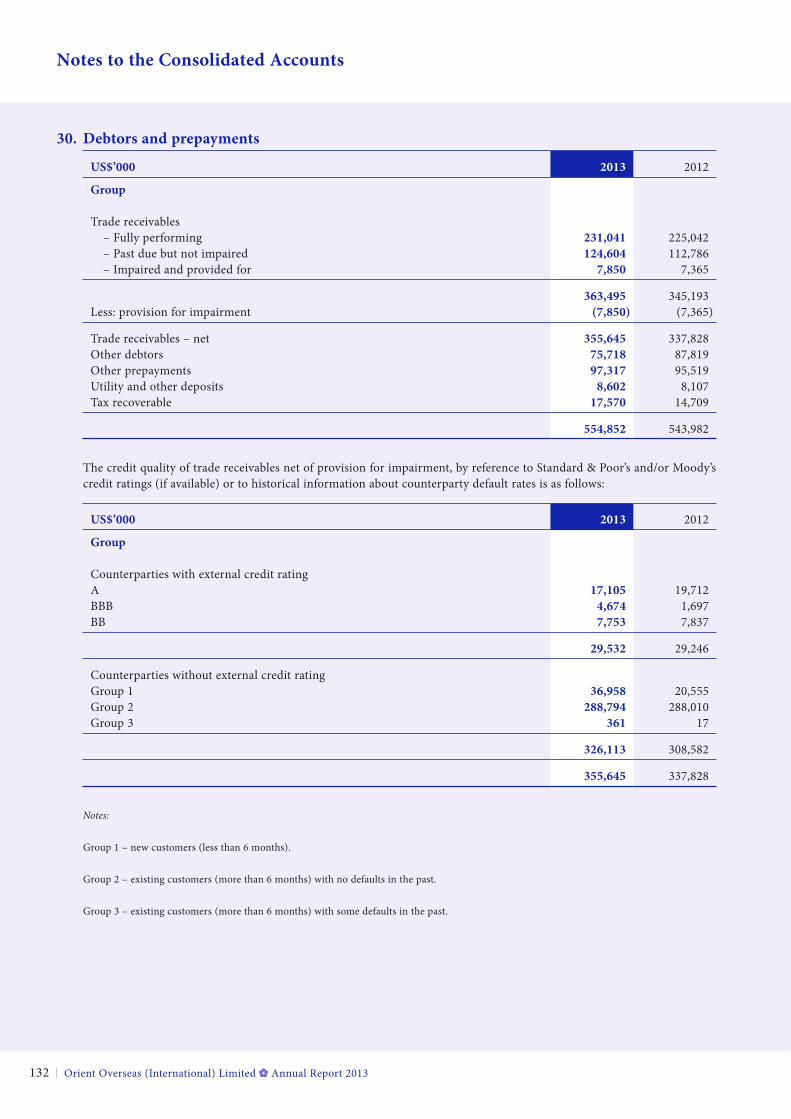
Orient Overseas (International) Limited Annual Report 2013132
Notes to the Consolidated Accounts
30. Debtors and prepayments
US$’000 2013 2012
Group
Trade receivables – Fully performing 231,041 225,042 – Past due but not impaired 124,604 112,786 – Impaired and provided for 7,850 7,365
363,495 345,193Less: provision for impairment (7,850) (7,365)
Trade receivables – net 355,645 337,828Other debtors 75,718 87,819Other prepayments 97,317 95,519Utility and other deposits 8,602 8,107Tax recoverable 17,570 14,709
554,852 543,982
The credit quality of trade receivables net of provision for impairment, by reference to Standard & Poor’s and/or Moody’s credit ratings (if available) or to historical information about counterparty default rates is as follows:
US$’000 2013 2012
Group
Counterparties with external credit ratingA 17,105 19,712BBB 4,674 1,697BB 7,753 7,837
29,532 29,246
Counterparties without external credit ratingGroup 1 36,958 20,555Group 2 288,794 288,010Group 3 361 17
326,113 308,582
355,645 337,828
Notes:
Group 1 – new customers (less than 6 months).
Group 2 – existing customers (more than 6 months) with no defaults in the past.
Group 3 – existing customers (more than 6 months) with some defaults in the past.
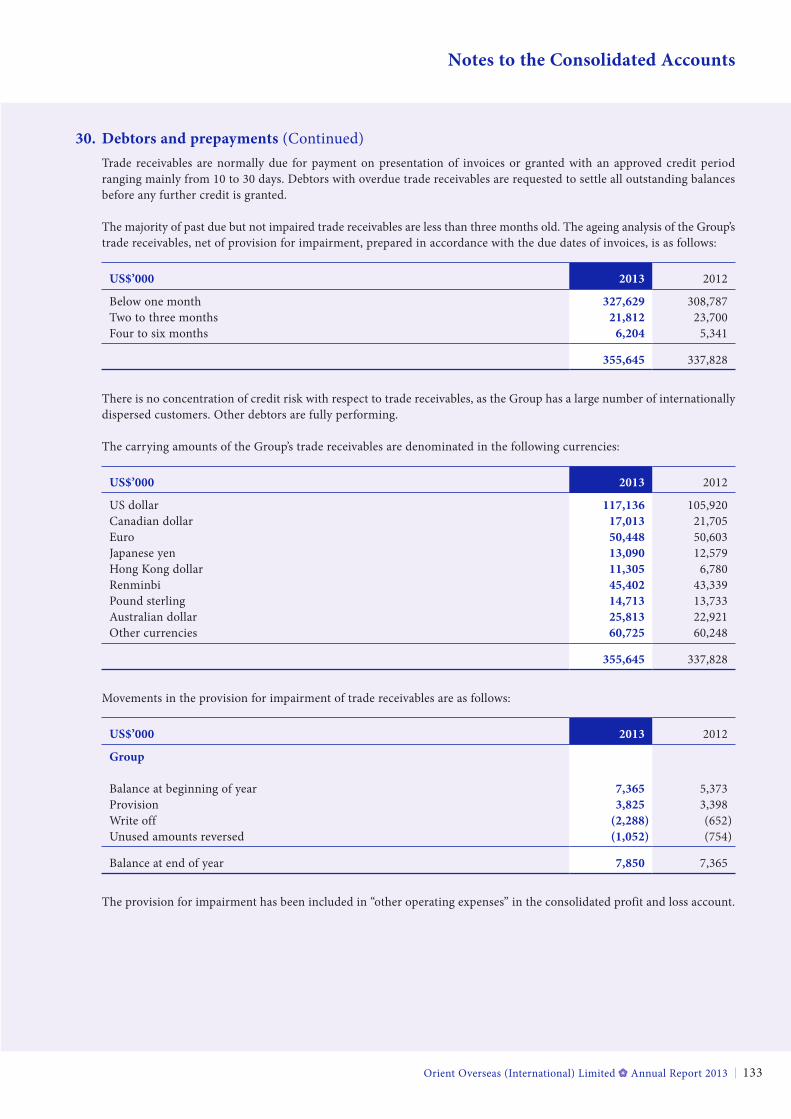
Orient Overseas (International) Limited Annual Report 2013 133
Notes to the Consolidated Accounts
30. Debtors and prepayments (Continued)Trade receivables are normally due for payment on presentation of invoices or granted with an approved credit period ranging mainly from 10 to 30 days. Debtors with overdue trade receivables are requested to settle all outstanding balances before any further credit is granted.
The majority of past due but not impaired trade receivables are less than three months old. The ageing analysis of the Group’s trade receivables, net of provision for impairment, prepared in accordance with the due dates of invoices, is as follows:
US$’000 2013 2012
Below one month 327,629 308,787Two to three months 21,812 23,700Four to six months 6,204 5,341
355,645 337,828
There is no concentration of credit risk with respect to trade receivables, as the Group has a large number of internationally dispersed customers. Other debtors are fully performing.
The carrying amounts of the Group’s trade receivables are denominated in the following currencies:
US$’000 2013 2012
US dollar 117,136 105,920Canadian dollar 17,013 21,705Euro 50,448 50,603Japanese yen 13,090 12,579Hong Kong dollar 11,305 6,780Renminbi 45,402 43,339Pound sterling 14,713 13,733Australian dollar 25,813 22,921Other currencies 60,725 60,248
355,645 337,828
Movements in the provision for impairment of trade receivables are as follows:
US$’000 2013 2012
Group
Balance at beginning of year 7,365 5,373Provision 3,825 3,398Write off (2,288) (652)Unused amounts reversed (1,052) (754)
Balance at end of year 7,850 7,365
The provision for impairment has been included in “other operating expenses” in the consolidated profit and loss account.
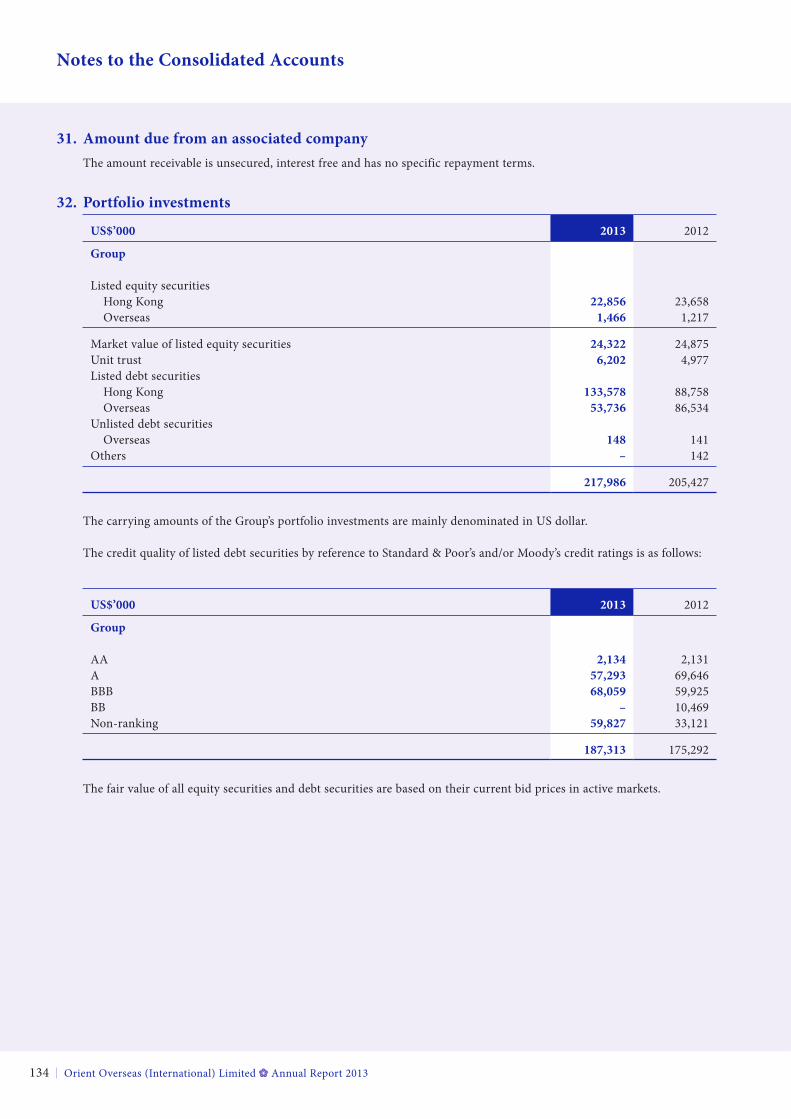
Orient Overseas (International) Limited Annual Report 2013134
Notes to the Consolidated Accounts
31. amount due from an associated companyThe amount receivable is unsecured, interest free and has no specific repayment terms.
32. portfolio investments
US$’000 2013 2012
Group
Listed equity securities Hong Kong 22,856 23,658 Overseas 1,466 1,217
Market value of listed equity securities 24,322 24,875Unit trust 6,202 4,977Listed debt securities Hong Kong 133,578 88,758 Overseas 53,736 86,534Unlisted debt securities Overseas 148 141Others – 142
217,986 205,427
The carrying amounts of the Group’s portfolio investments are mainly denominated in US dollar.
The credit quality of listed debt securities by reference to Standard & Poor’s and/or Moody’s credit ratings is as follows:
US$’000 2013 2012
Group
AA 2,134 2,131A 57,293 69,646BBB 68,059 59,925BB – 10,469Non-ranking 59,827 33,121
187,313 175,292
The fair value of all equity securities and debt securities are based on their current bid prices in active markets.
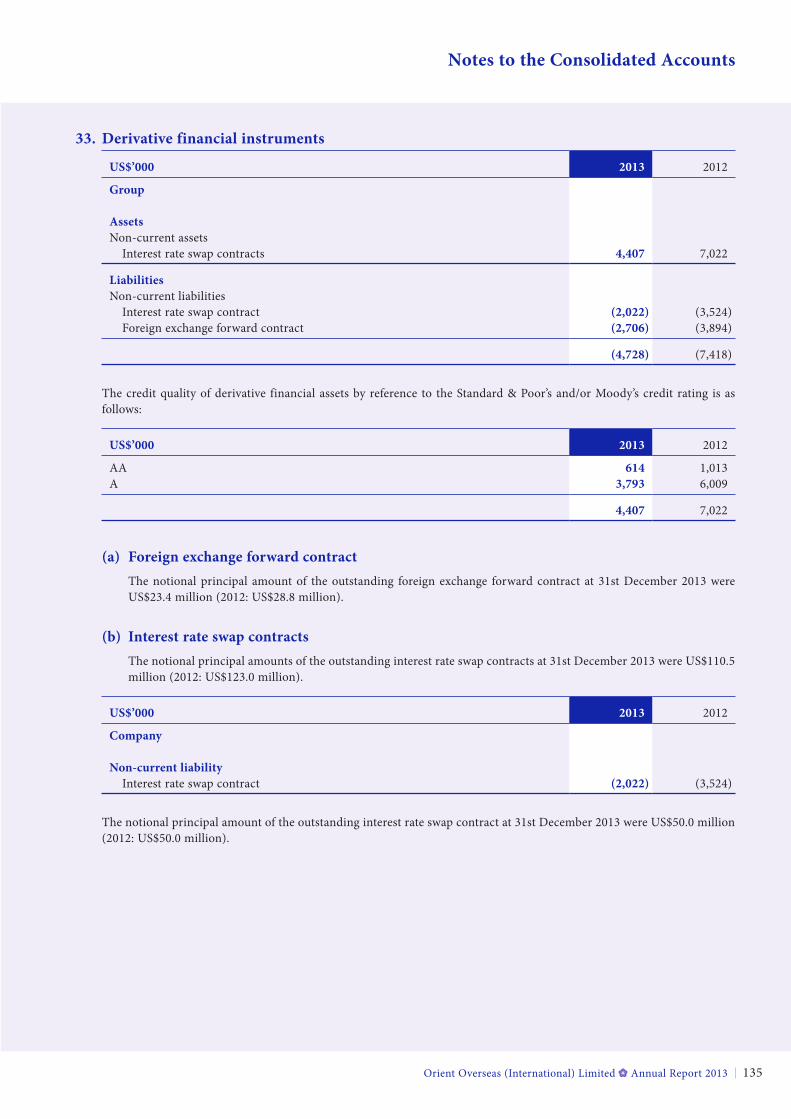
Orient Overseas (International) Limited Annual Report 2013 135
Notes to the Consolidated Accounts
33. Derivative financial instruments
US$’000 2013 2012
Group
assetsNon-current assets Interest rate swap contracts 4,407 7,022
liabilitiesNon-current liabilities Interest rate swap contract (2,022) (3,524) Foreign exchange forward contract (2,706) (3,894)
(4,728) (7,418)
The credit quality of derivative financial assets by reference to the Standard & Poor’s and/or Moody’s credit rating is as follows:
US$’000 2013 2012
AA 614 1,013A 3,793 6,009
4,407 7,022
(a) foreign exchange forward contractThe notional principal amount of the outstanding foreign exchange forward contract at 31st December 2013 were US$23.4 million (2012: US$28.8 million).
(b) interest rate swap contractsThe notional principal amounts of the outstanding interest rate swap contracts at 31st December 2013 were US$110.5 million (2012: US$123.0 million).
US$’000 2013 2012
Company
Non-current liability Interest rate swap contract (2,022) (3,524)
The notional principal amount of the outstanding interest rate swap contract at 31st December 2013 were US$50.0 million (2012: US$50.0 million).
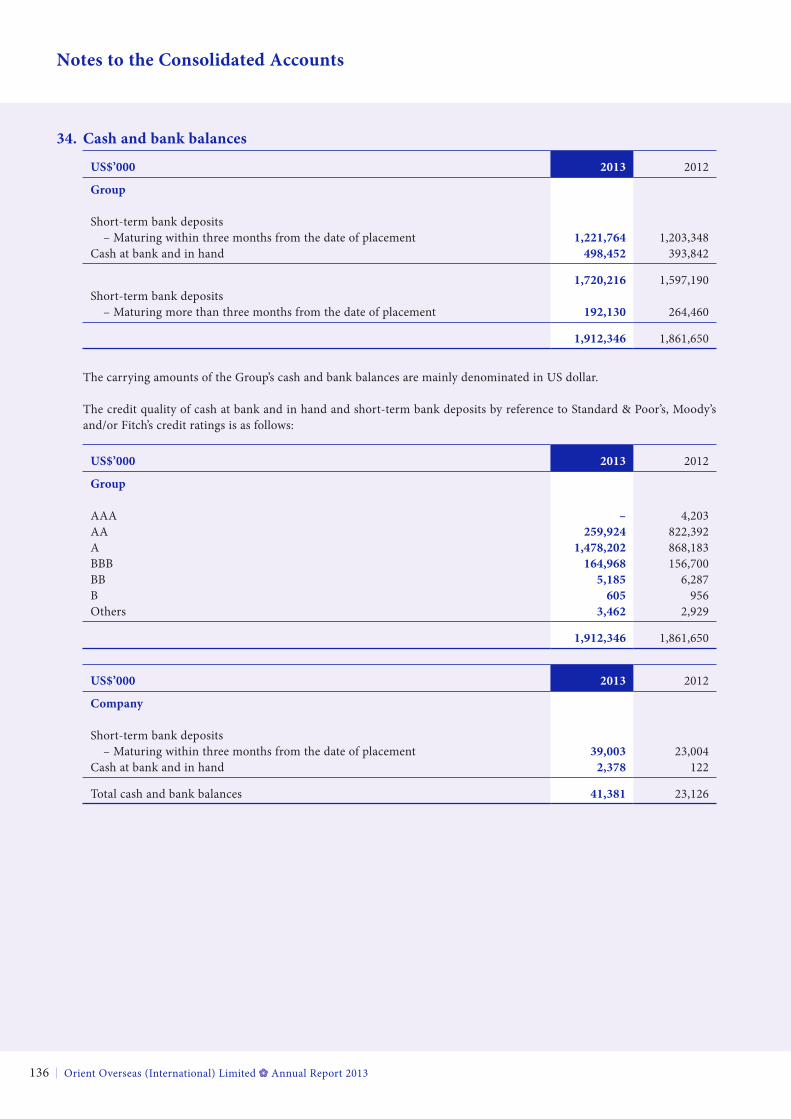
Orient Overseas (International) Limited Annual Report 2013136
Notes to the Consolidated Accounts
34. Cash and bank balances
US$’000 2013 2012
Group
Short-term bank deposits – Maturing within three months from the date of placement 1,221,764 1,203,348Cash at bank and in hand 498,452 393,842
1,720,216 1,597,190Short-term bank deposits – Maturing more than three months from the date of placement 192,130 264,460
1,912,346 1,861,650
The carrying amounts of the Group’s cash and bank balances are mainly denominated in US dollar.
The credit quality of cash at bank and in hand and short-term bank deposits by reference to Standard & Poor’s, Moody’s and/or Fitch’s credit ratings is as follows:
US$’000 2013 2012
Group
AAA – 4,203AA 259,924 822,392A 1,478,202 868,183BBB 164,968 156,700BB 5,185 6,287B 605 956Others 3,462 2,929
1,912,346 1,861,650
US$’000 2013 2012
Company
Short-term bank deposits – Maturing within three months from the date of placement 39,003 23,004Cash at bank and in hand 2,378 122
Total cash and bank balances 41,381 23,126
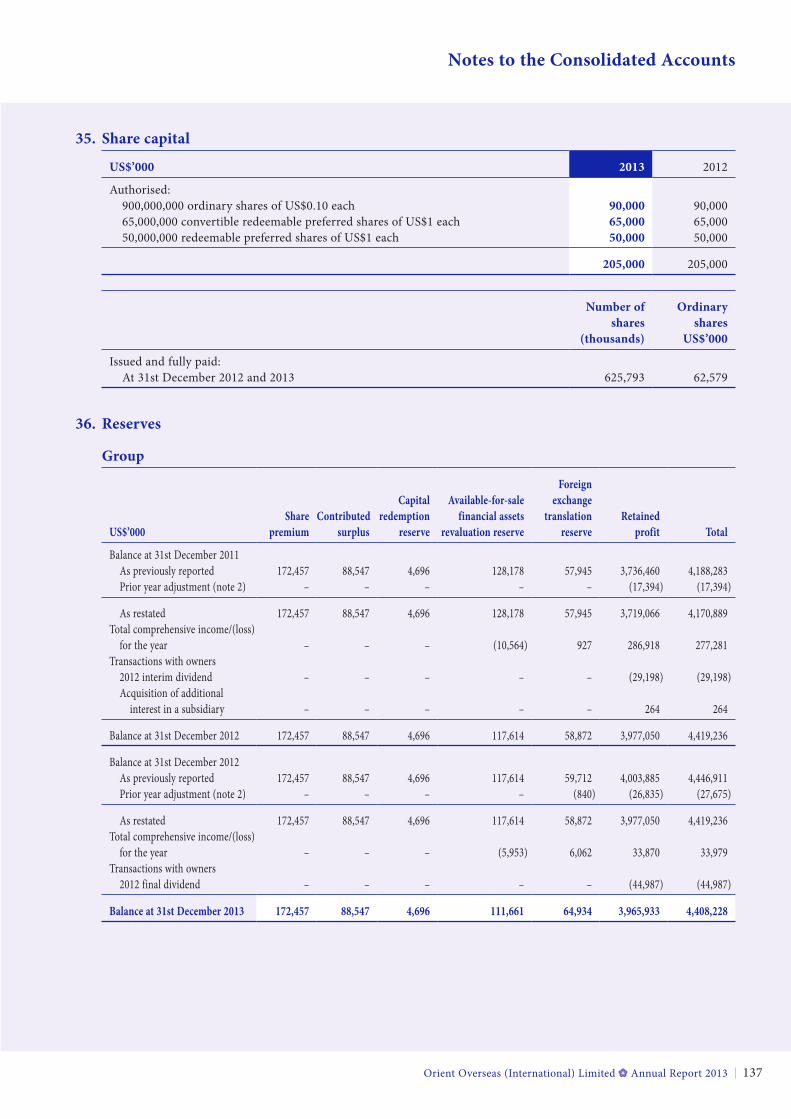
Orient Overseas (International) Limited Annual Report 2013 137
Notes to the Consolidated Accounts
35. Share capital
US$’000 2013 2012
Authorised: 900,000,000 ordinary shares of US$0.10 each 90,000 90,000 65,000,000 convertible redeemable preferred shares of US$1 each 65,000 65,000 50,000,000 redeemable preferred shares of US$1 each 50,000 50,000
205,000 205,000
Number of shares
(thousands)
ordinary shares
US$’000
Issued and fully paid: At 31st December 2012 and 2013 625,793 62,579
36. reserves
Group
US$’000Share
premiumContributed
surplus
Capitalredemption
reserve
available-for-salefinancial assets
revaluation reserve
foreignexchange
translationreserve
retainedprofit total
Balance at 31st December 2011 As previously reported 172,457 88,547 4,696 128,178 57,945 3,736,460 4,188,283 Prior year adjustment (note 2) – – – – – (17,394) (17,394)
As restated 172,457 88,547 4,696 128,178 57,945 3,719,066 4,170,889Total comprehensive income/(loss) for the year – – – (10,564) 927 286,918 277,281Transactions with owners 2012 interim dividend – – – – – (29,198) (29,198) Acquisition of additional interest in a subsidiary – – – – – 264 264
Balance at 31st December 2012 172,457 88,547 4,696 117,614 58,872 3,977,050 4,419,236
Balance at 31st December 2012 As previously reported 172,457 88,547 4,696 117,614 59,712 4,003,885 4,446,911 Prior year adjustment (note 2) – – – – (840) (26,835) (27,675)
As restated 172,457 88,547 4,696 117,614 58,872 3,977,050 4,419,236Total comprehensive income/(loss) for the year – – – (5,953) 6,062 33,870 33,979Transactions with owners 2012 final dividend – – – – – (44,987) (44,987)
Balance at 31st December 2013 172,457 88,547 4,696 111,661 64,934 3,965,933 4,408,228
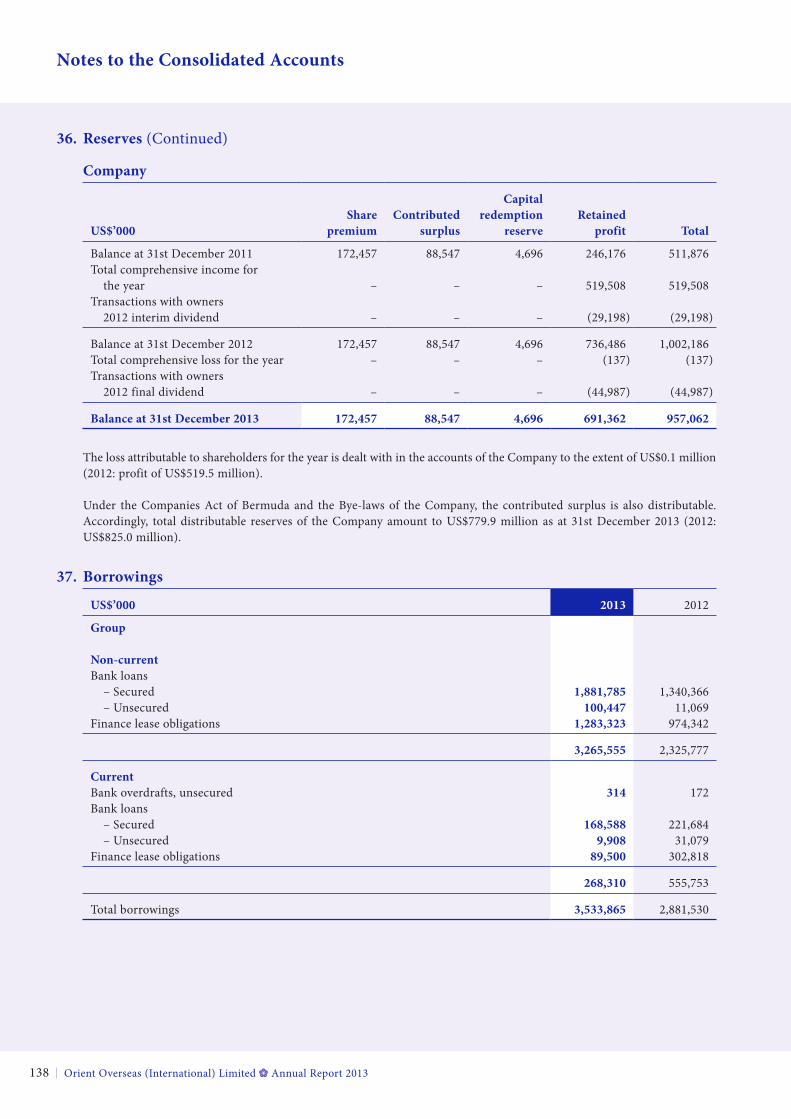
Orient Overseas (International) Limited Annual Report 2013138
Notes to the Consolidated Accounts
36. reserves (Continued)
Company
US$’000Share
premiumContributed
surplus
Capitalredemption
reserveretained
profit total
Balance at 31st December 2011 172,457 88,547 4,696 246,176 511,876Total comprehensive income for the year – – – 519,508 519,508Transactions with owners 2012 interim dividend – – – (29,198) (29,198)
Balance at 31st December 2012 172,457 88,547 4,696 736,486 1,002,186Total comprehensive loss for the year – – – (137) (137)Transactions with owners 2012 final dividend – – – (44,987) (44,987)
Balance at 31st December 2013 172,457 88,547 4,696 691,362 957,062
The loss attributable to shareholders for the year is dealt with in the accounts of the Company to the extent of US$0.1 million (2012: profit of US$519.5 million).
Under the Companies Act of Bermuda and the Bye-laws of the Company, the contributed surplus is also distributable. Accordingly, total distributable reserves of the Company amount to US$779.9 million as at 31st December 2013 (2012: US$825.0 million).
37. Borrowings
US$’000 2013 2012
Group
Non-currentBank loans – Secured 1,881,785 1,340,366 – Unsecured 100,447 11,069Finance lease obligations 1,283,323 974,342
3,265,555 2,325,777
CurrentBank overdrafts, unsecured 314 172Bank loans – Secured 168,588 221,684 – Unsecured 9,908 31,079Finance lease obligations 89,500 302,818
268,310 555,753
Total borrowings 3,533,865 2,881,530
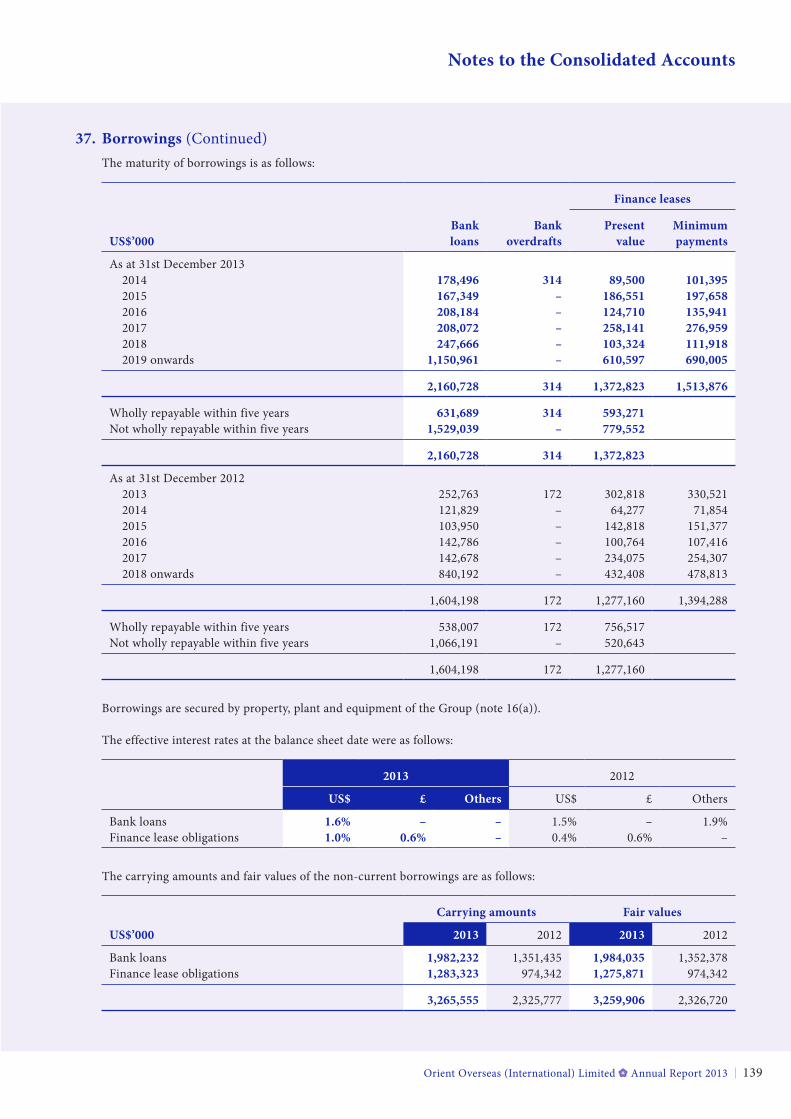
Orient Overseas (International) Limited Annual Report 2013 139
Notes to the Consolidated Accounts
37. Borrowings (Continued)The maturity of borrowings is as follows:
finance leases
Bank Bank present MinimumUS$’000 loans overdrafts value payments
As at 31st December 2013 2014 178,496 314 89,500 101,395 2015 167,349 – 186,551 197,658 2016 208,184 – 124,710 135,941 2017 208,072 – 258,141 276,959 2018 247,666 – 103,324 111,918 2019 onwards 1,150,961 – 610,597 690,005
2,160,728 314 1,372,823 1,513,876
Wholly repayable within five years 631,689 314 593,271Not wholly repayable within five years 1,529,039 – 779,552
2,160,728 314 1,372,823
As at 31st December 2012 2013 252,763 172 302,818 330,521 2014 121,829 – 64,277 71,854 2015 103,950 – 142,818 151,377 2016 142,786 – 100,764 107,416 2017 142,678 – 234,075 254,307 2018 onwards 840,192 – 432,408 478,813
1,604,198 172 1,277,160 1,394,288
Wholly repayable within five years 538,007 172 756,517Not wholly repayable within five years 1,066,191 – 520,643
1,604,198 172 1,277,160
Borrowings are secured by property, plant and equipment of the Group (note 16(a)).
The effective interest rates at the balance sheet date were as follows:
2013 2012
US$ £ others US$ £ Others
Bank loans 1.6% – – 1.5% – 1.9%Finance lease obligations 1.0% 0.6% – 0.4% 0.6% –
The carrying amounts and fair values of the non-current borrowings are as follows:
Carrying amounts fair values
US$’000 2013 2012 2013 2012
Bank loans 1,982,232 1,351,435 1,984,035 1,352,378Finance lease obligations 1,283,323 974,342 1,275,871 974,342
3,265,555 2,325,777 3,259,906 2,326,720
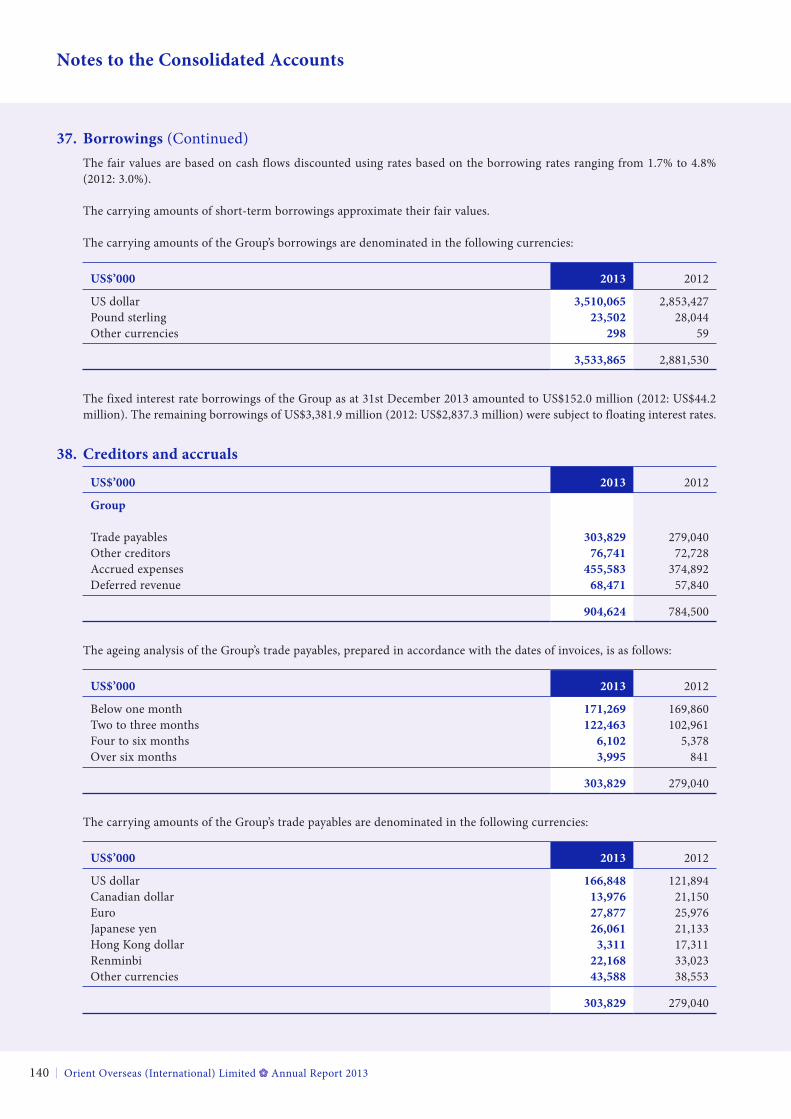
Orient Overseas (International) Limited Annual Report 2013140
Notes to the Consolidated Accounts
37. Borrowings (Continued)The fair values are based on cash flows discounted using rates based on the borrowing rates ranging from 1.7% to 4.8% (2012: 3.0%).
The carrying amounts of short-term borrowings approximate their fair values.
The carrying amounts of the Group’s borrowings are denominated in the following currencies:
US$’000 2013 2012
US dollar 3,510,065 2,853,427Pound sterling 23,502 28,044Other currencies 298 59
3,533,865 2,881,530
The fixed interest rate borrowings of the Group as at 31st December 2013 amounted to US$152.0 million (2012: US$44.2 million). The remaining borrowings of US$3,381.9 million (2012: US$2,837.3 million) were subject to floating interest rates.
38. Creditors and accruals
US$’000 2013 2012
Group
Trade payables 303,829 279,040Other creditors 76,741 72,728Accrued expenses 455,583 374,892Deferred revenue 68,471 57,840
904,624 784,500
The ageing analysis of the Group’s trade payables, prepared in accordance with the dates of invoices, is as follows:
US$’000 2013 2012
Below one month 171,269 169,860Two to three months 122,463 102,961Four to six months 6,102 5,378Over six months 3,995 841
303,829 279,040
The carrying amounts of the Group’s trade payables are denominated in the following currencies:
US$’000 2013 2012
US dollar 166,848 121,894Canadian dollar 13,976 21,150Euro 27,877 25,976Japanese yen 26,061 21,133Hong Kong dollar 3,311 17,311Renminbi 22,168 33,023Other currencies 43,588 38,553
303,829 279,040
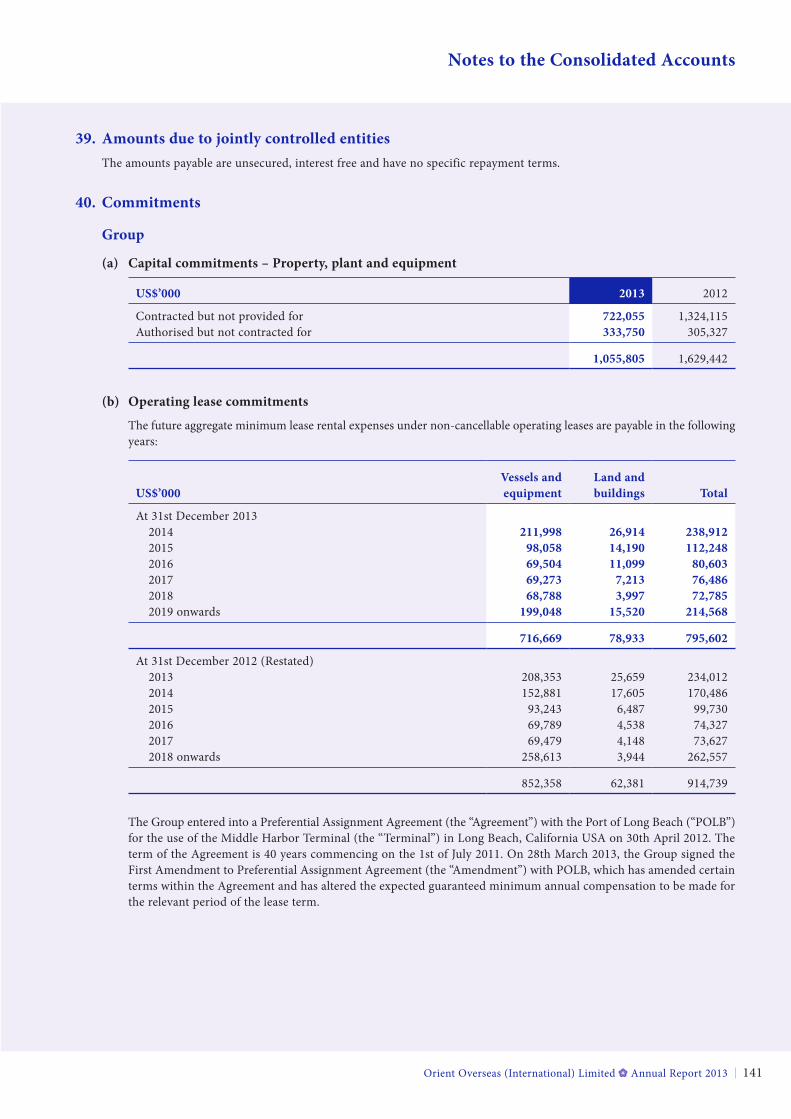
Orient Overseas (International) Limited Annual Report 2013 141
Notes to the Consolidated Accounts
39. amounts due to jointly controlled entitiesThe amounts payable are unsecured, interest free and have no specific repayment terms.
40. Commitments
Group
(a) Capital commitments – property, plant and equipment
US$’000 2013 2012
Contracted but not provided for 722,055 1,324,115Authorised but not contracted for 333,750 305,327
1,055,805 1,629,442
(b) operating lease commitments
The future aggregate minimum lease rental expenses under non-cancellable operating leases are payable in the following years:
Vessels and land andUS$’000 equipment buildings total
At 31st December 2013 2014 211,998 26,914 238,912 2015 98,058 14,190 112,248 2016 69,504 11,099 80,603 2017 69,273 7,213 76,486 2018 68,788 3,997 72,785 2019 onwards 199,048 15,520 214,568
716,669 78,933 795,602
At 31st December 2012 (Restated) 2013 208,353 25,659 234,012 2014 152,881 17,605 170,486 2015 93,243 6,487 99,730 2016 69,789 4,538 74,327 2017 69,479 4,148 73,627 2018 onwards 258,613 3,944 262,557
852,358 62,381 914,739
The Group entered into a Preferential Assignment Agreement (the “Agreement”) with the Port of Long Beach (“POLB”) for the use of the Middle Harbor Terminal (the “Terminal”) in Long Beach, California USA on 30th April 2012. The term of the Agreement is 40 years commencing on the 1st of July 2011. On 28th March 2013, the Group signed the First Amendment to Preferential Assignment Agreement (the “Amendment”) with POLB, which has amended certain terms within the Agreement and has altered the expected guaranteed minimum annual compensation to be made for the relevant period of the lease term.
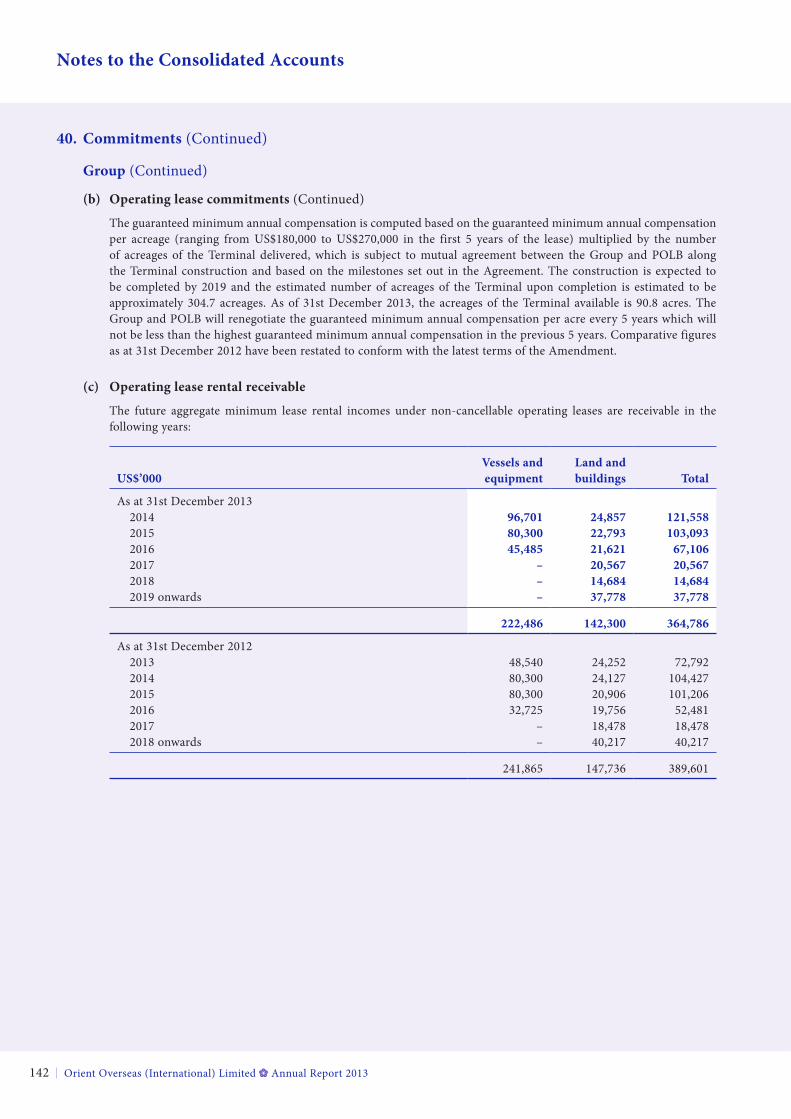
Orient Overseas (International) Limited Annual Report 2013142
Notes to the Consolidated Accounts
40. Commitments (Continued)
Group (Continued)
(b) operating lease commitments (Continued)
The guaranteed minimum annual compensation is computed based on the guaranteed minimum annual compensation per acreage (ranging from US$180,000 to US$270,000 in the first 5 years of the lease) multiplied by the number of acreages of the Terminal delivered, which is subject to mutual agreement between the Group and POLB along the Terminal construction and based on the milestones set out in the Agreement. The construction is expected to be completed by 2019 and the estimated number of acreages of the Terminal upon completion is estimated to be approximately 304.7 acreages. As of 31st December 2013, the acreages of the Terminal available is 90.8 acres. The Group and POLB will renegotiate the guaranteed minimum annual compensation per acre every 5 years which will not be less than the highest guaranteed minimum annual compensation in the previous 5 years. Comparative figures as at 31st December 2012 have been restated to conform with the latest terms of the Amendment.
(c) operating lease rental receivable
The future aggregate minimum lease rental incomes under non-cancellable operating leases are receivable in the following years:
Vessels and land andUS$’000 equipment buildings total
As at 31st December 2013 2014 96,701 24,857 121,558 2015 80,300 22,793 103,093 2016 45,485 21,621 67,106 2017 – 20,567 20,567 2018 – 14,684 14,684 2019 onwards – 37,778 37,778
222,486 142,300 364,786
As at 31st December 2012 2013 48,540 24,252 72,792 2014 80,300 24,127 104,427 2015 80,300 20,906 101,206 2016 32,725 19,756 52,481 2017 – 18,478 18,478 2018 onwards – 40,217 40,217
241,865 147,736 389,601
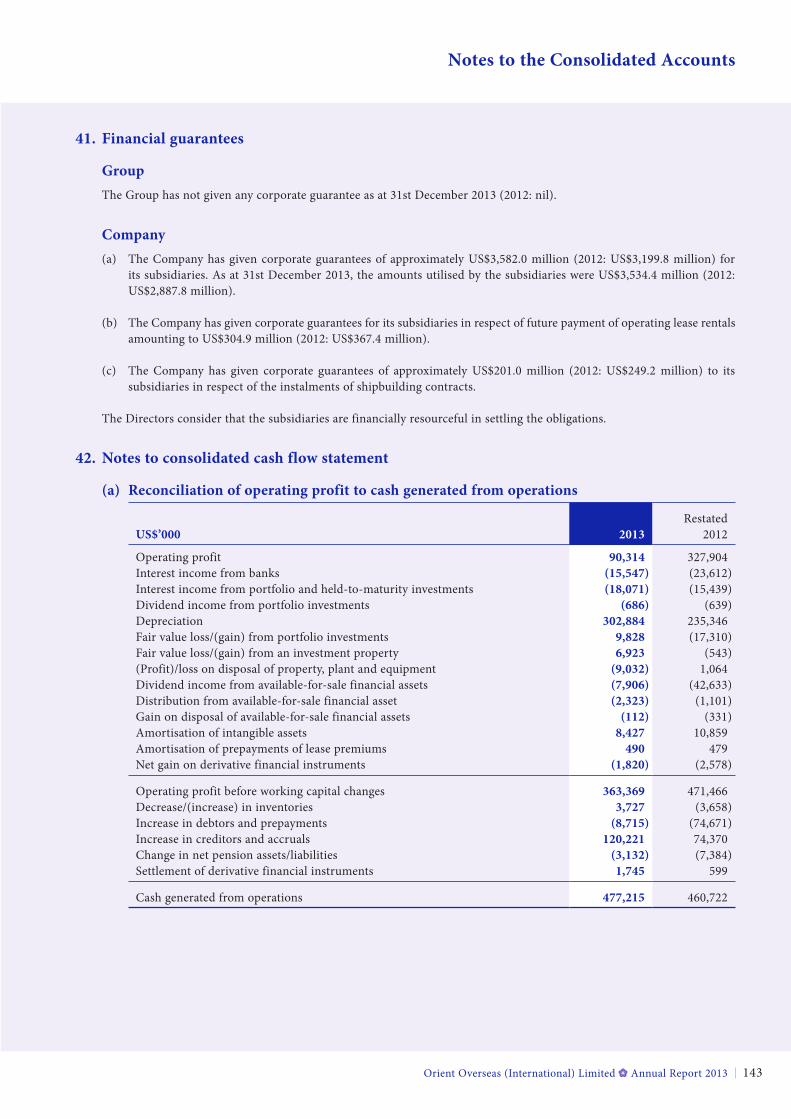
Orient Overseas (International) Limited Annual Report 2013 143
Notes to the Consolidated Accounts
41. financial guarantees
GroupThe Group has not given any corporate guarantee as at 31st December 2013 (2012: nil).
Company(a) The Company has given corporate guarantees of approximately US$3,582.0 million (2012: US$3,199.8 million) for
its subsidiaries. As at 31st December 2013, the amounts utilised by the subsidiaries were US$3,534.4 million (2012: US$2,887.8 million).
(b) The Company has given corporate guarantees for its subsidiaries in respect of future payment of operating lease rentals amounting to US$304.9 million (2012: US$367.4 million).
(c) The Company has given corporate guarantees of approximately US$201.0 million (2012: US$249.2 million) to its subsidiaries in respect of the instalments of shipbuilding contracts.
The Directors consider that the subsidiaries are financially resourceful in settling the obligations.
42. Notes to consolidated cash flow statement
(a) reconciliation of operating profit to cash generated from operations
RestatedUS$’000 2013 2012
Operating profit 90,314 327,904Interest income from banks (15,547) (23,612)Interest income from portfolio and held-to-maturity investments (18,071) (15,439)Dividend income from portfolio investments (686) (639)Depreciation 302,884 235,346Fair value loss/(gain) from portfolio investments 9,828 (17,310)Fair value loss/(gain) from an investment property 6,923 (543)(Profit)/loss on disposal of property, plant and equipment (9,032) 1,064Dividend income from available-for-sale financial assets (7,906) (42,633)Distribution from available-for-sale financial asset (2,323) (1,101)Gain on disposal of available-for-sale financial assets (112) (331)Amortisation of intangible assets 8,427 10,859Amortisation of prepayments of lease premiums 490 479Net gain on derivative financial instruments (1,820) (2,578)
Operating profit before working capital changes 363,369 471,466Decrease/(increase) in inventories 3,727 (3,658)Increase in debtors and prepayments (8,715) (74,671)Increase in creditors and accruals 120,221 74,370Change in net pension assets/liabilities (3,132) (7,384)Settlement of derivative financial instruments 1,745 599
Cash generated from operations 477,215 460,722
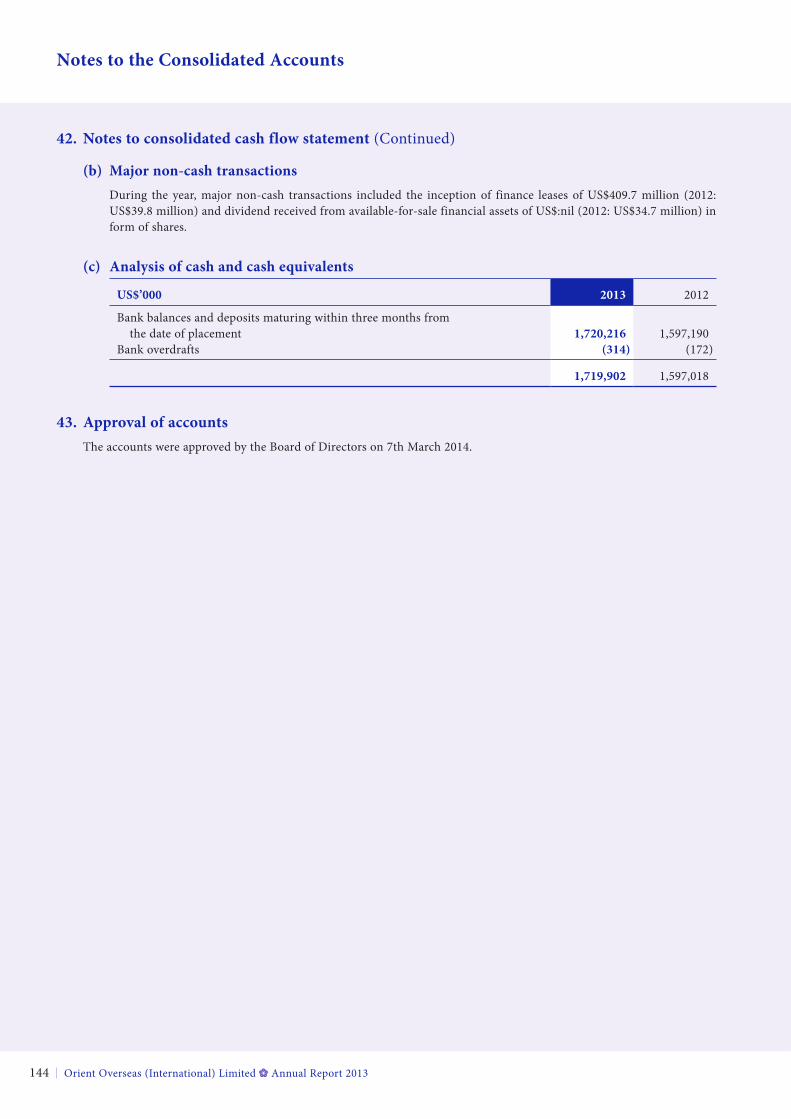
Orient Overseas (International) Limited Annual Report 2013144
Notes to the Consolidated Accounts
42. Notes to consolidated cash flow statement (Continued)
(b) Major non-cash transactionsDuring the year, major non-cash transactions included the inception of finance leases of US$409.7 million (2012: US$39.8 million) and dividend received from available-for-sale financial assets of US$:nil (2012: US$34.7 million) in form of shares.
(c) analysis of cash and cash equivalents
US$’000 2013 2012
Bank balances and deposits maturing within three months from the date of placement 1,720,216 1,597,190Bank overdrafts (314) (172)
1,719,902 1,597,018
43. approval of accountsThe accounts were approved by the Board of Directors on 7th March 2014.
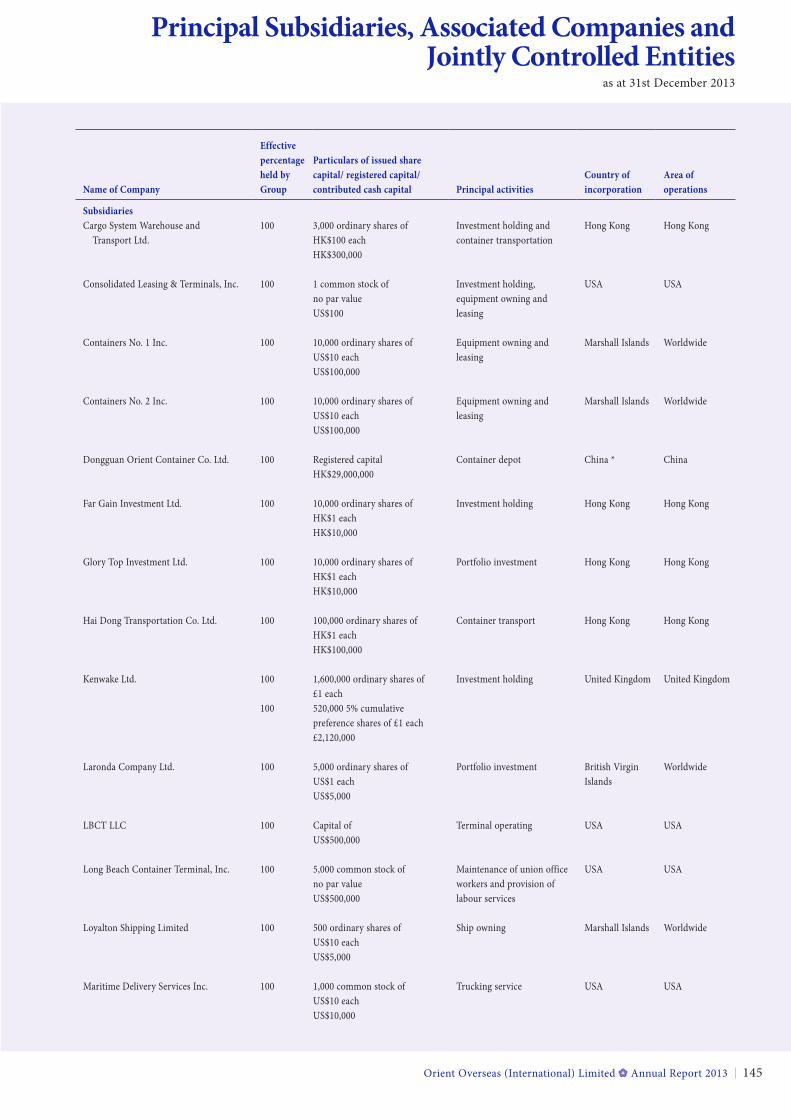
Orient Overseas (International) Limited Annual Report 2013 145
Principal Subsidiaries, Associated Companies and Jointly Controlled Entities
as at 31st December 2013
Name of Company
effective percentage held by Group
particulars of issued share capital/ registered capital/contributed cash capital principal activities
Country of incorporation
area of operations
Subsidiaries Cargo System Warehouse and Transport Ltd.
100 3,000 ordinary shares of HK$100 each HK$300,000
Investment holding and container transportation
Hong Kong Hong Kong
Consolidated Leasing & Terminals, Inc. 100 1 common stock of no par value US$100
Investment holding, equipment owning and leasing
USA USA
Containers No. 1 Inc. 100 10,000 ordinary shares of US$10 each US$100,000
Equipment owning and leasing
Marshall Islands Worldwide
Containers No. 2 Inc. 100 10,000 ordinary shares of US$10 each US$100,000
Equipment owning and leasing
Marshall Islands Worldwide
Dongguan Orient Container Co. Ltd. 100 Registered capital HK$29,000,000
Container depot China * China
Far Gain Investment Ltd. 100 10,000 ordinary shares of HK$1 each HK$10,000
Investment holding Hong Kong Hong Kong
Glory Top Investment Ltd. 100 10,000 ordinary shares of HK$1 each HK$10,000
Portfolio investment Hong Kong Hong Kong
Hai Dong Transportation Co. Ltd. 100 100,000 ordinary shares of HK$1 each HK$100,000
Container transport Hong Kong Hong Kong
Kenwake Ltd. 100 1,600,000 ordinary shares of £1 each
Investment holding United Kingdom United Kingdom
100 520,000 5% cumulative preference shares of £1 each £2,120,000
Laronda Company Ltd. 100 5,000 ordinary shares of US$1 each US$5,000
Portfolio investment British Virgin Islands
Worldwide
LBCT LLC 100 Capital of US$500,000
Terminal operating USA USA
Long Beach Container Terminal, Inc. 100 5,000 common stock of no par value US$500,000
Maintenance of union office workers and provision of labour services
USA USA
Loyalton Shipping Limited 100 500 ordinary shares of US$10 each US$5,000
Ship owning Marshall Islands Worldwide
Maritime Delivery Services Inc. 100 1,000 common stock of US$10 each US$10,000
Trucking service USA USA
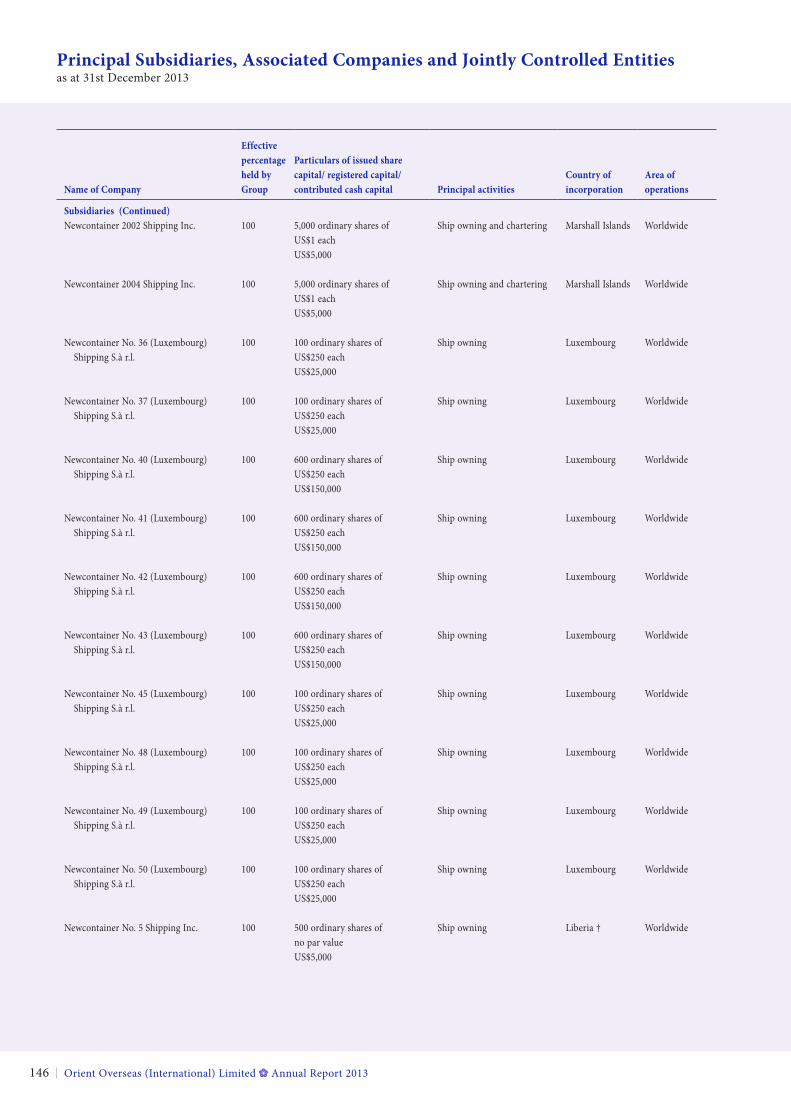
Orient Overseas (International) Limited Annual Report 2013146
Principal Subsidiaries, Associated Companies and Jointly Controlled Entitiesas at 31st December 2013
Name of Company
effective percentage held by Group
particulars of issued share capital/ registered capital/contributed cash capital principal activities
Country of incorporation
area of operations
Subsidiaries (Continued)Newcontainer 2002 Shipping Inc. 100 5,000 ordinary shares of
US$1 each US$5,000
Ship owning and chartering Marshall Islands Worldwide
Newcontainer 2004 Shipping Inc. 100 5,000 ordinary shares of US$1 each US$5,000
Ship owning and chartering Marshall Islands Worldwide
Newcontainer No. 36 (Luxembourg) Shipping S.à r.l.
100 100 ordinary shares of US$250 each US$25,000
Ship owning Luxembourg Worldwide
Newcontainer No. 37 (Luxembourg) Shipping S.à r.l.
100 100 ordinary shares of US$250 each US$25,000
Ship owning Luxembourg Worldwide
Newcontainer No. 40 (Luxembourg) Shipping S.à r.l.
100 600 ordinary shares of US$250 each US$150,000
Ship owning Luxembourg Worldwide
Newcontainer No. 41 (Luxembourg) Shipping S.à r.l.
100 600 ordinary shares of US$250 each US$150,000
Ship owning Luxembourg Worldwide
Newcontainer No. 42 (Luxembourg) Shipping S.à r.l.
100 600 ordinary shares of US$250 each US$150,000
Ship owning Luxembourg Worldwide
Newcontainer No. 43 (Luxembourg) Shipping S.à r.l.
100 600 ordinary shares of US$250 each US$150,000
Ship owning Luxembourg Worldwide
Newcontainer No. 45 (Luxembourg) Shipping S.à r.l.
100 100 ordinary shares of US$250 each US$25,000
Ship owning Luxembourg Worldwide
Newcontainer No. 48 (Luxembourg) Shipping S.à r.l.
100 100 ordinary shares of US$250 each US$25,000
Ship owning Luxembourg Worldwide
Newcontainer No. 49 (Luxembourg) Shipping S.à r.l.
100 100 ordinary shares of US$250 each US$25,000
Ship owning Luxembourg Worldwide
Newcontainer No. 50 (Luxembourg) Shipping S.à r.l.
100 100 ordinary shares of US$250 each US$25,000
Ship owning Luxembourg Worldwide
Newcontainer No. 5 Shipping Inc. 100 500 ordinary shares of no par value US$5,000
Ship owning Liberia † Worldwide
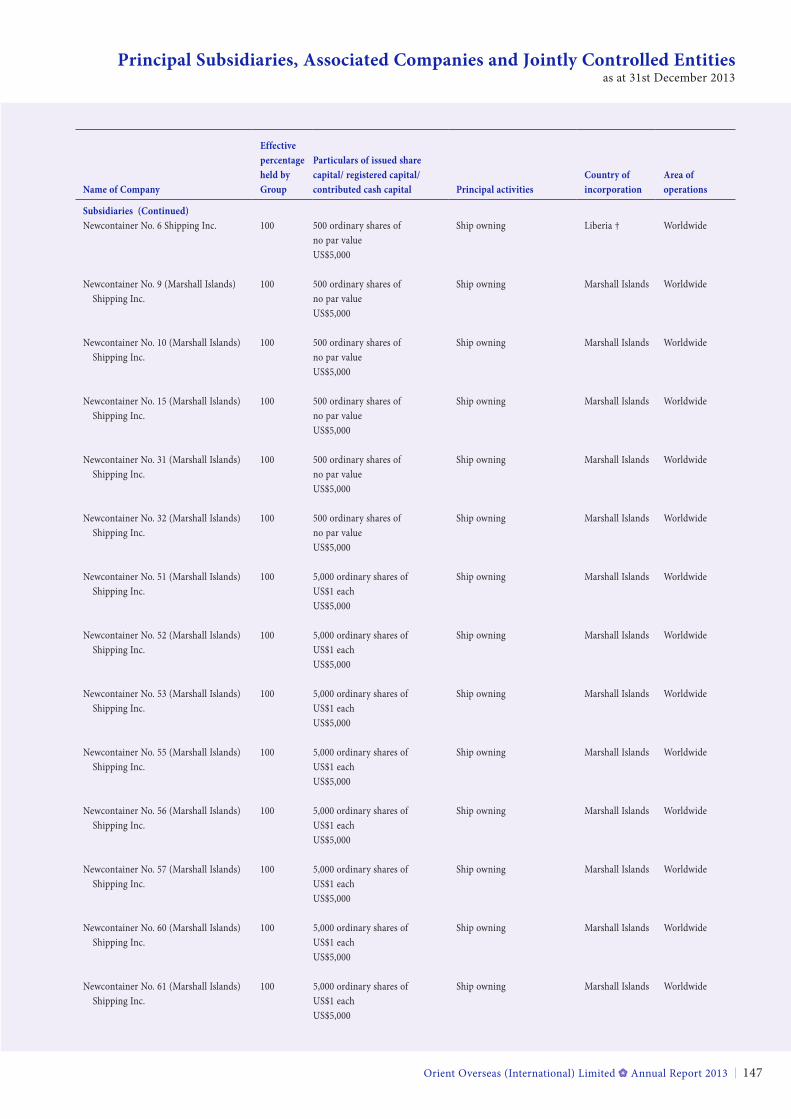
Orient Overseas (International) Limited Annual Report 2013 147
Principal Subsidiaries, Associated Companies and Jointly Controlled Entitiesas at 31st December 2013
Name of Company
effective percentage held by Group
particulars of issued share capital/ registered capital/contributed cash capital principal activities
Country of incorporation
area of operations
Subsidiaries (Continued)Newcontainer No. 6 Shipping Inc. 100 500 ordinary shares of
no par value US$5,000
Ship owning Liberia † Worldwide
Newcontainer No. 9 (Marshall Islands) Shipping Inc.
100 500 ordinary shares of no par value US$5,000
Ship owning Marshall Islands Worldwide
Newcontainer No. 10 (Marshall Islands) Shipping Inc.
100 500 ordinary shares of no par value US$5,000
Ship owning Marshall Islands Worldwide
Newcontainer No. 15 (Marshall Islands) Shipping Inc.
100 500 ordinary shares of no par value US$5,000
Ship owning Marshall Islands Worldwide
Newcontainer No. 31 (Marshall Islands) Shipping Inc.
100 500 ordinary shares of no par value US$5,000
Ship owning Marshall Islands Worldwide
Newcontainer No. 32 (Marshall Islands) Shipping Inc.
100 500 ordinary shares of no par value US$5,000
Ship owning Marshall Islands Worldwide
Newcontainer No. 51 (Marshall Islands) Shipping Inc.
100 5,000 ordinary shares of US$1 each US$5,000
Ship owning Marshall Islands Worldwide
Newcontainer No. 52 (Marshall Islands) Shipping Inc.
100 5,000 ordinary shares of US$1 each US$5,000
Ship owning Marshall Islands Worldwide
Newcontainer No. 53 (Marshall Islands) Shipping Inc.
100 5,000 ordinary shares of US$1 each US$5,000
Ship owning Marshall Islands Worldwide
Newcontainer No. 55 (Marshall Islands) Shipping Inc.
100 5,000 ordinary shares of US$1 each US$5,000
Ship owning Marshall Islands Worldwide
Newcontainer No. 56 (Marshall Islands) Shipping Inc.
100 5,000 ordinary shares of US$1 each US$5,000
Ship owning Marshall Islands Worldwide
Newcontainer No. 57 (Marshall Islands) Shipping Inc.
100 5,000 ordinary shares of US$1 each US$5,000
Ship owning Marshall Islands Worldwide
Newcontainer No. 60 (Marshall Islands) Shipping Inc.
100 5,000 ordinary shares of US$1 each US$5,000
Ship owning Marshall Islands Worldwide
Newcontainer No. 61 (Marshall Islands) Shipping Inc.
100 5,000 ordinary shares of US$1 each US$5,000
Ship owning Marshall Islands Worldwide
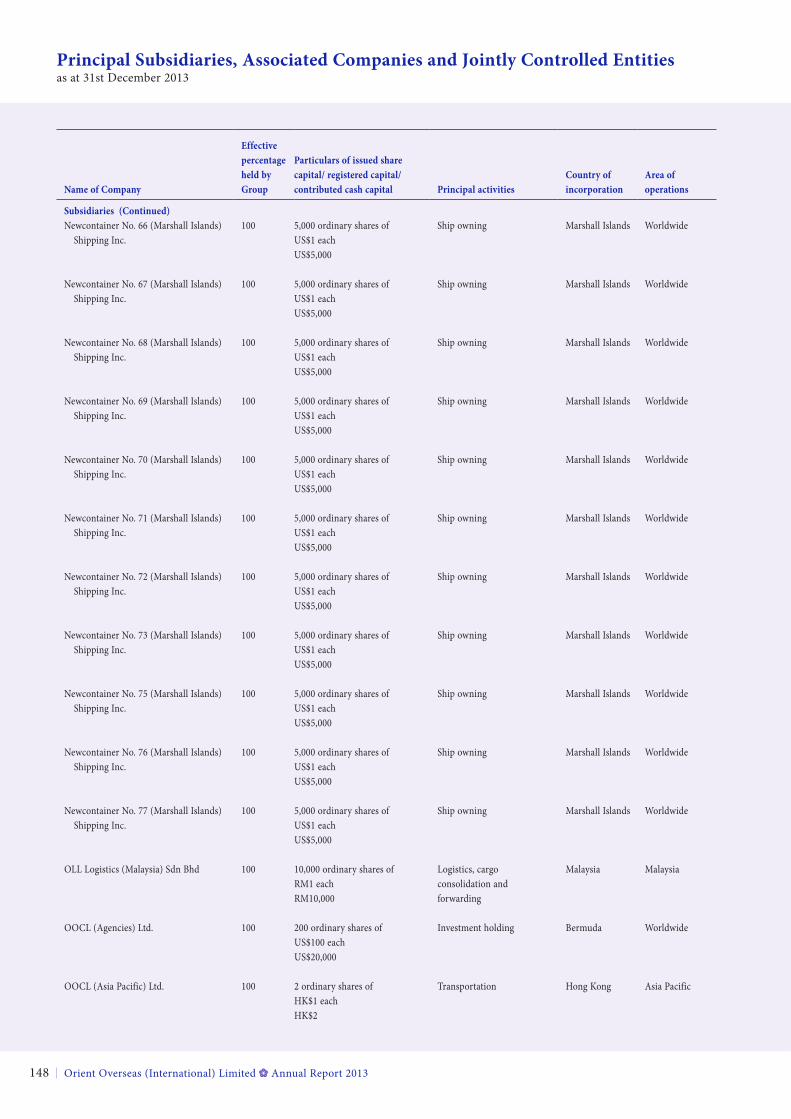
Orient Overseas (International) Limited Annual Report 2013148
Principal Subsidiaries, Associated Companies and Jointly Controlled Entitiesas at 31st December 2013
Name of Company
effective percentage held by Group
particulars of issued share capital/ registered capital/contributed cash capital principal activities
Country of incorporation
area of operations
Subsidiaries (Continued)Newcontainer No. 66 (Marshall Islands) Shipping Inc.
100 5,000 ordinary shares of US$1 each US$5,000
Ship owning Marshall Islands Worldwide
Newcontainer No. 67 (Marshall Islands) Shipping Inc.
100 5,000 ordinary shares of US$1 each US$5,000
Ship owning Marshall Islands Worldwide
Newcontainer No. 68 (Marshall Islands) Shipping Inc.
100 5,000 ordinary shares of US$1 each US$5,000
Ship owning Marshall Islands Worldwide
Newcontainer No. 69 (Marshall Islands) Shipping Inc.
100 5,000 ordinary shares of US$1 each US$5,000
Ship owning Marshall Islands Worldwide
Newcontainer No. 70 (Marshall Islands) Shipping Inc.
100 5,000 ordinary shares of US$1 each US$5,000
Ship owning Marshall Islands Worldwide
Newcontainer No. 71 (Marshall Islands) Shipping Inc.
100 5,000 ordinary shares of US$1 each US$5,000
Ship owning Marshall Islands Worldwide
Newcontainer No. 72 (Marshall Islands) Shipping Inc.
100 5,000 ordinary shares of US$1 each US$5,000
Ship owning Marshall Islands Worldwide
Newcontainer No. 73 (Marshall Islands) Shipping Inc.
100 5,000 ordinary shares of US$1 each US$5,000
Ship owning Marshall Islands Worldwide
Newcontainer No. 75 (Marshall Islands) Shipping Inc.
100 5,000 ordinary shares of US$1 each US$5,000
Ship owning Marshall Islands Worldwide
Newcontainer No. 76 (Marshall Islands) Shipping Inc.
100 5,000 ordinary shares of US$1 eachUS$5,000
Ship owning Marshall Islands Worldwide
Newcontainer No. 77 (Marshall Islands) Shipping Inc.
100 5,000 ordinary shares of US$1 eachUS$5,000
Ship owning Marshall Islands Worldwide
OLL Logistics (Malaysia) Sdn Bhd 100 10,000 ordinary shares of RM1 each RM10,000
Logistics, cargo consolidation and forwarding
Malaysia Malaysia
OOCL (Agencies) Ltd. 100 200 ordinary shares of US$100 each US$20,000
Investment holding Bermuda Worldwide
OOCL (Asia Pacific) Ltd. 100 2 ordinary shares of HK$1 each HK$2
Transportation Hong Kong Asia Pacific
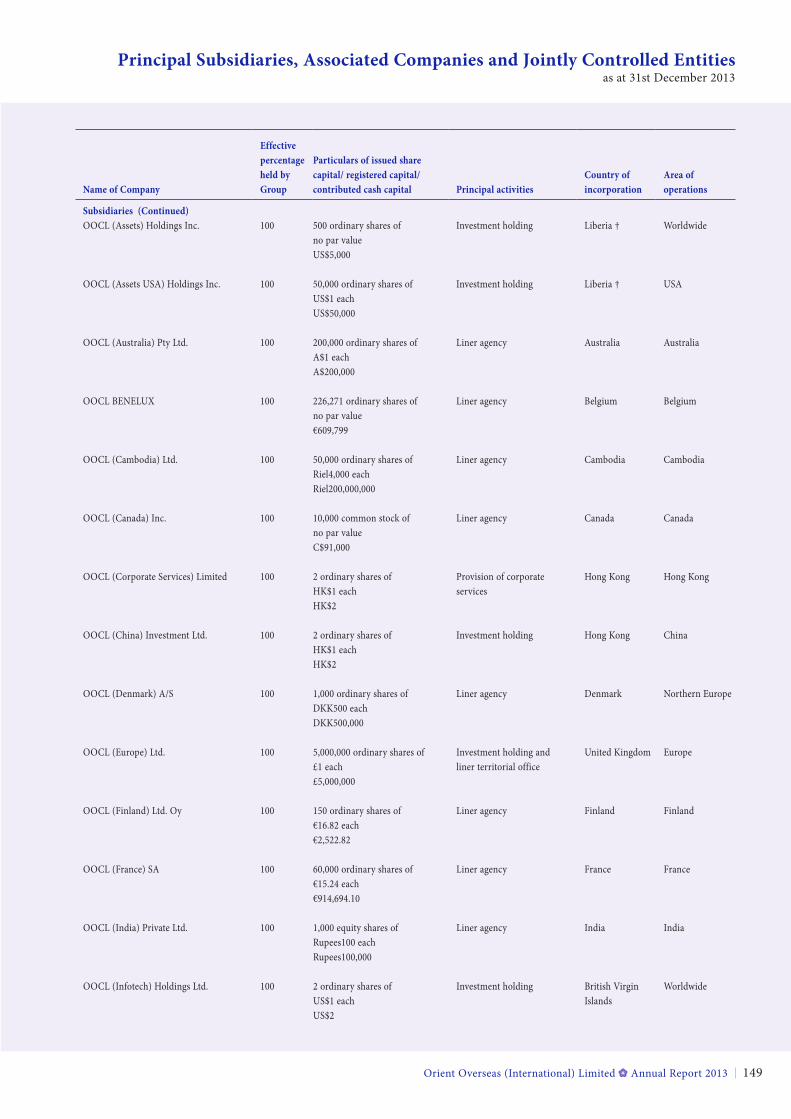
Orient Overseas (International) Limited Annual Report 2013 149
Principal Subsidiaries, Associated Companies and Jointly Controlled Entitiesas at 31st December 2013
Name of Company
effective percentage held by Group
particulars of issued share capital/ registered capital/contributed cash capital principal activities
Country of incorporation
area of operations
Subsidiaries (Continued)OOCL (Assets) Holdings Inc. 100 500 ordinary shares of
no par value US$5,000
Investment holding Liberia † Worldwide
OOCL (Assets USA) Holdings Inc. 100 50,000 ordinary shares of US$1 each US$50,000
Investment holding Liberia † USA
OOCL (Australia) Pty Ltd. 100 200,000 ordinary shares of A$1 each A$200,000
Liner agency Australia Australia
OOCL BENELUX 100 226,271 ordinary shares of no par value €609,799
Liner agency Belgium Belgium
OOCL (Cambodia) Ltd. 100 50,000 ordinary shares of Riel4,000 each Riel200,000,000
Liner agency Cambodia Cambodia
OOCL (Canada) Inc. 100 10,000 common stock of no par value C$91,000
Liner agency Canada Canada
OOCL (Corporate Services) Limited 100 2 ordinary shares of HK$1 each HK$2
Provision of corporate services
Hong Kong Hong Kong
OOCL (China) Investment Ltd. 100 2 ordinary shares of HK$1 each HK$2
Investment holding Hong Kong China
OOCL (Denmark) A/S 100 1,000 ordinary shares of DKK500 each DKK500,000
Liner agency Denmark Northern Europe
OOCL (Europe) Ltd. 100 5,000,000 ordinary shares of £1 each £5,000,000
Investment holding and liner territorial office
United Kingdom Europe
OOCL (Finland) Ltd. Oy 100 150 ordinary shares of €16.82 each €2,522.82
Liner agency Finland Finland
OOCL (France) SA 100 60,000 ordinary shares of €15.24 each €914,694.10
Liner agency France France
OOCL (India) Private Ltd. 100 1,000 equity shares of Rupees100 each Rupees100,000
Liner agency India India
OOCL (Infotech) Holdings Ltd. 100 2 ordinary shares of US$1 each US$2
Investment holding British Virgin Islands
Worldwide
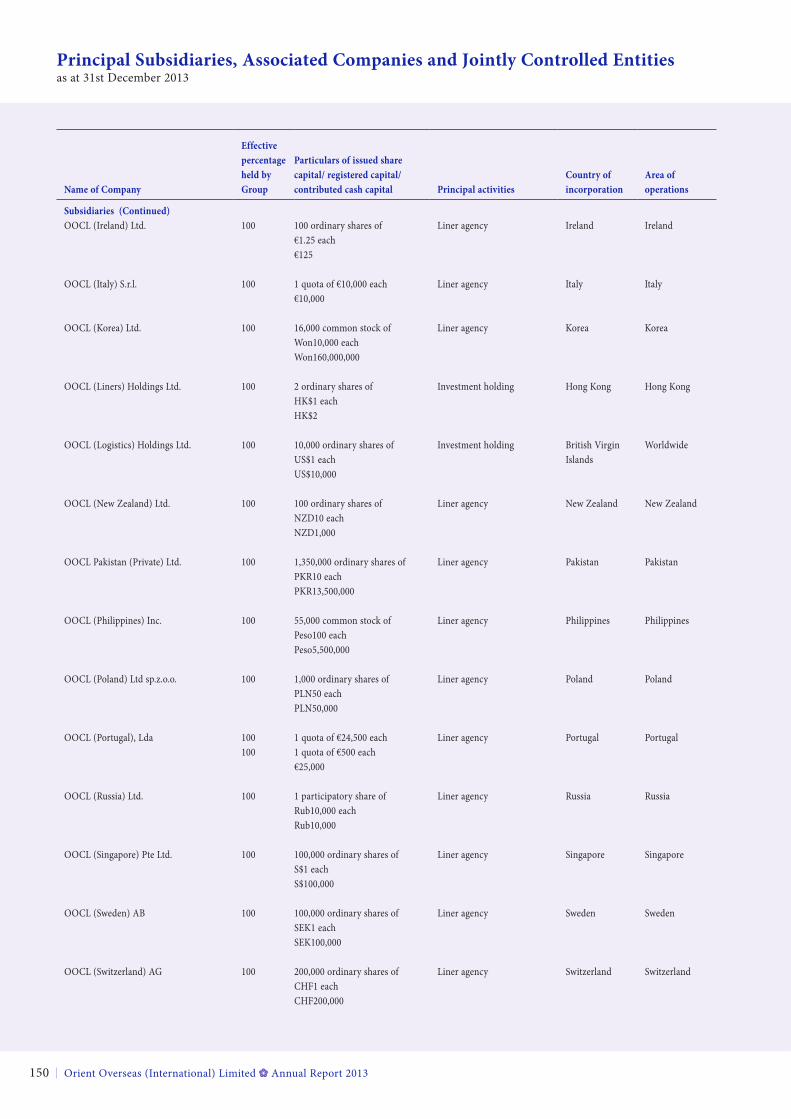
Orient Overseas (International) Limited Annual Report 2013150
Principal Subsidiaries, Associated Companies and Jointly Controlled Entitiesas at 31st December 2013
Name of Company
effective percentage held by Group
particulars of issued share capital/ registered capital/contributed cash capital principal activities
Country of incorporation
area of operations
Subsidiaries (Continued)OOCL (Ireland) Ltd. 100 100 ordinary shares of
€1.25 each €125
Liner agency Ireland Ireland
OOCL (Italy) S.r.l. 100 1 quota of €10,000 each €10,000
Liner agency Italy Italy
OOCL (Korea) Ltd. 100 16,000 common stock of Won10,000 each Won160,000,000
Liner agency Korea Korea
OOCL (Liners) Holdings Ltd. 100 2 ordinary shares of HK$1 each HK$2
Investment holding Hong Kong Hong Kong
OOCL (Logistics) Holdings Ltd. 100 10,000 ordinary shares of US$1 each US$10,000
Investment holding British Virgin Islands
Worldwide
OOCL (New Zealand) Ltd. 100 100 ordinary shares of NZD10 each NZD1,000
Liner agency New Zealand New Zealand
OOCL Pakistan (Private) Ltd. 100 1,350,000 ordinary shares of PKR10 each PKR13,500,000
Liner agency Pakistan Pakistan
OOCL (Philippines) Inc. 100 55,000 common stock of Peso100 each Peso5,500,000
Liner agency Philippines Philippines
OOCL (Poland) Ltd sp.z.o.o. 100 1,000 ordinary shares of PLN50 each PLN50,000
Liner agency Poland Poland
OOCL (Portugal), Lda 100 100
1 quota of €24,500 each 1 quota of €500 each €25,000
Liner agency Portugal Portugal
OOCL (Russia) Ltd. 100 1 participatory share of Rub10,000 each Rub10,000
Liner agency Russia Russia
OOCL (Singapore) Pte Ltd. 100 100,000 ordinary shares of S$1 each S$100,000
Liner agency Singapore Singapore
OOCL (Sweden) AB 100 100,000 ordinary shares of SEK1 each SEK100,000
Liner agency Sweden Sweden
OOCL (Switzerland) AG 100 200,000 ordinary shares of CHF1 each CHF200,000
Liner agency Switzerland Switzerland
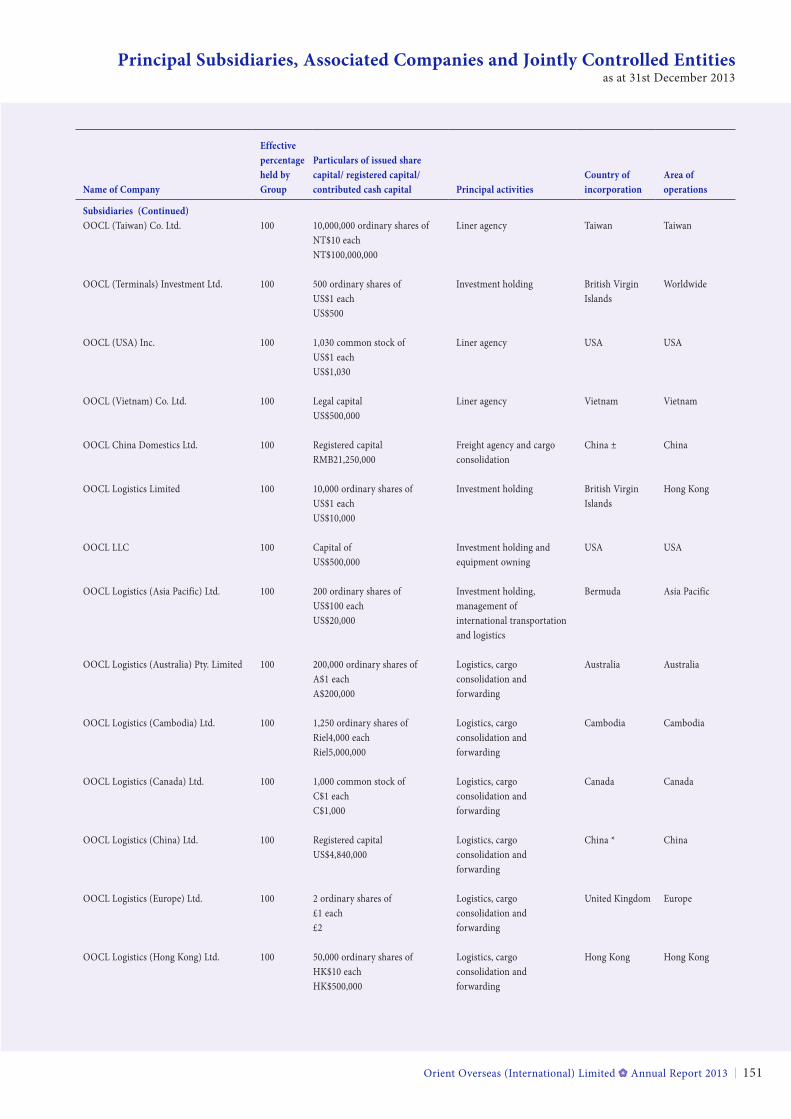
Orient Overseas (International) Limited Annual Report 2013 151
Principal Subsidiaries, Associated Companies and Jointly Controlled Entitiesas at 31st December 2013
Name of Company
effective percentage held by Group
particulars of issued share capital/ registered capital/contributed cash capital principal activities
Country of incorporation
area of operations
Subsidiaries (Continued)OOCL (Taiwan) Co. Ltd. 100 10,000,000 ordinary shares of
NT$10 each NT$100,000,000
Liner agency Taiwan Taiwan
OOCL (Terminals) Investment Ltd. 100 500 ordinary shares of US$1 each US$500
Investment holding British Virgin Islands
Worldwide
OOCL (USA) Inc. 100 1,030 common stock of US$1 each US$1,030
Liner agency USA USA
OOCL (Vietnam) Co. Ltd. 100 Legal capital US$500,000
Liner agency Vietnam Vietnam
OOCL China Domestics Ltd. 100 Registered capital RMB21,250,000
Freight agency and cargo consolidation
China ± China
OOCL Logistics Limited 100 10,000 ordinary shares of US$1 each US$10,000
Investment holding British Virgin Islands
Hong Kong
OOCL LLC 100 Capital of US$500,000
Investment holding and equipment owning
USA USA
OOCL Logistics (Asia Pacific) Ltd. 100 200 ordinary shares of US$100 each US$20,000
Investment holding, management of international transportation and logistics
Bermuda Asia Pacific
OOCL Logistics (Australia) Pty. Limited 100 200,000 ordinary shares of A$1 each A$200,000
Logistics, cargo consolidation and forwarding
Australia Australia
OOCL Logistics (Cambodia) Ltd. 100 1,250 ordinary shares of Riel4,000 each Riel5,000,000
Logistics, cargo consolidation and forwarding
Cambodia Cambodia
OOCL Logistics (Canada) Ltd. 100 1,000 common stock of C$1 each C$1,000
Logistics, cargo consolidation and forwarding
Canada Canada
OOCL Logistics (China) Ltd. 100 Registered capital US$4,840,000
Logistics, cargo consolidation and forwarding
China * China
OOCL Logistics (Europe) Ltd. 100 2 ordinary shares of £1 each £2
Logistics, cargo consolidation and forwarding
United Kingdom Europe
OOCL Logistics (Hong Kong) Ltd. 100 50,000 ordinary shares of HK$10 each HK$500,000
Logistics, cargo consolidation and forwarding
Hong Kong Hong Kong
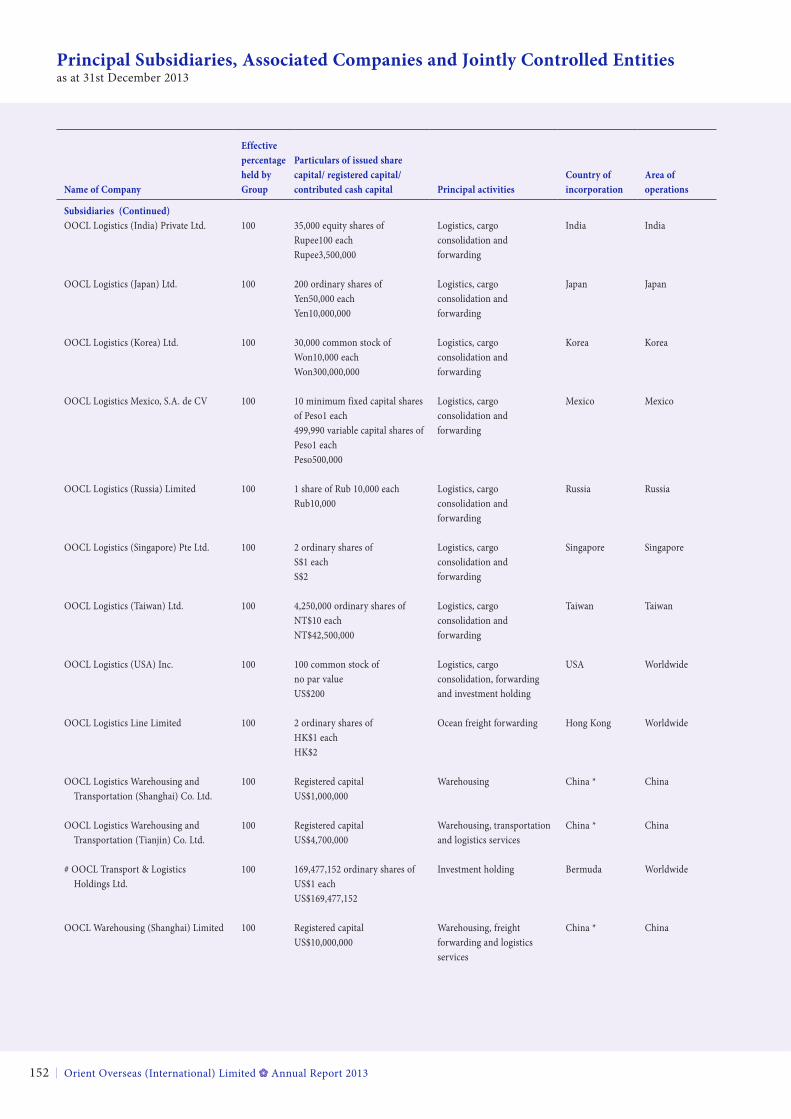
Orient Overseas (International) Limited Annual Report 2013152
Principal Subsidiaries, Associated Companies and Jointly Controlled Entitiesas at 31st December 2013
Name of Company
effective percentage held by Group
particulars of issued share capital/ registered capital/contributed cash capital principal activities
Country of incorporation
area of operations
Subsidiaries (Continued)OOCL Logistics (India) Private Ltd. 100 35,000 equity shares of
Rupee100 each Rupee3,500,000
Logistics, cargo consolidation and forwarding
India India
OOCL Logistics (Japan) Ltd. 100 200 ordinary shares of yen50,000 each yen10,000,000
Logistics, cargo consolidation and forwarding
Japan Japan
OOCL Logistics (Korea) Ltd. 100 30,000 common stock of Won10,000 each Won300,000,000
Logistics, cargo consolidation and forwarding
Korea Korea
OOCL Logistics Mexico, S.A. de CV 100 10 minimum fixed capital shares of Peso1 each 499,990 variable capital shares of Peso1 each Peso500,000
Logistics, cargo consolidation and forwarding
Mexico Mexico
OOCL Logistics (Russia) Limited 100 1 share of Rub 10,000 each Rub10,000
Logistics, cargo consolidation and forwarding
Russia Russia
OOCL Logistics (Singapore) Pte Ltd. 100 2 ordinary shares of S$1 each S$2
Logistics, cargo consolidation and forwarding
Singapore Singapore
OOCL Logistics (Taiwan) Ltd. 100 4,250,000 ordinary shares of NT$10 each NT$42,500,000
Logistics, cargo consolidation and forwarding
Taiwan Taiwan
OOCL Logistics (USA) Inc. 100 100 common stock of no par value US$200
Logistics, cargo consolidation, forwarding and investment holding
USA Worldwide
OOCL Logistics Line Limited 100 2 ordinary shares of HK$1 each HK$2
Ocean freight forwarding Hong Kong Worldwide
OOCL Logistics Warehousing and Transportation (Shanghai) Co. Ltd.
100 Registered capital US$1,000,000
Warehousing China * China
OOCL Logistics Warehousing and Transportation (Tianjin) Co. Ltd.
100 Registered capital US$4,700,000
Warehousing, transportation and logistics services
China * China
# OOCL Transport & Logistics Holdings Ltd.
100 169,477,152 ordinary shares of US$1 each US$169,477,152
Investment holding Bermuda Worldwide
OOCL Warehousing (Shanghai) Limited 100 Registered capital US$10,000,000
Warehousing, freight forwarding and logistics services
China * China
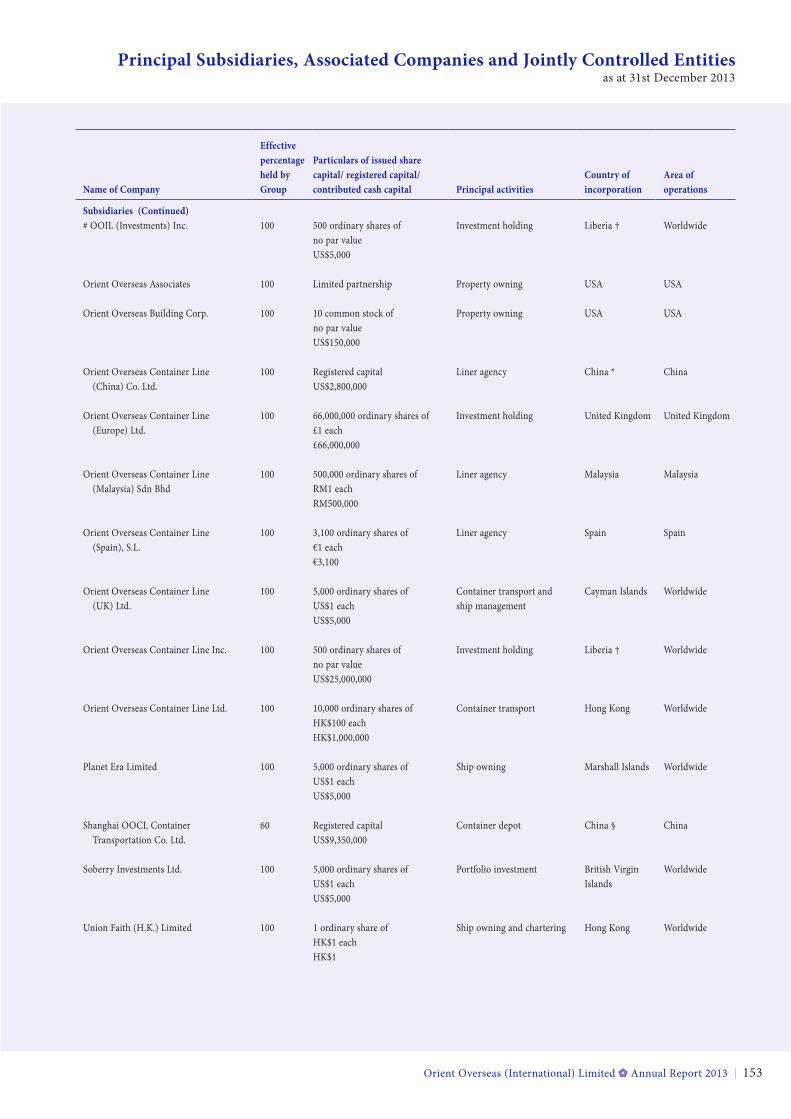
Orient Overseas (International) Limited Annual Report 2013 153
Principal Subsidiaries, Associated Companies and Jointly Controlled Entitiesas at 31st December 2013
Name of Company
effective percentage held by Group
particulars of issued share capital/ registered capital/contributed cash capital principal activities
Country of incorporation
area of operations
Subsidiaries (Continued)# OOIL (Investments) Inc. 100 500 ordinary shares of
no par value US$5,000
Investment holding Liberia † Worldwide
Orient Overseas Associates 100 Limited partnership Property owning USA USA
Orient Overseas Building Corp. 100 10 common stock of no par value US$150,000
Property owning USA USA
Orient Overseas Container Line (China) Co. Ltd.
100 Registered capital US$2,800,000
Liner agency China * China
Orient Overseas Container Line (Europe) Ltd.
100 66,000,000 ordinary shares of £1 each £66,000,000
Investment holding United Kingdom United Kingdom
Orient Overseas Container Line (Malaysia) Sdn Bhd
100 500,000 ordinary shares of RM1 each RM500,000
Liner agency Malaysia Malaysia
Orient Overseas Container Line (Spain), S.L.
100 3,100 ordinary shares of €1 each €3,100
Liner agency Spain Spain
Orient Overseas Container Line (UK) Ltd.
100 5,000 ordinary shares of US$1 each US$5,000
Container transport and ship management
Cayman Islands Worldwide
Orient Overseas Container Line Inc. 100 500 ordinary shares of no par value US$25,000,000
Investment holding Liberia † Worldwide
Orient Overseas Container Line Ltd. 100 10,000 ordinary shares of HK$100 each HK$1,000,000
Container transport Hong Kong Worldwide
Planet Era Limited 100 5,000 ordinary shares of US$1 each US$5,000
Ship owning Marshall Islands Worldwide
Shanghai OOCL Container Transportation Co. Ltd.
60 Registered capital US$9,350,000
Container depot China § China
Soberry Investments Ltd. 100 5,000 ordinary shares of US$1 each US$5,000
Portfolio investment British Virgin Islands
Worldwide
Union Faith (H.K.) Limited 100 1 ordinary share of HK$1 each HK$1
Ship owning and chartering Hong Kong Worldwide
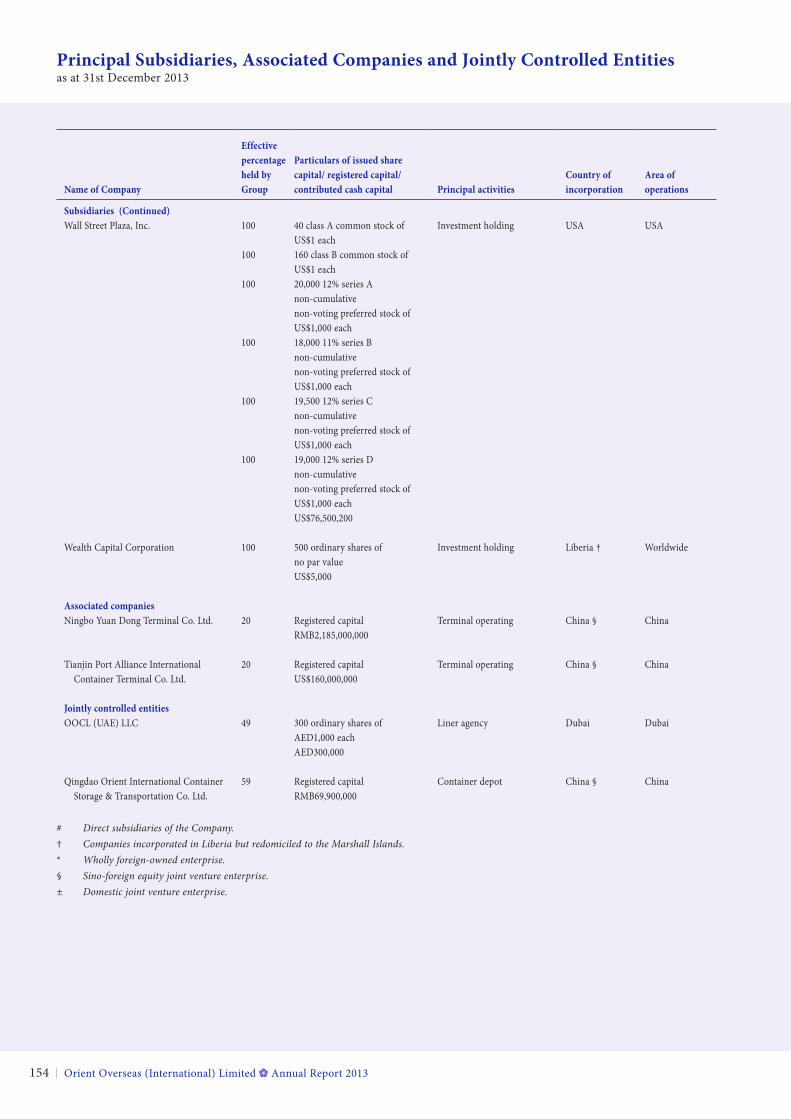
Orient Overseas (International) Limited Annual Report 2013154
Principal Subsidiaries, Associated Companies and Jointly Controlled Entitiesas at 31st December 2013
Name of Company
effective percentage held by Group
particulars of issued share capital/ registered capital/contributed cash capital principal activities
Country of incorporation
area of operations
Subsidiaries (Continued)Wall Street Plaza, Inc. 100 40 class A common stock of
US$1 eachInvestment holding USA USA
100 160 class B common stock of US$1 each
100 20,000 12% series A non-cumulative non-voting preferred stock of US$1,000 each
100 18,000 11% series B non-cumulative non-voting preferred stock of US$1,000 each
100 19,500 12% series C non-cumulative non-voting preferred stock of US$1,000 each
100 19,000 12% series D non-cumulative non-voting preferred stock of US$1,000 each US$76,500,200
Wealth Capital Corporation 100 500 ordinary shares of no par value US$5,000
Investment holding Liberia † Worldwide
associated companiesNingbo yuan Dong Terminal Co. Ltd. 20 Registered capital
RMB2,185,000,000Terminal operating China § China
Tianjin Port Alliance International Container Terminal Co. Ltd.
20 Registered capital US$160,000,000
Terminal operating China § China
jointly controlled entitiesOOCL (UAE) LLC 49 300 ordinary shares of
AED1,000 each AED300,000
Liner agency Dubai Dubai
Qingdao Orient International Container Storage & Transportation Co. Ltd.
59 Registered capital RMB69,900,000
Container depot China § China
# Direct subsidiaries of the Company.† Companies incorporated in Liberia but redomiciled to the Marshall Islands.* Wholly foreign-owned enterprise.§ Sino-foreign equity joint venture enterprise.± Domestic joint venture enterprise.
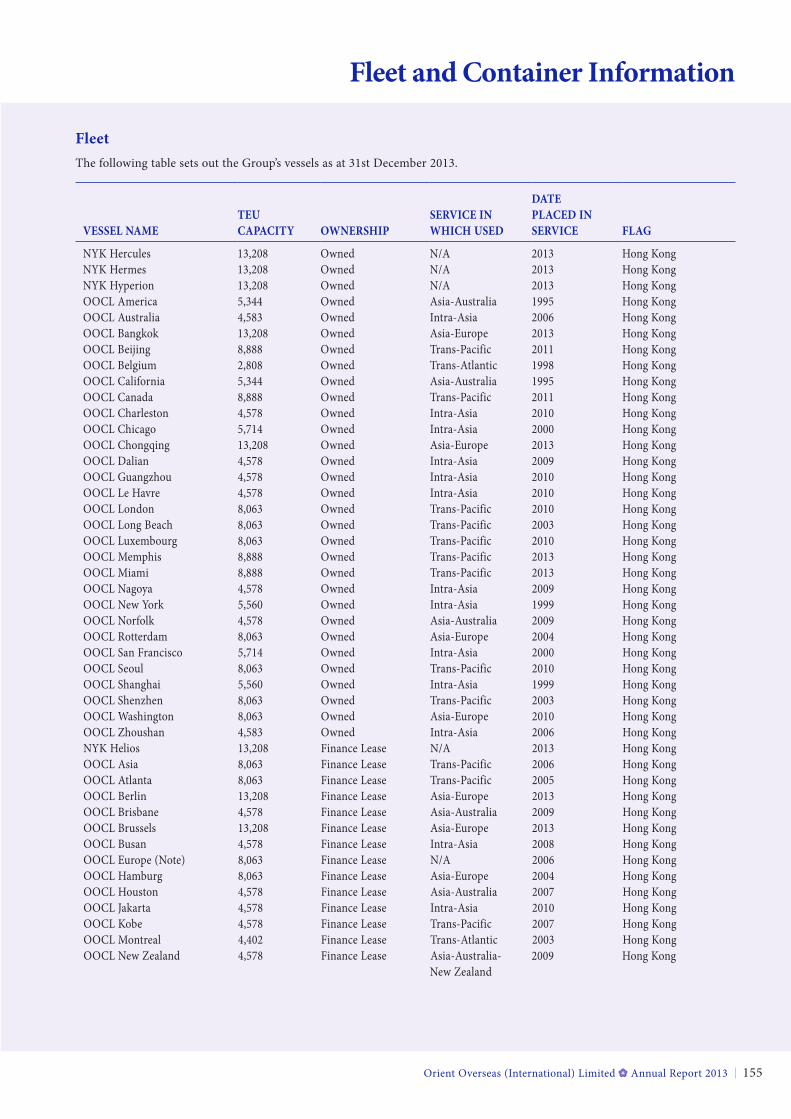
Orient Overseas (International) Limited Annual Report 2013 155
Fleet and Container Information
fleetThe following table sets out the Group’s vessels as at 31st December 2013.
VeSSel NaMeteU CapaCitY oWNerSHip
SerViCe iN WHiCH USeD
Date plaCeD iN SerViCe flaG
NyK Hercules 13,208 Owned N/A 2013 Hong KongNyK Hermes 13,208 Owned N/A 2013 Hong KongNyK Hyperion 13,208 Owned N/A 2013 Hong KongOOCL America 5,344 Owned Asia-Australia 1995 Hong KongOOCL Australia 4,583 Owned Intra-Asia 2006 Hong KongOOCL Bangkok 13,208 Owned Asia-Europe 2013 Hong KongOOCL Beijing 8,888 Owned Trans-Pacific 2011 Hong KongOOCL Belgium 2,808 Owned Trans-Atlantic 1998 Hong KongOOCL California 5,344 Owned Asia-Australia 1995 Hong KongOOCL Canada 8,888 Owned Trans-Pacific 2011 Hong KongOOCL Charleston 4,578 Owned Intra-Asia 2010 Hong KongOOCL Chicago 5,714 Owned Intra-Asia 2000 Hong KongOOCL Chongqing 13,208 Owned Asia-Europe 2013 Hong KongOOCL Dalian 4,578 Owned Intra-Asia 2009 Hong KongOOCL Guangzhou 4,578 Owned Intra-Asia 2010 Hong KongOOCL Le Havre 4,578 Owned Intra-Asia 2010 Hong KongOOCL London 8,063 Owned Trans-Pacific 2010 Hong KongOOCL Long Beach 8,063 Owned Trans-Pacific 2003 Hong KongOOCL Luxembourg 8,063 Owned Trans-Pacific 2010 Hong KongOOCL Memphis 8,888 Owned Trans-Pacific 2013 Hong KongOOCL Miami 8,888 Owned Trans-Pacific 2013 Hong KongOOCL Nagoya 4,578 Owned Intra-Asia 2009 Hong KongOOCL New york 5,560 Owned Intra-Asia 1999 Hong KongOOCL Norfolk 4,578 Owned Asia-Australia 2009 Hong KongOOCL Rotterdam 8,063 Owned Asia-Europe 2004 Hong KongOOCL San Francisco 5,714 Owned Intra-Asia 2000 Hong KongOOCL Seoul 8,063 Owned Trans-Pacific 2010 Hong KongOOCL Shanghai 5,560 Owned Intra-Asia 1999 Hong KongOOCL Shenzhen 8,063 Owned Trans-Pacific 2003 Hong KongOOCL Washington 8,063 Owned Asia-Europe 2010 Hong KongOOCL Zhoushan 4,583 Owned Intra-Asia 2006 Hong KongNyK Helios 13,208 Finance Lease N/A 2013 Hong KongOOCL Asia 8,063 Finance Lease Trans-Pacific 2006 Hong KongOOCL Atlanta 8,063 Finance Lease Trans-Pacific 2005 Hong KongOOCL Berlin 13,208 Finance Lease Asia-Europe 2013 Hong KongOOCL Brisbane 4,578 Finance Lease Asia-Australia 2009 Hong KongOOCL Brussels 13,208 Finance Lease Asia-Europe 2013 Hong KongOOCL Busan 4,578 Finance Lease Intra-Asia 2008 Hong KongOOCL Europe (Note) 8,063 Finance Lease N/A 2006 Hong KongOOCL Hamburg 8,063 Finance Lease Asia-Europe 2004 Hong KongOOCL Houston 4,578 Finance Lease Asia-Australia 2007 Hong KongOOCL Jakarta 4,578 Finance Lease Intra-Asia 2010 Hong KongOOCL Kobe 4,578 Finance Lease Trans-Pacific 2007 Hong KongOOCL Montreal 4,402 Finance Lease Trans-Atlantic 2003 Hong KongOOCL New Zealand 4,578 Finance Lease Asia-Australia-
New Zealand2009 Hong Kong
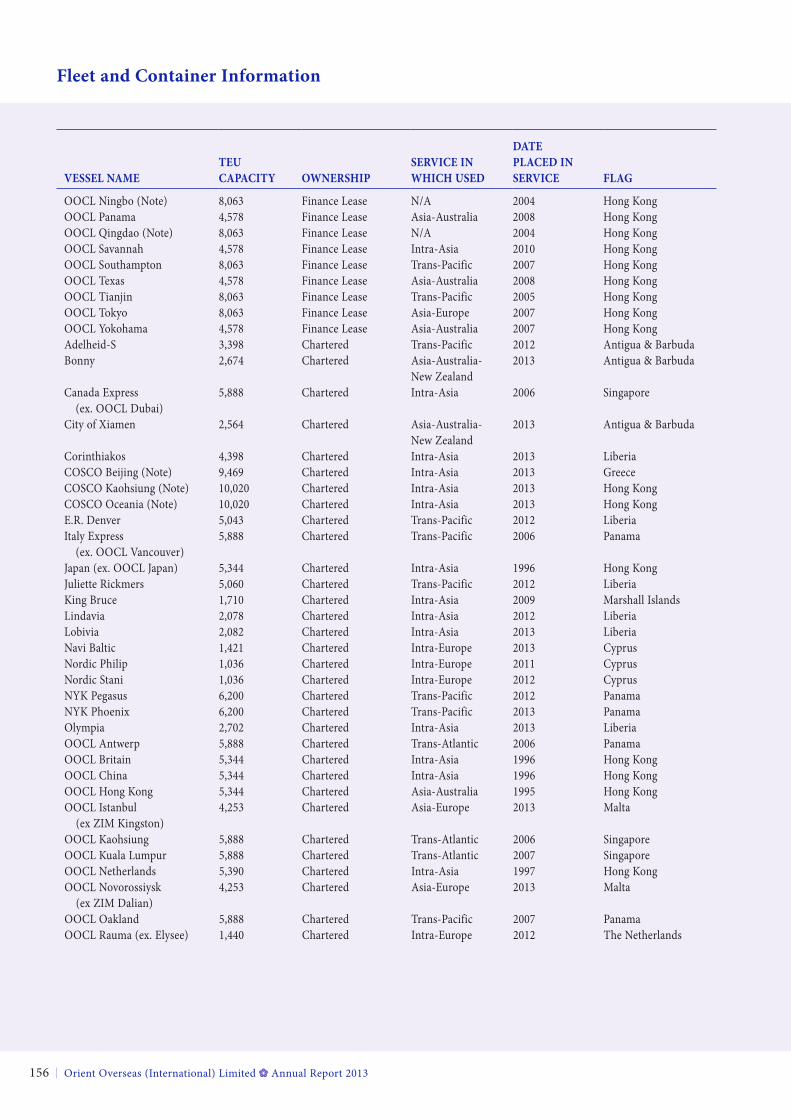
Orient Overseas (International) Limited Annual Report 2013156
Fleet and Container Information
VeSSel NaMeteU CapaCitY oWNerSHip
SerViCe iN WHiCH USeD
Date plaCeD iN SerViCe flaG
OOCL Ningbo (Note) 8,063 Finance Lease N/A 2004 Hong KongOOCL Panama 4,578 Finance Lease Asia-Australia 2008 Hong KongOOCL Qingdao (Note) 8,063 Finance Lease N/A 2004 Hong KongOOCL Savannah 4,578 Finance Lease Intra-Asia 2010 Hong KongOOCL Southampton 8,063 Finance Lease Trans-Pacific 2007 Hong KongOOCL Texas 4,578 Finance Lease Asia-Australia 2008 Hong KongOOCL Tianjin 8,063 Finance Lease Trans-Pacific 2005 Hong KongOOCL Tokyo 8,063 Finance Lease Asia-Europe 2007 Hong KongOOCL yokohama 4,578 Finance Lease Asia-Australia 2007 Hong KongAdelheid-S 3,398 Chartered Trans-Pacific 2012 Antigua & BarbudaBonny 2,674 Chartered Asia-Australia-
New Zealand2013 Antigua & Barbuda
Canada Express (ex. OOCL Dubai)
5,888 Chartered Intra-Asia 2006 Singapore
City of Xiamen 2,564 Chartered Asia-Australia- New Zealand
2013 Antigua & Barbuda
Corinthiakos 4,398 Chartered Intra-Asia 2013 LiberiaCOSCO Beijing (Note) 9,469 Chartered Intra-Asia 2013 GreeceCOSCO Kaohsiung (Note) 10,020 Chartered Intra-Asia 2013 Hong KongCOSCO Oceania (Note) 10,020 Chartered Intra-Asia 2013 Hong KongE.R. Denver 5,043 Chartered Trans-Pacific 2012 LiberiaItaly Express (ex. OOCL Vancouver)
5,888 Chartered Trans-Pacific 2006 Panama
Japan (ex. OOCL Japan) 5,344 Chartered Intra-Asia 1996 Hong KongJuliette Rickmers 5,060 Chartered Trans-Pacific 2012 LiberiaKing Bruce 1,710 Chartered Intra-Asia 2009 Marshall IslandsLindavia 2,078 Chartered Intra-Asia 2012 LiberiaLobivia 2,082 Chartered Intra-Asia 2013 LiberiaNavi Baltic 1,421 Chartered Intra-Europe 2013 CyprusNordic Philip 1,036 Chartered Intra-Europe 2011 CyprusNordic Stani 1,036 Chartered Intra-Europe 2012 CyprusNyK Pegasus 6,200 Chartered Trans-Pacific 2012 PanamaNyK Phoenix 6,200 Chartered Trans-Pacific 2013 PanamaOlympia 2,702 Chartered Intra-Asia 2013 LiberiaOOCL Antwerp 5,888 Chartered Trans-Atlantic 2006 PanamaOOCL Britain 5,344 Chartered Intra-Asia 1996 Hong KongOOCL China 5,344 Chartered Intra-Asia 1996 Hong KongOOCL Hong Kong 5,344 Chartered Asia-Australia 1995 Hong KongOOCL Istanbul (ex ZIM Kingston)
4,253 Chartered Asia-Europe 2013 Malta
OOCL Kaohsiung 5,888 Chartered Trans-Atlantic 2006 SingaporeOOCL Kuala Lumpur 5,888 Chartered Trans-Atlantic 2007 SingaporeOOCL Netherlands 5,390 Chartered Intra-Asia 1997 Hong KongOOCL Novorossiysk (ex ZIM Dalian)
4,253 Chartered Asia-Europe 2013 Malta
OOCL Oakland 5,888 Chartered Trans-Pacific 2007 PanamaOOCL Rauma (ex. Elysee) 1,440 Chartered Intra-Europe 2012 The Netherlands
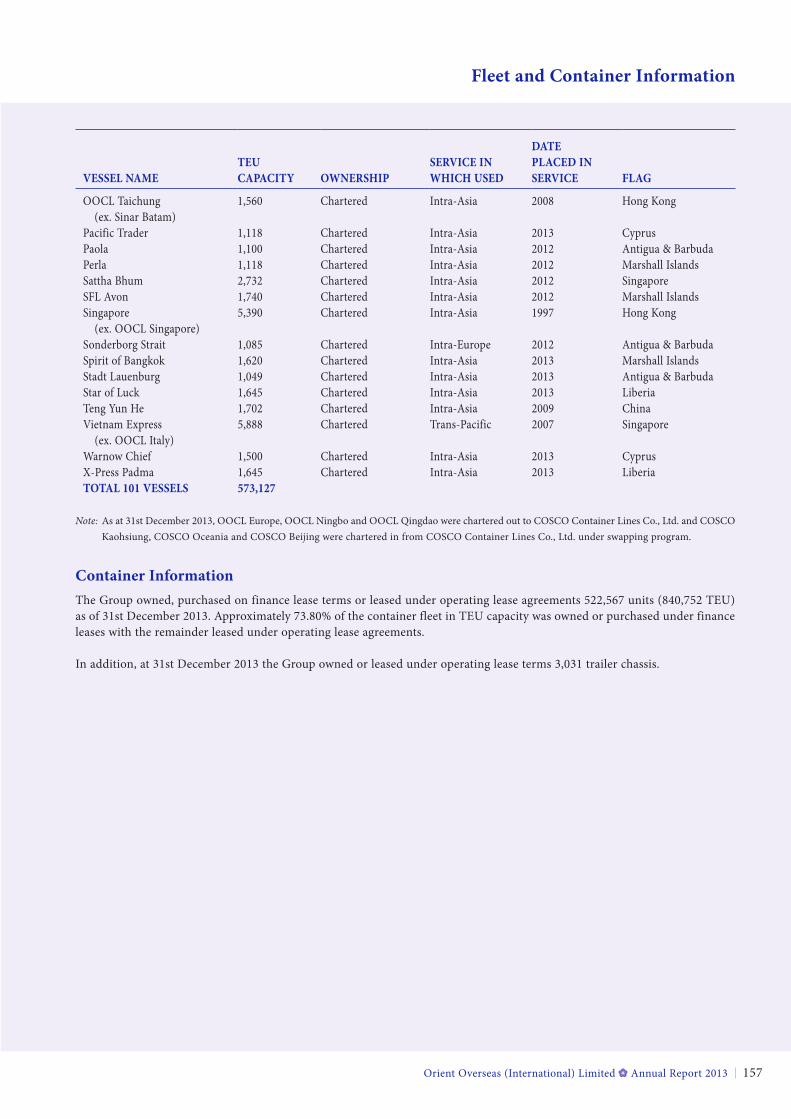
Orient Overseas (International) Limited Annual Report 2013 157
Fleet and Container Information
VeSSel NaMeteU CapaCitY oWNerSHip
SerViCe iN WHiCH USeD
Date plaCeD iN SerViCe flaG
OOCL Taichung (ex. Sinar Batam)
1,560 Chartered Intra-Asia 2008 Hong Kong
Pacific Trader 1,118 Chartered Intra-Asia 2013 CyprusPaola 1,100 Chartered Intra-Asia 2012 Antigua & BarbudaPerla 1,118 Chartered Intra-Asia 2012 Marshall IslandsSattha Bhum 2,732 Chartered Intra-Asia 2012 SingaporeSFL Avon 1,740 Chartered Intra-Asia 2012 Marshall IslandsSingapore (ex. OOCL Singapore)
5,390 Chartered Intra-Asia 1997 Hong Kong
Sonderborg Strait 1,085 Chartered Intra-Europe 2012 Antigua & BarbudaSpirit of Bangkok 1,620 Chartered Intra-Asia 2013 Marshall IslandsStadt Lauenburg 1,049 Chartered Intra-Asia 2013 Antigua & BarbudaStar of Luck 1,645 Chartered Intra-Asia 2013 LiberiaTeng yun He 1,702 Chartered Intra-Asia 2009 ChinaVietnam Express (ex. OOCL Italy)
5,888 Chartered Trans-Pacific 2007 Singapore
Warnow Chief 1,500 Chartered Intra-Asia 2013 CyprusX-Press Padma 1,645 Chartered Intra-Asia 2013 Liberiatotal 101 VeSSelS 573,127
Note: As at 31st December 2013, OOCL Europe, OOCL Ningbo and OOCL Qingdao were chartered out to COSCO Container Lines Co., Ltd. and COSCO Kaohsiung, COSCO Oceania and COSCO Beijing were chartered in from COSCO Container Lines Co., Ltd. under swapping program.
Container informationThe Group owned, purchased on finance lease terms or leased under operating lease agreements 522,567 units (840,752 TEU) as of 31st December 2013. Approximately 73.80% of the container fleet in TEU capacity was owned or purchased under finance leases with the remainder leased under operating lease agreements.
In addition, at 31st December 2013 the Group owned or leased under operating lease terms 3,031 trailer chassis.
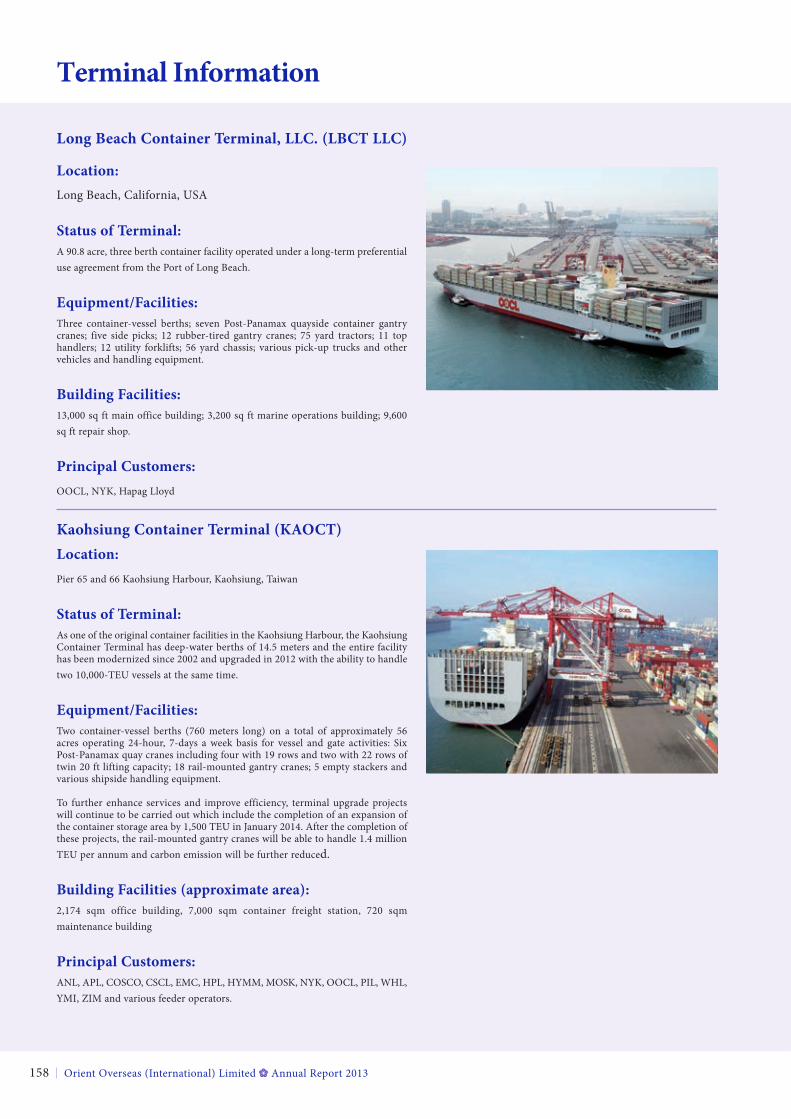
Terminal Information
Orient Overseas (International) Limited Annual Report 2013158
long Beach Container terminal, llC. (lBCt llC)
location:Long Beach, California, USA
Status of terminal:A 90.8 acre, three berth container facility operated under a long-term preferential use agreement from the Port of Long Beach.
equipment/facilities:Three container-vessel berths; seven Post-Panamax quayside container gantry cranes; five side picks; 12 rubber-tired gantry cranes; 75 yard tractors; 11 top handlers; 12 utility forklifts; 56 yard chassis; various pick-up trucks and other vehicles and handling equipment.
Building facilities:13,000 sq ft main office building; 3,200 sq ft marine operations building; 9,600 sq ft repair shop.
principal Customers:OOCL, NyK, Hapag Lloyd
Kaohsiung Container terminal (KaoCt)location:Pier 65 and 66 Kaohsiung Harbour, Kaohsiung, Taiwan
Status of terminal:As one of the original container facilities in the Kaohsiung Harbour, the Kaohsiung Container Terminal has deep-water berths of 14.5 meters and the entire facility has been modernized since 2002 and upgraded in 2012 with the ability to handle two 10,000-TEU vessels at the same time.
equipment/facilities:Two container-vessel berths (760 meters long) on a total of approximately 56 acres operating 24-hour, 7-days a week basis for vessel and gate activities: Six Post-Panamax quay cranes including four with 19 rows and two with 22 rows of twin 20 ft lifting capacity; 18 rail-mounted gantry cranes; 5 empty stackers and various shipside handling equipment.
To further enhance services and improve efficiency, terminal upgrade projects will continue to be carried out which include the completion of an expansion of the container storage area by 1,500 TEU in January 2014. After the completion of these projects, the rail-mounted gantry cranes will be able to handle 1.4 million TEU per annum and carbon emission will be further reduced.
Building facilities (approximate area):2,174 sqm office building, 7,000 sqm container freight station, 720 sqm maintenance building
principal Customers:ANL, APL, COSCO, CSCL, EMC, HPL, HyMM, MOSK, NyK, OOCL, PIL, WHL, yMI, ZIM and various feeder operators.
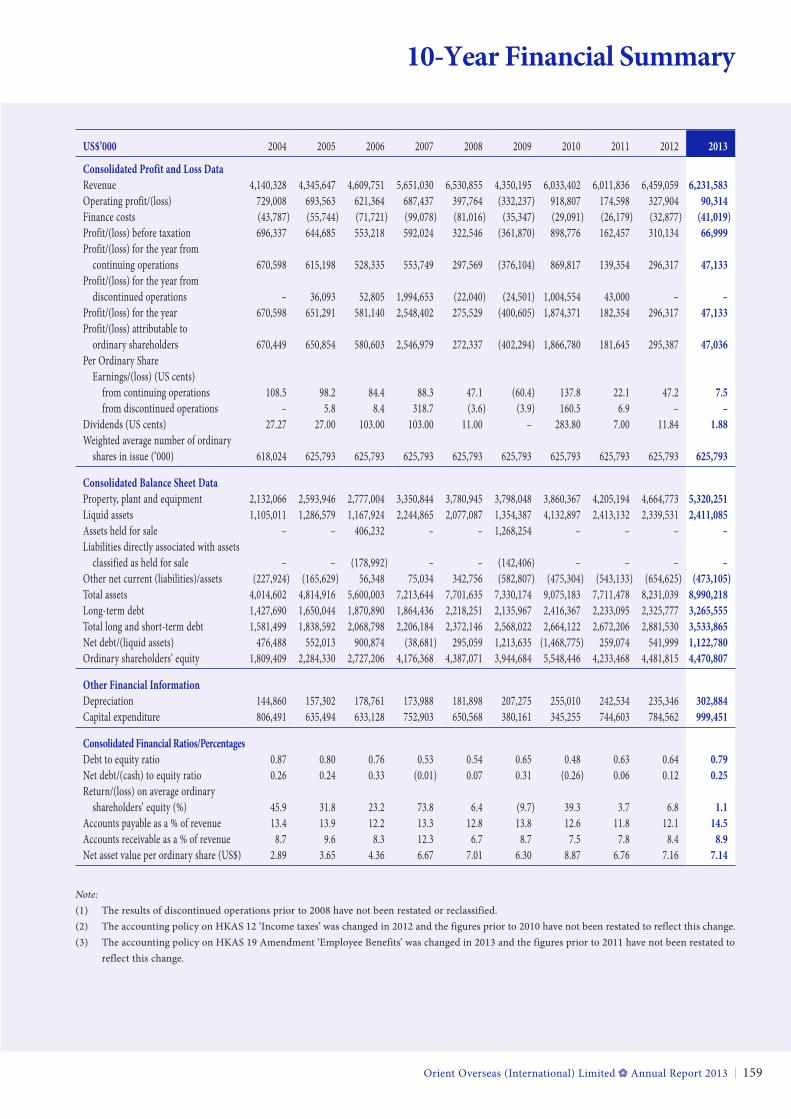
Orient Overseas (International) Limited Annual Report 2013 159
10-Year Financial Summary
US$’000 2004 2005 2006 2007 2008 2009 2010 2011 2012 2013
Consolidated profit and loss DataRevenue 4,140,328 4,345,647 4,609,751 5,651,030 6,530,855 4,350,195 6,033,402 6,011,836 6,459,059 6,231,583Operating profit/(loss) 729,008 693,563 621,364 687,437 397,764 (332,237) 918,807 174,598 327,904 90,314Finance costs (43,787) (55,744) (71,721) (99,078) (81,016) (35,347) (29,091) (26,179) (32,877) (41,019)Profit/(loss) before taxation 696,337 644,685 553,218 592,024 322,546 (361,870) 898,776 162,457 310,134 66,999Profit/(loss) for the year from continuing operations 670,598 615,198 528,335 553,749 297,569 (376,104) 869,817 139,354 296,317 47,133Profit/(loss) for the year from discontinued operations – 36,093 52,805 1,994,653 (22,040) (24,501) 1,004,554 43,000 – –Profit/(loss) for the year 670,598 651,291 581,140 2,548,402 275,529 (400,605) 1,874,371 182,354 296,317 47,133Profit/(loss) attributable to ordinary shareholders 670,449 650,854 580,603 2,546,979 272,337 (402,294) 1,866,780 181,645 295,387 47,036Per Ordinary Share Earnings/(loss) (US cents) from continuing operations 108.5 98.2 84.4 88.3 47.1 (60.4) 137.8 22.1 47.2 7.5 from discontinued operations – 5.8 8.4 318.7 (3.6) (3.9) 160.5 6.9 – –Dividends (US cents) 27.27 27.00 103.00 103.00 11.00 – 283.80 7.00 11.84 1.88Weighted average number of ordinary shares in issue (‘000) 618,024 625,793 625,793 625,793 625,793 625,793 625,793 625,793 625,793 625,793
Consolidated Balance Sheet DataProperty, plant and equipment 2,132,066 2,593,946 2,777,004 3,350,844 3,780,945 3,798,048 3,860,367 4,205,194 4,664,773 5,320,251Liquid assets 1,105,011 1,286,579 1,167,924 2,244,865 2,077,087 1,354,387 4,132,897 2,413,132 2,339,531 2,411,085Assets held for sale – – 406,232 – – 1,268,254 – – – –Liabilities directly associated with assets classified as held for sale – – (178,992) – – (142,406) – – – –Other net current (liabilities)/assets (227,924) (165,629) 56,348 75,034 342,756 (582,807) (475,304) (543,133) (654,625) (473,105)Total assets 4,014,602 4,814,916 5,600,003 7,213,644 7,701,635 7,330,174 9,075,183 7,711,478 8,231,039 8,990,218Long-term debt 1,427,690 1,650,044 1,870,890 1,864,436 2,218,251 2,135,967 2,416,367 2,233,095 2,325,777 3,265,555Total long and short-term debt 1,581,499 1,838,592 2,068,798 2,206,184 2,372,146 2,568,022 2,664,122 2,672,206 2,881,530 3,533,865Net debt/(liquid assets) 476,488 552,013 900,874 (38,681) 295,059 1,213,635 (1,468,775) 259,074 541,999 1,122,780Ordinary shareholders’ equity 1,809,409 2,284,330 2,727,206 4,176,368 4,387,071 3,944,684 5,548,446 4,233,468 4,481,815 4,470,807
other financial informationDepreciation 144,860 157,302 178,761 173,988 181,898 207,275 255,010 242,534 235,346 302,884Capital expenditure 806,491 635,494 633,128 752,903 650,568 380,161 345,255 744,603 784,562 999,451
Consolidated financial ratios/percentagesDebt to equity ratio 0.87 0.80 0.76 0.53 0.54 0.65 0.48 0.63 0.64 0.79Net debt/(cash) to equity ratio 0.26 0.24 0.33 (0.01) 0.07 0.31 (0.26) 0.06 0.12 0.25Return/(loss) on average ordinary shareholders’ equity (%) 45.9 31.8 23.2 73.8 6.4 (9.7) 39.3 3.7 6.8 1.1Accounts payable as a % of revenue 13.4 13.9 12.2 13.3 12.8 13.8 12.6 11.8 12.1 14.5Accounts receivable as a % of revenue 8.7 9.6 8.3 12.3 6.7 8.7 7.5 7.8 8.4 8.9Net asset value per ordinary share (US$) 2.89 3.65 4.36 6.67 7.01 6.30 8.87 6.76 7.16 7.14
Note:(1) The results of discontinued operations prior to 2008 have not been restated or reclassified.(2) The accounting policy on HKAS 12 ‘Income taxes’ was changed in 2012 and the figures prior to 2010 have not been restated to reflect this change.(3) The accounting policy on HKAS 19 Amendment ‘Employee Benefits’ was changed in 2013 and the figures prior to 2011 have not been restated to
reflect this change.
Corporate Information
Orient Overseas (International) Limited Annual Report 2013160
executive DirectorsMr. TUNG Chee Chen (Chairman, President and Chief Executive Officer)Mr. TUNG Lieh Cheung AndrewMr. TUNG Lieh Sing Alan (Acting Chief Financial Officer)
Non-executive DirectorsProfessor Roger KINGMr. CHOW Philip yiu Wah
independent Non-executive Directors
Mr. Simon MURRAyMr. CHANG Tsann Rong ErnestProfessor WONG yue Chim RichardMr. CHENG Wai Sun Edward
Company SecretaryMs. LEE Chee Fun Lammy
authorised representativesMr. TUNG Lieh Sing AlanMs. LEE Chee Fun Lammy
principal office33rd FloorHarbour Centre25 Harbour Road, WanchaiHong Kong
registered officeClarendon House2 Church StreetHamilton HM11Bermuda
principal registrarMUFG Fund Services (Bermuda) Limited 26 Burnaby Street Hamilton HM11 Bermuda
Branch registrarComputershare Hong Kong InvestorServices Limited Shops 1712-1716, 17th Floor Hopewell Centre 183 Queen’s Road East, Wanchai Hong Kong
listing exchangeThe Stock Exchange of Hong Kong LimitedStock Code: 316
Websitehttp://www.ooilgroup.com
Major BankersBank of Amercia, N.A.Bank of China (Hong Kong) LimitedCitibank, N.A.HSBC Holdings plcHSH NordbankNational Australia Bank LimitedOverseas-Chinese Banking Corporation LimitedStandard Chartered Bank (Hong Kong) Limited
SolicitorsConyers Dill & Pearman Clarendon House 2 Church Street Hamilton HM11 Bermuda
and at
2901 One Exchange Square 8 Connaught Place Central Hong Kong
Ince & Co Rooms 3801-6, 38th Floor ICBC Tower, Citibank Plaza 3 Garden Road, Central Hong Kong
Slaughter and May 47th Floor, Jardine House One Connaught Place Central Hong Kong
auditorPricewaterhouseCoopersCertified Public Accountants 22nd Floor Prince’s Building, Central Hong Kong

Orient Overseas (International) Limited(Incorporated in Bermuda with Limited Liability)
33rd Floor Harbour Centre, 25 Harbour Road, Wanchai, Hong Kong Telephone: (852) 2833 3838www.ooilgroup.com
Design and Production by: Toppan Vite Limited
This report is printed on paper in accordance with the standards belowAcid Free Lignin Free Dioxin Free Biodegradable ISO9001 ISO14001