Embed Size (px)
Citation preview

Origin of the Mertz Drift,
George V Basin, East Antarctica
143˚E
66˚30'S
by
Robin J. Beaman B.Sc. (James Cook University)
A thesis submitted in partial fulfillment of the requirements of
the Bachelor of Antarctic Studies with Honours at
the Institute of Antarctic and Southern Ocean Studies (IASOS),
University of Tasmania.
November 2000
i

Declaration
I hereby declare that this thesis contains no material which has
been accepted for the award of any other degree or diploma in
any tertiary institution. To the best of my knowledge and belief,
the thesis contains no material previously published or written
by another person, except where due reference is made in the
text of the thesis.
Robin J. Beaman
ii

Abstract
During February-March 2000, a joint Italian/Australian marine geoscience
expedition (Project WEGA) discovered and cored a large drift deposit, named the
Mertz Drift. The drift is about 390 km2 in area, and lies in the western end of the
George V Basin, East Antarctica. I document a study of the Mertz Drift as the deposit
contains an important high-resolution record of palaeoenvironment changes during
the Holocene. X-radiographs of cores, visual core logs and multi-sensor core logger
data are used to distinguish facies in the cores. A comparison of facies from all cores,
radiocarbon ages, thin section analysis and seafloor photographs of the Mertz Drift
allowed interpretation of five different facies into four generalised phases of
environmental history. A diamicton corresponds to sub-ice shelf, water-lain till
deposited during the Last Glacial Maximum, and underlies the Mertz Drift.
Unconformably overlying the diamicton is a massively bedded siliceous mud and
diatom ooze (SMO) with a high proportion of ice-rafted debris. This unit represents a
period of glacial retreat of the ice shelf and a transition to an open marine
environment, commencing about 14,000 yr BP and lasting for about 9000 years. A
thick succession of laminated and cross laminated SMO follows, deposited during a
mid-Holocene climate optimum from 5000 to 3000 yr BP. Overlying the Mertz Drift
as a drape is a massively bedded fine sand/SMO with a high proportion of ice-rafted
debris, deposited from 3000 yr BP to present. This drape reflects modern
oceanographic conditions commencing from a time of climatic deterioration. This
study found seasonal changes in diatom assemblages within lamination couplets with
mean deposition times of between 2.6 to 4.3 years. Two currents are believed
responsible for the construction of the drift. Upwelled Circumpolar Deep Water
transports fine grained sediments southwards towards the inner shelf, and deep, high
salinity Shelf Water flows northwesterly along the George V Basin, focusing sinking
sediments into a drift deposit. A relative reduction of sea ice cover during a climatic
optimum is believed to be a key factor for longer periods of upwelled Circumpolar
DeepWater over the outer shelf. This leads to a surge in bottom currents and the
concentration of greater volumes of sediment into the drift. This study has important
implications for oceanographers as the results suggest a non-steady-state of Antarctic
Bottom Water production during the Holocene.
iii

Acknowledgements
I would like to thank sincerely my three supervisors for making this enjoyable
project possible: Dr Andrew McMinn (IASOS) for offering guidance at crucial times;
Dr Leanne Armand (IASOS) for the great support and critique of the thesis; and Dr
Peter Harris (Antarctic CRC) for the interesting discussions and making the valuable
data available to me in the first place.
I would also like to thank the various scientists who offered insights into their
field of work: Dr Karen Gowlett-Holmes (CSIRO) for helping identify benthic fauna
from photographs; Dr Nathan Bindoff and Guy Williams (Antarctic CRC) for
explaining the complexities of Antarctic water masses; Dr Pat Quilty (Geology) for
identifying foraminifera in the thin sections; Dr Rob Massom (Antarctic CRC) for the
use of his satellite images of the Mertz Glacier region; and Dr Tom Trull (Antarctic
CRC) for explaining productivity and carbon export in the Southern Ocean.
Thank you to Simon Stephens for preparing the thin section samples, and
Lisette Robertson, Suenor Woon and Dr Fiona Taylor for assistance in obtaining the
X-radiographs of the WEGA cores.
To the great members of the IASOS Bachelor of Antarctic Studies (Honours)
2000 intake, thank you very much for your excellent company, intelligence and
experience shared this year. Australia's future science and education is in good hands.
I dedicate this thesis to the patience and moral support given me by my partner
Nerida Gray who sacrificed much to join me in Hobart for this year.
iv

Table of Contents
Title i
Declaration ii
Abstract iii
Acknowledgements iv
Table of Contents v
List of Figures and Tables viii
Acronyms and Abbreviations xiii
Chapter 1. Introduction 1
1.1 Introduction 1
1.2 Previous Studies 2
1.3 Aims and Hypotheses 7
1.4 Outline of Thesis 7
Chapter 2. Regional Setting 9
2.1 Introduction 9
2.2 George V Land 9
2.3 Glacial Setting 10
2.4 Meteorological Setting 11
2.5 Sea Ice and Polynyas 12
2.6 Bathymetry 13
2.7 Waves, Swell and Tides 14
2.8 Currents and Water Masses 15
Chapter 3. Materials and Methods 19
3.1 Introduction 19
3.2 Source of Data 19
3.3 Area, Volume and Carbon Content 22
3.4 X-radiographs 22
3.5 Facies Classification 23
3.6 Ice-rafted Debris (IRD) Gravel Content 23
3.7 Seafloor Photographs 24
3.8 Radiocarbon Ages 24
3.9 Laminations 24
v

3.10 Thin Section Analysis 25
Chapter 4. Sedimentology 27
4.1 Introduction 27
4.2 Previous Sedimentology Studies 27
4.2.1 Core DF79-12 27
4.2.2 Glacial-Marine Facies 31
4.2.3 Surficial Sediment Facies 32
4.3 Results 33
4.3.1 Area, Volume and Carbon Content 33
4.3.2 Facies Classification 34
4.3.3 Ice-rafted Debris (IRD) Gravel Content 41
4.3.4. Seafloor Photographs 44
4.4 Summary of Results 46
Chapter 5. Palaeoclimatology 48
5.1 Introduction 48
5.2 Palaeoclimatology 49
5.2.1 Radiocarbon Dating 49
5.2.2 Post-LGM Glacial Development of East Antarctica 50
5.2.3 Limits of Glacial Advance off George V Land 52
5.2.4 Carbon-14 Ages in Core DF79-12 53
5.3 Results 55
5.3.1 Radiocarbon Ages 55
5.3.2 Laminations 67
5.4 Summary of Results 71
Chapter 6. Thin Section Analysis 73
6.1 Introduction 73
6.2 Previous Diatom Studies 73
6.2.1 Diatom Analysis in George V Basin 73
6.2.2 Core DF79-12 75
6.3 Results 76
6.3.1 Thin Section Facies 77
6.3.2 Thin Section Analysis 79
6.4 Summary of Results 87
vi

Chapter 7. Discussion 89
7.1 Introduction 89
7.2 Succession of Environments 89
7.3 Model of Mertz Drift Formation 98
7.4 Sediment Accumulation Rates 100
7.5 Timing of Post-LGM Deposition in the George V Basin 101
7.6 Lamination Couplets 102
7.7 Physical Controls on Drift Formation 103
7.7.1 Oceanography 103
7.7.2 Bathymetry 104
7.7.3 Geomorphology and Coriolis Effect 105
7.8 Does the Mertz Drift Record Bottom Water Formation? 107
Chapter 8. Conclusions 111
8.1 Conclusions 111
8.2 Recommendations for Further Research 113
References 115
Appendix A. Facies Interpretation Logs and IRD Gravel Content 122
vii

List of Figures and Tables
Figures Page
Figure 1.1 Map of East Antarctica showing study site within box. 1
Figure 1.2 A north/south cross section through the western end of 3
the George V Basin.
Figure 1.3 Depositional model for Antarctic glacial-marine 4
environment on the continental shelf.
Figure 1.4 Map of the continental shelf off George V Land 5
- Mertz Glacier region.
Figure 1.5 Mertz Drift isopach map compiled from 3.5 kHz and 6
deep tow chirper data.
Figure 2.1 Map of the Australian Antarctic Territory (AAT). 10
Figure 2.2 Oblique, southward-looking view of George V Land. 11
Figure 2.3 Advanced Very High Resolution Radiometer channel 4 13
image of the Mertz Glacier Tongue and polynya.
Figure 2.4 A potential temperature, salinity and density diagram 17
that defines Antarctic water masses.
Figure 2.5 Cross section through the continental shelf in the 18
vicinity of the Mertz Glacier showing relative
positions of water masses.
Figure 3.1 Isopach map of the Mertz Drift showing station numbers 20
in relation to sediment core sites.
Figure 4.1 X-radiograph facies interpretation log and legend for 28
core DF79-12.
Figure 4.2 Downcore variation in percentage sand for core DF79-12. 29
Figure 4.3. Model of Antarctic glacial-marine environments 32
and facies.
Figure 4.4 X-radiograph example and line drawing of massively 35
bedded SMO facies within core 26PC12.
Figure 4.5 X-radiograph example and line drawing of massively 37
bedded fine sand/SMO facies from core 16PC01.
viii

Figure 4.6 X-radiograph example and line drawing of laminated 38
SMO facies within core 17PC02.
Figure 4.7 X-radiograph example and line drawing of cross 39
laminated SMO facies from core 17PC02.
Figure 4.8 X-radiograph example and line drawing of diamicton 40
facies from core 26PC12.
Figure 4.9 Graph of gravel content opposite the facies interpretation 43
log of core 27PC13.
Figure 4.10 Photograph of seafloor at station 24 in 819 metres of water. 44
Figure 4.11 Photograph of seafloor at station 24 in 819 metres of water. 45
Figure 5.1 Broad synthesis for glacial and climatic development 51
in East Antarctica since the LGM.
Figure 5.2 Late Pleistocene-Holocene reconstruction for the 53
George V Land ice margin.
Figure 5.3 Graph of corrected age versus depth for core 13GC05. 58
Figure 5.4 Graph of corrected age versus depth for core 13GC06. 58
Figure 5.5 Graph of corrected age versus depth for core 26PC12. 59
Figure 5.6 Graph of corrected age versus depth for core 26PC12. 60
Figure 5.7 Graph of corrected age versus depth for core 26PC12. 60
Figure 5.8 Corrected age for core 13GC05 facies interpretation 63
log and corresponding graph of gravel content per 5 cm
based on average sediment accumulation rates.
Figure 5.9 Corrected age for core 13GC06 facies interpretation 64
log and corresponding graph of gravel content per 5 cm
based on average sediment accumulation rates.
Figure 5.10 Corrected age for core 26PC12 facies interpretation 65
log and corresponding graph of gravel content per 5 cm
based on average sediment accumulation rates.
Figure 5.11 3.5 kHz seismic data along an east-west transect over the 66
Mertz Drift with average sediment accumulation rates.
Figure 5.12 Graph of visual count versus X-radiograph count of 68
lamination couplets within core 13GC05.
ix

Figure 5.13 Graph of visual count versus X-radiograph count of 68
lamination couplets within core 13GC06.
Figure 6.1. Absolute distribution of diatoms in surface sediments 74
on the continental shelf off George V Land.
Figure 6.2. Relative concentration of Fragilariopsis curta in surface 75
sediments on the continental shelf off George V Land.
Figure 6.3 Four thin section sample depths against the core 78
26PC12 facies interpretation log.
Figure 6.4 X-radiograph, thin section and photomicrograph of 80
massively bedded fine sand/SMO (8.5-11.5 cm).
Figure 6.5 X-radiograph, thin section and photomicrograph of 82
laminated SMO (162-165 cm).
Figure 6.6 X-radiograph, thin section and photomicrograph of 84
cross laminated SMO (227-230.5 cm).
Figure 6.7 X-radiograph, thin section and photomicrograph of 86
cross laminated SMO (237-240.5 cm).
Figure 7.1 Mertz Drift succession of phases of depositional 91
environment and units with corrected radiocarbon ages
within a representative 500 cm core.
Figure 7.2 Chirper data showing the details of internal acoustic 96
bedding across the large and small lobes of the drift.
Figure 7.3 Model of Mertz Drift formation using cross section 99
of the shelf.
Figure 7.4 East/west 3.5 kHz seismic profile across the large 100
and small lobes of the Mertz Drift.
Figure 7.5 Diagram showing water masses over the 105
George V Basin.
Figure 7.6 Diagram illustrating the possible relationships between 106
factors responsible for sediment deposition of the drift.
Figure A.1 Facies Legend 122
Figure A.2 Facies interpretation log and gravel content of 123
core 11GC02.
x
Figure A.3 Facies interpretation log and gravel content of 124
core 11GC03.
Figure A.4 Facies interpretation log and gravel content of 125
core 12GC04.
Figure A.5 Facies interpretation log and gravel content of 126
core 13GC05.
Figure A.6 Facies interpretation log and gravel content of 127
core 13GC06.
Figure A.7 Facies interpretation log and gravel content of 128
core 14GC07.
Figure A.8 Facies interpretation log and gravel content of 129
core 15GC08.
Figure A.9 Facies interpretation log and gravel content of 130
core 15GC09.
Figure A.10 Facies interpretation log and gravel content of 131
core 16PC01.
Figure A.11 Facies interpretation log and gravel content of 132
core 17PC02.
Figure A.12 Facies interpretation log and gravel content of 133
core 18PC03.
Figure A.13 Facies interpretation log and gravel content of 134
core 19PC04.
Figure A.14 Facies interpretation log and gravel content of 135
core 20PC05.
Figure A.15 Facies interpretation log and gravel content of 136
core 23PC09.
Figure A.16 Facies interpretation log and gravel content of 137
core 24PC10.
Figure A.17 Facies interpretation log and gravel content of 138
core 25PC11.
Figure A.18 Facies interpretation log and gravel content of 139
core 26PC12.
xi

Figure A.19 Facies interpretation log and gravel content of 140
core 27PC13.
Tables Page
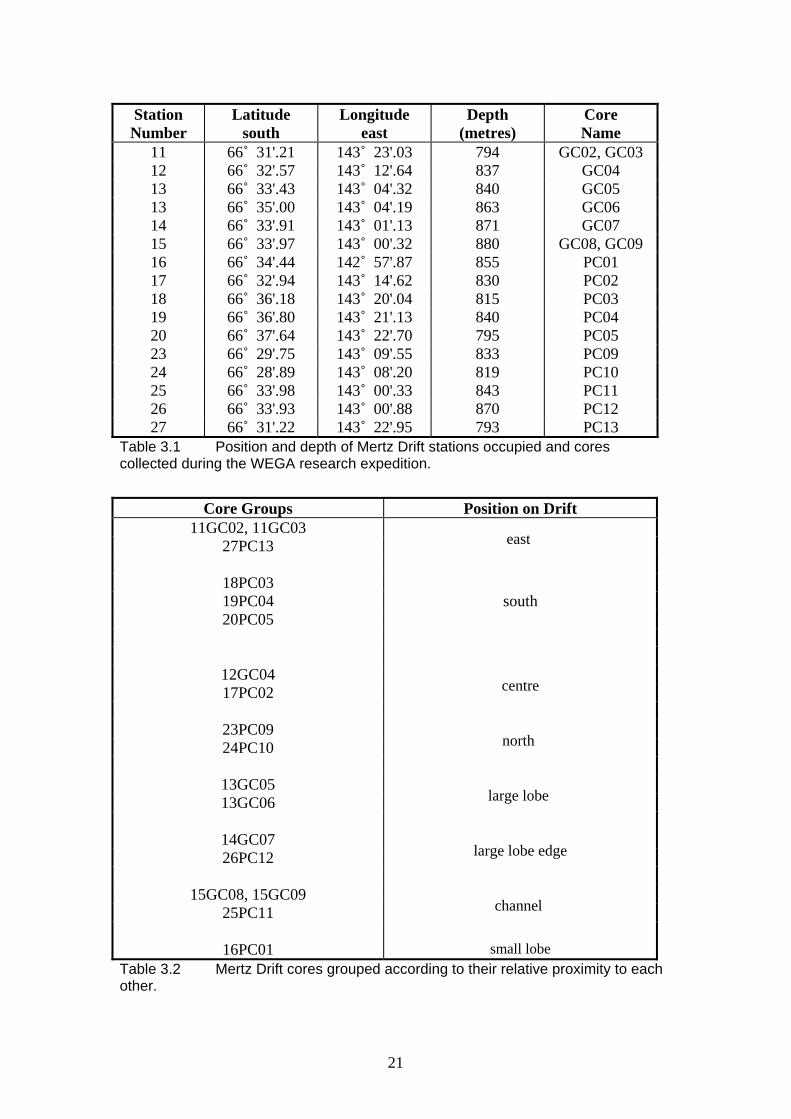
Table 3.1 Position and depth of Mertz Drift stations occupied and 21
cores collected during the WEGA research expedition.
Table 3.2 Mertz Drift cores grouped according to their relative 21
proximity to each other.
Table 4.1 Mertz Drift area and volume. 34
Table 4.2 Presence (x) of facies and approximate percentage of 35
each facies from all Mertz Drift cores.
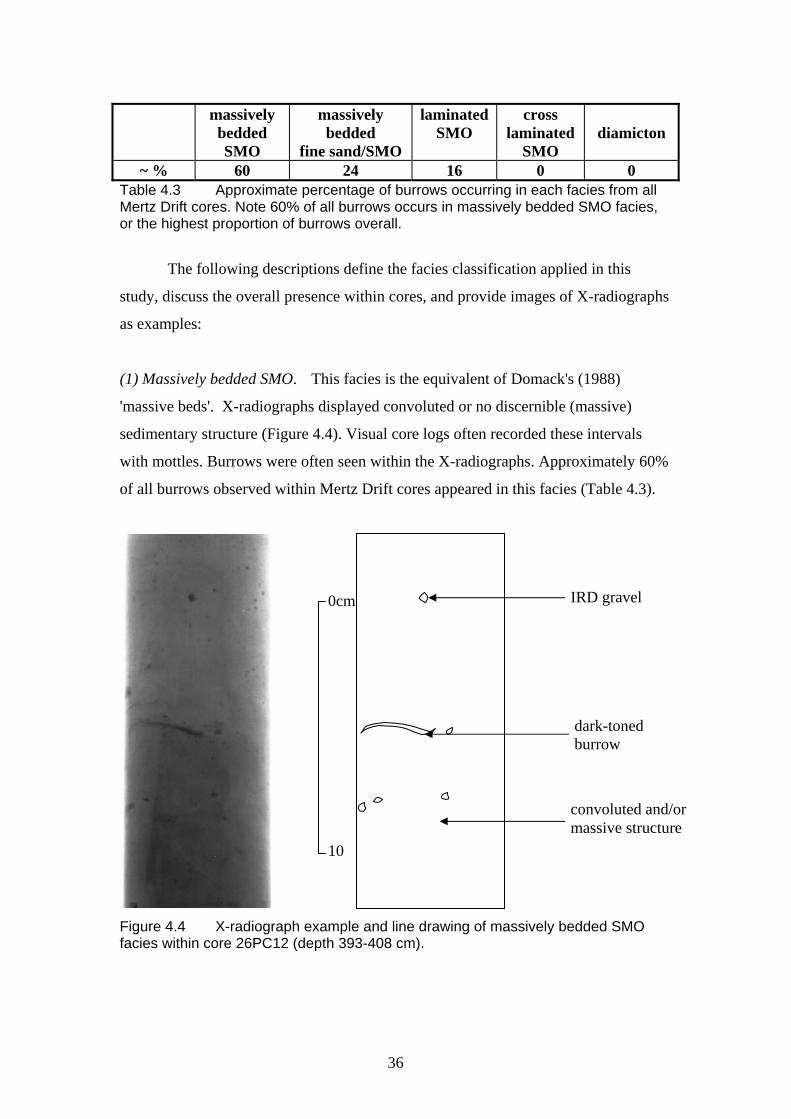
Table 4.3 Approximate percentage of burrows occurring in each 36
facies from all Mertz Drift cores.
Table 4.3 Table of IRD gravel content within each facies of each 41
core, with the sum occurrence and percentage of all
IRD within each facies.
Table 4.4 Location and summary of seafloor photograph 46
descriptions of Station 24 on the Mertz Drift.
Table 5.1 Uncorrected and corrected radiocarbon ages from 54
core DF79-12.
Table 5.2 List of Mertz Drift samples utilised for radiocarbon dating. 56
Table 5.3 Average sediment accumulation rates and predominant 61
facies within cores 13GC05, 13GC06 and 26PC12.
Table 5.4 Table of lamination couplet detail within core 13GC05. 70
Table 5.5 Table of lamination couplet detail within core 26PC12. 70
xii

Acronyms and Abbreviations
AABW Antarctic Bottom Water
AAT Australian Antarctic Territory
ACC Antarctic Circumpolar Current
ASW Antarctic Surface Water
BP Before Present
CDW Circumpolar Deep Water
CRC Cooperative Research Centre
DF79 'Operation Deep Freeze' 1979
EWD East Wind Drift
GEBCO General Bathymetric Chart of the Ocean
HSSW high salinity Shelf Water
IRD ice-rafted debris
ISW ice Shelf Water
LGM Last Glacial Maximum
MCDW Modified Circumpolar Deep Water
RV Research Vessel
SMO siliceous mud and diatom ooze
SW Shelf Water
TOC Total Organic Carbon
US United States of America
WEGA Wilkes Land Glacial History
WW Winter Water
xiii

Chapter 1. Introduction
1.1 Introduction
In February-March 2000, an Antarctic marine geoscience expedition, led by
Drs P.T. Harris from the Antarctic CRC and G. Brancolini from the National Institute
for Oceanography and Experimental Geophysics, discovered and mapped a large shelf
sediment drift deposit that was named the Mertz Drift. It is similar to deep sea pelagic
drift deposits in morphology and structure, however, it is composed of biosiliceous
ooze and located within a 850 m depression at the western end of the George V Basin,
East Antarctica.
Mertz Drift
Figure 1.1 Map of East Antarctica showing study site within box (source: Australian Antarctic Division 2000).
The discovery was part of the joint Italian/Australian Research Cruise to study
Wilkes Land Glacial History (Project WEGA) aboard the Research Vessel Tangaroa.
The aim of the WEGA project was to collect detailed sedimentary records from the
Terre Adélie and George V Land continental margin, for which little data presently
exist. Using multi-channel seismic and chirper seafloor imagery, the research team
1
mapped the deposit which covered about 390 km2. The drift is over 30 m thick, with
dimensions of about 30 km east to west and 22 km north to south.
Sediment cores collected from the Mertz Drift revealed laminated, olive-
green, siliceous mud and diatom ooze (SMO) overlying a glacial-marine diamicton.
While the lower SMO sediments are laminated, there is a 20 to 50 cm thick sandy
drape at the surface over the whole of the drift. The laminae possibly reflect annual
seasonal changes in productivity (Domack 1988). The sandy drape suggests that a
recent (late-Holocene) change in the depositional environment had occurred, possibly
related to changes in the extent of the nearby Mertz Glacier tongue, current regime
and/or the persistence of sea ice over the shelf area (Harris 2000). Therefore, a study
of the origin of the Mertz Drift became the purpose of this thesis, as the deposit could
possibly contain an important high-resolution record of palaeoenvironment changes
during the Holocene.
A detailed study of the Mertz Drift complements the aims of the WEGA
project, which was to determine the extent of the ice sheet during the Last Glacial
Maximum (LGM) along this section of the shelf. Knowledge of the extent of the
LGM ice sheet could thus provide ice boundary conditions for modelers. Another aim
of the project was to collect sedimentary records for comparison with the Dome C ice
core onshore. The correlation of sedimentary and glacial records would contribute to
the understanding of temporal and spatial constraints of the glacial/interglacial stages
and Quaternary palaeoclimatic fluctuations. The comparison of sedimentary and
glacial records would also permit the linkage of atmospheric processes and the
response of the marine system (Antarctic CRC 2000).
1.2 Previous Studies
The first collections of sediments in this region were during Douglas
Mawson's 1911-14 Australasian Antarctic Expedition to Commonwealth Bay. The
crew of the vessel Aurora obtained eight samples of the seafloor during depth
soundings in the area. Within the George V Basin, sediments were primarily siliceous
oozes composed of sponge spicules, diatoms and radiolaria. In general, the
2

biosiliceous component of sediments was found to increase below a depth of 550 m
(Domack and Anderson 1983).
The next marine geological study to the area was not until 1978/79 during
'Operation Deep Freeze' (DF79) by the US Icebreaker Glacier. This expedition
obtained seismic profiles and sediment cores in five north/south transects across the
continental shelf off George V Land. The Mertz Drift site was sampled during this
survey with core 12 (hereafter named core DF79-12) obtained from the southeast part
of the deposit. Using a single line of 12 kHz seismic data, Domack (1988) recorded
rather uniform and draped layers of fine grained, siliceous-rich sediments that
thickened to about 40 m at the western end of the George V Basin (Figure 1.2).
Domack (1988) postulated that the thicker SMO sediments should contain a greater
proportion of gravity flow muds (turbidites) than the uniform and draped layers
recovered in core DF79-12.
Figure 1.2 A north/south cross section through the western end of the George V Basin revealed by 'Operation Deep Freeze' 1979 (DF79) 12 kHz seismic profile (source: Domack et al. 1989). Note the position of core DF79-12, and the thickening of siliceous mud and diatom ooze (SMO) within dashed box indicating the Mertz Drift.
X-radiographs of core DF79-12 revealed sedimentary structures with
horizontal laminations, cross laminations, and massive units. SMO facies overlie an
erosional contact with glacial-marine diamicton at the base of the core (Domack
1988). Thus, deposition postdated a period of widespread glaciation on the shelf and
is Holocene in age (Domack et al. 1989). Domack (1988) proposed that impinging
Circumpolar Deep Water (CDW) removes fine grained sediment from outer shelf
banks and transports it towards the coast to be deposited within inner shelf basins
(Figure 1.3). Seasonal fluctuations in sea ice may also explain the development of
3

laminated intervals within the SMO facies, as individual laminae were found to have
different assemblages of diatoms (Domack 1988). Radiocarbon ages from core DF79-
12 revealed that the timing of the last glacial advance off George V Land was
attributed to a mid-Holocene glacial expansion of the Mertz Glacier tongue, which
was synchronous with a warming event of 7000 to 4000 yr BP (Domack et al. 1989).
Domack et al. (1991) admitted that the timing of the transition to open marine
conditions within the George V Basin was uncertain, and longer cores from this basin
would help resolve the complete Holocene record in this area.
Figure 1.3 Depositional model for Antarctic glacial-marine environment on the continental shelf (source: Domack 1988). Seasonal phytoplankton blooms, winnowed fine grained sediments transported from the outer shelf banks by upwelling ocean currents and gravity flows contribute to the siliceous ooze deposited within the basin. Note the Mertz Drift would lie within the dashed box of this model.
There was then a twenty-year gap until the next marine geology survey to
sample the George V Basin, which was the recent WEGA expedition that discovered
and mapped the Mertz Drift (Figure 1.4). Brancolini and Harris (2000) labeled it a
true 'drift' deposit since these sediments exhibit a patchy distribution, large-scale
bedforms, contain foreset bedding and display a depositional architecture indicative of
a 'confined drift' as defined by Faugeres et al. (1999). Confined drifts occur in
relatively small basins or troughs, and often in tectonically active basins that account
for their topographic confinement. The gross seismic character of a confined drift is
similar to mounded, elongate drifts having distinct boundary channels along the
margins (Faugeres et al. 1999).
4

300 m
500 m 700 m
900 m
1100 m
1300 m
700 m
900 m
500 m
300 m
142˚ E 143˚ 144˚ 145˚ 146˚
66˚ S
67˚
0 50 100 150 km
core DF79-12
Mertz Glacier
George V Land
George V Basin
Mertz Bank
Adélie Bank
continental slope
Mertz Drift
sill
Figure 1.4 Map of the continental shelf off George V Land - Mertz Glacier region (modified from: Brancolini and Harris 2000). Note the position of the Mertz Drift in the western arm of the George V Basin at a depth of approximately 850 m.
5
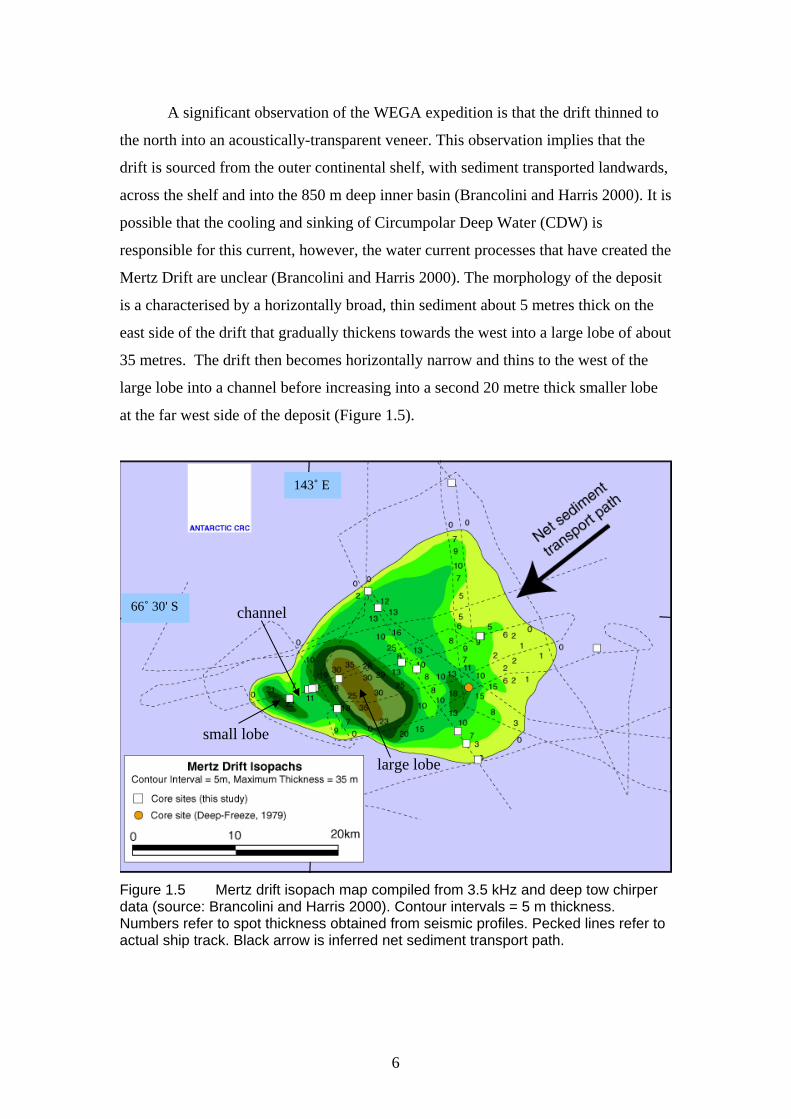
A significant observation of the WEGA expedition is that the drift thinned to
the north into an acoustically-transparent veneer. This observation implies that the
drift is sourced from the outer continental shelf, with sediment transported landwards,
across the shelf and into the 850 m deep inner basin (Brancolini and Harris 2000). It is
possible that the cooling and sinking of Circumpolar Deep Water (CDW) is
responsible for this current, however, the water current processes that have created the
Mertz Drift are unclear (Brancolini and Harris 2000). The morphology of the deposit
is a characterised by a horizontally broad, thin sediment about 5 metres thick on the
east side of the drift that gradually thickens towards the west into a large lobe of about
35 metres. The drift then becomes horizontally narrow and thins to the west of the
large lobe into a channel before increasing into a second 20 metre thick smaller lobe
at the far west side of the deposit (Figure 1.5).
143˚ E
66˚ 30' S channel
large lobe
small lobe
Figure 1.5 Mertz drift isopach map compiled from 3.5 kHz and deep tow chirper data (source: Brancolini and Harris 2000). Contour intervals = 5 m thickness. Numbers refer to spot thickness obtained from seismic profiles. Pecked lines refer to actual ship track. Black arrow is inferred net sediment transport path.
6
1.3 Aims and Hypotheses
This thesis has three main aims. The first is to produce facies descriptions
using visual core logs, multi-sensor core logger data and sedimentary structures
revealed by X-radiographs of cores recovered from the Mertz Drift. This is in order to
discover if there is an overall facies succession within the deposit, and whether the
drift has some underlying pattern of deposition. The second aim is to use radiocarbon
age data to explain the timing of any facies succession, and whether or not the Mertz
Drift sediments do record a high resolution of palaeoenvironment change during the
Holocene. A third aim is to conduct a microscope study of Mertz Drift sediments
using thin sections. Analysis may reveal the source of biosiliceous material, and
whether sediments are a hemipelagic drape, current lain or from gravity flows.
Based upon the depositional model for the Antarctic glacial-marine
environment by Domack (1988) and the findings by Brancolini and Harris (2000), the
following hypotheses are proposed:
a. Mertz Drift sediments largely result from cyclical, high productivity diatom
blooms due to annual seasonal changes in sea ice cover.
b. Mertz Drift sediments are concentrated and reworked by episodic, deep basin
currents.
c. Mertz Drift sediments contain a high resolution record of bottom current
intensity during the Holocene, and hence palaeoenvironment, off George V
Land.
1.4 Outline of Thesis
Chapters One through Two of this thesis are directed towards providing an
introduction to the subject and region. Chapter One introduces the limited findings
from expeditions to the George V Basin and the geomorphology of the Mertz Drift.
7
Chapter Two describes the regional setting of the coast and continental shelf off
George V Land, and describes the complex physical features of the area that may
have had an impact on the formation of the Mertz Drift. Chapter Three outlines the
data utilised in the study and the methods employed therein.
Chapter Four concentrates on sedimentology, and describes in more detail the
results of core DF79-12 and Antarctic glacial-marine facies models. The results of
facies descriptions from the WEGA cores are presented in this chapter. Chapter Five
focuses on palaeoclimatology, discussing radiocarbon dating and its use in Antarctic
Late Pleistocene-Holocene palaeoenvironment studies. The timing of post-LGM
retreat of ice sheets and climate change is summarised for East Antarctica and George
V Land. The results of radiocarbon dating of WEGA cores are displayed in this
chapter. Chapter Six presents the results of thin section analysis. Chapter Seven is the
discussion of overall facies succession and sedimentation history of the drift. A model
of the formation of the Mertz Drift is shown. The conclusions drawn from this study
and further research directions are given in Chapter Eight.
8
Chapter 2. Regional Setting
2.1 Introduction
This chapter on the regional setting of George V Land and the adjacent
continental shelf seeks to explain the complex physical processes that may have an
impact on the formation of the Mertz Drift. The coastline bounded by George V Land
is first defined. The glacial setting is then described which includes the Mertz Glacier,
ice walls of the coast and icebergs. The meteorological setting is presented with an
explanation of Antarctic maritime weather and katabatic winds. This is followed by a
description of sea ice and the Mertz polynya. The limited waves, swell and tidal
information obtained from this area are then presented. The unusual bathymetry of the
continental shelf off George V Land is described. This is followed by definitions of
the currents and water masses around Antarctica, and descriptions of water masses
discovered over the continental shelf off George V Land.
2.2 George V Land
Historical records of Wilkes Land indicate a number of identifying names for
the coastline at different longitudes. Sedimentological research papers record the
coastline adjacent to the Mertz Drift as George V Land (originally King George V
Land), whereas oceanographic papers record the coast here as Adélie Land. However,
as shown in Figure 2.1, the French Antarctic Territory, Terre Adélie (Adélie Land), is
bounded between longitude 136˚ and 142˚ east (Joyner 1988). George V Land lies to
the east of longitude 142˚ east. As the majority of research papers name the coastline
in this region George V Land, in the vicinity of the Mertz Drift at longitude 143˚ east,
then this name will be adopted for consistency.
9

Mertz Drift
George V Land
Mertz Glacier Ninnis Glacier
Figure 2.1 Map of the Australian Antarctic Territory (AAT), Adélie Land (in grey sector) and George V Land east of longitude 142˚ east (source: Australian Antarctic Division 2000). Note the study site within the box.
2.3 Glacial Setting
The coast of George V Land is dominated by the edge of an ice-covered
plateau that rises to a height of over 1219 m at a distance of 64 km inland (Domack
and Anderson 1983). The area includes some 390 km of coastline that has a total
drainage basin of 145,000 km2. Most of the coastline consists of ice cliffs that are
mostly sediment free. Glacial drainage along the ice cliffs is probably sufficiently
slow that wave erosion keeps pace with the rate of advance (Domack and Anderson
1983). Most of the ice drainage of George V Land occurs within a relatively small
segment of the coastline through the Mertz and Ninnis Glaciers, named after Dr
Xavier Mertz and Lieutenant Ninnis who died in 1913 as part of Douglas Mawson's
Far-eastern Sledging Party (Mawson 1997). Of these two glaciers, the Mertz Glacier
Tongue projects in a southwest to northeast direction approximately 150 km from the
coast over the continental shelf (Figure 2.2), and is probably grounded on the shallow
seafloor to the north.
10

Comparisons between various coastline surveys during the 20th century reveal that
the calving front of the Mertz Glacier Tongue fluctuates in the order of tens of
kilometres (Domack and Anderson 1983).
GEORGE V LAND
Mertz Drift
sea ice
N
E W S
Figure 2.2 Oblique, southward-looking view of George V Land. (source: NASA Space Shuttle). The photograph shows sea ice in the foreground with the position of the Mertz and Ninnis Glaciers and coastline drawn in the background. Note the study site within the box.
Sediment-laden icebergs calved from the Mertz Glacier have dimensions of up
to tens of km2 (Anderson et al. 1980). The observed drift of icebergs from the Mertz
and Ninnis Glaciers is to the west following the westerly-flowing surface currents
(East Wind Drift; Domack and Anderson 1983). A line of grounded icebergs is found
in the same southwest to northeast orientation as the Mertz Glacier Tongue (refer
Figure 2.2). During winter, fast ice connects these icebergs to the glacier, creating a
continuous zone of ice from the coast to the shelf break east of about longitude 146˚
east (Bindoff and Williams, submitted).
2.4 Meteorological Setting
The weather of Antarctica is dominated by a relatively simple tropospheric
circulation system. The pressure decreases poleward from mid-latitudes, producing
strong westerly winds (Walton 1987). Large temperature gradients between the cold
11

continent and the relatively warm ocean continually create low-pressure areas
(cyclones) that travel eastward or southeastward with the prevailing wind. The
concentration of cyclones forms a low-pressure trough between latitude 60˚ to 65˚
south. The maritime Antarctic weather thus consists of a continual succession of
cyclonic storms on a time scale of two to three days, interspersed with short periods
of finer weather resulting from intervening high pressure ridges (Walton 1987). South
of this trough the mean pressure increases, producing easterly winds at low altitudes.
The coastal zone has a higher proportion of clear days and remains relatively mild
during summer under the influence of the nearby ocean. During winter, however, sea
ice forms and air temperature falls much lower under radiative cooling (Walton
1987).
Near the base of coastal escarpments and mountain ranges, katabatic winds
may form that have almost no relationship with the overall pressure field and resultant
winds. These katabatic winds are still not well understood, however, it is thought that
at the edges of the escarpment where the terrain slope increases, wind becomes more
gravity-driven, overcoming the Coriolis effect (Walton 1987). In the vicinity of
George V Land, the katabatic winds are channeled down the Antarctic Plateau
through the valleys created by the Mertz and Ninnis Glaciers (Parish and Bromwich
1987). Katabatic winds in this region are the strongest recorded anywhere in
Antarctica (Massom et al. 1998). For example, while close to the George V Land
coastline, the WEGA research team experienced very strong katabatic winds gusting
to Force 11, accompanied by very rough seas from 22 to 24 February 2000 and low
temperatures to -15˚C (Brancolini and Harris 2000).
2.5 Sea Ice and Polynyas
Variability in the sea ice regime around Antarctica is fundamentally linked to
the meteorology. Within the sea ice, polynyas may form as areas of open water or thin
ice up to 0.3 m thick where new ice is removed by winds and ocean currents as it
forms (Massom et al. 1998). Particularly rapid sea ice formation and export occurs
where strong and persistent katabatic winds emerge from the continent via valleys,
often associated with outlet glaciers. Polynyas in such locations are thought to be sites
12

of significant water mass modification due to the high salt flux into the ocean as a
response to enhanced ice growth (Massom et al. 1998). Using passive microwave
data, the mean area of the Mertz polynya is 23,300 km2, with its maximum extent in
October (Massom et al. 1998). It lies beside the Mertz Glacier Tongue and extends as
far west as longitude 143˚ west (Figure 2.3). The strong katabatic winds flowing in
the vicinity of the Mertz Glacier are thought to contribute to the formation and
maintenance of this polynya, as winds continually remove sea ice allowing more to be
formed (Massom et al. 1998).
sea ice
Mertz Drift
grounded icebergs
Mertz Glacier Tongue
polynya
George V Land coastline
Figure 2.3 Advanced Very High Resolution Radiometer channel 4 image of the Mertz Glacier Tongue and associated polynya (source: Australian Bureau of Meteorology 14 June 1999). Dark patch inside dashed box is Mertz polynya indicating open water within sea ice. Note Mertz Drift study area inside small box.
2.6 Bathymetry
The continental shelf off George V Land is deep with an average shelf break
depth of 500 m and approximately 180 km wide (Domack 1982; Wright et al. 1983).
The physiography of the shelf is dominated by the George V Basin (also called the
Adélie Depression or the Mertz-Ninnis Trough), which is a linear, inner shelf basin
that parallels the coast (Figure 1.4). This basin, like other East Antarctic shelf basins,
13

is steep sided and joined to the shelf-break by a U-shaped valley that is fjord-like
(Harris and O'Brien 1996). These deep basins and valleys are believed to have a
structural origin as a result of rifting of Australia with Antarctica during the Tertiary
period then sculpted by successive ice advances during the Pleistocene (Domack et al.
1980; Hampton et al. 1987). The George V Basin reaches its deepest point of over
1100 m in the vicinity of the Mertz Glacier, and then trends in a west-northwest for
approximately 300 km (General Bathymetric Chart of the Ocean - GEBCO map data
1997). The Mertz Drift lies at the western arm of this linear basin at a depth of
approximately 850 m. There is a ridge at about longitude 144˚ east that separates this
western arm of the basin from the deeper east section (Harris 2000). A trough or sill
500 m deep connects the George V Basin to the continental slope at position 66˚
south, 143˚ east, and approximately 150 km north of the Mertz Drift. This sill is
bounded to the east by the shallow 200 m deep Mertz Bank and to the west by the
similar flat-topped 200 m deep Adélie Bank.
2.7 Waves, Swell and Tides
Published wave and swell data from the coast of George V Land are limited,
so the following information relies predominantly upon data from the WEGA
expedition that surveyed the area from February to March 2000. Brancolini and Harris
(2000) noted that while winds were often high (speed range 0 - 60 kn; mean speed 16
kn), it was predominantly from the south, and the short fetch and deep water inhibited
wave height (height range 0 to 3 m; mean height 0.5 m). Likewise, swell was
predominantly generated from the south (mean period 7 sec; height range 0 to 4.5 m;
mean height 2 m). In addition, new ice forming in the south of the area at the onset of
winter may have further inhibited wave and swell formation.
The tide on the George V Land continental shelf is diurnal, i.e. predominantly
one high water and one low water each day, with a maximum tidal range of 1.8 m
(Australian National Tide Tables 2000). Harris and O'Brien (1996) state that the depth
of the East Antarctic shelf and the presence of sea ice over much of the year restricts
the effects of swell and waves in reworking shelf sediments. Similarly, the microtidal
14

range (< 2 m) along the coast indicates that tidal currents play only a minor role in
shelf sediment dynamics.
2.8 Currents and Water Masses
The waters of the Southern Ocean have a special importance to
oceanographers because of the variety of water masses produced and the ability for
these waters to spread throughout the world as bottom water (Whitworth et al. 1998).
Ocean currents are also the dominant energy type responsible for the physical
reworking of sediments along the East Antarctic margin (Harris and O'Brien 1996).
Because of the variety of water masses produced south of the Polar Front, definitions
will mostly follow those in the review by Whitworth et al. (1998).
The wind-driven Antarctic Circumpolar Current (ACC) flows eastward,
exchanging waters among the Southern Ocean basins. This current includes
Circumpolar Deep Water (CDW), and is believed to be the critical water mass
because it is involved in the formation of all others (Whitworth et al. 1998). CDW is
considered in two layers: the upper, with an oxygen minimum and nutrient maximum,
is entrained within the ACC; the lower, with a salinity maximum, can be found south
of the ACC where it frequently meets the Antarctic continental shelf. Both upper and
lower layers of CDW are warmer than the cold surface waters that overlie it. Vertical
and lateral mixing in the slope and shelf regions can convert the lower layer CDW to
other water masses. This mixing is enhanced by the East Wind Drift (EWD) that
moves in a westerly direction around the Antarctic continent driven by the polar
easterly winds (Whitworth et al. 1998).
Whitworth et al. (1998) used a temperature, salinity and density diagram to
define Antarctic water masses (Figure 2.4). The upper boundary of CDW is the
density value 1028.03 kg/m3. The lower boundary of CDW is defined by the density
value of 1028.27 kg/m3. On the shelf, it is possible for CDW to mix with the
overlying Antarctic Surface Water or with the underlying Shelf Water and has been
given the term Modified Circumpolar Deep Water (MCDW). It is considered to be
15

colder and fresher than the regional CDW, however the boundary between the two is
vague (Whitworth et al. 1998).
Overlying CDW, and with density lower than 1028.03 kg/m3, is Antarctic
Surface Water (ASW). Because of its location at the air/sea/ice interface, ASW is the
most variable in properties of all Antarctic water masses. Its salinity is less than about
34.45 0/00 and its temperatures ranges from 2˚ C to - 2˚ C. In summer, Antarctic
Surface Water is sometimes called Winter Water (WW) since it is a remnant of the
isothermal winter mixed layer (Whitworth et al. 1998; Wong et al. 1998).
Underlying CDW is Antarctic Bottom Water (AABW), which has a density of
less than 1028.27 kg/m3 and is warmer than -1.7˚ C. AABW is believed to be created
in a two-stage process. First, MCDW mixes with Shelf Water to produce water seen
at the bottom of the shelf edge, then this water sinks along the slope, entraining the
warmer, saltier CDW to produce AABW (Whitworth et al. 1998).
Water denser than 1028.27 kg/m3 and colder than minus 1.7˚ C is called Shelf
Water. This water mass could result from two processes: (1) from salt rejected from
winter sea ice formation being trapped within basins, and (2) from the onshelf mixing
of MCDW, which is cooled in winter (Wong et al. 1998).
16

34.4 34.5 34.6 34.7 -2
-1.5
-1
-0.5
0
0.5
1
1.5
2
Potential Salinity (0/00)
Potential Temp. (˚ C)
Antarctic Surface Water or Winter Water
CDW
Antarctic Bottom Water
Shelf Water
upper density = 1028.03 kg/m3
lower density = 1028.27
kg/m3MCDW
Figure 2.4 A potential temperature, salinity and density diagram that defines Antarctic water masses (modified from: Whitworth et al. 1998). CDW = Circumpolar Deep Water; MCDW = Modified Circumpolar Deep Water.
The search for Antarctic Bottom Water (AABW) from the continental shelf
off George V Land led Rintoul (1998) to conclude that a cold, fresh, high oxygen and
dense variety of AABW (his Adélie Land Bottom Water) originated from the sill
connecting the George V Basin to the continental slope. A more recent Australian
winter oceanographic expedition to the Mertz Glacier polynya area found four distinct
water masses near the Mertz Glacier (Bindoff and Williams, submitted):
(1) A relatively warm, fresh and oxygen-poor Modified Circumpolar DeepWater
(MCDW) flowed in a predominantly southwesterly direction in tongues over the
Mertz Bank towards the coast, and in depths of up to 500 m (Figure 2.5).
(2) Over the George V Basin was a large volume of relatively homogenous and
non-stratified Winter Water (WW). The WW was derived from the MCDW when it
was cooled by the atmosphere and gained brine through interaction with the Mertz
17

polynya. WW extended to depths of about 500 m and flowed towards the Mertz
Glacier and westward following the coast (Figure 2.5).
(3) Underlying the WW in the deepest parts of the basin was a strongly stratified,
dense, oxygen rich, high salinity Shelf Water (HSSW). Through the ocean-
atmosphere interaction at the polynya, water masses were converted from MCDW
into WW and HSSW by cooling and the addition of brine (Bindoff and Williams,
submitted). Rintoul (1998) concluded that the HSSW in the George V Basin was the
source of the Antarctic Bottom Water flowing off the shelf (Figure 2.5).
(4) Bindoff and Williams (submitted) also discovered a supercooled and
freshened variety of Shelf Water called ice Shelf Water (ISW). Both WW and HSSW
water masses were modified by their interaction under the Mertz Glacier to become
ISW. This water mass occurred in depths to 500 m and flowed westerly, following the
coastline (Figure 2.5).
slope basin
sill
polynya
WW
CDW MCDW
HSSW AABW inner shelf
outer shelf
glacier
ISW
Figure 2.5 Cross section through the continental shelf in the vicinity of the Mertz Glacier showing relative positions of water masses (modified from: Bindoff and Williams, submitted). Colours of water masses match those of Figure 2.4. Arrows infer direction of flow across the shelf. Water masses are: Circumpolar Deep Water (CDW); Modified Circumpolar Deep Water (MCDW); Winter Water (WW); high salinity Shelf Water (HSSW); ice Shelf Water (ISW); Antarctic Bottom Water (AABW).
18

Chapter 3. Materials and Methods
3.1 Introduction
This chapter sets out the sources of data for the present project. It includes a
map and tables of the positions of the sediment cores collected by the WEGA
expedition used in this study. Area, volume and carbon content statistics for the Mertz
Drift are first explained. One aim of this thesis was to determine if the drift has some
underlying pattern of deposition. Facies descriptions of each Mertz Drift core were
produced using X-radiographs, visual core logs and multi-sensor core logger data, and
the methods are detailed below. X-radiographs also permitted counts of ice-rafted
debris (IRD) gravel content within each core in order to determine patterns of IRD
deposition in relation to facies. Seafloor photographs of the Mertz Drift are examined
to provide clues to the modern environment of deposition. Another aim of the thesis
was to use radiocarbon age data to explain the timing of any facies succession through
sediment accumulation rates. Radiocarbon dates are also used to calculate the mean
time period of deposition of laminae couplets of several cores. A third aim of this
thesis was to examine thin sections of sediments under microscope, in the method
described below, to determine whether samples were deposited as a hemipelagic
drape, current lain or from gravity flows.
3.2 Sources of Data
Data for the present study are derived from the results of the joint
Italian/Australian WEGA research expedition during February to March 2000 aboard
the RV Tangaroa. The expedition collected 18 piston and gravity cores from 16 sites
on the deposit, in two cross-drift transects (Figure 3.1). Sediment sampling equipment
consisted of a one tonne core head, with up to 6 m barrel lengths, configured as either
a gravity or piston corer. A Shipek grab was also deployed independently at several
stations to sample the upper 10 cm of sediment. Cores were logged visually onboard
the Tangaroa for colour, sedimentary structures, ice-rafted debris (IRD), presence of
burrows, grain size and fossils. Cores were also logged using a non-destructive
Geotech Model 36 multi-sensor core logger for bulk density, magnetic susceptibility
19

and P-wave velocity. Cores were refrigerated in approximately one metre long
sections after being split into an archived (unsampled) and sampled halves. While on
site, seabed photographs were taken using a Benthos model 372A underwater camera
and a model 383 flash (Brancolini and Harris 2000).
24 23
11 & 27
18 19 20
12 17
13
26 & 14
15 & 25
16
143˚ E
66˚ 30' S
Figure 3.1 Isopach map of the Mertz Drift showing station numbers (in bold) in relation to sediment core sites (small white squares) (source: Brancolini and Harris 2000). Unnumbered small white boxes outside of the Mertz Drift are WEGA sediment core sites excluded from the present study.
Table 3.1 lists the positions and depths of cores obtained from the Mertz Drift
in order of station number. Mertz Drift cores are grouped in Table 3.2 according to
their relative proximity to one another, and given a name according to their position
on the drift for ease of comparison. It should be noted that the high concentration of
cores collected from the Mertz Drift is unusual in the history of deep sea coring,
allowing much comparison between adjacent cores. Of these groups, only core
16PC01 on the small lobe did not have an immediately adjacent core.
20
Station Number
Latitude south
Longitude east
Depth (metres)
Core Name
11 66˚ 31'.21 143˚ 23'.03 794 GC02, GC03 12 66˚ 32'.57 143˚ 12'.64 837 GC04 13 66˚ 33'.43 143˚ 04'.32 840 GC05 13 66˚ 35'.00 143˚ 04'.19 863 GC06 14 66˚ 33'.91 143˚ 01'.13 871 GC07 15 66˚ 33'.97 143˚ 00'.32 880 GC08, GC09 16 66˚ 34'.44 142˚ 57'.87 855 PC01 17 66˚ 32'.94 143˚ 14'.62 830 PC02 18 66˚ 36'.18 143˚ 20'.04 815 PC03 19 66˚ 36'.80 143˚ 21'.13 840 PC04 20 66˚ 37'.64 143˚ 22'.70 795 PC05 23 66˚ 29'.75 143˚ 09'.55 833 PC09 24 66˚ 28'.89 143˚ 08'.20 819 PC10 25 66˚ 33'.98 143˚ 00'.33 843 PC11 26 66˚ 33'.93 143˚ 00'.88 870 PC12 27 66˚ 31'.22 143˚ 22'.95 793 PC13
Table 3.1 Position and depth of Mertz Drift stations occupied and cores collected during the WEGA research expedition.
Core Groups Position on Drift 11GC02, 11GC03
27PC13 east
18PC03 19PC04 south 20PC05
12GC04 17PC02 centre
23PC09 24PC10 north
13GC05 13GC06 large lobe
14GC07 26PC12 large lobe edge
15GC08, 15GC09
25PC11 channel
16PC01 small lobe
Table 3.2 Mertz Drift cores grouped according to their relative proximity to each other.
21
3.3 Area, Volume and Carbon Content
Area and volume statistics are determined to allow comparisons of the Mertz
Drift against other Antarctic drift deposits. Using the isopach map and scale of Figure
1.5, the area and volume of each isopach thickness interval was calculated using a
grid scale of 2 mm2 is equivalent to 206,611 m2 (Chapter 4). This volume figure was
then used to calculate the carbon content of the drift, as these deposits may play a
significant role in the carbon cycle of the Antarctic continental shelf (Harris et al.
1999). Calculations utilised the methods of Harris et al. (1999), which required
equations for:
(1) volume of solids = (volume of deposit) x 40%.
Where 40% is the value used in Harris et al. (1999) for ratio of solids/seawater.
(2) mass of solids = (calculated volume of solids) x 2600 kg/m3.
Where 2600 kg/m3 is the value used in Harris et al. (1999) for the mass of
solids/volume of solids.
(3) carbon content = (calculated mass of solids) x 1.5%.
Where 1.5% is the percentage of total organic carbon in core DF79-12 (Domack et al.
1989). At the time of writing this thesis, total organic carbon of WEGA sediments had
yet to be processed.
3.4 X-radiographs
Using the archived half of the cores, X-radiographs were undertaken at Rush,
Taylor and Partners Diagnostic Radiologists in Hobart using a Siemans Polyphos 50
machine. Siliceous mud and diatom ooze (SMO) sediments required an average
power of 46 kilovolt (kV) and time of 32 milliAmpsec (mAs) to reveal the internal
structure. The more dense diamicton unit underlying the SMO required an average of
66 kV and 32 mAs. Black and white photographs were produced from the negatives
of the X-radiographs, and photo reproductions of each core were constructed on 100 x
70 cm boards with a downcore cm scale.
22

3.5 Facies Classification
The X-radiographs of each Mertz Drift core were examined closely for
sedimentary structures. These included the presence of laminations or cross
laminations, convoluted or massive structures (Chapter 4). The presence of burrows
within X-radiographs of the cores was also recorded. Burrows were observed within
X-radiographs as generally horizontal, dark-toned, ragged lines (Harris 2000). Where
sedimentary structures were identified in the X-radiographs, comparison was made
with the visual core logs and multi-sensor core logger data for accuracy, particularly
when trying to identify the presence of burrows and sedimentary structures that were
obscured by poor X-radiographs. Information on sedimentary structure and sediment
type revealed by visual core logs, multi-sensor core logger data and X-radiographs
were then incorporated into a facies classification modified from Domack (1988).
Facies classification for each Mertz Drift core is presented in facies interpretation logs
(Appendix A). The proportion of the different facies observed in X-radiographs of
cores is presented in a table in order to determine any overall patterns of deposition.
The proportion of burrows observed in each facies is also given in a table to help in
identifying patterns of deposition within the Mertz Drift.
3.6 Ice-rafted Debris (IRD) Gravel Content
Using the X-radiographs for each Mertz Drift core, IRD granules (2-4 mm)
and pebbles (4-64 mm) were counted for each 5 cm interval down core . Granule and
pebble counts were then combined into the classification 'gravel' as total gravel
content. For each core, gravel content, representing the number of grains per 5 cm
interval, are presented in graphs alongside facies interpretation logs (Appendix A).
IRD gravel within the glacial-marine diamicton at the base of a number of cores was
not counted as this project focussed upon IRD deposition patterns within SMO
sediments only. Gravel content from each Mertz Drift core was used to calculate the
overall gravel content percentage for each facies (Chapter 4).
23
3.7 Seafloor Photographs
The use of photographs to reveal the benthic community is useful as they
assist in interpreting the modern environment of deposition. Clues may be given as to
whether Mertz Drift sediments are presently being concentrated and reworked by
deep basin currents, a hypothesis of this study. Fauna and features are identified for
several seafloor photographs representative of the Mertz Drift surface, and related to
habitat information where possible (Chapter 4).
3.8 Radiocarbon Ages
In the laboratory, 63 samples were taken of various Mertz Drift grab samples,
piston and gravity cores for radiocarbon dating at the Institute of Geological and
Nuclear Sciences, Lower Hutt, New Zealand. The conventional radiocarbon age
results obtained were corrected for contamination by older sediments and reservoir
effect to bring the core-tops to modern age (Chapter 5). The practice amongst marine
sediment workers is to subtract the core-top radiocarbon age from the remainder of
down core radiocarbon ages (Cunningham et al. 1999, McMinn 2000). The corrected
ages of Mertz Drift cores 13GC05, 13GC06 and 26PC12 were graphed against depth
in KaleidaGraph Version 3.5, and a linear regression and correlation coefficient were
calculated for each graph. The slope calculated for linear regression of each plot was
then used to produce average sediment accumulation rates. These rates were
compared against the facies within the cores to determine if there were any underlying
sedimentation patterns within the Mertz Drift.
3.9 Laminations
Domack (1988) proposed that laminae possibly reflect annual seasonal
changes in productivity. An aim of this project was to calculate the mean deposition
time for lamination couplets to test the hypothesis that Mertz Drift sediments largely
result from cyclical, high productivity diatom blooms due to annual seasonal changes
in sea ice cover. This calculation relied upon X-radiographs to observe and measure
the thickness of lamination couplets within the cores. Lamination couplets were
24

defined as a pair of light and dark-toned lines within X-radiographs. It was important
first to test the validity of the X-radiographs to record laminations accurately as the
images essentially display internal, three-dimensional sedimentary structures as two
dimensions. Therefore, a comparison was made of the number of lamination couplets
per 10 cm interval recorded on visual core logs for cores 13GC05 and 13GC06
compared to the number revealed by X-radiographs for the same 10 cm interval
(Chapter 5). Only intervals of lamination couplets that were clear within the X-
radiographs were used in the comparison. Graphs of visual versus X-radiograph
lamination couplet counts were produced in KaleidaGraph Version 3.5, and a linear
regression and correlation coefficient calculated for each graph.
X-radiographs of cores 13GC05 and 26PC12 were then examined in closer
detail to reveal the mean number of lamination couplets per cm and the mean couplet
thickness in cm. The mean couplet thickness (in cm) was multiplied by the average
sediment accumulation rate (in yr/cm) from these two cores to reveal the mean time
period for lamination couplets (in years; Chapter 5).
3.10 Thin Section Analysis
Four block samples of core 26PC12 were extracted for thin section analysis
under microscope (Chapter 6). Analysis may reveal the source of biosiliceous
material, and whether sediments are a hemipelagic drape, current lain or from gravity
flows. Block samples were obtained from the core at depths: 8.5-11.5, 162-165, 227-
230.5 and 237-240.5 cm. Samples were freeze dried, placed in an oven and left for
two days at 60˚C until all water had evaporated. Samples were then put in a dessicator
under vacuum, and an epoxy resin (AralditeM/Hardener HY956 - 10g/1.7g)
introduced to impregnate and cover the samples. Samples were released from the
dessicator and allowed to harden over four hours. After samples had hardened, the
blocks were flattened with a 400 grid diamond grinding surface and glued to glass
slides. The glass-mounted blocks were then sectioned at 20 µm and polished so as to
reveal sediment microstructure for analysis under microscope.
25
Analysis of thin sections was initially a comparison against the facies
interpretation log of core 26PC12 to determine the facies of the samples. The overall
style of deposition of the thin sections was compared against the equivalent depth
within X-radiographs of core 26PC12. This was in order to determine if there was any
correlation between the textural differences in the thin section and structures observed
in the X-radiographs. Thin sections were analysed under stereo and compound
microscopes to detect finer-scale qualitative differences in the microstructure. No
attempt was made to conduct a quantitative analysis of diatom species due to the late
preparation of thin sections and lack of time. Photomicrographs were taken of
important features of the thin sections to highlight points within the analysis.
26
Chapter 4. Sedimentology
4.1 Introduction
This chapter is in two parts. The first part describes the previous
sedimentology results from 'Operation Deep Freeze' 1979 (DF79) in greater detail, in
particular those of core DF79-12 which penetrated the southeast part of the Mertz
Drift. Core DF79-12 provides a comparison against the findings of this project using
the cores from the WEGA research expedition. Antarctic glacial-marine facies and
continental shelf surficial sediment facies are also described that will allow
comparison of Mertz Drift sediments with Antarctic polar glacial sequences. The
second part presents the sedimentological results of this project. This includes area,
volume and carbon content statistics, facies classification and ice-rafted debris (IRD)
gravel content of Mertz Drift cores, and the results of seafloor photograph
descriptions to interpret the modern environment of deposition. The chapter concludes
with a summary of these results.
4.2 Previous Sedimentology Studies
4.2.1 Core DF79-12
Core DF79-12 penetrated approximately 600 cm of laminated siliceous mud
and diatom ooze (SMO) before striking a weakly stratified, glacial-marine diamicton
(Domack and Anderson 1983). Facies classification based upon sedimentary
structures revealed by X-radiographs were varied (Domack 1988), and included
laminations, discontinuous laminae, cross laminae, massive beds, diamicton and the
presence of IRD (Figure 4.1). The overall facies succession of DF79-12 illustrated in
Figure 4.1 revealed diamicton at 600 cm followed by about 130 cm of sediment
providing poor X-radiographs then massive beds with relatively high IRD content to
about 330 cm. Massive beds were overlain predominantly by laminations with minor
cross laminae and massive intervals to about 70 cm. The upper 70 cm of core DF79-
12 was mostly discontinuous laminae and laminations.
27

500cm
525
550
575
600
625
0cm
25
50
75
100
125
150
175
200
225
250
275
300
325
350
375
400
425
450
475
500
Facies Legend
cross laminae
laminations
diamicton
unknown-poor Xray
massive beds
discontinuous laminae
IRD
Figure 4.1 X-radiograph facies interpretation log and legend for core DF79-12 (modified from: Domack 1988).
28
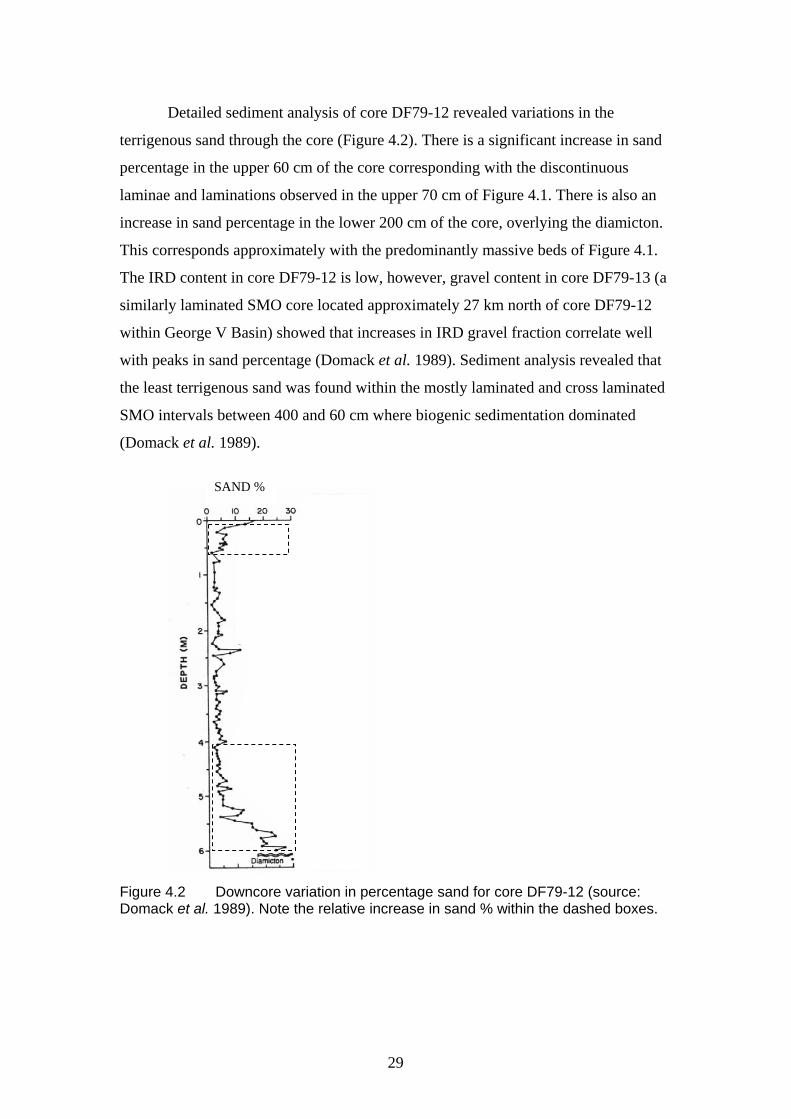
Detailed sediment analysis of core DF79-12 revealed variations in the
terrigenous sand through the core (Figure 4.2). There is a significant increase in sand
percentage in the upper 60 cm of the core corresponding with the discontinuous
laminae and laminations observed in the upper 70 cm of Figure 4.1. There is also an
increase in sand percentage in the lower 200 cm of the core, overlying the diamicton.
This corresponds approximately with the predominantly massive beds of Figure 4.1.
The IRD content in core DF79-12 is low, however, gravel content in core DF79-13 (a
similarly laminated SMO core located approximately 27 km north of core DF79-12
within George V Basin) showed that increases in IRD gravel fraction correlate well
with peaks in sand percentage (Domack et al. 1989). Sediment analysis revealed that
the least terrigenous sand was found within the mostly laminated and cross laminated
SMO intervals between 400 and 60 cm where biogenic sedimentation dominated
(Domack et al. 1989).
SAND %
Figure 4.2 Downcore variation in percentage sand for core DF79-12 (source: Domack et al. 1989). Note the relative increase in sand % within the dashed boxes.
29

The deposition of biogenic sediments was interpreted by Domack and
Anderson (1983) to have occurred soon after recession of the glacial ice from the
shelf (refer Chapter 5 for detail on timing), as evidenced by the contact between
diamicton and overlying SMO. There was a change from proximal ice tongue
sedimentation at the base of the core (diamicton) to open marine sedimentation above
(SMO; Domack et al. 1989). The transition between proximal and distal ice tongue
was recorded by an upward reduction in fine grained sand and an increase in biogenic
material within the 600 to 400 cm interval. As the glacier melted upon retreat,
increased winnowing of relict glacial-marine sediments by impinging Circumpolar
Deep Water (CDW) on the outer shelf was believed to be largely responsible for
transporting the fine sand, silt and clay into the basin (Domack and Anderson 1983).
Domack (1988) stated that sediment gravity flows, meltwater plumes and aeolian
transport may also be a source of transport for sediments into the basin. Yet Domack
(1988) noted a lack of evidence for sediment gravity flows within the basin, but
speculated that the thickest part of the George V Basin (Mertz Drift) should contain a
greater proportion of gravity flow muds than the uniform and draped layers recovered
in core DF79-12.
Domack (1988) proposed a model explaining the laminated SMO within deep
basin cores, in which areas that undergo seasonal fluctuations in sea ice cover
contribute significant quantities of biogenic detritus to the bottom after high
productivity, diatom blooms within the open water photic zone. Initial analysis of
diatom flora within individual laminae of core DF79-12 revealed strong contrasts in
species diversity and size. Epontic (sea ice habitat) diatoms dominated within one of
each laminae couplet (Domack 1988). Therefore, layers may represent initial pelagic
flux from melting sea ice followed by productivity during the rest of summer
represented by open water diatoms. The lack of pelagic carbonate within these
sediments, such as planktonic foraminifera, was most likely related to carbonate
dissolution at depths below 500 m (Domack 1988).
30
4.2.2 Glacial-Marine Facies
In this present study it is important to consider the diamicton and SMO
sediments within the WEGA expedition cores and core DF79-12 within the wider
perspective of Antarctic glacial-marine facies. This enables comparisons with
Antarctic polar glacial sequences. Antarctic glacial-marine sediments fall roughly into
three groups (Anderson et al. 1983):
(1) Transitional glacial-marine facies. This facies is a dominantly massive, unsorted
diamicton with some stratification, similar to lodgment tills (Figure 4.3). This facies
contains a low-diversity, marine fossil assemblage, indicating deposition in an
environment where conditions were unsuitable for most marine organisms. The facies
is interpreted as having been formed under an ice shelf, and grades seawards into
muds and oozes. Basal debris, melted out beneath the shelf, is deposited on the
seafloor with minor marine fossils.
(2) Compound glacial-marine facies. This facies includes mud and diatomaceous
oozes with only minor IRD, and is classified as compound due to the mixture of
glacial and marine components (Figure 4.3). These are the most widespread sediments
on the Antarctic seafloor today, blanketing the shelf in depths greater than about 300
m. This facies is interpreted as having been formed in a deep (> ~300 m) open marine
environment, where biogenic sedimentation dominates over terrigenous sediment
supply from glaciated coastlines or icebergs.
(3) Residual glacial-marine facies. This facies is confined to shallow (< ~300 m)
outer shelf banks in an open marine environment (Figure 4.3). Deposits consist of
unsorted gravel and sand, and possibly minor silt and clay after most of the fines have
been winnowed by marine currents, leaving residual sediments. This facies also
contains substantial carbonate material such as bryozoa, mollusc, echinoderms, coral
fragments and foraminifera.
31

open marine ice shelf ice sheet
lodgment till deposition
residual glacial-marine
facies compound
glacial-marine facies
transitional glacial-marine
facies
melting current biogenic
material freezing
melting
IRD winnowing
Figure 4.3. Model of Antarctic glacial-marine environments and facies (modified from: Anderson et al. 1983). Transitional glacial-marine facies consist of basal debris melted from beneath ice shelves and minor marine fossils. Compound glacial-marine facies comprise mostly biogenic material and minor IRD. Residual glacial-marine facies are sediments remaining after ocean currents have winnowed and removed fine grained material.
4.2.3 Surficial Sediment Facies
Since the relatively simple, Antarctic shelf-wide, glacial-marine sedimentation
model was proposed by Anderson et al. (1983), much work has been done to refine
depositional models that can be applied to the wide range of settings in Antarctica
(Domack and Harris 1998). Most revised models have only targeted specific
depositional environments such as facies successions resulting from ice shelf retreat
(Domack and Harris 1998, Harris and O'Brien 1998), or marine sedimentation at a
calving ice wall margin (Ashley and Smith 2000). The most common contribution in
facies descriptions has come from workers describing surficial sediments around the
Antarctic continental shelf. This is not surprising given the relative ease of obtaining
sediments in grab samples compared to deep water cores, or the use of technology
such as sidescan sonar and the newer multibeam echosounders to remotely sense
images of the seafloor.
Surficial sedimentary facies over the continental shelf off George V Land
were described based upon the lithology of sediments in cores obtained during
32
Operation Deep Freeze 1979. Domack (1988) classified surface sediments into
carbonate and siliceous facies. Carbonate facies occurred in two distinct zones on the
continental shelf: a nearshore region bordering the ice sheet at depths shallower than
approximately 250 m containing in situ and reworked accumulations of calcareous
shell material; and on the upper continental slope and on the outer shelf adjacent to
shallow banks. Siliceous facies occurred as shelf basin sediments below
approximately 500 m. This classification contributed to the Domack (1988)
depositional model for Antarctic glacial-marine environment on the continental shelf
(refer Chapter 1 - Figure 1.3).
The first part of this chapter has discussed the sedimentological results from
core DF79-12, and described Antarctic glacial-marine facies and surficial sediments
within the George V Basin. This information provides a baseline for the results of this
project, presented in the second part of the chapter.
4.3 Results
The sedimentological results commence with area, volume and carbon content
statistics, which are essential for comparison against other drift deposits. Carbon
content is calculated as these deposits may play a significant role in the carbon cycle
of the Antarctic continental shelf (Harris et al. 1999). An aim of this thesis was to
determine if the Mertz Drift has some underlying pattern of deposition. This part of
the chapter will explain how facies were classified within Mertz Drift cores and the
general pattern of appearance. Ice-rafted debris (IRD) gravel content is also measured
within cores to ascertain whether there are patterns of deposition in the drift. Seafloor
photographs are discussed to help determine the modern environment of deposition.
4.3.1 Area, Volume and Carbon Content
An estimation of the area and volume of each sediment isopach (i.e. vertical
columns) is given in Table 6.1. These results indicate the Mertz Drift has an area of
approximately 390 km2 and a volume of 5 km3. The greatest areal coverage over the
drift (111.074 km2) is observed where the isopach thickness is 0-5 m. However, in
33
terms of volume contribution to the whole drift it is relatively low (0.555 km3). The
greatest contribution to volume is found where isopach thickness is 10-15 m
(1.622km3), yet here, area is similar to the 0-5 m isopach coverage (108.120 km2).
Isopach Thickness (m) Area (km2) Volume (km3) 0-5 111.074 0.555 5-10 96.157 0.962 10-15 108.120 1.622 15-20 23.884 0.478 20-25 18.120 0.453 25-30 17.417 0.523 30-35 13.926 0.487 total 388.698 5.080
Table 4.1 Mertz Drift area and volume.
Calculations of carbon content utilised the approximate volume of 5 km3
determined from the total volume calculated in Table 6.1. The estimate of carbon
content of the Mertz Drift is 78 Mt, when derived from the following calculations:
(1) volume of solids = 5 km3 x 40% = 2 km3
(2) mass of solids = 2 km3 x 2 600 kg/m3 = 5200 million tonnes (Mt)
(3) carbon content = 5200 Mt x 1.5% = 78 Mt
4.3.2 Facies Classification
Examination of the X-radiographs of the Mertz Drift cores indicates an
improved classification scheme is required when compared to Domack's (1988) X-
radiograph interpretation of core DF79-12 (Figure 4.1). This was achieved by
incorporating information such as the sedimentary structures revealed by the X-
radiographs, and the grain size variations recorded in visual logs and multi-sensor
core logger data. The Domack (1988) 'discontinuous laminae' facies was not used
because of the difficulty in observing a difference between any discontinuous laminae
and massively bedded sedimentary structure within X-radiographs of Mertz Drift
cores. Sediments containing observed discontinuous laminae were classified within
'massively bedded siliceous mud and ooze' (SMO) facies in this study.
34

Five distinct facies are recognised and classified into: massively bedded SMO;
massively bedded fine sand/SMO; laminated SMO; cross laminated SMO; and
diamicton. Facies interpretation logs of all Mertz Drift cores are presented as figures
within Appendix A in order of station number. A facies interpretation legend is given
in Appendix A (Figure A1). The facies interpretation logs include intervals where
sedimentary structures were not obvious due to dark X-radiographs (~ 7% of core X-
radiographs). Facies interpretation logs in Appendix A also record the burrows
observed within each core. The presence of facies within cores and the approximate
percentage of facies from all cores is given in Table 4.2. Table 4.3 records the
approximate percentage of burrows occurring in facies from all cores. The presence of
facies within cores, the percentage of facies and percentage of burrows in facies is
tabled to assist in determining any patterns of deposition within the Mertz Drift.
Cores
massively bedded SMO
massively bedded
fine sand/SMO
laminated SMO
cross laminated
SMO
diamicton
11GC02 x x 11GC03 x x x x 12GC04 x x x 13GC05 x x x x 13GC06 x x x x 14GC07 x x x x 15GC08 x x x 15GC09 x x 16PC01 x x x x 17PC02 x x x x x 18PC03 x x x x 19PC04 x x x x x 20PC05 x x x 23PC09 x x x x 24PC10 x x x 25PC11 x x 26PC12 x x x x x 27PC13 x x x x x
~ % 33 10 48 4 5 Table 4.2 Presence (x) of facies and approximate percentage of each facies from all Mertz Drift cores. Note 48% of all cores is laminated SMO, or the highest proportion of facies overall.
35
massively bedded SMO
massively bedded
fine sand/SMO
laminated SMO
cross laminated
SMO
diamicton
~ % 60 24 16 0 0 Table 4.3 Approximate percentage of burrows occurring in each facies from all Mertz Drift cores. Note 60% of all burrows occurs in massively bedded SMO facies, or the highest proportion of burrows overall.
The following descriptions define the facies classification applied in this
study, discuss the overall presence within cores, and provide images of X-radiographs
as examples:
(1) Massively bedded SMO. This facies is the equivalent of Domack's (1988)
'massive beds'. X-radiographs displayed convoluted or no discernible (massive)
sedimentary structure (Figure 4.4). Visual core logs often recorded these intervals
with mottles. Burrows were often seen within the X-radiographs. Approximately 60%
of all burrows observed within Mertz Drift cores appeared in this facies (Table 4.3).
0cm
10
convoluted and/or massive structure
IRD gravel
dark-toned burrow
Figure 4.4 X-radiograph example and line drawing of massively bedded SMO facies within core 26PC12 (depth 393-408 cm).
36

Massively bedded SMO represents approximately 33% of all Mertz Drift
cores, or the second most common facies (Table 4.2). This facies was observed in all
cores studied (Table 4.2). This facies conforms to the compound glacial-marine facies
of Anderson et al. (1983), as it comprises a mixture of glacial and marine
components.
(2) Massively bedded fine sand/SMO. Domack (1988) did not provide a
classification for this facies. Within massively bedded fine sand/SMO, X-radiographs
of Mertz Drift cores reveal sedimentary structure as convoluted or massive (Figure
4.5). This facies is similar to the previously described massively bedded SMO except
that numerous sand grains may be seen as dark-toned (dense) material in X-
radiographs. Ice-rafted debris (IRD) gravel and dark-toned mottles, which may be
sponge spicules according to the visual observation logs, are often observed in the X-
radiographs. Burrows are also relatively numerous with approximately 24% of all
burrows appearing in this facies (Table 4.3).
0cm
10
convoluted and/or massive structure
dark mottles
IRD gravel
numerous sand grains
core-top
Figure 4.5 X-radiograph example and line drawing of massively bedded fine sand/SMO facies from core 16PC01 (depth 0-15 cm). Note: dark mottles may be sponge spicules.
37

Massively bedded fine sand/SMO represents approximately 10% of all Mertz
Drift cores (Table 4.2). This facies is observed in 16 of the 18 recovered cores (Table
4.2). Cores with no evidence of this facies expression were cores 15GC09 and
25PC11, from the channel between the large and small lobes of the drift. Massively
bedded fine sand/SMO also conforms to the compound glacial-marine facies of
Anderson et al. (1983).
(3) Laminated SMO. This facies is the equivalent of Domack's (1988) 'laminations'.
Laminated SMO facies are revealed by distinct horizontal dark- and light-toned
laminae within the X-radiographs of Mertz Drift cores (Figure 4.6). Burrows are not
as numerous with only approximately 16% of all burrows observed within this facies
(Table 4.3).
0cm
10
horizontal, dark and light-toned laminae
Figure 4.6 X-radiograph example and line drawing of laminated SMO facies within core 17PC02 (depth 164-179 cm). In this 15 cm section, dark-toned laminae have an approximate mean thickness of 2.7 mm; light-toned laminae have a mean thickness of 3.1 mm
Laminated SMO comprises approximately 48% of all Mertz Drift cores, and
was the predominant sedimentary structure discernible within X-radiographs (Table
4.2). All Mertz Drift cores, except cores 11GC02, 20PC05 and 24PC10, were
38
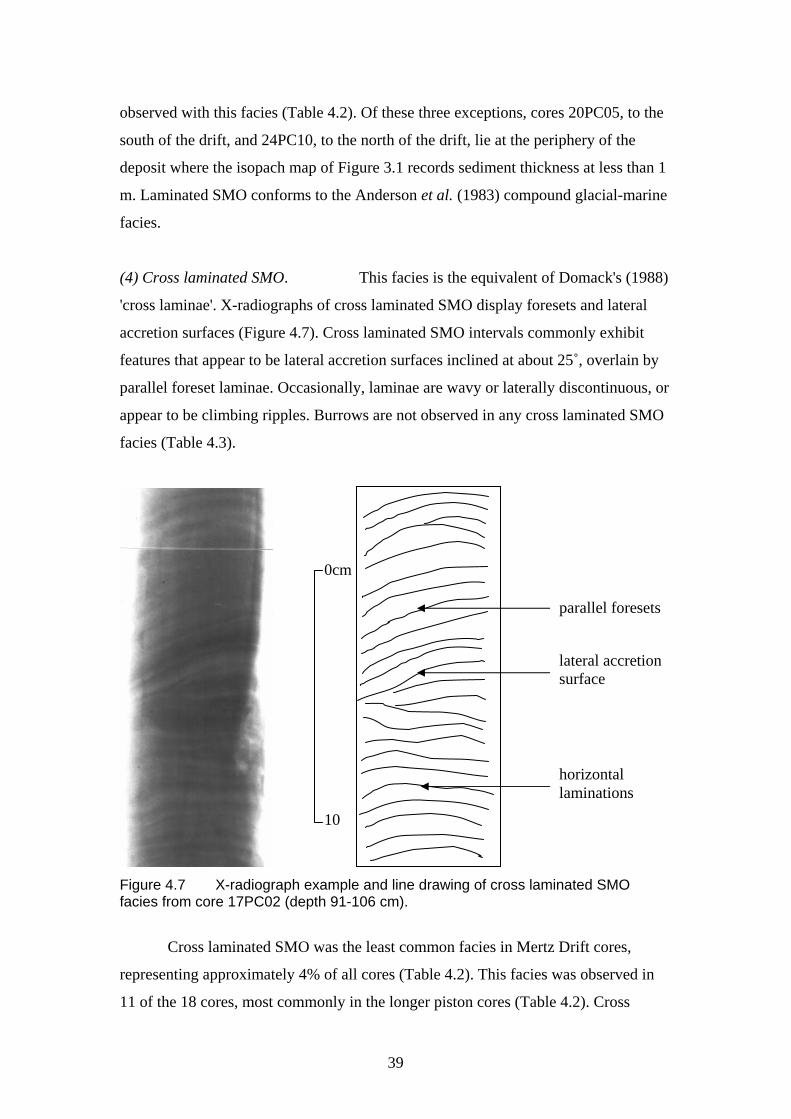
observed with this facies (Table 4.2). Of these three exceptions, cores 20PC05, to the
south of the drift, and 24PC10, to the north of the drift, lie at the periphery of the
deposit where the isopach map of Figure 3.1 records sediment thickness at less than 1
m. Laminated SMO conforms to the Anderson et al. (1983) compound glacial-marine
facies.
(4) Cross laminated SMO. This facies is the equivalent of Domack's (1988)
'cross laminae'. X-radiographs of cross laminated SMO display foresets and lateral
accretion surfaces (Figure 4.7). Cross laminated SMO intervals commonly exhibit
features that appear to be lateral accretion surfaces inclined at about 25˚, overlain by
parallel foreset laminae. Occasionally, laminae are wavy or laterally discontinuous, or
appear to be climbing ripples. Burrows are not observed in any cross laminated SMO
facies (Table 4.3).
0cm
10
horizontal laminations
lateral accretion surface
parallel foresets
Figure 4.7 X-radiograph example and line drawing of cross laminated SMO facies from core 17PC02 (depth 91-106 cm).
Cross laminated SMO was the least common facies in Mertz Drift cores,
representing approximately 4% of all cores (Table 4.2). This facies was observed in
11 of the 18 cores, most commonly in the longer piston cores (Table 4.2). Cross
39

laminated SMO occurs as intervals of about 7 cm thickness usually within the
laminated SMO facies. This facies corresponds to the Anderson et al. (1983)
compound glacial-marine facies.
(5) Diamicton. Domack (1988) also classified this facies 'diamicton'.
Diamicton consists of massively bedded muddy gravel, observed in X-radiographs as
very dark (dense) grains (Figure 4.8). Burrows were not observed within this facies
(Table 4.3).
0cm
10
massively bedded SMO
very dark, dense sand and gravel
sharp contact boundary
Figure 4.8 X-radiograph example and line drawing of diamicton facies from core 26PC12 (depth 486-501 cm).
Diamicton represents approximately 5% of all Mertz Drift cores (table 4.2).
Diamicton only occurred within six piston cores that were sufficiently long to
penetrate through the drift (Table 4.2). This facies matches the transitional glacial-
marine facies of Anderson et al. (1983).
40
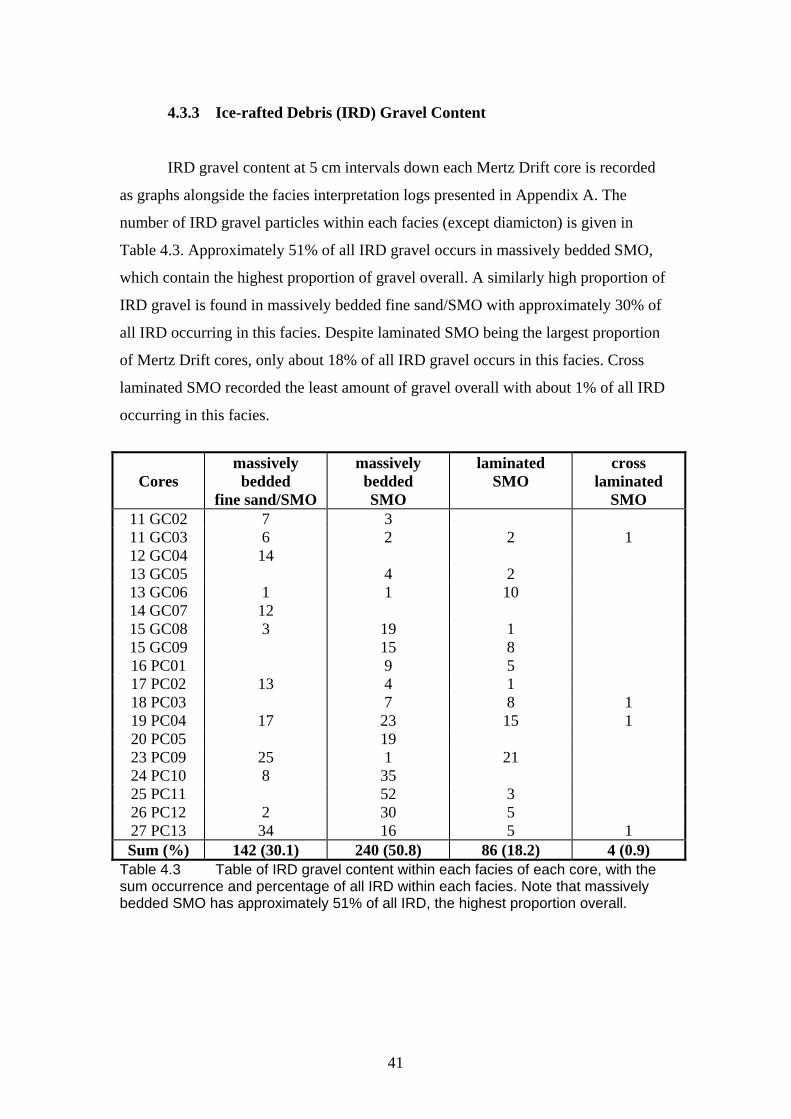
4.3.3 Ice-rafted Debris (IRD) Gravel Content
IRD gravel content at 5 cm intervals down each Mertz Drift core is recorded
as graphs alongside the facies interpretation logs presented in Appendix A. The
number of IRD gravel particles within each facies (except diamicton) is given in
Table 4.3. Approximately 51% of all IRD gravel occurs in massively bedded SMO,
which contain the highest proportion of gravel overall. A similarly high proportion of
IRD gravel is found in massively bedded fine sand/SMO with approximately 30% of
all IRD occurring in this facies. Despite laminated SMO being the largest proportion
of Mertz Drift cores, only about 18% of all IRD gravel occurs in this facies. Cross
laminated SMO recorded the least amount of gravel overall with about 1% of all IRD
occurring in this facies.
Cores massively
bedded fine sand/SMO
massively bedded SMO
laminated SMO
cross laminated
SMO 11 GC02 7 3 11 GC03 6 2 2 1 12 GC04 14 13 GC05 4 2 13 GC06 1 1 10 14 GC07 12 15 GC08 3 19 1 15 GC09 15 8 16 PC01 9 5 17 PC02 13 4 1 18 PC03 7 8 1 19 PC04 17 23 15 1 20 PC05 19 23 PC09 25 1 21 24 PC10 8 35 25 PC11 52 3 26 PC12 2 30 5 27 PC13 34 16 5 1 Sum (%) 142 (30.1) 240 (50.8) 86 (18.2) 4 (0.9)
Table 4.3 Table of IRD gravel content within each facies of each core, with the sum occurrence and percentage of all IRD within each facies. Note that massively bedded SMO has approximately 51% of all IRD, the highest proportion overall.
41

An example of the relative differences in IRD gravel content between facies is
recorded in the gravel content graph of core 27PC13, from the east side of the drift
(Figure 4.9). A peak of four gravel particles per 5 cm occurs within the massively
bedded SMO at the bottom of the core. Within the predominantly laminated SMO and
cross laminated SMO in the middle of the core is relatively low gravel content (one to
two particles per 5 cm interval). At the top of core 27PC13, peaks of up to six gravel
particles per 5 cm interval occur within the massively bedded fine sand/SMO.
42
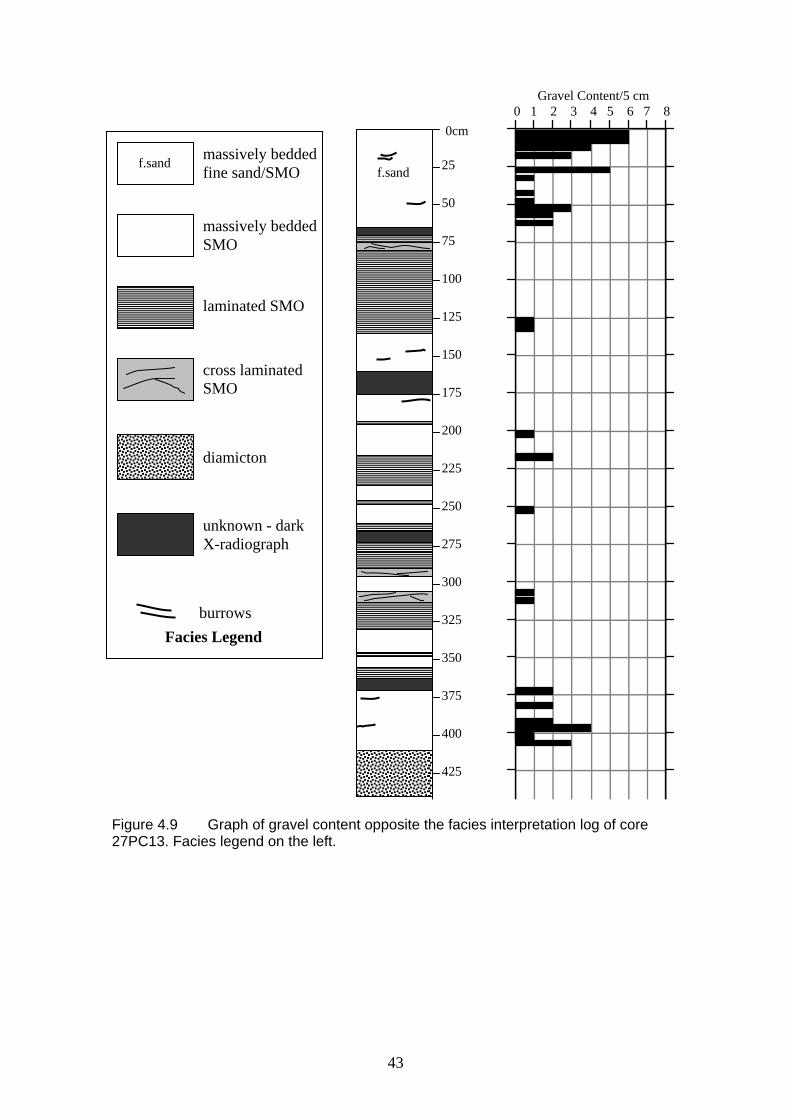
0cm
25
50
75
100
125
150
175
200
225
250
275
300
325
350
375
400
425
f.sand
Gravel Content/5 cm 0 1 2 3 4 5 6 7 8
Figure 4.9 Graph of gravel content opposite the facies interpretation log of core 27PC13. Facies legend on the left.
cross laminated SMO
massively bedded fine sand/SMO
laminated SMO
burrows
diamicton
unknown - dark X-radiograph
massively bedded SMO
f.sand
Facies Legend
43

4.3.4 Seafloor Photographs
Of the six stations photographed over the Mertz Drift during the WEGA
research expedition, only station number 24, at the very north of the drift revealed
clear photographs of the seafloor. The remaining photographs were too obscured by
turbidity in the water column to be useful. The two photos of station 24 are shown in
Figures 4.10 and 4.11.
Figure 4.10 Photograph of seafloor at station 24 in 819 metres of water (source: Brancolini and Harris 2000). Note the current tilted 20 cm long Sea pen (centre) and particles reflecting camera flash in the water column (top of photo).
44

Figure 4.11 Photograph of seafloor at station 24 in 819 metres of water (source: Brancolini and Harris 2000). Note the two large spherical glass sponges and angular ice-rafted cobble behind (centre-right). Smaller organisms in foreground may be golfball sponges with irregular projections. Sea pen in far backgound (top-right).
The organisms observed in the photographs are described as epibenthic
suspension feeders that filter material entrained within the water column due to strong
currents (Arntz and Gallardo 1994; Edgar 1997). The spherical, stalked sponges
belong to the Class Hexactinellida. These sponges are mostly deepwater with
exquisite glasslike skeletons (Buchsbaum et al. 1987). They are highly adapted to soft
sediments but require some hardened material for attachment such as a rock or sponge
spicule mat (Gowlett-Holmes 2000). Sea pens belong to Class Anthozoa Order
Pennatulacea, and live with the stalk embedded in mud. The featherlike upper portion
of the colony bears feeding polyps that capture tiny animals swept along in seabottom
currents (Buchsbaum et al. 1987). Descriptions of seafloor photographs are
summarised in Table 4.4. The substrate observed within the photographs is siliceous
facies from Domack's (1988) surfical sedimentary facies classification. However, the
substrate most likely represents massively bedded fine sand/SMO facies in this
present study.
45

Station 24
Latitude 66˚ 28'.89 south
Longitude 143˚ 08'.20 east
Water depth 819m
Silty mud and ooze with current tilted solitary sea pen.
Station 24
Latitude 66˚ 28'.89 south
Longitude 143˚ 08'.20 south
Water depth 819m
Silty mud and ooze and ice-rafted cobble. Biota are glass sponges, golfball sponges and a sea pen. Table 4.4 Location and summary of seafloor photograph descriptions of Station 24 on the Mertz Drift.
4.4 Summary of Results
In summary, the Mertz Drift has an area of approximately 390 km2 and a
volume of 5 km3. Carbon content of the drift is 78 million tonnes (Mt).
The five facies identified in Mertz Drift cores in relation to the Domack
(1988) classification and modified classification of this study are:
(1) Massively bedded SMO. Observed as 33% of all Mertz Drift cores, and recorded
in all cores. Approximately 60% of all burrows observed appeared in this facies.
Massively bedded SMO has the most IRD gravel content at 51% of all IRD gravel
occurring in this facies.
(2) Massively bedded fine sand/SMO. Represented approximately 10% of all Mertz
Drift cores, and is found in 16 out of 18 cores. Approximately 24% of all burrows
occur in this facies. Massively bedded fine sand/SMO also has a large proportion of
gravel content at 30% of all IRD gravel present in this facies.
(3) Laminated SMO. Comprised approximately 48% of all Mertz Drift cores, and is
the most common facies observed. This facies is in 15 out of 18 cores. Despite being
the predominant facies overall, only 16% of all burrows appear within this facies.
Laminated SMO recorded only 18% of all IRD gravel overall.
(4) Cross laminated SMO. Represented approximately 4% of all Mertz Drift cores,
and is the least common facies recorded. This facies is in 11 out of 18 cores. Burrows
46

were not seen in any cross laminated SMO facies. Cross laminated SMO recorded the
least amount of IRD gravel content at 1% of all IRD in this facies.
(5) Diamicton. Observed in approximately 5% of all Mertz Drift cores. Diamicton
only occurred within six cores that were sufficiently long to penetrate through the
Mertz Drift. Burrows were not observed within this facies. IRD gravel content was
not quantified in diamicton.
Seafloor photographs at one site record sponge communities and Anthozoa on
the Mertz Drift. This benthos is adapted for growing on soft sediments, and consists
of epibenthic suspension feeders that filter material swept along by strong currents.
The substrate represents massively bedded fine sand/SMO facies.
47

Chapter 5. Palaeoclimatology
5.1 Introduction
Chapter Five discusses palaeoclimatology, in particular the timing and glacial
development of East Antarctica since the Last Glacial Maximum (LGM). Information
on glacial history will provide a baseline from which to compare the results of the
radiocarbon age data from the Mertz Drift cores. Thus, this chapter is in two parts.
Part one begins with a brief overview of radiocarbon dating and its use in Antarctic
marine cores. A general view of the timing of post-LGM glacial development of East
Antarctica is presented. This first part also discusses the geographic limits of the last
glacial advance off George V Land, and the radiocarbon age results of 'Operation
Deep Freeze' 1979 (DF79), in particular, the ages obtained from core DF79-12. The
results of ages from core DF79-12 have been used to constrain the timing for the
retreat of the Mertz Glacier over the George V Basin.
The second part of this chapter presents the results of radiocarbon dating
samples from the Mertz Drift cores. Sediment accumulation rates are calculated for
cores 13GC05, 13GC06 and 26PC12, and are compared against the facies within the
cores to determine if there are any underlying sedimentation patterns within the Mertz
Drift. The laminations observed within X-radiographs and visual core logs of cores
13GC05 and 13GC06 are compared against one another for accuracy, then the mean
deposition time is calculated for lamination couplets in cores 13GC05 and 26PC12.
The reason for calculating the mean deposition time for lamination couplets is
because an hypothesis of this study is that Mertz Drift sediments largely result from
diatom blooms due to annual seasonal changes in sea ice cover. The mean deposition
time thus assists in determining whether lamination couplets have an annual cyclicity.
A summary of the Mertz Drift results concludes Chapter Five.
48
5.2 Palaeoclimatology
5.2.1 Radiocarbon Dating
The timing of glacial and climatic events since the Last Glacial Maximum
(LGM) in Antarctica is determined primarily through radiocarbon or carbon-14 dating
(Ingolfsson et al. 1998). Therefore, an understanding of the problems and limitations
of this dating technique is important before interpretations of dates can be made.
Radiocarbon dating uses carbon-14 obtained from terrestrial and aquatic mosses,
marine materials like mollusc shells, foraminifera, phytoplankton carbon and marine
mammal bones (Ingolfsson et al. 1998). Antarctic deep marine sediments lack calcite
due to the dissolution of calcium carbonate, yet they contain significant amounts of
organic carbon that may be used for radiocarbon dating (Domack et al. 1989).
The carbon-14 content of all marine organisms is affected by the 'reservoir
effect', which produces marine species with apparent radiocarbon ages older than they
really are (Berkman and Forman 1996). In Antarctic living marine species, the
reservoir effect commonly exceeds 1000 years, which is much older than marine
species from other parts of the world (Berkman and Forman 1996). An effect of this
scale is believed to arise from the depletion of carbon-14 in oceanic surface water
around Antarctica, and relates to the antiquity of the carbon pool in the Southern
Ocean (Berkman et al. 1998). The depletion of carbon-14 results in modern
radiocarbon ages for Antarctic marine samples that appear too old (Verkulich and
Hiller 1994; Cunningham et al. 1999). To correct radiocarbon ages obtained from
shallow marine fossils, which may contain sufficient calcium carbonate for dating, a
reservoir correction value is subtracted from the obtained radiocarbon age (Berkman
and Forman 1996; Berkman et al. 1998). A number of researchers use a circum-
Antarctic reservoir correction value of 1000 to 1300 years (Baroni and Orombelli
1991; Ingolfsson et al. 1998), but this correction value may vary regionally (Berkman
and Forman 1996).
When dating deep Antarctic marine sediments, the lack of calcium carbonate
or large marine fossils requires dating organic carbon, and using a standard reservoir
49

correction value has not always resulted in bringing marine sediment core-tops to the
modern age (Cunningham et al. 1999; McMinn 2000). This is possibly due to
plankton harvesting anomalously 'old' surface waters mixed with glacial meltwater
(Domack et al. 1989) or at the seafloor through reworking of older sediment by
glacial advance and contamination of the modern sediments (Harris et al. 1996). The
practice amongst marine sediment workers is to subtract the core-top radiocarbon age
from the remainder of downcore radiocarbon ages (Cunningham et al. 1999; McMinn
2000). This methodology assumes an age offset due to the reservoir effect and that
contamination is constant through time. Neither of these assumptions may be accurate
in providing true corrected ages (Cunningham et al. 1999).
5.2.2 Post-LGM Glacial Development of East Antarctica
The timing of the Last Glacial Maximum (LGM) around Antarctica is
believed to have coincided with the timing of lowest global sea levels around 20,000-
18,000 years Before Present (yr BP; Ingolfsson et al. 1998). Current opinion suggests
that as the Northern Hemisphere continental ice sheets retreated and global sea level
began to rise about 18,000 years ago, the outlet glaciers along the East Antarctic
continental shelf were also forced to retreat landward (Harris and O'Brien 1998).
Using a marine sediment core from Prydz Bay (core sections 1R-3R Ocean Drilling
Program Leg 119, Site 740A), the timing of glacial retreat showed siliceous mud and
diatom ooze (SMO) was initially deposited after 10,700 yr BP, thus dating the time of
ice shelf retreat past the core site (Domack et al. 1991). Harris and O'Brien (1998)
also confirm that the onset of open marine conditions after the LGM occurred about
10,000 yr BP on the outer shelf off Mac.Robertson Land, near Prydz Bay. A facies
succession from SMO to terrigenous sediment and back to SMO within Prydz Bay
was interpreted as evidence of a surge in the outlet system of the Lambert Glacier
synchronous with a mid-Holocene warming event (Domack et al. 1991).
Given the paucity of data from marine sediments along the Antarctic
continental shelf, evidence for the timing of post-LGM glacial retreat is more
numerous from studies on land (Ingolfsson et al. 1998). These include studies of
glacial morphology (Goodwin 1996; Colhoun 1997), lake sediments (Roberts and
50

McMinn 1999; Roberts et al. 2000), raised beaches (Baroni and Orombelli 1991;
Berkman et al. 1998) and fossil penguin rookeries (Heine and Speir 1989; Emslie et
al. 1998). In the review and broad synthesis of East Antarctic glacial history since the
LGM, Ingolfsson et al. (1998) applied a standard 1300 year reservoir correction to all
radiocarbon ages (Figure 5.1).
Figure 5.1 Broad synthesis for glacial and climatic development in East Antarctica since the LGM (source: Ingolfsson et al. 1998). The LGM is believed to have occurred 20,000-18,000 yr BP (Ingolfsson et al. 1998).
Ingolfsson et al. (1998) found that all land based studies of East Antarctica
inferred relatively moderate ice thickness during the LGM, with ice extending off the
present shore, but not far onto the shelf. Ice retreat from the shelf areas was underway
by 13,000 to 10,000 yr BP (Berkman et al. 1998; Ingolfsson et al. 1998). The oldest
deglaciation dates show freshwater and avian habitats developed in coastal areas
between 12,000 to 8000 yr BP (Ingolfsson et al. 1998; Roberts and McMinn 1999).
Indications of a minor mid-Holocene glacial readvance from 6200 yr BP are reported
from glaciers in the Bunger Hills (Colhoun 1997).
51
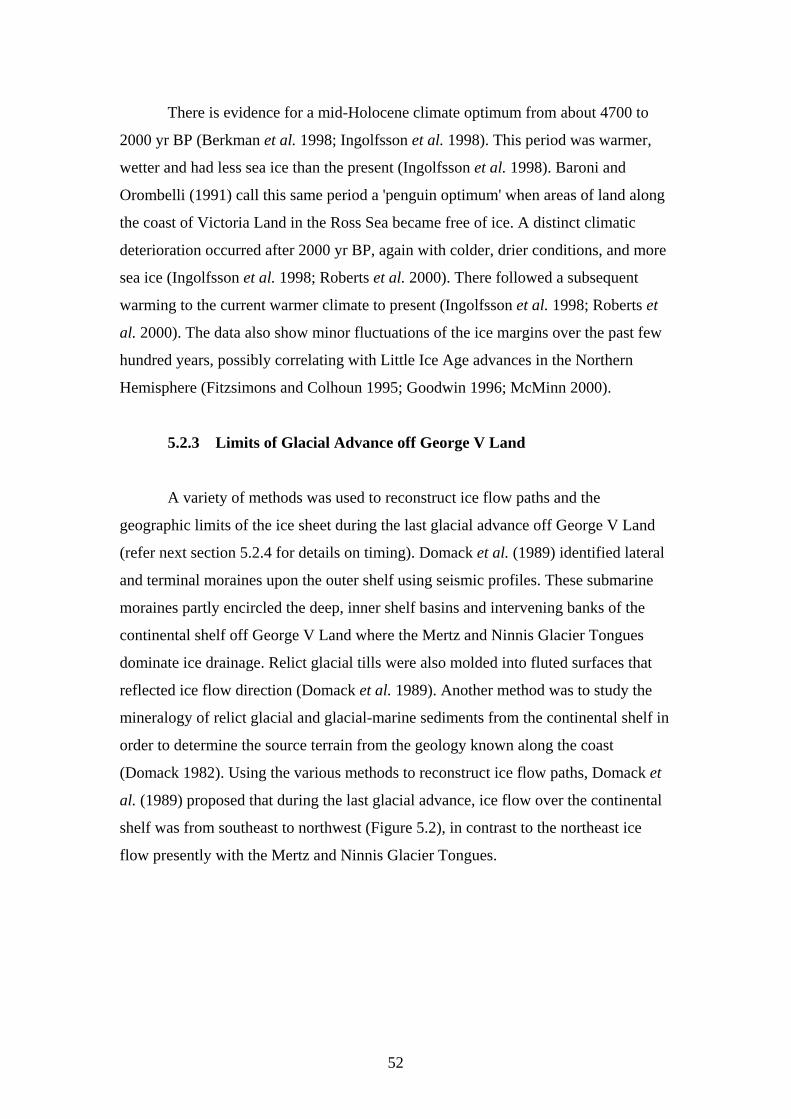
There is evidence for a mid-Holocene climate optimum from about 4700 to
2000 yr BP (Berkman et al. 1998; Ingolfsson et al. 1998). This period was warmer,
wetter and had less sea ice than the present (Ingolfsson et al. 1998). Baroni and
Orombelli (1991) call this same period a 'penguin optimum' when areas of land along
the coast of Victoria Land in the Ross Sea became free of ice. A distinct climatic
deterioration occurred after 2000 yr BP, again with colder, drier conditions, and more
sea ice (Ingolfsson et al. 1998; Roberts et al. 2000). There followed a subsequent
warming to the current warmer climate to present (Ingolfsson et al. 1998; Roberts et
al. 2000). The data also show minor fluctuations of the ice margins over the past few
hundred years, possibly correlating with Little Ice Age advances in the Northern
Hemisphere (Fitzsimons and Colhoun 1995; Goodwin 1996; McMinn 2000).
5.2.3 Limits of Glacial Advance off George V Land
A variety of methods was used to reconstruct ice flow paths and the
geographic limits of the ice sheet during the last glacial advance off George V Land
(refer next section 5.2.4 for details on timing). Domack et al. (1989) identified lateral
and terminal moraines upon the outer shelf using seismic profiles. These submarine
moraines partly encircled the deep, inner shelf basins and intervening banks of the
continental shelf off George V Land where the Mertz and Ninnis Glacier Tongues
dominate ice drainage. Relict glacial tills were also molded into fluted surfaces that
reflected ice flow direction (Domack et al. 1989). Another method was to study the
mineralogy of relict glacial and glacial-marine sediments from the continental shelf in
order to determine the source terrain from the geology known along the coast
(Domack 1982). Using the various methods to reconstruct ice flow paths, Domack et
al. (1989) proposed that during the last glacial advance, ice flow over the continental
shelf was from southeast to northwest (Figure 5.2), in contrast to the northeast ice
flow presently with the Mertz and Ninnis Glacier Tongues.
52
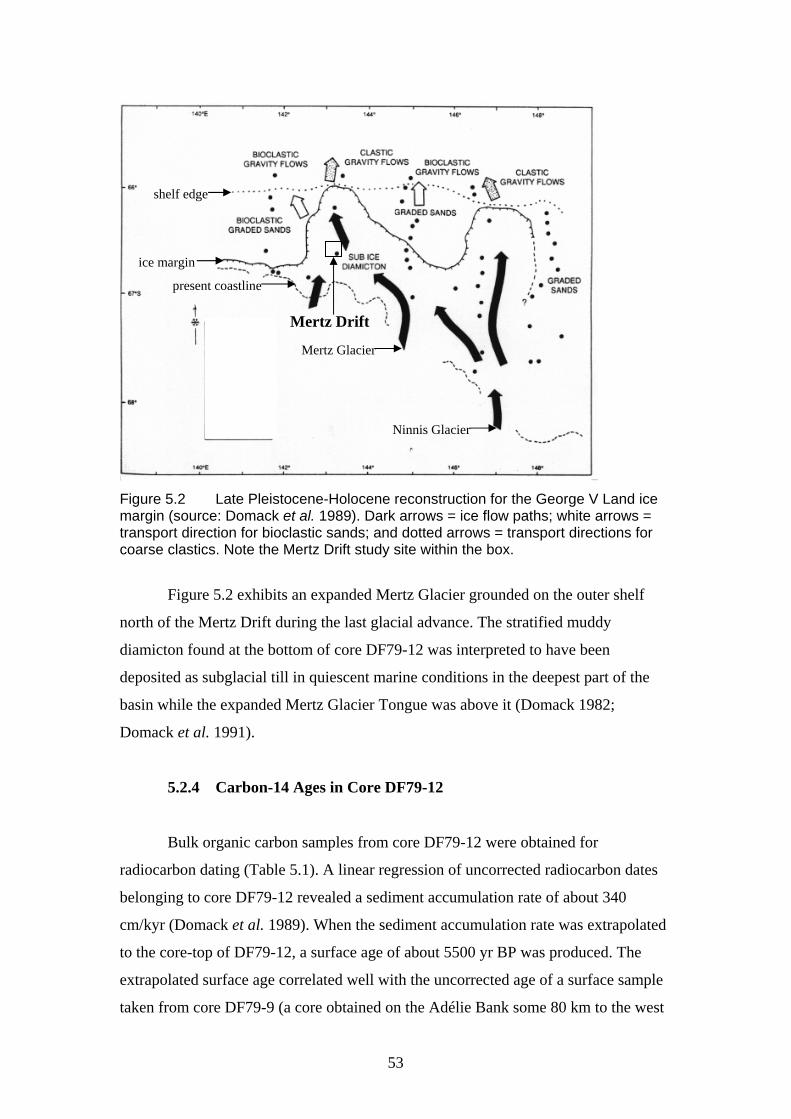
present coastline
Mertz Drift
ice margin
shelf edge
Ninnis Glacier
Mertz Glacier
Figure 5.2 Late Pleistocene-Holocene reconstruction for the George V Land ice margin (source: Domack et al. 1989). Dark arrows = ice flow paths; white arrows = transport direction for bioclastic sands; and dotted arrows = transport directions for coarse clastics. Note the Mertz Drift study site within the box.
Figure 5.2 exhibits an expanded Mertz Glacier grounded on the outer shelf
north of the Mertz Drift during the last glacial advance. The stratified muddy
diamicton found at the bottom of core DF79-12 was interpreted to have been
deposited as subglacial till in quiescent marine conditions in the deepest part of the
basin while the expanded Mertz Glacier Tongue was above it (Domack 1982;
Domack et al. 1991).
5.2.4 Carbon-14 Ages in Core DF79-12
Bulk organic carbon samples from core DF79-12 were obtained for
radiocarbon dating (Table 5.1). A linear regression of uncorrected radiocarbon dates
belonging to core DF79-12 revealed a sediment accumulation rate of about 340
cm/kyr (Domack et al. 1989). When the sediment accumulation rate was extrapolated
to the core-top of DF79-12, a surface age of about 5500 yr BP was produced. The
extrapolated surface age correlated well with the uncorrected age of a surface sample
taken from core DF79-9 (a core obtained on the Adélie Bank some 80 km to the west
53
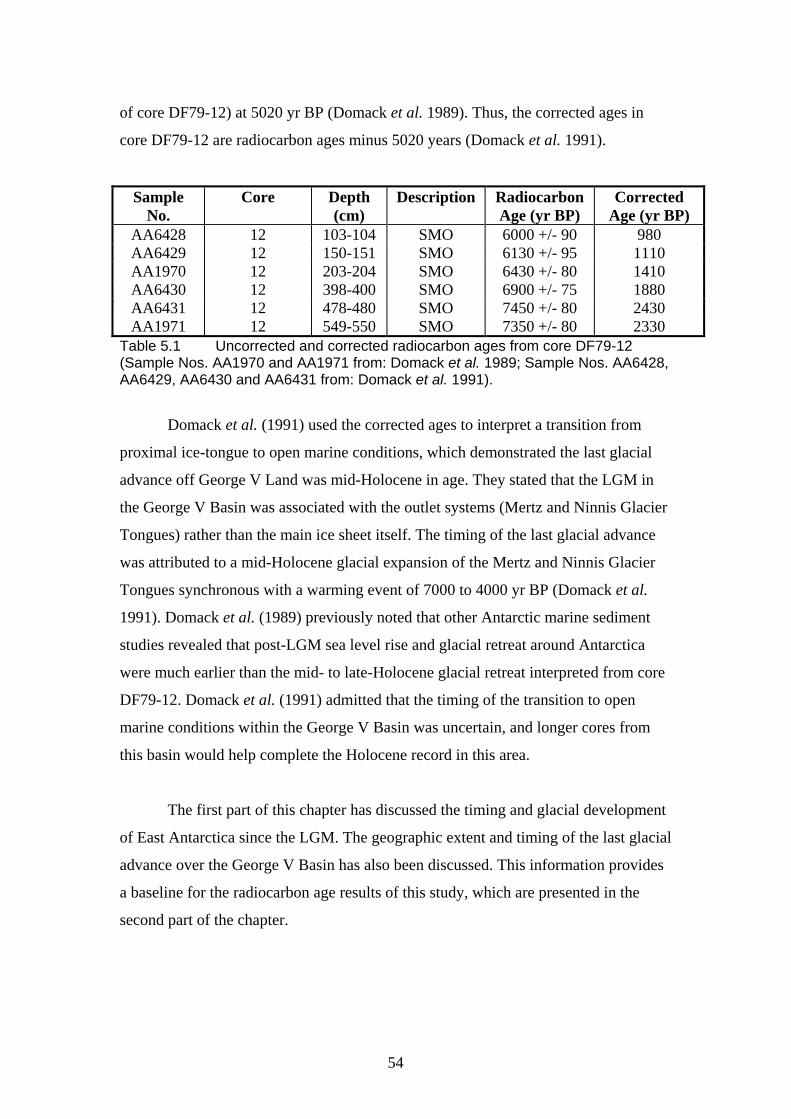
of core DF79-12) at 5020 yr BP (Domack et al. 1989). Thus, the corrected ages in
core DF79-12 are radiocarbon ages minus 5020 years (Domack et al. 1991).
Sample No.
Core Depth (cm)
Description Radiocarbon Age (yr BP)
Corrected Age (yr BP)
AA6428 12 103-104 SMO 6000 +/- 90 980 AA6429 12 150-151 SMO 6130 +/- 95 1110 AA1970 12 203-204 SMO 6430 +/- 80 1410 AA6430 12 398-400 SMO 6900 +/- 75 1880 AA6431 12 478-480 SMO 7450 +/- 80 2430 AA1971 12 549-550 SMO 7350 +/- 80 2330
Table 5.1 Uncorrected and corrected radiocarbon ages from core DF79-12 (Sample Nos. AA1970 and AA1971 from: Domack et al. 1989; Sample Nos. AA6428, AA6429, AA6430 and AA6431 from: Domack et al. 1991).
Domack et al. (1991) used the corrected ages to interpret a transition from
proximal ice-tongue to open marine conditions, which demonstrated the last glacial
advance off George V Land was mid-Holocene in age. They stated that the LGM in
the George V Basin was associated with the outlet systems (Mertz and Ninnis Glacier
Tongues) rather than the main ice sheet itself. The timing of the last glacial advance
was attributed to a mid-Holocene glacial expansion of the Mertz and Ninnis Glacier
Tongues synchronous with a warming event of 7000 to 4000 yr BP (Domack et al.
1991). Domack et al. (1989) previously noted that other Antarctic marine sediment
studies revealed that post-LGM sea level rise and glacial retreat around Antarctica
were much earlier than the mid- to late-Holocene glacial retreat interpreted from core
DF79-12. Domack et al. (1991) admitted that the timing of the transition to open
marine conditions within the George V Basin was uncertain, and longer cores from
this basin would help complete the Holocene record in this area.
The first part of this chapter has discussed the timing and glacial development
of East Antarctica since the LGM. The geographic extent and timing of the last glacial
advance over the George V Basin has also been discussed. This information provides
a baseline for the radiocarbon age results of this study, which are presented in the
second part of the chapter.
54

5.3 Results
One of the aims of this study was to use radiocarbon age data to explain the
timing of any facies succession, and whether the Mertz Drift sediments do record a
high resolution of palaeoenvironment change during the Holocene. The results of
radiocarbon age data from samples obtained from Mertz Drift cores are presented.
Sediment accumulation rates are calculated for cores 13GC05, 13GC06 and 26PC12,
then compared against facies interpretation logs of the cores in order to determine if
there are any underlying sedimentation patterns. Lamination couplets observed within
X-radiographs and visual core logs of cores 13GC05 and 13GC06 are compared
against one another for accuracy, then mean deposition time is calculated for
lamination couplets in cores 13GC05 and 26PC12. The mean deposition time is
calculated in order to determine whether lamination couplets have an annual cyclicity.
An annual cyclicity may prove one of the hypotheses for this study - that Mertz Drift
sediments largely result from diatom blooms due to annual seasonal changes in sea
ice cover.
5.3.1 Radiocarbon Ages
Twenty-five radiocarbon ages had been received from the Institute of
Geological and Nuclear Sciences, New Zealand. An additional radiocarbon age was
received from Geochron Laboratory, Massachusetts, USA. Table 5.2 documents
uncorrected radiocarbon and corrected ages. Note that errors are additive for corrected
age. Uncorrected radiocarbon ages are also displayed next to the facies interpretation
logs of Mertz Drift cores presented within Appendix A.
55

Lab No. Core Depth (cm)
Description Radiocarbon Age (yr BP)
Corrected Age (yr BP)
NZA11851 13GC05 0-1 f.sand/SMO 3155 +/- 70 0 +/- 70 NZA11892 13GC05 15-16 SMO 5653 +/- 60 2498 +/- 130 NZA11893 13GC05 100-101 SMO 5881 +/- 60 2726 +/- 130 NZA11924 13GC05 200-210 SMO 6 024 +/- 55 2869 +/- 125 NZA11925 13GC05 292-293 SMO 6 542 +/- 70 3387 +/- 140 NZA11926 13GC06 0-1 f.sand/SMO 2 736 +/- 55 0 +/- 55 NZA11927 13GC06 42-43 SMO 5 822 +/- 65 3086 +/- 120 NZA11928 13GC06 100-101 SMO 6 078 +/- 60 3342 +/- 115 NZA11929 13GC06 200-201 SMO 6 352 +/- 55 3616 +/- 110 NZA11837 14GC07 0-1 f.sand/SMO 2 272 +/- 55 0 +/- 55 NZA11838 14GC07 70-71 SMO 7 970 +/- 60 5698 +/- 115 NZA11839 15GC09 0-1 SMO 2 690 +/- 55 0 +/- 55 NZA11840 15GC09 20-22 SMO 5 828 +/- 55 3138 +/- 110 NZA11841 17PC02 0-1 f.sand/SMO 2 431 +/- 55 0 +/- 55 NZA11842 17PC02 45-46 SMO 5 927 +/- 60 3496 +/- 115 NZA11843 17PC02 514-515 diamicton 27 020 +/- 200 24,589 +/- 255 NZA11835 25GB13 0-1 f.sand/SMO 2 835 +/- 65 not applicable GX26788 25PC11 145-147 SMO 3 120 +/- 40 no surface age
NZA11844 25PC11 398-399 SMO 7 668 +/- 55 no surface age NZA11836 26GB14 0-1 f.sand/SMO 2 780 +/- 55 not applicable NZA11845 26PC12 0-1 f.sand/SMO 2 241 +/- 55 0 +/- 55 NZA11846 26PC12 99-100 SMO 5 414 +/- 55 3173 +/- 110 NZA11847 26PC12 199-200 SMO 6 115 +/- 65 3874 +/- 120 NZA11848 26PC12 299-300 SMO 6 266 +/- 70 4025 +/- 125 NZA11849 26PC12 399-400 SMO 7 152 +/- 60 4911 +/- 115 NZA11850 26PC12 482-483 SMO 15 469 +/- 70 13,228 +/- 125 Table 5.2 List of Mertz Drift samples utilised for radiocarbon dating.
(1) Uncorrected Radiocarbon Ages. The material dated ranges in age from 2241 yr
BP from the top of core 26PC12, on the large lobe edge, to a maximum age of 27,020
yr BP for diamicton from core 17PC02, in the centre of the Mertz Drift. The only
sample taken near the SMO-diamicton boundary is from the base of 26PC12 (482-483
cm), and returned an uncorrected age of 15,469 yr BP. Eight sampled core-tops (0-1
cm) revealed uncorrected radiocarbon ages of between 2241 yr BP from core 26PC12
to 3155 yr BP from core 13GC05. The eight core-top ages produced a mean surface
radiocarbon age of 2643 yr BP with a standard deviation of +/- 290 years.
(2) Corrected Ages. The corrected ages listed in Table 5.2 utilise only the age from
each core-top and not the mean core-top (surface) correction. Only core 25PC11,
from the channel, did not have a core-top age and thus a corrected age. It should be
noted that any samples from stations 15 and 25, in the channel, are suspect as
56

recovery of sediments from this part of the drift were quite poor due to the high water
content and slumping within the cores. Of the cores corrected, 13GC05 and 13GC06,
from the large lobe, 17PC02 in the centre of the drift and possibly 15GC09, in the
channel, constrain the massively bedded fine sand/SMO drape over the Mertz Drift,
as samples were obtained just below this layer (Harris 2000). These corrected ages are
2498, 3086, 3496 and 3138 yr BP, respectively. Thus, the fine sand/SMO layer has a
mean age of 3055 yr BP (standard deviation = +/- 358 years). Using the limited
corrected ages available, the SMO-diamicton facies boundary previously mentioned
lies between 13,228 and 24,589 yr BP.
(3) Corrected Age versus Depth Graphs. Only cores 13GC05 and 13GC06, on the
large lobe, and core 26PC12, from the large lobe edge, had sufficient corrected age
samples to produce graphs of age versus depth. A linear regression and correlation
coefficient was calculated for each graph. The slope of the linear regression allows
calculation of average sediment accumulation rates for these cores.
The graphs of corrected age versus depth for cores 13GC05 and 13GC06
(Figures 5.3 and 5.4 respectively) demonstrate similar and fairly consistent trends of
sediment accumulation rates. Comparison with the facies interpretation logs of cores
13GC05 and 13GC06 (refer Appendix A - Figures A.5 and A.6) revealed
predominantly laminated SMO between the radiocarbon sample positions. Linear
regression analysis indicates good age versus depth correlation (R = 0.96; R = 0.99
respectively, where R = 1 is a perfect fit and R = 0 is a poor fit).
57

Figure 5.3 Graph of corrected age versus depth for core 13GC05 (samples 15-16, 100-101, 200-210 and 292-293 cm). Linear regression: Depth = -738.2 + 0.31035 x Corrected Age; Correlation coefficient: R = 0.96367.
Figure 5.4 Graph of corrected age versus depth for core 13GC06 (samples 42-43, 100-101 and 200-201 cm). Linear regression: Depth = -866.97 + 0.2933 x Corrected Age; Correlation coefficient: R = 0.98929.
58

Initial analysis of a graph of corrected age versus depth of core 26PC12
indicated that the sediment accumulation rate between the bottom two samples (399-
400 cm and 482-483 cm) was much lower than average accumulation rates for the
samples above 399 cm (Figure 5.5). A comparison with core 26PC12 facies
interpretation log revealed predominantly massively bedded SMO between 399 to 483
cm while mostly laminated SMO was above 399 cm (refer Appendix A - Figure
A.18). The conclusion is that sediment accumulation rates vary between facies. To
calculate linear regressions (sediment accumulation rates) for the two different facies
within the samples obtained from core 26PC12, two graphs are presented, displaying
corrected age versus depth for samples 99-100 to 399-400 (Figure 5.6) and samples
399-400 to 482-483 (Figure 5.7)
Figure 5.5 Graph of corrected age versus depth for core 26PC12 (samples 99-100, 199-200, 299-300, 399-400 and 482-483 cm). Note the different slopes (sediment accumulation rates) between samples 99-100 to 399-400 cm and 399-400 to 482-483 cm.
59

Figure 5.6 Graph of corrected age versus depth for core 26PC12 (samples 99-100, 199-200, 299-300 and 399-400 cm). Linear regression: Depth = -450.43 + 0.17529 x Corrected Age; Correlation coefficient: R = 0.96977. Note the relatively high sedimentation rate of about 0.66 cm/yr between samples 199-200 and 299-300 cm.
Figure 5.7 Graph of corrected age versus depth for core 26PC12 (samples 399-400 and 482-483 cm). Linear regression: Depth = 349.81 + 0.01022 x Corrected Age.
60
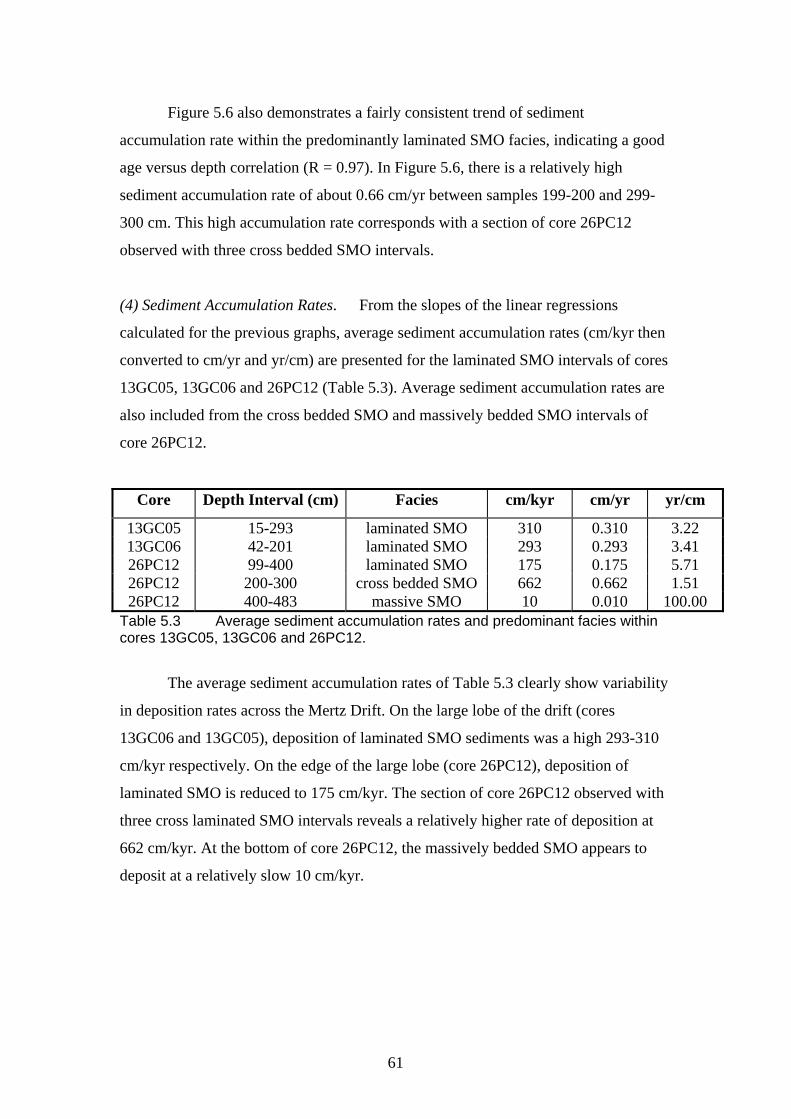
Figure 5.6 also demonstrates a fairly consistent trend of sediment
accumulation rate within the predominantly laminated SMO facies, indicating a good
age versus depth correlation (R = 0.97). In Figure 5.6, there is a relatively high
sediment accumulation rate of about 0.66 cm/yr between samples 199-200 and 299-
300 cm. This high accumulation rate corresponds with a section of core 26PC12
observed with three cross bedded SMO intervals.
(4) Sediment Accumulation Rates. From the slopes of the linear regressions
calculated for the previous graphs, average sediment accumulation rates (cm/kyr then
converted to cm/yr and yr/cm) are presented for the laminated SMO intervals of cores
13GC05, 13GC06 and 26PC12 (Table 5.3). Average sediment accumulation rates are
also included from the cross bedded SMO and massively bedded SMO intervals of
core 26PC12.
Core Depth Interval (cm) Facies cm/kyr cm/yr yr/cm
13GC05 15-293 laminated SMO 310 0.310 3.22 13GC06 42-201 laminated SMO 293 0.293 3.41 26PC12 99-400 laminated SMO 175 0.175 5.71 26PC12 200-300 cross bedded SMO 662 0.662 1.51 26PC12 400-483 massive SMO 10 0.010 100.00
Table 5.3 Average sediment accumulation rates and predominant facies within cores 13GC05, 13GC06 and 26PC12.
The average sediment accumulation rates of Table 5.3 clearly show variability
in deposition rates across the Mertz Drift. On the large lobe of the drift (cores
13GC06 and 13GC05), deposition of laminated SMO sediments was a high 293-310
cm/kyr respectively. On the edge of the large lobe (core 26PC12), deposition of
laminated SMO is reduced to 175 cm/kyr. The section of core 26PC12 observed with
three cross laminated SMO intervals reveals a relatively higher rate of deposition at
662 cm/kyr. At the bottom of core 26PC12, the massively bedded SMO appears to
deposit at a relatively slow 10 cm/kyr.
61

In addition to the average sediment accumulation rates of Table 5.3, the
massively bedded fine sand/SMO facies, found as a drape over the Mertz Drift, has an
approximate sediment accumulation rate of 10 cm/kyr, based upon the average 30 cm
thickness of the drape and the mean age of 3055 yr BP at the base of the facies. Thus,
the average sediment accumulation rate of the massively bedded fine sand/SMO
facies is comparable with that of the massively bedded SMO facies.
Based upon the average sediment accumulation rates, corrected ages were
applied as an approximate 'best fit' to the facies interpretation logs and IRD gravel
content graphs of cores 13GC05, 13GC06 and 26PC12 (Figures 5.8, 5.9 and 5.10
respectively).
62
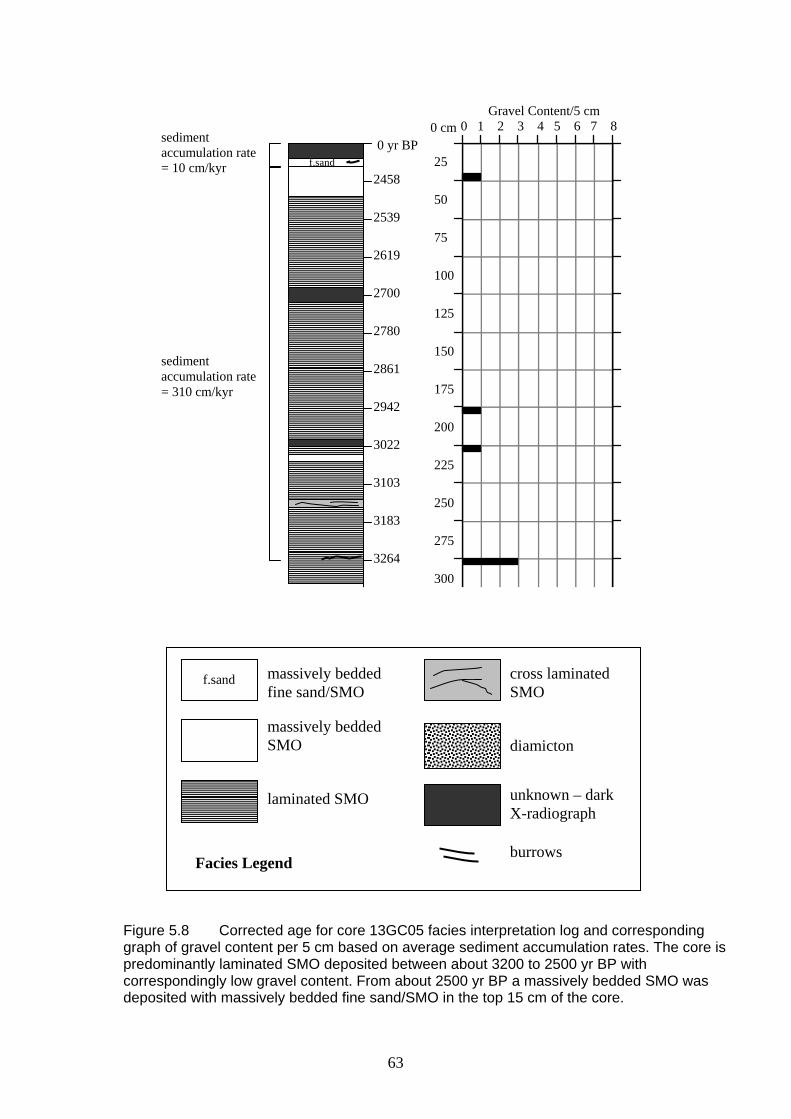
0 cm
25
50
75
100
125
150
175
200
225
250
275
300
325
350
375
400
425
450
475
500
Gravel Content/5 cm 0 1 2 3 4 5 6 7 8
0 yr BP
2458
2539
2619
2700
f.sand
sediment accumulation rate = 310 cm/kyr
2780
2861
2942
3022
3103
3183
3264
sediment accumulation rate = 10 cm/kyr
cross laminated SMO
massively bedded fine sand/SMO
laminated SMO
burrows
diamicton
unknown – dark X-radiograph
f.sand
massively bedded SMO
Facies Legend
63
Figure 5.8graph of gra
Corrected age for core 13GC05 facies interpretation log and corresponding vel content per 5 cm based on average sediment accumulation rates. The core is
0 to 2500 yr BP with From about 2500 yr BP a massively bedded SMO was
sand/SMO in the top 15 cm of the core.
predominantly laminated SMO deposited between about 320
correspondingly low gravel content. deposited with massively bedded fine
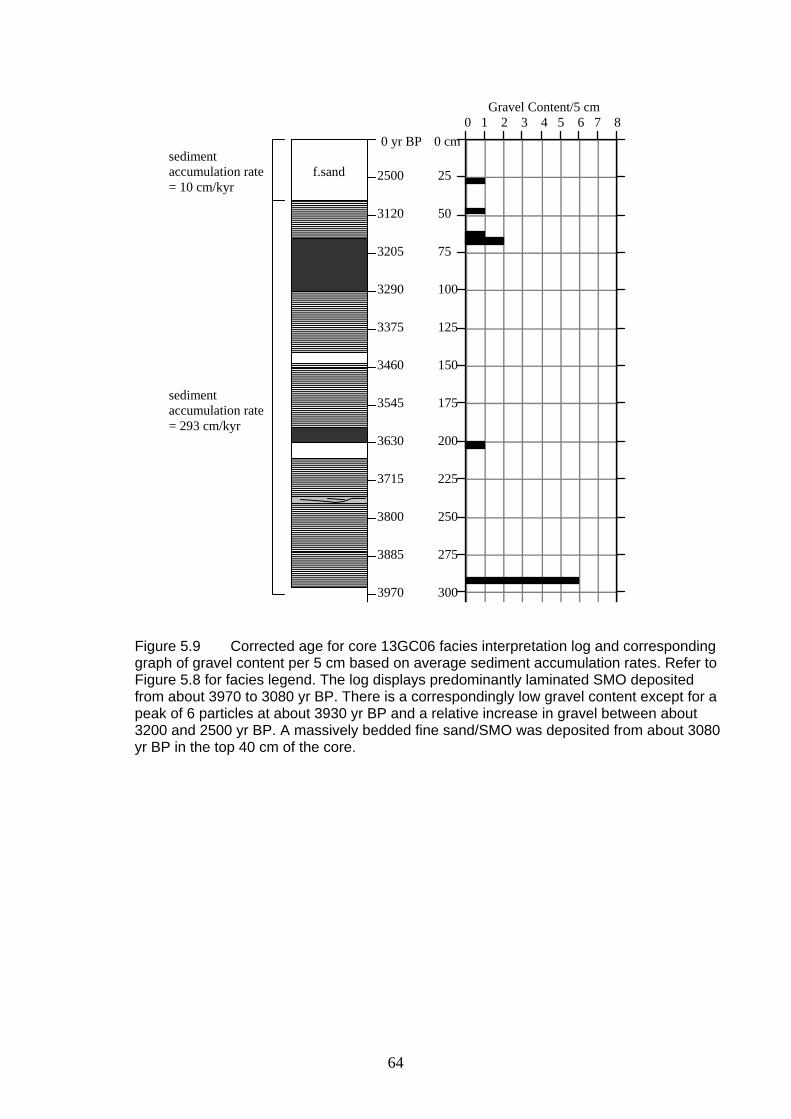
Gravel Content/5 cm 0 1 2 3 4 5 6 7 8
0 cm
25
50
75
100
125
150
175
200
225
250
275
300
325
350
375
400
425
450
475
500
0 yr BP
2500
3120
3205
3290
3375
3460
3545
3630
3715
3800
3885
3970
f.sand
sediment accumulation rate = 293 cm/kyr
sediment accumulation rate = 10 cm/kyr
Figure 5.9 Corrected age for core 13GC06 facies interpretation log and corresponding graph of gravel content per 5 cm based on average sediment accumulation rates. Refer to Figure 5.8 for facies legend. The log displays predominantly laminated SMO deposited from about 3970 to 3080 yr BP. There is a correspondingly low gravel content except for a peak of 6 particles at about 3930 yr BP and a relative increase in gravel between about 3200 and 2500 yr BP. A massively bedded fine sand/SMO was deposited from about 3080 yr BP in the top 40 cm of the core.
64

Figure 5.10 Corrected age for core 26PC12 facies interpretation log and corresponding graph of gravel content per 5 cm based on average sediment accumulation rates. Refer to Figure 5.8 for facies legend. Diamicton lies at the base of the core. A massively bedded SMO was deposited from about 14,000 to 4400 yr BP with a correspondingly high gravel content. Then a predominantly laminated SMO with minor intervals of cross laminated SMO was deposited between about 4400 and 2500 yr BP. Massively bedded fine sand/SMO was deposited from about 2500 yr BP to present. Gravel content is low for most of the laminated SMO facies then increases from about 3100 yr BP.
0cm
25
50
75
100
125
150
175
200
225
250
275
300
325
350
375
400
425
450
475
500
Gravel Content/5 cm 0 1 2 3 4 5 6 7 8
0 yr BP
2650
2800
2950
3100
3250
3400
3550
3700
3750
3800
3850
3900
4050
4200
4350
4500
6950
9400
11,850
f.sand
sediment accumulation rate = 10 cm/kyr
sediment accumulation rate = 175 cm/kyr
sediment accumulation rate = 10 cm/kyr
sediment accumulation rate = 662 cm/kyr
sediment accumulation rate = 175 cm/kyr
65
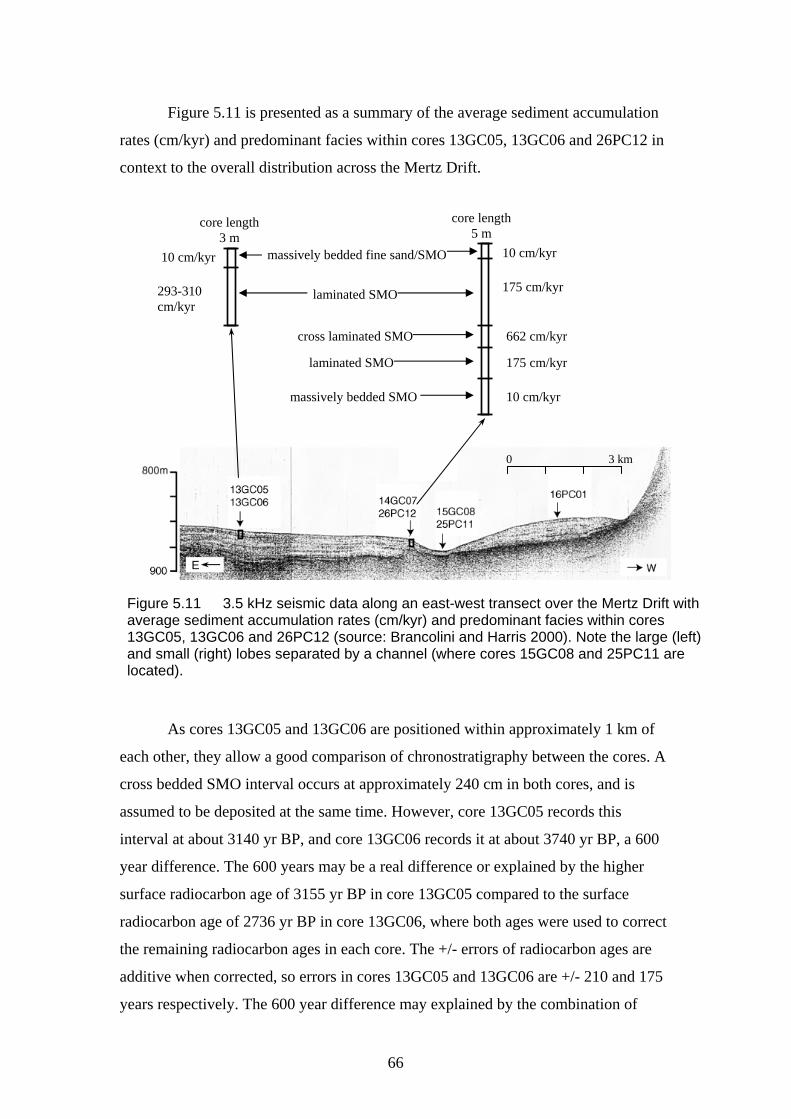
Figure 5.11 is presented as a summary of the average sediment accumulation
rates (cm/kyr) and predominant facies within cores 13GC05, 13GC06 and 26PC12 in
context to the overall distribution across the Mertz Drift.
Figure 5.11 3.5 kHz seismic data along an east-west transect over the Mertz Drift with average sediment accumulation rates (cm/kyr) and predominant facies within cores 13GC05, 13GC06 and 26PC12 (source: Brancolini and Harris 2000). Note the large (left) and small (right) lobes separated by a channel (where cores 15GC08 and 25PC11 are located).
0 3 km
E
10 cm/kyr
293-310 cm/kyr
10 cm/kyr
175 cm/kyr
10 cm/kyr
massively bedded fine sand/SMO
laminated SMO
massively bedded SMO
cross laminated SMO 662 cm/kyr
laminated SMO 175 cm/kyr
core length 3 m
core length 5 m
As cores 13GC05 and 13GC06 are positioned within approximately 1 km of
each other, they allow a good comparison of chronostratigraphy between the cores. A
cross bedded SMO interval occurs at approximately 240 cm in both cores, and is
assumed to be deposited at the same time. However, core 13GC05 records this
interval at about 3140 yr BP, and core 13GC06 records it at about 3740 yr BP, a 600
year difference. The 600 years may be a real difference or explained by the higher
surface radiocarbon age of 3155 yr BP in core 13GC05 compared to the surface
radiocarbon age of 2736 yr BP in core 13GC06, where both ages were used to correct
the remaining radiocarbon ages in each core. The +/- errors of radiocarbon ages are
additive when corrected, so errors in cores 13GC05 and 13GC06 are +/- 210 and 175
years respectively. The 600 year difference may explained by the combination of
66

variation in surface ages of the cores and the +/- errors in corrected radiocarbon ages.
This comparison highlights the difficulties of correcting for the reservoir effect and
contamination in Antarctic marine sediment cores.
In summary, massively bedded SMO facies was deposited between about
14,000 to 5000 yr BP, a time period of 9000 years. Laminated SMO facies was then
deposited from about 5000 to 3000 yr BP. Massively bedded fine sand/SMO facies
was deposited as a drape over the Mertz Drift from about 3000 yr BP to the present.
5.3.2 Laminations
An aim of this project was to calculate the mean deposition time for
lamination couplets to test the hypothesis that Mertz Drift sediments largely result
from cyclical, high productivity diatom blooms due to annual seasonal changes in sea
ice cover. The calculation relies upon X-radiographs to count lamination couplets
within cores. To test the validity of using X-radiographs to record the internal
sedimentary structure of cores, a comparison was made of the number of lamination
couplets per 10 cm interval recorded on visual core logs for cores 13GC05 and
13GC06, compared to the number revealed by X-radiographs for the same interval.
Graphs of visual versus X-radiograph lamination counts are presented in Figures 5.12
and 5.13 respectively. In addition, a linear regression and correlation coefficient was
calculated for each graph.
67

Figure 5.12 Graph of visual count versus X-radiograph count of lamination couplets within core 13GC05. Linear regression: X-radiograph count = 3.3955 + 0.76386 x Visual count; Correlation coefficient: R = 0.78646.
Figure 5.13 Graph of visual count versus X-radiograph count of lamination couplets within core 13GC06. Linear regression: X-radiograph count = 17.184 - 0.25266 x Visual count; Correlation coefficient: R = 0.46191.
68

Graphs of the visual versus X-radiograph lamination counts for cores 13GC05
and 13GC06 reveal differing trends. For Figure 5.12 (core 13GC05), the visual counts
reasonably agree with the X-radiograph counts (R = 0.79). From the calculated linear
regression of Figure 5.12, the X-radiograph counts approximately three more
lamination couplets for every visual lamination couplet count, which may be
interpreted as a slight overestimation. The overestimation of X-radiograph counts is
possibly because of the ability of X-radiographs to record three dimensional
sedimentary structures as two dimensions, whereas visual counts record only a two
dimensional view of sedimentary structure from the surface of a split core.
In contrast to core 13GC05, the trend for core 13GC06 (Figure 5.13) is poor
(R = 0.46). The visual counts do not agree with the X-radiograph counts. Hence, core
13GC06 was rejected for further laminae analysis as the X-radiographs of this core do
not provide the confidence to count the number of laminations accurately, and then
calculate the mean deposition time for lamination couplets.
Visual core logs from the WEGA expedition recorded the number of
lamination couplets only in cores 13GC05 and 13GC06, the latter being rejected for
further lamination analysis. The only other core possible for lamination analysis is
core 26PC12, which did not have the number of lamination couplets recorded in a
visual core log, and cannot be tested with the same method for accuracy of the X-
radiographs to record laminations. However, the X-radiographs of core 26PC12 are of
relatively high quality and sufficiently clear to use for further analysis. Therefore, to
calculate the mean deposition time for lamination couplets, X-radiographs of cores
13GC05 and 26PC12 were examined in closer detail to reveal the mean number of
lamination couplets per cm and the mean couplet thickness in cm (Tables 5.4 and 5.5
respectively).
69

Depth Interval (cm)
No. Lamination Couplets
No. Lamination Couplets/cm
Couplet Thickness (cm)
40-50 11 1.10 0.90 50-60 12 1.20 0.83 60-70 12 1.20 0.83 70-80 11 1.10 0.90 80-90 11 1.10 0.90
110-120 13 1.30 0.78 120-130 11 1.10 0.91 130-140 11 1.10 0.91 140-150 16 1.60 0.63 150-160 17 1.70 0.59 160-170 14 1.40 0.71 170-180 15 1.50 0.67
mean (SD) 1.28 (0.21) 0.80 (0.12) Table 5.4 Table of lamination couplet detail within core 13GC05. SD = standard deviation. Note: the mean number of lamination couplets/cm = 1.28 and the mean couplet thickness = 0.80 cm.
Depth Interval (cm)
No. Lamination Couplets
No. Lamination Couplets/cm
Couplet Thickness (cm)
103-110 11 1.57 0.64 110-120 14 1.40 0.71 120-130 19 1.90 0.53 130-140 13 1.30 0.77 140-145 6 1.20 0.83 160-170 11 1.10 0.91 170-180 13 1.30 0.77 192-200 11 1.37 0.73 200-210 17 1.70 0.59 210-220 14 1.40 0.71 280-290 11 1.10 0.91 290-300 12 1.20 0.83 310-320 10 1.00 1.00 320-330 13 1.30 0.77 330-340 16 1.60 0.63 382-390 9 1.13 0.89
mean (SD) 1.35 (0.24) 0.76 (0.12) Table 5.5 Table of lamination couplet detail within core 26PC12. SD = standard deviation. Note: the mean number of lamination couplets/cm = 1.35 and the mean couplet thickness = 0.76 cm.
As the laminated SMO facies sediment accumulation rate for core 13GC05
converts to 3.22 yr/cm (from Table 5.3), then the mean deposition time for lamination
couplets in core 13GC05 = 3.22 yr/cm x 0.80 cm = 2.58 years. The laminated SMO
facies sediment accumulation rate for core 26PC12 converts to 5.71 yr/cm (from
70
Table 5.3), therefore, the mean deposition time for lamination couplets in core
26PC12 = 5.71 yr/cm x 0.76 cm = 4.34 years. Thus, for core 13GC05, from the large
lobe, and core 26PC12, from the edge of the large lobe, lamination couplets have a
mean deposition time of between 2.6 to 4.3 years respectively. These values are
approximate only because of the possibility of overestimating the number of
lamination couplets within X-radiographs, and errors in calculating average sediment
accumulation rates.
5.4 Summary of Results
Uncorrected radiocarbon ages for Mertz Drift samples ranged from 2241 yr
BP from the surface of core 26PC12 to a maximum age of 27,020 yr BP for diamicton
at the base of core 17PC02. A sample near the SMO-diamicton boundary of core
26PC12 recorded an uncorrected radiocarbon age of 15,469 yr BP. The mean surface
radiocarbon age of the Mertz Drift is 2643 yr BP.
Corrected radiocarbon ages reveal the fine sand/SMO drape over the Mertz
Drift commenced deposition at a mean age of 3055 yr BP. The SMO-diamicton
boundary was deposited between 13,228 and 24,589 yr BP.
Graphs and linear regressions of corrected radiocarbon age versus depth for
cores 13GC05, 13GC06 and 26PC12 demonstrated good age versus depth correlation,
and high sedimentation rates (eg. 0.175-0.310 cm/yr) for samples taken from
predominantly laminated SMO facies. Within core 26PC12, a relatively high
sedimentation rate (eg. 0.662 cm/yr) between samples 199-200 and 299-300 cm
corresponds with a section of the core observed with three cross bedded SMO
intervals.
The average sedimentation accumulation rates show variability in deposition
rates across the Mertz Drift and between facies. The average sediment accumulation
rates calculated for facies are:
(1) Massively bedded fine sand/SMO - 10 cm/kyr.
(2) Laminated SMO - 175, 293 and 310 cm/kyr.
71
(3) Cross laminated SMO - 662 cm/kyr.
(4) Massively bedded SMO - 10 cm/kyr.
Comparison of ages between a similar cross bedded SMO interval at 240 cm
depth in both cores 13GC05 and 13GC06 reveal a 600 year difference. The difference
may explained by the combination of variation in surface ages of the cores and the +/-
errors in corrected radiocarbon ages.
In summary, massively bedded SMO facies was deposited between about
14,000 to 5000 yr BP. Laminated SMO facies was then deposited from about 5000 to
3000 yr BP. Massively bedded fine sand/SMO facies was deposited as a drape over
the Mertz Drift from about 3000 yr BP to the present.
A graph and linear regression of the visual versus X-radiograph lamination
couplet counts for core 13GC05 reveal that visual counts agree reasonably with the X-
radiograph counts. There may be a slight overestimation in counts of the number of
lamination couplets revealed by X-radiographs. A linear regression of the visual
versus X-radiograph lamination couplet counts for core 13GC06 suggest that visual
counts do not agree with the X-radiograph counts.
Calculations of the mean deposition time of lamination couplets in cores
13GC05 and 26PC12 indicate periods of between 2.6 and 4.3 years respectively.
72

Chapter 6. Thin Section Analysis
6.1 Introduction
A hypothesis of this study is that Mertz Drift sediments largely result from
cyclical, high productivity diatom blooms due to annual seasonal changes in sea ice
cover. The aim of the project was then to conduct a microscope study of Mertz Drift
sediments using thin sections, which may reveal the source of biosiliceous material,
and whether sediments are a hemipelagic drape, current lain or from gravity flows.
The first part of this chapter describes previous diatom studies of the surface
sediments of the George V Basin collected during 'Operation Deep Freeze' 1979
(DF79), and the reports of downcore siliceous components of core DF79-12.
The second part of the chapter describes the results of thin section analysis of
four block samples from core 26PC12. The depths from which thin sections were
obtained are initially compared against the facies interpretation log of core 26PC12 to
show where the thin sections are in relation to the facies in the core. The sedimentary
structures of the thin sections, such as mottles and laminae, are then compared against
the equivalent depth X-radiographs for any correlation between thin section and X-
radiograph structures. Thin sections were analysed under stereo and compound
microscopes to detect finer-scale qualitative differences in the microstructure. A
summary of results is provided at the end of the chapter.
6.2 Previous Diatom Studies
6.2.1 Diatom Analysis in George V Basin
Leventer (1992) determined the modern distribution of diatoms in surface
sediments from cores obtained during 'Operation Deep Freeze' 1979 (DF79), and
related this assemblage data to environmental information. Concentrations of up to
250 million diatom valves/gram of sediment were found, particularly within the
deeper parts of the George V Basin. A westerly increasing diatom abundance was
observed within the basin (Figure 6.1). The relative increase in diatom abundance to
73

the west was attributed to the East Wind Drift (EWD) current, laterally transporting
fine grained, diatomaceous material to the west, and also to the persistent sea ice
cover east of longitude 147˚ east decreasing primary productivity.
Mertz Drift
Figure 6.1. Absolute distribution of diatoms in surface sediments on the continental shelf off George V Land (source: Leventer 1992). Note the study site within the box. Mertz Drift surface sediment has a diatom concentration of 200 x 106/gram.
Within the George V Basin, the most abundant diatom species was
Fragilariopsis curta, a small pennate form commonly found as a member of the sea
ice community and a dominant component of ice edge blooms (Figure 6.2). There is
an offshore decrease in this species and a relative increase in the more 'oceanic'
species Fragilariopsis kerguelensis, indicating the decreasing influence of sea ice in
an offshore direction.
Leventer (1992) concluded that the downcore variability in relative abundance
of the two species, Fragilariopsis curta and F. kerguelensis, would be useful in
understanding the history of sea ice versus open water production over the continental
shelf off George V Land.
74

Mertz Drift
% Fragilariopsis curta
Figure 6.2. Relative concentration of Fragilariopsis curta in surface sediments on the continental shelf off George V Land (source: Leventer 1992). Note the study site within the box. Mertz Drift surface sediments have 20-30% F. curta.
6.2.2 Core DF79-12
Reports of the downcore siliceous components of core DF79-12 are quite
limited, and are general in nature. Domack (1988) stated that the dominant biogenic
constituents of siliceous mud and diatom ooze (SMO) facies consisted of planktonic
diatoms, minor benthic diatoms, radiolarians, silicoflagellates and sponge spicules.
Calcium carbonate, in the form of planktonic foraminifera, was almost completely
lacking in sediments. Faecal pellets comprised up to 25% of the sediment, where they
had yet to disintegrate in shallow portions of the core.
Initial analysis of diatom floras within individual laminae within core DF79-
12 revealed strong contrasts in species diversity and size (Domack 1988). Laminae
differed in that small sea ice diatoms, such as Fragilariopsis curta, dominated within
one lamina of each lamination couplet. The relative dominance of sea ice diatoms to
other diatoms in each couplet was interpreted as representing the initial pelagic flux of
diatoms induced by melting sea ice, while the overlying lamina represented
productivity during the remainder of the summer (Domack 1988). This interpretation
led to the Domack (1988) productivity model (refer Chapter 1 - Figure 1.3) to explain
75

the development of laminated SMO facies within shelf basin sediments. In this model,
areas that undergo seasonal fluctuations in sea ice cover contribute significant
quantities of biogenic detritus to the seafloor. As sea ice melted, dense and short-lived
sea ice diatoms would be quickly ‘fluxed’ to the bottom followed by diatoms
produced during the remainder of summer. Domack (1988) concluded that it is not
known whether the seasonal conditions of open water over the western end of George
V Basin (i.e. Mertz Drift area) are due to wind-forced breakout of sea ice, and hence
reducing the flux of diatoms to the seafloor, or melting, which may contribute
significant biogenic detritus in the manner proposed in the productivity model.
The results of diatom distribution in the surficial sediments of George V basin
and the limited results and interpretation of core DF79-12 have been discussed in the
first part of this chapter. This information serves as a baseline against which the
results from thin section analysis in this study will be compared.
6.3 Results
The following thin section analysis of four samples from core 26PC12 may
help to resolve questions pertaining to the origin and physical processes involved in
the deposition of Mertz Drift sediments. Analysis may reveal the source of
biosiliceous material, and whether sediments are a hemipelagic drape, current lain or
from gravity flows.
The depths from which thin sections were obtained are first compared against
the facies interpretation log of core 26PC12 to show where the thin sections are in
relation to the facies in the core. The sedimentary structures of the thin sections, such
as mottles and laminae, are then compared against the equivalent depth X-radiographs
for any correlation between thin section and X-radiograph structures.
Photomicrographs of sediments in the thin sections are also presented to highlight
important features. The microstructure of thin sections are qualitatively described for
finer-scale features revealed by stereo and compound microscope.
76
6.3.1 Thin Section Facies
The facies interpretation log of core 26PC12 against the depths from which
thin section samples were obtained is presented in Figure 6.3. Samples were taken
from the following facies: massively bedded fine sand/SMO (8.5-11.5 cm); laminated
SMO (162-165 cm); cross laminated SMO (227-230.5 and 237-240.5cm).
Thin sections were obtained from these facies to assist in confirming or
denying the sedimentary structures observed in X-radiographs and visual core logs, as
well as the interpretations of environment of deposition. Thin section samples were
not obtained from massively bedded SMO or diamicton facies due to the lack of time
available to process samples.
It should be noted that the processing of thin sections led to some shrinkage
and desiccation of the sediments, which made comparison with the equivalent depth
X-radiographs slightly difficult. Additionally, neither the X-radiographs and
photographs of thin sections reproduced very well into this thesis due to the
limitations of scanning and printer resolution. Line drawings of both X-radiographs
and thin section photographs are provided to assist in comparisons of sedimentary
structure.
77

500
0 cm
25
50
75
100
125
150
175
200
225
250
275
300
325
350
375
400
425
450
475
f.sand
Figure 6.3 Four thin section sample depths against the core 26PC12 facies interpretation log. The sample at 8.5-11.5 cm is massively bedded fine sand/SMO. The sample from 162-165 cm is laminated SMO. Samples 227-230.5 and 237-240.5 cm are both cross laminated SMO facies.
8.5-11.5 cm
162-165 cm
227-230.5 cm 237-240.5 cm
massively bedded fine sand/SMO f.sand
laminated SMO
cross laminated SMO
diamicton
unknown – dark X-radiograph
burrows
massively bedded SMO
Facies Legend
78

6.3.2 Thin Section Analysis
(1) Massively bedded fine sand/SMO (sample depth 8.5-11.5 cm). Figure 6.4A&B
displays the X-radiograph and thin section at the equivalent depth. The massively
bedded fine sand/SMO in the X-radiograph shows dark-toned mottles, thin
discontinuous laminae and the massive bedding characteristic of this facies. Within
the thin section, even though there is some shrinkage and disruption of the sediments
from processing the thin section, the same thin laminae and mottles can be seen, and
are found to be concentrations of fine to very fine grained sand. The pockets of sand
correlate with the darker-toned (dense) structures of the X-radiograph i.e. mottles and
thin laminae. The majority of sediments are siliceous material such as diatoms and
sponge spicules, which correlate with the light-toned parts of the X-radiograph.
79
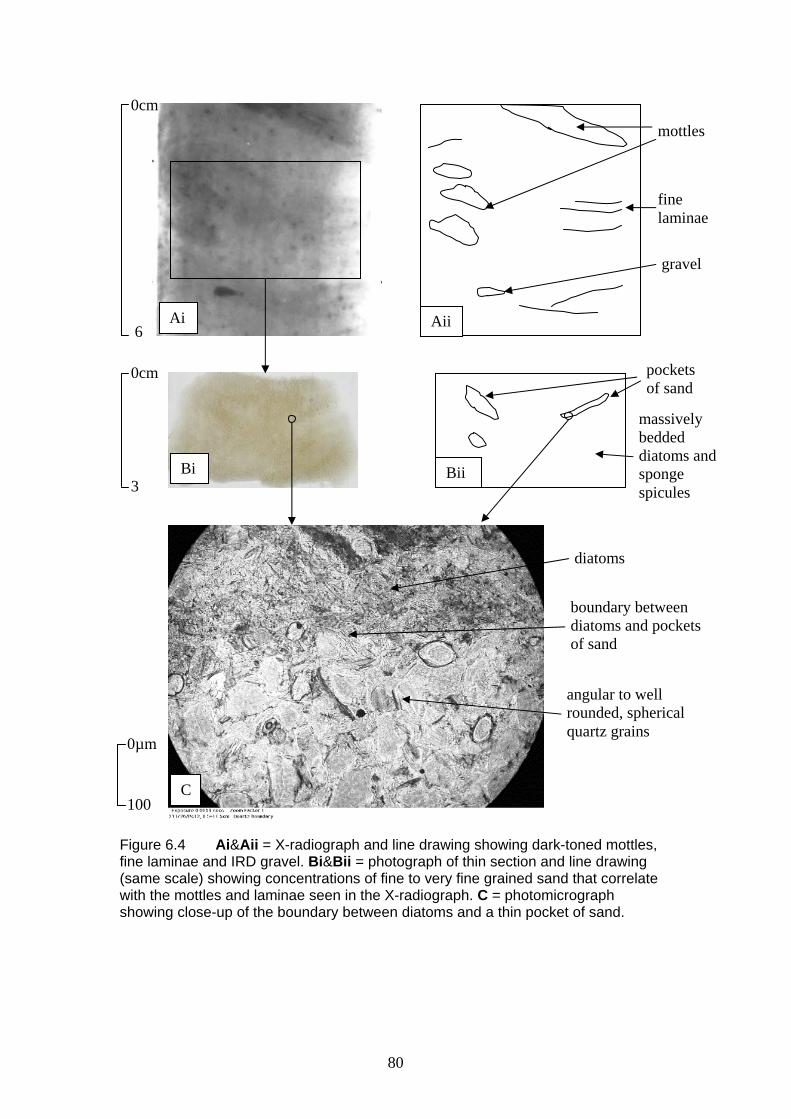
0cm
6 Aii
pockets of sand
massively bedded diatoms and sponge spicules
Bii Bi
Ai
fine laminae
gravel
mottles
3
0cm
diatoms
boundary between diatoms and pockets of sand
angular to well rounded, spherical quartz grains
100
0µm
C
Figure 6.4 Ai&Aii = X-radiograph and line drawing showing dark-toned mottles, fine laminae and IRD gravel. Bi&Bii = photograph of thin section and line drawing (same scale) showing concentrations of fine to very fine grained sand that correlate with the mottles and laminae seen in the X-radiograph. C = photomicrograph showing close-up of the boundary between diatoms and a thin pocket of sand.
80

The microstructure of sediments in the thin section (Figure 6.4B) reveals small
concentrations or pockets of fine to very fine grained sand scattered throughout the
thin section. The sand consists of angular to well rounded, spherical quartz grains.
Green pyroxene is also identified amongst the sand particles. The majority of
sediments are massively bedded siliceous material such as diatoms, although many
larger sponge spicules are also seen. Individual quartz grains are also present within
the siliceous material. The photomicrograph in Figure 6.4C shows a distinct boundary
between a concentration of quartz grains and overlying diatoms. Bioturbation in
several pockets of sand is evidenced by bedding disruption by finer grained diatom
material.
(2) Laminated SMO (sample depth 162-165 cm). The X-radiograph and equivalent
depth thin section are presented in Figure 6.5A&B for comparison. The X-radiograph
shows the horizontal light-and dark-toned laminae of laminated SMO facies. The
photograph of the same depth thin section also reveals laminae that correlate with the
structures in the X-radiograph (Figure 6.5A&B). Under microscope (Figure 6.5C),
there is a distinct change between dark lamina and light lamina in the thin section.
The dark lamina is more tightly packed with diatoms while the light lamina is matted
and has more dispersed diatoms.
81
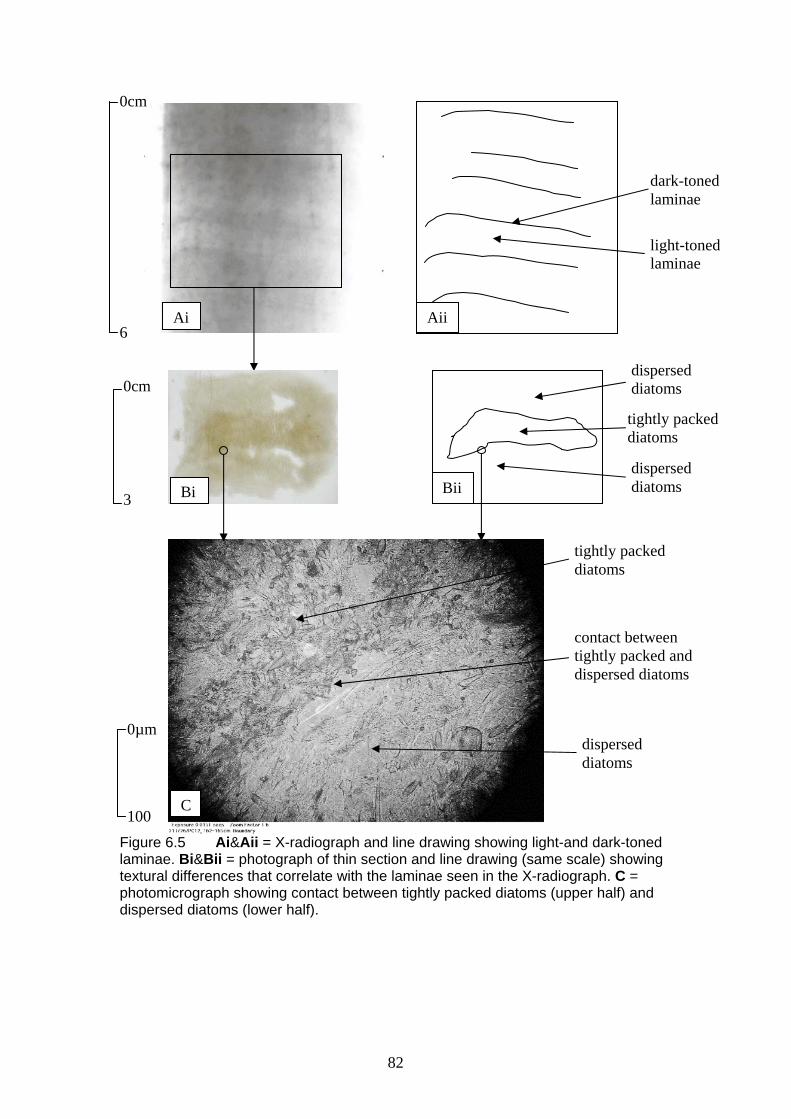
6
0cm
Aii
dark-toned laminae
light-toned laminae
Ai
dispersed diatoms
Bii
3
0cm
tightly packed diatoms
dispersed diatoms Bi
C
tightly packed diatoms
contact between tightly packed and dispersed diatoms
100
0µm dispersed diatoms
Figure 6.5 Ai&Aii = X-radiograph and line drawing showing light-and dark-toned laminae. Bi&Bii = photograph of thin section and line drawing (same scale) showing textural differences that correlate with the laminae seen in the X-radiograph. C = photomicrograph showing contact between tightly packed diatoms (upper half) and dispersed diatoms (lower half).
82
Under the microscope, diatoms dominate the sediment composition with no
terrigenous contribution observed. The microstructure of the thin section reveals
distinct variations how packed diatoms are within each lamina (Figure 6.5B). A mat
of siliceous spines dominates the light lamina; believed to be derived from the
diatoms of Corethron criophilum and vegetative spore Chaetoceros cells. The spines
appeared to be somewhat aligned with the bedding of the lamina. Corethron
criophilum valves, minus spines, and Chaetoceros resting spores are numerous in the
light lamina. The centic diatom Thalassiosira tumida and the pennate diatom
Fragilariopsis curta are also numerous. Very few desiccation cracks are observed
within the light lamina due to the mesh-like linkage between diatom cells. In contrast,
the dark lamina has many randomly oriented desiccation cracks, and appears to be
more compact and diverse in diatom species. The dark lamina has a different
assemblage of diatoms to the light lamina. Chaetoceros resting spores appear to be
more common. The dark lamina lacks Corethron criophilum and siliceous spines.
Fragilariopsis kerguelensis was generally the dominant pennate diatom observed.
The photomicrograph in Figure 6.5C shows a distinct contact between the more
densely packed diatom lamina and the underlying least dense lamina.
(3) Cross laminated SMO (sample depth 227-230.5 cm). Figure 6.6A&B displays a
photograph of the thin section and X-radiograph of the same sample depth. The X-
radiograph shows distinct light- and dark-toned laminae interpreted to be parallel
foresets, inclined at 15˚ to the horizontal. When examined under the microscope, the
thin section reveals faint dark and light lamina, which roughly correlate with the dark
and light lamina of the X-radiograph. The dark lamina of the thin section reveals
diatoms slightly more packed than in the light lamina. It was not possible to
determine whether these light and dark lamina correspond with the contents of the
light and dark lamina in the laminated SMO thin section. However, the dark lamina
had a scattering of foraminifera in contrast to the light lamina, which had no
foraminifer amongst the diatom matrix.
83

0cm
6
0cm
Bii
Aii
Bi
Ai
slightly more packed diatom and forams
dark-toned parallel foresets
3
more dispersed diatoms and no forams
chamber of foraminifera
100
0µm
diatoms
C
Figure 6.6 Ai&Aii = X-radiograph and line drawing showing dark-and light-toned parallel foresets at an angle of approximately 15˚. Bi&Bii = photograph of thin section and line drawing (same scale) showing faint dark lamina of more packed diatoms and foraminifera, overlying light lamina with slightly more dispersed diatoms and no foraminifera. The dark lamina of the thin section roughly correlates with the dark-toned lamina in the X-radiograph. C = photomicrograph of the benthic foraminifera Globocassidulina crassa from the dark lamina.
84

The microstructure of the thin section shows dark lamina that are slightly
more packed in diatom material compared to the light lamina (Figure 6.6B). The dark
lamina also has numerous benthic foraminifera, Globocassidulina crassa, surrounded
by the diatom matrix. The calcium carbonate foraminifera were not corroded. The
light lamina contain no foraminifera. Most diatoms show signs of frustule alignment,
and a similar axis of orientation to the bedding of the light and dark lamina they lie in.
Desiccation cracks formed during the preparation of the thin section have also
followed the axis of orientation of the individual light and dark lamina. The
photomicrograph of Figure 6.6C displays the relatively large (> 0.1 mm)
Globocassidulina crassa in relation to the smaller (> 0.01 mm) diatoms, indicating
the poorly sorted nature of the dark lamina.
(4) Cross laminated SMO (sample depth 237-240.5 cm). The X-radiograph and
equivalent depth thin section are shown in Figure 6.7A&B for comparison. The
structures within the X-radiograph show a 6 cm interval of cross laminae that is wavy
and laterally discontinuous, bounded above and below with horizontal laminae. The
thin section (Figure 6.7B) also confirms lamina with similar textural patterns to the X-
radiograph. Lamina with more packed diatoms correspond to the dark-toned lamina of
the X-radiograph, while the less packed diatom lamina correlate with the light-toned
lamina of the X-radiograph. Again, it was not possible to determine whether these
light and dark lamina correspond with the contents of the light and dark lamina in the
laminated SMO thin section.
85

0cm
6 Ai Aii
less packed diatoms
tightly packed diatoms
light-toned cross laminae
dark-toned cross laminae
Bii 3
0cm
horizontal laminae
Bi
diatoms showing grain-alignment in a vertical direction
100
0µm
C
Figure 6.7 Ai&Aii = X-radiograph and line drawing showing dark-and light-toned cross laminae. Bi&Bii = photograph of thin section and line drawing (same scale) showing dark and light lamina that correlates with the dark-and light-toned cross lamina in the X-radiograph. C = photomicrograph showing a close-up of the oriented and aligned diatoms within the sediments. The diatoms in this example have a vertical grain-alignment only because shrinkage in the preparation of the thin section has folded the grains vertically. It is not indicative of vertical bedding of laminae.
86
The microstructure of this cross bedded SMO thin section reveals slight
relative changes in the packing of diatoms within lamina corresponding with light and
dark lamina (Figure 6.7B). Like the previous cross laminated SMO thin section, most
diatoms show signs of frustule alignment, and a similar axis of orientation to the
bedding of the light and dark lamina they lie in. The photomicrograph of Figure 6.7C
shows a vertical alignment of diatoms within a denser lamina. Shrinkage during the
preparation of the thin section has folded this section of diatoms vertically, and is not
indicative of vertical bedding of lamina. Desiccation cracks formed during the making
of the thin section have also followed the axis of orientation of the individual light
and dark lamina.
6.4 Summary of Results
A comparison between structures within X-radiographs and thin sections show
good correlation. Dark (dense) lamina in X-radiographs match dark lamina within
thin sections that have increased diatom concentrations. Light (less dense) lamina in
X-radiographs match more dispersed diatoms in light lamina of thin sections. Dark
mottles in X-radiographs are also correlated with concentrations of quartz sand grains.
It was not possible to distinguish whether the composition of light lamina in
laminated SMO and cross laminated SMO had the same diatom assemblage. The
diatom assemblage from the light lamina of the laminated SMO is a mat of somewhat
aligned siliceous spines derived from the diatoms of Corethron criophilum and
vegetative spore Chaetoceros cells. Other numerous diatoms in light lamina of
laminated SMO are Corethron criophilum valves, Chaetoceros resting spores,
Thalassiosira tumida and Fragilariopsis curta. The diatom assemblage of light
lamina in cross laminated SMO had distinct frustule alignment parallel to the bedding
of the lamina.
The presence of foraminifera was a noted difference in sediment composition
between dark lamina of laminated and cross laminated SMO. It was not possible to
determine a difference in diatom composition in the dark lamina of laminated and
cross laminated SMO. The dark lamina of laminated SMO have a compact and
87

diverse diatom assemblage. Chaetoceros resting spores appear to be common and
Fragilariopsis kerguelensis was the dominant pennate diatom observed. The dark
lamina of laminated SMO lacks the Corethron criophilum and siliceous spines of the
light lamina. The diatom assemblage of dark lamina in cross laminated SMO had
distinct frustule alignment parallel to the bedding of the lamina.
88

Chapter 7. Discussion
7.1 Introduction
This study has three main aims. The first is to produce facies descriptions
using visual core logs, multi-sensor core logger data and sedimentary structures
revealed by X-radiographs of cores recovered from the Mertz Drift. This is in order to
discover if there is an overall facies succession within the deposit, and whether the
drift has some underlying pattern of deposition. The second aim is to use radiocarbon
age data to explain the timing of any facies succession, and whether or not the Mertz
Drift sediments do record a high resolution of palaeoenvironment change during the
Holocene. A third aim was to conduct a microscope study of Mertz Drift sediments
using thin sections. Analysis may reveal the source of biosiliceous material, and
whether sediments are a hemipelagic drape, current lain or from gravity flows.
The discussion chapter covers the following related topics of relevance to the
aims and hypotheses:
The succession of environmental phases interpreted from the general pattern of
facies in the deposit.
A model of Mertz Drift formation.
Sediment accumulation rates across the drift.
The timing of post-LGM deposition in the George V Basin.
Lamination couplets.
The various physical controls on drift formation
Does the Mertz Drift record bottom water formation?
7.2 Succession of Environments
The general succession of phases of depositional environment and units within
a representative 500 cm core is presented in Figure 7.1 This study identifies a
succession of four units in the Mertz Drift. Unit 1 is a diamicton, which underlies the
drift deposit. Lying unconformably over the diamicton is Unit 2, a massively bedded
89

SMO. Overlying Unit 2 is a relatively thick Unit 3, consisting of laminated SMO
interbedded with minor intervals of cross laminated and massively bedded SMO. Unit
4, a massively bedded fine sand/SMO, overlies the Mertz Drift as a drape. These units
are described in turn to interpret the succession of environmental phases for the
deposit.
(1) Sub-Ice Shelf Phase. The diamicton in core DF79-12 was interpreted as
being deposited under a floating ice tongue, in a low energy, fjord-like environment
(Domack 1982; Domack et al. 1991). This present study found Unit 1 to be a muddy
diamicton with an erosional upper surface in X-radiographs of Mertz Drift cores that
were sufficiently long to penetrate through the drift (Figure 7.1). The facies is very
high in ice-rafted debris (IRD) gravel but was not quantified in this study as the focus
was on the siliceous mud and diatom ooze (SMO) sediments of the drift. The
diamicton sampled in this study is similarly interpreted as a sub-ice shelf, water-lain
till.
The single corrected radiocarbon age of 24,589 yr BP, at the base of core
17PC02, reveals deposition during the Last Glacial Maximum (LGM). Deposition of
diamicton during a glacial advance in the LGM is consistent with the findings of
Harris and O'Brien (1998) who found a similar diamicton deposited during a glacial
advance during the LGM on the Mac.Robertson shelf. During the last glacial advance,
ice flow over the continental shelf off George V Land was from southeast to
northwest (refer Chapter 5 - Figure 5.2; Domack et al. 1989). The combined Mertz
and Ninnis Glacier Tongues were probably grounded on the outer shelf with restricted
water circulation under the floating ice shelf. Sub-ice shelf till melted from beneath
the glacier and combined with minor marine plankton at the western end of the
George V Basin, where the Mertz Drift is located.
90
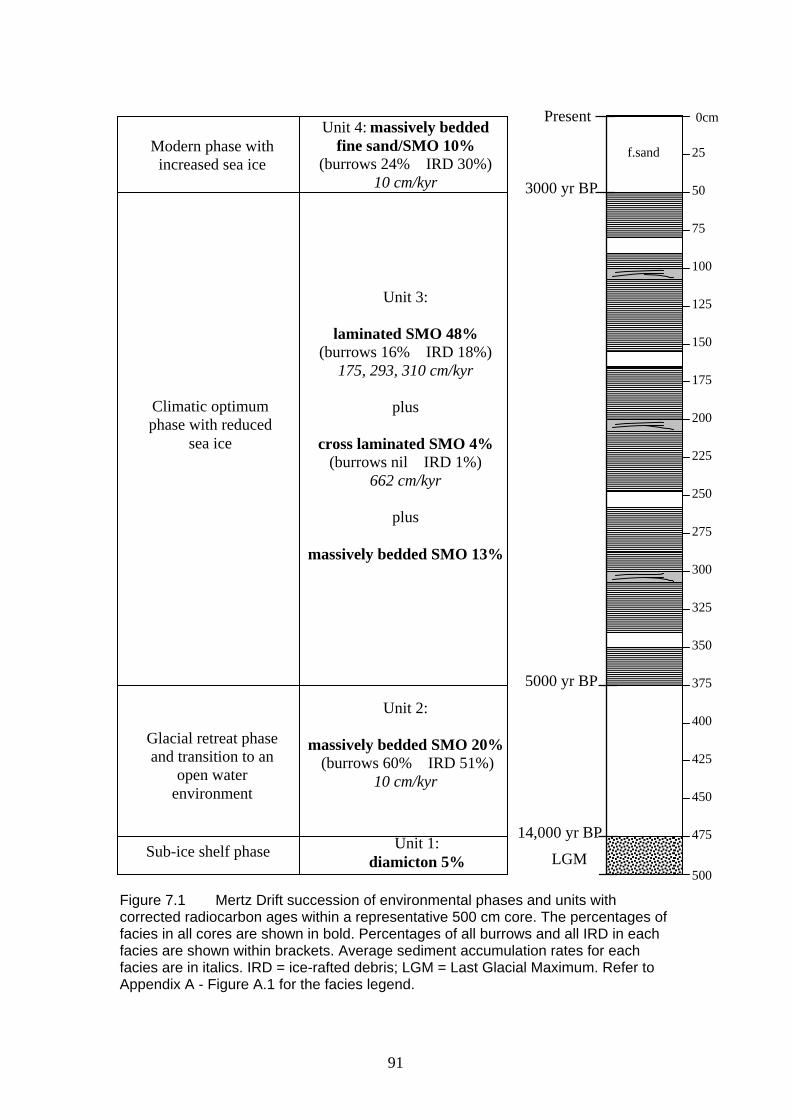
0cm
25
50
75
100
125
150
175
200
225
250
275
300
325
350
375
400
425
450
475
500
f.sand
Present
3000 yr BP
5000 yr BP
14,000 yr BP
LGM
Unit 4: massively bedded fine sand/SMO 10%
(burrows 24% IRD 30%) 10 cm/kyr
Unit 3:
laminated SMO 48% (burrows 16% IRD 18%)
175, 293, 310 cm/kyr
plus
cross laminated SMO 4% (burrows nil IRD 1%)
662 cm/kyr
plus
massively bedded SMO 13%
Unit 2:
massively bedded SMO 20% (burrows 60% IRD 51%)
10 cm/kyr
Unit 1: diamicton 5%
Modern phase with increased sea ice
Climatic optimum phase with reduced
sea ice
Glacial retreat phase and transition to an
open water environment
Sub-ice shelf phase
Figure 7.1 Mertz Drift succession of environmental phases and units with corrected radiocarbon ages within a representative 500 cm core. The percentages of facies in all cores are shown in bold. Percentages of all burrows and all IRD in each facies are shown within brackets. Average sediment accumulation rates for each facies are in italics. IRD = ice-rafted debris; LGM = Last Glacial Maximum. Refer to Appendix A - Figure A.1 for the facies legend.
91
(2) Glacial Retreat Phase. Domack et al. (1989) found a high IRD and
bioturbated, massively bedded SMO at the base of core DF79-12, which was
interpreted as a glacial retreat phase (refer Chapter 4 - Figure 4.1). This present study
found a similar massively bedded SMO facies, comprising 20% of Mertz Drift
sediments (Unit 2 in Figure 7.1). There was a high percentage of IRD gravel content
(51% of all IRD) observed in X-radiographs of this facies. This study interprets that
Unit 2 records a glacial retreat phase, and represents the transition from sub-ice shelf
to open marine conditions. This interpretation is consistent with similar high IRD,
massively bedded SMO facies, which represent sedimentation at the calving line of
retreating glaciers (Domack et al. 1989; Domack and Harris 1998; Harris and O'Brien
1998). The high IRD in this facies is believed to be related to the concentration of
icebergs by winds at the calving line (Domack and Harris 1998).
Ingolfsson et al. (1998) stated that ice retreat for the East Antarctic shelf area
was underway by 11,000 to 10,000 yr BP, with deglaciation of some shallow inner
shelf areas occurring between 10,000 to 5000 yr BP. Ingolfsson et al. (1998) also
noted that by 5000 yr BP most Antarctic glaciers had retreated to or behind their
present positions. The timing of Unit 2 conforms closely to the deglaciation period in
the review by Ingolfsson et al. (1998). The timing for the onset of open marine
conditions occurred about 14,000 yr BP based upon the corrected radiocarbon age at
the base of core 26PC12. Thus, the end of the LGM is constrained between about
24,000 and 14,000 yr BP. This study found that the massively bedded SMO facies
records a low sediment accumulation rate of about 10 cm/kyr. The extrapolated age at
the top of this facies has a corrected radiocarbon age of about 5000 yr BP; thus Unit 2
represents deposition over a 9000 year period.
Domack and Anderson (1983) attributed the increased winnowing of
sediments by impinging Circumpolar Deep Water (CDW) on the outer shelf for the
increasing proportion of SMO within the lower section of core DF79-12.
X-radiographs in this present study reveal a sharp contact whenever this
diamicton/SMO boundary occurs. The sharp contact is possible evidence of the
erosion that would be expected to occur as water masses intrude into the basin. The
high proportion of burrows found within Unit 2 (60% of all burrows) may
92

demonstrate colonisation by benthic fauna on the Mertz Drift as a result of a
retreating ice shelf. As the Mertz Glacier Tongue retreated, episodic deep basin
currents may have provided the infrequent energy needed to produce low deposition
rates, providing the substrate upon which benthic fauna found favourable for
colonisation and bioturbation.
(3) Climatic Optimum Phase. Domack et al. (1989) interpreted the upward
increase in biogenic material and three metre thick laminated SMO in core DF79-12
as the transition between proximal to distal ice tongue (refer Chapter 4 - Figure 4.1).
In this present study, a similar facies succession overlies the massively bedded SMO,
and comprised the bulk of Mertz Drift sediments (Unit 3 in Figure 7.1). Unit 3
consists of laminated SMO (48% of cores), interbedded with approximately three to
four cross laminated SMO (4% of cores) and massively bedded SMO (13% of cores;
Figure 7.1). For ease of discussion, Unit 3 is described as a laminated and cross
laminated SMO succession. Both the laminated and cross laminated SMO facies
record relatively low proportions of IRD gravel (18% and 1% of all IRD
respectively). This study also interprets Unit 3 to represent an open marine
environment with a distal ice tongue.
The Ingolfsson et al. (1998) review of post-LGM climatic history recorded a
climate optimum in East Antarctica from about 4700 to 2000 yr BP. This period was
warmer, wetter and had less sea ice than the present (Ingolfsson et al. 1998). The
corrected radiocarbon ages from Mertz Drift cores with Unit 3 record this succession
between about 5000 to 3000 yr BP. An important result of this study is that the period
of deposition of the laminated and cross laminated SMO succession is close to the
Ingolfsson et al. (1998) climatic optimum.
The average sediment accumulation rates for laminated SMO in cores
13GC05, 13GC06 and 26PC12 have high deposition rates (310, 293 and 175 cm/kyr
respectively). The cross laminated SMO facies in the Mertz Drift records a deposition
rate approximately double that of the laminated SMO facies at 662 cm/kyr. Sediment
accumulation rates for Unit 3 are over an order of magnitude greater than the rate for
the underlying Unit 2. It is unlikely that an increase in productivity over the shelf of
93

greater than 20 times can account for the thick Unit 3. Instead, enhanced bottom
current activity is believed responsible for concentrating the laminated SMO facies
into a drift deposit during this climate optimum phase. Furthermore, cross laminated
SMO may represent short periods of rapid sedimentation and higher velocity bottom
current activity relative to velocities responsible for deposition of laminations.
Another study of cross laminated SMO from marine cores obtained from the Nielsen
Shelf Valley, near Prydz Bay, also supports this interpretation, and the mid-Holocene
timing of enhanced bottom current activity (Harris, submitted).
The low proportion of burrows observed within the laminated and cross
laminated SMO facies (16% and 0% of all burrows respectively) may prove that the
environment of deposition was not suitable for colonisation by benthic fauna. A large
influx of fine grained biogenic material such as occurred during this sedimentary
succession would make colonisation difficult, which could explain the reduced
bioturbation in the X-radiographs and the excellent preservation of laminae.
Alternatively, the rate of bioturbation is much less than the sediment accumulation
and current reworking so no record is preserved during this period.
It is possible that the high sediment accumulation rates in Unit 3 may have
reduced the concentration of IRD gravel deposited over the Mertz Drift even if IRD
sedimentation was constant since the LGM. A reduced proportion of IRD gravel may
also infer a reduction in glacial calving due to a change in palaeoclimate and/or
glacial retreat. The lack of IRD gravel in the laminated SMO of core DF79-12 was
also noted as unusual by Domack and Anderson (1983) given the glacial setting of the
region and observed debris zones in icebergs. It was not possible in this study to
calculate accurate figures to prove or disprove that a high sedimentation rate alone
was responsible for the low IRD in this unit, even if the IRD rate was constant.
Analysis of a thin section of laminated SMO revealed a distinct change of
diatom assemblage between lamina. The light lamina is a mat of somewhat aligned
siliceous spines and numerous Fragilariopsis curta, a sea ice associated diatom. The
dark lamina is a compact and apparently diverse diatom assemblages, with numerous
Fragilariopsis kerguelensis, an open water associated diatom. Thus, these limited
94

observations confirm Domack's (1988) initial findings of a relative change in sea ice
diatom assemblage to open water diatom assemblage observed within lamination
couplets of core DF79-12. The relative dominance of sea ice diatoms to other diatoms
in each couplet is interpreted in this present study as representing the initial pelagic
flux of diatoms induced by melting sea ice, while the overlying laminae represents
primary productivity during the remainder of the summer season. Sediment trap data
are required to confirm this assumption.
Relatively shallow, impinging Circumpolar Deep Water (CDW) over the outer
shelf is responsible for transporting fine grained sediment towards the coast (Domack
1988). As SMO is not found anywhere in the eastern half of the George V Basin
(Harris 2000), then this study proposes that bottom currents associated with high
salinity Shelf Water (HSSW; refer Chapter 2 - Figure 2.5) sweep northwesterly along
the length of the basin, and collect falling pelagic material brought into the inner shelf
by CDW. The HSSW then concentrates the sediment into the Mertz Drift at the
western end of the George V Basin.
Analysis of cross laminated SMO thin sections reveals diatoms with a distinct
axis of orientation and grain-alignment. The alignment of individual elongate grains
suggests they were emplaced individually and not as clasts and faecal pellets. The
sediment within the cross laminated SMO appears to be current-lain, and is consistent
with the interpretation by Harris (submitted) that cross laminated SMO may represent
higher velocity bottom current activity relative to velocities responsible for deposition
of laminations. Additionally, the burial of the relatively large foraminifera
Globocassidulina crassa and the much smaller diatom matrix is an indication of a
poorly sorted sediment that would be expected if bottom current energy increases. As
calcium carbonate material can experience dissolution at depths greater than 500 m on
the shelf (Domack 1988), the lack of corrosion observed in the foraminifera could be
further evidence of the high sedimentation rate recorded in cross laminated SMO
facies and burial before dissolution could occur.
(4) Modern Phase. Domack et al. (1989) noted a significant increase in sand
percentage occurring in the upper 60 cm of core DF79-12 (refer Chapter 4 - Figure
95

4.2), and was interpreted as reduced biogenic input during the late-Holocene (Domack
et al. 1991). This present study found a similar massively bedded fine sand/SMO
facies, deposited as a drape over the Mertz Drift (Unit 4 in Figure 7.1). The massively
bedded fine sand/SMO comprises approximately 10% of Mertz Drift cores, and has a
relatively high proportion of IRD gravel content (30% of all IRD). Unit 4 is also
interpreted in this study as representing deposition of sediments during modern (late-
Holocene) oceanographic conditions. Thus, Unit 4 has been deposited as a drape over
the Mertz Drift during a period when the continental shelf in the region undergoes
long periods of sea ice cover each year with a short but productive summer.
Seismic profiles from the WEGA expedition show this surface layer to be
significantly different from the underlying laminated SMO facies (Figure 7.2).
Datasonics chirper data reveal an acoustically thin and dark layer overlying the Mertz
Drift, which is believed to represent the massively bedded fine sand/SMO facies
(Brancolini and Harris 2000).
large lobe
thin, dark drape over the drift
small lobe
Figure 7.2 Chirper data showing the details of internal acoustic bedding across the large and small lobes of the Mertz Drift, separated by a channel in the vicinity of core 25PC11 (source: Brancolini and Harris 2000). Note the thin and dark drape over the drift, interpreted to be Unit 4 - the massively bedded fine sand/SMO facies.
96
A distinct climatic deterioration occurred in East Antarctica after 2000 yr BP,
with colder, drier conditions, and more sea ice (Ingolfsson et al. 1998; Roberts et al.
2000). There has since followed a subsequent warming to present (Ingolfsson et al.
1998; Roberts et al. 2000). The mean of four corrected radiocarbon ages at the base of
Unit 4 show deposition commenced about 3000 yr BP to the present. An important
finding of this study is that deposition of the drape commenced close to the time when
the climatic deterioration occurred.
Unit 4 has similarities with Unit 2, the massively bedded SMO facies at the
bottom of Mertz Drift cores. Both facies record massive and convoluted structures
within X-radiographs. Both units show a relatively high proportion of burrows and
IRD gravel content, and record the same relatively low sediment accumulation rate
(10 cm/kyr). The lower Unit 2 is interpreted as being deposited in a warming
environment after a glacial, and the upper Unit 4 is also interpreted as reflecting
deposition during a cooler environment that is warming. Therefore, bottom current
activity during the period 3000 yr BP to the present is considered similar to that
interpreted for the period 14,000 to 5000 yr BP.
Episodic deep basin currents may have provided the infrequent energy needed
to produce low deposition rates, providing the substrate upon which benthic fauna
found favourable for colonisation, as observed in seafloor photographs. The
photographs at one site on the drift record sponge communities and Anthozoa on a
substrate interpreted to be massively bedded fine sand/SMO (refer Chapter 4 - Figure
4.11). Deep basin sponge communities survive in soft, predominantly muddy
surfaces, and may live on the few boulders large enough to provide a stable substrate,
which are high enough to prevent significant sediment accumulation on their surface
(Barthel and Gutt 1992). The numerous sponge spicules observed in the thin section
possibly confirm a significant colonisation of the Mertz Drift by deep water sponge
communities, as recorded in seafloor photographs. There is also evidence for
bioturbation in the thin section, which confirms the observation that Unit 4 has a
relatively high proportion of burrows in X-radiographs (24% of all burrows).
97

7.3 Model of Mertz Drift Formation
A summary model describing the formation of the Mertz Drift in three discrete
post-LGM phases is shown in Figure 7.3. The physical controls on drift formation are
discussed in more detail later in this chapter. The following is a description of each
phase:
(1) Glacial Retreat Phase - 14,000 to 5000 yr BP (Figure 7.3A). Eustatic sea level
rise followed by subsequent regional warming resulted in a rapid retreat of the Mertz
Glacier Tongue to produce an open water, marine environment over the George V
Basin. Short periods of episodic, relatively shallow Circumpolar Deep Water (CDW)
over the outer shelf, swept sediments into the inner shelf. Corresponding pulses of
deep basin, high salinity Shelf Water (HSSW) concentrated sinking fine grained
material into a drift. Sediments contain high ice-rafted debris (IRD) gravel, and the
substrate was colonised by benthic fauna.
(2) Climate Optimum Phase - 5000 to 3000 yr BP (Figure 7.3B). A mid-Holocene
climatic optimum resulted in less extensive sea ice in the region. Longer periods of
seasonal open water and air-sea interaction allowed correspondingly longer periods of
CDW to be upwelled over the outer shelf. Upwelled CDW transported greater
volumes of fine grained material into the George V Basin. CDW over the basin
cooled and sank to help produce HSSW and more energetic bottom currents, which in
turn concentrated sediments into the drift. High sedimentation rates reduced the
concentration of IRD gravel, and created an environment unsuitable for colonisation
by benthic fauna.
(3) Modern Phase - 3000 yr BP to present (Figure 7.3C). Regional cooling caused
seasonally more extensive sea ice. During episodic, relatively shorter periods,
upwelled CDW swept lower volumes of fine grained sediments into the George V
Basin. Pulses of deep basin HSSW concentrated material as a thin drape over the
drift. A low deposition rate resulted in high IRD gravel, and the substrate was
recolonised by benthic fauna.
98

Figure 7.3 Model of Mertz Drift formation using a cross section of the shelf. A = Glacial retreat phase; B = Climatic optimum phase; C = Modern phase. CDW = Circumpolar Deep Water; HSSW = high salinity Shelf Water; MSL = mean sea level.
Modern phase - 3000 yr BP to present
MSL
-200
-400
-600
-800
-1000
200 -1
CDW
HSSW
massively bedded fine sand/SMO with high IRD
more extensive sea ice
Climate optimum phase - 5000 to 3000 yr BP
MSL
-200
-400
-600
-800
000
200
-1
-1
sea level stable
CDW
laminated and cross laminated SMO with minor IRD
HSSW
less extensive sea ice
Glacial retreat phase - 14,000 to 5000 yr BP
MSL
-200
-400
-600
-800
000
200
HSSW
sea level rising icebergs from glacier CDW
-1 massively bedded SMO in sharp contact with diamicton A
-1
B
C
99

7.4 Sediment Accumulation Rates
A new finding, in addition to the aims of this study, is that sediment
accumulation rates across the Mertz Drift have not been constant over the same time
scale. This finding is evidenced by a lower sediment accumulation rate of 175 cm/kyr
within laminated SMO from core 26PC12, compared to 293 and 310 cm/kyr for
laminated SMO in cores 13GC05 and 13GC06 respectively. The difference between
the rates appears to correspond with the morphology of the drift. Figure 7.4 shows
that the thickest part of the drift of about 35 m occur in the vicinity of cores 13GC05
and 13GC06, while core 26PC12 was obtained from the edge of the large lobe where
acoustic strata thin and pinch out. Radiocarbon ages from core 16PC01 on the small
lobe (Figure 7.4) would be a useful test for a high sediment accumulation rate similar
to cores 13GC05 and 13GC06, however, no radiocarbon ages were available from
core 16PC01. The sediment accumulation rates across the Mertz Drift are likely to
vary depending on where the current preferentially deposits sediment over the drift.
Topography is likely to be an important factor in the current flow regime in this
region.
Figure 7.4 East/west 3.5 kHz seismic profile across the large and small lobes of the Mertz Drift (source: Brancolini and Harris 2000). Cores 13GC05 and 13GC06 lie at the thickest part of the drift on the large lobe, and have relatively high sedimentation rates within laminated SMO. Core 26PC12 is positioned on the edge of the large lobe where acoustic strata thins and pinches out, and has a lower sedimentation rate within the laminated SMO of this core.
basin wall channel small lobe large lobe
100

7.5 Timing of Post-LGM Deposition in the George V Basin
The timing of the Last Glacial Maximum (LGM) around Antarctica is
believed to have coincided with the timing of lowest global sea levels around 20,000-
18,000 yr BP (Ingolfsson et al. 1998). The sub-ice shelf phase of deposition for the
Mertz Drift was around 24,000 yr BP based upon the single radiocarbon age from
diamicton in this study. Diamicton (Unit 1) in the western end of the George V Basin
(i.e. Mertz Drift area) was thus deposited as a result of a glacial advance during the
LGM, and not during a mid-Holocene glacial advance as proposed by Domack et al.
(1991). Similarly, the timing of the onset of open marine conditions in this present
study (Unit 2 - 14,000 to 5000 yr BP) is in contrast to, and older than, the Domack et
al. (1991) estimate of mid- to late-Holocene timing of open marine conditions
following glacial retreat off George V Land. The climatic optimum phase (during
which the laminated and cross laminated SMO succession (Unit 3) of this study was
deposited) lasted from 5000 to 3000 yr BP. The equivalent laminated SMO within
core DF79-12 recorded corrected radiocarbon dates of between about 2400 to 1000 yr
BP (Domack et al. 1991).
The younger Domack et al. (1991) ages for core DF79-12 may be the result of
using a surface age of 5020 years to correct radiocarbon ages, nearly double the
surface ages used to correct Mertz Drift cores in this study. Thus, the assumptions
about reservoir correction for core DF79-12 made by Domack et al. (1991), and the
surface age used to correct core DF79-12 appear to be in error. A recalculation of
Domack et al.'s (1991) corrected radiocarbon ages (refer Chapter 5 - Table 5.1) using
the mean surface radiocarbon age of 2643 years from this present study, results in a
close match of radiocarbon ages for the laminated and cross laminated SMO: 5000 to
3000 yr BP (this study) versus about 4200 to 3000 yr BP (core DF79-12). However,
there was a poor match between the massively bedded SMO at the base of the Mertz
Drift: 14,000 to 5000 yr BP (this study) versus about 4700 to 4200 yr BP (core DF79-
12). No explanation can be given for the relatively poor match in radiocarbon ages for
the massively bedded SMO.
101
7.6 Lamination Couplets
A hypothesis of this study is that Mertz Drift sediments largely result from
cyclical, high productivity diatom blooms due to annual seasonal changes in sea ice
cover. This hypothesis was based upon the Domack (1988) productivity model to
explain the development of laminated SMO facies in shelf basin sediments (refer
Chapter 1 - Figure 1.3). This present study finds evidence in the laminated SMO thin
section for a cycle of sea ice diatoms to open water diatoms. Based on the Domack
(1988) model, this cycle is interpreted as representing the initial pelagic flux of
diatoms induced by melting sea ice, while the overlying lamina represents primary
productivity during the remainder of the summer season.
Calculations of the mean deposition time of lamination couplets in cores
13GC05 and 26PC12 indicate periods of between 2.6 and 4.3 years respectively.
These figures appear to disprove the hypothesis that Mertz Drift sediments result from
diatom blooms due to annual seasonal changes in sea ice cover. Yet the errors
involved in calculating the mean deposition time of lamination couplets in cores
13GC05 and 26PC12 suggest caution in disproving the annual productivity
hypothesis of this study. This study identifies that the mean deposition time of
lamination couplets is most likely to be multiyear but not decadal. The relevance of
multiyear cycles recorded in lamination couplets is that the laminated SMO of the
Mertz Drift thus records a high resolution history of sea ice versus open water
production over the George V Basin. A downcore comparison of sea ice versus open
water diatoms within a long piston core from the drift would be useful in
understanding this history.
Combining the interpretation of formation of laminae from thin section
analysis with the finding of a mean deposition time of between 2.6 and 4.3 years leads
to a revised hypothesis that Mertz Drift laminated sediments result from cyclical, high
productivity diatom blooms due to seasonal changes in sea ice cover. The lamination
couplets could reflect events that take between 2.6 to 4.3 years to occur, such as the
changes in sea ice extent as has recently been seen in the Weddell Sea, coherent with
observed passages of the Antarctic Circumpolar Wave (Cosimo and Gordon 1998).
102

7.7 Physical Controls on Drift Formation
Domack (1988) hypothesised that the thicker SMO sediments at the western
end of the George V Basin (i.e. the area Mertz Drift lies in) should contain a greater
proportion of gravity flow muds than the uniform and draped layers as recovered in
core DF79-12. An aim of this project was to conduct thin section analysis, which may
reveal whether sediments were a hemipelagic drape, current lain or from gravity
flows. Thin sections did reveal sediments to be a possible continuum between drape
and current lain deposits, but no evidence for gravity flows was observed. In addition,
the criteria to distinguish debris flow from high and low concentration turbidites, such
as upper or lower sharp contacts and upward fining of beds (Wright et al. 1983), do
not appear within any Mertz Drift X-radiographs. As no sharp contacts were obvious
from the X-radiographs within this thick laminated and cross laminated SMO
succession, it is difficult to support the Domack (1988) gravity flow hypothesis. If
gravity flows were an important feature of the Mertz Drift then seismic profiles would
show wedge-shaped acoustic reflections. Instead, profiles reveal a mounded and
constructional feature, consistent with the depositional architecture indicative of a
'confined drift' as defined by Faugeres et al. (1999).
7.7.1 Oceanography
This study proposes that two separate currents are responsible for the
construction of the Mertz Drift. The two water masses responsible for the currents
are:
(1) Circumpolar Deep Water (CDW). Relatively shallow, impinging CDW transports
fine grained biogenic material from the water column and terrigenous material
winnowed from the outer shelf banks towards the coast, and over the George V Basin.
This process is well accepted within Antarctic glacial-marine models, in that fine
grained material is swept from the outer shelves by upwelled CDW, and transported
southerly towards the inner shelf (Domack 1988; Harris and O'Brien 1998). Most of
the sediments within the Mertz Drift were probably derived from the outer shelf
except for any ice-rafted debris (IRD) and diatoms falling from above.
103

(2) High Salinity Shelf Water (HSSW). Deep basin bottom currents derived from
HSSW (separate from southerly-flowing CDW) sweep northwesterly along the length
of the basin, and collect falling fine grained biogenic and terrestrial material brought
into the inner shelf by CDW. These sediments are then concentrated into the Mertz
Drift at the western end of the basin. The geomorphology of the drift suggests a
bottom current from the southeast, which will be argued in the following paragraphs
based upon recent oceanographic information, and other physical processes such as
seafloor bathymetry and Coriolis effect.
Recent oceanographic studies have yet to resolve the current flows at the
western end of the George V Basin but there are some initial results from acoustic
doppler current profiler data for northwesterly-flowing deep basin currents reflective
of HSSW (Williams 2000). Bindoff and Williams (submitted) state that a major
source for the brine contributing to the cold, dense HSSW originates from the Mertz
polynya at the eastern end of the George V Basin. This information forms the basis
for the proposal that the deep basin bottom current responsible for concentrating
sediments into the Mertz Drift is derived from HSSW, flowing from the eastern end
of the George V Basin towards the western end of the basin (i.e. in the vicinity of the
Mertz Drift), then northward over the sill as Antarctic Bottom Water (AABW; refer
Chapter 2 - Figure 2.5).
7.7.2 Bathymetry
It is possible that the bathymetric form of the basin may explain sedimentation
into a drift deposit. Any water mass with fine grained sediments in a suspension load
must experience a reduction in velocity to allow settling at the western end of the
George V Basin. The bathymetric map of the continental shelf off George V Land
displays a 'peanut' shaped George V Basin (refer Chapter 1 - Figure 1.4). There is a
low ridge at about longitude 144˚ east that separates the western arm of the basin from
the deeper east section (Harris 2000). Any northwesterly-flowing HSSW must
encounter this ridge then flow down into the western end of the basin before being
deflected north towards the sill. In effect, a gyre is likely to have been produced over
the western end of the basin where fine grained sediments settle in a drift deposit
104

when the velocity drops. The proposed general flow of HSSW within the George V
basin is displayed in Figure 7.5.
continental slope
HSSW
cooling of MCDW
Mertz Glacier
polynya
brine rejection
pack ice N
East Wind Drift
CDW
Mertz Drift
AABW
Figure 7.5 Diagram showing brine rejection and/or cooling of impinging Modified Circumpolar Deep Water (MCDW) to produce westerly flowing high salinity Shelf Water (HSSW) and Antarctic Bottom Water (AABW) within the George V Basin (modified from: Baines and Condie 1998). Note the proposed gyre effect over the western end of the basin believed responsible for the concentration of sediments into the Mertz Drift.
7.7.3 Geomorphology and Coriolis Effect
The review of deep sea drift deposits or contourite drifts by Faugeres et al.
(1999) states that as a general rule, deep sea sediment bodies of any type tend to
migrate according to a number of principal factors: the flow direction, the Coriolis
effect and the bathymetric framework. Firstly, whatever the type of current, drift
deposits tend to migrate downstream. Secondly, the Coriolis effect influences the
current regime and lateral migration of drifts. In the Southern Hemisphere, if current
flow is from east to west, the Coriolis effect deflects the flow to the left, effectively
105
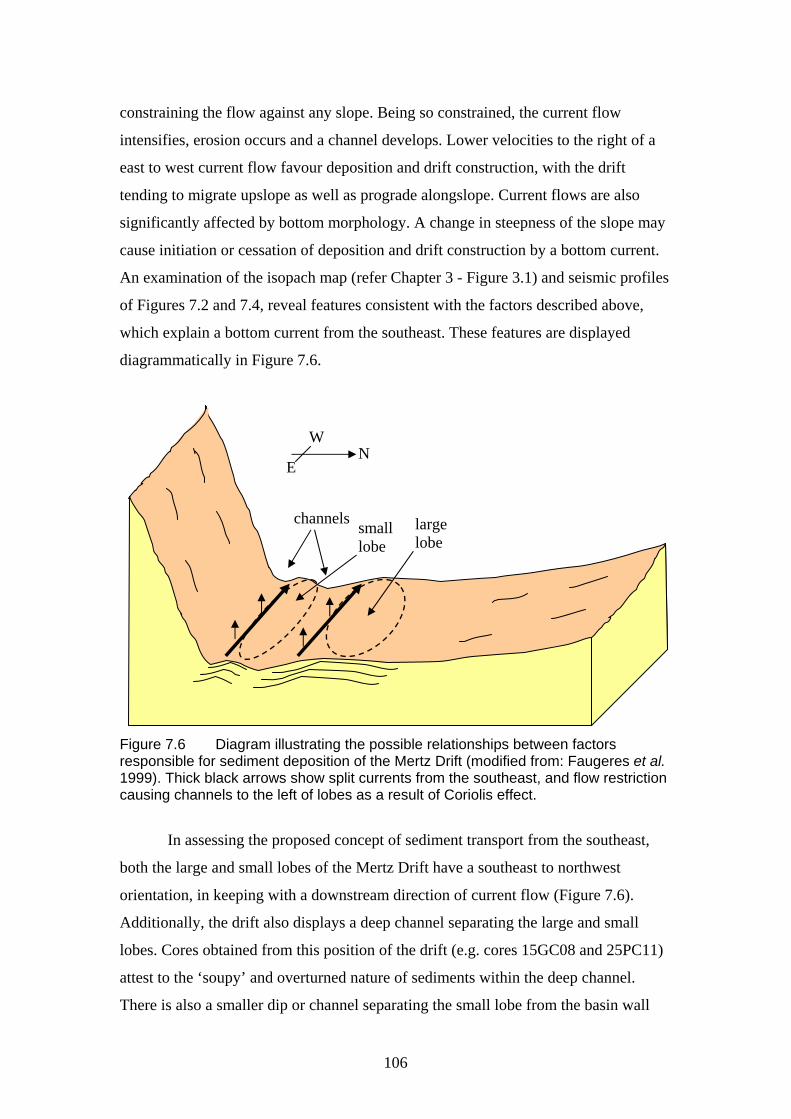
constraining the flow against any slope. Being so constrained, the current flow
intensifies, erosion occurs and a channel develops. Lower velocities to the right of a
east to west current flow favour deposition and drift construction, with the drift
tending to migrate upslope as well as prograde alongslope. Current flows are also
significantly affected by bottom morphology. A change in steepness of the slope may
cause initiation or cessation of deposition and drift construction by a bottom current.
An examination of the isopach map (refer Chapter 3 - Figure 3.1) and seismic profiles
of Figures 7.2 and 7.4, reveal features consistent with the factors described above,
which explain a bottom current from the southeast. These features are displayed
diagrammatically in Figure 7.6.
floor basin
side of basin
channels
N
small lobe
large lobe
W
E
Figure 7.6 Diagram illustrating the possible relationships between factors responsible for sediment deposition of the Mertz Drift (modified from: Faugeres et al. 1999). Thick black arrows show split currents from the southeast, and flow restriction causing channels to the left of lobes as a result of Coriolis effect.
In assessing the proposed concept of sediment transport from the southeast,
both the large and small lobes of the Mertz Drift have a southeast to northwest
orientation, in keeping with a downstream direction of current flow (Figure 7.6).
Additionally, the drift also displays a deep channel separating the large and small
lobes. Cores obtained from this position of the drift (e.g. cores 15GC08 and 25PC11)
attest to the ‘soupy’ and overturned nature of sediments within the deep channel.
There is also a smaller dip or channel separating the small lobe from the basin wall
106
(refer to Figure 7.4). Thus, current flow appears to split at a finer-scale over the drift
to erode and create two channels. Both channels are consistent with flow restriction to
the left as a result of Coriolis effect. A topographic high underlying the Mertz Drift on
the west side of the large lobe (under core 26PC12 in Figure 7.2) may explain why
currents have split at this finer scale. Deposit zones to the right of the split currents
explain the development of the two lobes, and possibly the varying sediment
accumulation rates across the Mertz Drift. Faugeres et al. (1999) also describes
progradation towards the slope for drifts in the southern hemisphere as a result of the
Coriolis effect. The internal acoustic structure of the Mertz Drift displays this feature.
From seismic profiles, Brancolini and Harris (2000) note that acoustic reflectors from
the small lobe dive beneath the reflectors of the large lobe. This may reflect
progradation toward the side of the basin in keeping with the Faugeres et al. (1999)
model of drift deposition, and provide further proof that current flow is from the
southeast.
7.8 Does the Mertz Drift Record Bottom Water Formation?
This study proposed that it was unlikely that an increase in productivity over
the shelf of greater than 20 times could account for the high deposition rates during
the climatic optimum phase (Unit 3). Primary productivity is dependent on the
presence of sunlight, carbon dioxide, nutrient salts and water, whilst the rate is
controlled by the levels of these factors and by the ambient temperature (Walton
1987). With the arrival of spring and summer, the sea ice breaks up, exposing the
water to light. Within days a phytoplankton bloom develops as a result of rapid
multiplication of resting spores brought to the surface and also released from the
fragmenting ice layer (Walton 1987). However, studies show that highest numbers of
diatom species occurred with the melting of the sea ice then dropped off during the
remainder of summer when open water prevailed (Knox 1994). The implication is that
regardless of the period of favourable light and temperature each season,
phytoplankton blooms occur only during a brief period at the beginning of summer
and reduces thereafter. It is difficult to believe that a climatic optimum would change
the relative productivity to a level to produce the high sedimentation rates recorded in
the Mertz Drift, based upon the behaviour of diatom blooms under present conditions.
107

Even if primary productivity, and possibly IRD sedimentation, has been
relatively constant since the Last Glacial Maximum (LGM), the only mechanism to
explain the high sedimentation rates in the Mertz Drift are physical processes such as
enhanced bottom currents. A surge in the local current regime in the George V Basin
may possibly concentrate greater volumes of fine grained material into a drift deposit
during the climate optimum phase. A relative reduction in bottom current intensity
during the glacial retreat phase (Unit 2) and modern phase (Unit 4) therefore will not
lead to transporting the same volume of fine grained material, and result in lower
deposition rates.
Evidence for enhanced bottom current activity during the climatic optimum
are the lateral accretion surfaces, parallel foresets, wavy or laterally discontinuous
laminae observed in X-radiographs of cross laminated SMO from the Mertz Drift.
Cross laminations are believed to represent short periods of rapid sedimentation and
higher velocity bottom current activity relative to velocities responsible for deposition
of laminations. Thin sections of cross laminated SMO show current-lain diatom
frustule alignment, rapid sedimentation in the form of uncorroded foraminifera and
poorly sorted sediments. Similarly, thin sections of laminated SMO show evidence of
current transport with somewhat aligned siliceous spines in the light laminae.
This study thus proposes that Mertz Drift sediments do record bottom water
formation. The deep basin bottom current believed to be responsible for concentrating
sediments into the deposit is derived from high salinity Shelf Water (HSSW), which
fills the George V Basin, and eventually overflows the sill at the shelf edge to become
Antarctic Bottom Water (AABW; Rintoul 1998). The interpretation of environments
from this study therefore implies three distinct periods of HSSW, and hence AABW
production, since the LGM. The massively bedded SMO (Unit 2) was deposited by
relatively less energetic bottom currents from 14,000 to 5000 yr BP. This period
occurred during glacial retreat as sea level rose and the climate warmed (Ingolfsson et
al. 1998). The laminated and cross laminated SMO succession (Unit 3) was deposited
during a surge in the local bottom current regime from 5000 to 3000 yr BP. This
period is close to a climatic optimum when East Antarctica was warmer, wetter and
had less sea ice than the present (Ingolfsson et al. 1998). A climatic deterioration in
108

East Antarctica with colder, drier conditions, and more sea ice (Ingolfsson et al.
1998), resulted in relatively less energetic, episodic bottom currents depositing
massively bedded fine sand/SMO (Unit 4) from 3000 yr BP to present.
As two separate water masses and the resulting currents are believed
responsible for the Mertz Drift (i.e. the relatively shallow CDW and deep basin
HSSW), this study proposes that a possible factor linking the two water masses to
changes in local current regime is the change in sea ice cover over the shelf. Relative
changes in sea ice cover have been highlighted in the Ingolfsson et al. (1998) review
of Antarctic glacial and climatic history since the LGM. Less extensive sea ice in the
region during a climatic optimum would allow winds such as from cyclonic storms to
interact with the sea and draw CDW onto the shelf. This interaction would occur in
the same manner that causes upwelling of oceanic water masses on lower latitude
continental shelves (Press and Seiver 1986).
Recent oceanographic studies in the region found CDW peaks in flow over the
outer shelf in summer when the sea ice has melted (Williams 2000). Therefore, a
longer period of seasonal open water during a climatic optimum may allow a
correspondingly longer period of time for the upwelling of CDW over the outer shelf
and towards the coast. As CDW is linked to the production of modified Circumpolar
Deep Water (MCDW), then HSSW through brine rejection, and ultimately AABW as
it flows off the shelf (Rintoul 1998; Bindoff and Williams, submitted), a longer period
of upwelled CDW may be the oceanographic key that enhances bottom current
activity. The resulting surge in local bottom currents as HSSW fills the basin would,
in turn, focus the higher volumes of fine grained sediments into the Mertz Drift, and
produce more AABW during a climatic optimum. The relative changes in deposition
are important because of the implications for the non-steady-state of bottom water
production proposed by Broecker et al. (1998).
Another important implication from the results of this study is the role of the
Mertz Drift as a carbon sink. Antarctic deep shelf basins have been suggested as
potential carbon sinks by Harris et al. (1999). This is because sediments are presently
accumulating within the shelf valleys and basins, which represent approximately 10%
109

of the shelf surface area compared to the 90% of the area that is essentially erosional
in character (Harris and O'Brien 1996). This present study calculated a carbon content
within the Mertz Drift of approximately 78 million tonnes (Mt). This is approximately
seven times the carbon content calculated for the Andvord Drift, the only other drift
deposit found on the Antarctic shelf to date (11 Mt; Harris et al. 1999). When
averaged over the entire drift formation period of approximately 14,000 years, the 78
Mt of carbon calculated within the Mertz Drift may only represent a low carbon
deposition rate of 5.6 kt C/yr. However, when about 65% (the calculated percentage
of Unit 3) of that 78 Mt, or 45.5 Mt, is deposited between 5000 and 3000 yr BP,
during a period of enhanced bottom current, the carbon deposition rate climbs to
about 25 kt C/yr. As there are over 19 deep basins along the Australian Antarctic
Territory alone, with the majority unstudied, then any drift deposits which may be in
these basins could play an important role in the carbon cycle of the Antarctic shelf.
110
Chapter 8. Conclusions
8.1 Conclusions
This present study has developed a new model to explain the origin of the
Mertz Drift. This study draws upon models of drift deposits by Faugeres et al. (1999),
and previous models of Antarctic glacial-marine sediments by Anderson et al. (1983),
Domack (1988), Domack and Harris (1998), and Harris and O'Brien (1998).
A study of X-radiographs, visual core logs and multi-sensor core logger data
from 18 gravity and piston cores collected by the WEGA research expedition on the
Mertz Drift, defines five facies:
(1) massively bedded siliceous mud and diatom ooze (SMO)
(2) massively bedded fine sand/SMO,
(3) laminated SMO,
(4) cross laminated SMO, and
(5) diamicton.
A comparison of facies interpretation logs of all cores, the application of
radiocarbon ages to cores, thin section analysis and seafloor photographs of the Mertz
Drift allow interpretation of the five facies into four generalised phases of
environmental history. The diamicton corresponds to sub-ice shelf, water-lain till
deposition during the Last Glacial Maximum (LGM). Unconformably overlying the
diamicton is a massively bedded SMO with a high proportion of ice-rafted debris
(IRD). This unit represents a period of glacial retreat of the ice shelf and a transition
to an open marine environment, commencing about 14,000 yr BP. Low sedimentation
rates during this period last for about 9000 years. A thick succession of laminated and
cross laminated SMO follows, deposited during a mid-Holocene climate optimum
from 5000 to 3000 yr BP. Overlying the Mertz Drift as a drape is a massively bedded
fine sand/SMO with a high proportion of IRD, deposited from 3000 yr BP to present.
This drape reflects modern oceanographic conditions commencing from a time of
climatic deterioration in the region.
111
This study found large relative changes in sediment accumulation rates
between the glacial retreat phase, climatic optimum phase and modern phase. A
comparison of sediment accumulation rates across the Mertz Drift also reveals that
rates have not been constant over the same time scale. Radiocarbon ages from Mertz
Drift cores show diamicton was deposited as a result of a glacial advance during the
LGM, and not during a Domack et al. (1991) mid-Holocene glacial advance over the
George V Basin. The timing of the onset of open marine conditions in this study is in
contrast to, and older than, the Domack et al. (1991) mid- to late-Holocene timing of
open marine conditions in the area.
As a consequence of this study, the three hypotheses proposed at the start of
the thesis are mostly supported. However, this study was not able to confirm that
Mertz Drift sediments largely result from cyclical, high productivity diatom blooms
due to annual seasonal changes in sea ice cover. In contrast, observations of lamina
revealed cyclical changes in diatom assemblages within lamination couplets with
mean deposition times of between 2.6 to 4.3 years.
Mertz Drift sediments are concentrated and reworked by episodic, deep basin
currents. The two currents believed responsible for the construction of the drift are the
relatively shallow, upwelled Circumpolar Deep Water (CDW), transporting fine
grained sediments southwards towards the inner shelf, and deep high salinity Shelf
Water (HSSW) flowing northwesterly along the basin, focusing sinking sediments
into a drift deposit. A gyre is likely to have been produced over the western end of the
basin where fine grained sediments settle in a drift deposit when the velocity drops.
Coriolis effect and seafloor topography are two physical processes that are likely to be
important factors in the current flow regime in this area.
Mertz Drift sediments record a high resolution record of bottom current
intensity during the Holocene, and hence palaeoenvironment, off George V Land.
Bottom currents are associated with the formation of HSSW, which in turn becomes
Antarctic Bottom Water (AABW). The relative reduction of seasonal sea ice cover
during a climatic optimum is believed to be a key factor in allowing longer periods of
CDW over the shelf, which leads to a surge in bottom currents and the concentration
112
of greater volumes of sediment into the Mertz Drift. Calculation of carbon deposition
rates in the Mertz Drift shows that drift deposits may play an important role in the
carbon cycle of the Antarctic shelf.
The sediments of the Mertz Drift reflect dramatic and rapid changes in the
palaeoenvironment during the Holocene. There is currently a global anthropogenic
warming trend influencing sea ice distribution around Antarctica. Ice cores show that
warming over the past three decades is the most pronounced in over four centuries.
The results from this study predicts that: if the warming trend and sea ice reduction
continue, then the energetic current environment, observed during the mid-Holocene
climatic optimum, will develop. However, the proviso for this scenario will only occur
if sea ice reduces significantly from the extensive area it currently occupies around
Antarctica during most of the year. This study also has important implications for
oceanographers as the results suggest a non-steady-state of Antarctic Bottom Water
production during the Holocene.
8.2 Recommendations for Further Research
To help resolve the issue of lamination couplet origin and period of cyclicity,
sediment trap data would be required to confirm diatom assemblage successions. A
longer piston core at the site of the thickest section of the drift would provide a
detailed record of past environmental conditions from a relatively unknown region of
the East Antarctic shelf. This record would provide a comparison for other better
studied locations such as the Nielsen Shelf Valley and Prydz Bay. The aim would be
to develop an East Antarctic Holocene palaeoclimatology, as one of key strategic
questions underpinning Australian Antarctic research is - What geological and
geophysical processes have shaped the continent and the surrounding ocean, and what
has been their effect on the present and past Antarctic climate?
The findings from this present study can now be compared with the Dome C
ice core onshore. This was one of the aims for the WEGA expedition. The correlation
of sedimentary and glacial records would contribute to the understanding of temporal
and spatial constraints of the glacial/interglacial stages and late-Quaternary
113

palaeoclimatic fluctuations. The comparison of sedimentary and glacial records would
also permit the linkage of atmospheric processes and the response of the marine
system.
Future research with the existing WEGA cores could involve obtaining more
radiocarbon dates to 'fine-tune' the corrected ages to the various facies. Radiocarbon
ages from core 16PC01, on the small lobe, would be a useful test for a high sediment
accumulation rate similar to cores 13GC05 and 13GC06, from the large lobe. A study
of variability in sea ice versus open water diatom assemblages within individual
laminae would be very useful. Techniques would involve individual diatom species
counts and a detailed thin section analysis. In addition, an overall downcore
comparison of sea ice versus open water diatoms within a long piston core would be
useful for helping understand the history of sea ice versus open water production on
the continental shelf off George V Land.
114

References
Anderson, J.B., Domack, E.W. and Kurtz, D.D. (1980). Observations of sediment-
laden icebergs in Antarctic waters: implications to glacial erosion and
transport. Journal of Glaciology Vol. 25, No. 23: 387-396.
Anderson, J.B., Brake, C., Domack, E.W., Myers, N. and Wright, R. (1983).
Development of a Polar Glacial-Marine Sedimentary Model from Antarctic
Quaternary Deposits and Glaciological Information. In: Molnia, B.F. (editor).
Glacial-Marine Sedimentation. New York: Plenum Press: 233-263.
Antarctic CRC (2000), Antarctic CRC Home Page [www.antcrc.utas.edu.au],
[cited February 25, 2000]. Available from Internet:
<URL:http://www.antcrc.utas.edu.au/sediment_web/collab/wega/wega.html>.
Arntz, W.E. and Gallardo, V.A. (1994). Antarctic Benthos: Present Position and
Future Prospects. In: Hempel, G. (editor). Antarctic Science, Global Concerns.
Berlin: Springer-Verlag: 243-277.
Ashley, G.M. and Smith, N.D. (2000). Marine sedimentation at a calving glacier
margin. GSA Bulletin Vol. 112, No. 5: 657-667.
Australian Antarctic Division (2000), Australian Antarctic Division Home Page
[www.antdiv.gov.au], [cited August 27, 2000]. Available from Internet:
<URL:http://www.antdiv.gov.au/resources/atlas/>.
Baines, P.G. and Condie, S. (1998). Observations and Modelling of Antarctic
Downslope Flows: a Review. In: Jacobs, S.S. and Weiss, R.F. (editors).
Ocean, Ice and Atmosphere: Interactions at the Antarctic Continental Margin.
Antarctic Research Series Volume 75. Washington D.C.: American
Geophysical Union: 29-49.
115
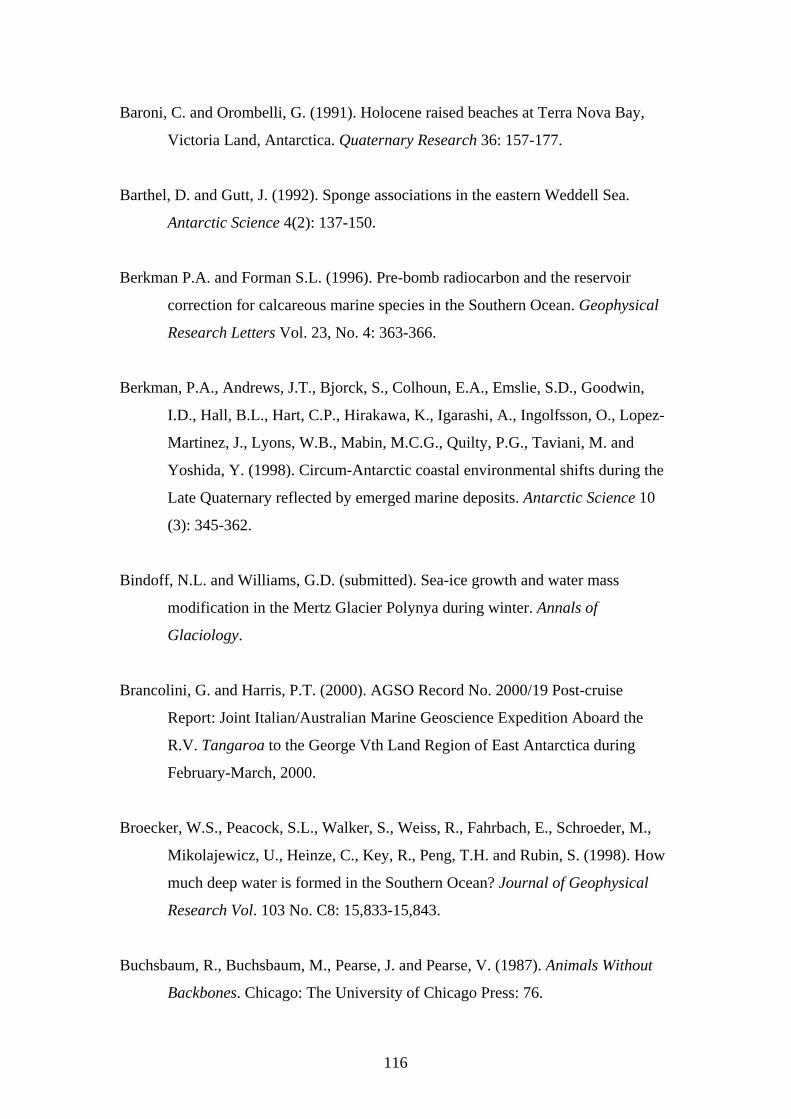
Baroni, C. and Orombelli, G. (1991). Holocene raised beaches at Terra Nova Bay,
Victoria Land, Antarctica. Quaternary Research 36: 157-177.
Barthel, D. and Gutt, J. (1992). Sponge associations in the eastern Weddell Sea.
Antarctic Science 4(2): 137-150.
Berkman P.A. and Forman S.L. (1996). Pre-bomb radiocarbon and the reservoir
correction for calcareous marine species in the Southern Ocean. Geophysical
Research Letters Vol. 23, No. 4: 363-366.
Berkman, P.A., Andrews, J.T., Bjorck, S., Colhoun, E.A., Emslie, S.D., Goodwin,
I.D., Hall, B.L., Hart, C.P., Hirakawa, K., Igarashi, A., Ingolfsson, O., Lopez-
Martinez, J., Lyons, W.B., Mabin, M.C.G., Quilty, P.G., Taviani, M. and
Yoshida, Y. (1998). Circum-Antarctic coastal environmental shifts during the
Late Quaternary reflected by emerged marine deposits. Antarctic Science 10
(3): 345-362.
Bindoff, N.L. and Williams, G.D. (submitted). Sea-ice growth and water mass
modification in the Mertz Glacier Polynya during winter. Annals of
Glaciology.
Brancolini, G. and Harris, P.T. (2000). AGSO Record No. 2000/19 Post-cruise
Report: Joint Italian/Australian Marine Geoscience Expedition Aboard the
R.V. Tangaroa to the George Vth Land Region of East Antarctica during
February-March, 2000.
Broecker, W.S., Peacock, S.L., Walker, S., Weiss, R., Fahrbach, E., Schroeder, M.,
Mikolajewicz, U., Heinze, C., Key, R., Peng, T.H. and Rubin, S. (1998). How
much deep water is formed in the Southern Ocean? Journal of Geophysical
Research Vol. 103 No. C8: 15,833-15,843.
Buchsbaum, R., Buchsbaum, M., Pearse, J. and Pearse, V. (1987). Animals Without
Backbones. Chicago: The University of Chicago Press: 76.
116

Colhoun, E.A. (1997). A Review of Geomorphological Research in Bunger Hills and
Expansion of the East Antarctic Ice Sheet during the Last Glacial Maximum.
In: Ricci, C.A. (editor). The Antarctic Region: Geological Evolution and
Processes. Proceedings of the VII International Symposium on Antarctic
Earth Sciences. Siena: Terra Antarctica Publication: 801-807.
Cosimo, J.C. and Gordon, A.L. (1998). Interannual Variability in Summer Sea Ice
Minimum, Coastal Polynyas and Bottom Water Formation in the Weddell Sea.
In: Jefferies, M.O. (editor). Antarctic Sea Ice: Physical Processes,
Interactions and Variability. Antarctic Research Series Volume 74.
Washington DC: American Geophysical Union: 293-315.
Cunningham, W.L, Leventer, A., Andrews, J.T., Jennings, A.E. and Licht, K.J.
(1999). Late Pleistocene-Holocene marine conditions in the Ross Sea,
Antarctica: evidence from the diatom record. The Holocene 9.2: 129-139.
Domack, E.W., Fairchild W.W. and Anderson J.B. (1980). Lower Cretaceous
sediment from the East Antarctic continental shelf. Nature 287: 625-626.
Domack, E.W. (1982). Sedimentology of glacial and glacial marine deposits on the
George V - Adélie continental shelf, East Antarctica. Boreas 11: 79-97.
Domack, E.W. and Anderson J.B. (1983). Marine Geology of the George V
Continental Margin: Combined Results of Deep Freeze 79 and the 1911-14
Australasian Expedition. In: Oliver, R.L., James, P.R. and Jago, J.B. (editors).
Antarctic Earth Science. Canberra: Australian Academy of Science: 402-406.
Domack, E.W. (1988). Biogenic Facies in the Antarctic glacimarine environment:
basis for a polar glacimarine summary. Palaeogeography, Palaeoclimatology,
Palaeoecology 63: 357-372.
Domack, E.W., Jull, A.J.T., Anderson, J.B., Linick, T.W. and Williams, C.R. (1989).
Application of Tandem Accelerator Mass-Spectrometer dating to late
117

Pleistocene-Holocene sediments of the East Antarctic continental shelf.
Quaternary Research 31: 277-287.
Domack, E.W., Jull, A.J.T. and Nakao, S. (1991). Advance of East Antarctic outlet
glaciers during the Hypsithermal: implications for the volume state of the
Antarctic ice sheet under global warming. Geology Vol. 19: 1059-1062.
Domack, E.W. and Harris, P.T. (1998). A new depositional model for ice shelves,
based upon sediment cores from the Ross Sea and the Mac.Robertson shelf,
Antarctica. Annals of Glaciology 27: 281-184.
Edgar, G.J. (1997). Australian Marine Life. Kew, Victoria: Reed Books: 112.
Emslie, S.D., Fraser, W., Smith, R.C. Walker, W. (1998). Abandoned penguin
colonies and environmental change in the Palmer Station area, Anvers Island,
Antarctic Peninsula. Antarctic Science 10 (3): 257-268.
Faugeres, J.C., Stow, D.A.V., Imbert, P. and Viana, A. (1999). Seismic features
diagnostic of contourite drifts. Marine Geology 162: 1-38.
Fitzsimons, S.J. and Colhoun, E.A. (1995). Form, structure and stability of the margin
of the Antarctic ice sheet, Vestfold Hills and Bunger Hills, East Antarctica.
Antarctic Science 7: 171-179.
Goodwin, I.D. (1996). A mid to late Holocene readvance of the Law Dome ice
margin, Budd Coast, East Antarctica. Antarctic Science 8 (4): 395-406.
Gowlett-Holmes, K. (2000). Dr. K. Gowlett-Holmes, CSIRO Marine Research
[personal communication, 10 July 2000].
Hampton, M.A., Kravitz, J.H. and Luepke, G. (1987). Geology of Sediment Cores
from the George V Continental Margin, Antarctica. In: Eittreim, S.L. and
Hampton, M.A. (editors). The Antarctic Continental Margin: Geology and
118

Geophysics of Offshore Wilkes Land, CPCEMR Earth Science Series Volume
5A. Houston: Circum-Pacific Council for Energy and Mineral Resources: 151-
174.
Harris, P.T., O'Brien, P.E., Sedwick, P. and Truswell, E.M. (1996). Late Quaternary
history of sedimentation on the Mac.Robertson shelf, East Antarctica:
problems with 14C-dating of marine sediments. Papers and Proceedings of the
Royal Society of Tasmania Vol. 130(2): 47-53.
Harris, P.T. and O'Brien, P.E. (1996). Geomorphology and sedimentology of the
continental shelf adjacent to Mac.Robertson Land, East Antarctica: a scalped
shelf. Geo-Marine Letters 16:287-296.
Harris, P.T. and O'Brien P.E. (1998). Bottom currents, sedimentation and ice-sheet
facies successions on the Mac.Robertson shelf, East Antarctica. Marine
Geology 151: 47-72.
Harris, PT., Domack, E.W., Manley, P.L., Gilbert, R. and Leventer, A. (1999).
Andvord drift: A new type of inner shelf, glacial marine deposystem from the
Antarctic Peninsula. Geology Vol. 27, No. 8: 683-686.
Harris, P.T. (2000), Dr. P.T. Harris, Antarctic CRC, University of Tasmania [personal
communication, 25 August 2000].
Harris, P.T. (submitted). Ripple cross-laminated sediments on the East Antarctic
shelf: evidence for episodic bottom water production during the Holocene?
Marine Geology.
Heine, J.C. and Speir, T.W. (1989). Ornithogenic soils of the Cape Bird Adélie
penguin rookeries, Antarctica. Polar Biology 10: 89-99.
Ingolfsson, O., Hjort, C., Berkman, P.A., Bjorck, S., Colhoun, E., Goodwin, I.D.,
Hall, B., Hirakawa, K., Melles, M., Moller, P and Prentice, M.L. (1998).
119

Antarctic glacial history since the Last Glacial Maximum: an overview of the
record on land. Antarctic Science 10(3): 326-344.
Joyner C.C. (1988). The Antarctic legal regime and the Law of the Sea. Oceanus 31
No.2: 22-27.
Knox, G.A. (1994). The Biology of the Southern Ocean. Cambridge: Cambridge
University Press: 15.
Leventer, A. (1992). Modern distribution of diatoms in sediments from the George V
Coast, Antarctica. Marine Micropaleontology 19: 315-332.
Massom, R.A., Harris, P.T., Michael, K.J. and Potter, M.J. (1998). The distribution
and formative processes of latent-heat polynyas in East Antarctica. Annals of
Glaciology 27: 420-426.
Mawson, D. (1997). The Home of the Blizzard. Kent Town, S.A.: Wakefield Press.
McMinn, A. (2000). Late Holocene increase in sea ice extent in fjords of the Vestfold
Hills, eastern Antarctica. Antarctic Science 12 (1): 80-88.
Parish, T.R and Bromwich, D.H. (1987). The surface windfield over the Antarctic ice
sheets. Nature Vol. 328: 51-54.
Press, F. and Seiver, R. (1986). Earth. New York: W.H. Freeman and Co.: 291.
Rintoul, S.R. (1998). On the Origin and Influence of Adélie Land Bottom Water. In:
Jacobs, S.S. and Weiss, R.F. (editors). Ocean, Ice and Atmosphere:
Interactions at the Antarctic Continental Margin. Antarctic Research Series
Volume 75. Washington DC: American Geophysical Union: 151-171.
Roberts, D. and McMinn, A. (1999). A diatom-based palaeosalinity history of Ace
Lake, Vestfold Hills, Antarctica. The Holocene Vol. 9: 401-408.
120

Roberts, D., McMinn, A. and Zwartz, D. (2000). An initial palaeosalinity history of
Jaw Lake, Bunger Hills based on a diatom-salinity transfer function applied to
sediment cores. Antarctic Science 12(2): 172-176.
Verkulich, S.R and Hiller, A. (1994). Holocene deglaciation of the Bunger Hills
revealed by 14C measurements on stomach oil deposits in snow petrel
colonies. Antarctic Science 6(3): 395-399.
Walton, D.W.H. (1987). Antarctic Science. London: Cambridge University Press.
Whitworth III, T., Orsi, A.H., Kim, S.J., Nowlin Jr., W.D. and Locarnini, R.A.
(1998). Water Masses and Mixing Near the Antarctic Slope Front. In: Jacobs,
S.S. and Weiss, R.F. (editors). Ocean, Ice and Atmosphere: Interactions at the
Antarctic Continental Margin. Antarctic Research Series Volume 75.
Washington D.C.: American Geophysical Union: 1-27.
Williams, G.D. (2000), G.D. Williams, Antarctic.CRC, University of Tasmania
[personal communication, 1 September 2000].
Wong, A.P.S., Bindoff, N.L. and Forbes, A. (1998). Ocean-Ice Shelf Interaction and
Possible Bottom Water Formation in Prydz Bay, Antarctica. In: Jacobs, S.S.
and Weiss, R.F. (editors). Ocean, Ice and Atmosphere: Interactions at the
Antarctic Continental Margin. Antarctic Research Series Volume 75.
Washington D.C.: American Geophysical Union: 173-187.
Wright, R., Anderson, J.B. and Fisco, P.P. (1983). Distribution and Association of
Sediment Gravity Flow Deposits and Glacial/Glacial-Marine Sediments
Around the Continental Margin of Antarctica. In: Molina, B.F. (editor).
Glacial-Marine Sedimentation. New York: Plenum Press: 265-300.
121

Figure A.1 Facies legend for Mertz Drift cores. SMO = siliceous mud and diatom ooze.
f.sand massively bedded fine sand/SMO massively bedded SMO laminated SMO cross laminated SMO diamicton unknown – dark X-radiograph
burrows
122

Figure A.2 Facies interpretation log and gravel content of core 11GC02.
0cm
25
50 f.sand
Gravel Content/5 cm 0 1 2 3 4 5 6 7 8
123
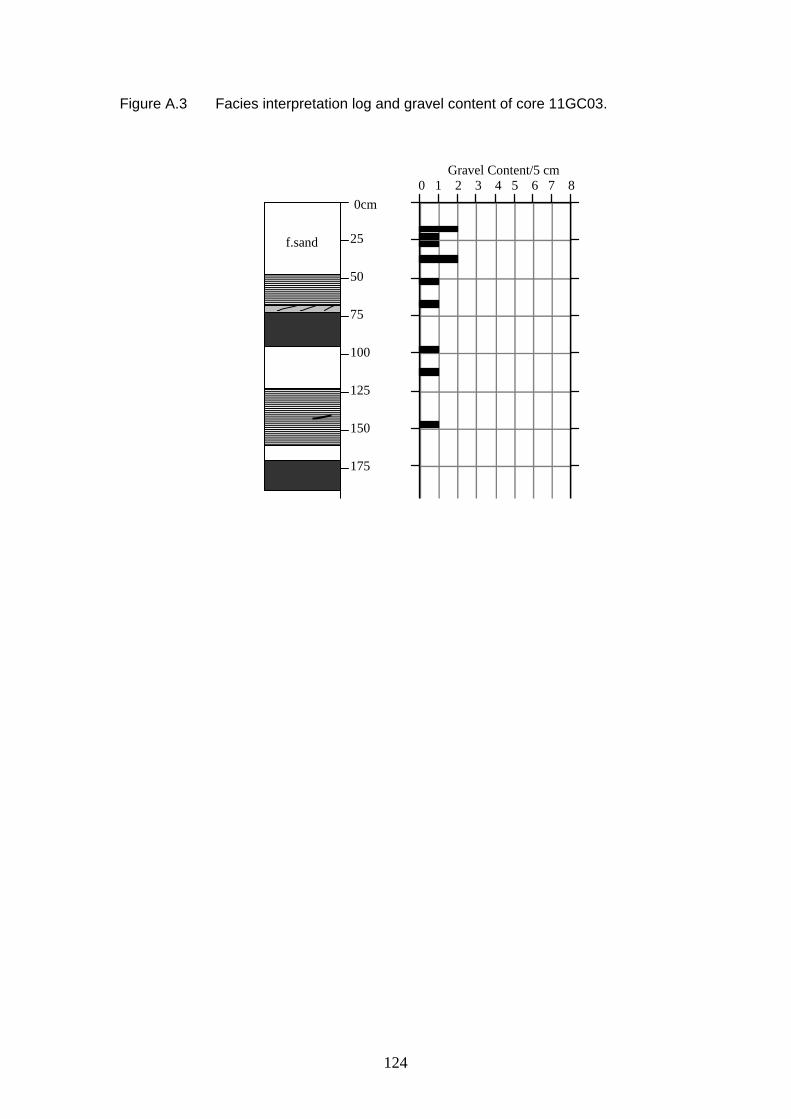
Figure A.3 Facies interpretation log and gravel content of core 11GC03.
Gravel Content/5 cm 0 1 2 3 4 5 6 7 8
0cm
25
50
75
100
125
150
175
f.sand
124
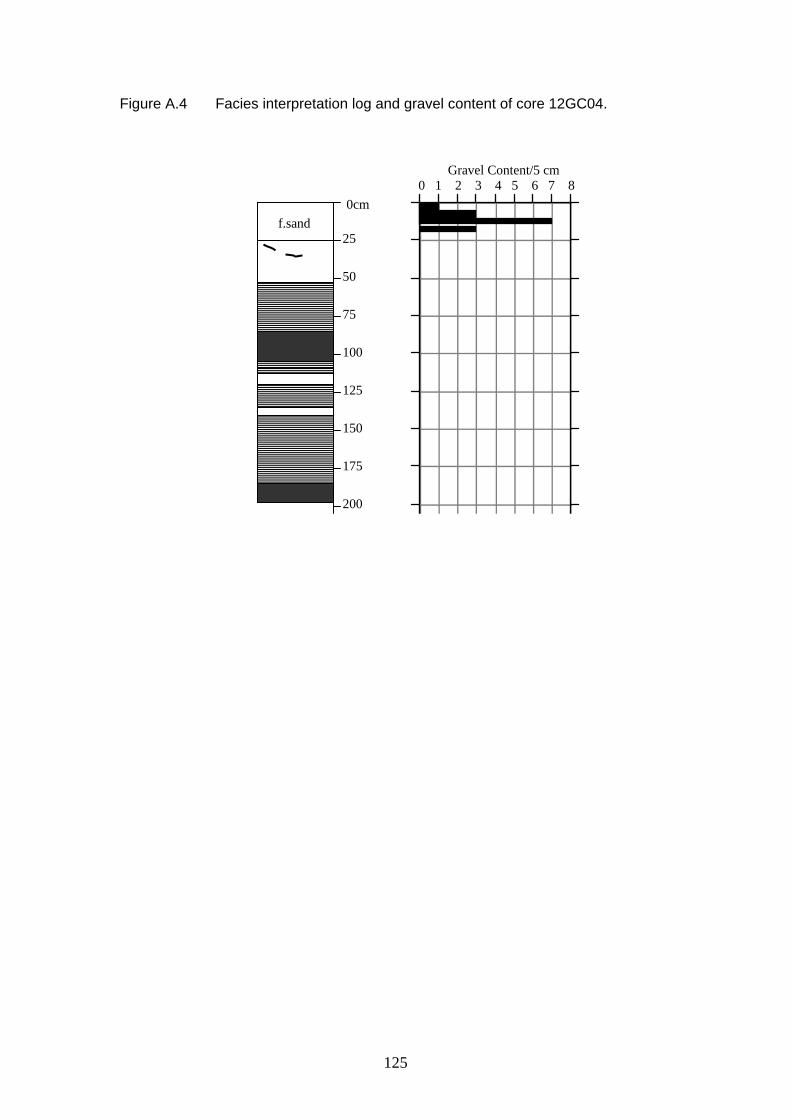
Figure A.4 Facies interpretation log and gravel content of core 12GC04.
Gravel Content/5 cm 0 1 2 3 4 5 6 7 8
0cm
25
50
75
100
125
150
175
200
f.sand
125

Figure A.5 Facies interpretation log (with uncorrected radiocarbon ages) and gravel content of core 13GC05. Gravel Content/5 cm
0 1 2 3 4 5 6 7 8 0cm
25
50
75
100
125
150
175
200
225
250
275
3155 +/- 70 yr BP f.sand 5653 +/- 60 yr BP
5881 +/- 60 yr BP
6024 +/- 55 yr BP
6542 +/- 70 yr BP
126

Figure A.6 Facies interpretation log (with uncorrected radiocarbon ages) and gravel content of core 13GC06.
Gravel Content/5 cm 0 1 2 3 4 5 6 7 8
0cm
25
50
75
100
125
150
175
200
225
250
275
300
f.sand
2736 +/- 55 yr BP
5822 +/- 65 yr BP
6078 +/- 60 yr BP
6352 +/- 55 yr BP
127

Figure A.7 Facies interpretation log (with uncorrected radiocarbon ages) and gravel content of core 14GC07. Gravel Content/5 cm
0 1 2 3 4 5 6 7 8 0cm
25
50
75
2272 +/- 55 yr B.P
7970 +/- 60 yr B.P
f.sand
f.sand
128
Figure A.8 Facies interpretation log and gravel content of core 15GC08. Gravel Content/5 cm
0 1 2 3 4 5 6 7 8 0cm
25
50
75 f.-c.sand
129

Figure A.9 Facies interpretation log (with uncorrected radiocarbon ages) and gravel content of core 15GC09. Gravel Content/5 cm
0 1 2 3 4 5 6 7 8 0cm
25
50
2690 +/- 55 yr B.P
5828 +/- 55 yr B.P
130
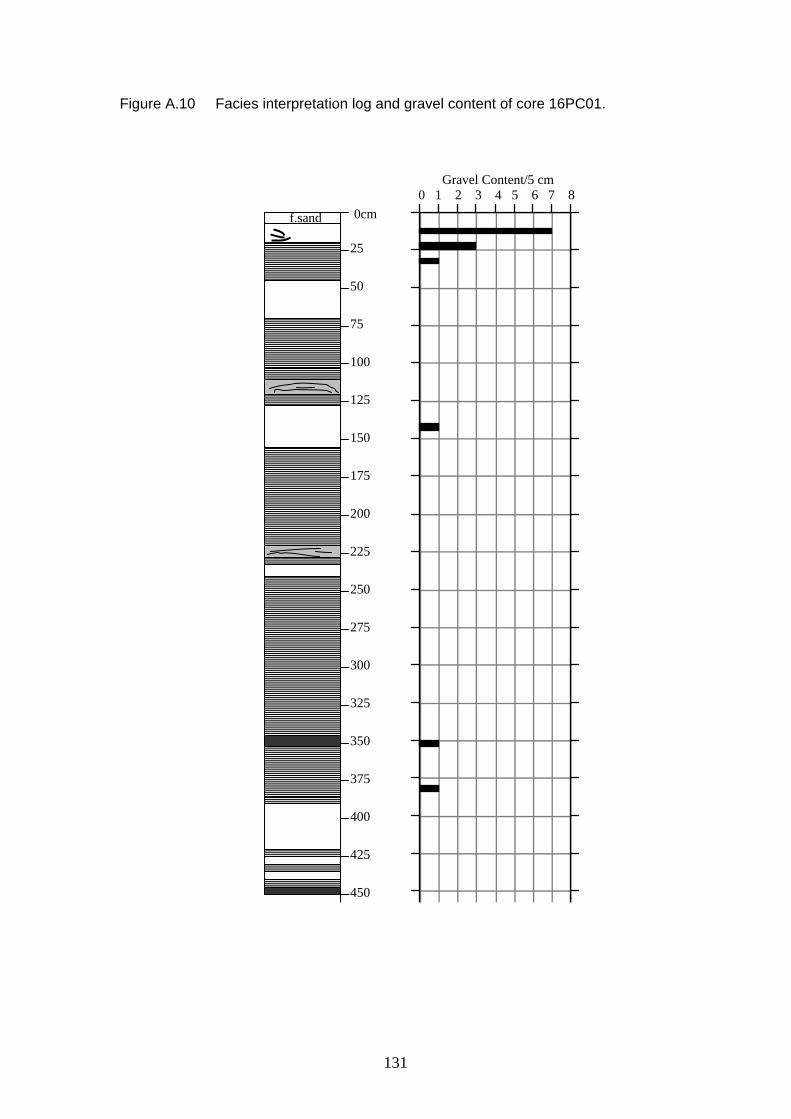
Figure A.10 Facies interpretation log and gravel content of core 16PC01. Gravel Content/5 cm
0 1 2 3 4 5 6 7 8 0cm
25
50
75
100
125
150
175
200
225
250
275
300
325
350
375
400
425
450
f.sand
131
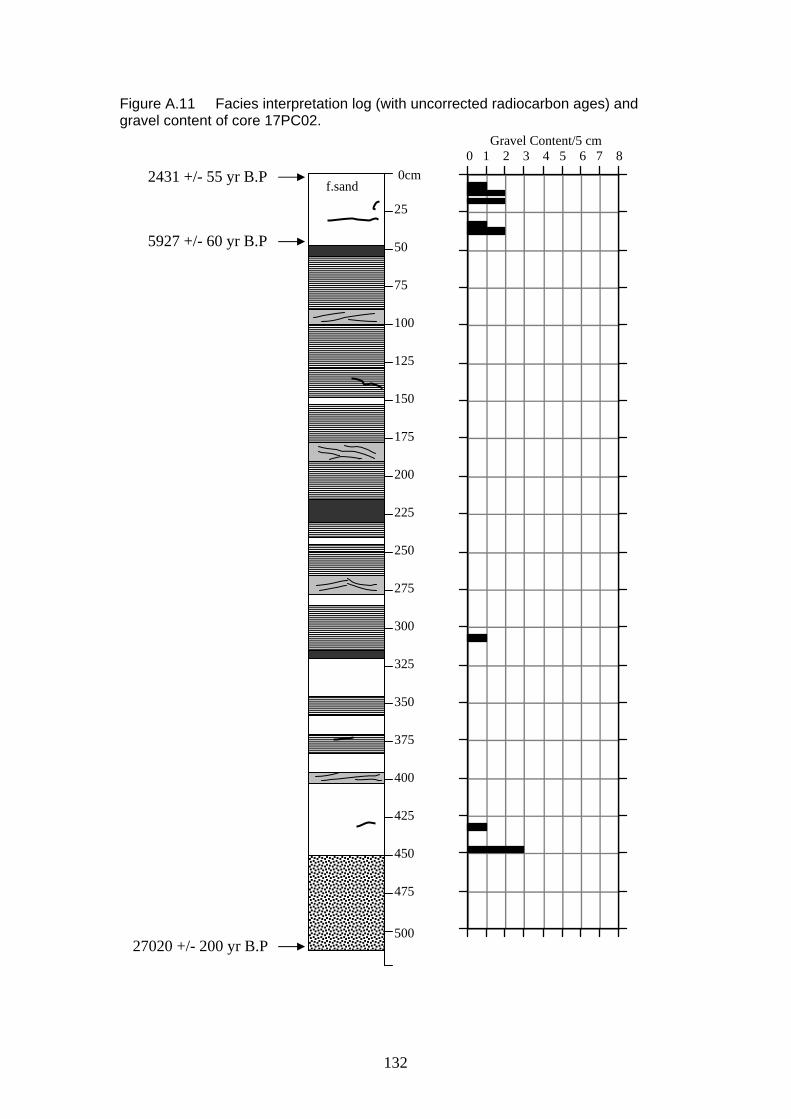
Figure A.11 Facies interpretation log (with uncorrected radiocarbon ages) and gravel content of core 17PC02. Gravel Content/5 cm
0 1 2 3 4 5 6 7 8
500
0cm
25
50
75
100
125
150
175
200
225
250
275
300
325
350
375
400
425
450
475
2431 +/- 55 yr B.P
5927 +/- 60 yr B.P
27020 +/- 200 yr B.P
f.sand
132
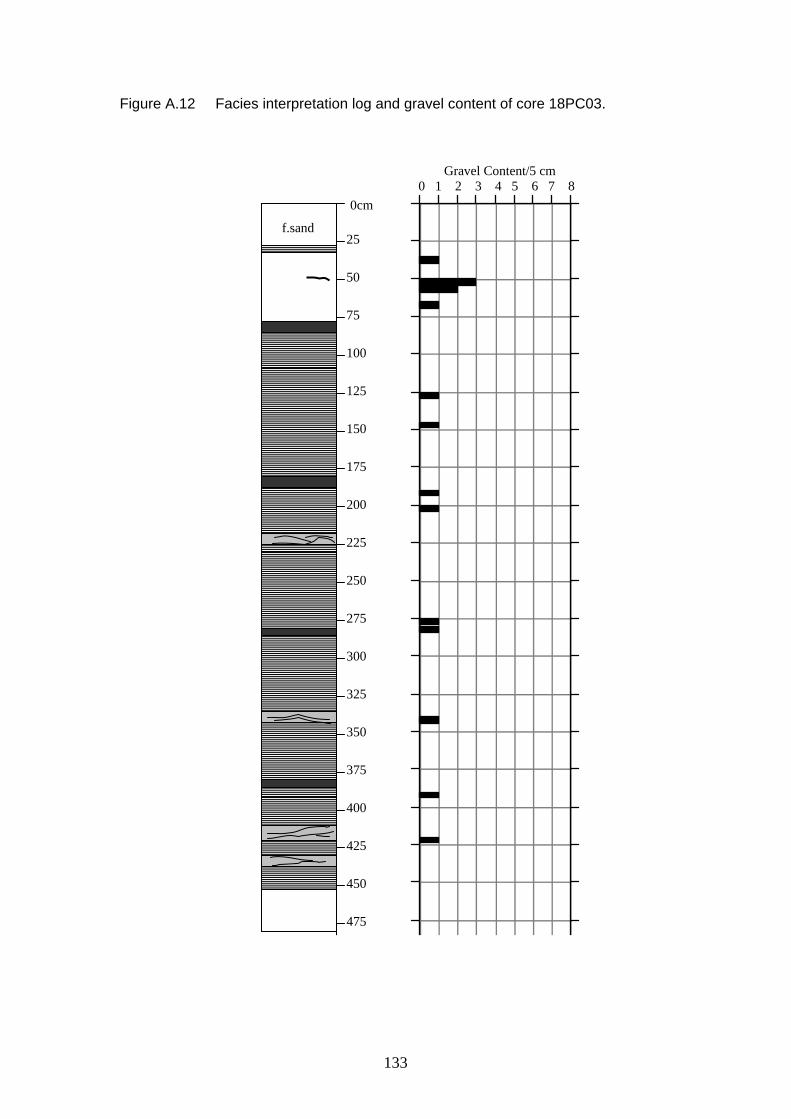
Figure A.12 Facies interpretation log and gravel content of core 18PC03.
Gravel Content/5 cm 0 1 2 3 4 5 6 7 8
0cm
25
50
75
100
125
150
175
200
225
250
275
300
325
350
375
400
425
450
475
f.sand
133

Figure A.13 Facies interpretation log and gravel content of core 19PC04.
Gravel Content/5 cm 0 1 2 3 4 5 6 7 8
0cm
25
50
75
100
125
150
175
200
225
250
275
300
325
350
375
400
425
450
f.sand
134
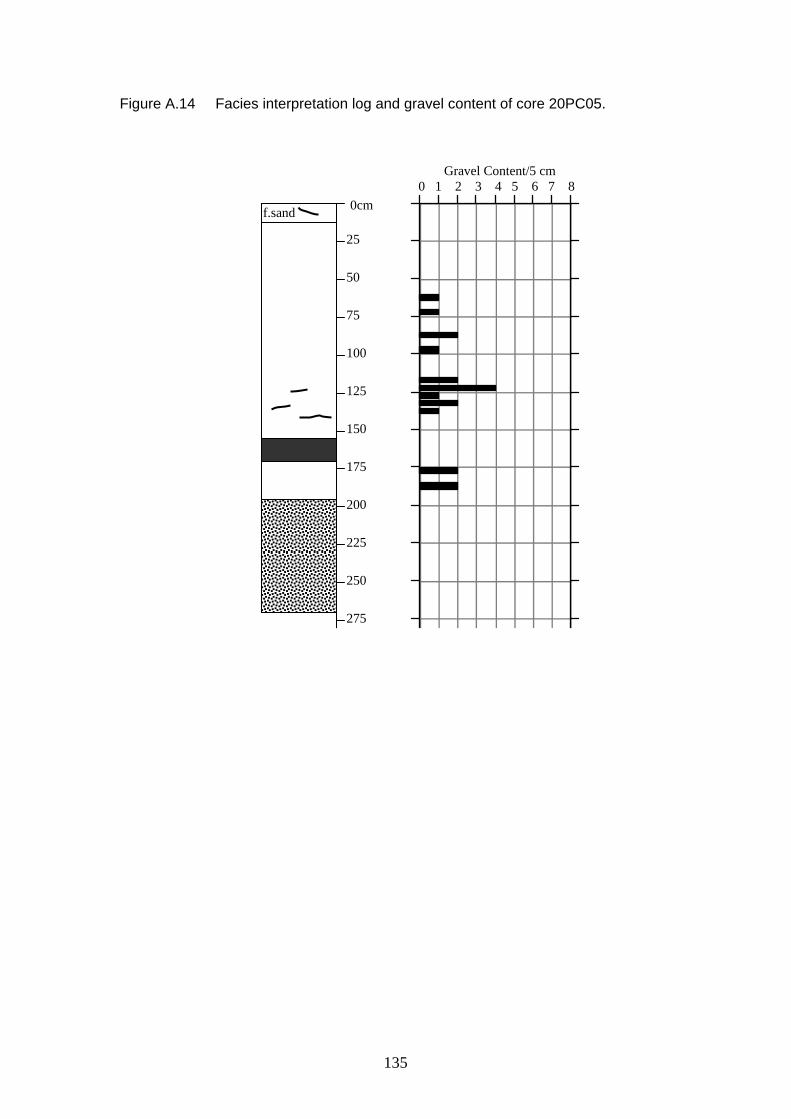
Figure A.14 Facies interpretation log and gravel content of core 20PC05.
0cm
25
50
75
100
125
150
175
200
225
250
275
f.sand
Gravel Content/5 cm 0 1 2 3 4 5 6 7 8
135

Figure A.15 Facies interpretation log and gravel content of core 23PC09.
Gravel Content/5 cm 0 1 2 3 4 5 6 7 8
500
0cm
25
50
75
100
125
150
175
200
225
250
275
300
325
350
375
400
425
450
475
f.sand
136

Figure A.16 Facies interpretation log and gravel content of core 24PC10.
0cm
25
50
75
100
125
f.sand
f.sand
Gravel Content/5 cm 0 1 2 3 4 5 6 7 8
137

Figure A.17 Facies interpretation log (with uncorrected radiocarbon ages) and gravel content of core 25PC11.
0cm
25
50
75
100
125
150
175
200
225
250
275
300
325
350
375
3120 +/- 40 yr B.P
top of core lost
7668 +/- 55 yr B.P
Gravel Content/5 cm 0 1 2 3 4 5 6 7 8
138

Figure A.18 Facies interpretation log (with uncorrected radiocarbon ages) and gravel content of core 26PC12. Gravel Content/5 cm
0 1 2 3 4 5 6 7 8
500
0cm
25
50
75
100
125
150
175
200
225
250
275
300
325
350
375
400
425
450
475
2241 +/- 55 yr B.P
5414 +/- 55 yr B.P
6115 +/- 65 yr B.P
6266 +/- 70 yr B.P
7152 +/- 60 yr B.P
15,469 +/- 70 yr B.P
f.sand
139
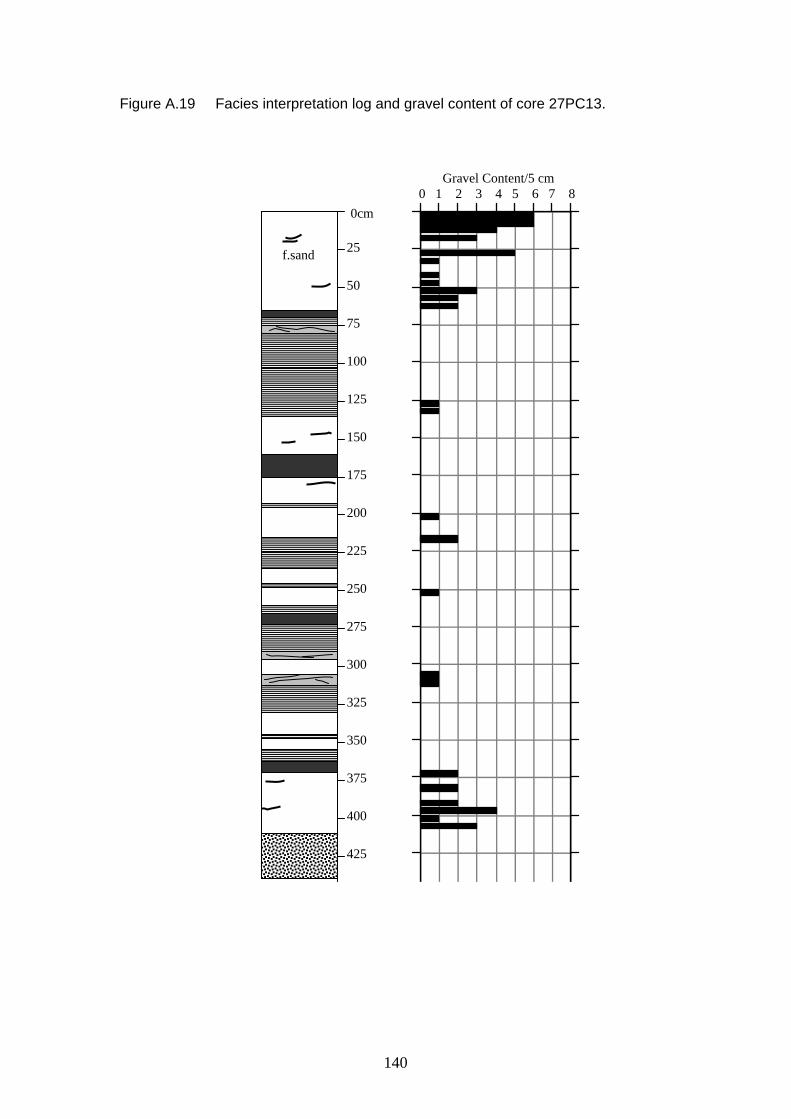
Figure A.19 Facies interpretation log and gravel content of core 27PC13.
0cm
25
50
75
100
125
150
175
200
225
250
275
300
325
350
375
400
425
f.sand
Gravel Content/5 cm 0 1 2 3 4 5 6 7 8
140