Embed Size (px)
Citation preview

RSMB Limited, Savoy Hill House 7-10 Savoy Hill London WC2R 0BU Tel: + 44 (0)20 7808 3600 Email: [email protected] Web: www.rsmb.co.uk
Registered office as above. Registered in England and Wales No. 2173860
ORIGIN VID MODEL PROOF OF CONCEPT Stage 1: Integration of TV
A report prepared for:
ISBA
August 2021

Table of Contents
Page
Contents 1. Introduction ............................................................................................................ 1
2. Executive Summary .................................................................................................. 2
3. Methodology recap .................................................................................................. 5
4. Dataset .................................................................................................................... 6
5. Design of Experiment ............................................................................................... 7
5.1 Individual rates ...........................................................................................................7
5.2 ‘Cookie’ .......................................................................................................................8
6. Results ............................................................................................................................. 10
6.1 Total Campaign Reach ............................................................................................. 10
6.2 Reach by Channel .................................................................................................... 14
6.3 Reach by Demographic ............................................................................................ 15
6.4 Reach build by Week ............................................................................................... 17
6.5 Type of Campaign .................................................................................................... 17
6.6 Overall Reach – Regression to the Mean ................................................................ 20
6.7 Unique Contribution to Reach ................................................................................. 22
7. Summary ......................................................................................................................... 25

Origin VID Model Proof of Concept: Stage 1 1
1. Introduction
Origin is a cross industry initiative led by ISBA on behalf of UK advertisers to establish a cross
media measurement service for campaign planning, reporting and evaluation, and aligned to
the WFA Framework for cross media measurement.
As part of this initiative, Origin seeks to test and validate key components proposed as part of
a technical blueprint that can provide for advertisers needs. One of these key components is
the Virtual ID Model.
RSMB had previously completed a comprehensive methodology review and concept
assessment concluding that the approach had potential merit and a recommended proof of
concept (POC) be established to test the Virtual ID Model including how measured panel data
for Linear TV advertising data could be integrated into the framework. This reflects the scope
of the BARB universe for their TV advertising currency, which is driven by the broadcast TV
commercial logs used as input to this POC. In particular it excludes non-linear BVOD and
addressable advertising. Return path data and BVOD census data are not a feature of this
currency.
RSMB were commissioned by ISBA to undertake this Proof of Concept. The proof of concept
consisted of two stages:
Stage 1 Integration of TV data
The first stage was to evaluate how data from a television panel could be
adapted into a Virtual ID model and how well this would retain results seen
in the original data. Given the hypothesis that channels could be taken as
surrogates for websites, another important corollary outcome from this work
was whether the VID model could work for online. Campaigns are restricted
to spots on broadcast TV.
Stage 2 Integration of TV data with Online
The second stage is to evaluate if the Virtual ID model could be successfully
extended across TV and Online data. The work would compare various
scenarios to understand if any could retain cross media campaign
relationships.
This interim report relates to work undertaken and completed for Stage 1 only. Campaigns
were restricted to television only.

Origin VID Model Proof of Concept: Stage 1 2
2. Executive Summary
The Proof on Concept (POC) was to test the Virtual ID component of the WFA technical
blueprint for cross media measurement. The first stage (and the basis for this interim report)
was to evaluate how well data from a TV panel can be integrated into this VID framework
preserving TV campaign results. A secondary outcome from this TV data would be an
indication whether the model would potentially work for online given the relationship
between channels across campaigns may be analogous to relationships between websites.
The TV campaign data related to linear campaigns only; return path data, addressable
advertising and BVOD are not part of the BARB commercial campaign currency and were not
part of this evaluation. The POC used data from Ipsos MORI’s Compass panel. For the first
stage only data for television linear campaigns was used. (For the second stage online
campaign viewing data would also be assessed in conjunction with the TV campaigns). Panel
data was treated as census data in the design of the experiment in order to evaluate the model
against ‘true’ census data. Campaigns were restricted to spots from 6 key channels for
simplicity.
The WFA proposed VID model allocates individuals to website impressions based on a
probabilistic rate and potentially a website cookie. For this first stage of the POC, 4 different
scenarios were evaluated based on 2 types of rates and using a ‘cookie’ (i.e. panel ID) and,
finally, not using a ‘cookie’. The two types of rates were as follows:
Abstract follows WFA framework and based on theoretical rates designed to
give closest results by training the model using campaign results.
Real calculated relative propensity to view for each individual based on
panel data.
The ‘with cookie’ scenario was utilised within a single channel only. A further option of using
across all channels was redundant for the work undertaken in Stage 1 as by definition it will
preserve television data the best but will be evaluated in Stage 2 to establish whether this
inhibits cross-media measurement.
For total campaign reach all models performed well. The model with abstract rates and ‘with
cookie’ returned results closest to the benchmark ‘census’ data. It over predicted slightly for
campaigns of low and very high weight and under predicted slightly for campaigns of medium

Origin VID Model Proof of Concept: Stage 1 3
to high weight. The model with real rates and ‘with cookie’ was the next best with the models
without ‘cookies’ showing more variability although results were acceptable.
Attribution was undertaken within gender and age demographics and this resulted in fairly
good retention of demographic profiles for campaigns from the modelled data.
Week to week build of campaigns was largely preserved and showed a similar degree of
differences for each modelling scenario as was seen across the full period of the campaign.
Campaigns were grouped according to their delivery in time segments and days to evaluate
whether the models had any deficiencies for campaigns with a particular type of laydown.
There was no significant differential performance for any particular type of campaign.
As would be expected, in general the true campaigns exhibited non-random overall reach (i.e.
reach between channels was correlated). Regression to the mean measurements were used
to evaluate if and how much the modelled results moved away from this toward random
reach. For smaller campaigns inevitably sampling error made assessment difficult but for the
larger robust campaigns regression to the mean ranged from very low to acceptable for the
four scenarios.
The abstract rates with cookies showed the best results. However, it must be noted that for
Stage 1 this was a small scale test and this technique would have benefited from this; on a
larger scale the results would be expected to weaken. Although the scale will not really be
expanded significantly, a sterner test for this model will occur for Stage 2 with the introduction
of digital campaigns and the creation of model parameters from a period independent to the
domain of evaluation.
In summary, the Proof of Concept for Stage 1 has yielded the following findings:
The allocation model is able to address marked duplications seen across television
campaigns producing acceptable results for key components (e.g. overall, reach build,
demographic profile, channel’s unique contributions). The model closest to the WFA
specification performed best but the other scenarios performed satisfactorily and will
therefore also continue to be assessed for Stage 2 as they could provide better cross
media estimates when online campaigns are introduced into the assessment.

Origin VID Model Proof of Concept: Stage 1 4
The standalone results for television only campaigns have produced encouraging signs
that the approach may preserve duplications between TV channels and websites for
joint media campaigns given similar interdependent relationships between TV
channels may also exist between TV channels and websites.

Origin VID Model Proof of Concept: Stage 1 5
3. Methodology recap
The framework set out by the WFA has a multitude of components in the cross media solution.
However, at the heart of the solution is the Virtual ID model. This is the focus of the Proof of
Concept.
The Virtual ID model is straightforward in nature. It can broadly be described as follows:
A ‘respondent’ ID listing is created equal to the Census population.
Gender and Age Group classifications are assigned to these based on universes sizes.
A homogeneous group indicator is assigned to these indicating groups of similar
behaviour for channels in the media campaign.
Relative rates of advertising exposure to each channel are assigned to these
homogeneous groups.
Given Census campaign impressions, these are assigned in a probabilistic way using
an allocation algorithm.
Cookie information collected for the Census impressions may also be used in this
allocation process.
The inputs for this process are acquired by training the model using Single Source Panel (SSP)
data.
The framework allows and invites modifications to the process for example, in terms of how
these rates and groups are created and whether cookie usage is beneficial.

Origin VID Model Proof of Concept: Stage 1 6
4. Dataset
In order to conduct this evaluation a Single Source Panel dataset is required that is able to
measure campaign data for both Television and Online. The Compass panel run by Ipsos MORI
was used for this process. The panel consists of around 3,000 respondents aged 18+. Data is
measured across TV, Radio and Online. For Stage 1, only data for the TV element was used.
The data used was for 4 w/e 31st January 2021. For this Proof of Concept, for simplicity, the
TV channels were restricted to the following channels:
ITV
Channel 4
Channel 5
ITV2
Sky 1
Dave
Data was extracted for every single campaign spot transmitted during this period for these
channels. It was accepted that some of these would constitute only partial campaigns but this
data was still useful for training the model and calculating propensity to view for panel
members. In the actual evaluation of the models only campaigns that consisted of an
appreciable proportion of the original campaign were used.
The demographics used in the test were as follows:
Men 18-34 Women 18-34
Men 35-54 Women 35-54
Men 55+ Women 55+
For simplicity, the sample was restricted to a consistent cohort of Adults who had reported
for at least 21 days out of the 28 days.
For reference, a campaign reach of 50% would have the following sampling errors:
- All Adults Sampling error = 0.8 95% Confidence Interval = (48.4,51.6)
- Demographic Sampling error = 2.2 95% Confidence Interval = (45.6,54.4)

Origin VID Model Proof of Concept: Stage 1 7
5. Design of Experiment
Stage 1 of the Proof of Concept related to the integration of television data into the VID model.
For this stage, the evaluation was mainly concerned with how the panel data could be
transformed into the Virtual ID framework, using elements of the methodology that was set
out, while still retaining the general viewing metrics of the original source. In order to evaluate
this, the panel data was treated as though it came from a census population. The allocation
process could then be applied to the impressions measured using the allocation algorithms
and compared back to this ‘Census’ benchmark.
There were two key inputs to the allocation process: the determination of individual rates and
the use of a ‘cookie’ (to help control the reach currency), which for TV panel data was the
respondent ID.
5.1 Individual rates
For this evaluation two types of rates were used: Abstract and Real rates.
Abstract rates
These followed the protocols set out in the WFA framework. Essentially these were designed
to be based (or rather trained) on the panel campaign aggregate results rather than using any
personal panel rates per se. So essentially an optimisation routine was undertaken to segment
the VID population into groups with equal rates such that the expected results from the
allocation process would be as close as possible on average to campaign data. The data was
optimised with respect to the following reach components of the campaigns:
Total campaign
Demographics (Gender by Age Group)
Weekly build
Pairwise Channels
It is accepted that this level of training was achievable for this experiment but may be more
challenging for a larger scale application.

Origin VID Model Proof of Concept: Stage 1 8
Real rates
The real rates used were much simpler. Here each respondent was effectively in their own
unique group and generated a unique rate based on their propensity to view advertising on
that media channel across the campaigns.
Note that in both cases, the VID model is guaranteed to replicate the impressions currency for
each demographic group.
5.2 ‘Cookie’
In the WFA framework for Online the cookie information was utilised and the
recommendation for the algorithm was to use this in the allocation process rather than treat
the data as individual separate impressions. For TV data there is no such thing as a ‘Cookie’
but analogously the unique panel identifier can be used, principally to retain observed
campaign frequencies by individuals. For the end-to-end project, 3 options related to cookies
are considered:
No Cookie
Here, each television impact is treated independently in the process. Clearly, under
this method by definition there is a loss in preservation of the measured television
campaign reach and frequency data with spots viewed by the same individual not
accounted for directly. However, this option is considered as the loss here may be
offset if there are gains in accuracy of modelled cross media interactions, which will
be considered in Stage 2. So, it is useful to see what is lost in the standalone TV
campaigns.
Cookies within Channels
Here, each television impact uses the respondent ID for campaign spots within the
same channel. So, for example if two spots were watched on a channel by a single
respondent, the Virtual ID respondents that were allocated the first spot would also
have the second. This method aligns more closely with what happens on website data
for the allocation model if a cookie is used as it can only be done so within the website.

Origin VID Model Proof of Concept: Stage 1 9
Cookies across Channels
The final option is where each television impact uses the respondent ID across all
campaign spots. This option by definition preserves the campaign data seen for the
panel so is redundant for Stage 1 as it will match exactly. However, it will be an
important option in Stage 2 where it will need to be evaluated whether this option,
although perfect for standalone television data, inhibits the accuracy of the cross
media measurement.
So, for Stage 1 the following 4 scenarios are considered:
Pros Cons
Scenario 1: Follows WFA Framework Dependent on availability of cookies.
Abstract/Cookies
Rates based on training – limit to how much can be controlled.
Scenario 2: Abstract/No Cookies
Not dependent on availability of cookies.
Rates based on training – limit to how much can be controlled. Loses the benefit of cookie information.
Scenario 3: Real/Cookies
Uses observed data.
Dependent on availability of cookies Range and mixture of rates limited by panel sample size.
Scenario 4: Not dependent on availability of cookies
Loses the benefit of cookie information
Real/No Cookies Uses observed data
Work was undertaken to produce the two types of rates. Allocation algorithms as specified in
the WFA framework were then applied using the appropriate inputs and protocols for the four
scenarios.

Origin VID Model Proof of Concept: Stage 1 10
6. Results
Although all commercial spots across the channels were used in the determination of rates in
order to utilise the data fully, for the evaluation schedules were only used if the spots
broadcast across the selected channels and time period were a sufficient proportion of the
original schedule. This meant the campaigns were both closer to full campaigns and also
findings would not be contaminated by erratic variation from schedules with limited data. All
four scenarios were evaluated for 459 campaigns.
6.1 Total Campaign Reach
A key requirement of the model is that it produces credible estimates for the overall campaign
reach. The actual reach of each campaign compared to GRPs is shown below:
As with all statistical evaluations, the proof of concept can only assess model performance
within the bounds of the input data. There is a clear relationship between Reach and GRPs but
there is some noticeable variation in reach around the underlying curve. For example, at
around 200 GRPs the reach ranges from 40% to 57%, with an average spread of around plus
or minus 5 points. This significantly exceeds the sampling errors and confidence intervals cited
in section 3 and reassures that the dispersion within the domain of study is systematic rather
than random. Essentially the model has to work hard to reflect systematic variations in the

Origin VID Model Proof of Concept: Stage 1 11
reach to frequency relationships and the relatively low sampling error means that the test is
quite powerful. Inevitably, systematic variations within demographics are more confounded
with sampling error.
The below charts the percentage reach from the allocation against the actual reach for
Scenario 1 (Abstract/Cookie):
From the above, it can be seen that the modelled reach is close to actual reach.
The other scenarios show a similar pattern.
However, the key differences in goodness of fit are imperceptible from these types of charts.
A better chart to focus on the goodness of fit is to plot the (Model – Actual) vs the Actual
reach. This will better show any differences in the precision of modelled estimates between
the scenarios and also any biases within the scenarios.
0
10
20
30
40
50
60
70
80
0 10 20 30 40 50 60 70 80
Mo
del
%
Actual %
Campaign % Reach: Modelled vs Actual

Origin VID Model Proof of Concept: Stage 1 12
The below shows these for the 4 scenarios. Note that the y-axis is in terms of percentage
points (e.g. if modelled reach was 11% and actual reach was 10% then Model – Diff % would
be 1%):
A brief summary of the above:
Scenario 1: Abstract/Cookies Closest fit.
Scenario 2: Abstract/No Cookies More variability, slight tendency towards
underestimating the higher reach campaigns.
Scenario 3: Real/Cookies Reasonably close fit, tendency towards over
reporting.
Scenario 4: Real/No Cookies More variability, slight tendency towards
underestimating the higher reach campaigns.
-6
-4
-2
0
2
4
6
0 20 40 60 80
Mo
del
-D
iff
%
Actual %
Abstract/CookieCampaign % Reach: Modelled vs Actual
-10
-5
0
5
10
15
0 20 40 60 80M
od
el-
Dif
f %
Actual %
Abstract/No CookieCampaign % Reach: Modelled vs Actual
-4
-2
0
2
4
6
8
10
0 20 40 60 80
Mo
del
-D
iff
%
Actual %
Real/CookieCampaign % Reach: Modelled vs Actual
-5
0
5
10
15
20
0 20 40 60 80
Mo
del
-D
iff
%
Actual %
Real/No CookieCampaign % Reach: Modelled vs Actual

Origin VID Model Proof of Concept: Stage 1 13
The modelled reaches when compared to GRPs look as follows:
All methods show a similar shape to the actual reach, however the “no cookie” models seem
to show less dispersion than the actual reach curve has which could indicate that the no cookie
models aren’t able to model the variation in reach as well as the cookie models are (which is
also supported by the “no cookie” models having more variation in the Model Difference
charts).
The table below summarises the performance across all scenarios for the 459 campaigns.
Rates Cookie used Diff Abs Diff
Scenario 1: Abstract Yes -0.3 0.6
Scenario 2: Abstract No 1.0 2.1
Scenario 3: Real Yes 1.6 1.6
Scenario 4: Real No 1.4 2.0

Origin VID Model Proof of Concept: Stage 1 14
Although averages can mask what happens at an individual level, all scenarios perform well in
terms of reach. The average difference shows that Abstract/Cookie has the least bias overall,
although the chart illustrates where the biases were more marked. With the abstract model,
because the rates are determined by fitting to campaigns there is probably potential to adjust
this process to target some of these biases. The other scenarios show a similar level of
closeness of fit, although for Scenario 3 the consistent figures for difference and absolute
differences reinforce the findings seen in the charts whereby there is a consistent over
estimation. It should be noted that in our opinion the differences seen in all scenarios are
acceptably close for a modelled solution within the training campaigns examined, with the
performance of the Abstract/Cookie scenario model particularly impressive. It should be
noted however that this is a modelled solution and the goodness of fit is based on intended
use cases; specialist planned campaigns which fall outside the reach to frequency
relationships seen in the input dataset of actual executed campaigns may not produce as
accurate a reach figure since the rates will not have been trained on these types of less
common campaign (although this is an issue that can also affect panel based solutions). The
Abstract/Cookie scenario is designed to produce rates to minimise differences in reach
between the model and the panel for these campaigns at both an overall level but more
importantly for various components. In this small scale experiment a higher level could be
applied than usual, so caution is needed regarding whether it is much better than the other
scenarios. Further to this, the true test is how well it will preserve cross-media duplications in
Stage 2. Nonetheless, the rest of the following results below will largely focus on this scenario
as it is the method that most follows the WFA initiative but also because the pattern of results
for the other scenarios generally replicates the findings (albeit relative to their top line
results).
6.2 Reach by Channel
Another important characteristic to evaluate is how well the model preserves the channel
components within the campaigns themselves. This will be analogous to how well the model
will preserve data for individual websites.
Again, the overall average differences are examined to determine if there are any marked
differences between performance for channels. For the scenarios that use ‘cookies’ this
exercise is redundant because this ‘cookie’ is used within channels and it will therefore

Origin VID Model Proof of Concept: Stage 1 15
perfectly preserve reach (and frequency) at this level so differences will be zero. The table
below details the differences for the other scenarios:
Abstract without Cookie Real without Cookie
Diff Abs diff Diff Abs diff
All 1.0 2.1 1.4 2.0
ITV -0.3 2.0 0.5 1.8
Channel 4 0.1 0.9 0.5 0.9
Channel 5 0.1 1.1 1.0 1.2
ITV2 0.7 0.7 0.2 0.3
Sky 1 0.9 0.9 0.2 0.3
Dave 1.1 1.1 0.2 0.3
For abstract without cookie for ITV, Channel 4 and Channel 5 there is little bias with ITV
showing larger differences. This may relate to ITV constituting a heavier element of the
campaign so relative to reach the difference may not be so marked. It should be noted that
for ITV2, Sky 1 and Dave the average difference and the average absolute difference are the
same, which indicates that whatever bias does exist in these channels it is almost always an
overestimation in reach.
For ‘real without cookie’ the average differences across channels are small and more
consistent with little bias. For ITV, Channel 4 and Channel 5 there are larger absolute
differences but as noted before this may relate more to weight of these channels within the
campaign. For ITV2, Sky 1 and Dave differences are small both in terms of bias and fit, and it
can be noted that the real rates have a closer fit to the reach compared to the abstract rates
for these channels.
6.3 Reach by Demographic
For this proof of concept the allocation process for TV campaign data was undertaken at a
demographic level. The breakdown was as follow:
Men/Women * Age (18-34, 35-54, 55+)
Similar, to the channel data it is intuitive to examine if there are any differences in the
allocation process.
Origin VID Model Proof of Concept: Stage 1 16
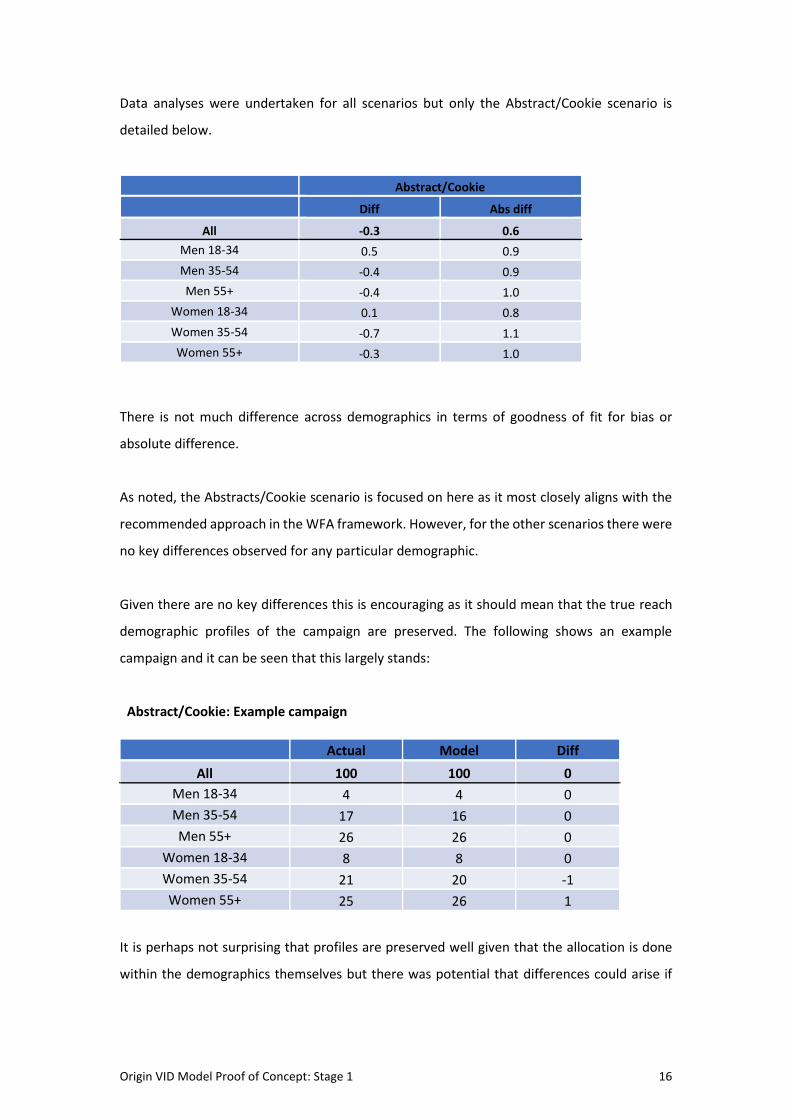
Data analyses were undertaken for all scenarios but only the Abstract/Cookie scenario is
detailed below.
Abstract/Cookie
Diff Abs diff
All -0.3 0.6
Men 18-34 0.5 0.9
Men 35-54 -0.4 0.9
Men 55+ -0.4 1.0
Women 18-34 0.1 0.8
Women 35-54 -0.7 1.1
Women 55+ -0.3 1.0
There is not much difference across demographics in terms of goodness of fit for bias or
absolute difference.
As noted, the Abstracts/Cookie scenario is focused on here as it most closely aligns with the
recommended approach in the WFA framework. However, for the other scenarios there were
no key differences observed for any particular demographic.
Given there are no key differences this is encouraging as it should mean that the true reach
demographic profiles of the campaign are preserved. The following shows an example
campaign and it can be seen that this largely stands:
Abstract/Cookie: Example campaign
Actual Model Diff
All 100 100 0
Men 18-34 4 4 0
Men 35-54 17 16 0
Men 55+ 26 26 0
Women 18-34 8 8 0
Women 35-54 21 20 -1
Women 55+ 25 26 1
It is perhaps not surprising that profiles are preserved well given that the allocation is done
within the demographics themselves but there was potential that differences could arise if

Origin VID Model Proof of Concept: Stage 1 17
there was differences in the preservation of duplications across channel for any particular
demographic which could have skewed the profile.
6.4 Reach build by Week
A key component in the Advertiser ‘North Star’ requirements was that the modelling solution
should be dissectible and results consistent as the campaigns build. As part of the evaluation
therefore the 4 week campaigns were evaluated by examining the weekly build for the
allocation model and comparing to the real results. In general, the results were encouraging
with weekly builds aligning. The below shows examples for 3 campaigns of different weight
for the Abstract/Cookie model.
These were typical of the comparisons seen with the level and direction of differences for
each scenario mirroring that seen overall.
6.5 Type of Campaign
Another challenge for the allocation model is for campaigns with a particular laydown. An
example of this is if the model could cope with a campaign schedule that was heavily delivered
in weekday afternoon when availability to view may be different (e.g. for full time workers).
All four scenarios had no direct component in the calculation of rates to directly address this
(although the cookie models preserved spots viewed within channels so arguably addressed
some correlation in personal viewing of spots).
2 2 6 6
30 32
5 5
20 19
47 48
8 8
31 30
55 54
12 12
31 30
60 59
ACTUAL MODEL ACTUAL MODEL ACTUAL MODEL
Week 1 Week 2 Week 3 Week 4
CAMPAIGN 1
CAMPAIGN 3

Origin VID Model Proof of Concept: Stage 1 18
RSMB undertook a cluster analysis for the 459 television campaigns using time segments and
days that spots were broadcast in order to separate them out into different types of
campaigns. Three types of campaigns were identified:
Peaktime upweight
Weekend upweight
Weekday Daytime upweight
We can note from the reach curves that each cluster has a clear relationship with GRPs (with
less dispersion than when looking at all campaigns), although as the relationship is broadly
similar in each cluster the model would not have needed to stretch too much to meet the
needs of each type:

Origin VID Model Proof of Concept: Stage 1 19
The table below shows the performance of the allocation model across these campaigns for
the Abstract/Cookie model.

Origin VID Model Proof of Concept: Stage 1 20
Scenario 1: Abstract/Cookie
Type Campaigns Diff Abs diff
All 459 -0.3 0.6
Peaktime 109 0.2 0.4
Weekend 99 -0.2 0.5
Weekday Daytime 251 -0.6 0.8
The Weekday/Daytime schedules were slightly worse in terms of bias and size of differences.
Although these clusters identified types of campaign where it was suspected that the model
may struggle, differences were minimal and the model coped well with the three types of
campaign. It should be noted though that the relationship between reach and GRPs was
similar with all three campaign types, if more specialised campaigns exist in the real world
(that have a different relationship to that observed in the data) then the performance may
differ from the domain of study.
6.6 Overall Reach – Regression to the Mean
The danger with many modelled solutions is that although the top-line results are strong, the
solution fails to pick up marked discrimination and tends towards a random solution. In the
context of this experiment the test here is whether the modelled solution picks up and retains
the non-random element of viewership across channel spots. It is best illustrated by a real
example:
Scenario 3: Abstract/Cookie
Random reach = 55% Actual total panel reach = 47% Model reach = 50% RTM = (47-50)/(47-55) = 38%
So, in the above case the random reach would be 55%. This is calculated by assuming each
measured separate channel campaign reach was independent. The real reach is 47%. This is
therefore 8 percentage points from random. The model reach is 50%. This has ‘moved’ 3
points (out of 8 points) from the actual towards random so a regression to the mean of 38%.
The complement of this – and perhaps more positive – is that 62% of the discrimination is
retained.

Origin VID Model Proof of Concept: Stage 1 21
This calculation was undertaken for all 459 campaigns for each scenario. The following charts
compare the regression to the mean against the size of campaign (using reach as the metric):
It must be acknowledged that at low reach levels, small absolute levels of regression-to-the-
mean are large in percentage terms. Differences between actual and random are more likely
to be within the bounds of sampling error, therefore it might be expected that RTM is
overstated. Plotting RTM against Actual Reach allows the larger/more robust reach data
points to be differentiated.
A brief summary of the above:
Scenario 1: Abstract/Cookies – High regression to the mean for smaller campaigns.
For larger campaigns regression to the mean is smaller and actually tends slightly
towards negative regression to the mean. This would mean reach is slightly
underestimated.
-100
-50
0
50
100
0 20 40 60 80
RTM
Actual Reach %
Abstract/Cookies
-100
-50
0
50
100
0 20 40 60 80
RTM
Actual Reach %
Abstract /No cookie
-100
-50
0
50
100
0 20 40 60 80
RTM
Actual Reach %
Real/Cookies
-100
-50
0
50
100
0 20 40 60 80
RTM
Actual Reach %
Real/No cookie

Origin VID Model Proof of Concept: Stage 1 22
Scenario 2: Abstract/No Cookies – More variability in regression to the mean but
broadly averages around zero regression to the mean.
Scenario 3: Real/Cookies – High regression to the mean for smaller campaigns.
Regression to the mean tends towards 40% meaning this model retains 60% of
discrimination on average.
Scenario 4: Real/No Cookies – This largely mirrors the regression to the mean seen in
Scenario 1 albeit with less tendency towards regression to the mean.
The results across scenarios are quite different. The abstract/cookie and real/no cookie
perform best in terms of limiting regression to the mean but even the worst scenario produces
regression to the mean statistics that are in our opinion acceptable for a modelled solution.
The results indicate two important findings ahead of Stage 2:
1. The allocation model is able to preserve marked duplications seen across broadcast
television campaigns.
2. Encouraging signs it may also then preserve duplications between TV channels and
websites for joint media campaigns.
Although the Abstract Cookie scenario performed best, for Stage 2 all the scenarios will be
carried forward and evaluated as results may have been enhanced for the Abstract Cookie
scenario due to the level of control that could be applied and also because the other scenarios
may produce better cross media results.
6.7 Unique Contribution to Reach
In addition to preserving the reach of stations it is important that the unique contributions
each station makes to the overall reach of a campaign is preserved. A station’s unique
contribution to reach is the reach of the overall campaign that would be lost if that the spots
on that station were removed. The average unique reach (as a % of census population) each
station contributes for each of the 4 methods is as follows:

Origin VID Model Proof of Concept: Stage 1 23
Unique contribution to reach – Absolute percentage points
Actual Abstract/
Cookies
Abstract/No
Cookies
Real/Cookies Real/No
Cookies
ITV 15.0 14.6 15.2 16.2 15.0
Channel 4 5.4 5.1 5.8 6.3 5.6
Channel 5 3.7 3.5 3.7 4.3 4.2
ITV2 1.5 1.4 1.3 1.6 1.6
Sky 1 0.7 0.8 1.0 0.8 0.8
Dave 1.5 1.6 1.8 1.6 1.6
All models on average seem to preserve the unique contribution to reach well albeit the
Real/Cookies scenario consistently overestimates and to a higher degree.
However, an examination of all individual campaigns shows that the cookie based models do
a better job of preserving unique contribution to reach as they show the least variance
between actual and modelled unique contribution to reach, with abstract/cookie performing
the best (only ITV is shown but results are similar for the other stations):
-20
-10
0
10
20
0 10 20 30 40 50 60 70 80 90 100
Mo
del
-P
anel
Dif
fere
nce
Actual Unique Contribution %
ITV Model Difference From Actual - Abstract/Cookie
-20
-10
0
10
20
0 10 20 30 40 50 60 70 80 90 100
Mo
del
-P
anel
Dif
fere
nce
Actual Unique Contribution %
ITV Model Difference From Actual - Real/Cookie

Origin VID Model Proof of Concept: Stage 1 24
-20
-10
0
10
20
0 10 20 30 40 50 60 70 80 90 100
Mo
del
-P
anel
Dif
fere
nce
Actual Unique Contribution %
ITV Model Difference From Actual - Abstract No Cookie
-20
-10
0
10
20
0 10 20 30 40 50 60 70 80 90 100
Mo
del
-P
anel
Dif
fere
nce
Actual Unique Contribution %
ITV Model Difference From Actual - Real No Cookie

Origin VID Model Proof of Concept: Stage 1 25
7. Summary
Using the Compass panel (run by Ipsos MORI) Phase 1 of Origin was evaluated by treating the
panel as a census and applying the methodology to a set of real TV campaigns known to have
been broadcast in the period of the dataset. Four scenarios were assessed (Abstract rates to
assign cookies; abstract rates to assign impressions; panel based rates to assign cookies; and
panel based rates to assign impressions) and their performance evaluated. Performance was
assessed at a top line level for reach as well as by demographic, station, type and week by
week.
Results were encouraging in all methods, broadly conserving systematic variations in TV
campaign reach across channels within the VID model. The preservation of reach suggests
potential for the model to work well across TV and website campaigns, as well as website
campaigns themselves, although nothing conclusive can be said until these types of campaigns
are directly tested. Results indicated that abstract rates with cookies saw the smallest
discrepancies between actual and modelled reach. However, it should be caveated that, for
clarity in the POC, the evaluation has been limited to 6 larger channels and that abstract rates
may be harder to devise in the presence of a long tail of channels. It may also be the case that
to optimise the VID model for cross-media estimation, it is necessary to break down the cookie
beyond separation of channels. In our opinion, the “no cookie” scenario results suggest that
there is indeed some leeway without significantly distorting the TAM panel reach and
frequency relationships within the linear advertising measurement. Therefore all 4 methods
will continue to be assessed in Phase 2.
In addition, Phase 2 will evaluate the scenario in which the TAM panel ID creates a “cookie”
which transcends campaign viewing across all channels in a campaign. By definition, this will
preserve the TAM panel reach and frequency currency in the VID model. The trade-off will be
the degree to which this might distort the cross-media duplications.
The technique used for evaluation is based upon goodness-of-fit, in the sense that one set of
training campaigns are used to both fit and then evaluate the performance of the VID model.
A second set of broadcast TV campaigns, in a different time period, will be available for phase
2 of the POC. It will be prudent to evaluate the set 1 trained model in terms of the set 2
campaign outcomes.