Embed Size (px)
Citation preview
137REV BRAS EPIDEMIOL JAN-MAR 2015; 18(1): 137-48
ABSTRACT: Objective: To assess the validity of using self-reported anthropometric data for diagnosis of nutritional status of adults in a rural population of northeast Brazil. Methods: A population-based survey was conducted on a sample of 797 individuals aged 18 years or more. The proportion of individuals who knew their anthropometric measures was calculated. For agreement analysis between those who reported their measures the following indicators were obtained: differences between averages (weight, height, body mass index), intra-class correlation coefficient (ICC), Kappa statistic, sensitivity, specificity, positive predictive value (PPV) and negative predictive value (VPN). Bland-Altman graphics were also obtained. Results: More than half of the respondents (58.5%) did not know their weight or height. Weight was the most known measure among all. The magnitude of the mean difference for weight, height and body mass index (BMI) (0.43 kg, 0.31 cm, 0.32 kg/m2, respectively) was small, indicating good agreement, with a trend toward overestimation. ICC for weight, height and BMI were 0.96; 0.60; and 0.53, respectively. Kappa statistic indicated good agreement in all strata. General measures of sensitivity, specificity, PPV and NPV were 84.2; 82; 90.7 and 71.3%, respectively. Elderly, those with low schooling and those who do not often weigh were less accurate on their measures. Conclusion: The use of self-reported measures should be done with caution in epidemiological studies in rural populations.
Keywords: Body mass index. Nutritional status. Anthropometry. Self report. Validation studies. Rural population.
Use of self-reported measures of height, weight and body mass index in a rural population of Northeast BrazilUso de medidas autorreferidas de peso, altura e índice de massa corporal em uma população rural do nordeste brasileiro
Poliana Cardoso MartinsI, Maria Bernadete de CarvalhoII, Carla Jorge MachadoII
ORIGINAL ARTICLE / ARTIGO ORIGINAL
IInstituto Multidisciplinar em Saúde, Universidade Federal da Bahia – Vitória da Conquista (BA), Brazil.IIDepartment of Preventive and Sociel Medicine, Universidade Federal de Minas Gerais – Belo Horizonte (MG), Brazil.Corresponding author: Rua Rio de Contas, 58, Quadra 17, Lote 58, Candeias, CEP: 45029-094, Vitória da Conquista, BA, Brasil. E-mail: [email protected] of interests: nothing to declare – Financing source: Coordination for the Improvement of Higher Education Personnel (CAPES), edital 05/2009; Ministry of Health (MS), National Council for Scientific and Technological Development (CNPq), Bahia Research Foundation (FAPESB), Secretariat of Health” of Bahia (SESAB), edital 20/2010; Study for SUS: Shared Health Management (PPSUS-BA) Document n. SUS0017/2010.
DOI: 10.1590/1980-5497201500010011
MARTINS, P.C., CARVALHO, M.B., MACHADO, C.J.
138REV BRAS EPIDEMIOL JAN-MAR 2015; 18(1): 137-48
INTRODUCTION
Nowadays, obesity and excessive weight are considered to be priority issues in the global agenda of public health. In Brazil, it is possible to observe increasing prevalence of obesity in all of the regions, socioeconomic strata and age groups. Recent national estimates show significant increment in the percentage of obesity in the rural Brazilian region1, which shows the importance of following-up overweight and obesity indicators in rural populations.
The World Health Organization (WHO) recommends the use of body mass index (BMI) to analyze the nutritional status and to control excessive weight in population groups2. BMI is mostly assessed by direct weight and height measurements, performed by trained individuals, with proper equipment. However, these measurements can present some operational limitations to the point of preventing the direct collection of anthropometric data. Some of these limitations are: longer duration of field work, difficulties to transport the equipment, difficulties to find an adequate place to take measurements, the execution of training and the standardization of anthropometrists3.
RESUMO: Objetivo: Avaliar a validade do uso de dados antropométricos autorreferidos para o diagnóstico do estado nutricional em adultos de uma população rural do nordeste brasileiro. Métodos: Foi realizado um inquérito de base populacional em uma amostra de 797 indivíduos com 18 anos de idade ou mais. Obteve-se a proporção de indivíduos que conheciam as medidas antropométricas. Para as análises da concordância entre os que informaram as medidas foram calculadas: diferenças entre médias, coeficiente de correlação intraclasse (CCI), estatística Kappa, sensibilidade, especificidade, valor preditivo positivo (VPP) e valor preditivo negativo (VPN). Obteve-se também os gráficos de Bland e Altman. Resultados: Não sabiam relatar informações sobre peso e estatura 58,5% dos entrevistados. O peso foi a medida mais conhecida em comparação às demais. A magnitude da diferença entre as médias foi pequena para peso, altura e índice de massa corporal (IMC) (0,43 kg, 0,31cm, 0,32 kg/m2, respectivamente), evidenciado uma boa concordância intrapares e uma tendência de superestimação das medidas. Os CCI para peso, altura e IMC foram, respectivamente, 0,96; 0,60 e 0,53. A estatística Kappa indicou bom acordo para os estratos avaliados. As medidas gerais de sensibilidade, especificidade, VPP e VPN foram 84,2; 82; 90,7; e 71,3%, respectivamente. Apresentaram menor acurácia nas medidas os idosos, pessoas com escolaridade inferior a quatro anos e que não se pesam frequentemente. Conclusão: Recomenda-se o uso com cautela de medidas autorreferidas em estudos epidemiológicos em populações rurais.
Palavras-chaves: Índice de massa corporal. Estado nutricional. Antropometria. Autorrelato. Estudos de validação. População rural.
USE OF SELF-REPORTED MEASURES OF HEIGHT, WEIGHT AND BODY MASS INDEX IN A RURAL POPULATION OF NORTHEAST BRAZIL.
139REV BRAS EPIDEMIOL JAN-MAR 2015; 18(1): 137-48
An alternative that has been used to gather anthropometric information in population studies is to use self-reported weight and height values. This strategy allows the conduction of epidemiological studies in large groups, thus promoting the use of fewer resources and the simplification of field work4.
Studies show that self-reported weight and height values present high correlation and intrapair agreement4-7. Despite this correlation, it is recommended that this method be used carefully, because variables such as sex, age and socioeconomic classification can lead to bias at the time of taking measurements4.
With regard to sex, it is possible to observe that weight tends to be more underestimated by women5-9, and height, by men9-11. It is known that the use of self-reported measurements for adults and teenagers is valid, however, it should not be used for elderly people, since this group tends to overestimate height more expressively7. Other sociocultural and health variables that can affect the quality of self-reported measurements are family income12, schooling13 and anthropometric characteristics14. The incorrect information of weight and height leads to the wrong estimation of BMI, which has a direct influence on the prevalence of overweight and obesity.
Up until now, no national or international studies were found in literature that analyzed the use and the validation of self-reported BMI in the adult rural population. Therefore, this study intends to assess the validity of using anthropometric data of self-reported weight and height to diagnose the nutritional status of adults by BMI in a rural population in the Brazilian northeast region.
METHODOLOGY
This is an analysis and validation study originated from a subsample of a cross-sectional study called “Projeto COMQUISTA: Comunidades Quilombolas de Vitória da Conquista, Avaliação dos Condicionantes de Saúde”. It was conducted from Septembe to October, 2011, with adults (18 years old or more), living in rural quilombola communities, certified by Fundação Palmares (year of reference, 2010).
The considered sampling universe is the eligible population of adults, estimated in 2,935 individuals. Sampling calculation considered the following parameters: (a) at first, prevalence of 50%, given the heterogeneity of measured events; (b) 5% accuracy; (c) 95% confidence level; (d) design effect of 2; (3) 30% of loss, accounting for 884 adult individuals. Other information about the study is available in a different publication15.
In total, 797 adults were interviewed. Among them, 744 would be eligible for the study, once 11 pregnant women, 36 individuals whose questionnaires were answered by a secondary informer, and 6 individuals who did not have any information on weight and/or height were excluded.
For the collection of information about anthropometric measurements, the following questions were asked: “Do you know how much you weigh?” and “Do you know your height? (even
MARTINS, P.C., CARVALHO, M.B., MACHADO, C.J.
140REV BRAS EPIDEMIOL JAN-MAR 2015; 18(1): 137-48
if approximately)”. Measurements were confirmed after the application of interviews. All of the interviewers were trained to take measurements, based on the manual of anthropometric measurements elaborated for this study, which adopted the procedures established by SISVAN, from the Ministry of Health16. In order to measure weight, a digital scale by Marte LC200pp, with 200 kg capacity and 50 g, was used . A portable stadiometer by CauMaq, model EST-22, was used for height, with 300 to 2,000 mm capacity. It was used to measure people’s height in erect posture. BMI was calculated with the use of measured and self-reported measurements. For agreement analyses between measurements, the category excessive weight, according to the criteria by the WHO, was created to classify overweight and obesity (BMI ≥ 25 kg/m2)1.
The variables used for stratification were: sex; age (young adults aged 18 to 29 years old; adults aged 30 to 59 years old; and elders aged 60 years old or more); schooling, classified in less than 4 schooling years or 4 schooling years or more; income, categorized according to the definition of the governmental program Bolsa Família, used to classify families in poverty with monthly per capita family income of up to R$ 140 (one hundred and forty reais)17; time since last weight measurement, classified in less than 6 months or 6 months or more.
Facing the considerable loss of information in self-reported measurements, a comparison was made between individuals with and without such information and the distribution of socioeconomic and behavioral variables, and the χ2 test was conducted, with 5% significance level.
The difference between weight, height and BMI was calculated by subtracting self-reported values from measured values. Positive results represented the overestimation of measurements, and negative results, their underestimation. To assess intrapair agreement, intraclass correlation coefficients (ICC) were used, based on the classification by Landis and Koch18: almost perfect (0.81 to 1.00); substantial (0.61 to 0.80); moderate (0.41 to 0.60); regular (0.21 to 0.40); discrete (0 to 0.20); no agreement (-1.00 to 0). Bland and Altman’s analyses (relationship between the difference of measurements taken in two different moments and the mean of both measurements) enabled to emphasize the variability of differences between values19.
Kappa statistics was used to assess the intra-category agreement of nutritional status. In order to evaluate this statistics, the criterion by Landis and Koch18 was also adopted, by considering the following agreement levels: none (lower than zero); discrete (from 0 to 0.20); moderate, regular (from 0.21 to 0.40); moderate (from 0.41 to 0.60); substantial (from 0.61 to 0.80); almost perfect (from 0.81 to 1.00).
Validity was analyzed based on sensitivity and specificity values, as well as positive predictive value (PPV) and negative predictive value (NPV), and the parameter was based on taken measurements, so it would be possible to achieve the proper BMI. The statistical software SPSS, version 19.0, was used for statistical analyses. A 5% significance level was adopted. The project was approved by the Research Ethics Committee of Faculdade São Francisco de Barreiras (CAAE 0118.0.066.000-10) and Universidade Federal de Minas Gerais
USE OF SELF-REPORTED MEASURES OF HEIGHT, WEIGHT AND BODY MASS INDEX IN A RURAL POPULATION OF NORTHEAST BRAZIL.
141REV BRAS EPIDEMIOL JAN-MAR 2015; 18(1): 137-48
(CAAE 0118.0.066.203-10). All of the participants signed the informed consent form and agreed to participate by being interviewed and measured (weight and height).
RESULTS
There was expressive absence of information concerning self-reported weight and height. Out of the 744 individuals, only 209 (41.5%) presented self-reported weight and height measurements. From the 435 (58.5%) left, 6.7% (n = 29) did not know their weight; 67.1% (n = 292) did not mention their height; and 26.2% (n = 114) did not inform either measurement. Besides, 4.5% (n = 34) of the interviewees reported never having been weighed, and 37.0% (n = 275) had been weighed 6 months ago or more.
The unawareness of anthropometric measurements was statistically significant (p > 0.05), especially among women (77.4%) in comparison to men (36.5%); among the elderly (68.1%), in comparison to approximately 55.0% of people in other age groups; among those with lower schooling (64.6%) in comparison to those with higher schooling (42.8%); among individuals with per capita income lower than R$ 140 (59.1%), compared to 47.2% of those with higher income; among those who had been weighed six months ago or the ones who have never been weighed (66.0%), in comparison to the people who had been recently weighed (53.1%); and among the extremes regarding nutritional status (67.7%) for low weight and 73.0% for obesity), when compared to the other categories (about 55.0%).
Considering these exclusions, the subsample used for the agreement analysis was comprised of 309 individuals. There was a difference in distribution between genders, with higher percentage for men in this group (70.8%). With regard to the other variables, it is possible to observe that 16.5% of them were 60 years old or more, and 56.6% were aged between 30 to 59 years old; 61.3% studied for 4 years or less; 63.4% had per capita income lower than or equal to R$ 140, and 34.0% mentioned their weight was measured more than 6 months ago. Nutritional status, according to measured BMI, presented the following distribution: 2.6%, low weight; 60.2%, eutrophy; 30.7%, overweight; and 6.5%, obesity.
The magnitude of the difference between the mean between self-reported and measured measurements was little (0.4 kg, 0.3 cm, 0.3 kg/m2 for weight, height and BMI, respectively), showing good intrapair agreement. In most strata, there is a trend toward overestimation of self-reported weight, height and BMI.
Even though women are more unaware of their weight, the ones who informed it did so more correctly. Women underestimated their weight in average in 0.8 kg (-11.4 to 8.5 kg), and men presented a trend toward overestimation of an average of 0.9 kg, presenting large amplitude (-12.5 to 24.0 kg). As to height, men and women overestimated their measurement. BMI was similar to weight (0.5 kg/m2 for men and -0.2 kg/m2 for women) (Table 1).
With regard to age, elderly people presented more distortions in measurements, with overestimation for weight, height and BMI. Younger people (aged 18 to 29 years old) underestimated both measurements. The mean value of the difference of weight for
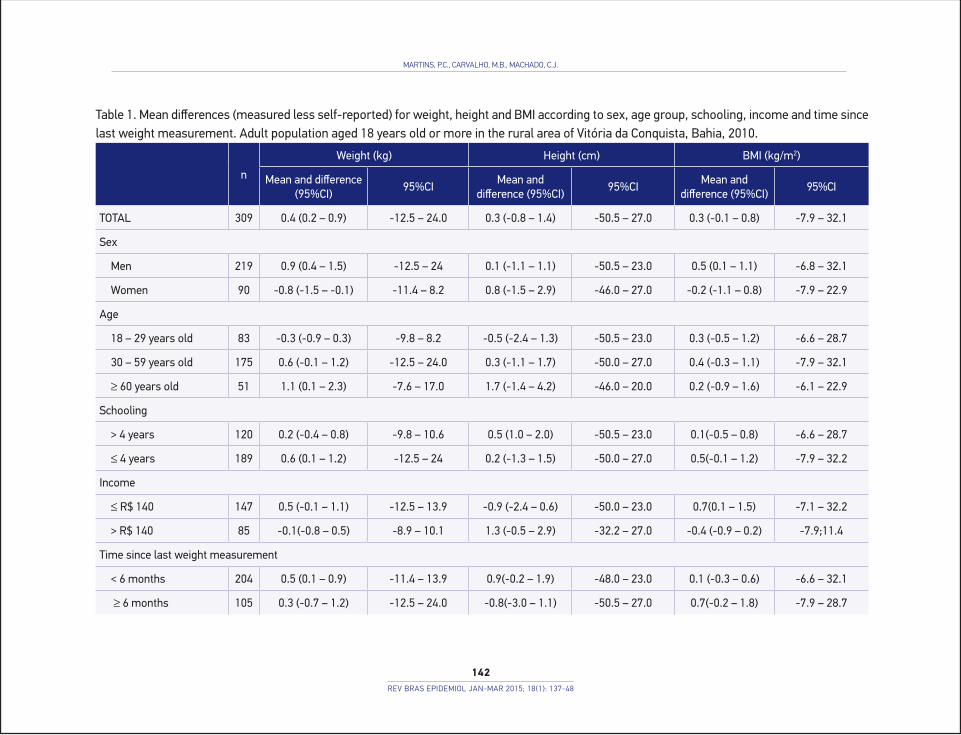
Table 1. Mean differences (measured less self-reported) for weight, height and BMI according to sex, age group, schooling, income and time since last weight measurement. Adult population aged 18 years old or more in the rural area of Vitória da Conquista, Bahia, 2010.
n
Weight (kg) Height (cm) BMI (kg/m2)
Mean and difference (95%CI)
95%CIMean and
difference (95%CI)95%CI
Mean and difference (95%CI)
95%CI
TOTAL 309 0.4 (0.2 – 0.9) -12.5 – 24.0 0.3 (-0.8 – 1.4) -50.5 – 27.0 0.3 (-0.1 – 0.8) -7.9 – 32.1
Sex
Men 219 0.9 (0.4 – 1.5) -12.5 – 24 0.1 (-1.1 – 1.1) -50.5 – 23.0 0.5 (0.1 – 1.1) -6.8 – 32.1
Women 90 -0.8 (-1.5 – -0.1) -11.4 – 8.2 0.8 (-1.5 – 2.9) -46.0 – 27.0 -0.2 (-1.1 – 0.8) -7.9 – 22.9
Age
18 – 29 years old 83 -0.3 (-0.9 – 0.3) -9.8 – 8.2 -0.5 (-2.4 – 1.3) -50.5 – 23.0 0.3 (-0.5 – 1.2) -6.6 – 28.7
30 – 59 years old 175 0.6 (-0.1 – 1.2) -12.5 – 24.0 0.3 (-1.1 – 1.7) -50.0 – 27.0 0.4 (-0.3 – 1.1) -7.9 – 32.1
≥ 60 years old 51 1.1 (0.1 – 2.3) -7.6 – 17.0 1.7 (-1.4 – 4.2) -46.0 – 20.0 0.2 (-0.9 – 1.6) -6.1 – 22.9
Schooling
> 4 years 120 0.2 (-0.4 – 0.8) -9.8 – 10.6 0.5 (1.0 – 2.0) -50.5 – 23.0 0.1(-0.5 – 0.8) -6.6 – 28.7
≤ 4 years 189 0.6 (0.1 – 1.2) -12.5 – 24 0.2 (-1.3 – 1.5) -50.0 – 27.0 0.5(-0.1 – 1.2) -7.9 – 32.2
Income
≤ R$ 140 147 0.5 (-0.1 – 1.1) -12.5 – 13.9 -0.9 (-2.4 – 0.6) -50.0 – 23.0 0.7(0.1 – 1.5) -7.1 – 32.2
> R$ 140 85 -0.1(-0.8 – 0.5) -8.9 – 10.1 1.3 (-0.5 – 2.9) -32.2 – 27.0 -0.4 (-0.9 – 0.2) -7.9;11.4
Time since last weight measurement
< 6 months 204 0.5 (0.1 – 0.9) -11.4 – 13.9 0.9(-0.2 – 1.9) -48.0 – 23.0 0.1 (-0.3 – 0.6) -6.6 – 32.1
≥ 6 months 105 0.3 (-0.7 – 1.2) -12.5 – 24.0 -0.8(-3.0 – 1.1) -50.5 – 27.0 0.7(-0.2 – 1.8) -7.9 – 28.7
MARTINS, P.C., CARVALHO, M.B., MACHADO, C.J.
142REV BRAS EPIDEMIOL JAN-MAR 2015; 18(1): 137-48
USE OF SELF-REPORTED MEASURES OF HEIGHT, WEIGHT AND BODY MASS INDEX IN A RURAL POPULATION OF NORTHEAST BRAZIL.
143REV BRAS EPIDEMIOL JAN-MAR 2015; 18(1): 137-48
individuals with four or less schooling years was of 0.5 kg, which was higher than the ones found for those with higher schooling. By assessing the differences in income strata, people with lower income overestimated their weight (0.5 kg), and underestimated their height (-0.9 cm), with BMI overestimation (0.7 kg/m2). The ones who had been weighed more than 6 months ago presented weight overestimation (0.33 kg), and height underestimation (-0.8 cm), with BMI overestimation (0.72 kg/m2) (Table 1).
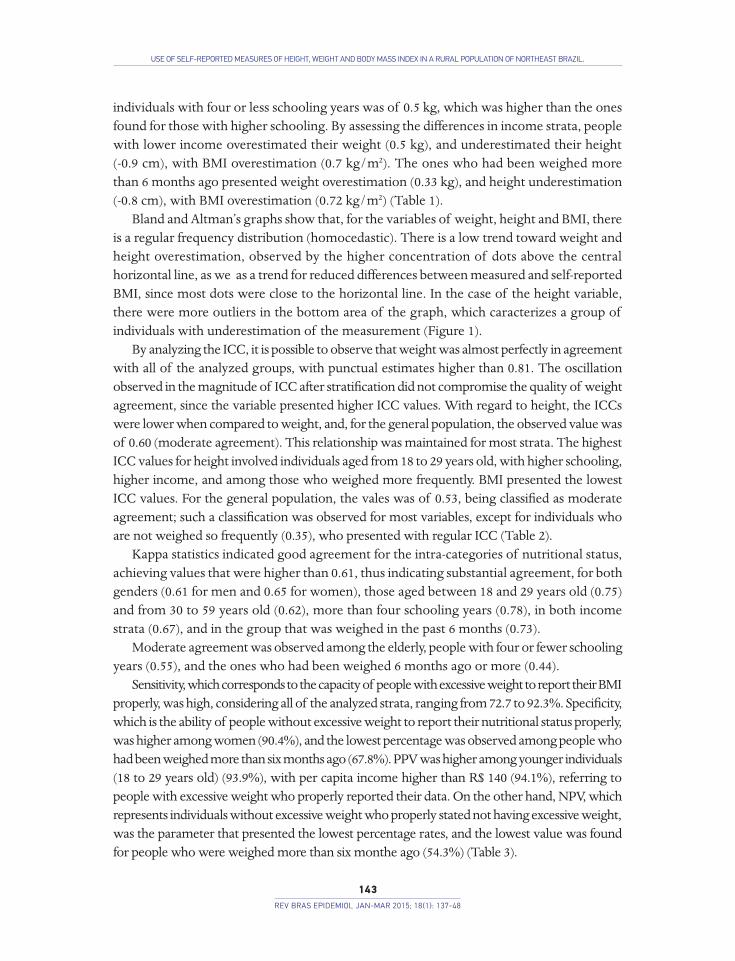
Bland and Altman’s graphs show that, for the variables of weight, height and BMI, there is a regular frequency distribution (homocedastic). There is a low trend toward weight and height overestimation, observed by the higher concentration of dots above the central horizontal line, as we as a trend for reduced differences between measured and self-reported BMI, since most dots were close to the horizontal line. In the case of the height variable, there were more outliers in the bottom area of the graph, which caracterizes a group of individuals with underestimation of the measurement (Figure 1).
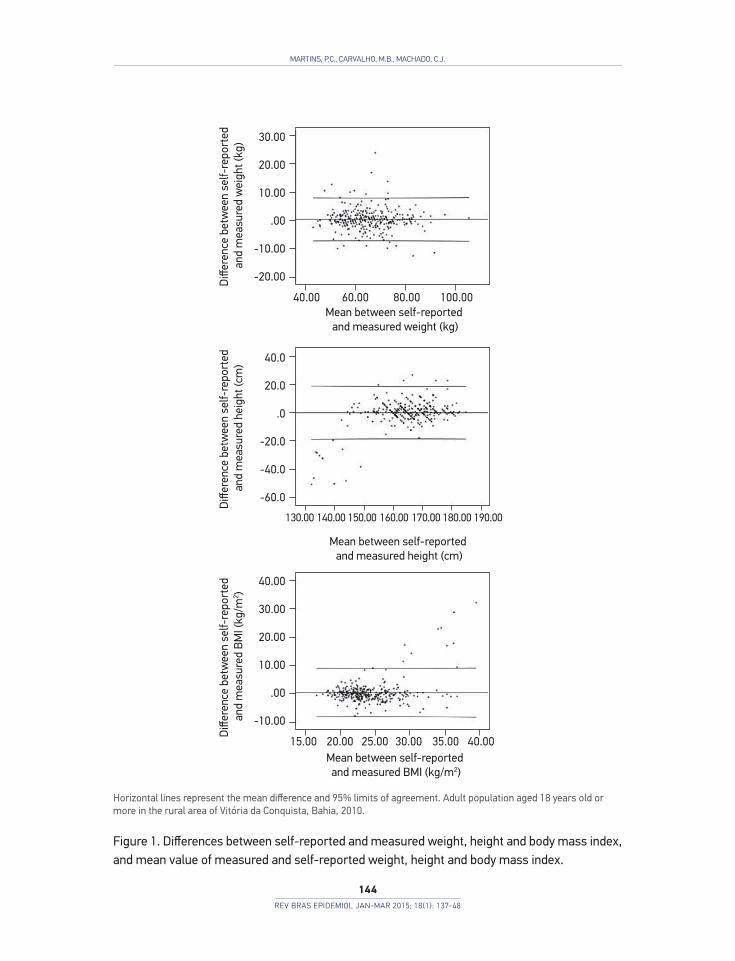
By analyzing the ICC, it is possible to observe that weight was almost perfectly in agreement with all of the analyzed groups, with punctual estimates higher than 0.81. The oscillation observed in the magnitude of ICC after stratification did not compromise the quality of weight agreement, since the variable presented higher ICC values. With regard to height, the ICCs were lower when compared to weight, and, for the general population, the observed value was of 0.60 (moderate agreement). This relationship was maintained for most strata. The highest ICC values for height involved individuals aged from 18 to 29 years old, with higher schooling, higher income, and among those who weighed more frequently. BMI presented the lowest ICC values. For the general population, the vales was of 0.53, being classified as moderate agreement; such a classification was observed for most variables, except for individuals who are not weighed so frequently (0.35), who presented with regular ICC (Table 2).
Kappa statistics indicated good agreement for the intra-categories of nutritional status, achieving values that were higher than 0.61, thus indicating substantial agreement, for both genders (0.61 for men and 0.65 for women), those aged between 18 and 29 years old (0.75) and from 30 to 59 years old (0.62), more than four schooling years (0.78), in both income strata (0.67), and in the group that was weighed in the past 6 months (0.73).
Moderate agreement was observed among the elderly, people with four or fewer schooling years (0.55), and the ones who had been weighed 6 months ago or more (0.44).
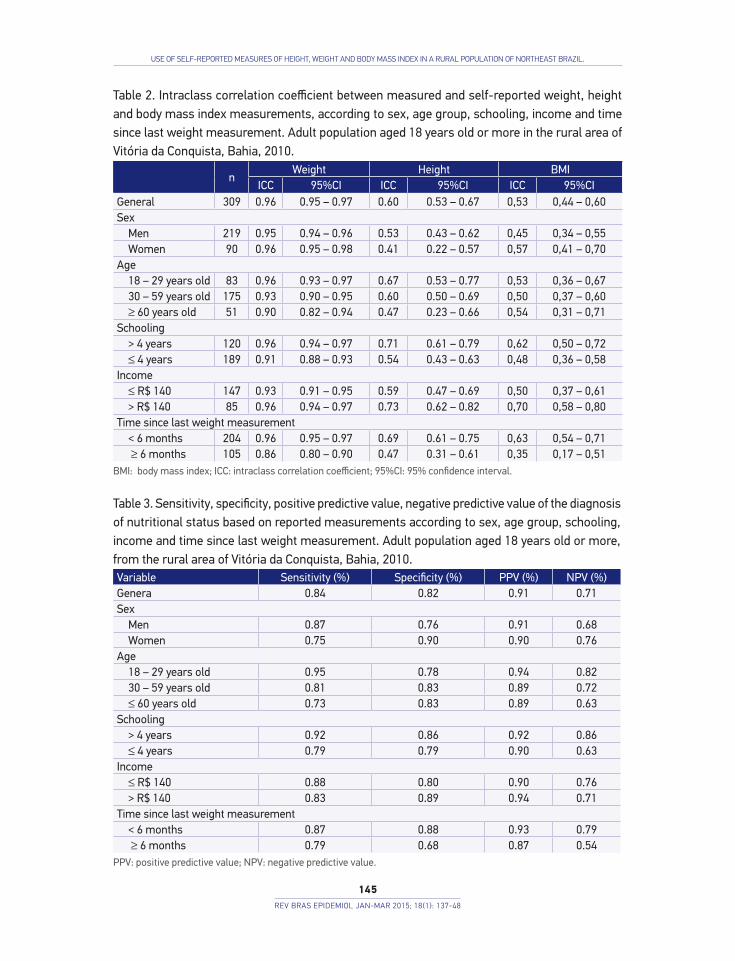
Sensitivity, which corresponds to the capacity of people with excessive weight to report their BMI properly, was high, considering all of the analyzed strata, ranging from 72.7 to 92.3%. Specificity, which is the ability of people without excessive weight to report their nutritional status properly, was higher among women (90.4%), and the lowest percentage was observed among people who had been weighed more than six months ago (67.8%). PPV was higher among younger individuals (18 to 29 years old) (93.9%), with per capita income higher than R$ 140 (94.1%), referring to people with excessive weight who properly reported their data. On the other hand, NPV, which represents individuals without excessive weight who properly stated not having excessive weight, was the parameter that presented the lowest percentage rates, and the lowest value was found for people who were weighed more than six monthe ago (54.3%) (Table 3).
MARTINS, P.C., CARVALHO, M.B., MACHADO, C.J.
144REV BRAS EPIDEMIOL JAN-MAR 2015; 18(1): 137-48
Horizontal lines represent the mean difference and 95% limits of agreement. Adult population aged 18 years old or more in the rural area of Vitória da Conquista, Bahia, 2010.
Figure 1. Differences between self-reported and measured weight, height and body mass index, and mean value of measured and self-reported weight, height and body mass index.
Diff
eren
ce b
etw
een
self-
repo
rted
an
d m
easu
red
wei
ght (
kg)
Mean between self-reported and measured weight (kg)
Mean between self-reported and measured height (cm)
Mean between self-reported and measured BMI (kg/m2)
Diff
eren
ce b
etw
een
self-
repo
rted
an
d m
easu
red
BMI (
kg/m
2 )D
iffer
ence
bet
wee
n se
lf-re
port
ed
and
mea
sure
d he
ight
(cm
)
30.00
20.00
10.00
.00
-10.00
-20.00
40.00
30.00
20.00
10.00
.00
-10.00
40.0
20.0
.0
-20.0
-40.0
-60.0
40.00 60.00 80.00 100.00
130.00 140.00 150.00 160.00 170.00 180.00 190.00
20.00 25.0015.00 30.00 40.0035.00
USE OF SELF-REPORTED MEASURES OF HEIGHT, WEIGHT AND BODY MASS INDEX IN A RURAL POPULATION OF NORTHEAST BRAZIL.
145REV BRAS EPIDEMIOL JAN-MAR 2015; 18(1): 137-48
Table 2. Intraclass correlation coefficient between measured and self-reported weight, height and body mass index measurements, according to sex, age group, schooling, income and time since last weight measurement. Adult population aged 18 years old or more in the rural area of Vitória da Conquista, Bahia, 2010.
nWeight Height BMI
ICC 95%CI ICC 95%CI ICC 95%CIGeneral 309 0.96 0.95 – 0.97 0.60 0.53 – 0.67 0,53 0,44 – 0,60Sex
Men 219 0.95 0.94 – 0.96 0.53 0.43 – 0.62 0,45 0,34 – 0,55Women 90 0.96 0.95 – 0.98 0.41 0.22 – 0.57 0,57 0,41 – 0,70
Age18 – 29 years old 83 0.96 0.93 – 0.97 0.67 0.53 – 0.77 0,53 0,36 – 0,6730 – 59 years old 175 0.93 0.90 – 0.95 0.60 0.50 – 0.69 0,50 0,37 – 0,60≥ 60 years old 51 0.90 0.82 – 0.94 0.47 0.23 – 0.66 0,54 0,31 – 0,71
Schooling> 4 years 120 0.96 0.94 – 0.97 0.71 0.61 – 0.79 0,62 0,50 – 0,72≤ 4 years 189 0.91 0.88 – 0.93 0.54 0.43 – 0.63 0,48 0,36 – 0,58
Income ≤ R$ 140 147 0.93 0.91 – 0.95 0.59 0.47 – 0.69 0,50 0,37 – 0,61> R$ 140 85 0.96 0.94 – 0.97 0.73 0.62 – 0.82 0,70 0,58 – 0,80
Time since last weight measurement< 6 months 204 0.96 0.95 – 0.97 0.69 0.61 – 0.75 0,63 0,54 – 0,71 ≥ 6 months 105 0.86 0.80 – 0.90 0.47 0.31 – 0.61 0,35 0,17 – 0,51
BMI: body mass index; ICC: intraclass correlation coefficient; 95%CI: 95% confidence interval.
Table 3. Sensitivity, specificity, positive predictive value, negative predictive value of the diagnosis of nutritional status based on reported measurements according to sex, age group, schooling, income and time since last weight measurement. Adult population aged 18 years old or more, from the rural area of Vitória da Conquista, Bahia, 2010. Variable Sensitivity (%) Specificity (%) PPV (%) NPV (%)Genera 0.84 0.82 0.91 0.71Sex
Men 0.87 0.76 0.91 0.68Women 0.75 0.90 0.90 0.76
Age18 – 29 years old 0.95 0.78 0.94 0.8230 – 59 years old 0.81 0.83 0.89 0.72≤ 60 years old 0.73 0.83 0.89 0.63
Schooling> 4 years 0.92 0.86 0.92 0.86≤ 4 years 0.79 0.79 0.90 0.63
Income≤ R$ 140 0.88 0.80 0.90 0.76> R$ 140 0.83 0.89 0.94 0.71
Time since last weight measurement< 6 months 0.87 0.88 0.93 0.79 ≥ 6 months 0.79 0.68 0.87 0.54
PPV: positive predictive value; NPV: negative predictive value.
MARTINS, P.C., CARVALHO, M.B., MACHADO, C.J.
146REV BRAS EPIDEMIOL JAN-MAR 2015; 18(1): 137-48
DISCUSSION
The observed reality shows major unawareness of the population regarding their anthropometric measurements. Among the people who did not know or did not want to inform their weight and height, there is prevalence of women, elderly people, those with lower schooling, lower income, who did not weigh frequently or were never weighed, and those whose nutritional status was between the extremes of low weight and obesity.
With regard to sex, another study also found higher percenage of women in the group of people who did not inform their anthropometric measurements11, however, the loss found in this survey conducted in the city of Goiânia, Goiás, was lower (5%) to that observed in this study (58.5%). This finding is opposite to the expected, once it was believed that women would present better understanding of their nutritional status when compared to men; besides, they would be more concerned about their health conditions20,21. The observed reality can be attributed to the low socioeconomic status and schooling of the studied population, as well as to the fact that this is a rural population, with more difficulties to access health services and places that enable the measurement of weight and height.
Another characteristic that reaffirms the difficulty to access places to measure weight is the fact that about 40% of the interviewees reported never having been weighed or being weight 6 months ago or more. A study conducted with adolescents living in rural areas2 indicated that the differences observed between self-reported and measure measurements were related to the low frequency with which inhabitants of rural areas can measure their anthropometric measurements22.
Among those who knew how to report their measurements, a group composed of 41.5% of the total sample, it was observed that weight is the more familiar measurement for the population, shown by higher values of ICC, lower magnitude of differences between means and by the more regular distribution pattern in Bland and Altman’s graphs. These findings corroborate those of other studies, which also identified the weight as being the better reported anthropometric measurement11,23,24.
In accordance with this study, other evaluations of self-reported anthropometric measurements show that women tend to overestimate their height and underestimate their weight, thus leading to inaccuracy in the definition of their nutritional status4,12,25. Based on literature, it is possible to assume that this behavioral pattern is associated with female dissatisfaction toward their body image, which is mainly influenced by social and cultural pressure to achieve certain beauty patterns20.
With regard to age, it is possible to notice that older individuals presented higher measures of dispersion of self-reported weight and height values, which was also found in other studies7. Elderly people also presented the lowers ICC, Kappa and other validation measures. This reality can be associated with some questions, such as the physiological aging
USE OF SELF-REPORTED MEASURES OF HEIGHT, WEIGHT AND BODY MASS INDEX IN A RURAL POPULATION OF NORTHEAST BRAZIL.
147REV BRAS EPIDEMIOL JAN-MAR 2015; 18(1): 137-48
process, which leads to the reduction of height and to considerable changes in the weight of the person, as a result of the loss of lean mass, and of the fact that elderly people do not check their weigh, and especially their height, often; all of this leads to the report of more inaccurate information7.
Individuals with four or fewer schooling years presented less accuracy in self-reported measurements, as observed in other studies13. Especially in rural areas, the limited teaching, educational and information context can have a negative influence on the access to health services, as well as on the understanding of health information given to users. This situation can compromise the health care required by these people. Generally, individuals with higher schooling tend to have better perception of the disease and of the importance of health care26.
The agreement analysis also shows that the diff iculty of accessing the places to measure weight may make it more diff icult to understand the anthropometric measurements, since the people who had not been weighed for the past six months presented lower ICC, Kappa, sensitivity, specificity, PPV and NPV values.
Two main conclusions arise from this study. Firstly, facing the considerable number of individuals without information on self-reported weight and/or height, this strategy of obtaining anthropometric measurements in rural populations should be used carefully. The fact that more than 50% of the population cannot inform their measurements is a matter of concern, and nutritional surveillance actions should be conducted focusing on rural populations. Secondly, facing the positive agreement found between self-reported and measurement weight, height and BMI values, it is possible to recommend the use of self-reported measurements in epidemiological studies involving rural populations, however, it is necessary to be careful when adopting this information for rural populations of elderly people, with low schooling and among those who do not weigh frequently.
To sum up, by planning the adoption of self-reported anthropometric measurements to assess nutritional status, the objectives of the study and the specific characteristics of the population should be considered. The possibility of classification errors and possible bias in the results should be considered before the adoption of self-reported measurements. These analyses should be reapplied in populations living in rural areas of other regions of the country, with the objective of identifying other factors associated with error in self-reported measurements.
It is also important to develop dietary and nutritional surveillance strategies as part of health services, such as population surveys, nutritional calls, and encouragement to the scientific production focusing on nutritional evaluation in rural contexts. These strategies can produce health and nutrition indicators to develop actions aiming at the health care for this population.
MARTINS, P.C., CARVALHO, M.B., MACHADO, C.J.
148REV BRAS EPIDEMIOL JAN-MAR 2015; 18(1): 137-48
1. Instituto Brasileiro de Geografia e Estatística (IBGE). Pesquisa de Orçamentos Familiares 2008-2009. Antropometria e estado nutricional de crianças, adolescentes e adultos no Brasil. Rio de Janeiro: IBGE; 2010. Disponível em: http://www.ibge.gov.br/home/estatistica/populacao/condicaodevida/pof/2008_2009/POFpublicacao.pdf. (Acessado em 01 de setembro de 2013).
2. World Health Organization WHO). Obesity: preventing and managing the global epidemic: report of a World Health Organization Consultation. WHO - Obesity Technical Report Series, n. 284. Geneva: WHO; 2000.
3. Kac G, Sichieri R, Gigante D. Epidemiologia nutricional. Rio de Janeiro: Editora Fiocruz; 2007.
4. Gorber SC, Tremblay M, Moher D, Gorber B. A comparison of direct vs. self-report measures for assessing height, weight and body mass index: a systematic review. Obes Rev 2007; 8(4): 307-26.
5. Conde WL, Oliveira DR, Borges CA, Baraldi LG. Consistência entre medidas antropométricas em inquéritos nacionais. Rev Saúde Pública 2013; 47(1): 69-76.
6. Coqueiro RS, Borges LJ, Araújo VC, Pelegrini A, Barbosa AR. Medidas auto-referidas são válidas para avaliação do estado nutricional na população brasileira? Rev Bras Cineantrop Desempenho Hum 2009; 11(1): 113-9.
7. Kuczmarki MF, Kuczmarski RJ, Najar M. Effects of age on validity of self-reported height, weight and body mass index: findings from the Third National Health and Nutrition Examination Survey, 1988-1994. J Am Diet Assoc 2001; 101(1): 28-34.
8. Lucca A, Moura EC. Validity and reliability of self-reported weight, height and body mass index from telephone interviews. Cad Saúde Pública 2010; 26(1): 110-22.
9. Nawaz H, Chan W, Abdulrahman M, Larson D, Katz DL. Self-reported weight and height: implications for obesity research. Am J Prev Med 2001; 20(4): 294-8.
10. Spencer EA, Appleby PN, Davey GK, Key TJ. Validity of self-reported height and weight in 4808 EPIC-Oxford participants. Public Health Nutr 2002; 5(4): 561-5.
11. Peixoto MRG, Benício MHD, Jardim PCBV. Validade do peso e da altura auto-referidos: o estudo de Goiânia. Rev Saúde Pública 2006; 40(6): 1065-72.
12. Silveira EA, Araújo CL, Gigante DP, Barros AJD, Lima MS. Validação do peso e altura referidos para o diagnóstico do estado nutricional em uma população de adultos no Sul do Brasil. Cad Saúde Pública 2005; 21(1): 235-45.
13. Craig BM, Adams AK. Accuracy of body mass index categories based on self-reported height and weight among women in the United States. Materm Child Health J 2009; 13(4): 489-96.
14. Dekkers JC, van Wier MF, Hendriksen IJ, Twisk JW, van Mechelen W. Accuracy of self-reported body weight, height
and waist circumference in a Dutch overweight working population. BMC Med Res Methodol 2008; 8: 69.
15. Bezerra VM, Medeiros DS, Gomes KO, Souzas R, Giatti L, Steffens AP, et al. Inquérito de Saúde em Comunidades Quilombolas de Vitória da Conquista, Bahia, Brasil (Projeto COMQUISTA): aspectos metodológicos e análise descritiva. Ciênc Saúde Coletiva 2014; 19(6): 1835-47.
16. Brasil. Ministério da Saúde. Vigilância alimentar e nutricional - SISVAN: orientações básicas para a coleta, o processamento, a análise de dados e a informação em serviços de saúde. Brasília: Ministério da Saúde; 2004.
17. Brasil. Decreto nº 6.917, de 30 de julho de 2009. Altera os arts. 18, 19 e 28 do Decreto nº 5.209, de 17 de setembro de 2004, que regulamenta a Lei nº 10.836, de 9 de janeiro de 2004, que cria o Programa Bolsa Família. Brasília: Diário Oficial da União; 2009.
18. Landis JR, Koch GG. The measurement of observer agreement for categorical data. Biometrics 1977; 33(1): 159-74.
19. Bland JM, Altman DG. Comparing methods of measurement: why plotting difference against standard method is misleading. Lancet 1995; 346(8982): 1085-7
20. Paquette MC, Raine K. Sociocultural context of women’s body image. Soc Sci Med 2004; 59(5): 1047-58.
21. World Health Organization (WHO). Women and health: today’s evidence tomorrow’s agenda. Geneva: WHO; 2009.
22. Enes CC, Pegolo GE, Silva MV. Medidas autorreferidas versus medidas aferidas de peso e altura de adolescentes residentes em áreas rurais de Piedade, São Paulo. Nutrire 2009; 34(2): 59-70.
23. Castro V, Moraes SA, Freitas ICM. Concordância de medidas antropométricas em estudo epidemiológico de base populacional. Ribeirão Preto, SP, 2006. Projeto OBEDIARP. Rev Bras Epidemiol 2010; 13(1): 58-68.
24. Thomaz PMD, Silva EF, Costa THM. Validade de peso, altura e índice de massa corporal autorreferidos na população adulta de Brasília. Rev Bras Epidemiol 2013; 16(1): 157-69.
25. Del Duca GF, González-Chica DA, Santos JV, Knuth AG, Camargo MBJ, Araújo CL. Peso e altura autorreferidos para determinação do estado nutricional de adultos e idosos: validade e implicações em análises de dados. Cad Saúde Pública 2012; 28(1): 75-85.
26. Travassos C, Viacava F. Acesso e uso de serviços de saúde em idosos residentes em áreas rurais, Brasil, 1998 e 2003. Cad Saúde Pública 2007; 23(10): 2490-2502.
Received on: 09/13/2013 Final version presented on: 03/05/2014 Accepted on: 04/28/2014
REFERENCES