Embed Size (px)
Citation preview
e-ISSN: 2455-667X Annals of Natural Sciences Vol. 2(1), March 2016: 50-61 Journal’s URL: http://www.crsdindia.com/ans.html Email: [email protected]
ORIGINAL ARTICLE
Physico-chemical standardization and to evaluate chemical attributes of different
tea and coffee for quality assurance
Preeti Sharma1, Ishrat Alim1 and Sarita Shrivastava2 1Quality Assurance Laboratory, M.P. Council of Science and Technology, Vigyan Bhavan,
Science Hills, Nehru Nagar, Bhopal (M.P.) India. 2Department of Chemistry, Institute of Excellence in Higher Education (IEHE), Bhopal
Email: [email protected]
ABSTRACT Hot beverages drinking habits are worldwide spread and many countries cultivate different brands of tea and coffee to meet the increasing demands. Tea ‘Camellia sinensis’ and coffee ‘Coffea arabica L.’ are now the two most common non-alcoholic beverages in the world and are drunk in most countries, but typically one predominates. Coffee is the preferred drink in Europe and America, and tea elsewhere. Tea is an essential commodity of domestic consumption and is considered as the major and the cheapest beverage amongst the beverages available in India. Black standard tea constitutes nearly 80 per cent of value sales, although green tea has seen its popularity rise. Furthermore, in the south and north, coffee is bigger as a proportion of total hot drinks as tea than in the rest of the country. The basic aspect of this research is to explore the possibilities of method development specifically for physico-chemical standardization and their application for quality assessment and health risk for human consumption. This research has attempted to explore a way in which quality monitoring method of analysis of the hot beverages might be used to support the food and drug administration under prevention of food adulteration act in making their subjective judgments. Present research is an effort to describes the quality assurance parameters for tea and coffee after distributing the product in the market as small or big brand on the basis of existing evaluation techniques applied during fermentation and grading processes and then about the application of analytical procedures as well as instrumental methods of analysis in food processing industries and finally its prospects in tea and coffee industries. Keywords: Hot beverages, domestic consumption, physico-chemical standardization, quality assurance, health risk and human consumption Received: 8th Jan. 2016, Revised: 19th Feb. 2016, Accepted: 21st Feb. 2016 ©2016 Council of Research & Sustainable Development, India How to cite this article: Sharma P., Alim I. and Shrivastava S. (2016): Physico-chemical standardization and to evaluate chemical attributes of different tea and coffee for quality assurance. Annals of Natural Sciences, Vol. 2[1]: March, 2016: 50-61. Introduction The term ‘tea and coffee quality’ is concerned with the overall quality which is a predefined standard of made-tea. It depends on various factors, namely tea growing, environment, processing techniques etc. and certain parameters need to be controlled to maintain a preferred quality. With fast-changing tea consuming habits of human being, international competition and need for increasingly stringent standards, improving tea quality is a serious concern for the tea industry. Traditional methods of tea quality monitoring are not standardized and need to apply modern technology to improve the overall tea quality. Analytical and specifically instrumentation culture and off course the vision, analysis of the quality parameters can help in solving some of existing problems of tea and coffee quality monitoring methods.
Annals of
Natural Sciences
Sharma, et. al.,
Annals of Natural Sciences ~ 51 ~ Vol. 2(1): March 2016
Tea is an important high value crop throughout the world. Tea leaves are processed through various stages viz., withering, rolling and cutting, fermenting, drying and sorting / grading. Every stage is concerned with some standard methods and failure of one of them may lead to a reduction in the quality of made-tea like Green tea and Black tea. Therefore it is very necessary that every stage should be monitored constantly by evaluating certain parameters like aroma, colour, size, taste and astringent during two main processing stages: fermentation and grading in a flavour terminology of human sensory panel to produce quality tea. Similarly it is very important to assure the quality of the products after launching in the market. Although numerous literatures is available on the quality control parameters which are being done in in-house research and development activity established by the big companies under which many brands are launched in the market. Scientists all over the world are trying to quantify the quality of the tea on the basis of the quality control (in house) but negligence behaviour is appeared on the quality assurance of these beverages and the presence of various biochemical compounds specifically caffeine which is responsible for the taste of the made tea Hara, (2001); CFC (2004); Radhakrishnan, (2004); Franca et al., (2005); Maridakis, (2006). However a few noteworthy contributions are available on the quality assurance of the beverages which is getting increased day by day and are used across the country. Organoleptic properties like colour, size, shape and flavour are most important parameters that are might consider in the tea and coffee different processing stages in order to assess the quality of these hot beverages. For example the ‘colour’ and ‘aroma’ of fermenting tea are two important quality parameters in the tea fermentation process. Similarly, size, shape, colour, and flavour of ‘made-tea granules’ during the tea grading process are the specific attributes to be considered for quality monitoring method. On the other hand coffee quality depends on the coffee aroma caused by the chemical constituents and taste having some bitterness in it and these quite great diverse brands of tea and coffee are well known to consumers. Colour, texture, flavour etc. are the important process parameters for the subjective determination of the overall product quality of food processing industries and agricultural products (Giese, 2000). Quality characteristics of black tea are assessed, using either sight, smell, and/or taste of the beverage (Cloughley, 1981; Ding et al., 1992; Sanderson et al., 1976). Several studies have demonstrated linkages between the sensory quality characteristics of resultant black tea, the chemical composition of the green leaf and the black tea processing parameters (Biswas, and Sarkar, 1973). Several efforts have been made to point out the beneficial effects of drinking these beverages and also to assess the quality by chemical analysis usually done on pigmentation and the specific flavouring characteristics, however a little attention has been given to quality assurance of the product and purity of the hot beverages. Keeping the view in mind present research has been undertaken to furnish the information and data base with necessary background information of area of interest relevant to this research. For this, it enumerates detailed background on the tea quality perception, prospect of systematic analytical procedures and methods of analysis in quality evaluation and their prospective applications in related food and Agri-produce industries. Present work will surely be helpful to explore the possibility of better quality in regard of nutritional aspects as it focuses on key requirements for the techniques encountered during the standard operating procedures development for quality assurance and inspection systems specifically for the hot beverages. It will also introduce food safety system and its usefulness for periodic check the food and Agri-produce. MATERIAL AND METHODS A comprehensive study was done on the quality assurance of selected hot beverages i.e. tea and coffee as it has a cooling, slightly bitter, astringent flavor and the people is very fond of this specific taste. The study is focused for ensuring the efficacy of analytical
Sharma, et. al.,
Annals of Natural Sciences ~ 52 ~ Vol. 2(1): March 2016
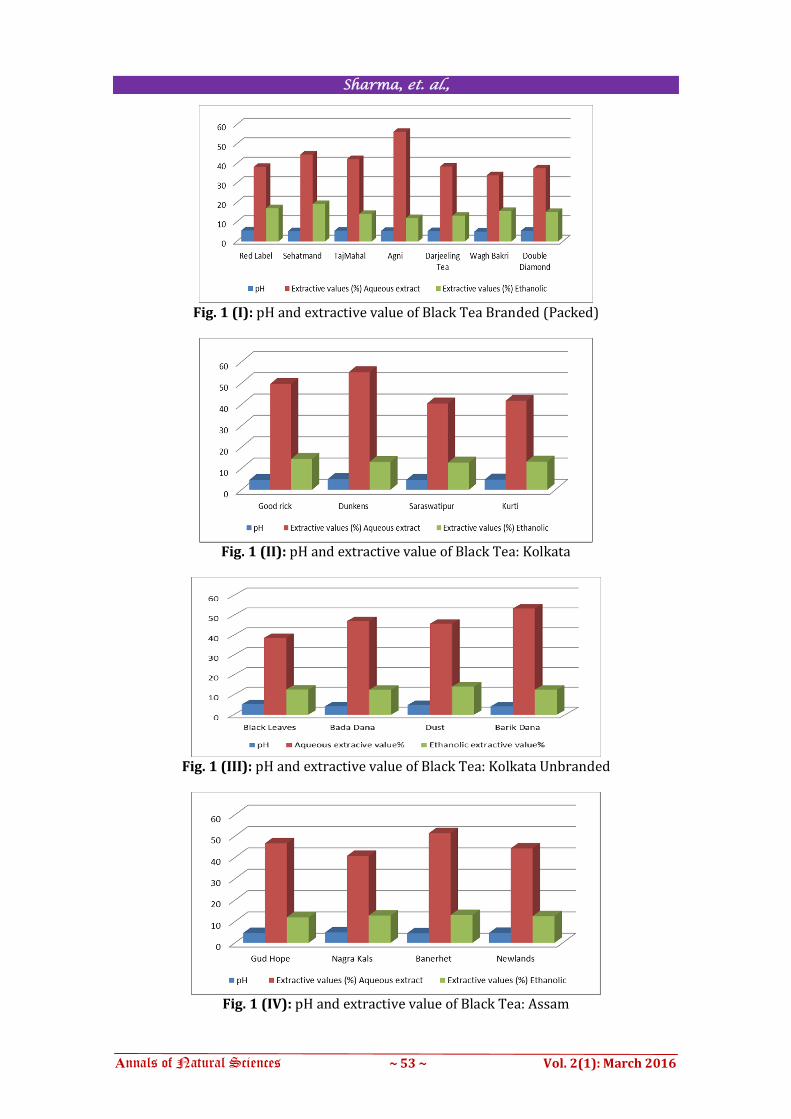
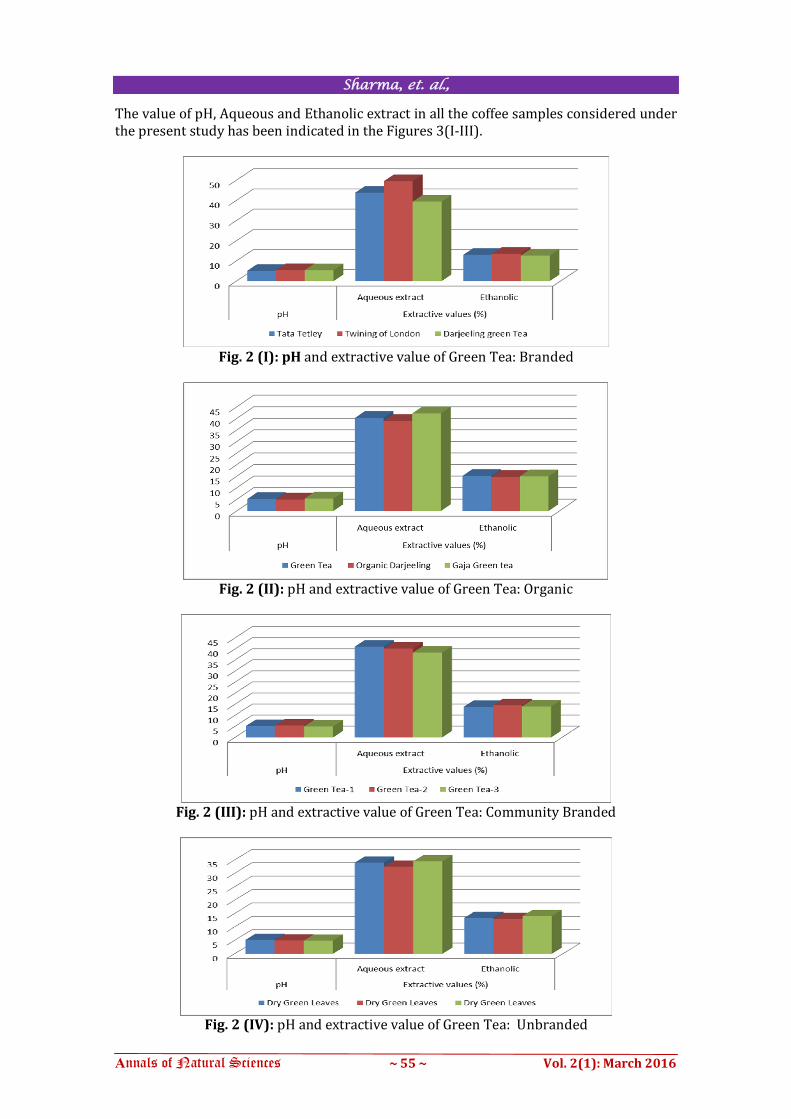
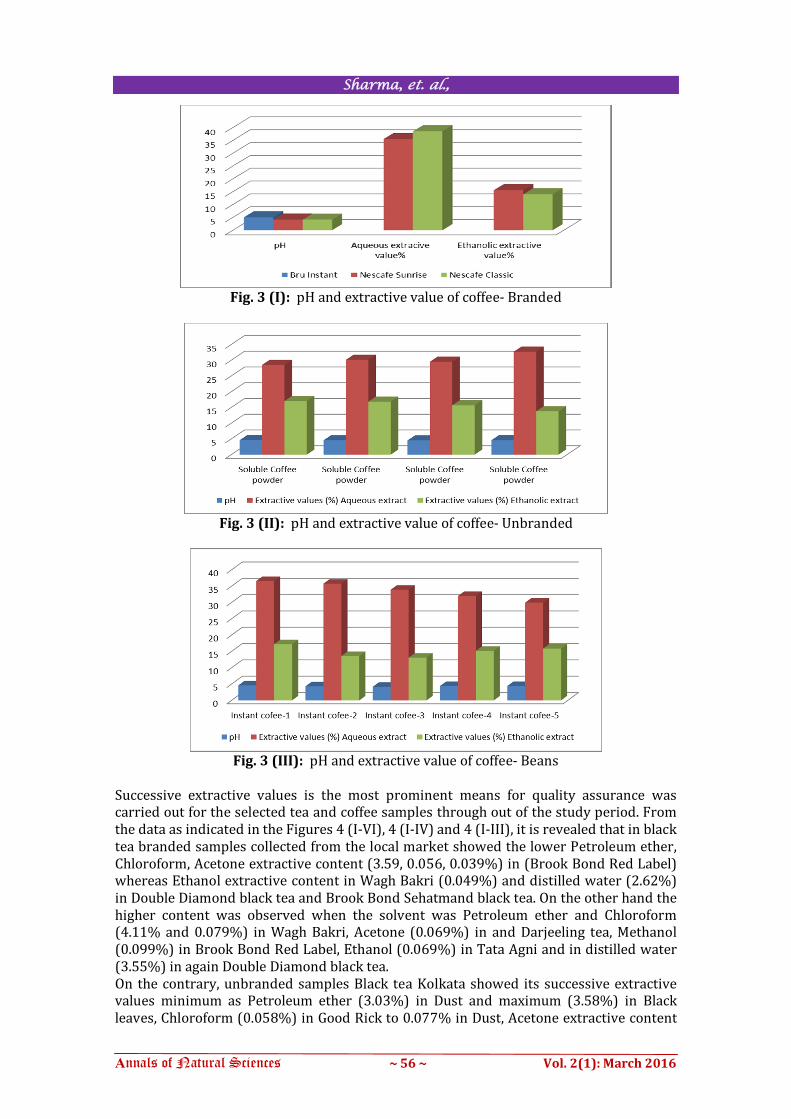
procedures to ascertain the purity of such Agri-produce. Marked brands (Packed) of black tea, green tea and coffee commonly consumed in India and another loose (Unpacked) tea available in the local market was collected to carry out physico-chemical standardization for quality assurance of selected samples as per the standard methods prescribed under Manual of Methods of Analysis of Foods and Beverages: coffee and tea (I.S.I Part IX), 1984 and A.O.A.C, 2000). The samples of the selected tea and coffee were randomly collected from tea and coffee company of local market. RESULTS AND DISCUSSION Quality assurance including Organoleptic properties, Physico-chemical analysis of hot beverages was done for the present study not only to fulfill the objective, as the results obtained from this study can be used to standardize different black, green tea and coffee but also composition of raw materials which enable researcher to generate an idea about possible application of the quality assurance of the product under study. The purpose of the present study was to evaluate chemical attributes of commercial selected tea and coffee brands (Packed) and other samples available as loose (unpacked) form prior to extraction. An attention was paid to the physico-chemical standardization of the selected samples which shows the category, grading, branding (Packed: Big company), community branding (small company) and other loose unpacked tea or the formulation from coffee beans and soluble coffee powder form available in the selected and local market of the selected State. T he appearance as per the granule size of these tea and coffee indicated that the granules appearance was influenced by in-house research and development activity maintained by the big, small and other wholesaler of this Agri-produce or the commodity selected during study period. In the present study no leakage of the packing was found in the samples at the time of collection. Findings related to the physical parameters i.e. Organoleptic characteristics revealed that the colour was black brown (Black tea), dark green (Green tea), dark brown (instant coffee) and brown (coffee beans). All the samples which were collected for the analysis was found with characteristic odour and bitter astringent taste except black tea dust and Barik Dana Calcutta (Unbranded) obtained as loose form from the local market of the Bhopal city market having dull in appearance with very bitter in taste. Details of the Physico-chemical characteristics of hot beverages analyzed throughout of the study period have been expressed in the Fig. 1(I-VI), 2 (I-IV), 3 (I-III). Physico-chemical standardization for quality assurance of different selected tea and coffee samples covering the following parameters like pH, Extractive values and Successive extractive values were carried out to assess the overall purity and the quality of the selected tea and coffee samples procured during the study period. In the present study, pH of 1% w/v of aqueous solution of black tea was found as minimum in Barik Dana Black tea Calcutta small community branded (4.17) and Wagh Bakri branded tea (5.03). However the maximum pH of aqueous solution of black tea was found as 5.61) in Jayanti Gold of Siliguri and 5.62 in Brook Bond Red Label tea which revealed the slightly acidic condition of the tea solution. On the other hand Dried Green tea leaves procured from Lucknow showed minimum pH as 4.95, whereas maximum pH was observed as 5.48 in the Twining of London green tea samples as indicated in the Fig. 1 (I-VI) and 2 (I-IV). On the other hand coffee samples showed minimum pH as 4.11 in Nescafe classic, whereas maximum pH was observed as 5.03 in the BRU Instant branded coffee sample as indicated in the Figure 3 (I-III). From the data as expressed in the same Figures, it is revealed that the water soluble extractive value of the selected black tea samples was found minimum (33.952%) in branded samples Wagh Bakri followed by Maitri Gold black tea small community branded tea of Siliguri (36.849%), whereas maximum values was observed as (50.772% - 64.161%) in Labriver, Darjeeling and Kajri Para, Siliguri black small community branded tea.
Sharma, et. al.,
Annals of Natural Sciences ~ 53 ~ Vol. 2(1): March 2016
Fig. 1 (I): pH and extractive value of Black Tea Branded (Packed)
Fig. 1 (II): pH and extractive value of Black Tea: Kolkata
Fig. 1 (III): pH and extractive value of Black Tea: Kolkata Unbranded
Fig. 1 (IV): pH and extractive value of Black Tea: Assam
Sharma, et. al.,
Annals of Natural Sciences ~ 54 ~ Vol. 2(1): March 2016
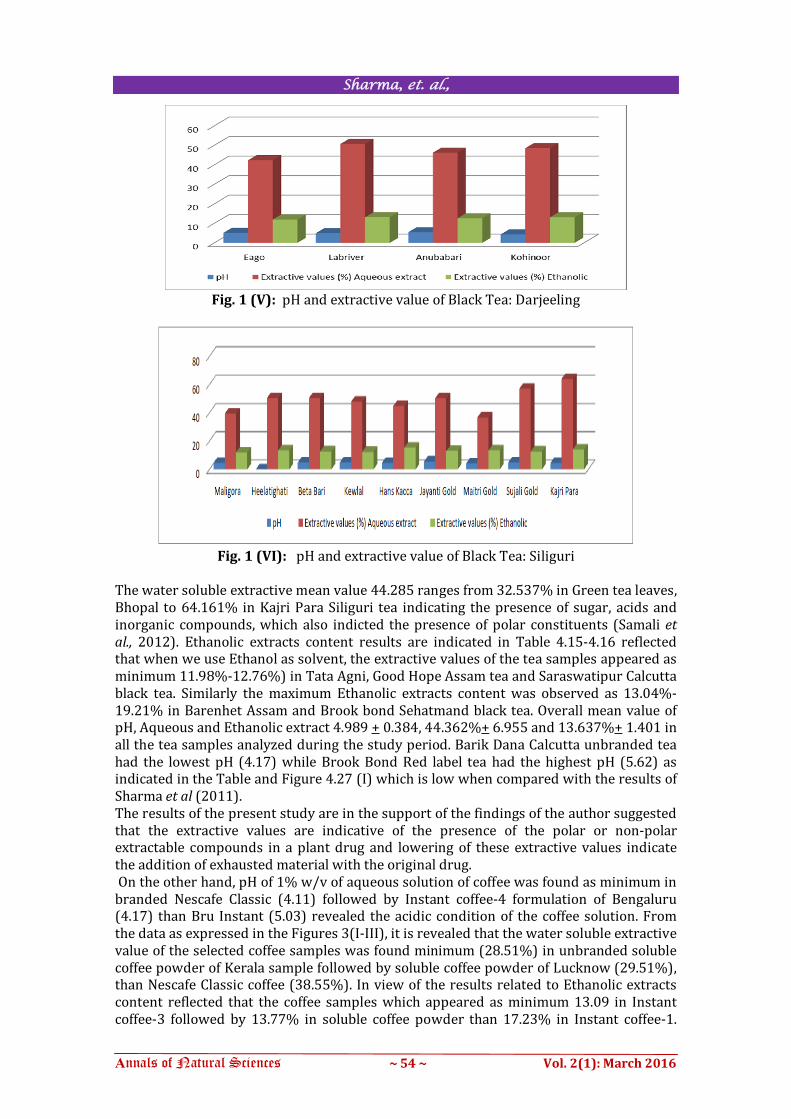
Fig. 1 (V): pH and extractive value of Black Tea: Darjeeling
Fig. 1 (VI): pH and extractive value of Black Tea: Siliguri
The water soluble extractive mean value 44.285 ranges from 32.537% in Green tea leaves, Bhopal to 64.161% in Kajri Para Siliguri tea indicating the presence of sugar, acids and inorganic compounds, which also indicted the presence of polar constituents (Samali et al., 2012). Ethanolic extracts content results are indicated in Table 4.15-4.16 reflected that when we use Ethanol as solvent, the extractive values of the tea samples appeared as minimum 11.98%-12.76%) in Tata Agni, Good Hope Assam tea and Saraswatipur Calcutta black tea. Similarly the maximum Ethanolic extracts content was observed as 13.04%- 19.21% in Barenhet Assam and Brook bond Sehatmand black tea. Overall mean value of pH, Aqueous and Ethanolic extract 4.989 + 0.384, 44.362%+ 6.955 and 13.637%+ 1.401 in all the tea samples analyzed during the study period. Barik Dana Calcutta unbranded tea had the lowest pH (4.17) while Brook Bond Red label tea had the highest pH (5.62) as indicated in the Table and Figure 4.27 (I) which is low when compared with the results of Sharma et al (2011). The results of the present study are in the support of the findings of the author suggested that the extractive values are indicative of the presence of the polar or non-polar extractable compounds in a plant drug and lowering of these extractive values indicate the addition of exhausted material with the original drug. On the other hand, pH of 1% w/v of aqueous solution of coffee was found as minimum in branded Nescafe Classic (4.11) followed by Instant coffee-4 formulation of Bengaluru (4.17) than Bru Instant (5.03) revealed the acidic condition of the coffee solution. From the data as expressed in the Figures 3(I-III), it is revealed that the water soluble extractive value of the selected coffee samples was found minimum (28.51%) in unbranded soluble coffee powder of Kerala sample followed by soluble coffee powder of Lucknow (29.51%), than Nescafe Classic coffee (38.55%). In view of the results related to Ethanolic extracts content reflected that the coffee samples which appeared as minimum 13.09 in Instant coffee-3 followed by 13.77% in soluble coffee powder than 17.23% in Instant coffee-1.
Sharma, et. al.,
Annals of Natural Sciences ~ 55 ~ Vol. 2(1): March 2016
The value of pH, Aqueous and Ethanolic extract in all the coffee samples considered under the present study has been indicated in the Figures 3(I-III).
Fig. 2 (I): pH and extractive value of Green Tea: Branded
Fig. 2 (II): pH and extractive value of Green Tea: Organic
Fig. 2 (III): pH and extractive value of Green Tea: Community Branded
Fig. 2 (IV): pH and extractive value of Green Tea: Unbranded
Sharma, et. al.,
Annals of Natural Sciences ~ 56 ~ Vol. 2(1): March 2016
Fig. 3 (I): pH and extractive value of coffee- Branded
Fig. 3 (II): pH and extractive value of coffee- Unbranded
Fig. 3 (III): pH and extractive value of coffee- Beans
Successive extractive values is the most prominent means for quality assurance was carried out for the selected tea and coffee samples through out of the study period. From the data as indicated in the Figures 4 (I-VI), 4 (I-IV) and 4 (I-III), it is revealed that in black tea branded samples collected from the local market showed the lower Petroleum ether, Chloroform, Acetone extractive content (3.59, 0.056, 0.039%) in (Brook Bond Red Label) whereas Ethanol extractive content in Wagh Bakri (0.049%) and distilled water (2.62%) in Double Diamond black tea and Brook Bond Sehatmand black tea. On the other hand the higher content was observed when the solvent was Petroleum ether and Chloroform (4.11% and 0.079%) in Wagh Bakri, Acetone (0.069%) in and Darjeeling tea, Methanol (0.099%) in Brook Bond Red Label, Ethanol (0.069%) in Tata Agni and in distilled water (3.55%) in again Double Diamond black tea. On the contrary, unbranded samples Black tea Kolkata showed its successive extractive values minimum as Petroleum ether (3.03%) in Dust and maximum (3.58%) in Black leaves, Chloroform (0.058%) in Good Rick to 0.077% in Dust, Acetone extractive content

Sharma, et. al.,
Annals of Natural Sciences ~ 57 ~ Vol. 2(1): March 2016
from 0.039% in Black leaves to 0.059% in Barik Dana, Methenolic content ranged from 0.042% (Dunkens) to 0.067% (Barik Dana), Ethanolic extractive content was minimum (0.049%) in Bada Dana to maximum 0.071% in Saraswatipur tea, Kolkata and distilled water extractive content was minimum (2.32%) again in Bada Dana, Kolkata to maximum 2.98% in Good Rick tea of the same place.
Fig 4 (I): Successive extractive value of Black Tea: Branded
Fig 4 (II): Successive extractive value of Black Tea: Kolkata
Fig 4 (III): Successive extractive value of Black Tea: Kolkata
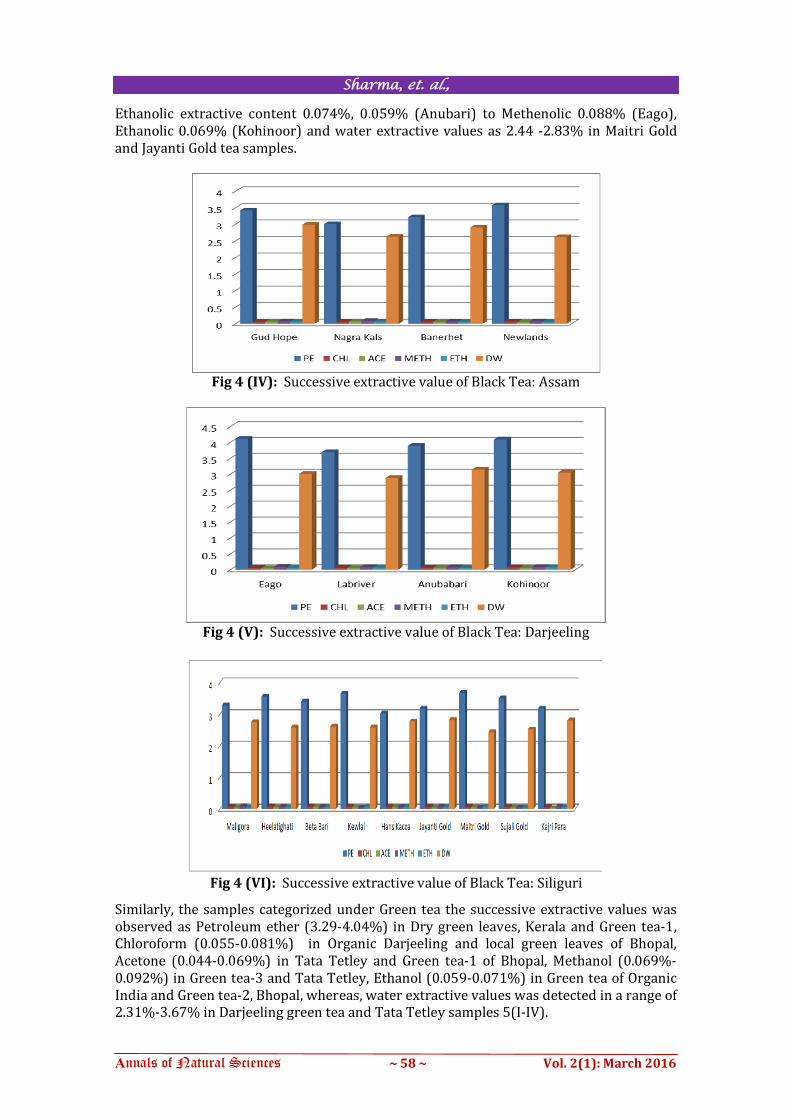
Similarly successive extractive values of Siliguri tea was observed as Petroleum ether (3.03-3.69%) in Hans Kacca and Maitri Gold, Chloroform (0.058-0.079%) and Acetone (0.039-0.062%) in Kajri Para and Beta Bari, Methanol (0.049-0.088%) in Kewlal and Maligora, Ethanol (0.049-0.067%) in Maligora and Maitri Gold whereas water extractive values was detected in a range of 2.44-2.83% in Maitri Gold and Jayanti Gold tea samples. Successive extractive values of Darjeeling tea were found in a range from the solvent Petroleum ether 3.69% (Labriver) to 4.11% (Eago), Chloroform and Acetone 0.059% and 0.044% (Brook Bond Red Label) to 0.069% and 0.062% (Kohinoor), Methenolic,
Sharma, et. al.,
Annals of Natural Sciences ~ 58 ~ Vol. 2(1): March 2016
Ethanolic extractive content 0.074%, 0.059% (Anubari) to Methenolic 0.088% (Eago), Ethanolic 0.069% (Kohinoor) and water extractive values as 2.44 -2.83% in Maitri Gold and Jayanti Gold tea samples.
Fig 4 (IV): Successive extractive value of Black Tea: Assam
Fig 4 (V): Successive extractive value of Black Tea: Darjeeling
Fig 4 (VI): Successive extractive value of Black Tea: Siliguri
Similarly, the samples categorized under Green tea the successive extractive values was observed as Petroleum ether (3.29-4.04%) in Dry green leaves, Kerala and Green tea-1, Chloroform (0.055-0.081%) in Organic Darjeeling and local green leaves of Bhopal, Acetone (0.044-0.069%) in Tata Tetley and Green tea-1 of Bhopal, Methanol (0.069%-0.092%) in Green tea-3 and Tata Tetley, Ethanol (0.059-0.071%) in Green tea of Organic India and Green tea-2, Bhopal, whereas, water extractive values was detected in a range of 2.31%-3.67% in Darjeeling green tea and Tata Tetley samples 5(I-IV).

Sharma, et. al.,
Annals of Natural Sciences ~ 59 ~ Vol. 2(1): March 2016
Fig 5 (I): Successive extractive value of Green Tea: Branded
Fig 5 (II): Successive extractive value of Green Tea: Organic
Fig 5 (III): Successive extractive value of Green Tea: Community
Fig 5 (IV): Successive extractive value of Green Tea: Unbranded
Sharma, et. al.,
Annals of Natural Sciences ~ 60 ~ Vol. 2(1): March 2016
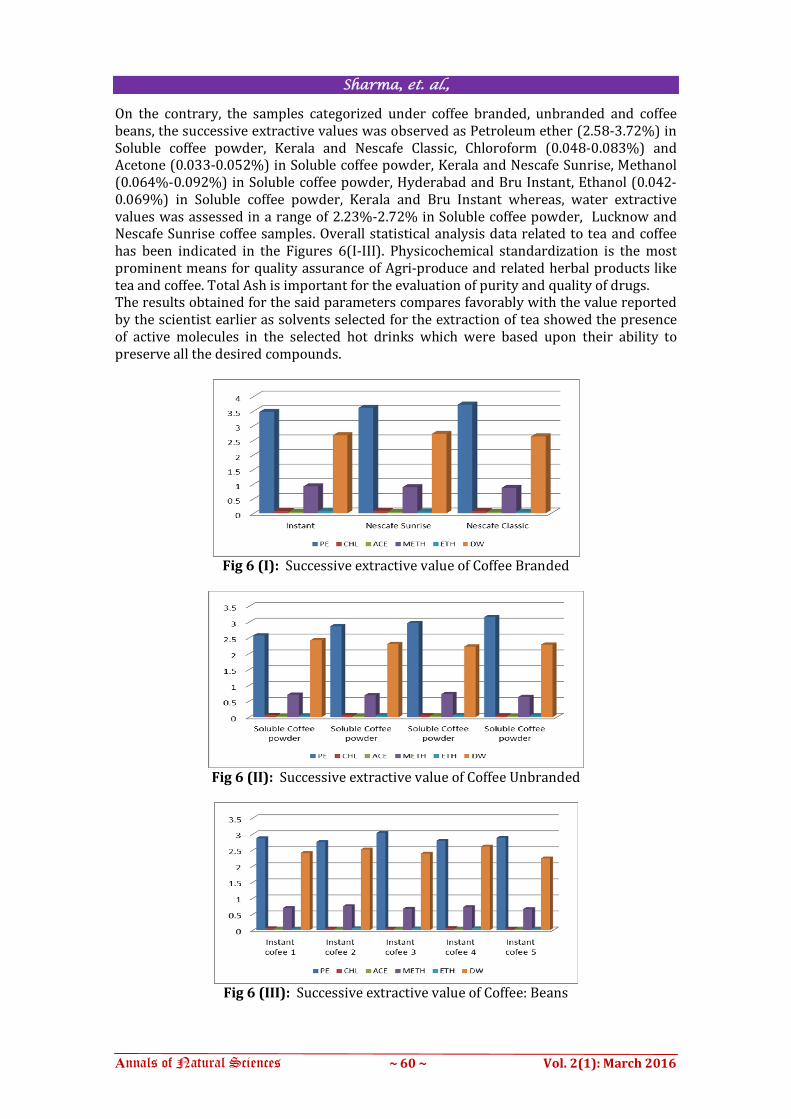
On the contrary, the samples categorized under coffee branded, unbranded and coffee beans, the successive extractive values was observed as Petroleum ether (2.58-3.72%) in Soluble coffee powder, Kerala and Nescafe Classic, Chloroform (0.048-0.083%) and Acetone (0.033-0.052%) in Soluble coffee powder, Kerala and Nescafe Sunrise, Methanol (0.064%-0.092%) in Soluble coffee powder, Hyderabad and Bru Instant, Ethanol (0.042-0.069%) in Soluble coffee powder, Kerala and Bru Instant whereas, water extractive values was assessed in a range of 2.23%-2.72% in Soluble coffee powder, Lucknow and Nescafe Sunrise coffee samples. Overall statistical analysis data related to tea and coffee has been indicated in the Figures 6(I-III). Physicochemical standardization is the most prominent means for quality assurance of Agri-produce and related herbal products like tea and coffee. Total Ash is important for the evaluation of purity and quality of drugs. The results obtained for the said parameters compares favorably with the value reported by the scientist earlier as solvents selected for the extraction of tea showed the presence of active molecules in the selected hot drinks which were based upon their ability to preserve all the desired compounds.
Fig 6 (I): Successive extractive value of Coffee Branded
Fig 6 (II): Successive extractive value of Coffee Unbranded
Fig 6 (III): Successive extractive value of Coffee: Beans
Sharma, et. al.,
Annals of Natural Sciences ~ 61 ~ Vol. 2(1): March 2016
According to the nature of the tea different solvents methanol and ethanol considered good but the importance of extraction time and temperature cannot be denied. Present research reports and explores the chemical profile of different teas and coffees to set their role in modern life.
ACKNOWLEDGEMENT Thanks are due to Prof. Pramod K. Verma, Director General and D. K. Soni, Incharge Quality Assurance Laboratory, MPCST for extending support and constant encouragement. The authors are also thankful to all the staff of QAL offered selfless support and assistance to perform experimental work. REFERENCES 1. AOAC (2000): Official method of analysis of the association of official analytical chemists (AOAC) 14th
edition Washington, D.C.USAP Pp.152-162. 2. Biswas A.K. and Sarkar A.R. (1973): Biological and chemical factors affecting the valuations of North-East
Indian Plains teas. II. Statistical evaluation of the biochemical constituents and their effects on briskness, quality and cash valuations of black teas. Journal of Science and Food Agriculture, 24: 1457–1477.
3. CFC (Common Fund for Commodities) (2004): Improving coffee quality in east and central Africa through enhanced Processing practices; A (CFC/ICO/22) Project for Rwanda and Ethiopia, Final Appraisal Report. The Netherlands, Amsterdam. pp. 10-11.
4. Franca A.S., Oliveira L.S., Mendonca C.F. and Siva X.A. (2005): Physical and chemical attributes of defective crude and roasted coffee beans, Food Chem., 90: 89-94.
5. Giese J. (2000): Colour Measurement in Foods as a Quality Parameter, Food Technology, 54(2): 62-65. 6. Hara Y. (2001). Green tea: Health benefits and applications. Marcel Dekker, Inc., New York, USA. 7. I.S.I. (Part IX) (1984): Manual of Methods of Analysis of Foods and Beverages: coffee and tea. 8. Maridakis A.K. (2006): Proceedings on health benefits of tea and coffee, Italy 26th-29th December, 2007 9. Radhakrishnan S. (2004): Coffee consumption in India- Perspectives and Prospects. Indian coffee, April:
27-35. 10. Samali A., Rukaiyatu A. Kirim and Mustapha K.B. (2012): African Journal of Pharmacy and Pharmacology,
6(6): 384-388.