Embed Size (px)
Citation preview

Original article
Strategies for annotation and curation oftranslational databases: the eTUMOUR project
Margarida Julia-Sape1,2,3,*,y, Miguel Lurgi2,4,y, Mariola Mier5, Francesc Estanyol4, Xavier Rafael4,Ana Paula Candiota1,2,3, Anna Barcelo3, Alina Garcıa1,3,M. Carmen Martınez-Bisbal1,6, Ruben Ferrer-Luna6, Angel Moreno-Torres1,Bernardo Celda1,6 and Carles Arus1,2,3,*
1Centro de Investigacion Biomedica en Red en Bioingenierıa, Biomateriales y Nanomedicina (CIBER-BBN), 2Departament de Bioquımica i Biologia
Molecular, Facultat de Biociencies Universitat Autonoma de Barcelona (UAB), Cerdanyola del Valles 08193 Spain, 3Institut de Biotecnologia i de
Biomedicina (IBB), Universitat Autonoma de Barcelona (UAB), Cerdanyola del Valles 08193 Spain, 4Microart SL, Barcelona, Spain, 5Pharma Quality
Europe (PQE), Figline Valdarno, Italy and 6Departmento de Quımica Fısica, Universidad de Valencia (UVEG), Burjassot, Valencia
Correspondence may also be addressed to Margarida Julia-Sape. Email: [email protected]
*Corresponding author: Email: [email protected] Phone + 34 93 5811257: Fax + 34 93 5811264
yThese authors contributed equally to this work.
Submitted 10 February 2012; Revised 25 July 2012; Accepted 12 September 2012
.............................................................................................................................................................................................................................................................................................
The eTUMOUR (eT) multi-centre project gathered in vivo and ex vivo magnetic resonance (MR) data, as well as transcrip-
tomic and clinical information from brain tumour patients, with the purpose of improving the diagnostic and prognostic
evaluation of future patients. In order to carry this out, among other work, a database—the eTDB—was developed. In
addition to complex permission rules and software and management quality control (QC), it was necessary to develop
anonymization, processing and data visualization tools for the data uploaded. It was also necessary to develop sophisti-
cated curation strategies that involved on one hand, dedicated fields for QC-generated meta-data and specialized queries
and global permissions for senior curators and on the other, to establish a set of metrics to quantify its contents. The
indispensable dataset (ID), completeness and pairedness indices were set. The database contains 1317 cases created as a
result of the eT project and 304 from a previous project, INTERPRET. The number of cases fulfilling the ID was 656.
Completeness and pairedness were heterogeneous, depending on the data type involved.
.............................................................................................................................................................................................................................................................................................
Introduction
Brain tumours afflict a larger percentage of the European
population as life span increases, and in children over 1 year
of age, they are the most common cause of death from
disease. Their characterization using magnetic resonance
imaging (MRI), such as regional extent, oedema and mass
effect, is non-invasive. The achievable Sensitivity and
Specificity with radiological analysis of an MRI study vary
depending on the tumour type and grade (1), and histo-
pathological analysis of a biopsy sample remains the gold
standard for their classification. However, stereotactic brain
biopsy has significant risks, with an estimated morbidity of
2.4–3.5% (2, 3) and a death rate of 0.2–0.8% (2, 4). There
are situations in which repeated biopsies may not be advis-
able or practical, as in brain tumours of children or in aged
patients in a bad physical condition. Hence, there is a need
for improving the non-invasive brain tumour diagnostic
and prognostic characterization (5), to improve patient
management and treatment.
The eTUMOUR (eT) project (Web Accessible MR Decision
Support System for Brain Tumour Diagnosis and Prognosis,
incorporating in vivo and ex vivo Genomic and
Metabolomic Data) was an EU-funded effort (FP6-2002-
LIFESCIHEALTH 503094), carried out from February 2004
to August 2009 (5.5 years), involving 21 partners across
.............................................................................................................................................................................................................................................................................................
� The Author(s) 2012. Published by Oxford University Press.This is an Open Access article distributed under the terms of the Creative Commons Attribution License (http://creativecommons.org/licenses/by-nc/3.0/), which permits non-commercial reuse, distribution, and reproduction in any medium, provided the original work isproperly cited. For commercial re-use, please contact [email protected]. Page 1 of 16
(page number not for citation purposes)
Database, Vol. 2012, Article ID bas035, doi:10.1093/database/bas035.............................................................................................................................................................................................................................................................................................

Europe and Argentina. The aim of the project was to coor-
dinate European scientific expertise in magnetic resonance
spectroscopy (MRS) and genetic analysis to improve tumour
classification and provide health care professionals with a
validated decision support system (DSS) for non-invasive,
MRS-based characterization of brain tumours. The project
built upon expertise obtained with the INTERPRET EU pro-
ject IST-1999-10310 (January 2000–December 2002), which
created an MRS-based DSS for tumour diagnosis (6), and an
associated database (7), which is still accessible to the
medical community. The goal of eT was to bring together
the expertise required to study the genomic and metabo-
lomic characteristics, both in vivo and ex vivo of brain tu-
mours, with a multi-centre collaboration to acquire
statistically significant data and to investigate how meta-
bolomic and genomic profiles relate to diagnosis or to clin-
ically relevant factors such as survival time and treatment
response.
Much of the effort of the project was put in data gather-
ing and database development and annotation. Partners
and countries involved in data acquisition are listed in
Table 1.
In some cases, a single partner could in turn coordinate
data acquisition at several collaborating clinical centres, i.e.
UAB coordinated Institut de Diagnostic per la Imatge,
Centre Bellvitge (IDI-Bellvitge) and Centre Badalona
(IDI-Badalona), IAT/CRC CIM Centre d’Imatge Molecular
del Parc de Recerca Biomedica de Barcelona (PRBB),
Centre Diagnostic Pedralbes (CDP), Hospital Universitari
de Bellvitge, Hospital Germans Trias i Pujol and Hospital
del Mar. Similarly, UVEG coordinated data gathering at
Hospital La Ribera-Alzira, Hospital Quiron Valencia, Insti-
tuto Valenciano Oncologıa, Hospital Clınico Universitario-
Valencia, Hospital Universitario Dr. Peset and Hospital
Universitario La Fe Valencia.
The database was planned to store, in 5 years, data from
about 1000 patients acquired at different countries and
with different MR scanners. To achieve this, the project
had a devoted data ‘workpackage’ (the term used in
European Framework Program jargon), with the following
goals:
� To discuss and agree the consensus acquisition proto-
cols, and to acquire the corresponding data.
� To develop a web-accessible database for standardized
data storage, guaranteeing data privacy, confidentiality
and authenticity.
� To use quality assessment practices to ensure
compliance with ethical aspects (patient consent
forms, data anonymization and local ethics committee
approval).
This article will focus on the description of the method-
ology followed and the challenges met to develop and an-
notate the eT database (eTDB).
Challenges determining thefunctional requirements
The project was set up in a way where the eTDB was the
first stage of the project (Figure 1). The database had to be
functional and contain good-quality data so that pattern
recognition specialists (mathematicians and statisticians)
could download good quality datasets for their experi-
ments, which would in turn result in classifiers to be incor-
porated into the DSS. Functional requirements were
obtained from users (clinicians, spectroscopists and molecu-
lar biologists) according to what would be an ideal way of
organizing and storing the types of information that was
being collected, in accordance to the acquisition protocols
set up for the project, (MR protocols: http://www.etumour.
net/index.php?option=com_content&task=category&sec
tionid=26&id=204&Itemid=181; Clinical protocols:
http://www.etumour.net/index.php?option=com_content&
task=category§ionid=26& id=203&Itemid=183).
Three main challenges were faced. The first one was to
agree on the exact way to store all the data collected. The
second was that the database must allow expert-based
quality control (QC) on the data, to avoid ‘garbage in, gar-
bage out’ in the pattern recognition stage. Mathematicians
had the entire responsibility in classifiers and curators were
only requested to validate results after the classification
studies. In addition, only previous experience on intensive
QC was available from INTERPRET (clinical and SV data) but
no further automated QC tools were available in 2004, e.g.
for high-resolution magic angle spinning (HRMAS).
Therefore, the QC had to be a combination of expert-based
and automated methods for the different data types. As for
the expert-based methods, it was mandatory to incorporate
visualization tools for the raw data, because in MRS, raw
data signals come in the time domain, i.e. signal intensity
versus time, in very specific formats depending on the
manufacturer (Supplementary Table S1). In this context,
visualization implied that MRS raw data had to be pro-
cessed by the eTDB, rendering images of processed spectra
in the frequency domain, which would be the meta-data on
the web-based interface.
The third challenge was first to be able to monitor the
progression in the number and quality of the available data
throughout the project’s development and second to estab-
lish criteria to set up a ‘validated database’ (7), i.e. a ‘quality
dataset’, with which further studies could be undertaken,
similarly to the concept of inclusion criteria of clinical
studies.
Data types
The basic unit in the eTDB is the patient. Five data
types were defined for each patient (Figure 1), i.e. clinical,
in vivo single voxel (SV) MRS, multi-voxel (MV) MRS, MRI
.............................................................................................................................................................................................................................................................................................
Page 2 of 16
Original article Database, Vol. 2012, Article ID bas035, doi:10.1093/database/bas035.............................................................................................................................................................................................................................................................................................

and ex vivo HRMAS and microarray data. The clinical
information was mostly text, although representative
images from the histopathological slides could also be
stored. For the rest of data types, the database contained
both the raw data (Supplementary Table S1) and a set of
specific meta-data. By meta-data, we mean acquisition
parameters, validation-related information and processed
MRS data. The first two were text fields that could be
automatically extracted from raw data, manually uploaded
by curators or automatically calculated by the eTDB.
Processed MRS were txt, jpg or pdf files, depending on
data types.
Figure 1. Overview of the eT project with respect to data. The database is built on the concept of patient and each patient hasdifferent data types.
Table 1. List of partners
Partner (acronym) City Country
Universitat Autonoma de Barcelona (UAB) Cerdanyola del Valles Spain
Hospital Sant Joan de Deu (HSJD) Barcelona Spain
University of Birmingham (UB) Birmingham UK
Fundacion Lucha contra las Enfermedades Neurologicas de la Infancia (FLENI) Buenos Aires Argentina
Cancer Research UK Cambridge Research Institute (CRUK) Cambridge UK
Deutsche Krebsforschungzentrum Heidelberg (DKFZ) Heidelberg Germany
Medical University of Lodz (MUL) Lodz Poland
St Georges’ Hospital and Medical School (SGUL) London UK
University Medical Centre Nijmegen, Radboud University (RU) Nijmegen The Netherlands
University of Nottingham (NOTTI) Nottingham UK
Universidad de Valencia (UVEG) Valencia Spain
.............................................................................................................................................................................................................................................................................................
Page 3 of 16
Database, Vol. 2012, Article ID bas035, doi:10.1093/database/bas035 Original article.............................................................................................................................................................................................................................................................................................

The web-based application and user interface
The eTDB is implemented on an Oracle 10 g Database
Management System server running on a Linux box
(Ubuntu Debian 32-bit). It is based on the three-tier
application model, which is composed by three main com-
ponents: the client (the browser application), the server
(Apache Tomcat 5.5.17) and the database (Oracle 10g).
The graphical user interface (GUI) developed as the
front-end for the eTDB is based on Java Server Pages and
JavaBeans (http://java.sun.com/javase/technologies/desk-
top/javabeans/index.jsp). Additional functionalities, such
as file upload or the interface between the GUI and the
JavaBeans, were implemented using Java servlets (http://
java.sun.com/products/servlet/). All incoming patient data
(in vivo MRS and MRI) from the different manufacturers
were anonymized or de-identified at the time of MRS and
MRI upload with java applets (http://java.sun.com/applets/)
within the system’s web front end. Once the file was read
and parsed through the applet, the fields of interest (e.g.
name, id code, date of birth, sex) found within were
removed and a compressed (zip) file was created on the
curator’s computer. This compressed file was the raw data
subsequently entered into the eTDB. The format, and
therefore the structure, of these files is entirely dependent
on the manufacturer and data type, and until now there is
no standard way of delivering this type of data, despite the
DICOM (Digital Imaging and Communication in Medicine)
standard having been defined for MRS data since 2002
(http://www.dclunie.com/dicom-status/status.html). For this
reason, the anonymization applet within the eTDB pos-
sesses an adaptor for each of the formats encountered
throughout the development of the project
(Supplementary Table S1).
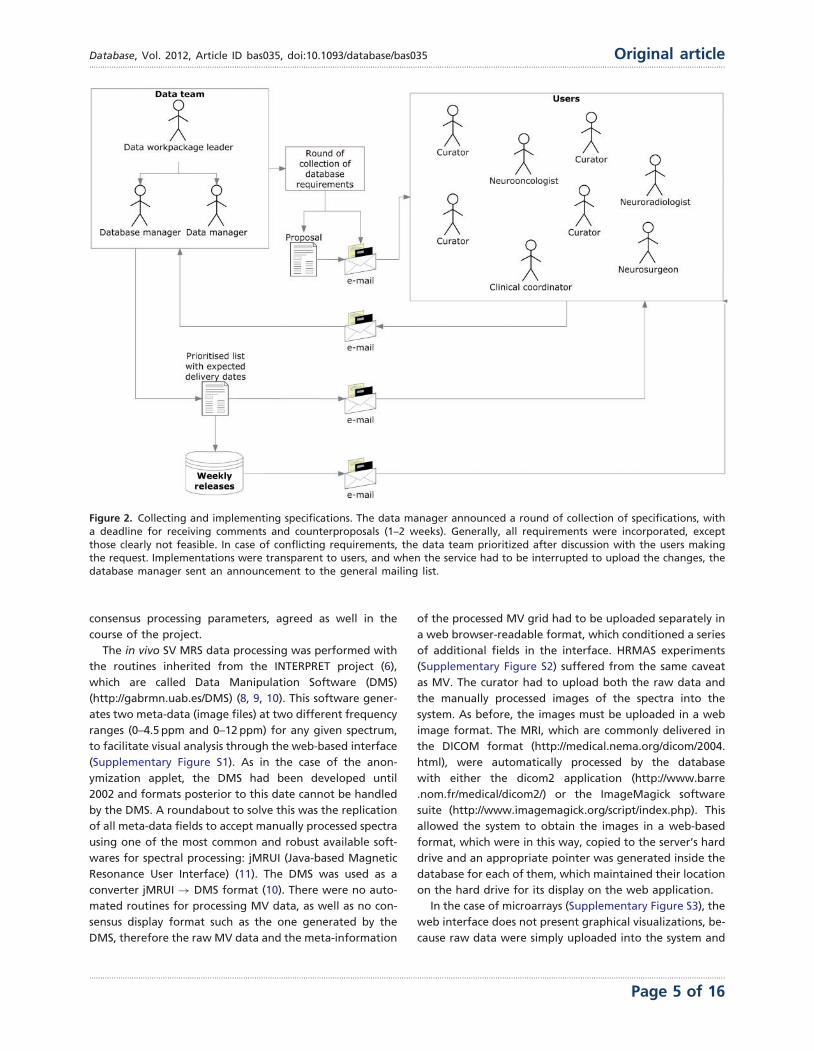
Figure 2 explains the procedure for collecting and
implementing the specifications, which was refined
through the project’s progress and carried out up to the
last quarter of the fifth year, since the complexity of the
requirements increased as the project advanced. Regarding
users, the ‘data team’ refers to the core team that took
over the developments in the database. It included the
database manager, who was also the database program-
mer; the data manager who was also the person commu-
nicating both with the users and the database manager
and the data workpackage leader, who coordinated the
data team.
User roles are summarized in Figure 3. The other roles
allowed in the system were as follows:
� Curator: the basic role of the system and therefore was
applied to most users. It is basically a data uploader,
with edit permissions over the data belonging to the
user’s centre, but no permissions to edit data from
other centres. As a general rule, it was set to enable
viewing the data from all centres.
� Senior curator: this role is meant only for the expert
spectroscopists (ES) or the clinical coordinator. ES are
not allowed to modify clinical data or any type of
raw data on any of the cases on the database, and
although they still belong to one of the centres regis-
tered within the database, ideally they should not be
involved in data entry procedures. This role is the only
one able to see the QC section of the experiments
(clinical or spectroscopic), and the cases and experi-
ments on which the expert is able to edit this section
is determined by a set of permissions that are stored
inside the database, which are retrieved in real time for
adjusting the interface settings and layout.
Aside from the roles, the system has also a set of
embedded permissions, applicable over any kind of user
and has priority over the roles just described. These are:
edit, view, create and download and when enabled, will
allow a user to edit, view, create and download a case
(including all of its sections). They are organized by centres,
which means that if a user is given ‘view’ permission over
centre ‘A’, he/she will be able to view the data from the
cases belonging to centre ‘A’, when originally he/she could
only see the data of his/her centre’s cases. A typical curator
will have all the four types of permissions over the centre
he/she belongs to, although additionally it can have a spe-
cific kind of permission over other centres. For example,
during the project, those researchers involved in carrying
out pattern recognition analysis of the data were able to
download data from all cases in order to analyse them,
therefore having the ‘download’ permission for all centres
in the eTDB.
The eTDB web-based application offers a comprehensive
suite of queries to allow any user to search the cases in the
database by any field. A set of 21 pre-defined queries, the
‘simple queries’ were designed to fulfil the most common
needs of most users with one click. For example, looking for
cases with a specific data type from a given centre, entered
after a certain date. Or, for each ES, which cases have MRS
pending of his/her rating. The ‘advanced queries’ allow
users to establish filtering criteria, as well as selecting
which fields will be presented in the results table.
Visualization
All raw data are available for download in their original
formats, for users with download permissions so that they
can process themselves with the software and parameters
of their choice, because the specific processing of the MRS
can be varied and influences subsequent analysis. However,
to complete the expert-based QC, MRS data had to be pre-
sented to ES in a processed form. This was achieved by
either automated or manual processing which rendered
spectroscopic meta-data in the form of images for web dis-
play in the eTDB interface. The processing relied on
.............................................................................................................................................................................................................................................................................................
Page 4 of 16
Original article Database, Vol. 2012, Article ID bas035, doi:10.1093/database/bas035.............................................................................................................................................................................................................................................................................................
consensus processing parameters, agreed as well in the
course of the project.
The in vivo SV MRS data processing was performed with
the routines inherited from the INTERPRET project (6),
which are called Data Manipulation Software (DMS)
(http://gabrmn.uab.es/DMS) (8, 9, 10). This software gener-
ates two meta-data (image files) at two different frequency
ranges (0–4.5 ppm and 0–12 ppm) for any given spectrum,
to facilitate visual analysis through the web-based interface
(Supplementary Figure S1). As in the case of the anon-
ymization applet, the DMS had been developed until
2002 and formats posterior to this date cannot be handled
by the DMS. A roundabout to solve this was the replication
of all meta-data fields to accept manually processed spectra
using one of the most common and robust available soft-
wares for spectral processing: jMRUI (Java-based Magnetic
Resonance User Interface) (11). The DMS was used as a
converter jMRUI ! DMS format (10). There were no auto-
mated routines for processing MV data, as well as no con-
sensus display format such as the one generated by the
DMS, therefore the raw MV data and the meta-information
of the processed MV grid had to be uploaded separately in
a web browser-readable format, which conditioned a series
of additional fields in the interface. HRMAS experiments
(Supplementary Figure S2) suffered from the same caveat
as MV. The curator had to upload both the raw data and
the manually processed images of the spectra into the
system. As before, the images must be uploaded in a web
image format. The MRI, which are commonly delivered in
the DICOM format (http://medical.nema.org/dicom/2004.
html), were automatically processed by the database
with either the dicom2 application (http://www.barre
.nom.fr/medical/dicom2/) or the ImageMagick software
suite (http://www.imagemagick.org/script/index.php). This
allowed the system to obtain the images in a web-based
format, which were in this way, copied to the server’s hard
drive and an appropriate pointer was generated inside the
database for each of them, which maintained their location
on the hard drive for its display on the web application.
In the case of microarrays (Supplementary Figure S3), the
web interface does not present graphical visualizations, be-
cause raw data were simply uploaded into the system and
Figure 2. Collecting and implementing specifications. The data manager announced a round of collection of specifications, witha deadline for receiving comments and counterproposals (1–2 weeks). Generally, all requirements were incorporated, exceptthose clearly not feasible. In case of conflicting requirements, the data team prioritized after discussion with the users makingthe request. Implementations were transparent to users, and when the service had to be interrupted to upload the changes, thedatabase manager sent an announcement to the general mailing list.
.............................................................................................................................................................................................................................................................................................
Page 5 of 16
Database, Vol. 2012, Article ID bas035, doi:10.1093/database/bas035 Original article.............................................................................................................................................................................................................................................................................................

stored along with the other meta-data that comprised the
experiments’ information.
Curation workflow
Curation was divided into two activities: data entry and
data validation. A workflow is shown in Figure 4.
Data entry was performed by curators, and each centre
could have specific personnel with different areas of ex-
pertise (microarrays, spectroscopy, radiology). In most
cases, the same person that acquired the in vivo data (radi-
ologists) or was responsible of biopsy processing and ana-
lysis (HRMAS or microarrays) was the one who performed
data entry. With respect to clinical information and in vivo
MRS, in most cases, there were support curators (biochem-
ists or biomedical spectroscopists) who performed data
entry in collaboration with radiologists, pathologists or
neurosurgeons.
From the point of view of the system and its interface,
data entry consisted of two main actions performed by the
curator: filling out the meta-data text fields and uploading
the raw data files. In each of the sections of any given case,
there were particular fields to specify the raw data location
on the client machine, which were then processed by exist-
ing meta-data reading or pre-processing pipelines for their
display into the web-based interface.
Validation was set at two levels (Figure 4): (i) QC, in
which the purpose was to establish, for each section, if
the data entered satisfied the standards (from the instru-
mental point of view) set by acquisition protocols; (ii) qual-
ity assessment, in which the purpose was to establish
whether the eTDB entries were the same as source records,
i.e. hospital files.
The QC of all spectroscopy data (SV, MV and HRMAS)
underwent a three-expert system evaluation, and the gen-
eral procedure is illustrated in Figure 5. Each ES was as-
signed to centres different from their own to perform the
QC: this was done to ensure that no expert had seen the
data being evaluated before and that he/she had no pref-
erence on accepting the data for reasons other than its
validity and integrity and that he/she had not been
involved in the process of acquisition or uploading of the
evaluated data. The assignment of centres for evaluation
Figure 3. User roles and their permissions. Permissions to perform the different tasks are stored within the database and arebased on the centre the user belongs to.
.............................................................................................................................................................................................................................................................................................
Page 6 of 16
Original article Database, Vol. 2012, Article ID bas035, doi:10.1093/database/bas035.............................................................................................................................................................................................................................................................................................

Figure 4. Curation workflow. Diagram showing the data entry, the three types of quality control (white circles), quality assuranceand how they relate to different data types and meta-data and to each other.
.............................................................................................................................................................................................................................................................................................
Page 7 of 16
Database, Vol. 2012, Article ID bas035, doi:10.1093/database/bas035 Original article.............................................................................................................................................................................................................................................................................................
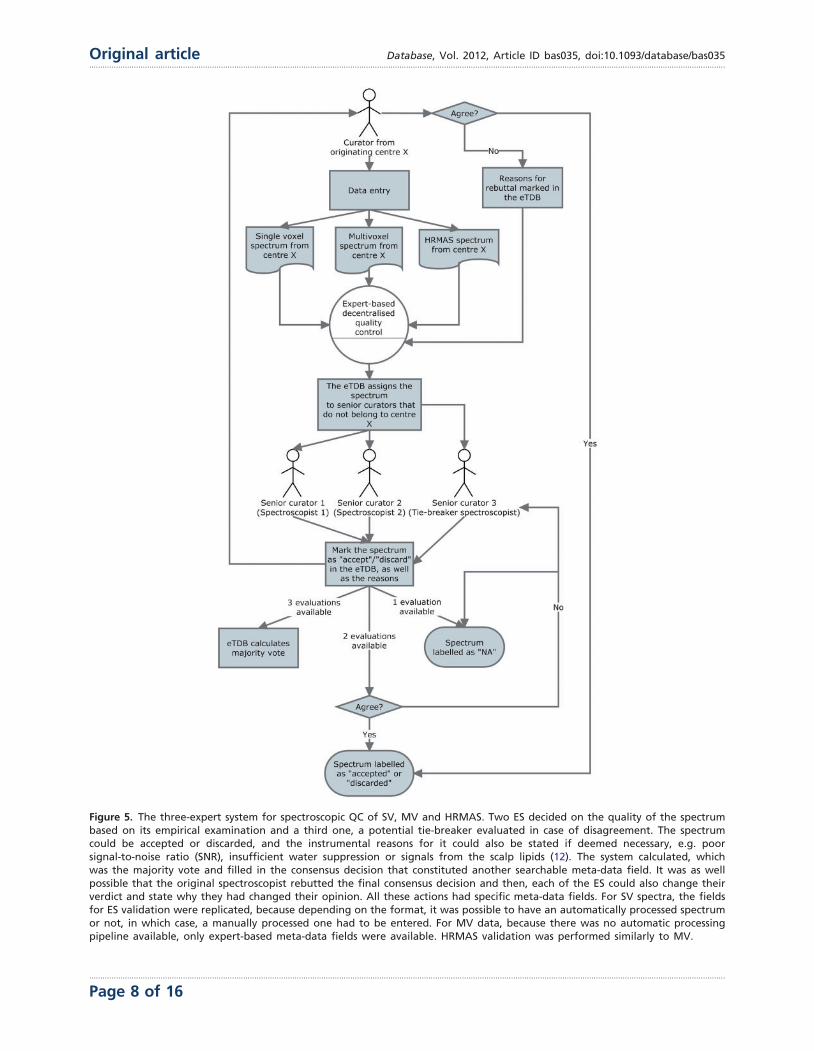
Figure 5. The three-expert system for spectroscopic QC of SV, MV and HRMAS. Two ES decided on the quality of the spectrumbased on its empirical examination and a third one, a potential tie-breaker evaluated in case of disagreement. The spectrumcould be accepted or discarded, and the instrumental reasons for it could also be stated if deemed necessary, e.g. poorsignal-to-noise ratio (SNR), insufficient water suppression or signals from the scalp lipids (12). The system calculated, whichwas the majority vote and filled in the consensus decision that constituted another searchable meta-data field. It was as wellpossible that the original spectroscopist rebutted the final consensus decision and then, each of the ES could also change theirverdict and state why they had changed their opinion. All these actions had specific meta-data fields. For SV spectra, the fieldsfor ES validation were replicated, because depending on the format, it was possible to have an automatically processed spectrumor not, in which case, a manually processed one had to be entered. For MV data, because there was no automatic processingpipeline available, only expert-based meta-data fields were available. HRMAS validation was performed similarly to MV.
.............................................................................................................................................................................................................................................................................................
Page 8 of 16
Original article Database, Vol. 2012, Article ID bas035, doi:10.1093/database/bas035.............................................................................................................................................................................................................................................................................................

was stored into the database for reference by the system,
which consulted this information in real time every instance
an ES logged into the system.
The clinical data validation (CDV) was entirely expert-
based and performed at a central review facility in
Nijmegen, The Netherlands (Figure 6 and Supplementary
Figure S4). It involved not only experts from different med-
ical disciplines (neurosurgeons, radiologists and neuroon-
cologists) to review the MRI and clinical information for
each case, but also a neuropathologists’ panel, to ensure
first, diagnostic certainty (13–16) and second, that the voxel
of the SV and MV study had been positioned according to
protocols, covering the most malignant part of the tumour,
avoiding clear necrosis, oedema or cystic areas (17), and
co-localized with the area from which the subsequent
biopsy had been obtained.
In both situations (ES and clinical coordinator), the system
checked the user’s profile against a table of permissions
stored in the database, setting to visible/not visible or edit-
able/non-editable, the corresponding edit or query fields on
the interface. A set of complex queries, based on the permis-
sions enabled to the user, retrieved all the experiments/cases
pending evaluation and presented the expert with a list of
the pending experiments awaiting evaluation.
The microarray QC was solely based on the text param-
eters associated to five parameters extracted from RPT
Figure 6. Clinical data validation. The review was internally coordinated by a clinical coordinator that collected all the results andentered them into the eTDB. This person was in charge of gathering the results of the clinical meetings, organizing the slidesdistribution among neuropathologists, collecting their diagnoses and entering all this meta-data for all the centres into theeTDB. In this case, the permission schema for this user was that of a senior curator and specifically tailored for this sole purpose.
.............................................................................................................................................................................................................................................................................................
Page 9 of 16
Database, Vol. 2012, Article ID bas035, doi:10.1093/database/bas035 Original article.............................................................................................................................................................................................................................................................................................
(report) files. In this case, a decision rule was implemented
that automatically checked these values for deciding which
microarrays passed the QC and which one did not.
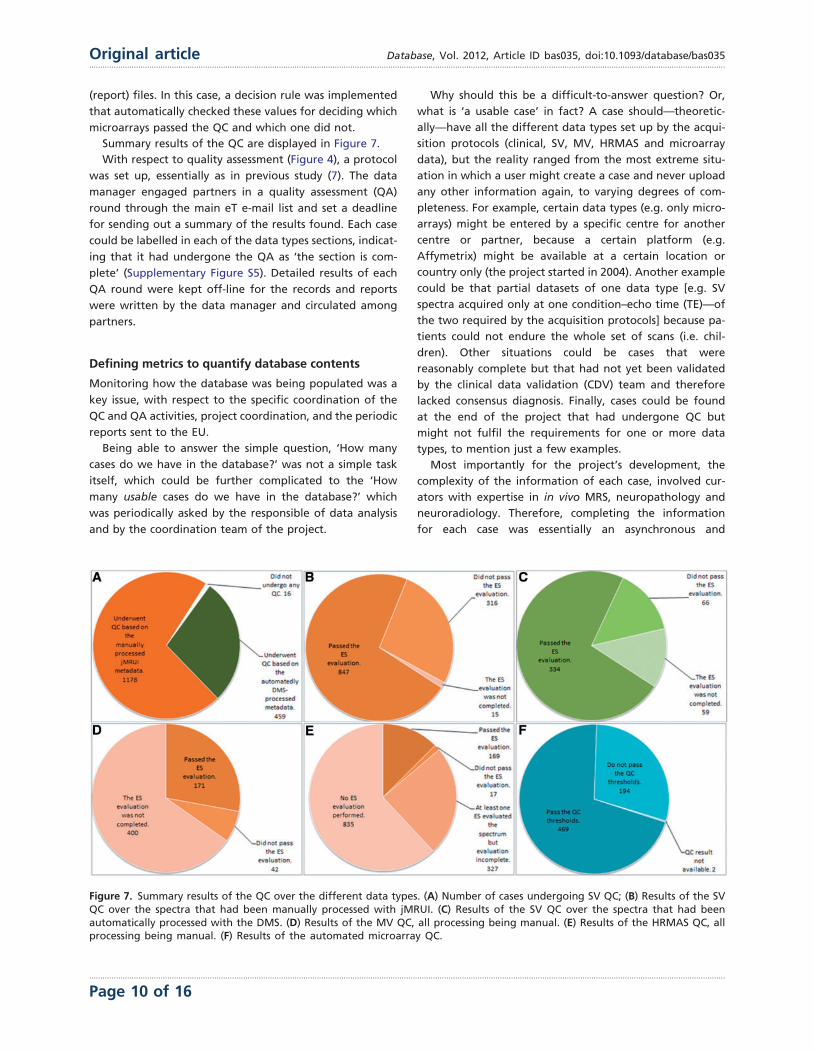
Summary results of the QC are displayed in Figure 7.
With respect to quality assessment (Figure 4), a protocol
was set up, essentially as in previous study (7). The data
manager engaged partners in a quality assessment (QA)
round through the main eT e-mail list and set a deadline
for sending out a summary of the results found. Each case
could be labelled in each of the data types sections, indicat-
ing that it had undergone the QA as ‘the section is com-
plete’ (Supplementary Figure S5). Detailed results of each
QA round were kept off-line for the records and reports
were written by the data manager and circulated among
partners.
Defining metrics to quantify database contents
Monitoring how the database was being populated was a
key issue, with respect to the specific coordination of the
QC and QA activities, project coordination, and the periodic
reports sent to the EU.
Being able to answer the simple question, ‘How many
cases do we have in the database?’ was not a simple task
itself, which could be further complicated to the ‘How
many usable cases do we have in the database?’ which
was periodically asked by the responsible of data analysis
and by the coordination team of the project.
Why should this be a difficult-to-answer question? Or,
what is ‘a usable case’ in fact? A case should—theoretic-
ally—have all the different data types set up by the acqui-
sition protocols (clinical, SV, MV, HRMAS and microarray
data), but the reality ranged from the most extreme situ-
ation in which a user might create a case and never upload
any other information again, to varying degrees of com-
pleteness. For example, certain data types (e.g. only micro-
arrays) might be entered by a specific centre for another
centre or partner, because a certain platform (e.g.
Affymetrix) might be available at a certain location or
country only (the project started in 2004). Another example
could be that partial datasets of one data type [e.g. SV
spectra acquired only at one condition–echo time (TE)—of
the two required by the acquisition protocols] because pa-
tients could not endure the whole set of scans (i.e. chil-
dren). Other situations could be cases that were
reasonably complete but that had not yet been validated
by the clinical data validation (CDV) team and therefore
lacked consensus diagnosis. Finally, cases could be found
at the end of the project that had undergone QC but
might not fulfil the requirements for one or more data
types, to mention just a few examples.
Most importantly for the project’s development, the
complexity of the information of each case, involved cur-
ators with expertise in in vivo MRS, neuropathology and
neuroradiology. Therefore, completing the information
for each case was essentially an asynchronous and
Figure 7. Summary results of the QC over the different data types. (A) Number of cases undergoing SV QC; (B) Results of the SVQC over the spectra that had been manually processed with jMRUI. (C) Results of the SV QC over the spectra that had beenautomatically processed with the DMS. (D) Results of the MV QC, all processing being manual. (E) Results of the HRMAS QC, allprocessing being manual. (F) Results of the automated microarray QC.
.............................................................................................................................................................................................................................................................................................
Page 10 of 16
Original article Database, Vol. 2012, Article ID bas035, doi:10.1093/database/bas035.............................................................................................................................................................................................................................................................................................

team-based process. For example, a spectroscopist working
in a clinical centre specialized in imaging would create a
case in the eTDB, after patient ‘eTnnnn’ had undergone
the MR exam, and the spectroscopist had checked that pa-
tient ‘eTnnnn’ fulfilled the inclusion criteria. Some days or
weeks later, patient ‘eTnnnn’ might be operated in a dif-
ferent hospital in the same geographical area. Personnel at
the University Department in the same partner would peri-
odically collect all biopsy pieces stored in a liquid N2 con-
tainer at the neurosurgery ward of this hospital. After that,
a batch of biopsies would be processed at that University,
and among those, the biopsy from patient ‘eTnnnn’ would
be split in two if the piece was big enough for microarrays
and HRMAS. Different departments (and in some cases,
even different partners, depending on the availability of
Affymetrix platforms with which the microarrays were pro-
cessed) would perform the microarrays and HRMAS and
enter the data into the eTDB once the RNA had been ex-
tracted and the microarray experiment performed.
Sometime later, the whole MRI study would be gathered
at the MR centre and the hospital and unstained biopsy
slides would be collected from the pathology department,
and sent to the central pathology review for validation.
Clinical information would be followed up and the eTDB
updated during the whole project for each patient with
Karnofsky performance scores or survival data. This process
would require the collaboration of a total of four or five
different curators, apart from the clinicians, nurses and lab
technicians involved in the study, but not directly interact-
ing with the eTDB, having the curators edit permissions for
the cases of the corresponding centre/s. Given this degree
of complexity, it was deemed necessary to devise a set of
simple metrics. These follow in the next section.
The indispensable dataset for quantifying usable data
The indispensable dataset (ID) (Figure 8) for each case was
defined as the minimum amount of information that
allowed one case to be usable for the project. This would
happen when the case accomplished on one hand, the val-
idation requirements set up in the QC protocols and on the
other, when it could be used at least in one pattern recog-
nition study, targeting in vivo MRS data-based classification
studies. Fulfilling the ID did not exempt partners from the
obligation to gather as much information as they could
obtain for each case. However, eT aimed for the ideal situ-
ation in which all the information that could be uploaded
in the eTDB was available (ideal dataset) as depicted in
Figure 8.
On the other hand, it was also necessary to quantify the
data entered in the eTDB with respect to the data types,
and how these different data types were related to each
other. In short, it was necessary to monitor whether a part-
ner was uploading a more or less balanced set of data types
for all their cases, or if there was any consistent lack of
certain data types. The formulae in Table 2 account for
this. Note that all indices were defined with respect to
the number of cases with clinical information (NCCI). This
happened because when a case was created, it was auto-
matically searchable by clinical information even if no other
information was filled in. Therefore, the maximum number
of cases in the database was the NCCI. The NCCI is 1621, of
which 304 had been migrated from the INTERPRET vali-
dated database (7) (http://gabrmn.uab.es/interpretvalida
teddb/) through agreement between the two consortia.
Therefore, 1317 cases were created in the eTDB as a
result of the eT project.
Completeness accounted for the degree to which the
different data types populated the database (Table 2).
Balancedness is an indicative mean value for completeness
of the different types and should be interpreted in view of
the completeness values (Table 2). Complete pairedness is
similar to the definition of ‘ideal dataset’ but it is less strin-
gent because it only requires the presence of different data
types and does not require availability of sufficient clinical
information to perform the CDV. Partial pairedness meas-
ures (in vivo, ex vivo, etc.) indicate the percentage of cases
for which two or more data types can be found. Results of
the application of the main indices are shown through
Venn diagrams in Figure 9. It is worth noting here that as
INTERPRET did not gather HRMAS or microarrays, by de-
fault the corresponding 304 cases did not fulfil the com-
plete pairedness standards of eT and the maximum
achievable complete pairedness was 81% (1321 of 1621
cases). The explanation for such a low complete pairedness
was the difficultness in gathering all the data types for each
patient. The cases fulfilling this condition came exclusively
from one participating centre, and correspond to the
15.2% of their cases (26 out of 171).
Discussion
The eT project developed and populated a database, the
eTDB, with multi-centre, multi-dimensional data from 1621
brain tumour patients, with a variable degree of complete-
ness and quality.
The most important question faced in the project, from
the data management point of view was, ‘how many cases
are there in the eTDB?’. A synthetic and potentially unsat-
isfactory answer would be: ‘it depends. . . on which type of
user you are and what you are looking for’. Is the potential
user looking for cases that someone can use? Or for cases
with all possible data types, a specific data type, necessarily
of good quality and a consensus clinical diagnosis? Is the
user familiar with the data types and prefers to make his/
her own selection or is the user a mathematician looking
for a carefully trimmed-off dataset ready for feeding into
the latest machine learning algorithm? Does the user want
to go translational and is looking for a collection with
.............................................................................................................................................................................................................................................................................................
Page 11 of 16
Database, Vol. 2012, Article ID bas035, doi:10.1093/database/bas035 Original article.............................................................................................................................................................................................................................................................................................

Figure 8. Indispensable (top) and ideal (bottom) datasets. For a case to fulfil the indispensable dataset, sufficient clinical infor-mation for performing the CDV had to be available. Sufficient clinical information was defined as the availability of: date ofbirth, sex, date of spectroscopy, at least one radiological classification (‘radiological diagnosis’ in the database), date of biopsy,paraffin section WHO (World Health Organization) classification (18, 19) (originating pathologist), relevant radiodiagnosticimages [a representative T1-weighted image without contrast, a representative T2-weighted image and a representativeimage with voxel position(s) for the SV or the MV MRS]. In addition, the following data types were also needed to completethe indispensable dataset: one pair of MRS SV at short and long TE (except for rare cases such as childhood tumours and adultswith small tumours where one echo time was acceptable), or one MRS MV at short TE, or one MRS MV at long TE, or HRMASdata, or one valid microarray.
.............................................................................................................................................................................................................................................................................................
Page 12 of 16
Original article Database, Vol. 2012, Article ID bas035, doi:10.1093/database/bas035.............................................................................................................................................................................................................................................................................................

multi-dimensional ex vivo/in vivo data? Does the user need
to download ‘everything’?
Setting up a metrics battery served the purpose of quan-
tifying its contents, monitoring the data entry and curation
processes. It might be argued that the application of certain
metrics as inclusion criteria, such as, e.g. the need for CDV
or the availability of the ID, caused the drop in the cases
included with respect to the theoretical maximum of 1621
to 222, by joint probability (several events having to occur
at the same time) and the existence of bottlenecks (one or
several of these events having a low probability). This is a
frequent and down-played situation encountered in almost
any project dealing with data: subsequent application of
inclusion criteria causes a progressive reduction in the
number of cases available, the only difference in eT being
that all potential cases were entered into the database by
default. Similar projects involving the creation of a data-
base have also encountered this: just to mention a couple
of examples, the pilot TCGA research network (20) gath-
ered in 2008, 587 cases, of which only 91 (15%) passed
just four QC criteria, i.e. >80% tumour nuclei in specimens,
<50% necrosis, a secondary pathology assessment and DNA
or RNA of enough quality. Application of a much larger set
of inclusion criteria on a more diverse dataset left a similar
number (222 cases or 13.7%). In the antecedent of eT,
INTERPRET, a dataset containing only in vivo MRS
Figure 9. Venn diagrams of the main metrics defined. Left: number of cases by origin (INTERPRET or prospective eT), withnumbers fulfilling the QC, the CDV and the ID and the intersection of all three. Size of Venn diagrams is proportional to thenumber of cases. Right: different pairedness values (intersections), with completeness for each data type. Values are expressed inpercentage of cases from the total 1621. Size of Venn diagrams is not proportional to percentages.
Table 2. Formulae characterizing the contents of the eTDB
INDEX FORMULA
Completeness (NC data type� 100)/(NCCI)
Balancedness {[(NCSV) + (NCMV) + (NCHRMAS) + (NCMA) + (NCMRI)]� 100}/(NCCI)
Complete pairedness {[(NCSV) AND (NCMV) AND (NCHRMAS) AND (NCMA) AND (NCMRI)]� 100}/(NCCI)
In vivo MRS pairedness [(NCSV) AND (NCMV)� 100]/(NCCI)
Ex vivo pairedness [(NCHRMAS) AND (NCMA)� 100]/(NCCI)
SV and HRMAS pairedness [(NCSV) AND (NCHRMAS)� 100]/(NCCI)
SV and microarrays pairedness [(NCSV) AND (NCMA)� 100]/(NCCI)
MV and HRMAS pairedness [(NCMV) AND (NCHRMAS)� 100]/(NCCI)
MV and microarrays pairedness [(NCMV) AND (NCMA)� 100]/(NCCI)
The subindex indicates the data type. AND is used here as Boolean operator.
NC, number of cases; NCsv, number of cases with SV data; NCMV, number of cases with MV data; NCHRMAS, number of cases with HRMAS
data; NCMA, number of cases with microarrays data.
.............................................................................................................................................................................................................................................................................................
Page 13 of 16
Database, Vol. 2012, Article ID bas035, doi:10.1093/database/bas035 Original article.............................................................................................................................................................................................................................................................................................

(mostly SV) and clinical data, application of inclusion cri-
teria also left 30% of the original cases in the ‘INTERPRET
validated database’ (7).
A validated database has been shown to be extremely
useful, e.g. to test new mathematical algorithms and the
INTERPRET database with its 304 cases provides an example
of this (9, 21–30). As artificial intelligence experts do not
necessarily have the expertise to interpret most of the in-
formation available from a specialized database, a vali-
dated dataset (not even a database) can simplify the task
of evaluating new algorithms. On the other hand, applica-
tion of a different metrics collection might result in a dif-
ferent subset of cases that might be useful in future and
presently unplanned research questions on the same pa-
tient population.
With respect to bottlenecks identified with the metrics,
the most important was fulfilment of the ID; and from the
QC point of view, completing the CDV evaluation. Despite
the large amount of spectra judged individually by two or
even three different persons, the decentralized system
worked well, because most spectra passed QC (Figure 7).
The only problem was when one ES failed to perform the
evaluation of a batch of data (i.e. HRMAS), then that whole
block would remain with incomplete QC, although the in-
dividual evaluations were still recorded and queryable.
Incomplete QC was an issue in the centralized protocol, in
which disagreement among pathologists could exclude a
case from entering the list of those with ID, no matter
how good and/or complete the rest of data associated to
the case are. A similar situation was encountered in the
TCGA glioblastoma pilot (20). It has to be stressed
though, in the context of brain tumours, and more
specifically, of gliomas, this is a widely acknowledged
fact (13–16, 31, 32). Therefore, the take-home message
would be to apply a QC that is as de-centralized and as
automated as possible. Even so, unavoidable bottlenecks
might appear, specific of the area involved (i.e. histopatho-
logical characterization of gliomas), and these should be
identified and minimized as soon as possible with the
help of metrics.
From the technical point of view, a lesson learned
from the experience with the eTDB would be the import-
ance of having proper automated processing and visua-
lization tools available, especially now that molecular
imaging techniques are becoming widespread (33). In
this respect, data standards for properly describing
the data, such as the DICOM structured reporting
(http://www.pixelmed.com/srbook.html), HL7 (http://www.
hl7.org/), DICOM for MRS (http://www.dclunie.com/dicom-
status/status.html), minimum information about a microar-
ray experiment (MIAME) (34, 35) or minimum information
for biological and biomedical investigations (MIBBI) (36),
should provide an adequate starting point for future
design of translational databases. However, in this project,
an important part of data pre-processing and meta-data
extraction had to be accomplished by reverse engineering,
which indeed is not ideal. In this sense, a step forward,
would be to adopt ontologies for the standardization of
data representation and communication among different
sources, enabling an easy integration to other systems.
This option has been already explored in the area of brain
tumour MRS (37), but not in the context of eT and its specific
needs.
The eT project finished in August 2009 and as of 2012,
all personnel specifically hired or involved in the project
are working elsewhere, or funded to do other research.
The database is still maintained ‘gratis et amore’ by a
small team at the Universitat Autonoma de Barcelona
(Spain) and a copy is saved at a server of the Universidad
de Valencia (Spain), both available to those project partici-
pants that acquired the data, each centre being able to
download their own data. Access to other partners is
granted upon negotiation with the uploader partner.
Access to external research groups for downloading the
data was set to be carried out through the project manage-
ment committee (through its former coordinator, Professor
Celda from Universidad de Valencia) and the involved part-
ners that gathered and curated these data. Access with
view-only permissions (http://solaria.uab.es/eTumour/) is
granted after request for a password, to the project man-
agement committee as well.
The accessibility solution chosen, despite not standard
in the biological database area, is used in similar
consortia, such as the dbGAP consortium (38) (http://www
.ncbi.nlm.nih.gov/gap), where data access is carried out
through a data access committee. It is also similar to
the strategy adopted in INTERPRET (7), where the data-
base has been already made accessible to more than 50 re-
search groups to date, with view permissions and to three
research groups with download permission upon request to
the INTERPRET partners, with no applications having been
turned down to date. The only requests to the groups with
download permissions have been: use of data for the pur-
pose stated, no unauthorized transfer to third parties and
acknowledgement to data providers, similarly to dbGAP.
Given the positive experience with the INTERPRET database
and the lack of specific funding, a similar solution to
INTERPRET could be adopted for the eTDB in the future.
All data in the eTDB are anonymized or de-identified,
in accordance to the European Union 95/46/EC directive on
data protection (http://eur-lex.europa.eu/LexUriServ/LexUri
Serv.do?uri=CELEX:31995L0046:EN:NOT) and national regu-
lations of the involved countries, e.g. the Spanish Ley de
Proteccion de Datos (https://www.agpd.es/), differently
for example to other projects such as the TCGA, where the
approach has been to set up two data tiers, one public with
anonymous data and the second tier with non-de-identified
data, subject as well to data transfer agreement.
.............................................................................................................................................................................................................................................................................................
Page 14 of 16
Original article Database, Vol. 2012, Article ID bas035, doi:10.1093/database/bas035.............................................................................................................................................................................................................................................................................................

Conclusion
The eT project gathered a complex dataset of in vivo and
ex vivo data from brain tumour patients, in which QC
checks at many levels were performed to ensure that sub-
sequent statistical analysis was reliable. These checks were
either automated (microarrays) or expert-based (spectros-
copy and clinical information). For the latter, development
of embedded data visualization tools was necessary. The
decentralized system was less prone to generating bottle-
necks limiting the number of data available. The develop-
ment of a set of metrics was key to the proper monitoring
of the eTDB contents.
Acknowledgements
Data gathering and curation is acknowledged for the fol-
lowing partners and persons: Universitat Autonoma de
Barcelona, Cerdanyola del Valles, Spain: Jaume
Capellades, Jesus Pujol, Miriam Camison, Teresa Delgado,
Juana Martın, Milena Acosta, Indira Coronel, Daniel
Valverde, Xavier Castells, Joaquin Arino; Hospital Sant
Joan de Deu, Barcelona, Spain: Antoni Capdevila;
Radboud University, Nijmegen, The Netherlands: Arend
Heerschap, Sandra Sprenger, Jack vanAsten, Jannie
Wijnen, Pieter Wesseling, Albert Idema; St. George’s
University of London, London, UK: Franklyn Howe, Alan
James Wright, Kirstie Opstad, Greg Fellows; Medical
University of Lodz, Lodz, Poland: Witold Gajewicz, Jan
Fortuniak; Fundacion para la Lucha contra las
Enfermedades Neurologicas de la Infancia, Buenos Aires,
Argentina: Jorge Calvar, Horacio Martinetto, Lina Nunez;
Deutsche Krebsforschungzentrum, Heidelberg, Germany:
Peter Bachert, Stefan Kirsch; Birmingham University,
Birmingham, UK: Andrew Peet, Martin Wilson, Nigel
Davies, Jane Crouch, Heather Crosby; The University of
Nottingham, Nottingham, UK: Richard Grundy, Hazel
Rogers; Cancer Research UK Cambridge Research Institute,
Cambridge, UK: John Griffiths, Dominick McIntyre, Mary
McLean, Madhu Basetti.
Funding
The European Union (LSHC-CT-2004-503094). Partial sup-
port also from CIBER-BBN, which is an initiative funded by
the VI National R&D&i Plan 2008–11, CIBER Actions and
financed by the Instituto de Salud Carlos III with assistance
from the European Regional Development Fund and
Ministerio de Ciencia e Innovacion in Spain (PHENOIMA:
SAF2008-03323).
Conflict of interest. None declared.
References1. Julia-Sape,M., Acosta,D., Majos,C. et al. (2006) Comparison be-
tween neuroimaging classifications and histopathological diag-
noses using an international multicenter brain tumor magnetic
resonance imaging database. J. Neurosurg., 105, 6–14.
2. Favre,J., Taha,J.M. and Burchiel,K.J. (2002) An analysis of the re-
spective risks of hematoma formation in 361 consecutive morpho-
logical and functional stereotactic procedures. Neurosurgery, 50,
48–57.
3. Hall,W.A. (1998) The safety and efficacy of stereotactic biopsy for
intracranial lesions. Cancer, 82, 1749–1755.
4. Field,M., Witham,T.F., Flickinger,J.C. et al. (2001) Comprehensive
assessment of hemorrhage risks and outcomes after stereotactic
brain biopsy. J. Neurosurg., 94, 545–551.
5. Diehn,M., Nardini,C., Wang,D.S. et al. (2008) Identification of non-
invasive imaging surrogates for brain tumor gene-expression mod-
ules. Proc. Natl Acad. Sci. USA, 105, 5213–5218.
6. Tate,A.R., Underwood,J., Acosta,D.M. et al. (2006) Development of
a decision support system for diagnosis and grading of brain tu-
mours using in vivo magnetic resonance single voxel spectra. NMR
Biomed., 19, 411–434.
7. Julia-Sape,M., Acosta,D., Mier,M. et al. (2006) A multi-centre,
web-accessible and quality control-checked database of in vivo
MR spectra of brain tumour patients. Magn. Reson. Mater. Phy.,
19, 22–33.
8. Garcia-Gomez,J.M., Tortajada,S., Vidal,C. et al. (2008) The effect of
combining two echo times in automatic brain tumor classification
by MRS. NMR Biomed., 21, 1112–1125.
9. Garcia-Gomez,J.M., Luts,J., Julia-Sape,M. et al. (2009)
Multiproject-multicenter evaluation of automatic brain tumor clas-
sification by magnetic resonance spectroscopy. Magn. Reson.
Mater. Phy., 22, 5–18.
10. Perez-Ruiz,A., Julia-Sape,M., Mercadal,G. et al. (2010)
The INTERPRET Decision-Support System version 3.0 for evaluation
of Magnetic Resonance Spectroscopy data from human brain tu-
mours and other abnormal brain masses. BMC Bioinformatics, 11,
581.
11. Stefan,D., Cesare,F.D., Andrasescu,A. et al. (2009) Quantitation of
magnetic resonance spectroscopy signals: the jMRUI software pack-
age. Measurement Sci. Technol., 20, 104035.
12. Kreis,R. (2004) Issues of spectral quality in clinical 1H-magnetic res-
onance spectroscopy and a gallery of artifacts. NMR Biomed., 17,
361–381.
13. Prayson,R.A., Agamanolis,D.P., Cohen,M.L. et al. (2000)
Interobserver reproducibility among neuropathologists and surgical
pathologists in fibrillary astrocytoma grading. J. Neurol. Sci., 175,
33–39.
14. Coons,S.W., Johnson,P.C., Scheithauer,B.W. et al. (1997) Improving
diagnostic accuracy and interobserver concordance in the classifica-
tion and grading of primary gliomas. Cancer, 79, 1381–1393.
15. Trembath,D., Miller,C.R. and Perry,A. (2008) Gray zones in brain
tumor classification: evolving concepts. Adv. Anat. Pathol., 15,
287–97.
16. Gilles,F.H., Tavare,C.J., Becker,L.E. et al. (2008) Pathologist
interobserver variability of histologic features in childhood brain
tumors: results from the CCG-945 study. Pediatr. Dev. Pathol., 11,
108–117.
17. Ricci,P.E., Pitt,A., Keller,P.J. et al. (2000) Effect of voxel position on
single-voxel MR spectroscopy findings. AJNR Am. J. Neuroradiol.,
21, 367–374.
.............................................................................................................................................................................................................................................................................................
Page 15 of 16
Database, Vol. 2012, Article ID bas035, doi:10.1093/database/bas035 Original article.............................................................................................................................................................................................................................................................................................
18. Kleihues,P. and Cavenee,W.K. (2000) Pathology and Genetics of
Tumours of the Nervous System. IARC Press, Lyon.
19. Louis,D.N., Ohgaki,H., Wiestler,O.D. et al. (2007) The 2007 WHO
classification of tumours of the central nervous system. Acta
Neuropathol., 114, 97–109.
20. Cancer Genome Atlas Research Network. (2008) Comprehensive
genomic characterization defines human glioblastoma genes and
core pathways. Nature, 455, 1061–1068.
21. Fuster-Garcia,E., Navarro,C., Vicente,J. et al. (2011) Compatibility
between 3T 1H SV-MRS data and automatic brain tumour diagnosis
support systems based on databases of 1.5T 1H SV-MRS spectra.
Magn. Reson. Mater. Phy. MAGMA, 24(1), 35–42.
22. Vicente,J., Garcıa-Gomez,J., Tortajada,S. et al. (2009) Age-filtered
MRS classifier to overcome the differences in childhood and adult-
hood brain tumours. In: Proceedings of the 17th Scientific Meeting,
International Society for Magnetic Resonance in Medicine.
Honolulu, p. 981.
23. Vicente,J., Garcıa-Gomez,J., Tortajada,S. et al. (2009) Ranking of
brain tumour classifiers using a Bayesian approach.
In: Cabestany,J., Sandoval,F., Prieto,A. et al. (eds), Bio-Inspired
Systems: Computational and Ambient Intelligence, Vol. 5517.
Berlin/Heidelberg, Springer, pp. 1005–1012.
24. Garcıa-Gomez,J., Epifanio,I., Julia-Sape,M. et al. (2009) Possibilistic
classification of brain tumors by MRS based on functional data
analysis and subpattern discovery. In: Proceedings of the 17th
Scientific Meeting, International Society for Magnetic Resonance
in Medicine. Honolulu, p. 146.
25. Vellido,A., Julia-Sape,M., Romero,E. et al. (2008) Exploratory char-
acterization of outliers in a multi-centre 1H-MRS brain tumour
dataset. In: Lovrek,I., Howlett,R. and Jain,L. (eds), Knowledge-
based Intelligent Information and Engineering Systems, Vol. 5178.
Berlin/Heidelberg, Springer, pp. 189–196.
26. Gonzalez-Navarro,F.F., Belanche-Munoz,L.A., Romero,E. et al.
(2010) Feature and model selection with discriminatory visualiza-
tion for diagnostic classification of brain tumors. Neurocomputing,
73, 622–632.
27. Vellido,A. and Lisboa,P.J. (2006) Handling outliers in brain tumour
MRS data analysis through robust topographic mapping. Comput.
Biol. Med., 36, 1049–1063.
28. Nebot,A., Castro,F., Vellido,A. et al. (2008) Rule-based assistance to
brain tumour diagnosis using LR-FIR. In: Lovrek,I., Howlett,R. and
Jain,L. (eds), Knowledge-based Intelligent Information and
Engineering Systems, Vol. 5178, Vol. Vol. 5178. Berlin/Heidelberg,
Springer, pp. 173–180.
29. Colas,F., Kok,J.N. and Vellido,A. (2010) Finding discriminative
subtypes of aggressive brain tumours using magnetic resonance
spectroscopy. Conf. Proc. IEEE Eng. Med. Biol. Soc., 2010,
1065–1068.
30. Cruz-Barbosa,R. and Vellido,A. (2010) Semi-supervised analysis of
human brain tumours from partially labeled MRS information,
using manifold learning models. Int. J. Neural. Syst., 21, 17–29.
31. Gravendeel,L.A., Kouwenhoven,M.C., Gevaert,O. et al. (2009)
Intrinsic gene expression profiles of gliomas are a better predictor
of survival than histology. Cancer Res., 69, 9065–9072.
32. Giannini,C., Scheithauer,B.W., Weaver,A.L. et al. (2001)
Oligodendrogliomas: reproducibility and prognostic value of histo-
logic diagnosis and grading. J. Neuropathol. Exp. Neurol., 60,
248–262.
33. Glunde,K. and Bhujwalla,Z.M. (2011) Metabolic tumor
imaging using magnetic resonance spectroscopy. Semin. Oncol.,
38, 26–41.
34. Brazma,A., Hingamp,P., Quackenbush,J. et al. (2001) Minimum in-
formation about a microarray experiment (MIAME)-toward stand-
ards for microarray data. Nat. Genet., 29, 365–71.
35. Brazma,A. (2009) Minimum Information About a Microarray
Experiment (MIAME)–successes, failures, challenges. Sci. World J.,
9, 420–923.
36. Taylor,C.F., Field,D., Sansone,S.A. et al. (2008) Promoting
coherent minimum reporting guidelines for biological and bio-
medical investigations: the MIBBI project. Nat. Biotechnol., 26,
889–896.
37. Hu,B., Croitoru,M., Roset,R. et al. (2011) The HealthAgents ontol-
ogy: knowledge representation in a distributed decision support
system for brain tumours. Knowl. Eng. Rev., 26, 303–328.
38. Mailman,M.D., Feolo,M., Jin,Y. et al. (2007) The NCBI dbGaP
database of genotypes and phenotypes. Nat. Genet., 39,
1181–1186.
.............................................................................................................................................................................................................................................................................................
.............................................................................................................................................................................................................................................................................................
Page 16 of 16
Original article Database, Vol. 2012, Article ID bas035, doi:10.1093/database/bas035.............................................................................................................................................................................................................................................................................................


![Ncies%27 Compliance With Small Business Enterprise Expediture Goals for the 1st, 2nd, And 3rd Quaters for Fiscal Year 2011[1]](https://img.pdfslide.net/doc/110x75/577d1fe91a28ab4e1e919851/ncies27-compliance-with-small-business-enterprise-expediture-goals-for-the.jpg)