Embed Size (px)
Citation preview

Int J Clin Exp Med 2019;12(10):12591-12597www.ijcem.com /ISSN:1940-5901/IJCEM0089538
Original ArticleEffect of diagnostic ultrasound at different mechanical indexes on microbubbles
Hongqin Wei1, Jianhua Liu1, Weining Wang2, Chunhua Qiu1, Zhiwen Hu1
1Department of Medical Ultrasound, Guangzhou First People’s Hospital, School of Medicine, South China Univer-sity of Technology, Guangzhou, Guangdong, China; 2Department of School of Electronic and Information Engineer-ing, South China University of Technology, Guangzhou 510006, China
Received December 7, 2018; Accepted September 5, 2019; Epub October 15, 2019; Published October 30, 2019
Abstract: This study investigates the effects of different mechanical indexes (MI) of diagnostic ultrasound (US) on microbubbles in-vitro. ZHIFUXIAN microbubbles were obtained after being inserted into a cellulose tube and exposed to ultrasonic irradiation at different MIs. The US images were captured to analyze the changes in the microbubble concentration. The movement trends of the microbubbles at different MIs were monitored. We found that the microbubbles were not damaged at a low MI. Further, the microbubbles moved with increased MI, and were destroyed as the MI increased to a certain point. At MI<0.20, the microbubble movement rate increased over time. At MI>0.20, the microbubble movement rate increased over time, and some burst. We concluded that microbubble movements follow a certain law of motion at a low MI. Microbubbles are displaced at low MI, and they are distinctly destroyed at a high MI.
Keywords: Ultrasound contrast, microbubbles, microbubble concentration, mechanical index, diagnostic ultra-sound
Introduction
Ultrasonic microbubbles are a kind of contrast agent containing a special gas with a diameter in the range 1-10 µm. Due to the strong scatter-ing characteristics of ultrasonic microbubbles, they are injected into human blood vessels to enhance ultrasonic signals and improve the definition and resolution of the ultrasound images. The microbubbles vibrate due to the intensity of the ultrasound, thus scattering strong ultrasonic signals and enhancing back-scatter signals, which is the most important characteristic of an ultrasound contrast agent. An ultrasound field is created by alternating positive and negative pressure waves. A mechanical index (MI) is defined as the ratio of the negative pressure peak value of an ultra-sound in the relaxation period to the square root of the ultrasonic frequency, which is a measure of the acoustic power of an ultrasound beam [1, 2]. A MI could measure potential bio-mechanical effects, such as the gasification phenomenon generated by an ultrasonic wave and the energy released by the collapse of the
cavitation bubbles. MIs could be used to indi-cate such bio-mechanical effects, which can be depicted numerically for the operators of equip-ment [3, 4]. The interaction of an acoustic field and contrast microbubbles plays a key role in the contrast-enhanced ultrasound imaging pro-cess [5]. Cavitation can be categorized into inertial cavitation and stable cavitation. In sta-ble cavitation, the bubble oscillates periodically with the sound pressure balance where its radi-us is the equilibrium radius. Compared to sta-ble cavitation, inertial cavitation causes the microbubble to collapse violently. Inertial cavi-tation can be induced when the ultrasonic pres-sure reaches a certain threshold value [6]. In stable cavitation, the bubbles vibrate at a high speed, which may cause insignificant biological effects. A contrast-enhanced ultrasound imag-ing system uses harmonic imaging technology with an acoustic pressure >MI of 0.05, and the signal to noise ratio is improved by transmitting a fundamental frequency while receiving the amplified frequency. The contrast microbubbles are known to be destroyed by a diagnostic US at a high MI. The destruction of the microbubbles

Effect of diagnostic ultrasound on microbubbles
12592 Int J Clin Exp Med 2019;12(10):12591-12597
is a major concern not only for its bioeffects, but also for improving the contrast imaging performed by clinicians. Thus, understanding the time-dependent behavior of microbubble destruction is essential [7].
If a liquid containing a microbubble is placed in an acoustic field, the gas-filled bubbles increase in diameter or explode with changes in the acoustic pressure [8]. Thus, in order to use one of the characteristics, it is imperative to under-stand the behavior of the microbubbles at different MIs. A low MI reduces the signal to noise ratio and a low MI imaging (<0.25 MI) reduces the microbubble destruction. A low MI also causes a linear vibration of the microbub-bles, and the frequency of the US reflection is the same as the transmission frequency. The increase in the MI to 0.05 results in the nonlinear expansion and compression of the microbubble, which results in the emission of nonlinear harmonic signals at multiples of the transmitted frequency [9].
Palekar, et al. have reported that microbubbles begin to oscillate and vibrate at a low MI and rupture at a high MI [10]. Apfel and Holland [11] have established that cavitation clearly exists at an of MI>0.5. Other studies [12, 13] demon-strate that microbubbles oscillate in a relatively symmetrical and linear manner at an extremely low MI (0.05-0.1); where the microbubble is more resistant to compression than to expan-sion at a slightly higher MI (0.1-0.3). However, microbubbles are forced to expand and com-press at higher MIs, which results in their destruction at high acoustic pressures (MI>0.3-0.6). Some studies report capillary leakage and extravasations for US exposures at MI>0.4 dur-ing in-vivo tests [14, 15]. At certain ultrasonic pressures or MIs, the microbubbles move and collide with the vascular endothelium [16]. Stewart, et al. [17] have reported that the ultra-sound beam destroys all contrast agents at an MI>1.3, producing a high amount of acoustic energy, which causes an instantaneous explo-sion signal effect. This microbubble rupture is the leading cause of the non-thermal bioeffects of ultrasonography. Clinical ultrasound scan-ners that can display the MI have been pro-posed to evaluate the mechanical biological effects [18]. In the current study, we explore the MI at which the microbubbles begin to burst, particularly in a large lumen, under conditions
that might be relevant to other microbubble studies. Although several cardiac studies and those in other organs have been accomplished, few microbubble studies exist on large cavity organs. Bladder tumors are considered to be the most common tumor in the urinary system, particularly in males [19]; with a high-risk area in the trigone of the bladder. When targeted microbubbles are used for cancer therapy there are some issues such as US microbubbles being suspended [20] and this may cause diffi-culty in achieving a high concentration of micro-bubbles in the target area. Thus, for enhanced therapy in large lacuna organs, an in-depth knowledge of the behavior of microbubbles at different MIs is required. Herein, we have inves-tigated the effect of diagnostic US on the behavior of microbubbles at various MIs.
Materials and methods
Formation of microbubbles
A previously developed lipid-coated microbub-ble (MB) product [21], ZHIFUXIAN was used for the nucleation of the acoustic cavitation, in addition to being a contrast agent for a contrast-enhanced ultrasound (CEUS). ZHIF- UXIAN was prepared by the lyophilization of two lipid suspensions, 1,2-dipalmitoyl-sn-glyce-ro-3-phosphoglycerol (DPPG) and 1,2-distearo-yl-sn-glycero-3-phosphoethanolamine (DSPE), followed by Optison, which is a kind of fat foam, containing sulfur hexafluoride. The aver-age microbubble concentration of Definity is approximately 7×10⁹ bubbles/ml, with a size range of 2-4 μm.
Cellulose tube
The tube was created by the use of both cellu-losic and non-cellulosic materials. The primary wall had a diameter of 4 cm and a length of 10 cm.
Experimental platform
Microsoft Visual Studio 2010, the data analysis software was MATLAB, and the S2000 imaging analysis software was built by the South China University of Technology.
The cellulose tube was injected with approxi-mately 10 ml of distilled water, followed by 0.01 ml of microbubbles. Thus, the concentration of
Effect of diagnostic ultrasound on microbubbles
12593 Int J Clin Exp Med 2019;12(10):12591-12597
microbubbles was similar to that of the con-trast agent in humans. Then, the cellulose tube was fixed in a bracket utilized to maintain sta-bility during the experiment.
The contrast microbubbles were monitored by a commercially available US imaging system (ACUSON S2000, Siemens, Germany) using an L9-4 high-frequency linear array probe (operat-ing in the frequency range of 5-9 MHz). The out-put of the L9-4 imaging probe was character-ized experimentally by the 0.4 mm polyvinylidene difluoride bilaminar membrane hydrophone. In the B-mode, the probe transmits multiple sin-gle-cycle pulses of 12 MHz.
The high-frequency linear array probe was fixed on the cellulose tube and a real-time gray-scale contrast-enhanced US was performed to observe the patterns at different MIs of 0.04, 0.06, 0.11, 0.19, 0.24, 0.30, 0.38, and 0.43. During the experiment, we observed that the microbubbles were destroyed immediately at a high MI (0.38/0.43), and hence, we did not explore the observations at higher MIs. Moreover, at a low MI (0.04), almost no change in the concentration of the microbubbles was noted. Then, the movement of the microbub-bles in the cellulose tube was observed, and video images with a 30 s setting were captured. The other parameters of the machine remained unaltered during imaging, with a 9 MHz trans-ducer frequency, a 4 cm depth of the area of interest, and a 4 cm focus of depth.
The S2000 imaging analysis software was used to analyze the changes in the microbub-bles over a period of time, and it was observed
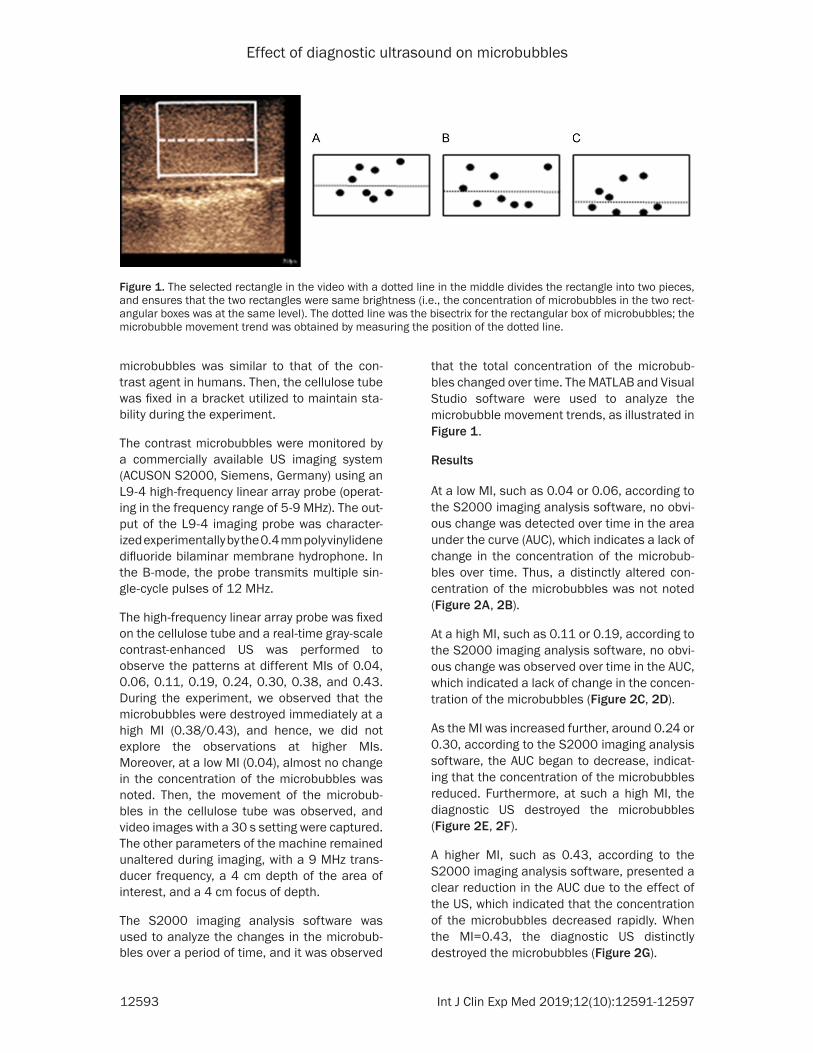
that the total concentration of the microbub-bles changed over time. The MATLAB and Visual Studio software were used to analyze the microbubble movement trends, as illustrated in Figure 1.
Results
At a low MI, such as 0.04 or 0.06, according to the S2000 imaging analysis software, no obvi-ous change was detected over time in the area under the curve (AUC), which indicates a lack of change in the concentration of the microbub-bles over time. Thus, a distinctly altered con-centration of the microbubbles was not noted (Figure 2A, 2B).
At a high MI, such as 0.11 or 0.19, according to the S2000 imaging analysis software, no obvi-ous change was observed over time in the AUC, which indicated a lack of change in the concen-tration of the microbubbles (Figure 2C, 2D).
As the MI was increased further, around 0.24 or 0.30, according to the S2000 imaging analysis software, the AUC began to decrease, indicat-ing that the concentration of the microbubbles reduced. Furthermore, at such a high MI, the diagnostic US destroyed the microbubbles (Figure 2E, 2F).
A higher MI, such as 0.43, according to the S2000 imaging analysis software, presented a clear reduction in the AUC due to the effect of the US, which indicated that the concentration of the microbubbles decreased rapidly. When the MI=0.43, the diagnostic US distinctly destroyed the microbubbles (Figure 2G).
Figure 1. The selected rectangle in the video with a dotted line in the middle divides the rectangle into two pieces, and ensures that the two rectangles were same brightness (i.e., the concentration of microbubbles in the two rect-angular boxes was at the same level). The dotted line was the bisectrix for the rectangular box of microbubbles; the microbubble movement trend was obtained by measuring the position of the dotted line.

Effect of diagnostic ultrasound on microbubbles
12594 Int J Clin Exp Med 2019;12(10):12591-12597
Using the MATLAB data analysis method, at a low MI, such as 0.04 or 0.06, the bisectrix hov-ered near the initial position. The microbubble movement was not obvious at low MIs, which suggests a low rate of microbubble movement (Figure 3A, 3B).
As observed from the MATLAB-based data analysis at a low MI, such as 0.11 or 0.14, the dotted line position clearly changes. γ is observed to be increasing during the process, (Figure 3C, 3D).
At a higher MI such as 0.24 and 0.30, γ increas-es to its maximum value with no further increase, however, it decreases with the in- creasing MI to a certain extent. The microbub-bles have a significant initial movement and are later destroyed (Figure 3E, 3F).
At an even higher mechanical index, such as 0.43, after γ increases to its maximum value, it
reduces for a short period. When the MI increases to a certain level, the microbubble movement is rapid initially, followed by the destruction of the microbubbles (Figure 3G).
Discussion
Some regularity is observed in the influence of a diagnostic US on microbubbles, although, remarkably different effects are observed at different MIs [22, 23]. If a correlation between a diagnostic US at different MIs and US micro-bubbles can be established, it can be used to adjust the MI to achieve adequate ultrasonic imaging conditions. The current study presents some correlations of the effects of diagnostic US. Our results demonstrate that not only do different MIs exert different influences, but there is also a correlation between a diagnostic US at different MIs and US microbubbles. The MATLAB-based analysis demonstrates that the
Figure 2. A. MI=0.04 of the contrast image and AUC, the area of interest and a period by S2000 imaging software was selected, and the total concentration of microbubbles was analyzed, which shows that the AUC does not change significantly with time; B. MI=0.06 image of an angiogram and AUC, the area of interest and a period by S2000 imaging software was selected, and the total concentration of microbubbles was analyzed, which shows that the AUC does not change significantly with time; C. MI=0.11 of the contrast image and AUC, the area of interest and a period by S2000 imaging software was selected, and the total concentration of microbubbles by was analyzed, which shows that the AUC does not change significantly with time; D. MI=0.19 of the contrast image and AUC, the area of interest and a period by S2000 imaging software was selected, and the total concentration of microbubbles was analyzed, which shows that the AUC does not change significantly with time; E. MI=0.24 of the contrast image and AUC, the area of interest and a period by S2000 imaging software was selected, and the total concentration of microbubbles was analyzed, which shows that the AUC began to decrease with time, thereby indicating that the concentration of microbubbles decreased with time; F. MI=0.30 of the contrast image and AUC, the area of interest and a period by S2000 imaging software was selected, and the total concentration of microbubbles was analyzed, which shows that the AUC began to decrease with time, thereby indicating that the concentration of microbubbles decreased with time; G. MI=0.43 of the contrast image and AUC, the area of interest and a period by S2000 imaging software was selected, and the total concentration of microbubbles was analyzed, which shows that the AUC began to decrease with time, thereby indicating that the concentration of microbubbles decreased with time.

Effect of diagnostic ultrasound on microbubbles
12595 Int J Clin Exp Med 2019;12(10):12591-12597
movement speed of the microbubbles is very low, and the velocity within a specific velocity-range exhibits no clear change with time at low MIs. Therefore, a US wave mainly causes micro-bubble movement at low MIs. The echogenicity of the microbubbles was monitored continu-ously by a low-MI B-mode imaging (MI=0.04), until their suspension in PBS, which did not sig-nificantly increase the diffusion rate. Our study at an MI=0.04 did not detect any precise micro-bubble movement, thereby indicating that the movement is achieved at a low rate. Thus, the main effect on the microbubbles is diffusion-driven. Sonne, et al. [24] state that the mecha-nism for microbubble destruction at low MIs can be attributed to two phenomena: cavitation
and acoustically driven diffusion, in which the is expelled from the microbubble during acoustic compression. As the MI increases from 0.11 to 0.19, no significant decrease in the total con-centration of the microbubbles is observed, which indicates that the ultrasonic effect on the microbubbles mainly causes their move-ment at this MI range with the passage of time. The MATLAB software analysis demonstrates that the moving speed of the microbubbles increases with the passage of time, suggesting that the effect of the US on the microbubbles increases with the passage of time. Tyrone, et al. [25] have established that peak rarefaction-al pressures with a concentration greater than at an MI>0.21, result in the rapid destruction of
Figure 3. (A, B) Showing the microbubble movement curve, the horizontal axis shows the time range; the vertical axis shows the bisectrix (dashed line); the blue curve is the dotted line position of the movement curve; red curve is the motion of fitted curve. (A, B) MI=0.04, movement curve in the initial position, the movement is not evident, MI=0.06, a dotted line location is not clear. The wave of the curve shows the vibration of microbubbles. (C, D) The MATLAB-based data analysis at low MI, such as 0.11 and 0.14, the dotted line position has clear changes, γ is seen increasing in the process, and the rate was faster as compared to (A and B); (E, F) At higher MI such as 0.24 and 0.30, γ grows to a maximum and no longer increases, but decreases with MI to a certain extent. The microbubble has a significant initial movement and then is destroyed; (G) At higher mechanical index, such as 0.43, after γ in-creased to the maximum, it is reduced for a short period. When the MI increased to a certain level, the microbubble movement is rapid initially, followed by its destruction.

Effect of diagnostic ultrasound on microbubbles
12596 Int J Clin Exp Med 2019;12(10):12591-12597
the microbubbles. Thomas, et al. [26] showed that microbubble destruction occurs at an MI of 0.1; however, with a slight decrease. In addi-tion, a slight decrease also occurs at an MI=0.2; and only at an MI of 0.3 is there evidence of destruction.
As the MI increases to 0.24 or 0.3, there is a slight decrease in the total concentration of the microbubbles, which indicates that the micro-bubbles are damaged by the US wave. With a modest change in the total concentration of the microbubbles, the main effect of this range of MIs is that it causes movement in the micro-bubbles, without damaging them. The MATLAB analysis demonstrates a high-speed movement of the microbubbles. Subsequently, the speed reduces later, indicating that the effect causes a strong microbubble movement and then dam-ages them. As the MI increases to 0.43, the concentration of the microbubbles reduces sharply initially, demonstrating that the US pri-marily damages the microbubbles. Furthermore, the moving speed of the microbubbles decreas-es rapidly in a short period.
Preliminary analysis results indicate that when the MI<0.20, the microbubbles are mainly driv-en down to the lateral, and as the MI increases, the movement speed increases linearly with the increasing MI. Thus, it can be inferred that when the MI<0.20, the movement of the micro-bubbles reaches a steady state after a period, and then, remains unaltered.
For an MI>0.20, such as 0.24 or 0.30, the con-centration of the microbubbles decreases with the passage of time. The MATLAB-based analy-sis demonstrates that the microbubble speed rate increases dramatically after the turning point. Thus, beyond this point, it can be con-cluded that the microbubbles burst according to the microbubble movement curve. Therefore, we speculate that when the MI is >0.20, the microbubbles move rapidly to the contralat-eral at a high speed, then display a rupture phenomenon.
However, the present experimental system is not designed to mimic in-vivo conditions. Fur- ther, we have not estimated the concentration of the microbubbles, and the study primarily only elucidates the correlation between the microbubble movement and a diagnostic US at different MIs. However, our study emulates large cavity structures to examine the effect of
a diagnostic US on microbubbles within cavity structures in order to provide a theoretical basis for a targeted cancer therapy to large lacuna organs such as the bladder. As it is dif-ficult for suspended microbubbles to accumu-late with a high concentration in the target area, the microbubbles can be driven to the target area at a low MI, thus achieving a high concentration of the microbubbles at the top of the bladder. Thus, when the microbubbles burst, excess energy is released, resulting in an enhanced targeted therapeutic effect.
Conclusion
In summary, our study indicates different mi- crobubble behavior at different MIs. The ultra-sonic effects on the microbubbles mainly ca- use their time-dependent movement at low MIs and their destruction at high MIs, which provides a theoretical basis for their use in treatment of large cavity structures.
Acknowledgements
This study was supported by the Guangdong Special Fund Project of Fundamental and Applied Research, China (No. 2016A0303- 13461) and Guangdong Planned Project of Science and Technology, China (No. 2014- A020212014, 2014A020212374), and the Natural Science Foundation of Guangdong Province (Grant No. 2016A030313461).
Disclosure of conflict of interest
None.
Address correspondence to: Jianhua Liu, Depart- ment of Medical Ultrasound, Guangzhou First Peo- ple’s Hospital, School of Medicine, South China Uni- versity of Technology, No. 1 Panfu Road, Guangzhou 510180, Guangdong, China. Tel: +86-020-810489- 20; Fax: +86-020-81048068; E-mail: [email protected]
References
[1] Goldberg BB, Liu JB and Forsberg F. Ultrasound contrast agents: a review. Ultrasound Med Biol 1994; 20: 319-333.
[2] Şen T, Tüfekçioğlu O and Koza Y. Mechanical index. Anatol J Cardiol 2015; 15: 334-336.
[3] Guidi F, Vos HJ, Mori R, de Jong N and Tortoli P. Microbubble characterization through acousti-

Effect of diagnostic ultrasound on microbubbles
12597 Int J Clin Exp Med 2019;12(10):12591-12597
cally induced deflation. IEEE Trans Ultrason Ferroelectr Freq Control 2010; 57: 193-202.
[4] Ahmadi F and McLoughlin IV. A new mechani-cal index for gauging the human bioeffects of low frequency ultrasound. Conf Proc IEEE Eng Med Biol Soc 2013; 2013: 1964-1967.
[5] Skorb EV, Möhwald H and Andreeva DV. Effect of cavitation bubble collapse on the modifica-tion of solids: crystallization aspects. Langmuir 2016; 32: 11072-11085.
[6] Dicker S, Mleczko M, Siepmann M, Wallace N, Sunny Y, Bawiec CR, Schmitz G, Lewin P and Wrenn SP. Inflence of shell composition on the resonance frequency of microbubble comtrast agents. Ultrasound Med Biol 2013; 39: 1292-1302.
[7] Forsberg F, Shi WT, Merritt CR, Dai Q, Solcova M and Goldberg BB. On the usefulness of the mechanical index displayed on clinical ultra-sound scanners for predicting contrast micro-bubbles destruction. J Ultrasound Med 2005; 24: 443-450.
[8] Miller DL. Overview of experimental studies of biological effects of medical ultrasound caused by gas body activation and inertial cav-itation. Prog Biophys Mol Biol 2007; 93: 314-330.
[9] Dijkmans PA, Juffermans LJ, Musters RJ, van Wamel A, ten Cate FJ, van Gilst W, Visser CA, de Jong N and Kamp O. Microbubbles and ultra-sound: from diagnosis to therapy. Eur J Echo-cardiogr 2004; 5: 245-256.
[10] Palekar-Shaanbag P, Chogale MM, Jog SV and Gaikwad SS. Microbubbles and their applica-tions in pharmaceutical targeting. Curr Drug Deliv 2013; 10: 363-373.
[11] Apfel RE and Holland CK. Gauging the likeli-hood of cavitation from short pulse, low duty cycle diagnostic ultrasound. Ultrasound Med Biol 1991; 17: 179-185.
[12] Majumdar S and Chowdhury S. Novel thera-peutic applications of microbubbles for target-ed drug delivery. Int J Pharm Bio Sci 2010; 1: 1-9.
[13] Hernot S and Klibanov AL. Microbubbles in ul-trasound-triggered drug and gene delivery. Adv Drug Deliv Rev 2008; 60: 1153-1166.
[14] Skyba DM, Price RJ, Linka AZ, Skalak TC and Kaul S. Direct in vivo visualization of intravas-cular destruction of microbubbles by ultra-sound and its local effects on tissue. Circula-tion 1998; 98: 290-293.
[15] Miller DL and Quddus J. Diagnostic ultrasound activation of contrast agent gas bodies induc-es capillary rupture in mice. Proc Natl Acad Sci U S A 2000; 97: 10179-10184.
[16] Ward M, Wu J and Chiu JF. Ultrasound-induced cell lysis and sonoporation enhanced by con-trast agents. J Acoust Soc Am 1999; 105: 2951-2957.
[17] Stewart MJ. Contrast echocardiography. Heart 2003; 89: 342-348.
[18] Merouani S, Hamdaoui O, Rezgui Y and Guem-ini M. Effects of ultrasound frequency and acoustic amplitude on the size of sonochemi-cally active bubbles - theoretical study. Ultra-son Sonochem 2013; 20: 815-819.
[19] Drudi FM, Cantisani V, Liberatore M, Iori F, Er-turk SM, Cristini C, Di Pierro G, D’Ambrosio U, Malpassini F, De Felice C and Di Leo N. Role of low-mechanical index CEUS in the differentia-tion between low and high grade bladder carci-noma: a pilot study. Ultraschall Med 2010; 31: 589-595.
[20] Sternberg CN and Calabró F. Adjuvant chemo-therapy for bladder cancer. Expert Rev Antican-cer Ther 2005; 5: 987-992.
[21] Liu J, Xiao S, Wu S, Ou W, He J, Gao S and Liu Z. Disruption of splenic circulation using micro-bubble-enhanced ultrasound and prothrom-bin: a preliminary study. Ultrasound Med Biol 2012; 38: 1930-1937.
[22] Hilgenfeldt S and Lohse D. The acoustics of di-agnostic microbubbles: dissipative effects and heat deposition. Ultrasonics 2000; 38: 99-104.
[23] Merouani S, Hamdaoui O, Rezgui Y and Guem-ini M. Energy analysis during acoustic bubble oscillations: relationship between bubble en-ergy and sonochemical parameters. Ultrason-ics 2014; 54: 227-232.
[24] Sonne C, Xie F, Lof J, Oberdorfer J, Phillips P, Carr Everbach E and Porter TR. Differences in definity and optison microbubble destruction rates at a similar mechanical index with differ-ent real-time perfusion systems. J Am Soc Echocardiogr 2003; 16: 1178-1185.
[25] Porter TM, Smith DA and Holland CK. Acoustic techniques for assessing the Optison destruc-tion threshold. J Ultrasound Med 2006; 25: 1519-1529.
[26] Porter TR, Oberdorfer J, Rafter P, Lof J and Xie F. Microbubble responses to a similar mechan-ical index with different real-time perfusion im-aging techniques. Ultrasound Med Biol 2003; 29: 1187-1192.