Embed Size (px)
Citation preview
ORIGINAL ARTICLE
Respiratory health and disease in a UKpopulation-based cohort of 85 year olds:The Newcastle 85+ StudyAndrew J Fisher,1,2 Mohammad E Yadegarfar,2,3 Joanna Collerton,2,3 Therese Small,1
Thomas B L Kirkwood,2 Karen Davies,2 Carol Jagger,2,3 Paul A Corris1,2
▸ Additional material ispublished online only. To viewthis file please visit the journalonline (http://dx.doi.org/10.1136/thoraxjnl-2015-207249)
1Department of RespiratoryMedicine, Newcastle UponTyne Hospitals NHS FoundationTrust, Newcastle Upon Tyne,UK2Institute for Ageing,Newcastle University,Newcastle Upon Tyne, UK3Faculty of Medical Sciences,Institute of Health and Society,Newcastle Upon Tyne, UK
Correspondence toProfessor Andrew J Fisher,Faculty of Medical Sciences,Institute for Ageing, NewcastleUniversity, Framlington Place,Newcastle Upon Tyne NE24HH, UK; [email protected]
AJF and MEY contributedequally.
Received 30 April 2015Revised 11 November 2015Accepted 18 November 2015Published Online First5 January 2016
To cite: Fisher AJ,Yadegarfar ME, Collerton J,et al. Thorax 2016;71:255–266.
ABSTRACTBackground People aged 85 years and older are thefastest growing age group worldwide. This studyassessed respiratory health, prevalence of respiratorydisease and use of spirometry in respiratory diagnosis ina population-based cohort of 85 year olds to betterunderstand respiratory health and disease in this sectorof society.Methods A single year birth-cohort of 85 year oldsparticipated in a respiratory assessment at their home orresidential institution including self-reporting ofsymptoms and measurement of spirometry. Generalpractice medical records were reviewed for respiratorydiagnoses and treatments.Findings In the 845 participants, a substantial burdenof respiratory disease was seen with a prevalence ofCOPD in medical records of 16.6% (n=140). A largeproportion of the cohort had environmental exposuresthrough past or current smoking (64.2%, n=539) andoccupational risk factors (33.6%, n=269). Spirometrymeeting reliability criteria was performed in 87%(n=737) of participants. In the subgroup with adiagnosis of COPD (n=123), only 75.6% (n=93)satisfied Global Initiative in Obstructive Lung Disease(GOLD) criteria for airflow obstruction, and in a healthysubgroup without respiratory symptoms or diagnoses(n=151), 44.4% (n=67) reached GOLD criteria forairflow obstruction and 43.3% (n=29) National Instituteof Health and Care Excellence criteria for at leastmoderate COPD.Interpretation Spirometry can be successfullyperformed in the very old, aged 85 years, and may helpidentify respiratory diseases such as COPD. Howeverinterpretation in this age group using current definitionsof COPD based on spirometry indices may be difficultand lead to overdiagnosis in a healthy group withtransient symptoms.
INTRODUCTIONThe very old, aged 85 years and older, are now themost rapidly expanding age sector of most popula-tions worldwide.1 Data from the 2011 England andWales Census showed a doubling of the over 85years age group between 1985 and 2010, fromnearly 0.7 million to over 1.4 million,2 andnumbers are projected to double again between2010 and 2030.3 This age group frequently useshealthcare resource in primary and secondarycare,4 and therefore understanding their health
status and burden of disease is important for train-ing of health professionals and for organisation ofhealthcare provision.Symptoms relating to the respiratory system, in
particular dyspnoea, are common in those 85 yearsand older with a prevalence of over 40%,5 and arefrequently a reason for older people to seek health-care. Although it is recognised that many chronicrespiratory diseases increase in prevalence andseverity with age, it is also clear that dyspnoea isnon-specific and may be associated with non-pulmonary morbidities.6 In the very old, assess-ment of respiratory health is further complicatedby the physiological changes that occur as part of‘normal’ or ‘healthy’ ageing, such as loss of lungelasticity and reduced thoracic cage movement,which will have an effect on objective measures oflung function.7
Current national and international guidelines onthe management of COPD have obstructive spirom-etry (FEV1/FVC ratio <0.7) as a key diagnostic testdirecting physicians towards the use of specific
Open AccessScan to access more
free content
Key messages
What is the key question?▸ What is the burden of respiratory disease and
utility of spirometry in aiding assessment ofrespiratory health and diagnosis of respiratorydisease in community-living 85 year olds in theUK?
What is the bottom line?▸ The study reveals a substantial burden of
respiratory disease and symptoms in 85 yearolds but also considerable discordance betweenphysician-diagnosed COPD and confirmatoryspirometry evidence in the very old that haveimportant implications for clinical practice.
Why read on?▸ This study represents the largest and most
detailed assessment to date of respiratoryhealth status and challenges of usingspirometry criteria in respiratory diagnosis inthe very old, aged 85 years and over, which arenow the fastest growing sector of thepopulation.
Fisher AJ, et al. Thorax 2016;71:255–266. doi:10.1136/thoraxjnl-2015-207249 255
Respiratory epidemiology on A
pril 7, 2022 by guest. Protected by copyright.
http://thorax.bmj.com
/T
horax: first published as 10.1136/thoraxjnl-2015-207249 on 5 January 2016. Dow
nloaded from
on April 7, 2022 by guest. P
rotected by copyright.http://thorax.bm
j.com/
Thorax: first published as 10.1136/thoraxjnl-2015-207249 on 5 January 2016. D
ownloaded from
on A
pril 7, 2022 by guest. Protected by copyright.
http://thorax.bmj.com
/T
horax: first published as 10.1136/thoraxjnl-2015-207249 on 5 January 2016. Dow
nloaded from
on April 7, 2022 by guest. P
rotected by copyright.http://thorax.bm
j.com/
Thorax: first published as 10.1136/thoraxjnl-2015-207249 on 5 January 2016. D
ownloaded from

respiratory medications.8 9 However, the accuracy of lung func-tion criteria for the diagnosis of airflow obstruction or restrictivelung disease in very old people has been questioned due to theintrapulmonary and extrapulmonary physiological changes thatoccur in this age group as part of normal ageing.10 This maycause misdiagnosis and inappropriate use of medications in thispopulation. Moreover, a previous study in a population with amean age of 73 years suggested that COPD may be either over-diagnosed or underdiagnosed depending on the approach takento defining abnormal lung function.11
This study aimed to address the lack of knowledge aboutrespiratory health, prevalence of lung disease and objective mea-sures of lung function in the very old using baseline data fromthe Newcastle 85+ Study,4 12 a large population-based cohortof 85 year olds. Specifically the study aimed to: assess the extentof common respiratory symptoms and the prevalence ofphysician-diagnosed lung disease, particularly COPD; and toassess the accuracy of COPD diagnosis based on lung functionmeasurements, respiratory symptoms and identification of riskfactors, and the degree to which respiratory medication wasappropriately prescribed. Finally, in a healthy reference group(HRG), the study aimed to evaluate the applicability of threestandard methods of interpreting lung function measurementsas normal or abnormal to disentangle the effects of lung diseaseand ‘normal’ or ‘healthy’ ageing on measured lung function.
METHODSFull details of the Newcastle 85+ Study methodology have beenreported.12 In brief, members of the 1921 birth cohort living inNewcastle upon Tyne or North Tyneside (North-East England)were recruited around their 85th birthday over a 17 -month-period spanning 2006 and 2007. Participants includedpeople living at home or in institutional care and regardless oftheir current health status. More detailed methods are availableas online supplementary materials.
Existing diagnoses of respiratory disease, respiratorysymptoms, respiratory medications and environmental riskfactorsCurrent and past respiratory diagnoses were identified from ageneral practice records review (GPRR) using a predeterminedchecklist of chronic respiratory diseases. Data on use, but notdoses, of respiratory medications were also obtained fromGPRR. Data on symptoms of breathlessness, cough, wheeze andsputum production were obtained by a structured questionnaireadministered as part of a domiciliary multidimensional healthassessment (MDHA) conducted by a research nurse in the parti-cipant’s home or institution. Specifically, participants were askedwhether shortness of breath limited their day-to-day activitiesand responses were then used to assign an Medical ResearchCouncil (MRC) dyspnoea score.8 Participants were asked aboutany relevant environmental exposure in their occupation or athome, specifically detailed smoking history and relevant occupa-tional history (including exposure to heavy industry generally aswell as the chemical industry, asbestos and coal mining). Twomeasures of disease burden were used: a disease count(maximum 18 diseases) previously determined in the cohort;and a non-respiratory disease count excluding COPD and otherrespiratory disease (maximum 16 diseases).4 Further details ofthe individual respiratory diagnoses, medications and chronicnon-respiratory diseases included in the disease count are pro-vided (see online supplementary methods).
Lung function measurementsSpirometry and peak flow measurements were performed at theparticipant’s place of residence by a trained research nurse usingMicroLab Spirometer and Spida V.5 software (Micro Medical,Rochester, UK). The aim was to obtain three technically satisfac-tory maximal effort ‘blows’ to generate reproducible FEV1, FVCand peak expiratory flow measurement (PEF); blows wererepeated until this was achieved or maximum effort reached.Blows were assessed for technical adequacy using in-built Spidaalgorithms. All spirometry curves were assessed independently bya respiratory clinical physiologist and those able to produce at leasttwo adequate blows were included in the analysis. If the necessaryquality was lacking they were excluded from analysis. Demispanwas measured as a surrogate for height13 (calculated using stand-ard equations) and height used with age and gender to calculatepredicted values for FEV1, FVC and peak flow using equations inthe UK Department of Health guide.9 Spirometry was classified(see online supplementary table S2) as normal, obstructive orrestrictive based on the FEV1/FVC ratio of 0.7 and the percentageof predicted values for FEV1 and FVC, with obstructive spirom-etry further classified as mild, moderate or severe based on GlobalInitiative in Obstructive Lung Disease (GOLD) criteria.10 In add-ition, we reanalysed the data using criteria presented by the GlobalLung Function Initiative (GLI)14 which provides alternative predic-tion model equations validated for ages 3 years to 95 years (seeonline supplementary tables S3–S5).
Healthy reference groupTo establish the distribution of normal lung function inpeople aged 85 years, we identified a HRG of participantswith no respiratory symptoms, no respiratory diagnoses, nocurrent use of respiratory medications and no non-respiratorydiagnosis which might influence lung function (eg, Parkinson’sdisease, kyphoscoliosis, heart failure, ankylosing spondylitis) intheir GPRR. Those with a BMI >30 were also excluded fromHRG. Lung function in the HRG was compared againstequation derived15 predicted values based on gender andheight by three accepted methods: percentage predictedvalue; lower limit of normal (LLN) using American ThoracicSociety/European Respiratory Society (ATS/ERS) criteria;16
and Z scores.
Statistical methodsGender differences in respiratory symptoms, diagnoses, environ-mental exposures and medications were examined using χ2 andMann-Whitney U tests. Gender differences in lung functionwere investigated in the whole sample, COPD group and theHRG using Mann-Whitney U test for continuous measures, χ2
and Fisher’s exact tests for categorised measures andKruskal-Wallis test for ordered categorised measures. The rela-tionship between FEV1 and PEF scores was assessed usingPearson’s correlation coefficients. Sensitivity analyses werecarried out to examine differences between those included andexcluded from analysis due to lack of spirometry measures andthose with and without an MRC dyspnoea score. All analyseswere conducted using Stata V.12.0 (StataCorp; College Station,Texas, USA).
RESULTSSociodemographic, non-respiratory health characteristicsand environmental exposures of the study populationDetails of the Newcastle 85+ Study population have beenreported previously, and the study population was broadly
256 Fisher AJ, et al. Thorax 2016;71:255–266. doi:10.1136/thoraxjnl-2015-207249
Respiratory epidemiology on A
pril 7, 2022 by guest. Protected by copyright.
http://thorax.bmj.com
/T
horax: first published as 10.1136/thoraxjnl-2015-207249 on 5 January 2016. Dow
nloaded from
sociodemographically representative of the local population,and of England and Wales, including the proportion in institu-tional care.4 Data from MDHA and GPRR was available for845 participants, 58.2% (845/1453) of those eligible (figure 1);their mean (SD) age was 85.5 (0.4) years, 62.3% (526/845)
were female and 99.6% (839/845) were of white ethnic group(table 1). Three-quarters were living in standard housing, 12.8%(108/845) in warden-supported accommodation and 10.2% (86/845) in institutional care. The median (IQR) chronic diseasecount was 5(3–6) with no significant gender difference
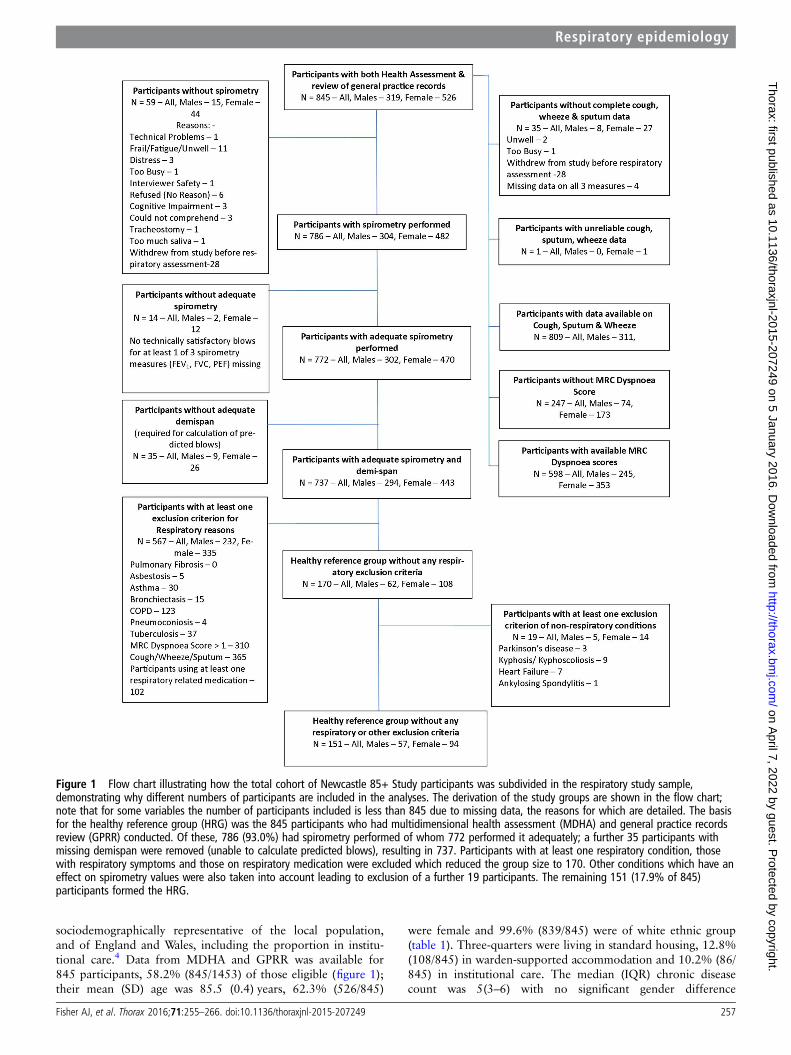
Figure 1 Flow chart illustrating how the total cohort of Newcastle 85+ Study participants was subdivided in the respiratory study sample,demonstrating why different numbers of participants are included in the analyses. The derivation of the study groups are shown in the flow chart;note that for some variables the number of participants included is less than 845 due to missing data, the reasons for which are detailed. The basisfor the healthy reference group (HRG) was the 845 participants who had multidimensional health assessment (MDHA) and general practice recordsreview (GPRR) conducted. Of these, 786 (93.0%) had spirometry performed of whom 772 performed it adequately; a further 35 participants withmissing demispan were removed (unable to calculate predicted blows), resulting in 737. Participants with at least one respiratory condition, thosewith respiratory symptoms and those on respiratory medication were excluded which reduced the group size to 170. Other conditions which have aneffect on spirometry values were also taken into account leading to exclusion of a further 19 participants. The remaining 151 (17.9% of 845)participants formed the HRG.
Fisher AJ, et al. Thorax 2016;71:255–266. doi:10.1136/thoraxjnl-2015-207249 257
Respiratory epidemiology on A
pril 7, 2022 by guest. Protected by copyright.
http://thorax.bmj.com
/T
horax: first published as 10.1136/thoraxjnl-2015-207249 on 5 January 2016. Dow
nloaded from
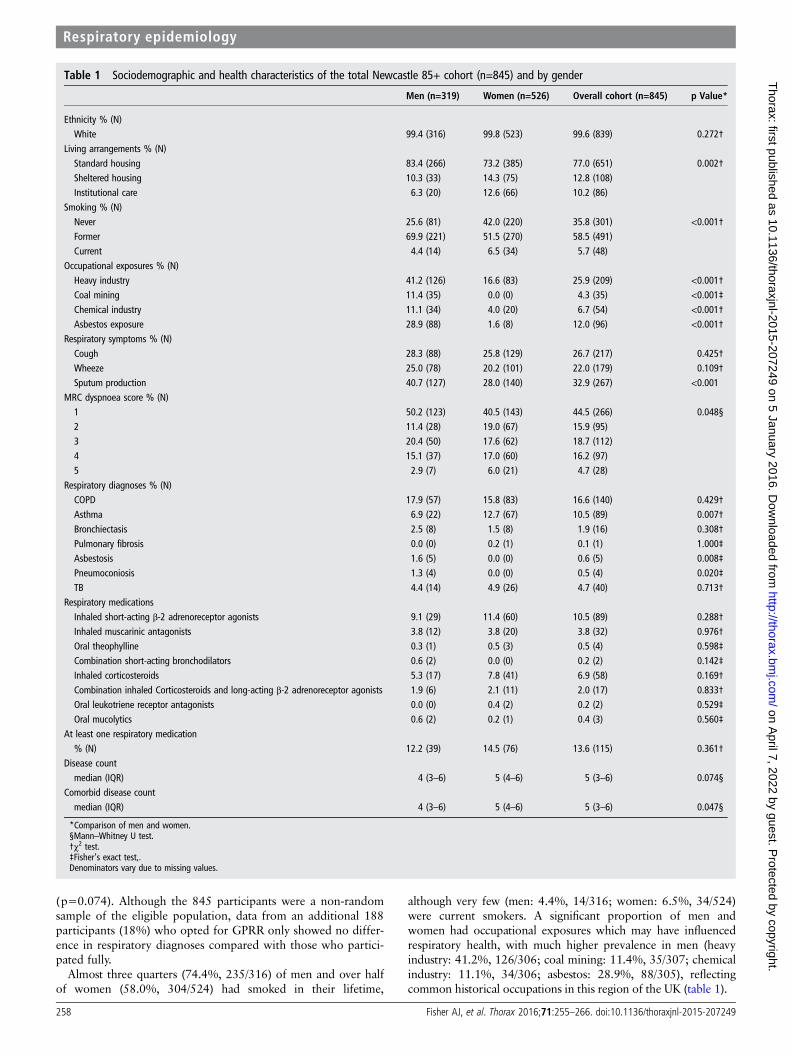
(p=0.074). Although the 845 participants were a non-randomsample of the eligible population, data from an additional 188participants (18%) who opted for GPRR only showed no differ-ence in respiratory diagnoses compared with those who partici-pated fully.
Almost three quarters (74.4%, 235/316) of men and over halfof women (58.0%, 304/524) had smoked in their lifetime,
although very few (men: 4.4%, 14/316; women: 6.5%, 34/524)were current smokers. A significant proportion of men andwomen had occupational exposures which may have influencedrespiratory health, with much higher prevalence in men (heavyindustry: 41.2%, 126/306; coal mining: 11.4%, 35/307; chemicalindustry: 11.1%, 34/306; asbestos: 28.9%, 88/305), reflectingcommon historical occupations in this region of the UK (table 1).
Table 1 Sociodemographic and health characteristics of the total Newcastle 85+ cohort (n=845) and by gender
Men (n=319) Women (n=526) Overall cohort (n=845) p Value*
Ethnicity % (N)White 99.4 (316) 99.8 (523) 99.6 (839) 0.272†
Living arrangements % (N)Standard housing 83.4 (266) 73.2 (385) 77.0 (651) 0.002†Sheltered housing 10.3 (33) 14.3 (75) 12.8 (108)Institutional care 6.3 (20) 12.6 (66) 10.2 (86)
Smoking % (N)Never 25.6 (81) 42.0 (220) 35.8 (301) <0.001†Former 69.9 (221) 51.5 (270) 58.5 (491)Current 4.4 (14) 6.5 (34) 5.7 (48)
Occupational exposures % (N)Heavy industry 41.2 (126) 16.6 (83) 25.9 (209) <0.001†Coal mining 11.4 (35) 0.0 (0) 4.3 (35) <0.001‡Chemical industry 11.1 (34) 4.0 (20) 6.7 (54) <0.001†Asbestos exposure 28.9 (88) 1.6 (8) 12.0 (96) <0.001†
Respiratory symptoms % (N)Cough 28.3 (88) 25.8 (129) 26.7 (217) 0.425†Wheeze 25.0 (78) 20.2 (101) 22.0 (179) 0.109†Sputum production 40.7 (127) 28.0 (140) 32.9 (267) <0.001
MRC dyspnoea score % (N)1 50.2 (123) 40.5 (143) 44.5 (266) 0.048§2 11.4 (28) 19.0 (67) 15.9 (95)3 20.4 (50) 17.6 (62) 18.7 (112)4 15.1 (37) 17.0 (60) 16.2 (97)5 2.9 (7) 6.0 (21) 4.7 (28)
Respiratory diagnoses % (N)COPD 17.9 (57) 15.8 (83) 16.6 (140) 0.429†Asthma 6.9 (22) 12.7 (67) 10.5 (89) 0.007†Bronchiectasis 2.5 (8) 1.5 (8) 1.9 (16) 0.308†Pulmonary fibrosis 0.0 (0) 0.2 (1) 0.1 (1) 1.000‡Asbestosis 1.6 (5) 0.0 (0) 0.6 (5) 0.008‡Pneumoconiosis 1.3 (4) 0.0 (0) 0.5 (4) 0.020‡TB 4.4 (14) 4.9 (26) 4.7 (40) 0.713†
Respiratory medicationsInhaled short-acting β-2 adrenoreceptor agonists 9.1 (29) 11.4 (60) 10.5 (89) 0.288†Inhaled muscarinic antagonists 3.8 (12) 3.8 (20) 3.8 (32) 0.976†Oral theophylline 0.3 (1) 0.5 (3) 0.5 (4) 0.598‡Combination short-acting bronchodilators 0.6 (2) 0.0 (0) 0.2 (2) 0.142‡Inhaled corticosteroids 5.3 (17) 7.8 (41) 6.9 (58) 0.169†Combination inhaled Corticosteroids and long-acting β-2 adrenoreceptor agonists 1.9 (6) 2.1 (11) 2.0 (17) 0.833†Oral leukotriene receptor antagonists 0.0 (0) 0.4 (2) 0.2 (2) 0.529‡Oral mucolytics 0.6 (2) 0.2 (1) 0.4 (3) 0.560‡
At least one respiratory medication% (N) 12.2 (39) 14.5 (76) 13.6 (115) 0.361†
Disease countmedian (IQR) 4 (3–6) 5 (4–6) 5 (3–6) 0.074§
Comorbid disease countmedian (IQR) 4 (3–6) 5 (4–6) 5 (3–6) 0.047§
*Comparison of men and women.§Mann–Whitney U test.†χ2 test.‡Fisher’s exact test,.Denominators vary due to missing values.
258 Fisher AJ, et al. Thorax 2016;71:255–266. doi:10.1136/thoraxjnl-2015-207249
Respiratory epidemiology on A
pril 7, 2022 by guest. Protected by copyright.
http://thorax.bmj.com
/T
horax: first published as 10.1136/thoraxjnl-2015-207249 on 5 January 2016. Dow
nloaded from
Respiratory diagnoses, symptomatology and medication useThe most common physician-diagnosed respiratory conditionwas COPD with a prevalence of 16.6% (140/845) and no sig-nificant gender difference (p=0.43) (table 1). A diagnosis ofasthma had been made in 10.5% (89/845) with a predominancein women (men: 6.9%; women: 12.7%; p=0.007). Otherrespiratory diagnoses were rare.
Chronic cough was self-reported in 26.7% (217/812) andwheeze in 22.0% (179/812) of participants. Regular sputumproduction was more common in men (men: 40.7%, 127/312;women: 28.0%, 140/500; p<0.001). An MRC dyspnoea scorewas assigned in 598 (70.8%) participants since in the other par-ticipants their activity could be limited by other non-respiratoryconditions. Half (123/245) of the men and 40.5% (143/353) ofthe women allocated an MRC dyspnoea score had no limita-tions to their daily activities due to breathlessness.
The most frequently prescribed respiratory medications wereinhaled short-acting β-2 adrenoreceptor agonists (10.5%, 89/845 of participants) followed by inhaled corticosteroids (6.9%,58/845) (table 1). Only 2.0% (17/845) were taking a
combination inhaler containing corticosteroid and a long-actingβ-2 adrenoreceptor agonist. The use of other respiratory medi-cations was unusual (table 1).
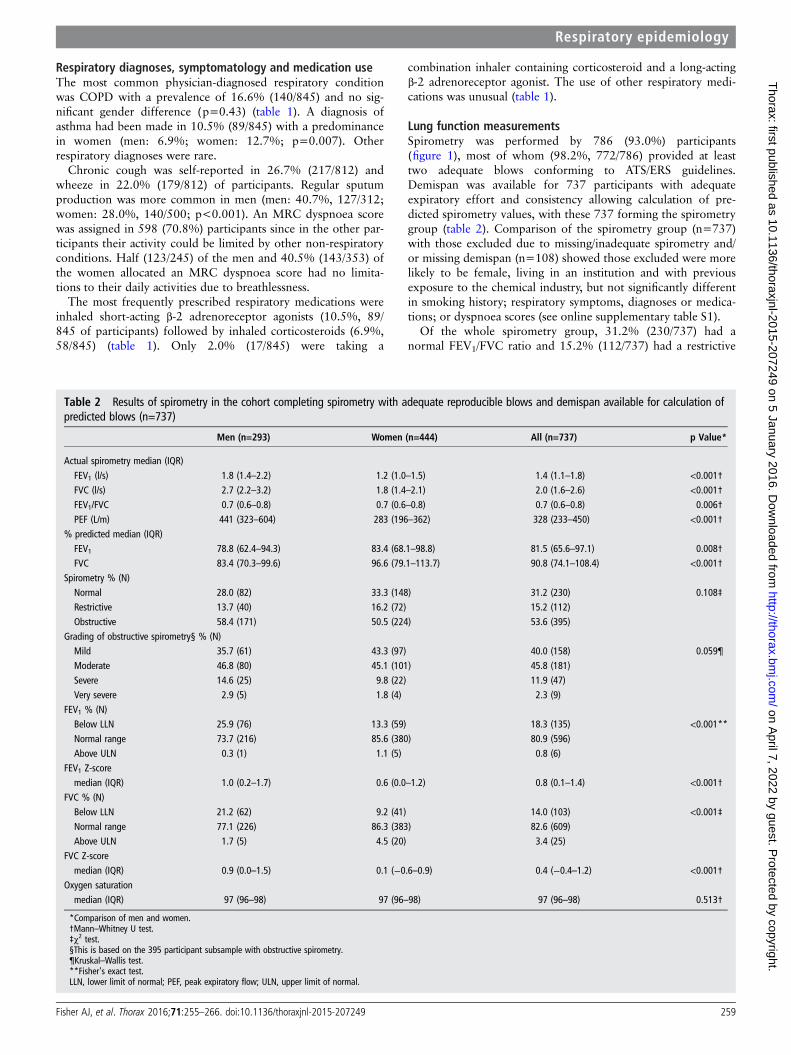
Lung function measurementsSpirometry was performed by 786 (93.0%) participants(figure 1), most of whom (98.2%, 772/786) provided at leasttwo adequate blows conforming to ATS/ERS guidelines.Demispan was available for 737 participants with adequateexpiratory effort and consistency allowing calculation of pre-dicted spirometry values, with these 737 forming the spirometrygroup (table 2). Comparison of the spirometry group (n=737)with those excluded due to missing/inadequate spirometry and/or missing demispan (n=108) showed those excluded were morelikely to be female, living in an institution and with previousexposure to the chemical industry, but not significantly differentin smoking history; respiratory symptoms, diagnoses or medica-tions; or dyspnoea scores (see online supplementary table S1).
Of the whole spirometry group, 31.2% (230/737) had anormal FEV1/FVC ratio and 15.2% (112/737) had a restrictive
Table 2 Results of spirometry in the cohort completing spirometry with adequate reproducible blows and demispan available for calculation ofpredicted blows (n=737)
Men (n=293) Women (n=444) All (n=737) p Value*
Actual spirometry median (IQR)
FEV1 (l/s) 1.8 (1.4–2.2) 1.2 (1.0–1.5) 1.4 (1.1–1.8) <0.001†FVC (l/s) 2.7 (2.2–3.2) 1.8 (1.4–2.1) 2.0 (1.6–2.6) <0.001†FEV1/FVC 0.7 (0.6–0.8) 0.7 (0.6–0.8) 0.7 (0.6–0.8) 0.006†PEF (L/m) 441 (323–604) 283 (196–362) 328 (233–450) <0.001†
% predicted median (IQR)FEV1 78.8 (62.4–94.3) 83.4 (68.1–98.8) 81.5 (65.6–97.1) 0.008†FVC 83.4 (70.3–99.6) 96.6 (79.1–113.7) 90.8 (74.1–108.4) <0.001†
Spirometry % (N)Normal 28.0 (82) 33.3 (148) 31.2 (230) 0.108‡Restrictive 13.7 (40) 16.2 (72) 15.2 (112)Obstructive 58.4 (171) 50.5 (224) 53.6 (395)
Grading of obstructive spirometry§ % (N)Mild 35.7 (61) 43.3 (97) 40.0 (158) 0.059¶Moderate 46.8 (80) 45.1 (101) 45.8 (181)Severe 14.6 (25) 9.8 (22) 11.9 (47)Very severe 2.9 (5) 1.8 (4) 2.3 (9)
FEV1 % (N)Below LLN 25.9 (76) 13.3 (59) 18.3 (135) <0.001**Normal range 73.7 (216) 85.6 (380) 80.9 (596)Above ULN 0.3 (1) 1.1 (5) 0.8 (6)
FEV1 Z-scoremedian (IQR) 1.0 (0.2–1.7) 0.6 (0.0–1.2) 0.8 (0.1–1.4) <0.001†
FVC % (N)Below LLN 21.2 (62) 9.2 (41) 14.0 (103) <0.001‡Normal range 77.1 (226) 86.3 (383) 82.6 (609)Above ULN 1.7 (5) 4.5 (20) 3.4 (25)
FVC Z-scoremedian (IQR) 0.9 (0.0–1.5) 0.1 (−0.6–0.9) 0.4 (−0.4–1.2) <0.001†
Oxygen saturationmedian (IQR) 97 (96–98) 97 (96–98) 97 (96–98) 0.513†
*Comparison of men and women.†Mann–Whitney U test.‡χ2 test.§This is based on the 395 participant subsample with obstructive spirometry.¶Kruskal–Wallis test.**Fisher’s exact test.LLN, lower limit of normal; PEF, peak expiratory flow; ULN, upper limit of normal.
Fisher AJ, et al. Thorax 2016;71:255–266. doi:10.1136/thoraxjnl-2015-207249 259
Respiratory epidemiology on A
pril 7, 2022 by guest. Protected by copyright.
http://thorax.bmj.com
/T
horax: first published as 10.1136/thoraxjnl-2015-207249 on 5 January 2016. Dow
nloaded from

Figure 2 Distribution curves of FEV1 and FVC in all participants in spirometry cohort (all, men and women) measured (blue) and predicted (green).
Figure 3 Scatter plots of spirometry and peak expiratory flow in all participants in spirometry cohort.
260 Fisher AJ, et al. Thorax 2016;71:255–266. doi:10.1136/thoraxjnl-2015-207249
Respiratory epidemiology on A
pril 7, 2022 by guest. Protected by copyright.
http://thorax.bmj.com
/T
horax: first published as 10.1136/thoraxjnl-2015-207249 on 5 January 2016. Dow
nloaded from
pattern. Obstructive spirometry was the most common finding(men: 58.4%, 171/293; women: 50.5%, 224/444) but with nogender difference in the spread of severity (table 2). Measuredvalues of FEV1, FVC and PEF in the spirometry group werenormally distributed but with a much wider distribution rangethan that of the predicted values (figure 2). Scatter plots of themeasured FEV1 and FVC against the predicted values showedmore participants with measured values below the predictedvalues than above suggesting a downward shift in the populationas a whole (figure 3). The spread of FEV1 measurements aroundthe predicted values was much wider in men than women.
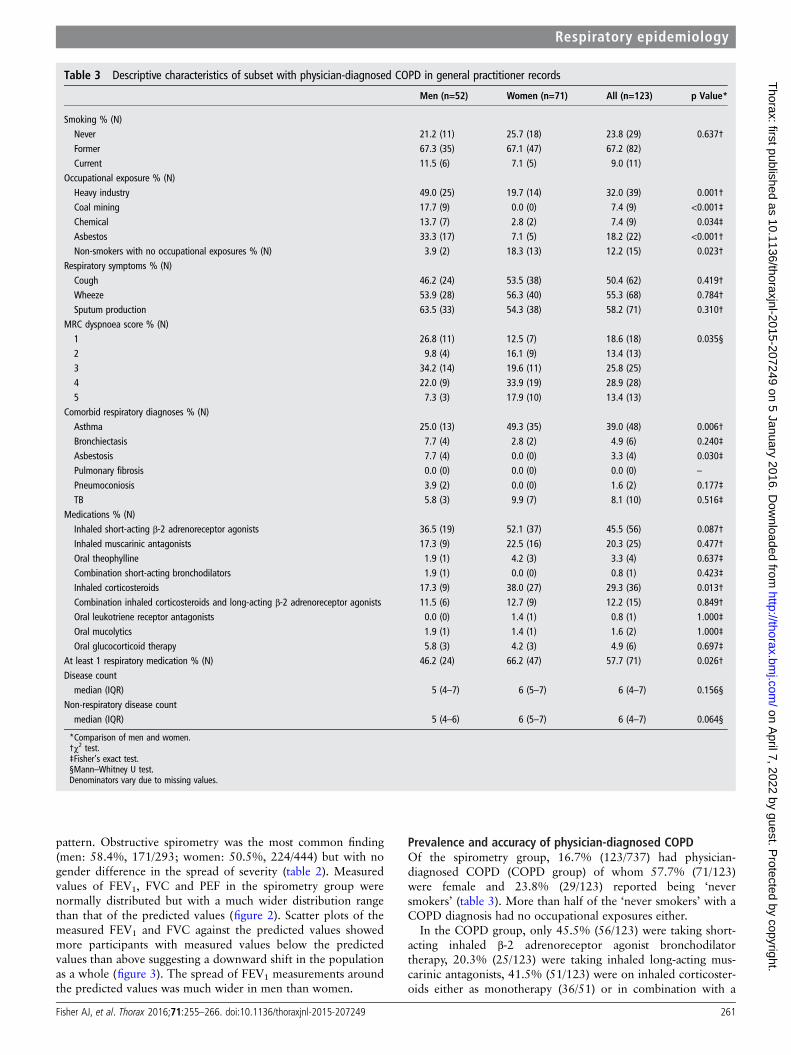
Prevalence and accuracy of physician-diagnosed COPDOf the spirometry group, 16.7% (123/737) had physician-diagnosed COPD (COPD group) of whom 57.7% (71/123)were female and 23.8% (29/123) reported being ‘neversmokers’ (table 3). More than half of the ‘never smokers’ with aCOPD diagnosis had no occupational exposures either.
In the COPD group, only 45.5% (56/123) were taking short-acting inhaled β-2 adrenoreceptor agonist bronchodilatortherapy, 20.3% (25/123) were taking inhaled long-acting mus-carinic antagonists, 41.5% (51/123) were on inhaled corticoster-oids either as monotherapy (36/51) or in combination with a
Table 3 Descriptive characteristics of subset with physician-diagnosed COPD in general practitioner records
Men (n=52) Women (n=71) All (n=123) p Value*
Smoking % (N)Never 21.2 (11) 25.7 (18) 23.8 (29) 0.637†Former 67.3 (35) 67.1 (47) 67.2 (82)Current 11.5 (6) 7.1 (5) 9.0 (11)
Occupational exposure % (N)Heavy industry 49.0 (25) 19.7 (14) 32.0 (39) 0.001†Coal mining 17.7 (9) 0.0 (0) 7.4 (9) <0.001‡Chemical 13.7 (7) 2.8 (2) 7.4 (9) 0.034‡Asbestos 33.3 (17) 7.1 (5) 18.2 (22) <0.001†Non-smokers with no occupational exposures % (N) 3.9 (2) 18.3 (13) 12.2 (15) 0.023†
Respiratory symptoms % (N)Cough 46.2 (24) 53.5 (38) 50.4 (62) 0.419†Wheeze 53.9 (28) 56.3 (40) 55.3 (68) 0.784†Sputum production 63.5 (33) 54.3 (38) 58.2 (71) 0.310†
MRC dyspnoea score % (N)1 26.8 (11) 12.5 (7) 18.6 (18) 0.035§2 9.8 (4) 16.1 (9) 13.4 (13)3 34.2 (14) 19.6 (11) 25.8 (25)4 22.0 (9) 33.9 (19) 28.9 (28)5 7.3 (3) 17.9 (10) 13.4 (13)
Comorbid respiratory diagnoses % (N)Asthma 25.0 (13) 49.3 (35) 39.0 (48) 0.006†Bronchiectasis 7.7 (4) 2.8 (2) 4.9 (6) 0.240‡Asbestosis 7.7 (4) 0.0 (0) 3.3 (4) 0.030‡Pulmonary fibrosis 0.0 (0) 0.0 (0) 0.0 (0) –
Pneumoconiosis 3.9 (2) 0.0 (0) 1.6 (2) 0.177‡TB 5.8 (3) 9.9 (7) 8.1 (10) 0.516‡
Medications % (N)Inhaled short-acting β-2 adrenoreceptor agonists 36.5 (19) 52.1 (37) 45.5 (56) 0.087†Inhaled muscarinic antagonists 17.3 (9) 22.5 (16) 20.3 (25) 0.477†Oral theophylline 1.9 (1) 4.2 (3) 3.3 (4) 0.637‡Combination short-acting bronchodilators 1.9 (1) 0.0 (0) 0.8 (1) 0.423‡Inhaled corticosteroids 17.3 (9) 38.0 (27) 29.3 (36) 0.013†Combination inhaled corticosteroids and long-acting β-2 adrenoreceptor agonists 11.5 (6) 12.7 (9) 12.2 (15) 0.849†Oral leukotriene receptor antagonists 0.0 (0) 1.4 (1) 0.8 (1) 1.000‡Oral mucolytics 1.9 (1) 1.4 (1) 1.6 (2) 1.000‡Oral glucocorticoid therapy 5.8 (3) 4.2 (3) 4.9 (6) 0.697‡
At least 1 respiratory medication % (N) 46.2 (24) 66.2 (47) 57.7 (71) 0.026†Disease count
median (IQR) 5 (4–7) 6 (5–7) 6 (4–7) 0.156§Non-respiratory disease count
median (IQR) 5 (4–6) 6 (5–7) 6 (4–7) 0.064§
*Comparison of men and women.†χ2 test.‡Fisher’s exact test.§Mann–Whitney U test.Denominators vary due to missing values.
Fisher AJ, et al. Thorax 2016;71:255–266. doi:10.1136/thoraxjnl-2015-207249 261
Respiratory epidemiology on A
pril 7, 2022 by guest. Protected by copyright.
http://thorax.bmj.com
/T
horax: first published as 10.1136/thoraxjnl-2015-207249 on 5 January 2016. Dow
nloaded from
long-acting β-agonist (15/51). There was minimal use of theo-phylline preparations, oral mucolytics or oral leukotriene recep-tor antagonists and none of the COPD group used homeoxygen (table 3). The proportion of the COPD group that wereon at least one respiratory medication differed significantlybetween men and women (men: 46.2%, 24/52; women: 66.2%,47/71; p=0.026), although a sizeable proportion (42.3%, 52/123) of those with a COPD diagnosis were not on any (table 3).There was a significant overlap in the diagnoses of asthma andCOPD with 61% (48/78) of those with an asthma diagnosis alsobeing diagnosed with COPD.
Respiratory symptoms were common but not universal in theCOPD group with 50.4% (62/123) reporting cough and 58.2%(71/123) sputum production. Nevertheless 26.8% (11/52) ofmen and 12.5% (7/71) of women with a COPD diagnosis hadonly minimal breathlessness (MRC dyspnoea score=1).
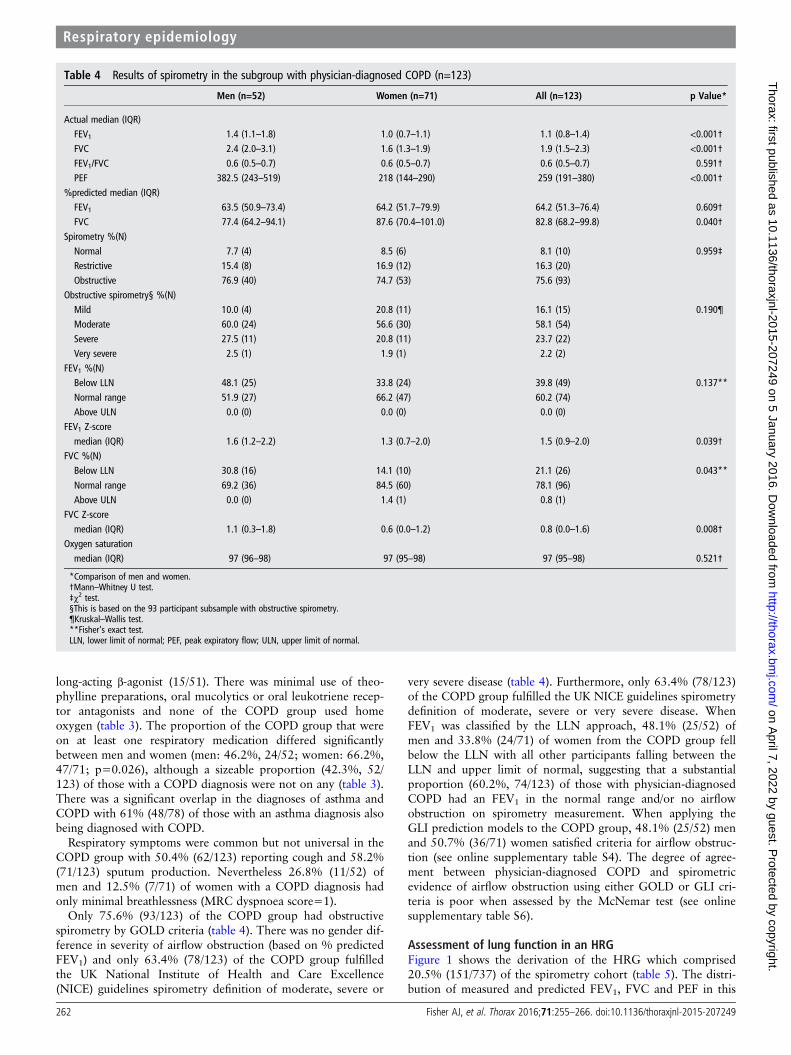
Only 75.6% (93/123) of the COPD group had obstructivespirometry by GOLD criteria (table 4). There was no gender dif-ference in severity of airflow obstruction (based on % predictedFEV1) and only 63.4% (78/123) of the COPD group fulfilledthe UK National Institute of Health and Care Excellence(NICE) guidelines spirometry definition of moderate, severe or
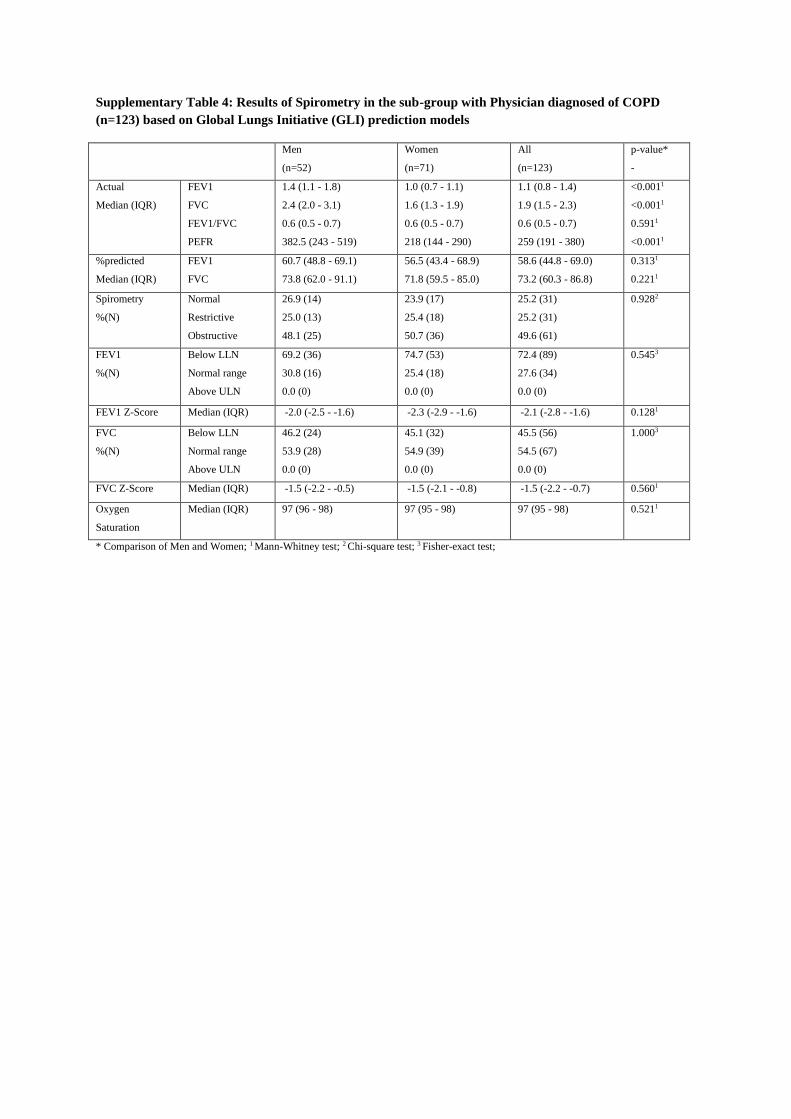
very severe disease (table 4). Furthermore, only 63.4% (78/123)of the COPD group fulfilled the UK NICE guidelines spirometrydefinition of moderate, severe or very severe disease. WhenFEV1 was classified by the LLN approach, 48.1% (25/52) ofmen and 33.8% (24/71) of women from the COPD group fellbelow the LLN with all other participants falling between theLLN and upper limit of normal, suggesting that a substantialproportion (60.2%, 74/123) of those with physician-diagnosedCOPD had an FEV1 in the normal range and/or no airflowobstruction on spirometry measurement. When applying theGLI prediction models to the COPD group, 48.1% (25/52) menand 50.7% (36/71) women satisfied criteria for airflow obstruc-tion (see online supplementary table S4). The degree of agree-ment between physician-diagnosed COPD and spirometricevidence of airflow obstruction using either GOLD or GLI cri-teria is poor when assessed by the McNemar test (see onlinesupplementary table S6).
Assessment of lung function in an HRGFigure 1 shows the derivation of the HRG which comprised20.5% (151/737) of the spirometry cohort (table 5). The distri-bution of measured and predicted FEV1, FVC and PEF in this
Table 4 Results of spirometry in the subgroup with physician-diagnosed COPD (n=123)
Men (n=52) Women (n=71) All (n=123) p Value*
Actual median (IQR)FEV1 1.4 (1.1–1.8) 1.0 (0.7–1.1) 1.1 (0.8–1.4) <0.001†FVC 2.4 (2.0–3.1) 1.6 (1.3–1.9) 1.9 (1.5–2.3) <0.001†FEV1/FVC 0.6 (0.5–0.7) 0.6 (0.5–0.7) 0.6 (0.5–0.7) 0.591†PEF 382.5 (243–519) 218 (144–290) 259 (191–380) <0.001†
%predicted median (IQR)FEV1 63.5 (50.9–73.4) 64.2 (51.7–79.9) 64.2 (51.3–76.4) 0.609†FVC 77.4 (64.2–94.1) 87.6 (70.4–101.0) 82.8 (68.2–99.8) 0.040†
Spirometry %(N)Normal 7.7 (4) 8.5 (6) 8.1 (10) 0.959‡Restrictive 15.4 (8) 16.9 (12) 16.3 (20)Obstructive 76.9 (40) 74.7 (53) 75.6 (93)
Obstructive spirometry§ %(N)Mild 10.0 (4) 20.8 (11) 16.1 (15) 0.190¶Moderate 60.0 (24) 56.6 (30) 58.1 (54)Severe 27.5 (11) 20.8 (11) 23.7 (22)Very severe 2.5 (1) 1.9 (1) 2.2 (2)
FEV1 %(N)Below LLN 48.1 (25) 33.8 (24) 39.8 (49) 0.137**Normal range 51.9 (27) 66.2 (47) 60.2 (74)Above ULN 0.0 (0) 0.0 (0) 0.0 (0)
FEV1 Z-scoremedian (IQR) 1.6 (1.2–2.2) 1.3 (0.7–2.0) 1.5 (0.9–2.0) 0.039†
FVC %(N)Below LLN 30.8 (16) 14.1 (10) 21.1 (26) 0.043**
Normal range 69.2 (36) 84.5 (60) 78.1 (96)Above ULN 0.0 (0) 1.4 (1) 0.8 (1)
FVC Z-scoremedian (IQR) 1.1 (0.3–1.8) 0.6 (0.0–1.2) 0.8 (0.0–1.6) 0.008†
Oxygen saturationmedian (IQR) 97 (96–98) 97 (95–98) 97 (95–98) 0.521†
*Comparison of men and women.†Mann–Whitney U test.‡χ2 test.§This is based on the 93 participant subsample with obstructive spirometry.¶Kruskal–Wallis test.**Fisher’s exact test.LLN, lower limit of normal; PEF, peak expiratory flow; ULN, upper limit of normal.
262 Fisher AJ, et al. Thorax 2016;71:255–266. doi:10.1136/thoraxjnl-2015-207249
Respiratory epidemiology on A
pril 7, 2022 by guest. Protected by copyright.
http://thorax.bmj.com
/T
horax: first published as 10.1136/thoraxjnl-2015-207249 on 5 January 2016. Dow
nloaded from
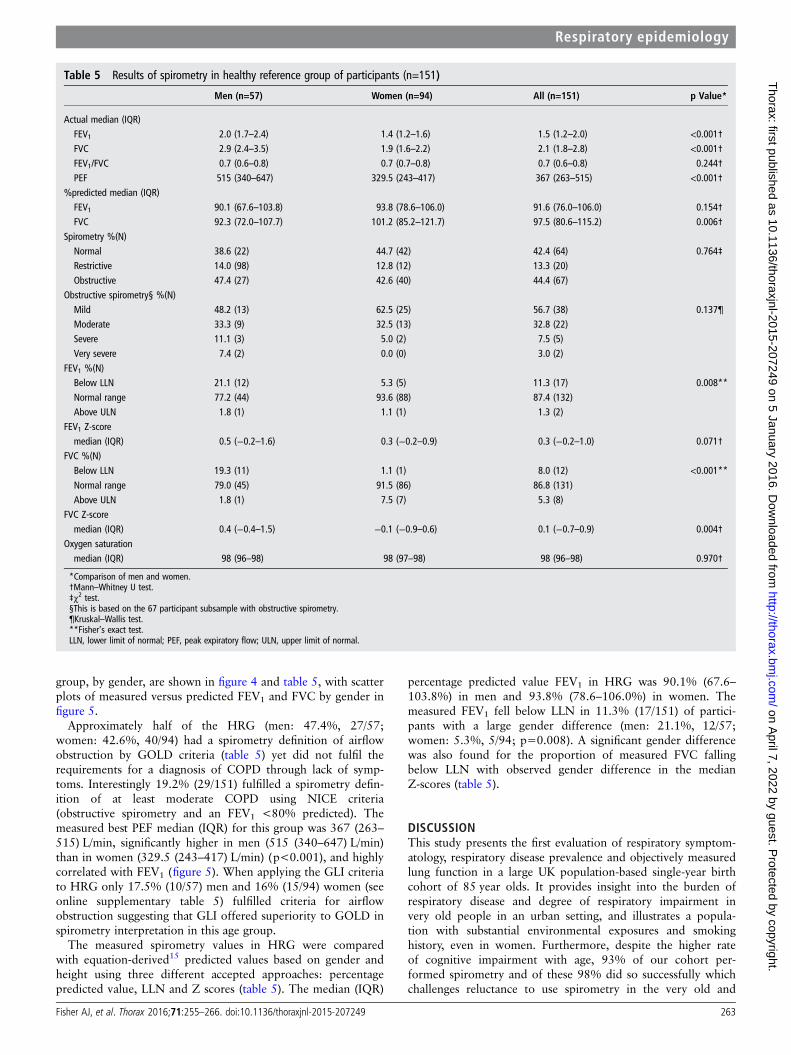
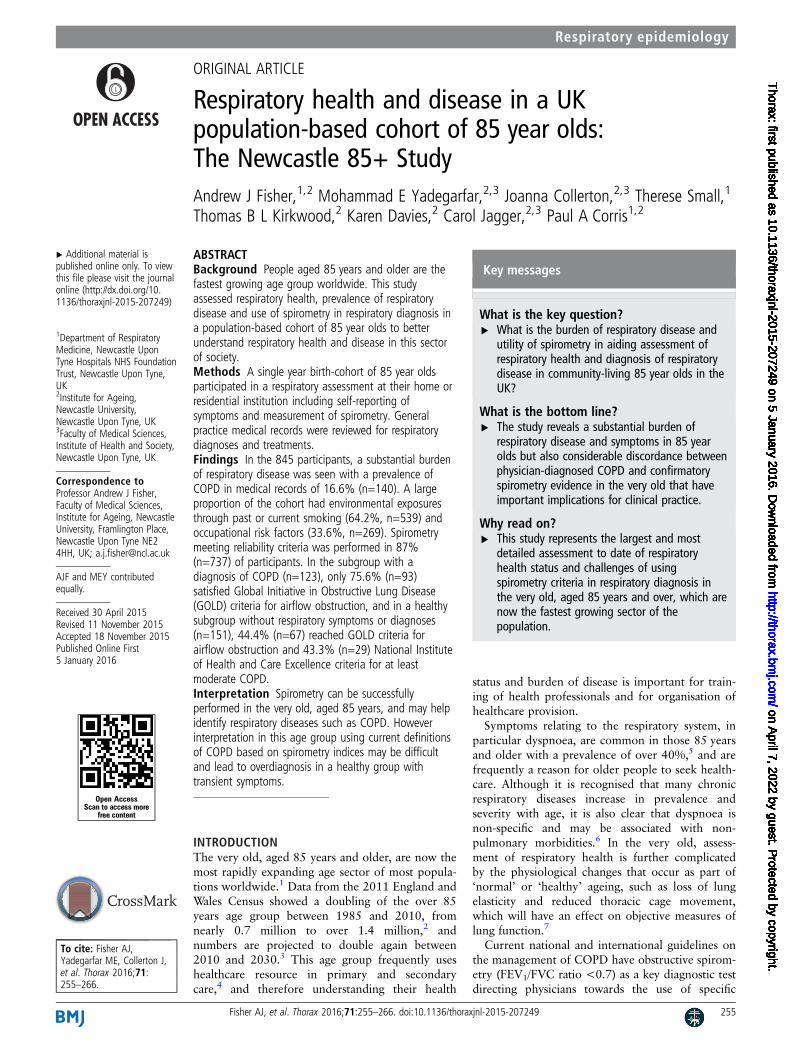
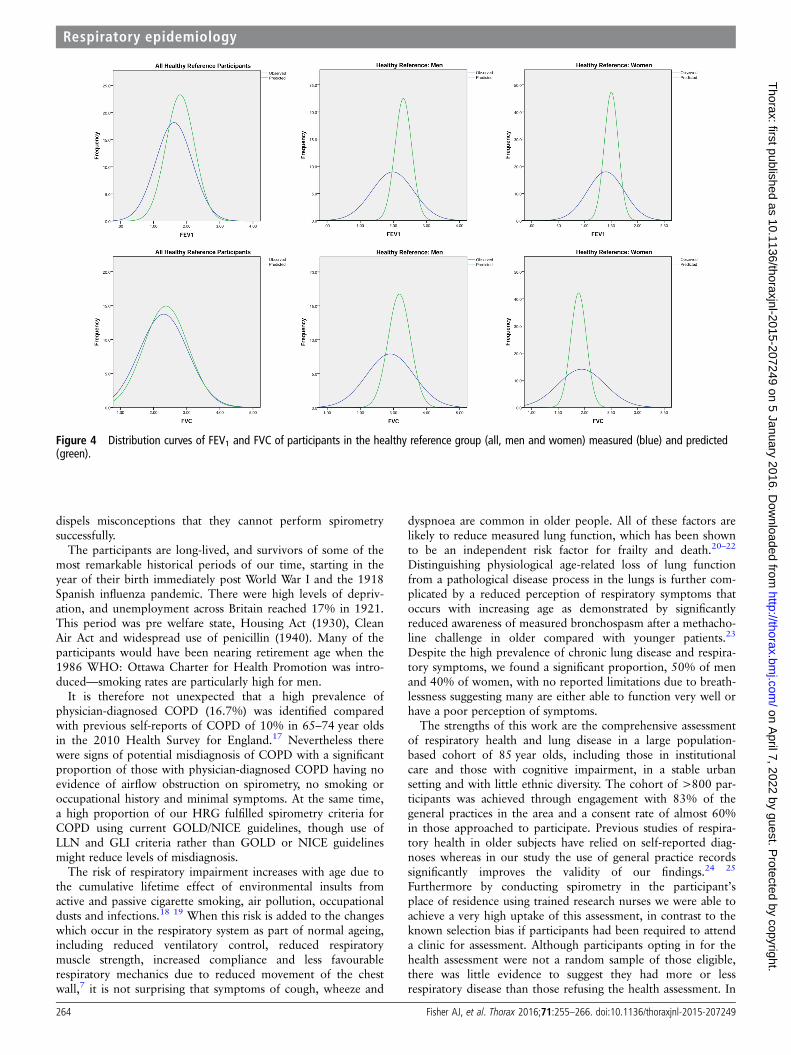
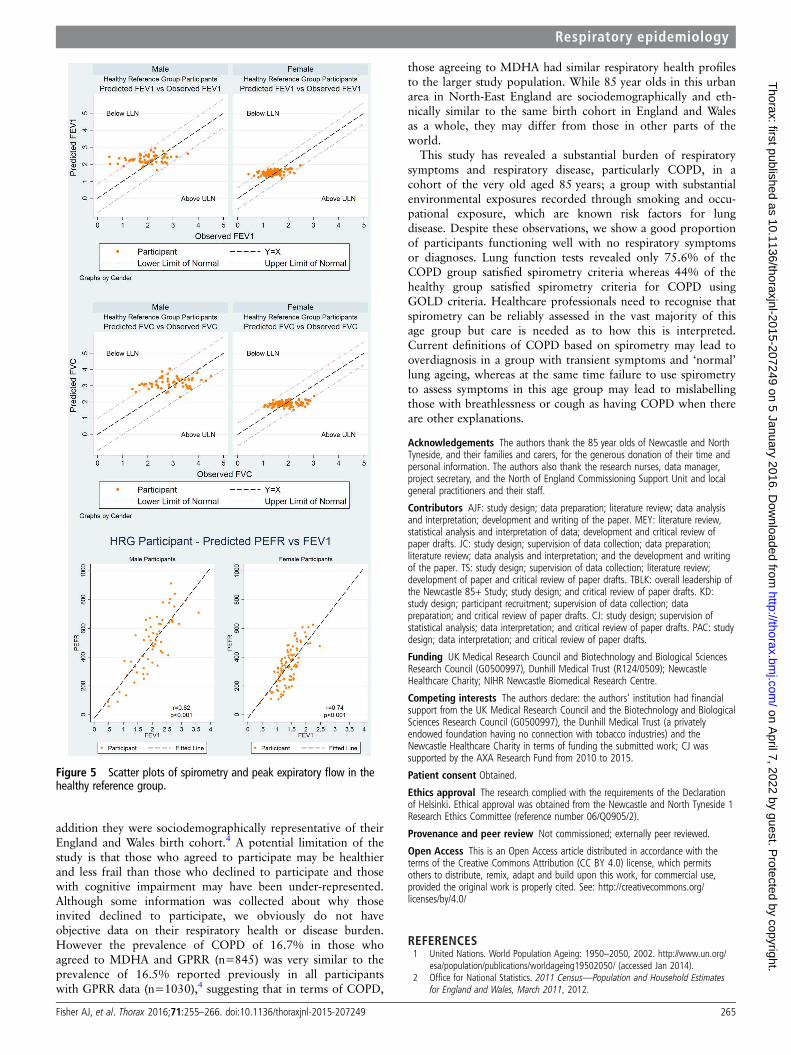
group, by gender, are shown in figure 4 and table 5, with scatterplots of measured versus predicted FEV1 and FVC by gender infigure 5.
Approximately half of the HRG (men: 47.4%, 27/57;women: 42.6%, 40/94) had a spirometry definition of airflowobstruction by GOLD criteria (table 5) yet did not fulfil therequirements for a diagnosis of COPD through lack of symp-toms. Interestingly 19.2% (29/151) fulfilled a spirometry defin-ition of at least moderate COPD using NICE criteria(obstructive spirometry and an FEV1 <80% predicted). Themeasured best PEF median (IQR) for this group was 367 (263–515) L/min, significantly higher in men (515 (340–647) L/min)than in women (329.5 (243–417) L/min) (p<0.001), and highlycorrelated with FEV1 (figure 5). When applying the GLI criteriato HRG only 17.5% (10/57) men and 16% (15/94) women (seeonline supplementary table 5) fulfilled criteria for airflowobstruction suggesting that GLI offered superiority to GOLD inspirometry interpretation in this age group.
The measured spirometry values in HRG were comparedwith equation-derived15 predicted values based on gender andheight using three different accepted approaches: percentagepredicted value, LLN and Z scores (table 5). The median (IQR)
percentage predicted value FEV1 in HRG was 90.1% (67.6–103.8%) in men and 93.8% (78.6–106.0%) in women. Themeasured FEV1 fell below LLN in 11.3% (17/151) of partici-pants with a large gender difference (men: 21.1%, 12/57;women: 5.3%, 5/94; p=0.008). A significant gender differencewas also found for the proportion of measured FVC fallingbelow LLN with observed gender difference in the medianZ-scores (table 5).
DISCUSSIONThis study presents the first evaluation of respiratory symptom-atology, respiratory disease prevalence and objectively measuredlung function in a large UK population-based single-year birthcohort of 85 year olds. It provides insight into the burden ofrespiratory disease and degree of respiratory impairment invery old people in an urban setting, and illustrates a popula-tion with substantial environmental exposures and smokinghistory, even in women. Furthermore, despite the higher rateof cognitive impairment with age, 93% of our cohort per-formed spirometry and of these 98% did so successfully whichchallenges reluctance to use spirometry in the very old and
Table 5 Results of spirometry in healthy reference group of participants (n=151)
Men (n=57) Women (n=94) All (n=151) p Value*
Actual median (IQR)FEV1 2.0 (1.7–2.4) 1.4 (1.2–1.6) 1.5 (1.2–2.0) <0.001†FVC 2.9 (2.4–3.5) 1.9 (1.6–2.2) 2.1 (1.8–2.8) <0.001†FEV1/FVC 0.7 (0.6–0.8) 0.7 (0.7–0.8) 0.7 (0.6–0.8) 0.244†PEF 515 (340–647) 329.5 (243–417) 367 (263–515) <0.001†
%predicted median (IQR)FEV1 90.1 (67.6–103.8) 93.8 (78.6–106.0) 91.6 (76.0–106.0) 0.154†FVC 92.3 (72.0–107.7) 101.2 (85.2–121.7) 97.5 (80.6–115.2) 0.006†
Spirometry %(N)Normal 38.6 (22) 44.7 (42) 42.4 (64) 0.764‡Restrictive 14.0 (98) 12.8 (12) 13.3 (20)Obstructive 47.4 (27) 42.6 (40) 44.4 (67)
Obstructive spirometry§ %(N)Mild 48.2 (13) 62.5 (25) 56.7 (38) 0.137¶Moderate 33.3 (9) 32.5 (13) 32.8 (22)Severe 11.1 (3) 5.0 (2) 7.5 (5)Very severe 7.4 (2) 0.0 (0) 3.0 (2)
FEV1 %(N)Below LLN 21.1 (12) 5.3 (5) 11.3 (17) 0.008**Normal range 77.2 (44) 93.6 (88) 87.4 (132)Above ULN 1.8 (1) 1.1 (1) 1.3 (2)
FEV1 Z-scoremedian (IQR) 0.5 (−0.2–1.6) 0.3 (−0.2–0.9) 0.3 (−0.2–1.0) 0.071†
FVC %(N)Below LLN 19.3 (11) 1.1 (1) 8.0 (12) <0.001**
Normal range 79.0 (45) 91.5 (86) 86.8 (131)Above ULN 1.8 (1) 7.5 (7) 5.3 (8)
FVC Z-scoremedian (IQR) 0.4 (−0.4–1.5) −0.1 (−0.9–0.6) 0.1 (−0.7–0.9) 0.004†
Oxygen saturationmedian (IQR) 98 (96–98) 98 (97–98) 98 (96–98) 0.970†
*Comparison of men and women.†Mann–Whitney U test.‡χ2 test.§This is based on the 67 participant subsample with obstructive spirometry.¶Kruskal–Wallis test.**Fisher’s exact test.LLN, lower limit of normal; PEF, peak expiratory flow; ULN, upper limit of normal.
Fisher AJ, et al. Thorax 2016;71:255–266. doi:10.1136/thoraxjnl-2015-207249 263
Respiratory epidemiology on A
pril 7, 2022 by guest. Protected by copyright.
http://thorax.bmj.com
/T
horax: first published as 10.1136/thoraxjnl-2015-207249 on 5 January 2016. Dow
nloaded from
dispels misconceptions that they cannot perform spirometrysuccessfully.
The participants are long-lived, and survivors of some of themost remarkable historical periods of our time, starting in theyear of their birth immediately post World War I and the 1918Spanish influenza pandemic. There were high levels of depriv-ation, and unemployment across Britain reached 17% in 1921.This period was pre welfare state, Housing Act (1930), CleanAir Act and widespread use of penicillin (1940). Many of theparticipants would have been nearing retirement age when the1986 WHO: Ottawa Charter for Health Promotion was intro-duced—smoking rates are particularly high for men.
It is therefore not unexpected that a high prevalence ofphysician-diagnosed COPD (16.7%) was identified comparedwith previous self-reports of COPD of 10% in 65–74 year oldsin the 2010 Health Survey for England.17 Nevertheless therewere signs of potential misdiagnosis of COPD with a significantproportion of those with physician-diagnosed COPD having noevidence of airflow obstruction on spirometry, no smoking oroccupational history and minimal symptoms. At the same time,a high proportion of our HRG fulfilled spirometry criteria forCOPD using current GOLD/NICE guidelines, though use ofLLN and GLI criteria rather than GOLD or NICE guidelinesmight reduce levels of misdiagnosis.
The risk of respiratory impairment increases with age due tothe cumulative lifetime effect of environmental insults fromactive and passive cigarette smoking, air pollution, occupationaldusts and infections.18 19 When this risk is added to the changeswhich occur in the respiratory system as part of normal ageing,including reduced ventilatory control, reduced respiratorymuscle strength, increased compliance and less favourablerespiratory mechanics due to reduced movement of the chestwall,7 it is not surprising that symptoms of cough, wheeze and
dyspnoea are common in older people. All of these factors arelikely to reduce measured lung function, which has been shownto be an independent risk factor for frailty and death.20–22
Distinguishing physiological age-related loss of lung functionfrom a pathological disease process in the lungs is further com-plicated by a reduced perception of respiratory symptoms thatoccurs with increasing age as demonstrated by significantlyreduced awareness of measured bronchospasm after a methacho-line challenge in older compared with younger patients.23
Despite the high prevalence of chronic lung disease and respira-tory symptoms, we found a significant proportion, 50% of menand 40% of women, with no reported limitations due to breath-lessness suggesting many are either able to function very well orhave a poor perception of symptoms.
The strengths of this work are the comprehensive assessmentof respiratory health and lung disease in a large population-based cohort of 85 year olds, including those in institutionalcare and those with cognitive impairment, in a stable urbansetting and with little ethnic diversity. The cohort of >800 par-ticipants was achieved through engagement with 83% of thegeneral practices in the area and a consent rate of almost 60%in those approached to participate. Previous studies of respira-tory health in older subjects have relied on self-reported diag-noses whereas in our study the use of general practice recordssignificantly improves the validity of our findings.24 25
Furthermore by conducting spirometry in the participant’splace of residence using trained research nurses we were able toachieve a very high uptake of this assessment, in contrast to theknown selection bias if participants had been required to attenda clinic for assessment. Although participants opting in for thehealth assessment were not a random sample of those eligible,there was little evidence to suggest they had more or lessrespiratory disease than those refusing the health assessment. In
Figure 4 Distribution curves of FEV1 and FVC of participants in the healthy reference group (all, men and women) measured (blue) and predicted(green).
264 Fisher AJ, et al. Thorax 2016;71:255–266. doi:10.1136/thoraxjnl-2015-207249
Respiratory epidemiology on A
pril 7, 2022 by guest. Protected by copyright.
http://thorax.bmj.com
/T
horax: first published as 10.1136/thoraxjnl-2015-207249 on 5 January 2016. Dow
nloaded from
addition they were sociodemographically representative of theirEngland and Wales birth cohort.4 A potential limitation of thestudy is that those who agreed to participate may be healthierand less frail than those who declined to participate and thosewith cognitive impairment may have been under-represented.Although some information was collected about why thoseinvited declined to participate, we obviously do not haveobjective data on their respiratory health or disease burden.However the prevalence of COPD of 16.7% in those whoagreed to MDHA and GPRR (n=845) was very similar to theprevalence of 16.5% reported previously in all participantswith GPRR data (n=1030),4 suggesting that in terms of COPD,
those agreeing to MDHA had similar respiratory health profilesto the larger study population. While 85 year olds in this urbanarea in North-East England are sociodemographically and eth-nically similar to the same birth cohort in England and Walesas a whole, they may differ from those in other parts of theworld.
This study has revealed a substantial burden of respiratorysymptoms and respiratory disease, particularly COPD, in acohort of the very old aged 85 years; a group with substantialenvironmental exposures recorded through smoking and occu-pational exposure, which are known risk factors for lungdisease. Despite these observations, we show a good proportionof participants functioning well with no respiratory symptomsor diagnoses. Lung function tests revealed only 75.6% of theCOPD group satisfied spirometry criteria whereas 44% of thehealthy group satisfied spirometry criteria for COPD usingGOLD criteria. Healthcare professionals need to recognise thatspirometry can be reliably assessed in the vast majority of thisage group but care is needed as to how this is interpreted.Current definitions of COPD based on spirometry may lead tooverdiagnosis in a group with transient symptoms and ‘normal’lung ageing, whereas at the same time failure to use spirometryto assess symptoms in this age group may lead to mislabellingthose with breathlessness or cough as having COPD when thereare other explanations.
Acknowledgements The authors thank the 85 year olds of Newcastle and NorthTyneside, and their families and carers, for the generous donation of their time andpersonal information. The authors also thank the research nurses, data manager,project secretary, and the North of England Commissioning Support Unit and localgeneral practitioners and their staff.
Contributors AJF: study design; data preparation; literature review; data analysisand interpretation; development and writing of the paper. MEY: literature review,statistical analysis and interpretation of data; development and critical review ofpaper drafts. JC: study design; supervision of data collection; data preparation;literature review; data analysis and interpretation; and the development and writingof the paper. TS: study design; supervision of data collection; literature review;development of paper and critical review of paper drafts. TBLK: overall leadership ofthe Newcastle 85+ Study; study design; and critical review of paper drafts. KD:study design; participant recruitment; supervision of data collection; datapreparation; and critical review of paper drafts. CJ: study design; supervision ofstatistical analysis; data interpretation; and critical review of paper drafts. PAC: studydesign; data interpretation; and critical review of paper drafts.
Funding UK Medical Research Council and Biotechnology and Biological SciencesResearch Council (G0500997), Dunhill Medical Trust (R124/0509); NewcastleHealthcare Charity; NIHR Newcastle Biomedical Research Centre.
Competing interests The authors declare: the authors’ institution had financialsupport from the UK Medical Research Council and the Biotechnology and BiologicalSciences Research Council (G0500997), the Dunhill Medical Trust (a privatelyendowed foundation having no connection with tobacco industries) and theNewcastle Healthcare Charity in terms of funding the submitted work; CJ wassupported by the AXA Research Fund from 2010 to 2015.
Patient consent Obtained.
Ethics approval The research complied with the requirements of the Declarationof Helsinki. Ethical approval was obtained from the Newcastle and North Tyneside 1Research Ethics Committee (reference number 06/Q0905/2).
Provenance and peer review Not commissioned; externally peer reviewed.
Open Access This is an Open Access article distributed in accordance with theterms of the Creative Commons Attribution (CC BY 4.0) license, which permitsothers to distribute, remix, adapt and build upon this work, for commercial use,provided the original work is properly cited. See: http://creativecommons.org/licenses/by/4.0/
REFERENCES1 United Nations. World Population Ageing: 1950–2050, 2002. http://www.un.org/
esa/population/publications/worldageing19502050/ (accessed Jan 2014).2 Office for National Statistics. 2011 Census—Population and Household Estimates
for England and Wales, March 2011, 2012.
Figure 5 Scatter plots of spirometry and peak expiratory flow in thehealthy reference group.
Fisher AJ, et al. Thorax 2016;71:255–266. doi:10.1136/thoraxjnl-2015-207249 265
Respiratory epidemiology on A
pril 7, 2022 by guest. Protected by copyright.
http://thorax.bmj.com
/T
horax: first published as 10.1136/thoraxjnl-2015-207249 on 5 January 2016. Dow
nloaded from
3 House of Lords Select Committee on Public Service and Demographic Change.Ready for Ageing? The Stationery Office Limited, 2013.
4 Collerton J, Davies K, Jagger C, et al. Health and disease in 85 year olds: baselinefindings from the Newcastle 85+ cohort study. BMJ 2009;339:b4904.
5 Tessier JF, Nejjari C, Letenneur L, et al. Dyspnea and 8-year mortality among elderlymen and women: the PAQUID cohort study. Eur J Epidemiol 2001;17:223–9.
6 van Mourik Y, Rutten FH, Moons KG, et al. Prevalence and underlying causes ofdyspnoea in older people: a systematic review. Age Ageing 2014;43:319–26.
7 Vaz Fragoso CA, Lee PJ. The aging lung. J Gerontol A Biol Sci Med Sci2012;67:233–5.
8 Fletcher CM, Elmes PC, Fairbairn AS, et al. The significance of respiratory symptomsand the diagnosis of chronic bronchitis in a working population. Br Med J1959;2:257–66.
9 Department of Health. A guide to performing quality assured diagnostic spirometry.Department of Health, 2013.
10 GOLD. Spirometry for health care providers. Global Initiative for Chronic ObstructiveLung Disease, 2010.
11 Guder G, Brenner S, Angermann CE, et al. GOLD or lower limit of normaldefinition? A comparison with expert-based diagnosis of chronic obstructivepulmonary disease in a prospective cohort-study. Respir Res 2012;13:13.
12 Collerton J, Barrass K, Bond J, et al. The Newcastle 85+ study: biological, clinicaland psychosocial factors associated with healthy ageing: study protocol. BMCGeriatr 2007;7:14.
13 Hirani V, Mindell J. A comparison of measured height and demi-span equivalentheight in the assessment of body mass index among people aged 65 years and overin England. Age Ageing 2008;37:311–17.
14 Quanjer PH, Stanojevic S, Cole TJ, et al. Multi-ethnic reference values for spirometryfor the 3–95-yr age range: the global lung function 2012 equations. Eur Respir J2012;40:1324–43.
15 Quanjer PH, Tammeling GJ, Cotes JE, et al. Lung volumes and forced ventilatoryflows. Report Working Party Standardization of Lung Function Tests, European
Community for Steel and Coal. Official Statement of the European RespiratorySociety. Eur Respir J Suppl 1993;16:5–40.
16 Miller MR, Hankinson J, Brusasco V, et al. Standardisation of spirometry. Eur RespirJ 2005;26:319–38.
17 National Health Service. Health Survey for England 2010, Respiratory Health. TheNHS Information Centre, 2011.
18 Boezen HM, Rijcken B, Schouten JP, et al. Breathlessness in elderly individuals isrelated to low lung function and reversibility of airway obstruction. Eur Respir J1998;12:805–10.
19 Vaz Fragoso CA, Gill TM. Respiratory impairment and the aging lung: a novelparadigm for assessing pulmonary function. J Gerontol A Biol Sci Med Sci2012;67:264–75.
20 Buchman AS, Boyle PA, Leurgans SE, et al. Pulmonary function, muscle strength,and incident mobility disability in elders. Proc Am Thorac Soc 2009;6:581–7.
21 Lyyra TM, Leskinen E, Heikkinen E. A cohort study found good respiratory, sensoryand motor functions decreased mortality risk in older people. J Clin Epidemiol2005;58:509–16.
22 Smith M, Zhou M, Wang L, et al. Peak flow as a predictor of cause-specificmortality in china: Results from a 15-year prospective study of 170 000 men.Int J Epidemiol 2013;42:803–15.
23 Connolly MJ, Crowley JJ, Charan NB, et al. Reduced subjective awareness ofbronchoconstriction provoked by methacholine in elderly asthmatic andnormal subjects as measured on a simple awareness scale. Thorax1992;47:410–13.
24 Simpson CF, Boyd CM, Carlson MC, et al. Agreement between self-report ofdisease diagnoses and medical record validation in disabled older women: factorsthat modify agreement. J Am Geriatr Soc 2004;52:123–7.
25 Kriegsman DM, Penninx BW, van Eijk JT, et al. Self-reports and general practitionerinformation on the presence of chronic diseases in community dwelling elderly.A study on the accuracy of patients’ self-reports and on determinants of inaccuracy.J Clin Epidemiol 1996;49:1407–17.
266 Fisher AJ, et al. Thorax 2016;71:255–266. doi:10.1136/thoraxjnl-2015-207249
Respiratory epidemiology on A
pril 7, 2022 by guest. Protected by copyright.
http://thorax.bmj.com
/T
horax: first published as 10.1136/thoraxjnl-2015-207249 on 5 January 2016. Dow
nloaded from

Appendices
Supplementary Methods
Participant Recruitment
The only exclusions from the initial invitation to participate in the Newcastle 85+ Study were people deemed by
their general practitioner to have end-stage terminal illness or whose behaviour might prove a threat to a
research nurse visiting alone. The multidimensional health assessment (MDHA) was performed by a trained
research nurse in their usual place of residence over three visits conducted over the course of one month with the
respiratory assessments performed on the second or third visit. In addition, the research nurses reviewed
participants’ medical records in a general practice record review (GPRR) to obtain information on current and
past diagnoses and current medication. Both computerised and paper records were examined, including hospital
correspondence. In the UK, patients are registered with a single general practice that acts as a gatekeeper to
secondary care and receives details of all hospital admissions and outpatient attendances.
Respiratory diseases and medications identified from the GPRR
The predetermined checklist of chronic respiratory diseases included COPD; Asthma; Bronchiectasis;
Pulmonary Fibrosis/Fibrosing Alveolitis; Asbestosis; Pneumoconiosis and Tuberculosis. The list of respiratory
medications included inhaled short or long acting beta-2 adrenoreceptor agonists, inhaled short or long acting
muscarinic antagonists, inhaled corticosteroids either as single agent or as part of a combination with long acting
beta-2 adrenoreceptor agonists, oral corticosteroids, oral leukotriene receptor antagonists, oral theophylline and
supplemental oxygen.
Chronic diseases comprising the comorbidity measure
The original disease count comprised 18 diseases: COPD, other respiratory disease, hypertension, ischaemic
heart disease, cerebrovascular disease, peripheral vascular disease, heart failure, atrial fibrillation, arthritis,
osteoporosis, diabetes mellitus, thyroid disease, cancer excluding non-melanoma skin cancer, eye disease,
dementia, Parkinson's Disease, anaemia and renal impairment. For the non-respiratory disease count we
excluded COPD and other respiratory disease (maximum count = 16).
Research in context
Evidence before this study
We undertook a review of literature on respiratory epidemiology in older ages in Scopus and PubMed over the
previous 15 years using the search terms “respiratory”, “epidemiology”, “old age”, and “lung function”. We
then focussed on studies that were solely in people aged 75 years and over or covered a wider age range but with
a reasonable number aged 75 years and over. We found only 2 studies reporting respiratory function in people
aged 85 years or over: the Swedish Twin Study with 808 participants, 26 of which were aged 86 and over; [1]
and the Danish 1905 birth cohort with 592 participants aged 93 at assessment. [2]
Added value of this study
Our prevalence of physician-diagnosed COPD (16.6%) is higher than previous self-reports of COPD in 65-74
year olds (men: 11%, women: 10%) in the 2010 Health Survey for England (HSE).[3] Interestingly in the 2010
HSE, the prevalence of COPD was less in those aged over 75 (men: 9%, women: 4%), possibly because it
excludes people in institutions. Our findings confirm that the very old population is living with a very high
prevalence of chronic lung disease particularly COPD. It is unclear if this represents environmental exposures
and is limited to an urban setting in the North East or is a national situation in the United Kingdom, though 23%
of the study population were born outside of the North East.[4]
The current way that lung function is categorised as normal or abnormal in clinical practice is generally based
on the definitions presented in the GOLD criteria.[5] If the measured FEV1/FVC ratio is less than 0.7 then a
diagnosis of airflow obstruction is made by GOLD criteria and if additionally the FEV1 is less than 80%
predicted then a symptomatic individual fulfils the definition for moderate COPD in the UK NICE
guidelines.[6] The measured values are reported as a percentage of predicted values based on equation derived
reference values for FEV1 and FVC for age, height and gender. There is however potential risk in applying this
approach to very old people for two main reasons. Firstly the reference values in this age group are derived from
an extrapolation of measurements taken in healthy people of a younger age and therefore may not reflect the
physiological changes that occur to lung function with very advanced ageing. Secondly, this risks misdiagnosis
of normal ageing as pathological lung disease and might lead to inappropriate diagnostic labelling and use of
medications that can have significant side effects.
The accuracy of lung function impairment by GOLD criteria and Lower Limit of Normal (LLN) in diagnosing
COPD has been compared against the gold standard of an expert clinical panel assessment in a cohort of 405
younger-old (median age= 72, IQR=69-77) with findings that the GOLD criteria were found to over diagnose
COPD and the LLN approach to under diagnose COPD.[7] However this cohort did not contain participants as
old as 85 years, hence our results add significantly to the evidence for over-diagnosis by GOLD criteria.
Additionally we found that the LLN approach would reduce, though not eliminate, over-diagnosis. In the Danish
1905 birth cohort, predictive equations derived from a general US population [8] were superior at predicting
survival compared to those generated specifically from an elderly population,[2] although others have reported
that spirometry reference ranges derived from a specific cohort of 458 healthy never smokers aged over 65 were
superior to those derived by extrapolation of reference ranges from the general population.[9] Nevertheless the
latter two studies did not assess accuracy of their spirometry definitions in specific subgroups of their study
population namely those with a diagnosis of COPD or a healthy reference group, as has been done in our study.
Previous findings in healthy participants aged over 70 years demonstrated that 35% had obstructive spirometry
by GOLD definition and that in their small subgroup (n=28) >80 years of age, one third had both a FEV1/FVC
ratio <0.7 and FEV1 percentage predicted <80%. [10] Our findings strengthen this evidence by including a much
larger and significantly older cohort.
Implications of all the available evidence
Our findings reveal substantial discordance between a physician diagnosis of COPD and confirmatory
spirometry evidence in the very old that may have important implications for practice. By both GOLD
definitions and the UK based NICE definitions, we found that only 75.6% of the COPD population satisfied
spirometry criteria for a COPD diagnosis. Firstly this raises the possibility that spirometry may not have been
used to establish a COPD diagnosis in the population due to a perception that they cannot perform it adequately.
Our study has however demonstrated that adequate reproducible blows conforming to ATS/ERS standards could
be produced by over 90% of the very old and under the supervision of a trained research nurse rather than a
clinical physiologist. Secondly, only 20.3% of the COPD cohort, were being treated with a long acting
muscarinic antagonist (LAMA), which is usually considered the first line regular bronchodilator agent in COPD
management. This suggests that 85 year olds with a COPD diagnosis may not be receiving standard therapies
for their condition. Finally that just under half of our healthy reference group fulfilled criteria for airflow
obstruction using GOLD and NICE definitions suggests that respiratory symptoms such as cough or
breathlessness, which may be due to transient respiratory infection or non-respiratory causes, might be
misdiagnosed as COPD by GOLD/NICE spirometry criteria and therefore given unnecessary treatment. The
lower limit of normal (LLN) approach appears to reduce the risk of false positives in an otherwise healthy
population but further research with longitudinal measures of lung function and diagnoses is necessary to
validate this.

Supplementary Table 1**: Comparison of the groups included and excluded in the spirometry cohort.
Excluded from
Spirometry Cohort
(n=108)
Included in
Spirometry cohort
(n=737)
p-value*
-
Sex Female 75.9 (82) 60.2 (444) 0.0022
Ethnicity White 98.1 (104) 99.9 (735) 0.0432
Living arrangements
% (N)
Standard housing
Sheltered housing
Institutional care
46.3 (50)
13.0 (14)
40.7 (44)
81.6 (601)
12.8 (94)
5.7 (42)
<0.0012
Smoking
% (N)
Never
Former
Current
41.9 (44)
53.3 (56)
4.8 (5)
35.0 (257)
59.2 (435)
5.9 (43)
0.3752
Occupational Exposures
% (N)
Heavy Industry
Coal mining
Chemical industry
Asbestos exposure
18.1 (13)
2.7 (2)
12.7 (9)
5.7 (4)
26.7 (196)
4.5 (33)
6.1 (45)
12.6 (92)
0.1112
0.7633
0.0352
0.1213
Respiratory symptoms
% (N)
Cough
Wheeze
Sputum production
26.9 (21)
20.8 (16)
26.0 (20)
26.7 (196)
22.2 (163)
33.6 (247)
0.9612
0.7832
0.1772
MRC Dyspnoea Score
% (N)
1
2
3
4
5
40.5 (15)
13.5 (5)
13.5 (5)
21.6 (8)
10.8 (4)
44.8 (251)
16.0 (90)
19.1 (107)
15.9 (89)
4.3 (24)
0.2571
Respiratory diagnoses
% (N)
COPD
Asthma
Bronchiectasis
Pulmonary Fibrosis
Asbestosis
Pneumoconiosis
Tuberculosis
15.7 (17)
7.4 (8)
0.9 (1)
0.9 (1)
0.0 (0)
0.0 (0)
2.8 (3)
16.7 (123)
4.1 (30)
2.0 (15)
0.0 (0)
0.7 (5)
0.5 (4)
5.0 (37)
0.8042
0.1182
0.7083
0.1283
1.0003
1.0003
0.4653
Medications Inhaled short acting β-2 adrenoreceptor agonists 11.1 (12) 10.5 (77) 0.8342
Inhaled muscarinic antagonists 3.7 (4) 3.8 (28) 1.0003
Oral Theophylline 0.0 (0) 0.5 (4) 1.0003
Combination short acting bronchodilators 0.0 (0) 0.3 (2) 1.0003
Inhaled Corticosteroids 4.6 (5) 7.2 (53) 0.3252
Combination inhaled Corticosteroids and long
acting β-2 adrenoreceptor agonists
0.9 (1) 2.2 (16) 0.7123
Oral leukotriene receptor antagonists 0.0 (0) 0.3 (2) 1.0003
Oral mucolytics 0.0 (0) 0.4 (3) 1.0003
At least 1 Respiratory Medication - % (N) 12.0 (13) 13.8 (102) 0.6102
Disease count - Median (IQR) 5 (4 - 6) 4 (3 - 6) 0.1781
* Comparison of Men and Women; ** Denominators may vary due to missing values; 1 Mann-Whitney test; 2 Chi-square test; 3 Fisher-exact test

Supplementary Table 2: Spirometry Definitions
Spirometry Definition
Normal FEV1/FVC > 0.7 FEV1 ≥ 80% predicted
Restrictive FEV1/FVC > 0.7 FEV1 ≤ 80% predicted
Obstructive FEV1/FVC < 0.7
Obstructive Spirometry Grading Definition
Mild FEV1/FVC < 0.7 FEV1 ≥ 80% predicted
Moderate FEV1/FVC < 0.7 50% ≤ FEV1 < 80% predicted
Severe FEV1/FVC < 0.7 30% ≤ FEV1 < 50% predicted
Very Severe FEV1/FVC < 0.7 FEV1 < 30% predicted
Limits of Normal Range FEV1 FVC
Men FEV1Pred +/- (0.51*1.645) FVCPred +/- (0.61*1.645)
Women FEV1Pred +/- (0.38*1.645) FVCPred +/- (0.43*1.645)
Use + for Upper Limit of Normal (ULN) and - for Lower Limit of Normal (LLN)
Z-Score FEV1 FVC
Men (FEV1Pred - FEV1 Actual)/0.51 (FVCPred - FVCActual)/0.61
Women (FEV1Pred - FEV1 Actual)/0.38 (FVCPred - FVCActual)/0.43
Range Upper Limit of Normal > 1.645 Lower Limit of Normal < -1.645

Supplementary Table 3: Results of Spirometry in the cohort completing spirometry with adequate
reproducible blows and demi-span available for calculation of predicted blows (n=737) based on Global
Lungs Initiative (GLI) prediction models
Men
(n=293)
Women
(n=444)
All
(n=737)
p-value*
Actual
Spirometry
Median (IQR)
FEV1
FVC
FEV1/FVC
PEFR
1.8 (1.4 - 2.2)
2.7 (2.2 - 3.2)
0.7 (0.6 - 0.8)
441 (323 - 604)
1.2 (1.0 - 1.5)
1.8 (1.4 - 2.1)
0.7 (0.6 - 0.8)
283 (196 - 362)
1.4 (1.1 - 1.8)
2.0 (1.6 - 2.6)
0.7 (0.6 - 0.8)
328 (233 - 450)
<0.0011
<0.0011
0.0061
<0.0011
%predicted
Median (IQR)
FEV1
FVC
74.3 (58.7 - 88.6)
80.8 (67.2 - 95.9)
72.4 (59.4 - 87.2)
80.4 (64.9 - 94.0)
73.2 (58.9 - 87.7)
80.6 (66.1 - 94.7)
0.4571
0.1621
Spirometry
% (N)
Normal
Restrictive
Obstructive
52.9 (155)
22.2 (65)
24.9 (73)
52.5 (233)
24.1 (107)
23.4 (104)
52.7 (388)
23.3 (172)
24.0 (177)
0.8002
FEV1
%(N)
Below LLN
Normal range
Above ULN
39.9 (117)
59.7 (175)
0.3 (1)
42.1 (187)
57.4 (255)
0.5 (2)
41.3 (304)
58.3 (430)
0.4 (3)
0.8233
FEV1 Z-Score Median (IQR) -1.3 (-2.1 - -0.6) -1.4 (-2.1 - -0.7) -1.4 (-2.1 - -0.6) 0.2481
FVC
%(N)
Below LLN
Normal range
Above ULN
31.4 (92)
67.6 (198)
1.0 (3)
31.5 (140)
68.2 (303)
0.2 (1)
31.5 (232)
68.0 (501)
0.5 (4)
0.4423
FVC Z-Score Median (IQR) -1.1 (-1.9 - -0.2) -1.0 (-1.8 - -0.3) -1.1 (-1.8 - -0.3) 0.7271
Oxygen
Saturation
Median (IQR) 97 (96 - 98) 97 (96 - 98) 97 (96 - 98) 0.5131
* Comparison of Men and Women; 1 Mann-Whitney test; 2 Chi-square test; 3 Fisher-exact test;
Supplementary Table 4: Results of Spirometry in the sub-group with Physician diagnosed of COPD
(n=123) based on Global Lungs Initiative (GLI) prediction models
Men
(n=52)
Women
(n=71)
All
(n=123)
p-value*
-
Actual
Median (IQR)
FEV1
FVC
FEV1/FVC
PEFR
1.4 (1.1 - 1.8)
2.4 (2.0 - 3.1)
0.6 (0.5 - 0.7)
382.5 (243 - 519)
1.0 (0.7 - 1.1)
1.6 (1.3 - 1.9)
0.6 (0.5 - 0.7)
218 (144 - 290)
1.1 (0.8 - 1.4)
1.9 (1.5 - 2.3)
0.6 (0.5 - 0.7)
259 (191 - 380)
<0.0011
<0.0011
0.5911
<0.0011
%predicted
Median (IQR)
FEV1
FVC
60.7 (48.8 - 69.1)
73.8 (62.0 - 91.1)
56.5 (43.4 - 68.9)
71.8 (59.5 - 85.0)
58.6 (44.8 - 69.0)
73.2 (60.3 - 86.8)
0.3131
0.2211
Spirometry
%(N)
Normal
Restrictive
Obstructive
26.9 (14)
25.0 (13)
48.1 (25)
23.9 (17)
25.4 (18)
50.7 (36)
25.2 (31)
25.2 (31)
49.6 (61)
0.9282
FEV1
%(N)
Below LLN
Normal range
Above ULN
69.2 (36)
30.8 (16)
0.0 (0)
74.7 (53)
25.4 (18)
0.0 (0)
72.4 (89)
27.6 (34)
0.0 (0)
0.5453
FEV1 Z-Score Median (IQR) -2.0 (-2.5 - -1.6) -2.3 (-2.9 - -1.6) -2.1 (-2.8 - -1.6) 0.1281
FVC
%(N)
Below LLN
Normal range
Above ULN
46.2 (24)
53.9 (28)
0.0 (0)
45.1 (32)
54.9 (39)
0.0 (0)
45.5 (56)
54.5 (67)
0.0 (0)
1.0003
FVC Z-Score Median (IQR) -1.5 (-2.2 - -0.5) -1.5 (-2.1 - -0.8) -1.5 (-2.2 - -0.7) 0.5601
Oxygen
Saturation
Median (IQR) 97 (96 - 98) 97 (95 - 98) 97 (95 - 98) 0.5211
* Comparison of Men and Women; 1 Mann-Whitney test; 2 Chi-square test; 3 Fisher-exact test;

Supplementary Table 5: Results of Spirometry in healthy reference group of participants (n=151) based
on Global Lungs Initiative (GLI) prediction values
Men
(n=57)
Women
(n=94)
All
(n=151)
p-value*
Actual
Median (IQR)
FEV1
FVC
FEV1/FVC
PEFR
2.0 (1.7 - 2.4)
2.9 (2.4 - 3.5)
0.7 (0.6 - 0.8)
515 (340 - 647)
1.4 (1.2 - 1.6)
1.9 (1.6 - 2.2)
0.7 (0.7 - 0.8)
329.5 (243 - 417)
1.5 (1.2 - 2.0)
2.1 (1.8 - 2.8)
0.7 (0.6 - 0.8)
367 (263 - 515)
<0.0011
<0.0011
0.2441
<0.0011
%predicted
Median (IQR)
FEV1
FVC
83.9 (65.7 - 97.5)
90.3 (70.5 - 104.2)
84.0 (69.7 - 93.3)
85.0 (72.4 - 99.3)
83.9 (69.0 - 94.2)
86.4 (70.9 - 102.8)
0.9971
0.6021
Spirometry
%(N)
Normal
Restrictive
Obstructive
63.2 (36)
19.3 (11)
17.5 (10)
67.0 (63)
17.0 (16)
16.0 (15)
65.6 (99)
17.9 (27)
16.6 (25)
0.8552
FEV1
%(N)
Below LLN
Normal range
Above ULN
26.3 (15)
71.9 (41)
1.8 (1)
23.4 (22)
75.5 (71)
1.1 (1)
24.5 (37)
74.2 (112)
1.3 (2)
0.8573
FEV1 Z-Score Median (IQR) -0.9 (-1.7 -0.1) -0.9 (-1.6 - -0.4) -0.9 (-1.6 - -0.3) 0.9181
FVC
%(N)
Below LLN
Normal range
Above ULN
26.3 (15)
73.7 (42)
0.0 (0)
21.3 (20)
78.7 (74)
0.0 (0)
23.2 (35)
76.8 (116)
0.0 (0)
0.3023
FVC Z-Score Median (IQR) -0.5 (-1.7 - 0.2) -0.8 (-1.4 - 0.0) -0.7 (-1.6 - 0.1) 0.8451
Oxygen Saturation Median (IQR) 98 (96 - 98) 98 (97 - 98) 98 (96 - 98) 0.9701
* Comparison of Men and Women; 1 Mann-Whitney test; 2 Chi-square test; 3 Fisher-exact test;

Supplementary Table 6: Level of agreement between the three methods of classification of obstructive
lung function
GP Diagnosed COPD
GOLD
Obstructive
No Yes
No 91.2 (312) 8.8 (30)
Yes 76.5 (302) 23.5 (93)
Total 83.3 (614) 16.7 (123)
p<0.001*
GP Diagnosed COPD
GLI
Obstructive
No Yes
No 88.9 (498) 11.1 (62)
Yes 65.5 (116) 34.5 (61)
Total 83.3 (614) 16.7 (123)
p<0.001*
GOLD COPD
GLI
Obstructive
No Yes
No 61.1 (342) 38.9 (218)
Yes 0.0 (0) 100.0 (177)
Total 46.4 (342) 53.6 (395)
* McNemar test
p<0.001*

References
1. Finkel D, Reynolds CA, Emery CF, et al. Genetic and environmental variation in lung function drives subsequent variation in aging of fluid intelligence. Behav Genet 2013;43:274-85.
2. Miller MR, Thinggaard M, Christensen K, et al. Best lung function equations for the very elderly selected by survival analysis. Eur Respir J 2014;43:1338-46.
3. National Health Service N. Health Survey for England 2010, Respiratory Health. The NHS Information Centre 2011.
4. Collerton J, Davies K, Jagger C, et al. Health and disease in 85 year olds: baseline findings from the Newcastle 85+ cohort study. BMJ 2009;339:b4904.
5. GOLD. Spirometry for Health Care Providers. In: Global Initiative for Chronic Obstructive Lung Disease, ed. 2010.
6. National Institute for Health and Clinical Excellence. Chronic obstructive pulmonary disease: Management of chronic obstructive pulmonary disease in adults in primary and secondary care (partial update). In: National Health Service, ed. 2010.
7. Guder G, Brenner S, Angermann CE, et al. "GOLD or lower limit of normal definition? A comparison with expert-based diagnosis of chronic obstructive pulmonary disease in a prospective cohort-study". Respir Res 2012;13:13.
8. Hankinson JL, Odencrantz JR, Fedan KB. Spirometric reference values from a sample of the general U.S. population. Am J Respir Crit Care Med 1999;159:179-87.
9. Garcia-Rio F, Pino JM, Dorgham A, et al. Spirometric reference equations for European females and males aged 65-85 yrs. Eur Respir J 2004;24:397-405.
10. Hardie JA, Buist AS, Vollmer WM, et al. Risk of over-diagnosis of COPD in asymptomatic elderly never-smokers. Eur Respir J 2002;20:1117-22.