Embed Size (px)
Citation preview
ARTICLE IN PRESS+ModelNEURAD-466; No. of Pages 16
Journal of Neuroradiology (2014) xxx, xxx—xxx
Available online at
ScienceDirectwww.sciencedirect.com
ORIGINAL ARTICLE
Quantitative texture analysis of brain whitematter lesions derived from T2-weightedMR images in MS patients with clinicallyisolated syndrome
C.P. Loizoua,∗, S. Petroudib, I. Seimenisc, M. Pantziarisd,C.S. Pattichisb
a Department of Computer Science, School of Sciences, Intercollege, 92, Ayias Phylaxeos Street, PO Box51604, 3507 Limassol, Cyprusb Department of Computer Science, University of Cyprus, Nicosia, Cyprusc Medical Physics Laboratory, Medical School, Democritus University, Alexandroupolis, Greeced Cyprus Institute of Neurology and Genetics, Nicosia, Cyprus
KEYWORDSMRI;Multiple sclerosis;Texture analysis;Shape features;EDSS
SummaryIntroduction: This study investigates the application of texture analysis methods on brain T2-white matter lesions detected with magnetic resonance imaging (MRI) for the prognosis of futuredisability in subjects diagnosed with clinical isolated syndrome (CIS) of multiple sclerosis (MS).Methods: Brain lesions and normal appearing white matter (NAWM) from 38 symptomaticuntreated subjects diagnosed with CIS as well as normal white matter (NWM) from 20 healthyvolunteers, were manually segmented, by an experienced MS neurologist, on transverse T2-weighted images obtained from serial brain MR imaging scans (0 and 6—12 months). Additionalclinical information in the form of the Expanded Disability Status Scale (EDSS), a scale from0 to 10, which provides a way of quantifying disability in MS and monitoring the changes overtime in the level of disability, were also provided. Shape and most importantly different tex-ture features including GLCM and laws were then extracted for all above regions, after imageintensity normalization.Results: The findings showed that: (i) there were significant differences for the texture futuresextracted between the NAWM and lesions at 0 month and between NAWM and lesions at6—12 months. However, no significant differences were found for all texture features extracted
Please cite this article in press as: Loizou CP, et al. Quantitative texture analysis of brain white matter lesionsderived from T2-weighted MR images in MS patients with clinically isolated syndrome. J Neuroradiol (2014),http://dx.doi.org/10.1016/j.neurad.2014.05.006
when comparing lesions temporally at 0 and 6—12 months with the exception of contrast (graylevel difference statistics-GLDS) and difference entropy (spatial gray level dependence matrix-SGLDM); (ii) significant differences were found between NWM and NAWM for most of the texturefeatures investigated in this study; (iii) there were significant differences found for the lesion
∗ Corresponding author. Tel.: +357 25 381180; fax: +357 25 386982.E-mail addresses: [email protected], [email protected], [email protected] (C.P. Loizou), [email protected]
(S. Petroudi), [email protected] (I. Seimenis), [email protected] (M. Pantziaris), [email protected] (C.S. Pattichis).
http://dx.doi.org/10.1016/j.neurad.2014.05.0060150-9861/© 2014 Elsevier Masson SAS. All rights reserved.
ARTICLE IN PRESS+ModelNEURAD-466; No. of Pages 16
2 C.P. Loizou et al.
texture features at 0 month for those with EDSS ≤ 2 versus those with EDSS > 2 (mean, median,inverse difference moment and sum average) and for the lesion texture features at 6—12 monthswith EDSS > 2 and EDSS ≤ 2 for the texture features (mean, median, entropy and sum average).It should be noted that whilst there were no differences in entropy at time 0 between the twogroups, significant change was observed at 6—12 months, relating the corresponding featuresto the follow-up and disability (EDSS) progression. For the NAWM, significant differences werefound between 0 month and 6—12 months with EDSS ≤ 2 (contrast, inverse difference moment),for 6—12 months for EDSS > 2 and 0 month with EDSS > 2 (difference entropy) and for 6—12 monthsfor EDSS > 2 and EDSS ≤ 2 (sum average); (iv) there was no significant difference for NAWM andthe lesion texture features (for both 0 and 6—12 months) for subjects with no change in EDSSscore versus subjects with increased EDSS score from 2 to 5 years.Conclusions: The findings of this study provide evidence that texture features of T2 MRI brainwhite matter lesions may have an additional potential role in the clinical evaluation of MRIimages in MS and perhaps may provide some prognostic evidence in relation to future disabilityof patients. However, a larger scale study is needed to establish the application in clinicalpractice and for computing shape and texture features that may provide information for betterand earlier differentiation between normal brain tissue and MS lesions.
. All
I
MdpdcrefMrrsfcoedMmfnatuctlmtdte
c
•
•
crfabwfuffciw
tdtsbtfeirtTeaai
© 2014 Elsevier Masson SAS
ntroduction
ultiple sclerosis (MS) is the most common autoimmuneisease of the central nervous system, with complex patho-hysiology, including inflammation, demyelination, axonalegeneration, and neuronal loss. Within individuals, thelinical manifestations are unpredictable, particularly withegard to the development of disability [1,2]. Diagnosticvaluation of MS can be very difficult and is thus per-ormed by a neurologist specialized in treating MS. TheS evaluation is generally based on conventional magnetic
esonance imaging (MRI), following the McDonald crite-ia [3,4]. It is furthermore based on clinical signs andymptoms. The development of modern imaging techniquesor the early detection of brain inflammation and theharacterization of tissue-specific injury is an importantbjective in MS research. A better understanding of dis-ase pathogenesis can also form the basis for the furtherevelopment of new and more effective therapies. RecentRI studies have shown that brain and focal lesion volumeeasures as well as magnetization transfer ratio and dif-
usion weighted imaging-derived parameters can provideew information in diagnosing MS [5,6]. Texture featurenalysis can provide information regarding the underlyingonal and structural properties of image regions. It can besed to analyze macroscopic lesions and other macroscopichanges in the MS brains that go beyond the conven-ional measures of lesion volume and number [1]. Theseesions might usually be undetectable using conventionaleasures of lesion volume and number [1,6]. Texture fea-
ure analysis is also used widely in neuro MRI to enableisease characterization and quantification. Therefore, tex-ure features may provide needed information for diseasevaluation.
Several studies have documented that texture featuresan be used in the assessment of MS lesions for:
Please cite this article in press as: Loizou CP, et al. Quanderived from T2-weighted MR images in MS patients withttp://dx.doi.org/10.1016/j.neurad.2014.05.006
differentiating between lesions for normal white matter(NWM) and normal appearing white matter (NAWM);
stqt
rights reserved.
monitoring the progression of the disease over longitudi-nal scans [6—17], and this paper aims to provide additionalinformation to support these.
MRI-based texture analysis was shown to be effective inlassifying MS lesions from NWM and NAWM, with an accu-acy of 96—100% [7]. In [10], texture features were usedor differentiating between normal and abnormal tissue,nd for image segmentation, while differences in textureetween normal and diseased spinal cord in MS subjectsere found in [13]. Active and non-active lesions were dif-
erentiated in [14], whereas in [15], texture analysis wassed to discriminate between MS lesions, NAWM and NWMrom healthy controls. In [18], hemispherical differencesor MS were found with texture analysis, while in [19],orrelation between texture features of T2-weighted MRImages and histological changes of postmortem MS brainsere investigated.
The primary objective of this study was to investigatehe use of texture features analysis to detect significantifferences between NWM, NAWM, and lesions as well aso achieve better discrimination between the different tis-ues. Significant differences between NWM and NAWM maye critical to the early diagnosis of the disease, whilst bet-er tissue discrimination may be valuable as a prognosticactor in the assessment of the natural evolution of the dis-ase. Since some form of quantitative MRI analysis is usedn MS clinical trials, we hypothesise that there is a closeelationship between the change in the extracted features,he clinical status and the rate of development of disability.he patient’s images acquired at the initial stages of the dis-ase (0 month) as well as after 6—12 months (6—12 months),re analyzed and the corresponding texture feature findingsre correlated with disability assessments for ground truth,nterrelating the Expanded Disability Status Scale (EDSS)
titative texture analysis of brain white matter lesionsh clinically isolated syndrome. J Neuroradiol (2014),
cores [20], with standard shape intensity and texture fea-ures. EDSS is a scale from 0 to 10, which provides a way ofuantifying disability in MS and monitoring the changes overime in the level of disability.
ARTICLE IN PRESS+ModelNEURAD-466; No. of Pages 16
Quantitative texture analysis of brain white matter lesions 3
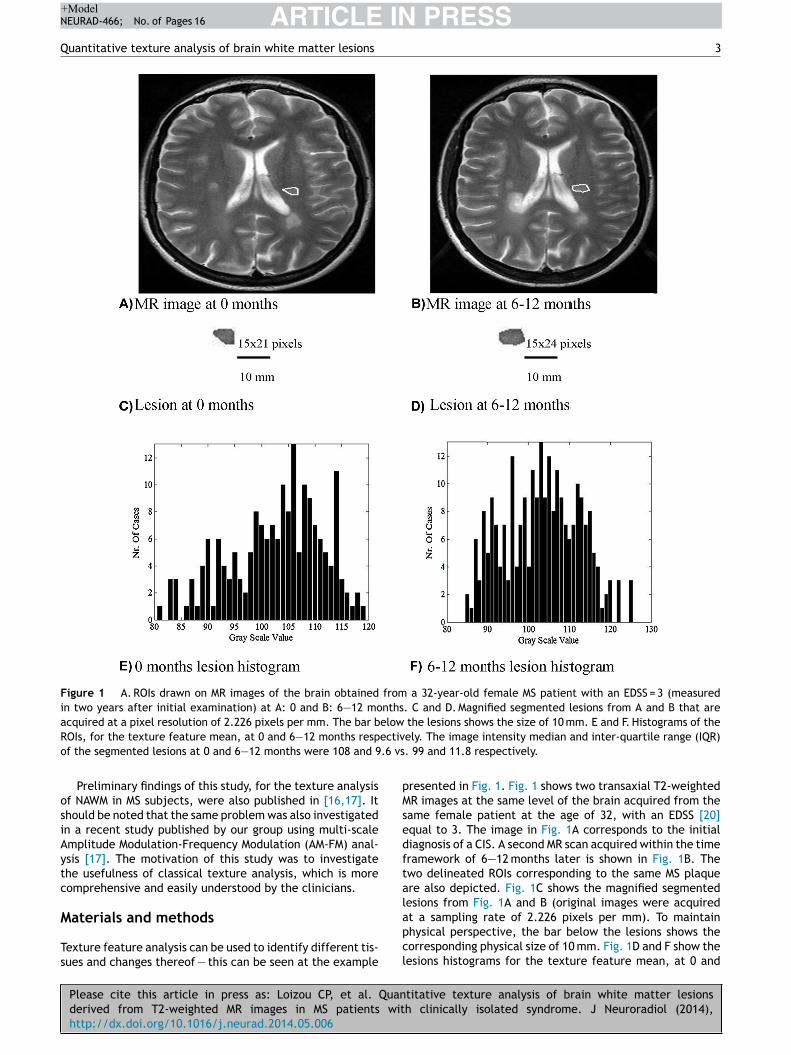
Figure 1 A. ROIs drawn on MR images of the brain obtained from a 32-year-old female MS patient with an EDSS = 3 (measuredin two years after initial examination) at A: 0 and B: 6—12 months. C and D. Magnified segmented lesions from A and B that areacquired at a pixel resolution of 2.226 pixels per mm. The bar below the lesions shows the size of 10 mm. E and F. Histograms of the
ectiv.6 vs
pMsedftal
ROIs, for the texture feature mean, at 0 and 6—12 months respof the segmented lesions at 0 and 6—12 months were 108 and 9
Preliminary findings of this study, for the texture analysisof NAWM in MS subjects, were also published in [16,17]. Itshould be noted that the same problem was also investigatedin a recent study published by our group using multi-scaleAmplitude Modulation-Frequency Modulation (AM-FM) anal-ysis [17]. The motivation of this study was to investigatethe usefulness of classical texture analysis, which is morecomprehensive and easily understood by the clinicians.
Please cite this article in press as: Loizou CP, et al. Quanderived from T2-weighted MR images in MS patients withttp://dx.doi.org/10.1016/j.neurad.2014.05.006
Materials and methods
Texture feature analysis can be used to identify different tis-sues and changes thereof — this can be seen at the example
apcl
ely. The image intensity median and inter-quartile range (IQR). 99 and 11.8 respectively.
resented in Fig. 1. Fig. 1 shows two transaxial T2-weightedR images at the same level of the brain acquired from the
ame female patient at the age of 32, with an EDSS [20]qual to 3. The image in Fig. 1A corresponds to the initialiagnosis of a CIS. A second MR scan acquired within the timeramework of 6—12 months later is shown in Fig. 1B. Thewo delineated ROIs corresponding to the same MS plaquere also depicted. Fig. 1C shows the magnified segmentedesions from Fig. 1A and B (original images were acquired
titative texture analysis of brain white matter lesionsh clinically isolated syndrome. J Neuroradiol (2014),
t a sampling rate of 2.226 pixels per mm). To maintainhysical perspective, the bar below the lesions shows theorresponding physical size of 10 mm. Fig. 1D and F show theesions histograms for the texture feature mean, at 0 and
ARTICLE IN+ModelNEURAD-466; No. of Pages 16
4
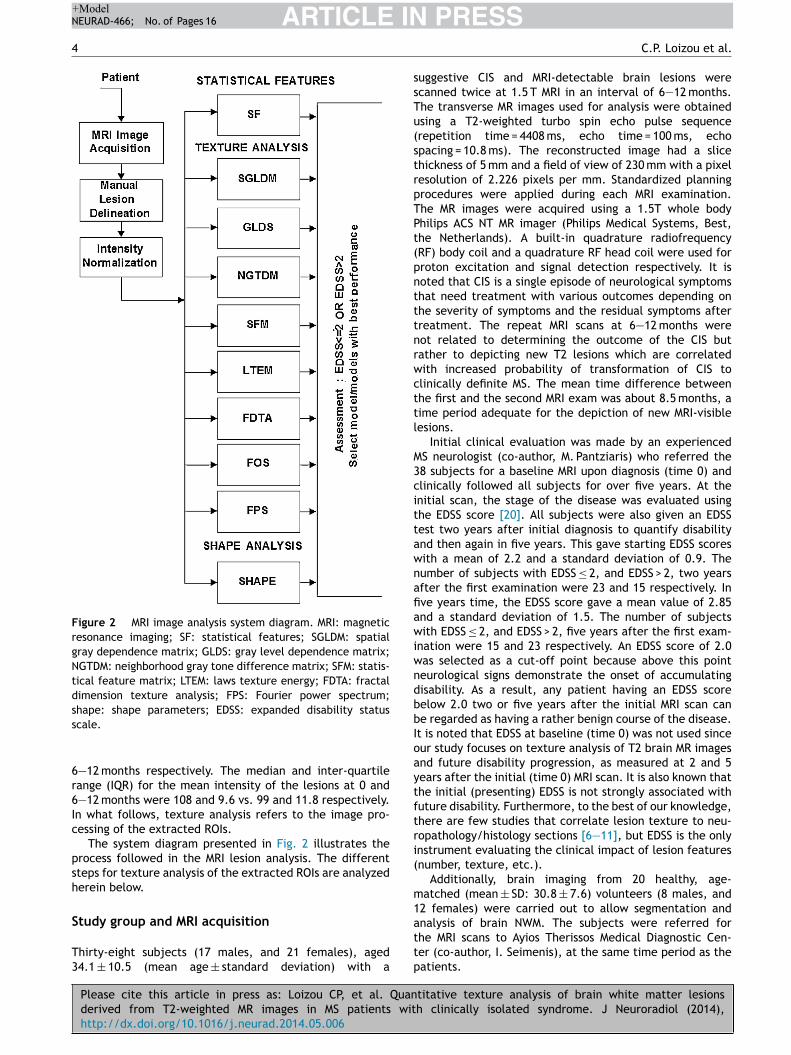
Figure 2 MRI image analysis system diagram. MRI: magneticresonance imaging; SF: statistical features; SGLDM: spatialgray dependence matrix; GLDS: gray level dependence matrix;NGTDM: neighborhood gray tone difference matrix; SFM: statis-tical feature matrix; LTEM: laws texture energy; FDTA: fractaldimension texture analysis; FPS: Fourier power spectrum;ss
6r6Ic
psh
S
T3
ssTu(strpTPt(pntttnrwcttl
M3cittawnafiawiwndbbIoaytftri(
m1
hape: shape parameters; EDSS: expanded disability statuscale.
—12 months respectively. The median and inter-quartileange (IQR) for the mean intensity of the lesions at 0 and—12 months were 108 and 9.6 vs. 99 and 11.8 respectively.n what follows, texture analysis refers to the image pro-essing of the extracted ROIs.
The system diagram presented in Fig. 2 illustrates therocess followed in the MRI lesion analysis. The differentteps for texture analysis of the extracted ROIs are analyzederein below.
Please cite this article in press as: Loizou CP, et al. Quanderived from T2-weighted MR images in MS patients withttp://dx.doi.org/10.1016/j.neurad.2014.05.006
tudy group and MRI acquisition
hirty-eight subjects (17 males, and 21 females), aged4.1 ± 10.5 (mean age ± standard deviation) with a
attp
PRESSC.P. Loizou et al.
uggestive CIS and MRI-detectable brain lesions werecanned twice at 1.5 T MRI in an interval of 6—12 months.he transverse MR images used for analysis were obtainedsing a T2-weighted turbo spin echo pulse sequencerepetition time = 4408 ms, echo time = 100 ms, echopacing = 10.8 ms). The reconstructed image had a slicehickness of 5 mm and a field of view of 230 mm with a pixelesolution of 2.226 pixels per mm. Standardized planningrocedures were applied during each MRI examination.he MR images were acquired using a 1.5T whole bodyhilips ACS NT MR imager (Philips Medical Systems, Best,he Netherlands). A built-in quadrature radiofrequencyRF) body coil and a quadrature RF head coil were used forroton excitation and signal detection respectively. It isoted that CIS is a single episode of neurological symptomshat need treatment with various outcomes depending onhe severity of symptoms and the residual symptoms afterreatment. The repeat MRI scans at 6—12 months wereot related to determining the outcome of the CIS butather to depicting new T2 lesions which are correlatedith increased probability of transformation of CIS tolinically definite MS. The mean time difference betweenhe first and the second MRI exam was about 8.5 months, aime period adequate for the depiction of new MRI-visibleesions.
Initial clinical evaluation was made by an experiencedS neurologist (co-author, M. Pantziaris) who referred the8 subjects for a baseline MRI upon diagnosis (time 0) andlinically followed all subjects for over five years. At thenitial scan, the stage of the disease was evaluated usinghe EDSS score [20]. All subjects were also given an EDSSest two years after initial diagnosis to quantify disabilitynd then again in five years. This gave starting EDSS scoresith a mean of 2.2 and a standard deviation of 0.9. Theumber of subjects with EDSS ≤ 2, and EDSS > 2, two yearsfter the first examination were 23 and 15 respectively. Inve years time, the EDSS score gave a mean value of 2.85nd a standard deviation of 1.5. The number of subjectsith EDSS ≤ 2, and EDSS > 2, five years after the first exam-
nation were 15 and 23 respectively. An EDSS score of 2.0as selected as a cut-off point because above this pointeurological signs demonstrate the onset of accumulatingisability. As a result, any patient having an EDSS scoreelow 2.0 two or five years after the initial MRI scan cane regarded as having a rather benign course of the disease.t is noted that EDSS at baseline (time 0) was not used sinceur study focuses on texture analysis of T2 brain MR imagesnd future disability progression, as measured at 2 and 5ears after the initial (time 0) MRI scan. It is also known thathe initial (presenting) EDSS is not strongly associated withuture disability. Furthermore, to the best of our knowledge,here are few studies that correlate lesion texture to neu-opathology/histology sections [6—11], but EDSS is the onlynstrument evaluating the clinical impact of lesion featuresnumber, texture, etc.).
Additionally, brain imaging from 20 healthy, age-atched (mean ± SD: 30.8 ± 7.6) volunteers (8 males, and
2 females) were carried out to allow segmentation and
titative texture analysis of brain white matter lesionsh clinically isolated syndrome. J Neuroradiol (2014),
nalysis of brain NWM. The subjects were referred forhe MRI scans to Ayios Therissos Medical Diagnostic Cen-er (co-author, I. Seimenis), at the same time period as theatients.
IN+Model
F
Sattifcf
•
•
•
•
•
•
•
•
•
ARTICLENEURAD-466; No. of Pages 16
Quantitative texture analysis of brain white matter lesions
Inter-scan intensity normalization
In a recent study [21], where six different inter-scan nor-malization techniques for MRI were compared, it was shownthat a normalization method based on histogram normal-ization proposed in [22], in which the original histogramof the whole image is stretched and shifted in order tocover a wider dynamic range, yields better results than theother methods tested. The original image histogram wasstretched, and shifted using [21,22] in order to cover allthe gray scale levels in the image as follows:
f(x, y) = gGWM − gBWM
gmax − gmin.(g(x, y) − gmin) + gBWM (1)
where g(x, y) denotes the original image gray scale valueat x and y, and gmax and gmin represents the maximum andthe minimum gray scale values in the original image respec-tively. The gBWM, represents the manual selection of theblack-white matter (which is the darkest image area in theoriginal image) and gGWM represents the gray-white matter(which is the brightest image area in the image which is thebrain) selected from slices of the whole MRI, as described inthe following section. The output image is represented withf(x, y).
Manual delineations and visual perception
All MRI-detectable brain lesions were identified and seg-mented by an experienced MS neurologist and confirmedby a radiologist. Only well-defined areas of hyperintensityon T2-weighted MR images were considered as MS plaques.The neurologist manually delineated the brain lesions byselecting consecutive points at the visually defined bor-ders between the lesions and the adjacent NAWM on theacquired transverse T2-weighted sections. Similar regionscorresponding to NAWM were manually delineated contralat-erally to the detected MS lesions with extra caution to avoidcontamination from dirty white matter areas. The manualdelineations were performed using a graphical user inter-face implemented in MATLAB® developed by our group. Foreach brain MRI scan of MS subjects, 10 discrete round regionsof interest (ROIs) with an approximate radius of 25 pix-els were also drawn in brain white matter, usually on thecontralateral to the lesion side, to represent NAWM. Everyeffort was made to avoid white matter areas with subtle,patchy and diffuse abnormal signal intensities. Finally, theneurologist manually segmented cerebrovascular fluid (CSF)areas as well as areas with air (sinuses) from all MS brain
Please cite this article in press as: Loizou CP, et al. Quanderived from T2-weighted MR images in MS patients withttp://dx.doi.org/10.1016/j.neurad.2014.05.006
scans. Similarly, ROIs representing NWM, CSF and air fromthe sinuses, of the same size as the NAWM and lesions,were arbitrarily segmented from the brain scans of the 20healthy subjects. Manual segmentation by the MS expert wasperformed in a blinded manner (without knowledge of theMRI-subject time-point relationships), without the possibil-ity of identifying the subject, the time-point of the examor the clinical findings. The selected points and delineationsare the regions used for texture analysis.
S
Tpitu
PRESS5
eature extraction: shape and texture
hape features and texture features were extracted fromll MS lesions detected and segmented as well as from allhe segmented ROIs from the healthy brain areas. The tex-ure features were normalized with respect to ROI’s undernvestigation size. The overall shape and texture featuresor each subject were then estimated by averaging theorresponding values for all lesions for each subject. Theollowing features were extracted:
shape parameters: (1) x-coordinate maximum length, (2)y-coordinate maximum length, (3) area, (4) perimeter, (5)perimeter2/area, (6) eccentricity, (7) equivalence diam-eter, (8) major axis length, (9) minor axis length, (10)centroid, (11) convex area, and (12) orientation;
statistical features [16,23]: (a) mean, (b) variance, (c)median value, (d) skewness, (e) kurtosis, (f) energy and(g) entropy;
spatial gray level dependence matrices (SGLDM) as pro-posed by Haralick et al. [23]: (a) angular second moment(ASM), (b) contrast, (c) correlation, (d) sum of squaresvariance (SOSV), (e) inverse difference moment (IDM), (f)sum average (SA), (g) sum variance (SV), (h) sum entropy(SE), (i) entropy, (j) difference variance (DV), (k) dif-ference entropy (DE), and (l) information measures ofcorrelation (IMC). For a chosen distance d (in this workd = 1 was used) and for angles � = 00, 450, 900, and 1350,we computed four values for each of the above texturemeasures. Each feature was computed using a distance ofone pixel. Then for each feature the mean values and therange of values were computed, and were used as twodifferent feature sets;
gray level difference statistics (GLDS) [24]: (a) homo-geneity, (b) contrast, (c) energy, (d) entropy, and (e)mean. The above features were calculated for displace-ments ı = (0, 1), (1, 1)(1, 0), (1, −1), where ı ≡ (�x, �y),and their mean values were taken;
neighborhood gray tone difference matrix (NGTDM) [25]:(a) coarseness, (b) contrast, (c) busyness, (d) complexity,and (e) strength;
statistical feature matrix (SFM) [26]: (a) coarseness, (b)contrast, (c) periodicity, and (d) roughness;
laws texture energy measures (LTEM) [26]: LL-textureenergy from LL kernel, EE-texture energy from EE ker-nel, SS-texture energy from SS kernel, LE-average textureenergy from LE and EL kernels, ES-average texture energyfrom ES and SE kernels, and LS-average texture energyfrom LS and SL kernels;
fractal dimension texture analysis (FDTA) [26]: the Hurstcoefficients for dimensions 4, 3 and 2 were computed;
Fourier power spectrum (FPS) [26]: (a) radial sum, and (b)angular sum.
tatistical analysis
he Mann-Whitney rank sum test (for independent sam-
titative texture analysis of brain white matter lesionsh clinically isolated syndrome. J Neuroradiol (2014),
les of different sizes) [27] was used in order to identifyf there were significant differences (S) or not (NS) betweenhe extracted texture features at P < 0.05. The median val-es over the segmented components (NWM, NAWM, and
ARTICLE IN PRESS+ModelNEURAD-466; No. of Pages 16
6 C.P. Loizou et al.
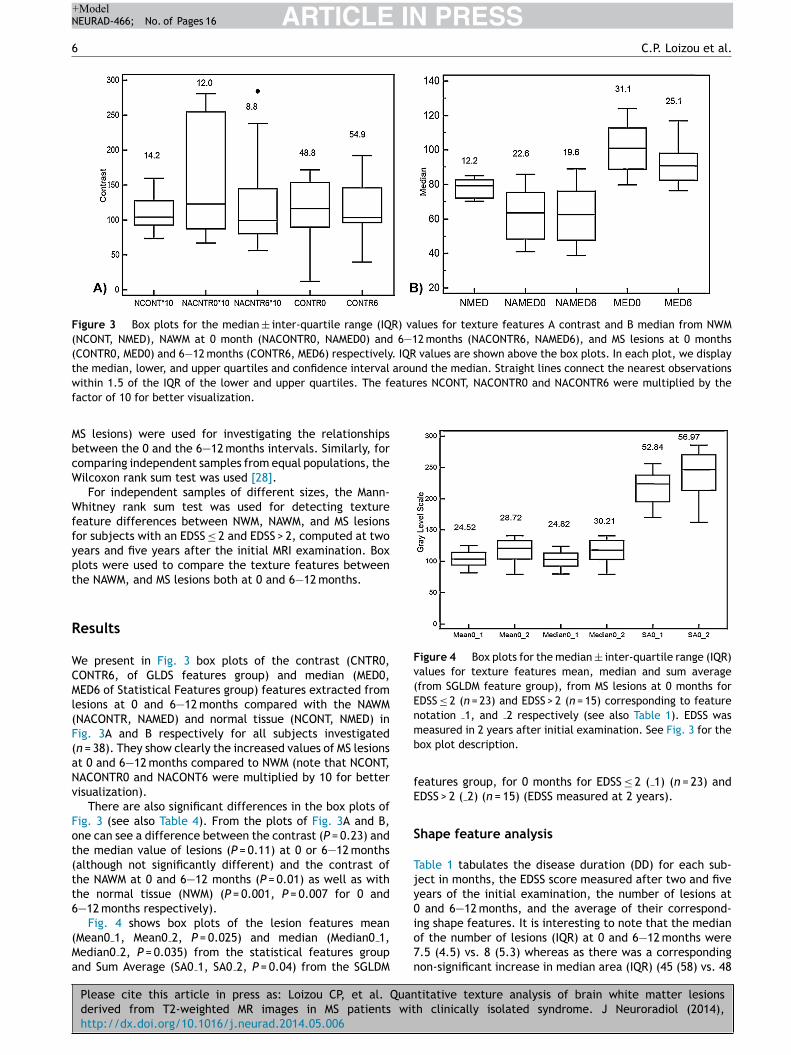
Figure 3 Box plots for the median ± inter-quartile range (IQR) values for texture features A contrast and B median from NWM(NCONT, NMED), NAWM at 0 month (NACONTR0, NAMED0) and 6—12 months (NACONTR6, NAMED6), and MS lesions at 0 months(CONTR0, MED0) and 6—12 months (CONTR6, MED6) respectively. IQR values are shown above the box plots. In each plot, we displaythe median, lower, and upper quartiles and confidence interval around the median. Straight lines connect the nearest observationsw atures NCONT, NACONTR0 and NACONTR6 were multiplied by thef
MbcW
Wffypt
R
WCMl(F(aNv
Fot(tt6
(Ma
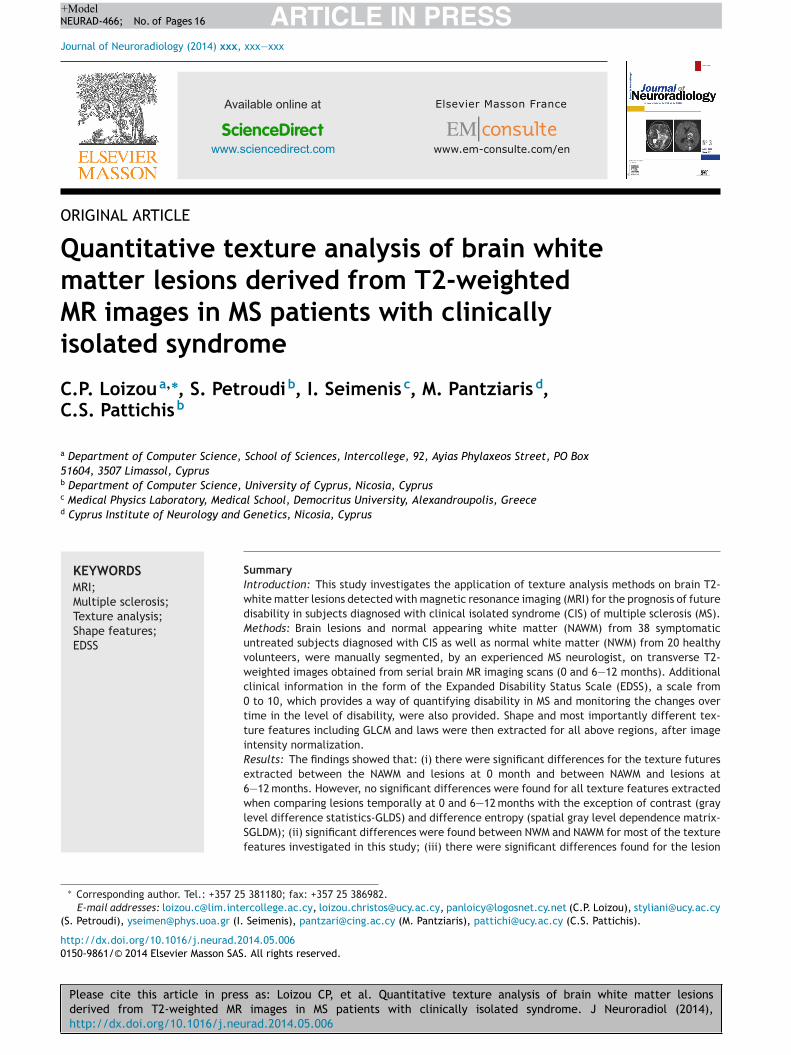
Figure 4 Box plots for the median ± inter-quartile range (IQR)values for texture features mean, median and sum average(from SGLDM feature group), from MS lesions at 0 months forEDSS ≤ 2 (n = 23) and EDSS > 2 (n = 15) corresponding to featurenotation 1, and 2 respectively (see also Table 1). EDSS wasmb
fE
S
Tjy0
ithin 1.5 of the IQR of the lower and upper quartiles. The feactor of 10 for better visualization.
S lesions) were used for investigating the relationshipsetween the 0 and the 6—12 months intervals. Similarly, foromparing independent samples from equal populations, theilcoxon rank sum test was used [28].For independent samples of different sizes, the Mann-
hitney rank sum test was used for detecting textureeature differences between NWM, NAWM, and MS lesionsor subjects with an EDSS ≤ 2 and EDSS > 2, computed at twoears and five years after the initial MRI examination. Boxlots were used to compare the texture features betweenhe NAWM, and MS lesions both at 0 and 6—12 months.
esults
e present in Fig. 3 box plots of the contrast (CNTR0,ONTR6, of GLDS features group) and median (MED0,ED6 of Statistical Features group) features extracted from
esions at 0 and 6—12 months compared with the NAWMNACONTR, NAMED) and normal tissue (NCONT, NMED) inig. 3A and B respectively for all subjects investigatedn = 38). They show clearly the increased values of MS lesionst 0 and 6—12 months compared to NWM (note that NCONT,ACONTR0 and NACONT6 were multiplied by 10 for betterisualization).
There are also significant differences in the box plots ofig. 3 (see also Table 4). From the plots of Fig. 3A and B,ne can see a difference between the contrast (P = 0.23) andhe median value of lesions (P = 0.11) at 0 or 6—12 monthsalthough not significantly different) and the contrast ofhe NAWM at 0 and 6—12 months (P = 0.01) as well as withhe normal tissue (NWM) (P = 0.001, P = 0.007 for 0 and—12 months respectively).
Please cite this article in press as: Loizou CP, et al. Quanderived from T2-weighted MR images in MS patients withttp://dx.doi.org/10.1016/j.neurad.2014.05.006
Fig. 4 shows box plots of the lesion features meanMean0 1, Mean0 2, P = 0.025) and median (Median0 1,edian0 2, P = 0.035) from the statistical features groupnd Sum Average (SA0 1, SA0 2, P = 0.04) from the SGLDM
io7n
easured in 2 years after initial examination. See Fig. 3 for theox plot description.
eatures group, for 0 months for EDSS ≤ 2 ( 1) (n = 23) andDSS > 2 ( 2) (n = 15) (EDSS measured at 2 years).
hape feature analysis
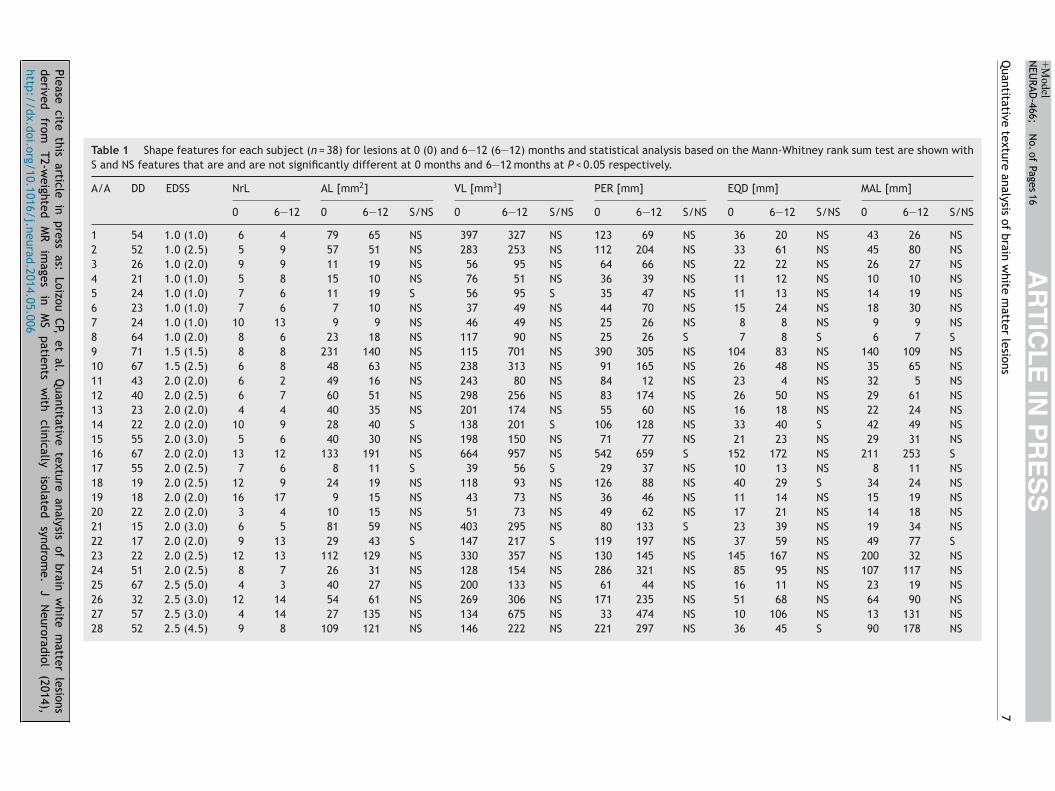
able 1 tabulates the disease duration (DD) for each sub-ect in months, the EDSS score measured after two and fiveears of the initial examination, the number of lesions at
and 6—12 months, and the average of their correspond-
titative texture analysis of brain white matter lesionsh clinically isolated syndrome. J Neuroradiol (2014),
ng shape features. It is interesting to note that the medianf the number of lesions (IQR) at 0 and 6—12 months were.5 (4.5) vs. 8 (5.3) whereas as there was a correspondingon-significant increase in median area (IQR) (45 (58) vs. 48
Please cite
this article
in press
as: Loizou
CP, et
al. Q
uantitative texture
analysis of
brain w
hite m
atter lesions
derived
from
T2-weighted
M
R
images
in
M
S
patients
with
clinically
isolated
syndrom
e.
J
Neuroradiol
(2014),
http://dx.doi.org/10.1016/j.neurad.2014.05.006
AR
TIC
LE
IN P
RE
SS
+Model
NEU
RAD-466;
N
o. of
Pages 16
Quantitative
texture analysis
of brain
white
matter
lesions
7
Table 1 Shape features for each subject (n = 38) for lesions at 0 (0) and 6—12 (6—12) months and statistical analysis based on the Mann-Whitney rank sum test are shown withS and NS features that are and are not significantly different at 0 months and 6—12 months at P < 0.05 respectively.
A/A DD EDSS NrL AL [mm2] VL [mm3] PER [mm] EQD [mm] MAL [mm]
0 6—12 0 6—12 S/NS 0 6—12 S/NS 0 6—12 S/NS 0 6—12 S/NS 0 6—12 S/NS
1 54 1.0 (1.0) 6 4 79 65 NS 397 327 NS 123 69 NS 36 20 NS 43 26 NS2 52 1.0 (2.5) 5 9 57 51 NS 283 253 NS 112 204 NS 33 61 NS 45 80 NS3 26 1.0 (2.0) 9 9 11 19 NS 56 95 NS 64 66 NS 22 22 NS 26 27 NS4 21 1.0 (1.0) 5 8 15 10 NS 76 51 NS 36 39 NS 11 12 NS 10 10 NS5 24 1.0 (1.0) 7 6 11 19 S 56 95 S 35 47 NS 11 13 NS 14 19 NS6 23 1.0 (1.0) 7 6 7 10 NS 37 49 NS 44 70 NS 15 24 NS 18 30 NS7 24 1.0 (1.0) 10 13 9 9 NS 46 49 NS 25 26 NS 8 8 NS 9 9 NS8 64 1.0 (2.0) 8 6 23 18 NS 117 90 NS 25 26 S 7 8 S 6 7 S9 71 1.5 (1.5) 8 8 231 140 NS 115 701 NS 390 305 NS 104 83 NS 140 109 NS10 67 1.5 (2.5) 6 8 48 63 NS 238 313 NS 91 165 NS 26 48 NS 35 65 NS11 43 2.0 (2.0) 6 2 49 16 NS 243 80 NS 84 12 NS 23 4 NS 32 5 NS12 40 2.0 (2.5) 6 7 60 51 NS 298 256 NS 83 174 NS 26 50 NS 29 61 NS13 23 2.0 (2.0) 4 4 40 35 NS 201 174 NS 55 60 NS 16 18 NS 22 24 NS14 22 2.0 (2.0) 10 9 28 40 S 138 201 S 106 128 NS 33 40 S 42 49 NS15 55 2.0 (3.0) 5 6 40 30 NS 198 150 NS 71 77 NS 21 23 NS 29 31 NS16 67 2.0 (2.0) 13 12 133 191 NS 664 957 NS 542 659 S 152 172 NS 211 253 S17 55 2.0 (2.5) 7 6 8 11 S 39 56 S 29 37 NS 10 13 NS 8 11 NS18 19 2.0 (2.5) 12 9 24 19 NS 118 93 NS 126 88 NS 40 29 S 34 24 NS19 18 2.0 (2.0) 16 17 9 15 NS 43 73 NS 36 46 NS 11 14 NS 15 19 NS20 22 2.0 (2.0) 3 4 10 15 NS 51 73 NS 49 62 NS 17 21 NS 14 18 NS21 15 2.0 (3.0) 6 5 81 59 NS 403 295 NS 80 133 S 23 39 NS 19 34 NS22 17 2.0 (2.0) 9 13 29 43 S 147 217 S 119 197 NS 37 59 NS 49 77 S23 22 2.0 (2.5) 12 13 112 129 NS 330 357 NS 130 145 NS 145 167 NS 200 32 NS24 51 2.0 (2.5) 8 7 26 31 NS 128 154 NS 286 321 NS 85 95 NS 107 117 NS25 67 2.5 (5.0) 4 3 40 27 NS 200 133 NS 61 44 NS 16 11 NS 23 19 NS26 32 2.5 (3.0) 12 14 54 61 NS 269 306 NS 171 235 NS 51 68 NS 64 90 NS27 57 2.5 (3.0) 4 14 27 135 NS 134 675 NS 33 474 NS 10 106 NS 13 131 NS28 52 2.5 (4.5) 9 8 109 121 NS 146 222 NS 221 297 NS 36 45 S 90 178 NS
Please cite
this article
in press
as: Loizou
CP, et
al. Q
uantitative texture
analysis of
brain w
hite m
atter lesions
derived
from
T2-weighted
M
R
images
in
M
S
patients
with
clinically
isolated
syndrom
e.
J
Neuroradiol
(2014),
http://dx.doi.org/10.1016/j.neurad.2014.05.006
AR
TIC
LE
IN P
RE
SS
+Model
NEU
RAD-466;
N
o. of
Pages 16
8
C.P. Loizou
et al.
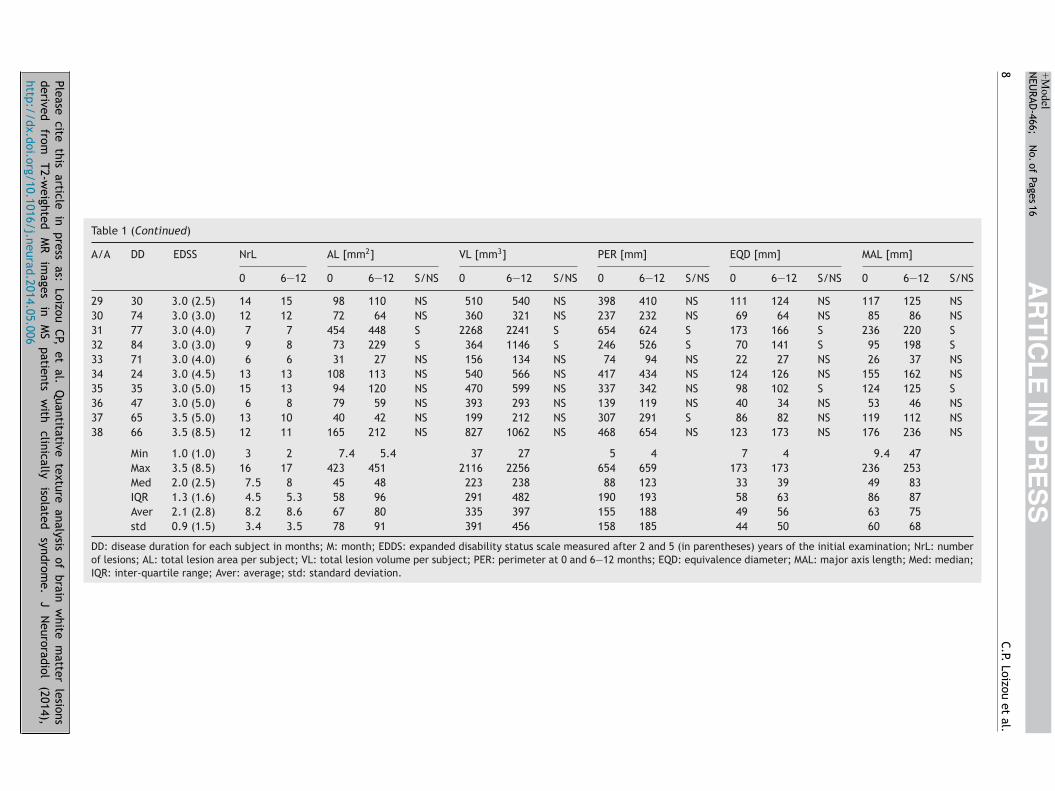
Table 1 (Continued)
A/A DD EDSS NrL AL [mm2] VL [mm3] PER [mm] EQD [mm] MAL [mm]
0 6—12 0 6—12 S/NS 0 6—12 S/NS 0 6—12 S/NS 0 6—12 S/NS 0 6—12 S/NS
29 30 3.0 (2.5) 14 15 98 110 NS 510 540 NS 398 410 NS 111 124 NS 117 125 NS30 74 3.0 (3.0) 12 12 72 64 NS 360 321 NS 237 232 NS 69 64 NS 85 86 NS31 77 3.0 (4.0) 7 7 454 448 S 2268 2241 S 654 624 S 173 166 S 236 220 S32 84 3.0 (3.0) 9 8 73 229 S 364 1146 S 246 526 S 70 141 S 95 198 S33 71 3.0 (4.0) 6 6 31 27 NS 156 134 NS 74 94 NS 22 27 NS 26 37 NS34 24 3.0 (4.5) 13 13 108 113 NS 540 566 NS 417 434 NS 124 126 NS 155 162 NS35 35 3.0 (5.0) 15 13 94 120 NS 470 599 NS 337 342 NS 98 102 S 124 125 S36 47 3.0 (5.0) 6 8 79 59 NS 393 293 NS 139 119 NS 40 34 NS 53 46 NS37 65 3.5 (5.0) 13 10 40 42 NS 199 212 NS 307 291 S 86 82 NS 119 112 NS38 66 3.5 (8.5) 12 11 165 212 NS 827 1062 NS 468 654 NS 123 173 NS 176 236 NS
Min 1.0 (1.0) 3 2 7.4 5.4 37 27 5 4 7 4 9.4 47Max 3.5 (8.5) 16 17 423 451 2116 2256 654 659 173 173 236 253Med 2.0 (2.5) 7.5 8 45 48 223 238 88 123 33 39 49 83IQR 1.3 (1.6) 4.5 5.3 58 96 291 482 190 193 58 63 86 87Aver 2.1 (2.8) 8.2 8.6 67 80 335 397 155 188 49 56 63 75std 0.9 (1.5) 3.4 3.5 78 91 391 456 158 185 44 50 60 68
DD: disease duration for each subject in months; M: month; EDDS: expanded disability status scale measured after 2 and 5 (in parentheses) years of the initial examination; NrL: numberof lesions; AL: total lesion area per subject; VL: total lesion volume per subject; PER: perimeter at 0 and 6—12 months; EQD: equivalence diameter; MAL: major axis length; Med: median;IQR: inter-quartile range; Aver: average; std: standard deviation.
ARTICLE IN+ModelNEURAD-466; No. of Pages 16
Quantitative texture analysis of brain white matter lesions
Table 2 Shape feature statistical analysis for all subjects(n = 38), for lesions at 0 and 6—12 months. Wilcoxon ranksum test shows with S and NS the features, that are (S) andare not significantly different (NS) at P < 0.05 respectively.P-values are shown in parentheses.
Shape feature Lesion 0 vs. lesions 6—12
Area NS (0.45)Volume NS (0.86)Perimeter NS (0.92)Eccentricity S (0.04)Equivalence diameter NS (0.14)Major axis length S (0.04)Minor axis length S (0.02)Centroid NS (0.27)Convex area S (0.01)
T
Tfbt(risb
•
•
•
R
TMworpww
•
•
Orientation NS (0.96)
(96) in mm2) and median perimeter (IQR) (88 (190) vs. 123(193) in mm) and a significant increase in median major axislength (IQR) (49 (86) vs. 83 (87) in mm) (as shown also inTable 2).
Table 2 presents statistical comparisons for the shapefeatures for all lesions and for all subjects at 0 and 6—12months based on the Wilcoxon rank sum test. It is shownthat:
• significant differences were found for the eccentricity(P = 0.04), the major axis length (P = 0.04), the minor axislength (P = 0.02) and the convex area (P = 0.01) betweenthe shape features at 0 and 6—12 months respectively;
• it is noted that the area (P = 0.45) and volume (P = 0.86)showed no significance difference.
Texture feature analysis
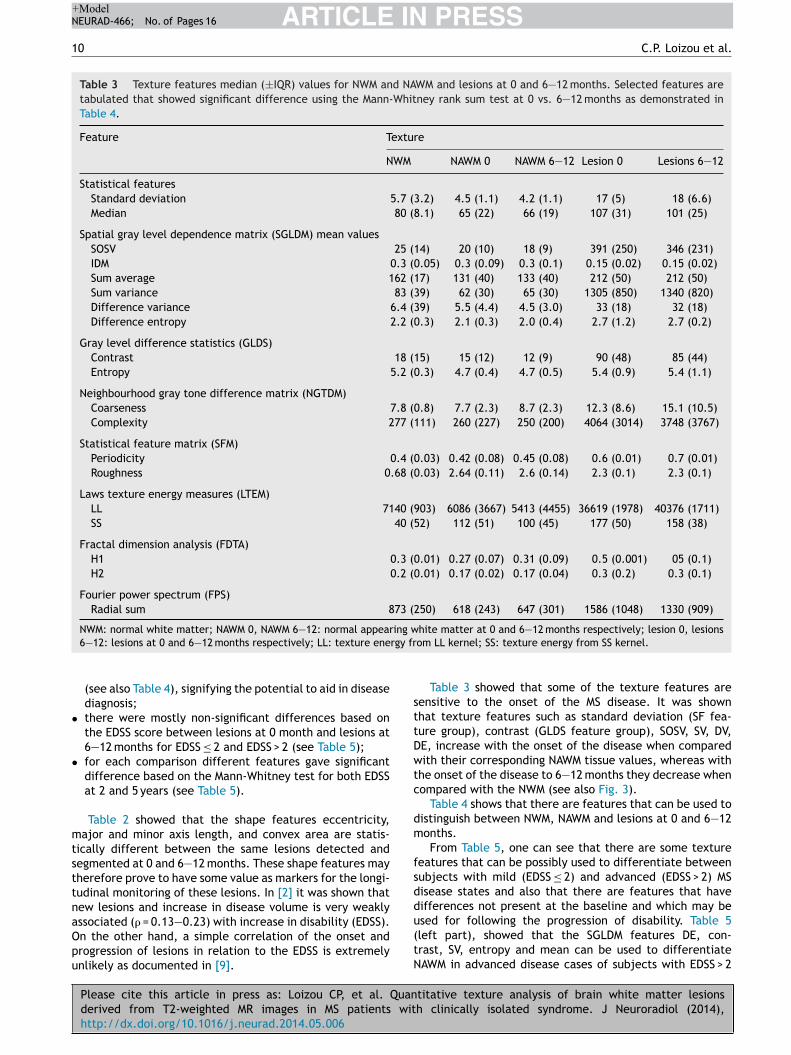
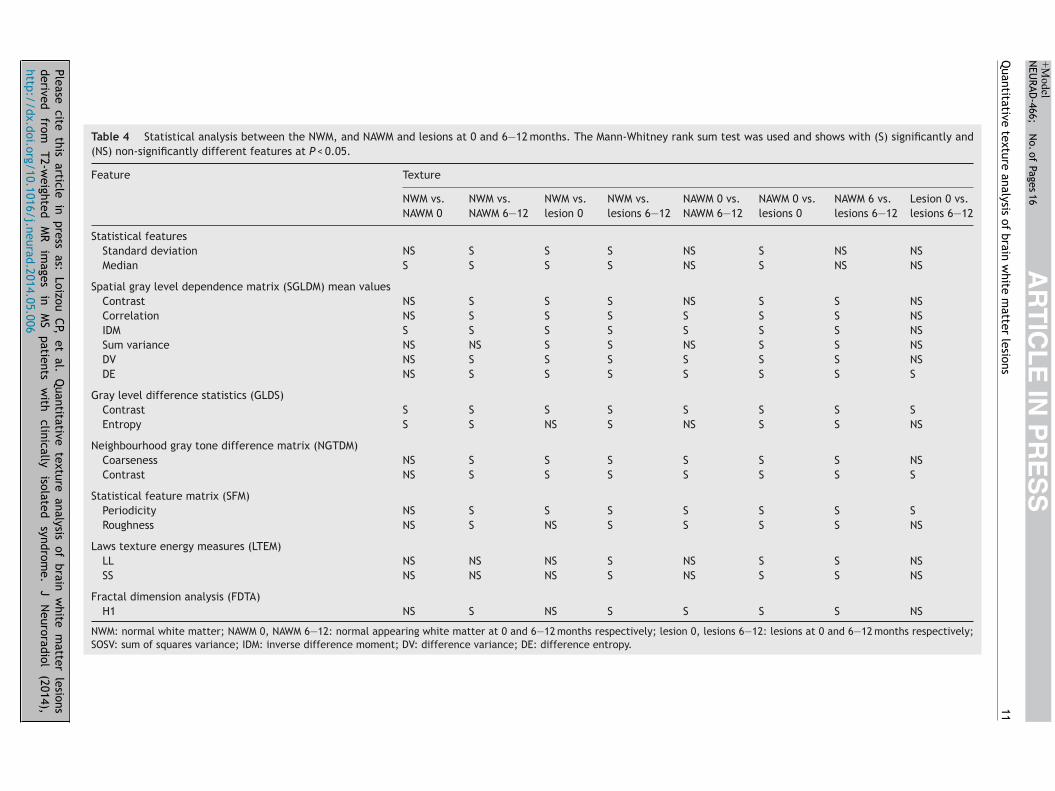
Table 3 presents the SF median (IQR) values for texturefeatures for the NWM and NAWM and MS lesions at 0 and6—12 months. Selected features are presented that showedsignificant difference using the Mann-Whitney rank sum testat 0 vs. 6—12 months as demonstrated also in Table 4. Table 4shows the results for the statistical analysis between theNWM, and NAWM and lesions at 0 and 6—12 months. TheMann-Whitney rank sum test was used and shows with (S)significantly and (NS) non-significantly different features atP < 0.05. It is shown that:
• for NAWM tissue and lesions at 0 month all texture featureswere significantly different as expected;
• for NAWM tissue and lesions at 6—12 months almost allfeatures were significantly different with the exceptionof standard deviation and median (from the statisticalfeatures group);
• for lesions at 0 and 6—12 months, only difference entropy(SGLDM), contrast (GLDS) and periodicity (SFM) were sig-
Please cite this article in press as: Loizou CP, et al. Quanderived from T2-weighted MR images in MS patients withttp://dx.doi.org/10.1016/j.neurad.2014.05.006
nificantly different;• features median (statistical features), IDM (SGLDM), con-
trast (GLDS), and entropy (GLDS) showed significantdifference between NWM and NAWM at 0.
PRESS9
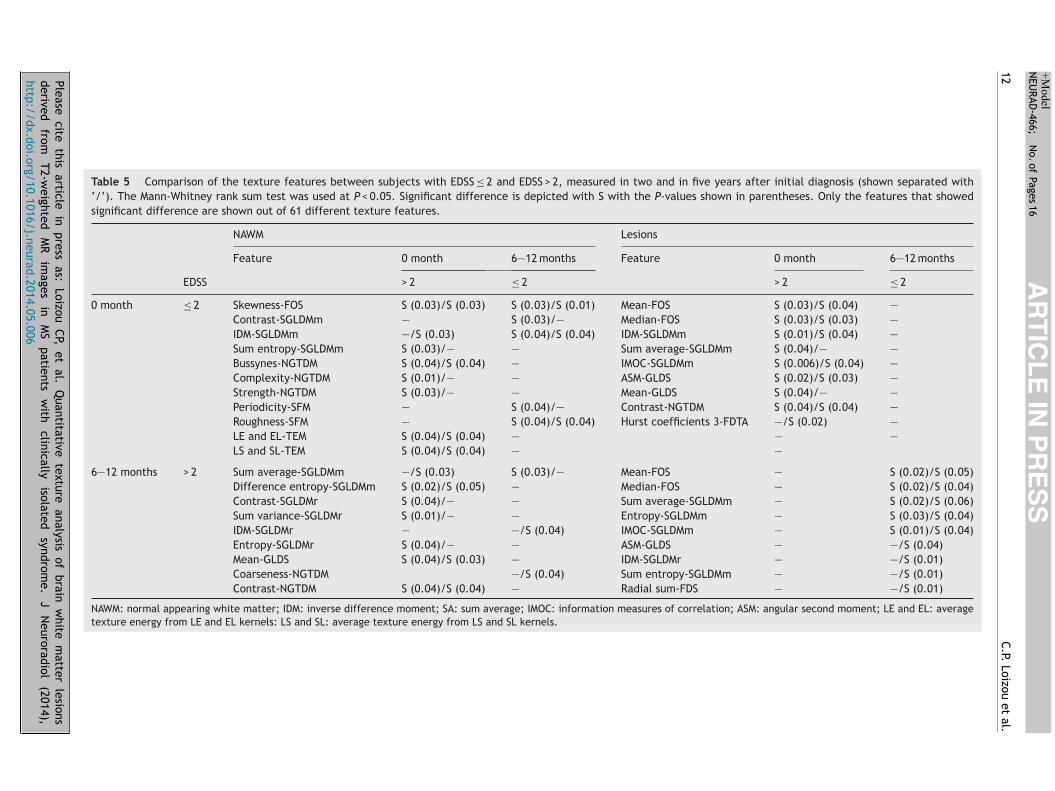
exture feature analysis based on the EDSS score
able 5 presents the statistical texture features comparisonsor brain lesions and NAWM recorded at 0 and 6—12 monthsetween subjects with an EDSS score lower than or equalo 2 (≤ 2) and subjects with an EDSS score greater than 2> 2) estimated in two and five years from initial diagnosisespectively, based on the Mann-Whitney rank sum test. Its noted that for each comparison different features gaveignificant difference based on the Mann-Whitney test foroth EDSS at 2 and 5 years. It is shown that:
only skewness (statistical features group) could be used todifferentiate between NAWM at 0 month and EDSS ≤ 2 ver-sus EDSS > 2, and NAWM at 0 month versus 6—12 months forEDSS ≤ 2 for both two and five years respectively (−/−)(see also Table 5);
mean and median (statistical features group) could beused to differentiate between, lesions at 0 month forEDSS ≤ 2 versus EDSS > 2, and lesions at 6—12 months forEDSS ≤ 2 versus EDSS > 2 for both two and five yearsrespectively (−/−);
there was no significant difference for NAWM and thelesion texture features (for both at 0 and 6—12 months) forsubjects with no change in EDSS score (n = 17) versus sub-jects with increased EDSS score (n = 20) from 2 to 5 years(see also Table 1 for details about the EDSS score at 2 and 5years for each subject. One subject had a slight decreasein EDSS score). Moreover, Spearman’s correlation analysisshowed only a few features that had moderate corre-lation (with significant difference at P < 0.05) with nochange vs. increased EDSS score. For example for lesionsat 6—12 months, only feature SGLDM — Information Mea-sure of Correlation (IMOC) gave a Spearman’s correlationcoefficient of 0.31 (and a P value of 0.01).
esults analysis
he presented analysis is based on the manually segmentedS lesions and NAWM areas from the MRI scans of 38 subjectsith CIS, in an attempt to quantify pathological changes thatccur in MS. The population sample used in our study rep-esents more than 50% of CIS cases diagnosed in the Cypriotopulation within the time span of two years. All subjectsere scanned twice with an interval of 6—12 months andere followed up for more than five years.
The results showed that:
there was not a significant difference between the shapefeatures extracted from the lesions at 0 and 6—12 monthsrespectively with the exception of eccentricity, convexarea, major and minor axis length (see Table 2);
there was a significant difference between most of thetexture features extracted from the NWM and NAWM andthe corresponding texture features extracted from thelesions at 0 and 6—12 months (with the exception of stan-dard deviation (SF feature group) and median (SF feature
titative texture analysis of brain white matter lesionsh clinically isolated syndrome. J Neuroradiol (2014),
group) at 6—12 months). Moreover, there was no signif-icant difference between features extracted from thelesions at 0 and 6—12 months with the exception of con-trast (GLDS feature group) and DE (SGLDM feature group),
ARTICLE IN PRESS+ModelNEURAD-466; No. of Pages 16
10 C.P. Loizou et al.
Table 3 Texture features median (±IQR) values for NWM and NAWM and lesions at 0 and 6—12 months. Selected features aretabulated that showed significant difference using the Mann-Whitney rank sum test at 0 vs. 6—12 months as demonstrated inTable 4.
Feature Texture
NWM NAWM 0 NAWM 6—12 Lesion 0 Lesions 6—12
Statistical featuresStandard deviation 5.7 (3.2) 4.5 (1.1) 4.2 (1.1) 17 (5) 18 (6.6)Median 80 (8.1) 65 (22) 66 (19) 107 (31) 101 (25)
Spatial gray level dependence matrix (SGLDM) mean valuesSOSV 25 (14) 20 (10) 18 (9) 391 (250) 346 (231)IDM 0.3 (0.05) 0.3 (0.09) 0.3 (0.1) 0.15 (0.02) 0.15 (0.02)Sum average 162 (17) 131 (40) 133 (40) 212 (50) 212 (50)Sum variance 83 (39) 62 (30) 65 (30) 1305 (850) 1340 (820)Difference variance 6.4 (39) 5.5 (4.4) 4.5 (3.0) 33 (18) 32 (18)Difference entropy 2.2 (0.3) 2.1 (0.3) 2.0 (0.4) 2.7 (1.2) 2.7 (0.2)
Gray level difference statistics (GLDS)Contrast 18 (15) 15 (12) 12 (9) 90 (48) 85 (44)Entropy 5.2 (0.3) 4.7 (0.4) 4.7 (0.5) 5.4 (0.9) 5.4 (1.1)
Neighbourhood gray tone difference matrix (NGTDM)Coarseness 7.8 (0.8) 7.7 (2.3) 8.7 (2.3) 12.3 (8.6) 15.1 (10.5)Complexity 277 (111) 260 (227) 250 (200) 4064 (3014) 3748 (3767)
Statistical feature matrix (SFM)Periodicity 0.4 (0.03) 0.42 (0.08) 0.45 (0.08) 0.6 (0.01) 0.7 (0.01)Roughness 0.68 (0.03) 2.64 (0.11) 2.6 (0.14) 2.3 (0.1) 2.3 (0.1)
Laws texture energy measures (LTEM)LL 7140 (903) 6086 (3667) 5413 (4455) 36619 (1978) 40376 (1711)SS 40 (52) 112 (51) 100 (45) 177 (50) 158 (38)
Fractal dimension analysis (FDTA)H1 0.3 (0.01) 0.27 (0.07) 0.31 (0.09) 0.5 (0.001) 05 (0.1)H2 0.2 (0.01) 0.17 (0.02) 0.17 (0.04) 0.3 (0.2) 0.3 (0.1)
Fourier power spectrum (FPS)Radial sum 873 (250) 618 (243) 647 (301) 1586 (1048) 1330 (909)
ing wrgy fr
•
•
mtsttnaOpu
sttDwtc
dm
fsddused for following the progression of disability. Table 5
NWM: normal white matter; NAWM 0, NAWM 6—12: normal appear6—12: lesions at 0 and 6—12 months respectively; LL: texture ene
(see also Table 4), signifying the potential to aid in diseasediagnosis;
there were mostly non-significant differences based onthe EDSS score between lesions at 0 month and lesions at6—12 months for EDSS ≤ 2 and EDSS > 2 (see Table 5);
for each comparison different features gave significantdifference based on the Mann-Whitney test for both EDSSat 2 and 5 years (see Table 5).
Table 2 showed that the shape features eccentricity,ajor and minor axis length, and convex area are statis-
ically different between the same lesions detected andegmented at 0 and 6—12 months. These shape features mayherefore prove to have some value as markers for the longi-udinal monitoring of these lesions. In [2] it was shown thatew lesions and increase in disease volume is very weaklyssociated (� = 0.13—0.23) with increase in disability (EDSS).
Please cite this article in press as: Loizou CP, et al. Quanderived from T2-weighted MR images in MS patients withttp://dx.doi.org/10.1016/j.neurad.2014.05.006
n the other hand, a simple correlation of the onset androgression of lesions in relation to the EDSS is extremelynlikely as documented in [9].
(tN
hite matter at 0 and 6—12 months respectively; lesion 0, lesionsom LL kernel; SS: texture energy from SS kernel.
Table 3 showed that some of the texture features areensitive to the onset of the MS disease. It was shownhat texture features such as standard deviation (SF fea-ure group), contrast (GLDS feature group), SOSV, SV, DV,E, increase with the onset of the disease when comparedith their corresponding NAWM tissue values, whereas with
he onset of the disease to 6—12 months they decrease whenompared with the NWM (see also Fig. 3).
Table 4 shows that there are features that can be used toistinguish between NWM, NAWM and lesions at 0 and 6—12onths.From Table 5, one can see that there are some texture
eatures that can be possibly used to differentiate betweenubjects with mild (EDSS ≤ 2) and advanced (EDSS > 2) MSisease states and also that there are features that haveifferences not present at the baseline and which may be
titative texture analysis of brain white matter lesionsh clinically isolated syndrome. J Neuroradiol (2014),
left part), showed that the SGLDM features DE, con-rast, SV, entropy and mean can be used to differentiateAWM in advanced disease cases of subjects with EDSS > 2
Please cite
this article
in press
as: Loizou
CP, et
al. Q
uantitative texture
analysis of
brain w
hite m
atter lesions
derived
from
T2-weighted
M
R
images
in
M
S
patients
with
clinically
isolated
syndrom
e.
J
Neuroradiol
(2014),
http://dx.doi.org/10.1016/j.neurad.2014.05.006
AR
TIC
LE
IN P
RE
SS
+Model
NEU
RAD-466;
N
o. of
Pages 16
Quantitative
texture analysis
of brain
white
matter
lesions
11
Table 4 Statistical analysis between the NWM, and NAWM and lesions at 0 and 6—12 months. The Mann-Whitney rank sum test was used and shows with (S) significantly and(NS) non-significantly different features at P < 0.05.
Feature Texture
NWM vs.NAWM 0
NWM vs.NAWM 6—12
NWM vs.lesion 0
NWM vs.lesions 6—12
NAWM 0 vs.NAWM 6—12
NAWM 0 vs.lesions 0
NAWM 6 vs.lesions 6—12
Lesion 0 vs.lesions 6—12
Statistical featuresStandard deviation NS S S S NS S NS NSMedian S S S S NS S NS NS
Spatial gray level dependence matrix (SGLDM) mean valuesContrast NS S S S NS S S NSCorrelation NS S S S S S S NSIDM S S S S S S S NSSum variance NS NS S S NS S S NSDV NS S S S S S S NSDE NS S S S S S S S
Gray level difference statistics (GLDS)Contrast S S S S S S S SEntropy S S NS S NS S S NS
Neighbourhood gray tone difference matrix (NGTDM)Coarseness NS S S S S S S NSContrast NS S S S S S S S
Statistical feature matrix (SFM)Periodicity NS S S S S S S SRoughness NS S NS S S S S NS
Laws texture energy measures (LTEM)LL NS NS NS S NS S S NSSS NS NS NS S NS S S NS
Fractal dimension analysis (FDTA)H1 NS S NS S S S S NS
NWM: normal white matter; NAWM 0, NAWM 6—12: normal appearing white matter at 0 and 6—12 months respectively; lesion 0, lesions 6—12: lesions at 0 and 6—12 months respectively;SOSV: sum of squares variance; IDM: inverse difference moment; DV: difference variance; DE: difference entropy.
Please cite
this article
in press
as: Loizou
CP, et
al. Q
uantitative texture
analysis of
brain w
hite m
atter lesions
derived
from
T2-weighted
M
R
images
in
M
S
patients
with
clinically
isolated
syndrom
e.
J
Neuroradiol
(2014),
http://dx.doi.org/10.1016/j.neurad.2014.05.006
AR
TIC
LE
IN P
RE
SS
+Model
NEU
RAD-466;
N
o. of
Pages 16
12
C.P. Loizou
et al.
Table 5 Comparison of the texture features between subjects with EDSS ≤ 2 and EDSS > 2, measured in two and in five years after initial diagnosis (shown separated with‘/’). The Mann-Whitney rank sum test was used at P < 0.05. Significant difference is depicted with S with the P-values shown in parentheses. Only the features that showedsignificant difference are shown out of 61 different texture features.
NAWM Lesions
Feature 0 month 6—12 months Feature 0 month 6—12 months
EDSS > 2 ≤ 2 > 2 ≤ 2
0 month ≤ 2 Skewness-FOS S (0.03)/S (0.03) S (0.03)/S (0.01) Mean-FOS S (0.03)/S (0.04) —Contrast-SGLDMm — S (0.03)/— Median-FOS S (0.03)/S (0.03) —IDM-SGLDMm —/S (0.03) S (0.04)/S (0.04) IDM-SGLDMm S (0.01)/S (0.04) —Sum entropy-SGLDMm S (0.03)/— — Sum average-SGLDMm S (0.04)/— —Bussynes-NGTDM S (0.04)/S (0.04) — IMOC-SGLDMm S (0.006)/S (0.04) —Complexity-NGTDM S (0.01)/— — ASM-GLDS S (0.02)/S (0.03) —Strength-NGTDM S (0.03)/— — Mean-GLDS S (0.04)/— —Periodicity-SFM — S (0.04)/— Contrast-NGTDM S (0.04)/S (0.04) —Roughness-SFM — S (0.04)/S (0.04) Hurst coefficients 3-FDTA —/S (0.02) —LE and EL-TEM S (0.04)/S (0.04) — — —LS and SL-TEM S (0.04)/S (0.04) — —
6—12 months > 2 Sum average-SGLDMm —/S (0.03) S (0.03)/— Mean-FOS — S (0.02)/S (0.05)Difference entropy-SGLDMm S (0.02)/S (0.05) — Median-FOS — S (0.02)/S (0.04)Contrast-SGLDMr S (0.04)/— — Sum average-SGLDMm — S (0.02)/S (0.06)Sum variance-SGLDMr S (0.01)/— — Entropy-SGLDMm — S (0.03)/S (0.04)IDM-SGLDMr — —/S (0.04) IMOC-SGLDMm — S (0.01)/S (0.04)Entropy-SGLDMr S (0.04)/— — ASM-GLDS — —/S (0.04)Mean-GLDS S (0.04)/S (0.03) — IDM-SGLDMr — —/S (0.01)Coarseness-NGTDM —/S (0.04) Sum entropy-SGLDMm — —/S (0.01)Contrast-NGTDM S (0.04)/S (0.04) — Radial sum-FDS — —/S (0.01)
NAWM: normal appearing white matter; IDM: inverse difference moment; SA: sum average; IMOC: information measures of correlation; ASM: angular second moment; LE and EL: averagetexture energy from LE and EL kernels: LS and SL: average texture energy from LS and SL kernels.
IN+Model
sZfosgot
niNTsigm
a3etiswaMgtstPsptfiim
tsiawstfislpal
[oT
ARTICLENEURAD-466; No. of Pages 16
Quantitative texture analysis of brain white matter lesions
between 0 and 6—12 months intervals. The features skew-ness (SF), contrast (SGLDM), IDM (SGLDM), periodicity (SFM)and roughness (SFM) can be used to differentiate NAWMat mild disease cases (EDSS ≤ 2) between subjects at 0and 6—12 months. Finally, the texture feature SA, IDM andcoarseness can be used to differentiate NAWM between mild(EDSS ≤ 2) and advanced (EDSS > 2) disease cases for subjectsat 6—12 months. From the results of Table 5 (right part),the features mean, median, IDM, SA, IMOC, ASM, contrastand Hurts coefficients for 0 month and the features mean,median, SA, entropy and IMOC for 6—12 months gave signif-icant differences between the two cases (EDSS ≤ 2 versusEDSS > 2). Those features may be used therefore to reli-ably differentiate lesions associated with mild and advancedcases of the disease.
To the best of our knowledge, only a handful of otherstudies [29,30] were carried out for differentiating betweenthe aforementioned two disability scores investigating asmaller set of different features. Several studies were car-ried out for differentiating and classifying NWM, and orNAWM, and lesions, as these are summarized below.
Discussion
The primary objective of this study is to evaluate differenttexture features that can be used to predict MS brain lesionsthat at a later stage are associated with advanced clinicaldisability. In addition, the use of texture features analy-sis to detect significant differences between NWM, NAWM,and MS lesions as well as for better tissue discriminationbetween them is also investigated. Texture features wereextracted and investigated based on statistical measures,and univariate statistical analysis.
Various studies have been performed in order to establisha relationship between the various gray levels and texturefeatures [9—14]. In [7], MRI texture analysis based on sta-tistical, autoregressive model, and wavelet-derived textureanalysis was performed on 29 MS subjects. The classifica-tion accuracy between MS lesions, NAWM and plaques NWM,was 96—100%. In [10], the authors showed that texture fea-tures can reveal discriminant features for differentiatingbetween normal and abnormal tissue, and for image segmen-tation. The differentiation between active and non-activebrain lesions in MS subjects from brain MRI was investi-gated in [14], where active lesions were identified withoutfrequent gadolinium injections, using run length analysiscriteria.
Likewise in [15], texture analysis was performed, usinglinear discriminant analysis, on MR images of MS subjects andnormal controls and a combined set of texture features wereexplored in order to better discriminate tissues betweenMS lesions, NAWM and NWM. The results demonstrated thatcompared with GLCM-based features, the combined set oftexture features were better at discriminating MS lesionsand NWM, equally good at discriminating MS lesions andNAWM and at all three tissue types, but less effective inclassification between NAWM and NWM. The classification
Please cite this article in press as: Loizou CP, et al. Quanderived from T2-weighted MR images in MS patients withttp://dx.doi.org/10.1016/j.neurad.2014.05.006
accuracy in tissue discrimination between MS lesions andNAWM was over 90%.
In [18], it was shown that several hemispherical differ-ences for primary progressive MS and relapsing remitting MS
tfpM
PRESS13
clerosis can be found with texture analysis. Most recently,hang et al. [19] hypothesized correlation between textureeatures of T2-weighted MRI images and histological changesf postmortem MS brains. They found that tissues with moreignificant myelin and axonal pathology are associated withreater texture heterogeneity showing that texture analysisn routine clinical MR images may be a potential measure ofissue integrity and thus MS disease activity and progression.
In [31], quantitative parameters anisotropy and lami-arity were derived from 3D texture analysis. Differencesn NWM texture associated with gender and changes ofWM texture with age were studied on healthy subjects.he study demonstrated that the texture anisotropy analy-is of anatomical MRI brain datasets provides quantitativenformation, which may help to better understand theender-related differences and NWM alterations with brainaturation and aging.In [29], 23 normal controls and 73 subjects with either
CIS (38 subjects) or clinically definite MS (CDMS, with5 subjects) were scanned and texture parameters werextracted. The texture parameters were compared betweenhe groups and correlated with clinical measures of disabilityn the MS subjects to investigate any association with diseaseeverity. The study showed that no significant differencesere found between the texture parameters from controlsnd CIS subjects; but that several parameters differ betweenS subjects and the two other groups, particularly in theray matter, but also in the NAWM. There were also correla-ions found between some of the parameters and the clinicalcores obtained from the subjects. The EDSS and timed walkest correlate with gray matter texture measures, while theaced Auditory Serial Addition Test 3 score, a cognitive mea-ure, correlates with NAWM texture. The study highlightedotential for texture analysis measures in classifying cen-ral nervous system demyelinating diseases that warrantsurther investigation; and the results added evidence to thedea that widespread, but subtle, damage occurs to NAWMn MS, and that this occurs in both white matter and grayatter.The work in [9] showed that histograms could charac-
erize changes between MS lesions and NAWM. It was alsohown that texture features and histograms might be usedn discriminating between segmented areas of normal andbnormal tissue. In [13], significant differences in textureere also found between normal and MS subjects in the
pinal cord as well as a significant correlation between tex-ure features and disability. The increase of these textureeatures suggests that the lesions texture in MS subjectss less homogeneous and more complex than the corre-ponding healthy tissue (NWM) in normal subjects [13]. Thisoss in homogeneity may be a result of some pathologicalrocesses, including demyelination, gliosis, inflammation,xonal loss, or changes in water content and leading to aess uniform MR signal intensity.
Findings presented in Table 4 corroborate the findings in9] showing that texture features increase with the onsetf the MS disease when compared to normal tissue (seeable 4). In Table 4 we showed using statistical analysis, that
titative texture analysis of brain white matter lesionsh clinically isolated syndrome. J Neuroradiol (2014),
here was a significant difference between NWM and NAWMor some features. These findings may prove quite useful forropelling the research for early diagnosis and treatment ofS.
IN+ModelN
1
lpabmuavst
iciNGf3sittstNtabstistwehmfistPts
mawchtt
ecicAmrd
[iFatregaretTbai
L
TsAepswvTtactsosentiousqfiimtaMswidko
ARTICLEEURAD-466; No. of Pages 16
4
In most previous studies [29,32,33] assessment of MSesions nature and corresponding differential diagnosis waserformed by visual evaluation of the lesion’s features suchs size, site and morphology. Only in [13] has an attempteen first made to assess the lesion’s texture by computerethods. Such analysis may be of value since pixel val-
es, pixel interrelations, and lesion texture may be moreccurately analyzed by computer methods than they can beisually estimated. According to the findings of the presenttudy, there exist significant differences in the values of theextural features extracted between 0 and 6—12 months.
Recently MRI studies using magnetization transfer imag-ng and, specifically, the magnetization transfer ratio (MTR)an quantify demyelination severity, because MTR is reducedn WM lesions [34] with milder decreases also observed inAWM and gray matter [35,36]. Tozer et al. [29] estimatedLCM textural features extracted from magnetization trans-
er MRI acquired from 23 healthy controls as well as from2 subjects with relapsing remitting MS, 3 subjects withecondary progressive MS, and 38 subjects with CIS, andnvestigated the relationship between textural features andhe EDSS. While the authors found no differences betweenhe features extracted from controls and subjects with CIS,everal features differed between subjects with MS andhe 2 other groups, especially in gray matter (but also inAWM). Disability scores also correlated well with GLCM tex-ural features extracted from NAWM regions. Texture featurebnormalities in MS suggested there might be tissue damageeyond classic white matter lesions and that these featureshow potential for quantifying the severity of demyelina-ion. In [37], the damage to the uncinated fasciculus andnferior longitudinal fasciculus in 16 patients with progres-ive supranuclear palsy (PSP) was evaluated using diffusionensor tract-specific analysis. It was found that patientsith PSP and Richardson syndrome had significantly differ-nt clusters of reduced gray matter when compared to theealthy control subjects, and thus demonstrated impair-ent of the uncinated fasciculus and inferior longitudinal
asciculus. Finally, in a more recent study [38], alterationsn brain white matter in photosensitive epilepsy (PSE) weretudied in 24 subjects by applying tract-based spatial statis-ics analysis. It was shown that the corpus callosum of theSE patients was abnormal and had significantly lower frac-ional anisotropy values when compared with the controlubjects.
In the presented study with the evaluation of a muchore extensive set of texture features the correlation of dis-
bility scores with the different features is more pronouncedith the presence of features that may enable the classifi-ation of patients with scores EDSS ≥ 2 (see also Table 5). Weave shown in a recent study [39] performed by our grouphat a classification score of 69% was achieved when usinghe SVM classifier for classifying MS lesions and NAWM.
Furthermore, the texture features shown in Table 4 mightncode meaningful interpretations regarding the clinicalontext of MS, lesions and NAWM. The median value is anndex that intuitively shows the brightness of each ROI. Asan be seen from Table 3, MS lesions are brighter than NWM.
Please cite this article in press as: Loizou CP, et al. Quanderived from T2-weighted MR images in MS patients withttp://dx.doi.org/10.1016/j.neurad.2014.05.006
nother important textural feature is contrast, which is aeasure of local variation between pixel intensities. MS
egions had higher contrast values than NWM regions. Inverseifferent moment (IDM) is related to lesions homogeneity
afrn
PRESSC.P. Loizou et al.
23]. In NWM, IDM had higher values than in MS regions,mplying that NWM were smoother and more homogeneous.rom another perspective, MS lesions attained lower entropynd sum of average values than NWM ROIs, indicating thathe degree of randomness of pixel intensities or texturaloughness in MS regions was lower. Conclusively, MS regionsxhibit lower signal intensity, higher contrast, less homo-eneous and rougher as compared to NWM. These findingsre in agreement with observations by Mathias et al. [13]egarding MS lesions. The latter were found with increasedntropy and decreased angular second moment, implyinghat MS lesion texture was rough and of low homogeneity.his loss of homogeneity in MS may be attributed to a num-er of processes such gliosis, inflammation, demyelinationnd changes in water content that may disrupt MR signalntensity uniformity [13].
imitations of the texture analysis method
he limitations of this study are similar with the ones pre-ented in a recent study performed by our group wheremplitude Modulation-Frequency Modulation features werextracted from NWM, NAWM and lesions [17] and here belowresented in detail. The MRI images in this study were inten-ity normalized based on the method proposed in [21]. Thisas done in order to reduce the effects of image intensityariation between images obtained at different time-points.he variation in intensity can have a significant impact whenrying to compare between different images and texture andlso when trying to generate global tissue models for tissuelassification [14]. The normalization process proposed inhis study uses prior knowledge of the high and low inten-ity values of the brain, so that the new intensity histogramf the lesion has its maximum peak close to its average graycale value [12]. More specifically, the influence of differ-nt MRI acquisition protocols and four gray level intensityormalization methods on the discrimination power on theexture analysis of two classes of samples were investigatedn [12]. MRI image may suffer from artifacts of differentrigin, such as image thermal noise, image background non-niformity form magnetic field in homogeneities, and notandardization of image gray scale intensity. High imageuality and minimization of these artifacts are importantor performing quantitative analysis. The intensity normal-zation method firstly proposed in [22] and then later appliedn [12,20] was used in this study. The proposed normalizationethod allows the scanner sensitivity variations and varia-
ions due to repeatability studies to be largely correctednd thereby facilitating meaningful comparisons betweenRI data sets obtained at different times and/or different
ubjects. By normalizing the histogram of the whole-braine introduced an automatic procedure with little sensitiv-
ty to pathological or morphological changes between theifferent image data sets. The method does not depend onnowledge of the scanner calibration and thus can be usedn retrospective data.
T2-weighted MR imaging is very sensitive to tissue
titative texture analysis of brain white matter lesionsh clinically isolated syndrome. J Neuroradiol (2014),
bnormalities in human brain, and many histopathologicaleatures in MS, such as edema, gliosis, demyelination andemyelination are depicted as hyperintensity lesions. It isot sensitive, however, to discrete tissue damage in NAWM.
IN+Model
tpppsTar
D
Tc
A
Ta0RR
R
[
[
ARTICLENEURAD-466; No. of Pages 16
Quantitative texture analysis of brain white matter lesions
Since the assessment of NAWM may provide more informa-tion concerning disease burden and evolution, the intentionhere was to characterize NAWM by using texture features.
The fact that ROI-specific findings were summed up persubject is a limitation of the current study since statisti-cal results may have been distorted to some extent (eitherby masking differences via averaging out subtle changes orby enhancing small differences through outlier overweight-ing). More than two time-points for imaging data acquisitionwould be needed to allow drawing of reliable conclusionsregarding the existence or not of temporal resolving powerof the features computed. In addition, the interval betweenthe examined time-points can be considered relatively smallwith respect to disease evolution in CIS. Although a stan-dardized procedure was followed for brain MRI planningpurposes, image registration between serial scans was notimplemented to ensure maximum compatibility regardinglesion detection and segmentation. Regarding texture anal-ysis, the correspondence between texture features andhistological parameters remains a matter of debate sinceMRI image voxel resolution is much lower than the resolutionin histological structures [10]. In addition, texture featuresanalysis presented in this study is dependent [10] on:
• MR acquisition parameters;• the quality assessment of the MRI device used;• the methods of image reconstruction and processing.
Another limitation is that by computing the average val-ues in texture features per subject somehow the individuallesions variability is diminished and that inter correlationbetween texture analysis results derived from T2-weightedimages and other MRI findings may provide further insightin the pathophysiology of the disease and offer valuableinformation towards the development of prognostic disabil-ity measures. It is noted that no multiple comparison testingwas carried out and this is a limitation of the study. On theother hand, a relatively small number of statistical tests wascarried out and thus we think that multiple testing correc-tion wouldn’t affect the results.
Conclusion
The results of this study indicate that several texture fea-tures of T2 MRI brain white matter lesions can be used todifferentiate between brain lesions NWM, and NAWM, thatlead to minimal (EDSS ≤ 2) and mild clinical signs (EDSS > 2).They may furthermore, have an additional potential role inthe clinical evaluation of MRI images in MS and perhaps mayprovide some prognostic evidence in relation to future dis-ability of patients. However, a larger scale study is needed toestablish the application in clinical practice and for comput-ing shape and texture features that may provide informationfor better and earlier differentiation between normal braintissue and MS lesions.
Further future directions including improvements in themeasurement and preprocessing of the image by applying
Please cite this article in press as: Loizou CP, et al. Quanderived from T2-weighted MR images in MS patients withttp://dx.doi.org/10.1016/j.neurad.2014.05.006
image normalization and validation of the results in a largernumber of subjects have also been discussed in [17].
In conclusion, we believe that the proposed methodologyin this study can provide a new and better clinical method for
[
PRESS15
he early diagnosis and monitoring of quantitative diseaserogression and of the effectiveness of various treatmentrotocols in multiple sclerosis. Texture analysis will likelylay in the future a supportive rather than a comprehen-ive role in the future of medical image interpretation.he robustness of texture analysis makes it particularlyttractive for monitoring disease progression or treatmentesponse with time, as demonstrated with MS.
isclosure of interest
he authors declare that they have no conflicts of interestoncerning this article.
cknowledgement
his work was supported through the project Quantitativend Qualitative Analysis of MRI brain images T�E/OPIZO/308(BIE)/15, 12/2008—12/2010, of the Program foresearch and Technological Development 2007—2013, of theesearch Promotion Foundation of Cyprus.
eferences
[1] Fazekas F, Barkof F, Filippi M, Grossman RI, Li DKB, McDon-ald WI. The contribution of magnetic resonance imaging to thediagnosis of multiple sclerosis. Neurology 1999;53:448—56.
[2] Filippi M, Paty DW, Kappos L, Barkhof F, Compston DA, et al.Correlations between changes in disability and T2-weightedbrain MRI activity in multiple sclerosis: a follow-up study. Neu-rology 1995;45:255—60.
[3] McDonald WI, Compston A, Edan G, Goodkin D, et al. Recom-mended diagnostic criteria for multiple sclerosis: guidelinesfrom the international panel on the diagnosis of multiple scle-rosis. Ann Neurol 2001;50:121—7.
[4] Polman CH, Reingold SC, Edan G, Filippi M, Hartung HP, KapposL, et al. Diagnostic criteria for multiple sclerosis: 2005 revisionsto the McDonald criteria. Ann Neurol 2005;58:840—6.
[5] Bakshi R, Thompson AJ, Rocca MA, Pelletier D, Dousset V,Barkhof F, et al. MRI in multiple sclerosis: current status andfuture prospects. Lancet Neurol 2008;7:615—25.
[6] Kassner A, Thornhill RE. Texture analysis: a review ofneurologic MR imaging applications. Am J Neuroradiol2010;31:809—16.
[7] Harrison LCV, Raunio M, Holli KK, Luukkaala T, Savio S, ElovaaraI, et al. MRI texture analysis in multiple sclerosis: toward aclinical analysis protocol. Acad Radiol 2010;17:696—707.
[8] Lövblad KO, Anzalone N, Dörfler A, Essig M, Hurwitz B, KapposL, et al. MR imaging in multiple sclerosis: review and rec-ommendations for current practice. AJNR Am J Neuroradiol2010;1:983—9.
[9] Dehmeshki J, Barker GJ, Tofts PS. Classifications of diseasesubgroups and correlation with disease severity using magneticresonance imaging whole-brain histograms: application to mag-netization transfer ratios and multiple sclerosis. IEEE Trans MedImaging 2002;21(4):320—31.
10] Herlidou-Meme S, Constans JM, Carsin B, Olivie D, Eliat PA,et al. MRI texture analysis on texture test objects, normal brainand intracranial tumors. Mag Res Imaging 2003;21:989—93.
11] Meier DS, Guttman CRG. Time-series analysis of MRI intensity
titative texture analysis of brain white matter lesionsh clinically isolated syndrome. J Neuroradiol (2014),
patterns in multiple sclerosis. NeuroImage 2003;0:1193—209.12] Collewet G, Strzelecki M, Marriette F. Influence of MRI acqui-
sition protocols and image intensity normalization methods ontexture classification. Magn Reson Imaging 2004;22:81—91.
IN+ModelN
1
[
[
[
[
[
[
[
[
[
[
[
[
[
[
[
[
[
[
[
[
[
[
[
[
[
[
ARTICLEEURAD-466; No. of Pages 16
6
13] Mathias JM, Tofts PS, Losseff NA. Texture analysis of spinalcord pathology in multiple sclerosis. Magn Reson Med 1999;42:929—35.
14] Yu O, Mauss Y, Zollner G, Namer IJ, Chambron J. Distinct pat-terns of active and non-active plaques using texture analysisof brain NMR images in multiple sclerosis subjects: preliminaryresults. Magn Reson Imaging 1999;17(9):1261—7.
15] Zhang J, Tong L, Wang L, Lib L. Texture analysis of multiplesclerosis: a comparative study. Magn Res Imaging 2008;26(8):1160—6.
16] Loizou CP, Pattichis CS, Seimenis I, Pantziaris M. Quantitativeanalysis of brain white matter lesions in multiple sclerosis sub-jects. In: 9th Int Conf Inform Techn Applic Biomed ITAB. 2009.
17] Loizou CP, Murray V, Pattichis MS, Seimenis I, Patziaris M,Pattichis CS. Multi-scale Amplitude Modulation-Frequency Mod-ulation (AM-FM) texture analysis of multiple sclerosis inbrain MRI images. IEEE Trans Inform Tech Biomed 2011;15(1):119—29.
18] Savio S, Hakulinen U, Ryymin P, Dastidar P, Soimakallio S, EskolaH. Comparison of diffusion tensor imaging and texture analy-sis findings on classification of multiple sclerosis patients. 5thEurop IFMBE Conf Proc 2001;37:579—82.
19] Zhang Y, Wayne Moore GR, Laule C, Bjarnason TA, KozlowskiP, Traboulsee A. Pathological correlates of MRI texture hetero-geneity in multiple sclerosis. Ann Neurol 2013;74(1):91—9.
20] Thompson AJ, Hobart JC. Multiple sclerosis: assessment of dis-ability and disability scales. J Neurol 1998;254(4):189—96.
21] Loizou CP, Pantziaris M, Pattichis CS, Seimenis I. Brain MRIimage normalization in texture analysis of multiple sclerosis. JBiomed Graph Comput 2013;3(1):20—34.
22] Nixon M, Aguado A. Feature extraction & image processing.Newnes; 2002.
23] Haralick RM, Shanmugam K, Dinstein I. Texture features forimage classification. IEEE Trans Syst Man Cybern 1973;SMC-3:610—21.
24] Weszka JS, Dyer CR, Rosenfield A. A comparative study of tex-ture measures for terrain classification. IEEE Trans Syst ManCybern 1976;SMC-6:269—85.
25] Amadasun M, King R. Textural features corresponding to tex-tural properties. IEEE Trans Syst Man Cybern 1989;19(5):264—1274.
Please cite this article in press as: Loizou CP, et al. Quanderived from T2-weighted MR images in MS patients withttp://dx.doi.org/10.1016/j.neurad.2014.05.006
26] Wu CM, Chen YC, Hsieh K-S. Texture features for classificationof ultrasonic images. IEEE Trans Med Imaging 1992;11:141—52.
27] Conover WJ. Practical nonparametric statistics. 3rd editionNew York: John Wiley & Sons; 1999.
[
PRESSC.P. Loizou et al.
28] Altman DG. Practical statistics for medical research. London:Chapman and Hall; 1991.
29] Tozer DJ, Marongiu G, Swanton JK, Thompson AJ, Miller DH.Texture analysis of magnetization transfer maps from subjectswith clinically isolated syndrome and multiple sclerosis. J MagnReson Imaging 2009;30(3):506—13.
30] Zhang Y, Zhu H, Mitchell JR, Costello F, Metz LM. MRI textureanalysis is a sensitive measure of tissue injury and recoveryresulting from acute inflammatory lesions in multiple sclerosis.Neuroimage 2009;47(1):107—11.
31] Kovalev V, Kruggel F. Texture anisotropy of the texture’s whitematter as revealed by anatomical MR. IEEE Trans Med Imaging2007;26(5):678—85.
32] Miller DH, Ormerod IE, Gibson A, du Boulay EP, RudgeP, McDonald WI. MR brain scanning in subjects with vas-culitis: differentiation from multiple sclerosis. Neuroradiol1987;29:226—31.
33] Singh S, Prabhakar S, Korah IP, Warade SS, Alexander M.Acute disseminated encephalomyelitis and multiple sclerosis:magnetic resonance imaging differentiation. Australas Radiol2000;44:404—11.
34] Schmierer K, Scaravilli F, Altmann DR, Barker GJ, Miller DH.Magnetization transfer ratio and myelin in postmortem multi-ple sclerosis brain. Ann Neurol 2004;56:407—15.
35] van Buchem MA, McGowan JC, Kolson DL, Polansky M, GrossmanRI. Quantitative volumetric magnetization transfer analysis inmultiple sclerosis: estimation of macroscopic and microscopicdisease burden. Magn Res Med 1996;36(4):632—6.
36] Davies GR, Altmann DR, Hadjiprocopis A, Rashid W, ChardDT, Griffin CM, et al. Increasing normal appearing gray andwhite matter magnetization transfer ratio abnormality in earlyrelapsing remitting multiple sclerosis. J Neurol 2005;252(9):1037—44.
37] Kouhei K, Noriko S, Miho O, Yasuhiro N, Kimiteru I, Yukio K,et al. Diffusion tensor tract-specific analysis of the uncinatefasciculus in patients with progressive supranuclear palsy. JNeuroradiol 2013;40(2):121—9.
38] Hanjian D, Bing X, Peigang L, Hua F, Jian W, Shaoji Y.Impaired white matter integrity in photosensitive epilepsy: aDTI study using tract-based spatial statistics. J Neuroradiol2014;41(2):131—5.
titative texture analysis of brain white matter lesionsh clinically isolated syndrome. J Neuroradiol (2014),
39] Loizou CP, Kyriacou EC, Seimenis I, Pantziaris M, Petroudi S,Karaolis M, et al. Brain white matter lesion classification inmultiple sclerosis subjects for the prognosis of future disability.Intell Decis Technol J (IDT) 2013;7:3—10.