Embed Size (px)
Citation preview
warwick.ac.uk/lib-publications
Original citation: du Toit, E., Squire, S. B., Dunbar, R., Machekano, R., Madan, Jason, Beyers, N. and Naidoo, P.. (2015) Comparing multidrug-resistant tuberculosis patient costs under molecular diagnostic algorithms in South Africa. The international journal of tuberculosis and lung disease, 19 (8). pp. 960-968. Permanent WRAP URL: http://wrap.warwick.ac.uk/85052 Copyright and reuse: The Warwick Research Archive Portal (WRAP) makes this work by researchers of the University of Warwick available open access under the following conditions. Copyright © and all moral rights to the version of the paper presented here belong to the individual author(s) and/or other copyright owners. To the extent reasonable and practicable the material made available in WRAP has been checked for eligibility before being made available. Copies of full items can be used for personal research or study, educational, or not-for-profit purposes without prior permission or charge. Provided that the authors, title and full bibliographic details are credited, a hyperlink and/or URL is given for the original metadata page and the content is not changed in any way. Publisher’s statement: © IITLD 2015 A note on versions: The version presented here may differ from the published version or, version of record, if you wish to cite this item you are advised to consult the publisher’s version. Please see the ‘permanent WRAP URL’ above for details on accessing the published version and note that access may require a subscription. For more information, please contact the WRAP Team at: [email protected]
1
A comparison of multidrug-resistant tuberculosis patient costs under molecular 1
diagnostic algorithms in South Africa. 2
3
Authors: 4
Elizabeth du Toit1, S. Bertel Squire2, Rory Dunbar1, Rhoderick Machekano3, Jason Madan4, Nulda 5
Beyers1, Pren Naidoo1 6
7
Affiliations: 8
9
1Desmond Tutu TB Centre, Department of Paediatrics and Child Health, Faculty of Medicine and 10
Health Sciences, Stellenbosch University, South Africa 11
2Liverpool School of Tropical Medicine, Liverpool, United Kingdom 12
3Biostatistics Unit, Centre for Evidence Based Health Care, Faculty of Medicine and Health 13
Sciences, Stellenbosch University, South Africa 14
4Warwick Medical School, University of Warwick, Coventry, United Kingdom 15
16
Corresponding author: Elizabeth du Toit, Desmond Tutu TB Centre, Department of Paediatrics 17
and Child Health, Faculty of Medicine and Health Sciences, Stellenbosch University, South Africa, 18
Telephone: (+27) 219389114, Fax: (+27)21 9389719, Email: [email protected] 19
20
Conflicts of interest: 21
The authors declare that there are no conflicts of interest 22
23
Author contributions: EdT, SBS, NB and PN were involved in the study design, EdT, PN in the 24
data collection, EdT, RD, RM, JM in the data analysis, EdT, SBS, RD, RM, JM, NB, and PN in writing 25
the manuscript 26
27
Running head: MDR-TB patient costs 28
Text word count: 4039 29
30

2
SUMMARY 31
32
Setting: The study took place in Cape Town, South Africa from 2010-2013 as part of an 33
observational cohort in 10 primary health facilities. 34
Study Aim: A comparison of costs incurred by patients in MDRTBPlus line probe assay and Xpert 35
MTB/RIF-based diagnostic algorithms, from the onset of illness until multidrug-resistant 36
tuberculosis treatment initiation. 37
Methods: Eligible patients were identified from laboratory and facility records, interviewed 3-6 38
months after treatment initiation and a cost questionnaire completed. Direct and indirect costs, 39
individual and household income, loss of individual income and change in household income 40
were recorded in local currency, adjusted to 2013 costs and converted to US$. 41
Results: The median number of visits to initiation of multidrug-resistant tuberculosis treatment 42
was reduced from 20 to 7 (p<0.001) and median costs from $68.1 to $38.3 (p=0.004) in the 43
Xpert group. From the onset of symptoms to being interviewed, the proportion unemployed 44
increased from 39% to 73% in the LPA group (p<0.001) and from 53% to 89% in the Xpert 45
group (p<0.001). There was a decrease of 16% in median household income in the LPA group 46
and 13% in the Xpert group. 47
Conclusion: The introduction of an Xpert-based algorithm brought relief by decreasing the cost 48
incurred by patients, but the loss of employment and income persist. Patients require support to 49
mitigate this impact. 50
51
52
Key words: molecular diagnostic tests, patient costs, income loss, impact assessment. 53
54
55

3
BACKGROUND 56
"TB is the child of poverty - and also its parent and provider" [Archbishop Desmond Tutu.] 57
58
Tuberculosis (TB) disproportionately affects the poor(1) due to a complex interaction between 59
many factors, including, poor nutrition, overcrowded living or working conditions, and 60
concomitant disease, such as human immunodeficiency virus (HIV) infection(2,3). TB 61
perpetuates a cycle of poverty with affected families losing household income through disability 62
or death and confronting costs in diagnosing and treating the disease. TB also affects the most 63
economically viable, being among the top three causes of death for women aged 15 - 44 years(4). 64
65
TB patients incur significant costs from the onset of their illness until diagnosis, with costs, as a 66
percentage of household income, being higher for poor patients(5–9). Long delays exist between 67
the onset of TB symptoms and initiation of TB treatment, attributed to both the patient and the 68
health system(10,11). The longer this delay, the more likely a patient is to both transmit TB(12) 69
and to incur costs for transport, accessing healthcare, purchasing pharmaceuticals, and losing 70
work time and productivity. 71
72
Several systematic reviews report on diagnostic and treatment costs faced by TB patients. Costs 73
ranged widely between countries with one review reporting the largest costs being incurred for 74
hospitalization, medication, transportation and private healthcare(6). Ukwaja et al(13) report 75
mean diagnostic costs for patients in Africa ranging between 10.4% to 35% of mean annual 76
income and concluded that average diagnostic costs for TB were “catastrophic”, defined in 77
different studies as costs greater than 10% of monthly or annual household income, greater than 78
40% of non-subsistence household income, or the use of non-reversible coping strategies (5,14). 79
Patients in the lowest income bracket face the greatest risk of “catastrophic” costs(5). Tanimura 80
et al(14) found that direct medical costs accounted on average for 20%, direct non-medical costs 81
for 20% and income loss for 60% of total cost for patients in low- and middle-income countries. 82
Pre-treatment costs accounted for half of total costs. In Burkina Faso, 72% of patients were 83
found to have incurred direct medical costs during the pre-diagnostic phase(15). 84
85
Those with multi-drug resistant (MDR) TB face an even greater economic burden, with low cure 86
rates and lengthy treatment of up to two years(16–18). Three studies reported by Tanimura et 87
al disaggregated the total costs for TB and MDR-TB patients and showed that costs were higher 88

4
for those with MDR-TB(14). In one of these studies pre-diagnostic costs for MDR-TB patients 89
were just over double that of TB patients(17). No studies from sub-Saharan Africa were found 90
pertaining specifically to MDR-TB patient diagnostic costs. 91
92
Implementation of Xpert MTB/RIF (Xpert) has reduced the time taken to diagnose MDR-TB(19) 93
and it is anticipated that patients will benefit economically through fewer pre-treatment 94
healthcare visits, and the potential for an earlier diagnosis to decrease morbidity and mortality. 95
It is important to ascertain the benefit which new technology affords to vulnerable groups(20). 96
This study compared costs incurred by patients in MDRTBPlus line probe assay (LPA) and Xpert-97
based diagnostic algorithms, from the onset of symptoms until MDR-TB treatment initiation. 98
99
METHODS 100
101
Setting: 102
103
The study took place in a routine operational setting in Cape Town, South Africa. The country has 104
high levels of poverty, with 56.8% of people living below the poverty line(21). Household 105
incomes show persistent disparities along racial lines, with average annual household income of 106
ZAR387,011 amongst “white” households compared to ZAR 69,632 amongst “black” households 107
and 48.7% of “black” households with annual household income <ZAR9,886(22). The 108
government has implemented a range of social protection measures to combat this, including 109
both conditional (child support and disability grants) and unconditional (pensions for men >65 110
and women >60-years old) cash transfers and the provision of free primary health services (23). 111
112
Free TB diagnostic services were provided at 142 primary health-care (PHC) facilities in Cape 113
Town; 101 of these together with the dedicated TB–hospital offered free TB treatment. There 114
was a PHC facility within about a 5 km radius of all households. TB tests were done at a central 115
laboratory and results recorded in an electronic laboratory database. 116
117
In 2010, a smear, culture and LPA-based diagnostic algorithm was in place (Figure 1) with LPA 118
performed on culture isolates in high MDR-risk TB presumptive cases. From 2011 Xpert was 119
sequentially introduced into facilities, replacing smear microscopy for all presumptive TB cases 120
(Figure 1). In both algorithms, cases with a failing 1st line TB treatment regimen were evaluated 121

5
for MDR-TB through culture and LPA. We refer to patients diagnosed under these algorithms as 122
the LPA and Xpert groups respectively. 123
124
MDR-TB patients received standardised treatment regimens. At the start of data collection in 125
2010, doctors at the TB hospital reviewed case records and prescribed treatment but most 126
patients initiated treatment at PHC facilities. Since 2012 (mid-way through the study), doctors 127
could initiate MDR-TB treatment at PHC facilities without the need for prior review of case 128
records at the TB-hospital. 129
130
Study Population: 131
132
The study was part of an observational cohort in 10 high TB-burden PHC facilities selected from 133
a total of 29 that met the criteria of a TB caseload of >350 in 2009. We sorted facilities from best 134
to worst performing based on new smear positive treatment outcomes and randomly selected 135
five facilities above and five below the median treatment success rate of 78%. 136
137
Eligible patients diagnosed in either algorithm were >18-years of age, had been diagnosed with 138
rifampicin or rifampicin and isoniazid resistance from sputa tested in Cape Town between June 139
2010 and December 2012, and had received MDR-TB treatment at one of the 10 PHC facilities. 140
Patients with previous MDR-TB treatment were excluded, as their pathway to care may have 141
been different. Those with pre- or extensively drug-resistant TB or who had interrupted MDR-TB 142
treatment at the time of the scheduled interview were excluded. For infection control and safety 143
of the researchers, only patients who had been on MDR-TB treatment for at least 3 months and 144
were smear negative were interviewed. 145
146
Data Sources and Collection: 147
148
Patients diagnosed at selected facilities were identified from the electronic laboratory database; 149
those diagnosed elsewhere, but on treatment at selected facilities, were identified from facility 150
DR-TB paper registers and clinical records. 151
152
Trained professional nurses located patient folders, reviewed study eligibility and recorded 153
demographic, laboratory and clinical data, and the patients’ healthcare visits on case report 154

6
forms. The clinical coordinator used this information to populate a timeline on a patient cost 155
questionnaire with the number and dates of visits. This was used to probe and clarify responses 156
provided by the patient during the interview. 157
158
Three to six months after the start of treatment, one of two graduate social scientists obtained 159
informed consent and conducted interviews with patients at the PHC facility, in their language of 160
choice. A structured cost questionnaire was completed detailing the patient’s care-seeking visits 161
from the reported onset of symptoms to MDR-TB treatment initiation. This included time spent 162
at healthcare facilities, travel time and out of pocket payments. Employment status and 163
individual and household income were assessed both prior to the onset of symptoms and at the 164
time of the interview. The clinical coordinator checked the questionnaire and the text relating to 165
care seeking visits and transcribed data onto a coded spreadsheet. 166
167
Costs Assessed: 168
169
Direct costs comprised medical (for private practitioner consultation, diagnostic tests and 170
medication) and non-medical (travel for return trips to the healthcare provider) expenditure as 171
reported by patients. Money spent on food and expenditure incurred for persons accompanying 172
the patient were not assessed. Indirect costs comprised opportunity costs for patient time. The 173
number of healthcare visits was determined from the folder review and patient interview. 174
Patient time comprised time spent in a healthcare facility, 8 hours per day for hospitalized 175
patients, and time spent in travel to the healthcare facility. The cost per hour for patient time 176
was calculated for all patients using the hourly wage (ZAR11.17) of a municipal worker in Cape 177
Town in 2013(24). We decided to use a basic wage for all patients as it was difficult to calculate 178
an average hourly wage for the large percentage that were unemployed or self-employed and 179
worked variable hours. The implications of this method are addressed in the discussion. 180
181
The total cost to the patient was calculated as the sum of direct and indirect costs. All costs were 182
calculated in local currency (ZAR) for that year, adjusted to 2013 costs using the annual 183
consumer price index(25) and converted to US$ based on average United Nations treasury 184
operational rates in 2013(26). 185
186
Definitions: 187

7
188
Healthcare visit: Any visit made to a pharmacy, private practitioner, traditional healer or 189
medical facility to seek care from the reported onset of symptoms with the current illness to 190
MDR-TB treatment initiation. This included directly observed therapy (DOT) visits for those on 191
1st-line TB treatment prior to MDR-TB treatment initiation; non TB-related visits were excluded. 192
MDR-TB diagnostic time-point: Defined as either pre-treatment, for a presumptive TB case 193
being concurrently evaluated for TB and drug resistance, or as on 1st line TB treatment, for a 194
case on a failing 1st-line TB regimen being evaluated for drug susceptibility. 195
196
Data Management and Statistical analysis: 197
198
Data from the case report forms and cost questionnaire were double entered into a Microsoft 199
SQL database, corrected and analyzed using STATA 12 (StataCorp). Some information on the 200
variables collected was incomplete and only reported data have been analysed. We compared 201
differences between the algorithms and between MDR-TB diagnostic time points. Categorical 202
data were summarized using proportions and compared using the chi-square test. Continuous 203
data were summarized using means and standard deviations or medians and interquartile 204
ranges. Continuous variables were assessed using either the two-sample t-test or Wilcoxon rank 205
sum test depending on the distribution of the variable. 206
207
Median as opposed to mean visits and costs are presented as the data were skewed and medians 208
are considered a more representative reflection of the sample. Mean values are presented as 209
supplementary information. We used a quantile regression model to assess the effect of potential 210
confounders such as age, gender, previous TB and HIV status on median visits and costs. 211
212
Ethics: 213
214
The Health Research Ethics Committee at Stellenbosch University (IRB0005239)(N10/09/308) 215
and Ethics Advisory Group at The International Union Against Tuberculosis and Lung Disease 216
(59/10) approved the study. The City Health Directorate, Western Cape Health Department and 217
National Health Laboratory Service granted permission to use routine health data for which a 218
waiver of informed consent was granted. All study participants provided informed consent for 219
interviews. 220

8
221
RESULTS 222
223
Demographic and clinical characteristics: 224
225
Of the 226 eligible patients, 153 were interviewed and 73 were excluded (Figure 2). Excluded 226
patients did not differ significantly in gender (p=0.344), age (p=0.561), HIV status (p=0.893), 227
previous TB treatment (p=0.101), or MDR-TB diagnostic time-point (p=0.471) from those 228
included. 229
230
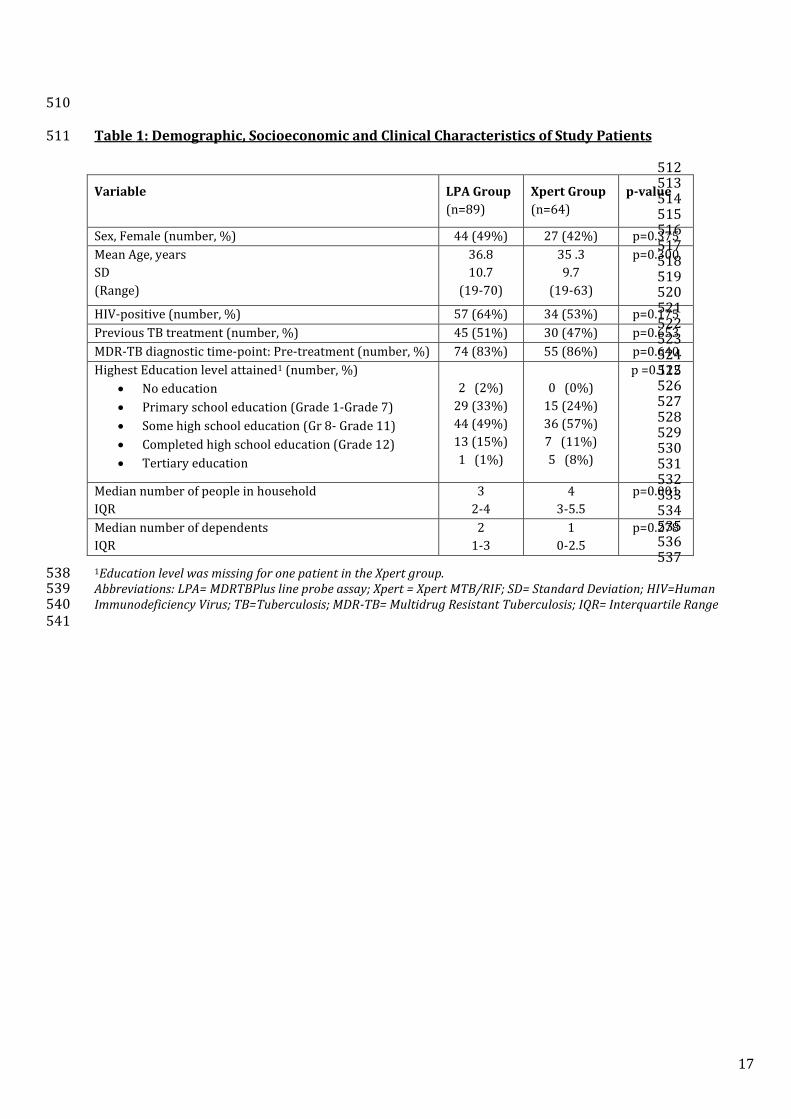
Demographic and clinical data are presented in Table 1 for the 89 patients in the LPA and 64 in 231
the Xpert groups. There were no significant differences in sex, age, HIV status, and previous TB 232
treatment between the groups. The majority of patients were diagnosed at the pre-treatment 233
diagnostic time-point in both groups. The median household size was smaller in the LPA than the 234
Xpert group (p=0.001). 235
236
Healthcare visits from the start of illness to MDR-TB treatment initiation: 237
238
The median number of health visits to MDR-TB treatment initiation was reduced from 20 in the 239
LPA group to 7 in the Xpert group (p<0.001) (Table 2). For those diagnosed at the pre-treatment 240
diagnostic time-point, the median number of visits was reduced from 16 in the LPA group to 6 in 241
the Xpert group (p<0.001). There were no significant differences between the groups for those 242
diagnosed whilst on 1st-line TB treatment (p=0.375). 243
244
In the quantile regression model (Table 3), age, gender, HIV status and previous TB were not 245
significantly associated with the number of visits. When adjusting for these potential 246
confounders, there were 12 (95% CI 3 to 21, p=0.009) fewer visits in the Xpert group. Cases 247
diagnosed at the pre-treatment diagnostic time-point had 10 fewer visits (95% CI 4 to 15, 248
p>0.001) in the Xpert group. For those diagnosed whilst on 1st line TB treatment, there was no 249
significant difference in the number of visits between the groups (p=0.624). 250
251
The proportion of patients who visited a private practitioner was similar, with 30% in the LPA 252
and 31% in the Xpert group (p=0.905). The proportion hospitalized at some point prior to MDR-253
9
TB treatment initiation was also similar with 19% in both groups (p=0.957). A higher proportion 254
attended a healthcare facility or a community site for DOT relating to their 1st line TB regimen in 255
the LPA group (69%) than in the Xpert group (39%) (p<0.001). 256
257
Cost to the patient: 258
259
The total median cost to the patient from the start of the illness to MDR-TB treatment initiation 260
was reduced from $68.1 (IQR 32.0 to 142.0) in the LPA group to $38.3 (IQR 14.1 to 79.3) in the 261
Xpert group (p=0.004)(Table 4). Median direct costs were $6.7 (IQR $1.1 to $28.2) in the LPA 262
group and $4.4 (IQR 0.0 to $22.2) in the Xpert group (p=0.321). Median indirect costs were 263
reduced from $40.0 (IQR $20.4 to $105.9) in the LPA group to $22.1 (IQR $11.0 to $54.5) in the 264
Xpert group (p=0.003). 265
266
All patients incurred indirect costs, but only 34 patients in the LPA group and 22 in the Xpert 267
group incurred direct medical costs with medians of $22.9 (IQR $17.2 to $28.9) and $22.0 (IQR 268
$15.7 to $26.0) respectively. Direct transport cost were incurred by 66 patients in the LPA group 269
and 41 in the Xpert group with medians of $5.3 (IQR 2.7 to 8.1) and $4.6 (IQR 1.6 to 10.3) 270
respectively. 271
272
For those diagnosed at the pre-treatment diagnostic time-point, the total median cost to the 273
patient was reduced from $49.8 (IQR 23.7 to 96.4) in the LPA group to $29.0 (IQR 12.5 to 57.6) 274
in the Xpert group (p=0.004). For those diagnosed whilst on 1st line TB treatment the total 275
median cost to the patient was $167.6 (IQR 105.1 to 273.2) in the LPA group compared to $179.4 276
(IQR 65.8 to 228.7) in the Xpert group (p=0.531). 277
278
In the quantile regression model (Table 3), gender, HIV status and previous TB were not 279
significantly associated with costs. When adjusting for these potential confounders, there was a 280
reduction of $35.4 (95% CI 6.1 to 64.7, p=0.018) in median costs in the Xpert group. Cases 281
diagnosed at the pre-treatment diagnostic time-point had a reduction of $23.5 (95% CI $1.7 to 282
$45.2, p>0.035) in the Xpert group. There was no significant difference in costs between the 283
groups (p=0.583) for those diagnosed whilst on 1st line TB treatment. Costs for those diagnosed 284
on 1st line TB treatment were $102.6 higher (p<0.001) in LPA group and $147.9 higher in the 285
Xpert group compared to those diagnosed pre-treatment in each group. 286
10
287
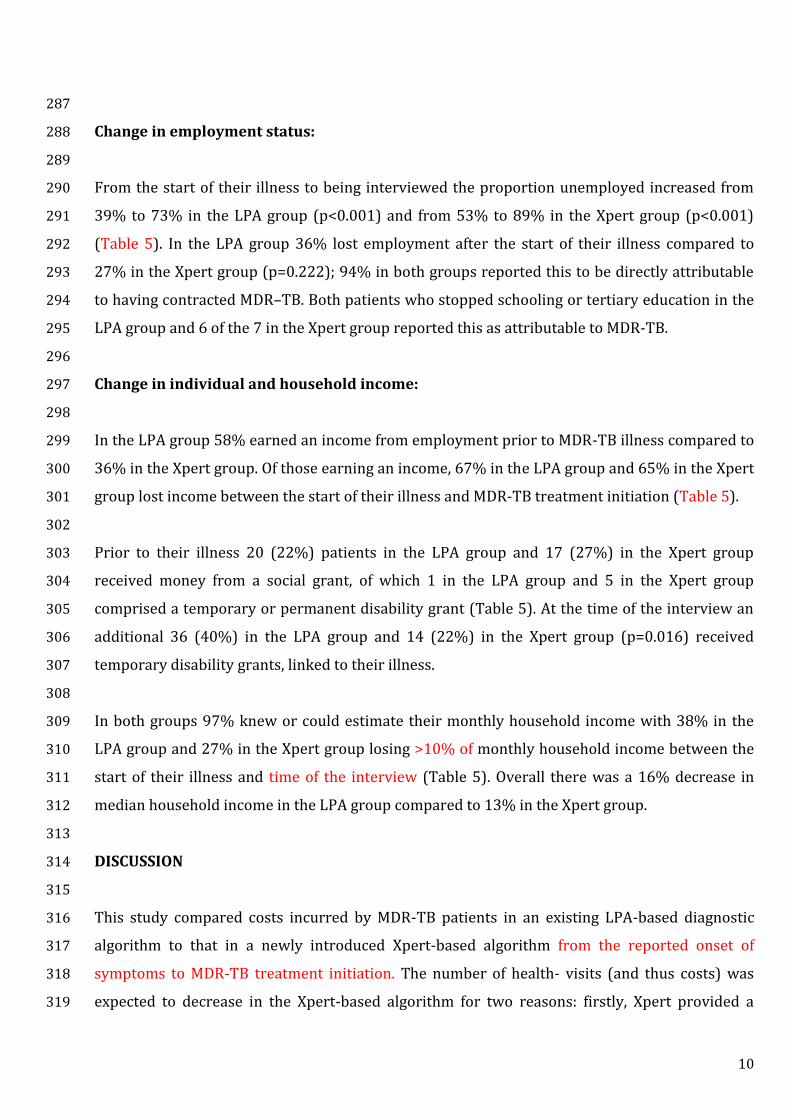
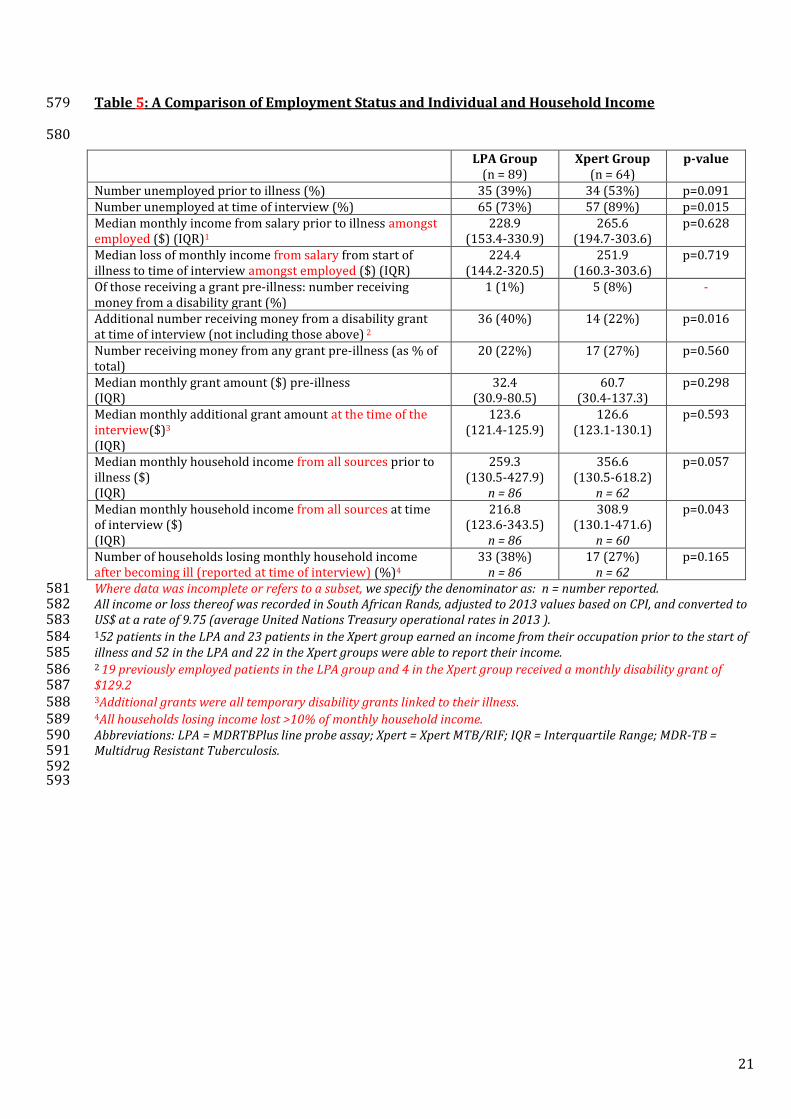
Change in employment status: 288
289
From the start of their illness to being interviewed the proportion unemployed increased from 290
39% to 73% in the LPA group (p<0.001) and from 53% to 89% in the Xpert group (p<0.001) 291
(Table 5). In the LPA group 36% lost employment after the start of their illness compared to 292
27% in the Xpert group (p=0.222); 94% in both groups reported this to be directly attributable 293
to having contracted MDR–TB. Both patients who stopped schooling or tertiary education in the 294
LPA group and 6 of the 7 in the Xpert group reported this as attributable to MDR-TB. 295
296
Change in individual and household income: 297
298
In the LPA group 58% earned an income from employment prior to MDR-TB illness compared to 299
36% in the Xpert group. Of those earning an income, 67% in the LPA group and 65% in the Xpert 300
group lost income between the start of their illness and MDR-TB treatment initiation (Table 5). 301
302
Prior to their illness 20 (22%) patients in the LPA group and 17 (27%) in the Xpert group 303
received money from a social grant, of which 1 in the LPA group and 5 in the Xpert group 304
comprised a temporary or permanent disability grant (Table 5). At the time of the interview an 305
additional 36 (40%) in the LPA group and 14 (22%) in the Xpert group (p=0.016) received 306
temporary disability grants, linked to their illness. 307
308
In both groups 97% knew or could estimate their monthly household income with 38% in the 309
LPA group and 27% in the Xpert group losing >10% of monthly household income between the 310
start of their illness and time of the interview (Table 5). Overall there was a 16% decrease in 311
median household income in the LPA group compared to 13% in the Xpert group. 312
313
DISCUSSION 314
315
This study compared costs incurred by MDR-TB patients in an existing LPA-based diagnostic 316
algorithm to that in a newly introduced Xpert-based algorithm from the reported onset of 317
symptoms to MDR-TB treatment initiation. The number of health- visits (and thus costs) was 318
expected to decrease in the Xpert-based algorithm for two reasons: firstly, Xpert provided a 319

11
quicker DST result than LPA (median <1 day compared to 24 days to a result being available in 320
the laboratory(19)), thus fewer patients would be started on 1st line TB treatment whilst 321
awaiting a DST result. Secondly, all presumptive TB cases would be simultaneously screened for 322
TB and drug susceptibility in the Xpert group; in comparison, those at low risk of MDR-TB in the 323
LPA group were only evaluated for drug susceptibility when 1st line TB treatment failed (usually 324
after 2-3 months of treatment). An algorithm where all presumptive cases are tested for drug 325
resistance, irrespective of the test used, will decrease the number of pre-treatment visits by 326
earlier identification of drug resistance for many patients. 327
328
The introduction of the Xpert-based algorithm decreased the number of pre-treatment 329
healthcare visits from a median of 20 in the LPA group to 7 in the Xpert group. However, the 330
number of visits remains high, especially for patients diagnosed whilst on 1st-line TB treatment. 331
A large contributor to this was DOT visits whilst awaiting a DST result. Visits to private 332
practitioners (similar in both algorithms) and to health centers not offering TB treatment 333
increased the number of pre-treatment visits as patients often made several visits, were not 334
appropriately tested and had to eventually be referred for MDR-TB tests and or treatment. 335
336
There was a significant decrease in median costs for patients in the Xpert ($38.3) compared to 337
the LPA group ($68.1). As direct medical costs were similar in both groups (all related to private 338
sector care as public sector services are free) and travel costs were low, this was largely 339
attributable to indirect costs related to time spent in travel and at the healthcare facility. Other 340
TB costing studies have also found higher indirect than direct costs (17,18). 341
342
Improved health system efficiencies with the Xpert-based algorithm can help to further reduce 343
indirect costs. To achieve this, healthcare professionals need to adhere to the testing algorithm 344
and health delivery issues such leaking sputum containers, broken fax machines, and mislaid 345
results need to be minimized to eliminate unnecessary pre-treatment visits. 346
347
Other studies have found income loss to be the largest financial burden faced by patients 348
contracting TB(14). We found a high proportion of patients, in both algorithms, who lost income 349
as a result of employment loss due to their illness, highlighting the devastating impact MDR-TB 350
can have on a patient’s livelihood, irrespective of the speed at which they are diagnosed. Studies 351
are needed to ascertain if people regain employment, once they have commenced or completed 352

12
treatment, however with the poor treatment outcomes for MDR-TB (27) this is likely to be low. 353
There was a marked loss of monthly household income in both groups. “Catastrophic” costs (14) 354
were experienced by 38% in the LPA group and 27% in the Xpert group who lost >10% of 355
monthly household income. 356
357
When estimating costs, different approaches may influence the cost estimate. In this study 358
indirect costs for patient’s time were calculated for all patients based on a basic municipal 359
workers wage. This may have overestimated indirect costs for those unemployed, although this 360
effect may be counter-balanced, as the study did not cost unpaid work in the household and the 361
cost to the unemployed who lost time that could have been used to seek new employment. 362
363
There are also alternative methods of calculating indirect costs – we have used the traditional 364
human capital method, which assumes a loss equivalent to the production that could have 365
occurred in the time foregone, using hourly wages to value this production(28). Alternative 366
methods, such as the friction cost approach(29) assume some reorganization to minimize 367
disruption (e.g. individuals substituting leisure time for paid or unpaid work). Our approach may 368
therefore overstate indirect costs by not accounting for such flexibility, although it is not possible 369
to quantify the impact of this. 370
371
Strengths and Limitations: 372
373
As patients were interviewed 3 to 6 months after the start of MDR-TB treatment, recall bias may 374
have influenced findings. A strength of our study was that was that we were able to triangulate 375
visit data from patient interviews with clinical records which is likely to have reduced reporting 376
bias. 377
378
However, the study had limitations. Firstly, this was an observational study conducted in routine 379
operational conditions. Temporal changes such as the full decentralisation of MDR-TB treatment 380
may have contributed to the findings. Secondly, the patients sampled were not representative of 381
all MDR-TB patients. Untreated patients were not included. To reduce the risk of infection to 382
researchers, only patients who had been on MDR-TB treatment for at least 3 months and had 383
smear-converted were interviewed. Patients who were lost to follow-up, which may have been 384
influenced by the high cost of illness, or had failed to smear convert were not included. Healthier 385

13
people were thus more likely to be interviewed, which may have underestimated costs, but this 386
is unlikely to have been different between the two algorithms. 387
388
Thirdly, we did not assess coping strategies that patients may have resorted to such as the sale of 389
assets and borrowing. Lastly, we have not assessed visits or costs based on clinic performance as 390
the clinic ranking changed each year and the number of patients was too small. The study 391
included the early phase of Xpert implementation, which may have increased the median 392
number of pre-treatment visits in the Xpert group as staff became familiar with the new 393
algorithm and new practices were entrenched. 394
395
Implications of Study Findings: 396
397
Given the high loss of employment attributable to their having developed MDR-TB, many of 398
these patients and their households are in need of financial support. There have been 399
international calls by the World Health Organisation and International Labour Office for 400
countries to invest in social protection mechanisms such as income replacement and social 401
support for those affected by illness(30). 402
403
Although disability grants (monthly value $129.2) are available to support MDR-TB patients and 404
offer a measure of income replacement, access to these was poor with fewer patients receiving a 405
disability grant at the time of the interview in the Xpert (22%) compared to the LPA group 406
(40%). This may reflect the time it takes to process a grant, with this not yet having taken place 407
for those diagnosed in the Xpert-based algorithm. Expedited access to disability grants is 408
required: the provision of unconditional disability grants could be considered for diseases such 409
as MDR-TB as the means-testing process (undertaken by a doctor) contributes to delay. On a 410
positive note, the low direct medical costs incurred by patients bare testimony to the social 411
protection offered by free public health services in South Africa. 412
413
CONCLUSION 414
415
Assessing the economic relief to the patient and their household is important in understanding 416
the impact of new molecular TB diagnostics. This study has shown that the introduction of an 417
Xpert-based algorithm brought relief by decreasing the costs incurred by patients, mostly by 418
14
reducing the number of visits to treatment initiation. Improved health service efficiencies can 419
help further reduce costs. 420
421
The link between TB and poverty is strong (1,31). In our setting, even though MDR-TB diagnosis 422
and treatment are free and easily accessible, the economic impact of MDR-TB was large, with 423
many patients losing employment and individual and household income. It is important for 424
health planners to be cognizant of the fact that irrespective of how quickly treatment is initiated 425
with a rapid MDR-TB test, a high number of patients will be vulnerable to the effects of increased 426
poverty. Efforts need to be made to mitigate this to break the poverty-illness cycle. 427
428
Acknowledgements 429
This research was supported by a United States Agency for International Development (USAID) 430
Cooperative Agreement (TREAT TB – Agreement No. GHN-A-00-08-00004-00). The contents are 431
the responsibility of the authors and do not necessarily reflect the views of USAID. 432
The assistance of the National Health Laboratory Services, Cape Town Health Directorate and 433
Western Cape Provincial Department of Health is acknowledged. We are grateful to Edina 434
Sinanovic, Health Economics Unit, University of Cape Town, for her advice. 435
436
15
References 437
1. Muniyandi M, Ramachandran R. Socioeconomic inequalities of tuberculosis in India. Expert Opin 438 Pharmacother. Informa UK Ltd London, UK; 2008 Jul 21;9(10):1623–8. 439
2. World Health Organisation. Addressing Poverty in TB Control: Options for National TB Control 440 Programmes. 2005 p. 3–78. 441
3. Lönnroth K, Jaramillo E, Williams BG, Dye C, Raviglione M. Drivers of tuberculosis epidemics: the 442 role of risk factors and social determinants. Soc Sci Med. 2009 Jun;68(12):2240–6. 443
4. World Health Organisation. Tuberculosis Fact sheet N°104. World Health Organization; 2014. 444
5. Laokri S, Dramaix-Wilmet M, Kassa F, Anagonou S, Dujardin B. Assessing the economic burden of 445 illness for tuberculosis patients in Benin: determinants and consequences of catastrophic health 446 expenditures and inequities. Trop Med Int Health. 2014 Oct;19(10):1249–58. 447
6. Barter DM, Agboola SO, Murray MB, Bärnighausen T. Tuberculosis and poverty: the contribution of 448 patient costs in sub-Saharan Africa--a systematic review. BMC Public Health. 2012 Jan;12:980. 449
7. Croft RA, Croft RP. Expenditure and loss of income incurred by tuberculosis patients before 450 reaching effective treatment in Bangladesh [Notes from the Field]. Int J Tuberc Lung Dis. 451 International Union Against Tuberculosis and Lung Disease; 1998;2(3):3. 452
8. Kamolratanakul P, Sawert H, Kongsin S, Lertmaharit S, Sriwongsa J, Na-Songkhla S, et al. Economic 453 impact of tuberculosis at the household level. Int J Tuberc Lung Dis. 1999 Jul;3(7):596–602. 454
9. Kemp JR, Mann G, Simwaka BN, Salaniponi FM, Squire SB. Can Malawi’s poor afford free 455 tuberculosis services? Patient and household costs associated with a tuberculosis diagnosis in 456 Lilongwe. Bull World Health Organ. World Health Organization; 2007;85(8):580–5. 457
10. Sreeramareddy CT, Panduru K V, Menten J, Van den Ende J. Time delays in diagnosis of pulmonary 458 tuberculosis: a systematic review of literature. BMC Infect Dis. 2009 Jan;9:91. 459
11. Narasimooloo R, Ross a. Delay in commencing treatment for MDR TB at a specialised TB treatment 460 centre in KwaZulu-Natal. S Afr Med J. 2012 Jun;102(6 Pt 2):360–2. 461
12. Dowdy DW, Chaisson RE, Maartens G, Corbett EL, Dorman SE. Impact of enhanced tuberculosis 462 diagnosis in South Africa: a mathematical model of expanded culture and drug susc1. Dowdy DW, 463 Chaisson RE, Maartens G, Corbett EL, Dorman SE (2008) Impact of enhanced tuberculosis 464 diagnosis in South Africa: a mathematical m. Proc Natl Acad Sci U S A. 2008 Aug 465 12;105(32):11293–8. 466
13. Ukwaja KN, Modebe O, Igwenyi C, Alobu I. The economic burden of tuberculosis care for patients 467 and households in Africa: a systematic review. Int J Tuberc Lung Dis. 2012 Jun;16(6):733–9. 468
14. Tanimura T, Jaramillo E, Weil D, Raviglione M, Lönnroth K. Financial burden for tuberculosis 469 patients in low- and middle-income countries: a systematic review. Eur Respir J. 2014 Feb 20;1–470 13. 471
15. Laokri S, Drabo MK, Weil O, Kafando B, Dembélé SM, Dujardin B. Patients are paying too much for 472 tuberculosis: a direct cost-burden evaluation in Burkina Faso. PLoS One. 2013 Jan;8(2):e56752. 473

16
16. World Helath Organisation. Global Tuberculosis Report. 2012 p. 1–82. 474
17. Pichenda K, Nakamura K, Morita A, Kizuki M, Seino K, Takano T. Non-hospital DOT and early 475 diagnosis of tuberculosis reduce. Int J Tuberc Lung Dis. 2012;16(December 2011):828–34. 476
18. Rouzier V a, Oxlade O, Verduga R, Gresely L, Menzies D. Patient and family costs associated with 477 tuberculosis, including multidrug-resistant tuberculosis, in Ecuador. Int J Tuberc Lung Dis. 2010 478 Oct;14(10):1316–22. 479
19. Naidoo P, du Toit E, Dunbar R, Lombard C, Caldwell J, Detjen A, et al. A Comparison of Multidrug-480 Resistant Tuberculosis Treatment Commencement Times in MDRTBPlus Line Probe Assay and 481 Xpert® MTB/RIF-Based Algorithms in a Routine Operational Setting in Cape Town. PLoS One. 482 2014 Jan;9(7):e103328. 483
20. Mann G, Squire SB, Bissell K, Eliseev P, Toit E Du, Hesseling A, et al. Beyond accuracy : creating a 484 comprehensive evidence base for tuberculosis diagnostic tools. Int J Tuberc Lung Dis. 485 2010;14(12):1518–24. 486
21. Statistics South Africa. Statistical release Living Conditions of Households in SA 2008/2009. 2011. 487
22. Statistics South Africa. Income and Expenditure of Households 2010 / 2011. 2011; 488
23. Pauw K, Mncube L. Expanding the Social Security Net in South Africa : Opportunities, Challenges 489 and Constraints. 2007. 490
24. Mywage.co.za/South Africa - Minimum Wages for Farm Workers, Fiorestry, Security Guards, 491 Domestic Workers in South Africa 2013 [Internet]. [cited 2014 Jun 5]. Available from: 492 http://m.mywage.co.za/main/salary/minimum-wages 493
25. Bennett M, Voges A. Statistical release Consumer Price Index. 2014 p. 2–10. 494
26. United Nations treasury Operational Rates of Exchange [Internet]. [cited 2014 May 27]. Available 495 from: 496 http://treasury.un.org/operationalrates/Details.aspx?code=ZAR¤cy=South+Africa+Rand&c497 ountry=South+Africa 498
27. Ahuja SD, Ashkin D, Avendano M, Banerjee R, Bauer M, Bayona JN, et al. Multidrug resistant 499 pulmonary tuberculosis treatment regimens and patient outcomes: an individual patient data 500 meta-analysis of 9,153 patients. PLoS Med. 2012 Jan;9(8):e1001300. 501
28. Hodgson T. Costs of Illness in Cost-Effectiveness Analysis : a review of the methodology. 502 Pharmacoeconomics. 1994;6(6):536–52. 503
29. Koopmanschap MA, Rutten FFH, van Ineveld BM, van Roijen L. The friction cost method for 504 measuring indirect costs of disease. J Health Econ. 1995 Jun;14(2):171–89. 505
30. International Labour office, World Health Organisation. A joint Crisis Initiative of the UN Chief 506 Executives Board for Co-ordination on the Social Protection Floor. Geneva; 2009 p. 2–19. 507
31. World Health Organisation. The role of Tuberculosis ( TB ) in poverty eradication. 2011 p. 5–7. 508
509
17
510
Table 1: Demographic, Socioeconomic and Clinical Characteristics of Study Patients 511
512 513 514 515 516 517 518 519 520 521 522 523 524 525 526 527 528 529 530 531 532 533 534 535 536 537
1Education level was missing for one patient in the Xpert group. 538 Abbreviations: LPA= MDRTBPlus line probe assay; Xpert = Xpert MTB/RIF; SD= Standard Deviation; HIV=Human 539 Immunodeficiency Virus; TB=Tuberculosis; MDR-TB= Multidrug Resistant Tuberculosis; IQR= Interquartile Range 540
541
Variable LPA Group
(n=89)
Xpert Group
(n=64)
p-value
Sex, Female (number, %) 44 (49%) 27 (42%) p=0.375
Mean Age, years
SD
(Range)
36.8
10.7
(19-70)
35 .3
9.7
(19-63)
p=0.300
HIV-positive (number, %) 57 (64%) 34 (53%) p=0.175
Previous TB treatment (number, %) 45 (51%) 30 (47%) p=0.653
MDR-TB diagnostic time-point: Pre-treatment (number, %) 74 (83%) 55 (86%) p=0.640
Highest Education level attained1 (number, %)
No education
Primary school education (Grade 1-Grade 7)
Some high school education (Gr 8- Grade 11)
Completed high school education (Grade 12)
Tertiary education
2 (2%)
29 (33%)
44 (49%)
13 (15%)
1 (1%)
0 (0%)
15 (24%)
36 (57%)
7 (11%)
5 (8%)
p =0.112
Median number of people in household
IQR
3
2-4
4
3-5.5
p=0.001
Median number of dependents
IQR
2
1-3
1
0-2.5
p=0.278

18
Table 2: Median Number of Healthcare Visits in the LPA and Xpert Groups 542
543 544 545 546 547 548 549 550 551 552 553 554 555 556 557
The table shows unadjusted data. Healthcare visits include all visits to both the public and private health sector. Visits 558 for directly observed therapy (DOT) are included for patients on a 1st line TB regimen, either whilst awaiting drug 559 susceptibility test results or for those who were not evaluated when diagnosed with TB. Only 1.4% of visits in the LPA 560 group and 3.2% in the Xpert group were to the private sector. 561 Abbreviations: LPA = MDRTBPlus line probe assay; Xpert = Xpert MTB/RIF; TB = Tuberculosis; IQR = Interquartile 562 Range; Min-Max = Minimum – Maximum 563 Data on mean visits are presented in supplemental information. 564 565
566
Median IQR Min-Max p-value
LPA Group - all patients
(n=89)
20 10-44 2-171 p<0.001
Xpert Group - all patients
(n=64)
7 4-23 2-184
LPA Group – pre-treatment
(n=74)
16 7-28 2-164 p<0.001
Xpert Group –pre-treatment
(n=55)
6 4-12 2-73
LPA Group – on 1st line TB treatment
(n=15)
77 48-126 25-171 p=0.375
Xpert Group - on 1st line TB treatment
(n=9)
51 46-77 19-184

19
Table 3: Quantile Regression Model Outputs for Number of Healthcare Visits and Patient Costs 567
568 Variable Coefficient Standard Error p-value 95% Confidence
Interval Adjusted Data for Number of Healthcare Visits – All patients
Xpert Group -11.9 4.5 0.009 -20.8 to -3.1
Gender 5.4 4.5 0.224 -3.4 to 14.3
HIV status -0.9 4.5 0.843 -9.8 to 8.0
Age -0.1 0.2 0.742 -0.5 to 0.4
Previous TB -0.4 4.4 0.921 -9.2 to 8.3
Constant 20.8 9.2 0.026 2.5 to 39.1
Adjusted Data for Number of Healthcare Visits – Patients at Pre-treatment Diagnostic Time
Point
Adjusted Visit Data – All patients
Adjusted Visit Data – All patients
Adjusted Visit Data – All patients
Adjusted Visit Data – All patients
Xpert Group -9.6 2.7 0.001 -14.9 to -4.2
Gender 2.3 2.7 0.401 -3.1 to 7.6
HIV status -0.1 2.7 0.979 -5.4 to 5.3
Age -0.1 0.1 0.524 -0.4 to 0.2
Previous TB 1.8 2.7 0.509 -3.5 to 7.1
Constant 17.2 5.8 0.004 5.6 to 28.7
Adjusted Data for Number of Healthcare Visits – Patients at Treatment Diagnostic Time Point
Xpert Group -13.4 26.8 0.624 -69.8 to 43.0
Gender 16.6 24.7 0.510 -35.3 to 68.5
HIV status 15.7 25.4 0.545 -37.7 to 69.2
Age -0.9 1.1 0.405 -3.3 to 1.4
Previous TB 57.9 35.2 0.117 -16.0 to 131.8
Constant 88.7 42.2 0.050 0.1 to 177.3
Adjusted Patient Cost Data ($) – All patients
Xpert Group -35.4 14.8 0.018 -64.7 to -6.1
Gender 9.4 14.7 0.524 -19.7 to 38.5
Previous TB -15.2 14.6 0.298 -44.0 to 13.6
HIV status -0.7 15.0 0.962 -30.4 to 28.9
Constant 74.3 16.5 <0.001 41.7 to 107.0
Adjusted Patient Cost Data ($) – Patients at Pre-treatment Diagnostic Time Point
Adjusted Visit Data – All patients
Adjusted Visit Data – All patients
Adjusted Visit Data – All patients
Adjusted Visit Data – All patients
Xpert Group -23.5 11.0 0.035 -45.2 to -1.7
Gender 7.3 10.9 0.506 -14.3 to 28.8
Previous TB 1.9 10.8 0865 -19.6 to 23.3
HIV status -1.7 11.1 0.880 -23.6 to 20.3
Constant 48.8 12.9 <0.001 23.2 to 74.3
Adjusted Patient Cost Data ($)– Patients at Treatment Diagnostic Time Point
Xpert Group -55.4 99.1 0.583 -262.8 to 152.1
Gender 48.8 90.3 0.595 -140.3 to 237.9
Previous TB 114.1 130.2 0.392 -158.4 to 386.5
HIV status 3.4 92.7 0.972 -190.7 to 197.4
Constant 121.2 86.8 0.179 -60.5 to 302.9
Adjusted Cost Comparison at the different Diagnostic Time Points in the LPA-based Algorithm
Pre-treatment 102.6 25.0 <0.001 52.8 to 152.4
Constant 69.2 21.3 0.002 26.8 to 111.6
Adjusted Cost Comparison at the different Diagnostic Time Points in the Xpert-based
Algorithm Pre-treatment 147.9 24.3 <0.001 99.3 to 196.5
Constant 14.6 15.5 0.349 -16.4 to 45.6

20
Table 4: Median Patients Costs in the LPA and Xpert Groups 569
Costs and time associated with seeking help were calculated from the onset of illness to MDR-TB treatment initiation in South African Rands, adjusted to 2013 values 570 based on the consumer price index, and converted to US$ at a rate of 9.75 (average United Nations Treasury operational rates in 2013). The total cost to the patient is 571 the sum of the direct and indirect costs. 572 The table shows data for all patients in both groups. However, only 67patients in the LPA group and 45 in the Xpert group incurred direct costs with medians of $20.5 573 (IQR 5.0 to 30.3) and $12.4 (IQR $3.4 to $30.4) respectively. Direct medical costs were incurred by 34 patients in the LPA group and 22 in the Xpert group with median 574 costs of $22.9 (IQR $17.2 to $28.9) and $22.0 (IQR $15.7 to $26.0) respectively. Direct transport cost were incurred by 66 patients in the LPA group and 41 in the Xpert 575 group with median costs of $5.3 (IQR 2.7 -8.1) and $4.6 (IQR 1.6-10.3) respectively. 576 Abbreviations: LPA = MDRTBPlus line probe assay; Xpert = Xpert MTB/RIF; IQR = Interquartile Range 577 Mean costs are presented as supplemental information. 578
n Median Direct Costs ($) (IQR)
Median Indirect Costs ($) (IQR)
Median Total Cost to Patient (IQR)
p-value Transport Costs
Medical Costs
Direct Costs p-value
Cost of Transport
Time
Cost of Time in Health Facility
Indirect Costs p-value
LPA Group – all patients
89 3.4 0 6.7 p=0.321 12.3 23.7 40.0 p=0.003 68.1 p=0.004
(0-6.9) (0-18.1) (1.1-28.2) (6.2-29.6) (11.7-64.4) (20.4-105.9) (32.0-142.0) Xpert Group – all patients
64 1.5 0 4.4 4.6 13.4 22.1 38.3 (0-6.5) (0-16.0) (0.0-22.2) (2.6-14.3) (8.2-39.0) (11.0-54.5) (14.1-79.3)
LPA Group – Pre-treatment
74 3.2 0 6.5 p=0.345 9.9 19.9 33.7 p=0.005 49.8 p=0.004
(0-6.9) (0-18.1) (1.1-25.9) (5.8-23.2 (8.9-46.1) (17.5-87.1) (23.7-96.4)
Xpert Group – Pre-treatment
55 1.5 0 4.2 4.0 12.1 17.3 29.0
(0-6.5) (0-15.7) (0.0-20.3) (2.5-9.9) (7.3-30.3) (10.9-46.7) (12.5-57.6)
LPA Group - on 1st line TB treatment
15 4.5 0 27.5 p=0.928 54.8 86.4 164.7 p=0.297 167.6 p= 0.531
(0-6.2) (0-24.1) (0.0-30.0) (30.1-91.2) (31.9-117.0) (76.1-234.5) (105.1-273.2)
Xpert Group - on 1st line TB treatment
9 3.4 0 4.6 25.4 37.0 61.3 179.4
(0-21.7) (0-22.9) (0.0-44.6) (21.6-46.9) (19.1-155.6) (46.7-202.4) (65.8-228.7)
21
Table 5: A Comparison of Employment Status and Individual and Household Income 579
580
LPA Group (n = 89)
Xpert Group (n = 64)
p-value
Number unemployed prior to illness (%) 35 (39%) 34 (53%) p=0.091 Number unemployed at time of interview (%) 65 (73%) 57 (89%) p=0.015 Median monthly income from salary prior to illness amongst employed ($) (IQR)1
228.9 (153.4-330.9)
265.6 (194.7-303.6)
p=0.628
Median loss of monthly income from salary from start of illness to time of interview amongst employed ($) (IQR)
224.4 (144.2-320.5)
251.9 (160.3-303.6)
p=0.719
Of those receiving a grant pre-illness: number receiving money from a disability grant (%)
1 (1%) 5 (8%) -
Additional number receiving money from a disability grant at time of interview (not including those above) 2
36 (40%) 14 (22%) p=0.016
Number receiving money from any grant pre-illness (as % of total)
20 (22%) 17 (27%) p=0.560
Median monthly grant amount ($) pre-illness (IQR)
32.4 (30.9-80.5)
60.7 (30.4-137.3)
p=0.298
Median monthly additional grant amount at the time of the interview($)3 (IQR)
123.6 (121.4-125.9)
126.6 (123.1-130.1)
p=0.593
Median monthly household income from all sources prior to illness ($) (IQR)
259.3 (130.5-427.9)
n = 86
356.6 (130.5-618.2)
n = 62
p=0.057
Median monthly household income from all sources at time of interview ($) (IQR)
216.8 (123.6-343.5)
n = 86
308.9 (130.1-471.6)
n = 60
p=0.043
Number of households losing monthly household income after becoming ill (reported at time of interview) (%)4
33 (38%) n = 86
17 (27%) n = 62
p=0.165
Where data was incomplete or refers to a subset, we specify the denominator as: n = number reported. 581 All income or loss thereof was recorded in South African Rands, adjusted to 2013 values based on CPI, and converted to 582 US$ at a rate of 9.75 (average United Nations Treasury operational rates in 2013 ). 583 152 patients in the LPA and 23 patients in the Xpert group earned an income from their occupation prior to the start of 584 illness and 52 in the LPA and 22 in the Xpert groups were able to report their income. 585 2 19 previously employed patients in the LPA group and 4 in the Xpert group received a monthly disability grant of 586 $129.2 587 3Additional grants were all temporary disability grants linked to their illness. 588 4All households losing income lost >10% of monthly household income. 589 Abbreviations: LPA = MDRTBPlus line probe assay; Xpert = Xpert MTB/RIF; IQR = Interquartile Range; MDR-TB = 590 Multidrug Resistant Tuberculosis. 591 592
593

22
Figure 1: Testing in the LPA and Xpert-based TB Diagnostic Algorithms

23
Figure 2: Study Population
Cases identified from
laboratory and clinic records
n=360
Eligible patients
n=226
Not eligible N=134 Reasons:
<18 years old: 5
Extra-pulmonary TB: 3
Previous MDR-TB: 3
No diagnostic result / diagnosed outside
of Cape Town: 3
Pre or XDR-TB: 41
No record MDR-TB treatment: 19
Interrupted MDR-TB treatment / died: 60
Included - Interviewed
n=153
Excluded - Not interviewed: N=73
Reasons:
Patient too ill / in hospital / still smear
positive: 38
Transferred/moved out of area: 6
Declined interview: 1
In prison: 2
Unable to schedule interview: 25
Unable to do interview due to poor patient
recall: 1
LPA-Group:
n=89
Xpert-Group
n=64