Embed Size (px)
Citation preview
Original Research
A Taxonomy for Patient-Ventilator Interactionsand a Method to Read Ventilator Waveforms
https://doi.org/10.4187/respcare.09316
Cite as: RESPCARE 2021; 10.4187/respcare.09316
Received: 31 July 2021Accepted: 31 July 2021
This Fast Track article has been peer-reviewed and accepted, but has not been throughthe composition and copyediting processes. The final version may differ slightly in style orformatting and will contain links to any supplemental data.
Alerts: Sign up at rc.rcjournal.com/alerts to receive customized email alerts when the fullyformatted version of this article is published.
1
Title: A Taxonomy for Patient-Ventilator Interactions and a Method to Read Ventilator
Waveforms
Authors
Eduardo Mireles-Cabodevila, MD Assistant Professor of Medicine – Cleveland Clinic Lerner College of Medicine of Case Western Reserve Director - Medical Intensive Care Unit, Respiratory Institute, Cleveland ClinicMedical Director - Simulation and Advanced Skills Center, Education Institute, Cleveland Clinic
Matthew T. Siuba, DOAssistant Professor of Medicine – Cleveland Clinic Lerner College of Medicine of Case Western Reserve Department of Critical CareRespiratory Institute Cleveland Clinic
Robert L Chatburn MHHS, RRT-NPS, FAARCProfessor of Medicine – Lerner College of Medicine of Case Western Reserve UniversityDirector – Simulation Fellowship, Education Institute, Cleveland ClinicProgram Manager – Enterprise Respiratory Care Research, Respiratory Institute, Cleveland Clinic
Contributions
Eduardo Mireles-Cabodevila, MD Literature searchManuscript preparationReview of manuscript
Matthew T. Siuba DOManuscript preparationReview of manuscript
Robert L. Chatburn, MHHS, RRT-NPS, FAARCManuscript preparationReview of manuscript
Conflict of Interest
Dr. Mireles-Cabodevila has no conflicts of interest related to this topic. He is a co-owner of a patent for Mid–Frequency Ventilation. He receives royalties from the American College of Physicians and Jones & Bartlett publishers.
Page 1 of 51 Respiratory Care
2
Dr. Siuba has no conflicts of interest.
Prof. Chatburn has affiliations with, special interest, or have conducted business within the last two years with the following companies: IngMar Medical, Vyaire Medical and ProMedic LLC. He is a co-owner of a patent for Mid–Frequency Ventilation.
Financial Support
None
Page 2 of 51Respiratory Care
3
A wise man once said: that which is simple is rarely seen, and that which is seen, is seldom understood.
What to say about that which is complicated?
Introduction
The ventilator waveforms provide us with a continuous stream of information on both physiology and
patient ventilator interactions. This information is invaluable for patient care. As critical care providers,
we need to change how we see the mechanical ventilator screen. Too often, training on ventilator
waveforms is based on simple pattern recognition (e.g. double triggering, missed trigger), and ends up
being just an experience-based exercise rather than a systematic process.
A physician in training spends countless hours learning how to read EKGs. The electrical manifestations
of the heart’s activity provide a window into the heart’s physiology and function. Knowing how to read
an EKG is a key skill that all clinicians must master. In daily clinical practice, we have continuous EKG
monitoring at the bedside that provides important information. Many centers have individuals monitoring
continuously to recognize dangerous patterns. We print, interpret, and document EKG strips every shift in
our intensive care unit. Comparing this to our practice with ventilators, the deficit in our approach
immediately becomes evident. Yes, we observe the ventilator display and document settings, but we do
not collect any information on the interpretation. Of course, there are clinicians around the world who do
routinely read ventilator waveforms and interpret patient-ventilator interactions, but this seems to be the
exception rather than the rule.
Another challenge is the plethora of terms used to describe patient-ventilator interactions. There is no
standardized vocabulary to describe what we see. Review articles, research studies and case reports use
different names and definitions for patterns observed1,2. Some use the etiology (e.g. reverse trigger), the
outcome (e.g. breath stacking), patterns (e.g. double trigger) or ambiguous terms (e.g flow asynchrony)
which we use and understand, yet, it generates problems in education, research and scholarship.3
Page 3 of 51 Respiratory Care
4
There are some historical and practical reasons for our practice deficit. First, early ventilators did not
provide graphical displays. Second, the nature of the display, being an instantaneous image, and having
no print out, makes it harder for us to document and analyze the waveforms. (Some ventilators allow
screen capture as image files, but this is far from convenient). Finally, and perhaps most importantly,
there was never a widely accepted, formal, systematic method to read these waveforms as there is for
EKGs.4 Most of us have relied on self-study, experience, and learning from mentors.
Here we propose a standardized nomenclature and taxonomy along with a method to read ventilator
waveforms based on knowledge of modes of mechanical ventilation, the physiology of the respiratory
system, and the analysis of interactions of patient with the ventilator. The method has 3 steps, which lead
to complete analysis of the waveforms.
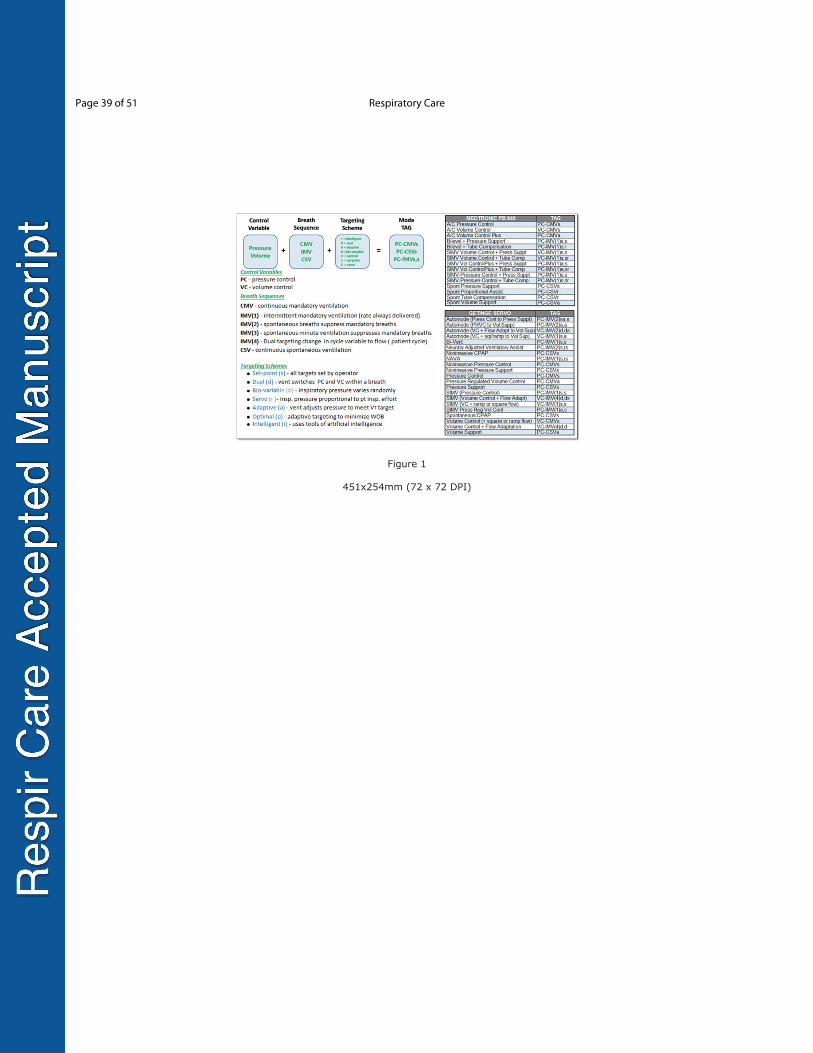
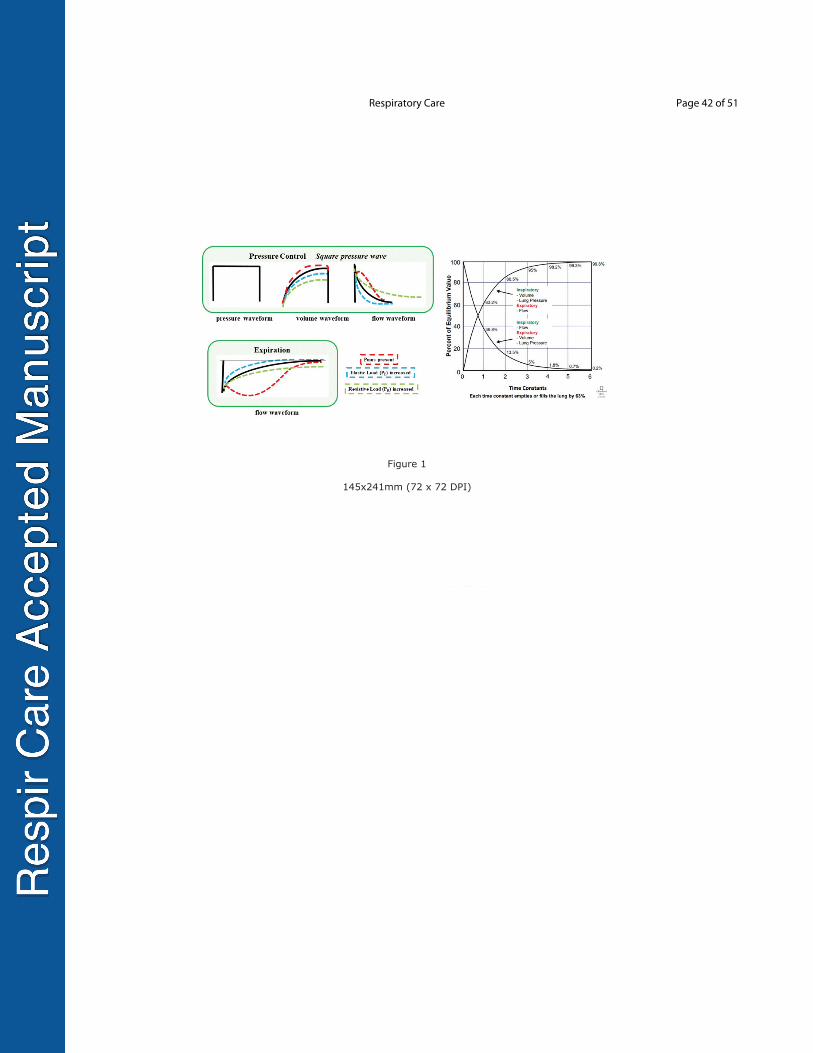
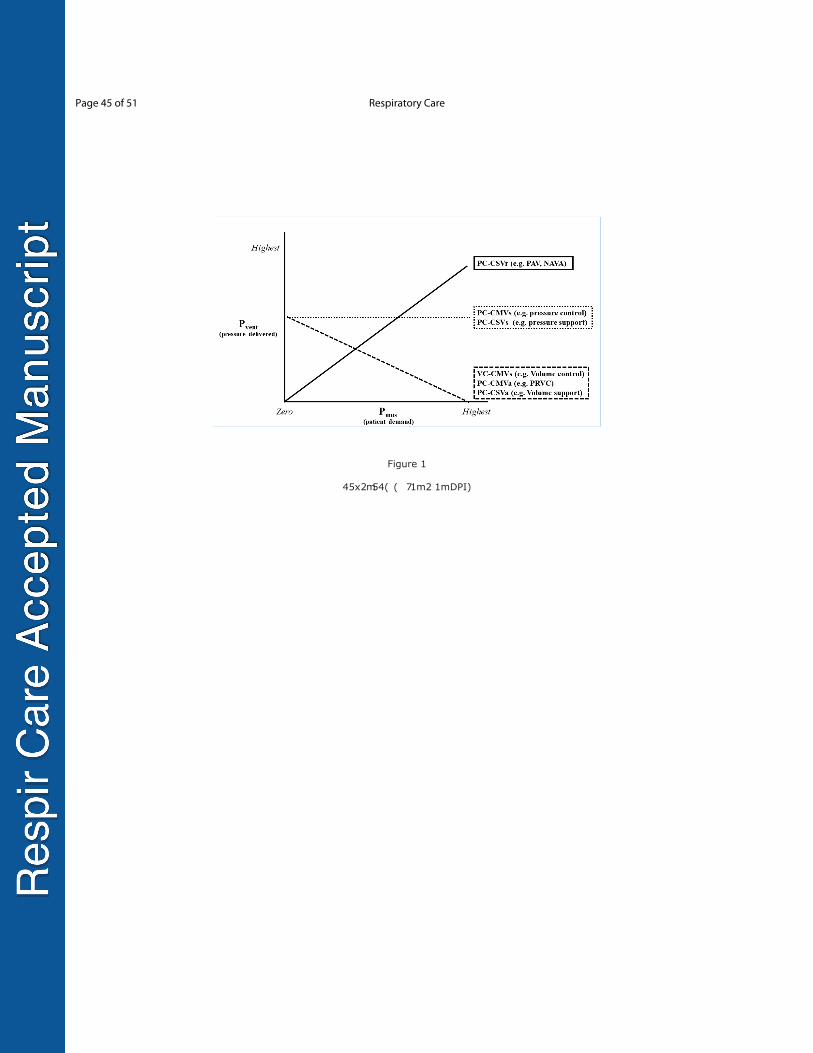
Step 1. Define the TAG for the mode (what the mode actually does)
To define a mode you must learn a small but specialized vocabulary of standardized terms and the
taxonomy used to classify modes. We have written extensively on this topic.5–7 Briefly, a mode can be
identified as a specific combination of three components, the control variable, the breath sequence, and
the targeting scheme (Figure 1), we summarize these three components with an abbreviation called the
Taxonomic Attribute Grouping (TAG). Clinicians can classify modes of any ventilator using the
taxonomy5. We have classified all the modes on almost every ventilator used in the United States8. The
mode taxonomy itself has been described in most current textbooks that contain chapters on mechanical
ventilation9–14. We maintain an evolving public database containing every mode on every ventilator
(Supplemental material). Also, a subset of these modes, for ventilators at our hospital, has been placed
on a pocket card that we call the TAG Mode Table (Figure 1).
Page 4 of 51Respiratory Care
5
There are several reasons why classifying a mode is an essential step, but the main one is that the
commercial name of the mode does not necessarily represent the mode’s actual behavior. The classic
example that highlights this is the mode named Pressure Regulated Volume Control (on Getinge Servo
ventilators), which is often thought to be a volume control mode.15 It is available on many other
ventilators, but with different proprietary mode names (e.g. Volume Control Plus or Volume Guarantee)
or can be activated under other mode name (e.g. Volume Control + Auto flow on the Dräger V500
ventilator) with the name of the mode not even changing. All these modes have the same TAG, PC-
CMVa which tells us the following: The control variable is pressure (PC), the breath sequence is
continuous mandatory ventilation (CMV), and the targeting scheme is adaptive (a). We will describe all
these further below, but the point is that to be able to read the ventilator waveforms we must understand
what the ventilator is programed to do. The TAG tells you that. It defines the mode’s three components
(control variable, breath sequence, and targeting scheme) which helps you analyze the waveforms to read
the patient physiology (Step 2) and patient – ventilator interaction (Step 3).
Page 5 of 51 Respiratory Care
6
Step 2: Determine the Load
The ventilator’s pressure, volume and flow waveforms contain important information on the physiology
of the respiratory system. Without any other intervention, just by observation of the waveforms, the
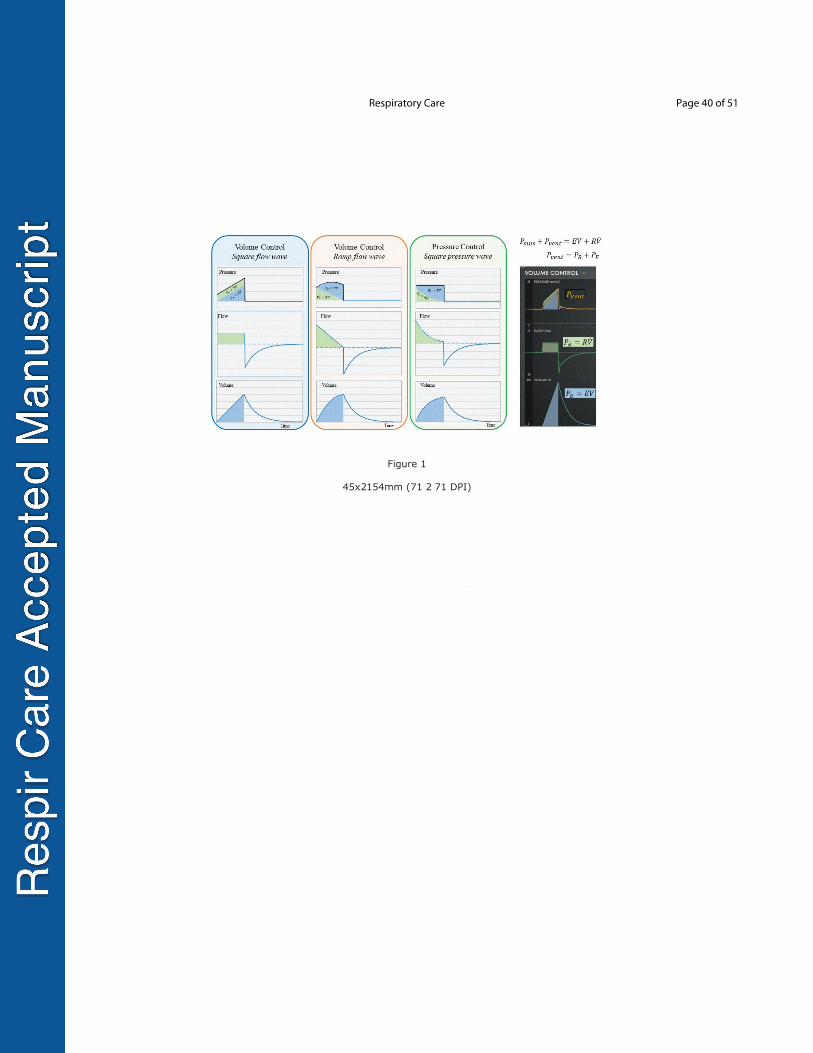
clinician can determine the main loads of the respiratory system (Figure 2).
During inspiration, the respiratory muscles or/and the ventilator generate pressure to deliver flow and
volume against the counter-pressure from the resistive and elastic properties of the respiratory system.
The mathematical model describing this is the Equation of Motion for the Respiratory System. There are
many forms of this equation, but a simple version is expressed as:
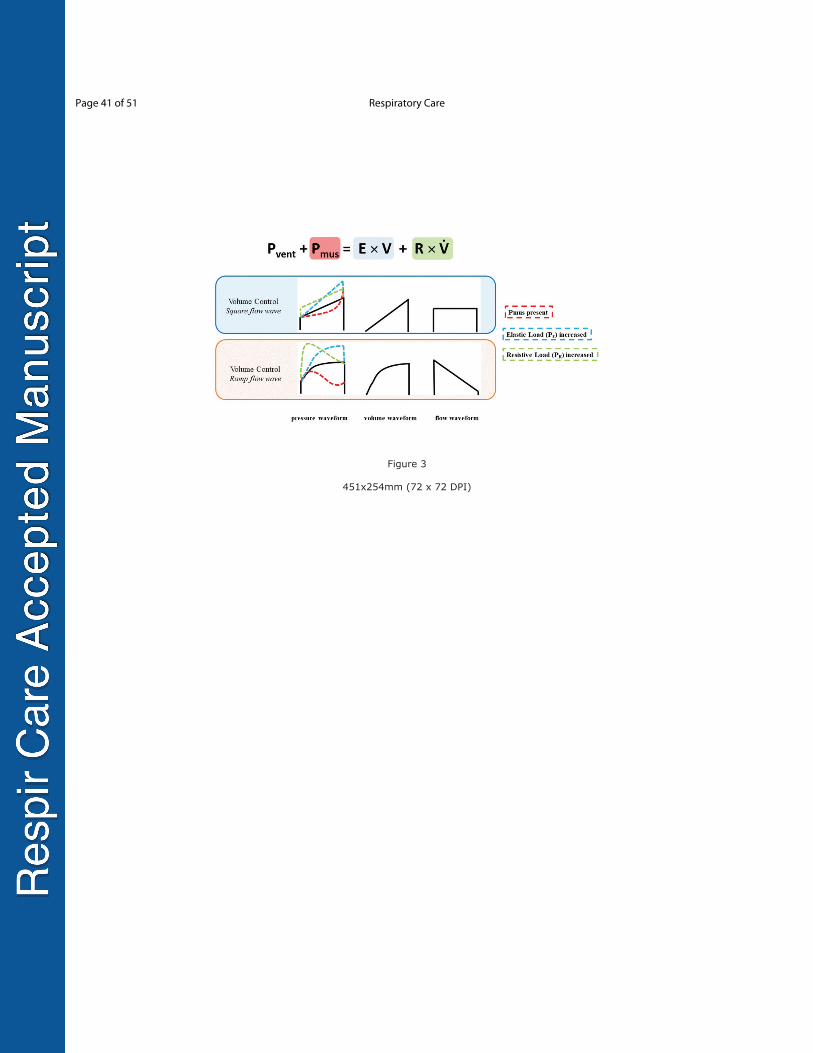
Pmus + Pvent = E V + R V (1)
where Pvent is the inspiratory pressure generated by the ventilator (above PEEP), Pmus is the inspiratory
pressure generated by the respiratory muscles, E is elastance (cm H2O/mL), V is volume (mL), R is
resistance (cm H20/L/s), and V is flow (L/min), all measured relative to their end-expiratory values. The
term E V has the dimensions of pressure and is called the elastic load (PE, the force to expand the chest
wall and lungs). The term R V also has the dimensions of pressure and is called the resistive load (PR, the
force to cause flow through the airways, both natural and artificial). Pvent and/or Pmus have to overcome
the elastic load and resistive load to achieve movement of air.
A note to the reader: elastance is the inverse of compliance. When we say high elastance it means low
compliance and vice versa. They are used interchangeably throughout the text. For example, we use
elastance when referring to the equation of motion, and use compliance when discussing the time
constant as it simplifies the math. For interpreting waveforms, we use compliance as this is what most
clinicians use at the bedside.
Having defined the concept of load, we will now describe the process for identifying the dominant load
(resistive or elastic), or if there is evidence of patient effort (Pmus), which makes determination of
resistance and elastance difficult. To be able to read the load or identify the presence of Pmus, we start by
Page 6 of 51Respiratory Care
7
identifying the breath control variable (it is defined in the TAG). The breath control variable is the output
the ventilator controls, either pressure or volume.
In volume control (VC) modes, by definition, the ventilator controls the inspiratory flow waveform (i.e.
the operator sets the peak flow and tidal volume) so the resulting pressure is the manifestation of the
respiratory system resistance and elastance. Thus, in VC you see the load and patient interactions in the
pressure waveform. Ventilators are excellent at controlling flow, so the tidal volume and flow waveform
will not change in the presence of Pmus for volume control with set-point targeting (see below).
In contrast, for pressure control (PC) modes, by definition, the inspiratory pressure waveform is
controlled by the ventilator (either the inspiratory pressure target is preset before inspiration starts or the
ventilator adjusts inspiratory pressure to be proportional to the patient’s inspiratory effort during
inspiration) so the resulting flow and volume are the manifestation of resistance and elastance of the
respiratory system. Thus, in PC you see the load and patient interactions in the flow and volume
waveforms. Ventilators are mediocre at controlling pressure (compared to controlling flow), so some
changes may also be evident in the pressure waveform, but the flow waveform should be the focus.
Note to the reader: When assessing load or patient-ventilator interactions, attention should be focused to
the waveform opposite the control variable.
The Anatomy of Ventilator Waveforms
To understand the physiology (determine the load) it is useful to know the determinants of the pressure,
volume, and flow waveforms for VC and PC during passive mandatory breaths, as in Figure 2. By passive
we mean that Pmus = 0 and by mandatory we mean that inspiration is either started or stopped (triggered or
cycled) by the ventilator. The waveforms contain the information on the elastic and resistive loads have
the dimensions of pressure. Actually, these are graphical representations of the equation of motion. At any
moment in time (horizontal axis of the graphs) the height of the pressure waveform is simply the height of
the volume waveform plus the height of the flow waveform (appropriately scaled by E for volume and R
Page 7 of 51 Respiratory Care
8
for flow) because Pvent = PE + PR. Every ventilator that displays pressure, volume, and flow waveforms is
plotting the equation of motion. (Figure 2) This knowledge is useful to understand how the resistive and
elastic loads manifest in the waveform according to the mode. Here we describe the most common
patterns.
Volume Control - Square Waveform (VCsq)
Figure 2 depicts the pressure, flow and volume waveforms for a VC passive inspiration with a square
flow waveform (i.e. constant flow). If we consider the resistance and elastance to be constant through the
inspiration, because the flow and volume are controlled, the resultant pressure waveform will be a
manifestation of the patient’s elastance and resistance.
Effects of Resistance
In VCsq, the ventilator delivers a constant inspiratory flow. It rises immediately and stops at the end of
the inspiratory time. This constant flow from the ventilator first encounters the resistance of the natural
and artificial airways. Because inspirations starts with an immediate rise in flow from zero to the set
value, and essentially no volume delivered, the airway pressure rises immediately as a manifestation of
the resistive load (R V). Once volume starts to be delivered to the alveoli, the airway pressure becomes a
manifestation of both elastic and resistive loads. At the end of the inspiration, in the absence of an
inspiratory hold, the airway pressure is the result of both the resistive and elastic loads (i.e., the end
inspiratory pressure). Figure 3 demonstrates that the resistive load is constant throughout the inspiration
(because flow and resistance are constant). If the flow stops (manual or preset inspiratory hold) the
resistive load is zero (R 0 = 0) and only the elastic load remains, this is the classic way taught to evaluate
the loads. You now can identify this with or without an inspiratory hold: the higher the resistive load, the
higher the initial step up in pressure, and if there is an end inspiratory pause, the greater the fall from the
peak to the plateau pressure.
Because the determinants of resistive load are flow and airway resistance, as either flow or resistance
increases, the resistive load will increase. As a consequence, the inspiratory resistive load can also be high
Page 8 of 51Respiratory Care
9
by setting high inspiratory flows (often done to decrease inspiratory time). To query if the issue is
resistance or high flow, it is useful to evaluate the expiratory flow waveform (see section below) as
generally high resistance will manifest both during inspiration and expiration.
Effects of Compliance
In VCsq, the volume is delivered at a constant rate (flow) to the lung, and the airway pressure rises
linearly. The slope of the pressure rise is proportional to elastance. The higher the elastance (the stiffer the
lungs) the faster the pressure rises. The equation of motion assumes that elastance is constant. That is
usually the case, however, in patients with very sick lungs (e.g. ARDS) the elastance may change during
inspiration. If there is recruitment during inspiration, the elastance would decrease and so would the
slope. On the contrary if during inspiration there is over-distention, the elastance would increase leading
to an increase in slope. The stress index16 is a mathematical equation used to detect non-constant elastance
by changes in the slope of the pressure waveform during VCsq. This is useful only if the patient is
passive, because any Pmus can distort the pressure waveform in VC.
Effect of Pmus
In VCsq, the Pmus will add to (inspiratory effort) or subtract from (expiratory effort) the inspiratory force
of Pvent. The pressure waveform will be deformed accordingly. During inspiration, if the patient makes an
inspiratory effort, then the pressure waveform will show a concave upward deformation. Patient effort can
be short, long, of different intensities and may occur early or late in the breath. It is not possible to
reliably discern the elastic or resistive loads while the Pmus occurs. (See work shifting below) (Figure 3)
Volume Control Descending Ramp Waveform (VCdsc)
In VCdsc, flow starts at the preset peak value and then decreases in a linear fashion through the
inspiratory time. The slope of the ramp depends of the inspiratory time, the set peak flow and set end
expiratory flow. It is important to remember that not all descending ramp waveforms are the same. On
some ventilators, end expiratory flow is set to a default value of zero while on others, it can be set to a
percentage of the peak flow (it is unclear why a manufacturer would give this as an option). In some
Page 9 of 51 Respiratory Care
10
ventilators, the time to reach peak flow may also be modified (called adjustable rise time, with a similarly
unclear rationale for this option). For this discussion we will use examples where inspiration begins at
peak flow and ends at zero flow.
Effect of Resistance
Similar to the square flow, the flow from the ventilator first encounters the resistance of the natural and
artificial airways. The airway pressure rises immediately as a manifestation of the resistive load. Figure 3
depicts the classic changes in pressure due to increased resistive loads. One may see waveforms
suggestive of high resistance when the flow is set high or when the resistance is high. To determine if the
issue is resistance or high flow, examine the expiratory flow waveform, to evaluate for airway resistance.
Effect of Compliance
In VCdsc, after flow begins, the effects of compliance will be hidden by the resistive component just as
with VCsq. The difference is that at end inspiration (assuming flow goes to zero), the end inspiratory
pressure is all PE. In this case, the end-inspiratory pressure is essentially the same as plateau pressure after
an inspiratory hold. In Figure 3 you can observe that if the elastic load is high (poor compliance) then the
end inspiratory pressure is higher. With this bedside observation you can assess if the elastic or resistive
pressures are elevated without imposing any maneuvers. If the flow is not set to end at 0, then these
assumptions do not apply, and the only way to assess the elastic load is an end inspiratory hold to
measure plateau pressure.
Effect of Pmus
The effects of Pmus on the pressure waveform during VCdsc are the same as for VCsq. It is not possible to
discern the elastic or resistive loads while the Pmus occurs.
Pressure Control Waveform
In PC with a square waveform, the ventilator increases the pressure from PEEP to the set inspiratory
pressure. This step increase in pressure, is immediate (unless the pressure rise time setting is increased)
Page 10 of 51Respiratory Care
11
and lasts for the set inspiratory time. At the end of inspiration, the pressure decreases immediately to the
set PEEP. Figure 2 depicts the pressure, flow and volume waveforms for a PC passive breath.
In PC, because pressure is the control variable, we look at the flow and volume waveforms to see the
patient’s respiratory system resistance, compliance and, if present, Pmus effects. In passive conditions,
after a step change in pressure (up or down), the flow and volume rise or fall exponentially. The
determinants of the rate of exponential change are the respiratory system resistance and compliance. The
time constant ( ) is the parameter that explains this (it is derived from the solution of the equation of
motion for volume and flow after a step change in Pvent). Understanding the time constant helps us deduce
which load (resistive or elastic) is dominating. The formula is simple,
= R C (2)
where is the time constant (in seconds), R is resistance (in L/s) and C is compliance (in cm H2O/L). One
time constant is the period of time where there is a 63% change in flow or volume (and hence alveolar
pressure) in response to a step change in pressure at the airway opening. Suppose the pressure changes
from 0 to 10 cm H2O on inspiration (or 10 to 0 cmH2O on expiration). At the end of a period of time
equal to one time constant (1 × ), the volume and flow will have changed by 63%. Hence alveolar
pressure will have changed by 6.3 cm H2O, leaving 3.7 cm H2O until equilibration). At the end of another
time constant (2 ), another 63% (or 0.63 x 3.7 = 2.3 cm H2O) change will occur, and so on (Figure 4).
This change continues, in theory, until infinity. For practical purposes, after a period equal to 5 ,
inspiration or expiration is considered complete (less than 1% of volume left). Setting inspiratory or
expiratory times to at least 3 is usually acceptable (Table 1)17.
Key Concepts: The flow waveform contains mostly the same information as the volume waveform
(including tidal volume, which is the area under the flow-time curve). The time constant is important
when examining passive flow waveforms during expiration for VC and for inspiration and expiration with
PC. The time constant is the result of a multiplication, so if the compliance or resistance are high, then
Page 11 of 51 Respiratory Care
12
the will be long, and if the compliance or resistance are low, then the time constant will be short. In
practice, a short time constant is generally due to low compliance (when has low resistance been an
issue?). A long time constant means either the resistance or compliance is high, and most of the time,
clinically, the issue is resistance. In general terms, the time constant in a passive patient, intubated, using
a heated humidifier with a normal respiratory system is 0.5 s, and thus the time to reach zero flow is
approximately 2.5s.17 The time constant varies according to the clinical condition (See Table 1). In
general, the goal is to recognize extremes: very long or very short (Figure 4).
The reader is advised that there are a few instances when PC is not delivered with a square waveform. In
pressure control using servo targeting (e.g. NAVA, PAV) modes, inspiratory pressure is controlled to be
proportional to inspiratory effort, based on the signal related to Pmus (ie, flow or diaphragm electrical
activity). Another reason is that most ventilators allow the user to set the pressure rise time. If rise time is
greater than zero, then the pressure rises in a curvilinear fashion to the target and thus inspiratory volume
and flow are not simple exponential equations determined by a single time constant. Nevertheless, the
passive expiratory volume and flow waveforms are unaffected.
Effect of Resistance
At the beginning of the inspiration, the step change in airway pressure, P, generates the peak inspiratory
flow (ie, peak flow = P/R). As volume is delivered, alveolar pressure rises. Hence the pressure driving
flow (airway pressure minus alveolar pressure) continually decreases with the resultant exponential decay
in flow (determined by the time constant). The resistive load is the highest at the beginning of the
inspiration, and lowest at end of inspiration.
If the resistance is elevated, then the time constant is longer. You can observe that peak flow is lower and
the flow waveform will take longer to reach zero flow. The same is true during expiration. Indeed, if the
set expiratory time is less than 3 , flow will still be negative when the next inspiration starts, indicating
gas trapping and autoPEEP.
Page 12 of 51Respiratory Care
13
Effect of Compliance
In a passive patient with no autoPEEP, just before inspiration (when flow is zero), the alveolar pressure is
equal to the airway pressure or PEEP. Immediately after the start of inspiration, the flow is increased to its
maximum, and the volume starts to be delivered to the alveoli. Alveolar volume and pressure rise
exponentially. Thus, the elastic load is zero at the beginning of inspiration, and maximal at the end of the
inspiration.
When the compliance is decreased, the time constant is decreased. Thus the time to reach zero flow is
short. A ventilated patient with normal lungs has a resistance of about 10 cm H2O (due the endotracheal
tube) and a compliance of about 0.05 L/cm H2O resulting in a time constant of about 0.5 seconds17.
Hence, an easy to remember rule of the thumb is that if the flow returns to zero before 1.5 seconds, your
compliance is very likely to be decreased.
Another practical tidbit: in a passive patient, if flow is zero at the end of inspiration, the end inspiratory
pressure will be equal the plateau pressure (the static pressure that results from an end inspiratory hold).
Common misconceptions about PC are that the set target pressure is equivalent to the plateau pressure
(true only if end inspiratory flow is zero), and that a plateau pressure using an inspiratory hold can’t be
obtained.
Effect of Pmus
The presence of Pmus will theoretically deform only the flow and volume waveforms (but in practice, as
mentioned above, the pressure waveform may also be distorted). The magnitude and duration of Pmus will
distort the waveforms accordingly. With this distortion, you may not be able to discern the predominant
load (resistive or elastic). However, if the effort is brief, and only at the start of inspiration or expiration,
the distortion of the flow waveform may be insignificant enough as not to obscure the load assessment.
Flow moving away from the baseline (ie, increasing flow) during inspiration indicates inspiratory effort
(positive Pmus) in PC ventilation (Figure 4). If there is evidence of Pmus during inspiration in the
Page 13 of 51 Respiratory Care
14
inspiratory flow waveform, then the expiratory waveform is your alternative to assess the physiology (as
long as it is passive).
Expiration
The expiratory phase is normally passive, due to the recoil of the lungs and chest wall. The expiratory
phase in mechanical ventilation (ie, the period from the start of negative flow to the start of positive flow)
is always pressure controlled. That is, during expiration the ventilator controls the pressure (i.e. you set
the PEEP). Therefore, we look at the flow (and volume) waveforms to see the physiology and patient-
ventilator interactions. The driving pressure for passive expiratory flow = P = Pplat – PEEP, for both PC
and VC. (Note that P Pplat – total PEEP because autoPEEP only exists at end expiration, although
autoPEEP will affect Pplat). Hence the same concepts of the time constant apply: a long time constant
means high resistance, and a short one means low compliance. (Figure 4)
The respiratory system has 2 time constants, inspiratory and expiratory, as compliance, and especially
resistance, are usually not the same during inspiration and expiration. However, in the majority of cases,
both move in the same direction. That is, if you see features of decreased compliance or increased
resistance in the inspiratory waveform, you are likely to see them in the expiratory waveform too. We use
the expiratory flow waveform to confirm the inspiratory waveform findings, or when there is Pmus in
inspiration. Rarely will you see them to be discordant, and if that is the case, look for something causing
variable obstruction, circuit issues, or ventilator settings. For example, a normal resistive load during
inspiration and high resistive load during expiration may point to an issue with the expiratory valve or
expiratory filter.
The output from step 2 is to define what the dominant load (resistive or elastic) is or there is Pmus. This
allows to move to the next step understanding the ventilator mode, and the patient physiology.
Page 14 of 51Respiratory Care
15
Step 3: Diagnose the Patient-Ventilator Interaction
The last clinically significant observation that can be obtained from the waveforms is how the patient and
ventilator interact. The interactions occur breath by breath, and as such, they will change with patient
condition, level of awareness, position etc. Many interactions will be temporary, harmless and may be
irrelevant clinically others may be harmful, especially if frequent (e.g. failed trigger). Although many
published reviews have described different types of interactions, there has been little consistency among
them and no attempt at a standardized vocabulary or taxonomy. Therefore, we propose the following
classification system which is based on word etymology, respiratory physiology and a description of the
interactions. The goal is that by using a standard and etymologically correct vocabulary we will provide
persistence of meaning to the terms that can translate across languages; by using descriptive terms, based
on signal analysis, rather than etiology, we intend to avoid ambiguity when reporting. By eliminating the
cause from the name, we allow the nomenclature to remain valid as we discover other causes. Table 3
summarizes the standardized taxonomy and multiple names used in the literature. The supplemental
appendix provide a glossary with the terms, their roots and rationale.
We have split the assessment of patient-ventilator interactions into two general types: 1) Synchrony,
which refers to timing of Pvent in reference to Pmus and 2) work of breathing, which refers to the
distribution of work from the ventilator (due to Pvent) in relation to that of the patient (due to Pmus).
Synchrony means a simultaneous action, development, or occurrence. In mechanical ventilation, it refers
to the timing of Pvent and Pmus signals in relation to each other. The patient activity is the reference event.
The gold standard for patient action (Pmus) is represented either by an esophageal pressure waveform (Pes)
or electrical signal from diaphragm (Edi eg, as measured during NAVA). In the absence of these
monitoring systems, we use the ventilator waveforms to infer the presence of Pmus. See Table 2 for the
definitions of synchrony, dyssynchrony and asynchrony.
Page 15 of 51 Respiratory Care
16
Work of breathing refers to both the patient and ventilator work, and their relation. This work relationship
has been interpreted by some as need for more “flow” being delivered by the ventilator. In extreme cases,
this is described as “flow starvation”. However, it is more accurate to use the term work shifting. Work is
performed when inspiratory volume is delivered under pressure (ie, the higher the pressure and the larger
the volume, the higher the work) (see work shifting section).
Note: If the patient is paralyzed/deeply sedated and there is no Pmus, then by definition there can’t be an
issue with synchrony: it is a matter of operator settings choice.
Here we outline an organized method for systematic observations to assess patient-ventilator interactions.
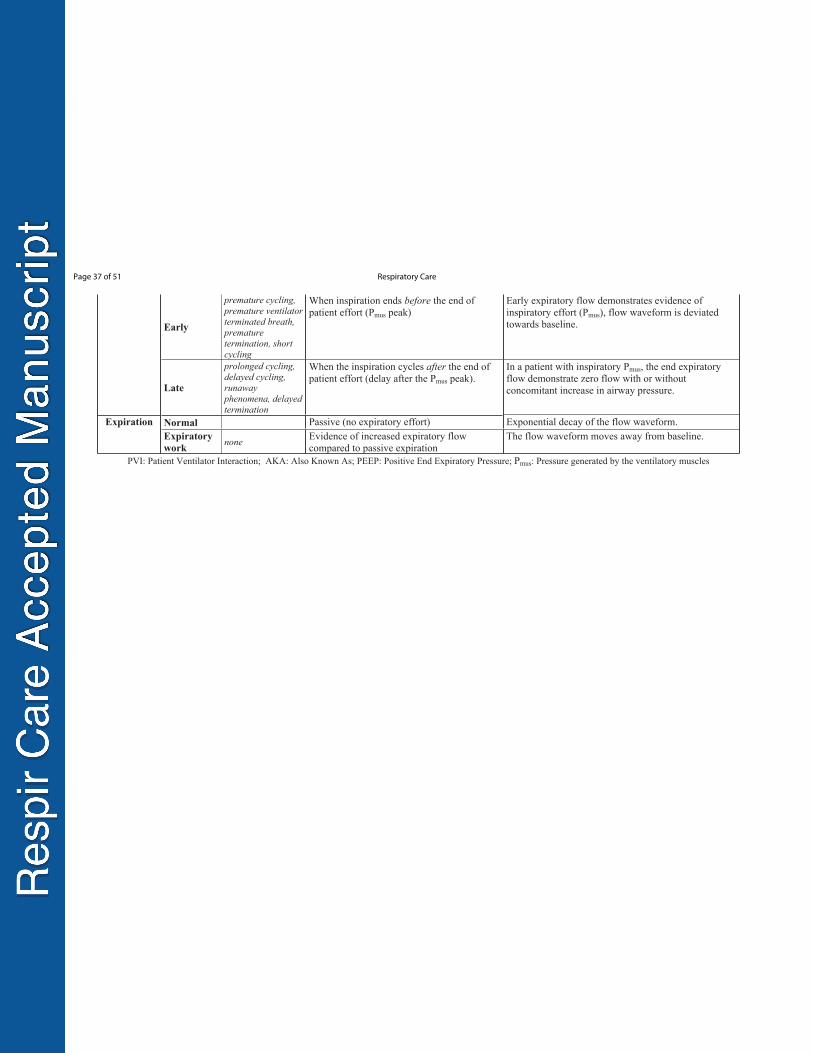
It follows the 4 phases of a breath: trigger, inspiration, cycle, expiration (Table 3).
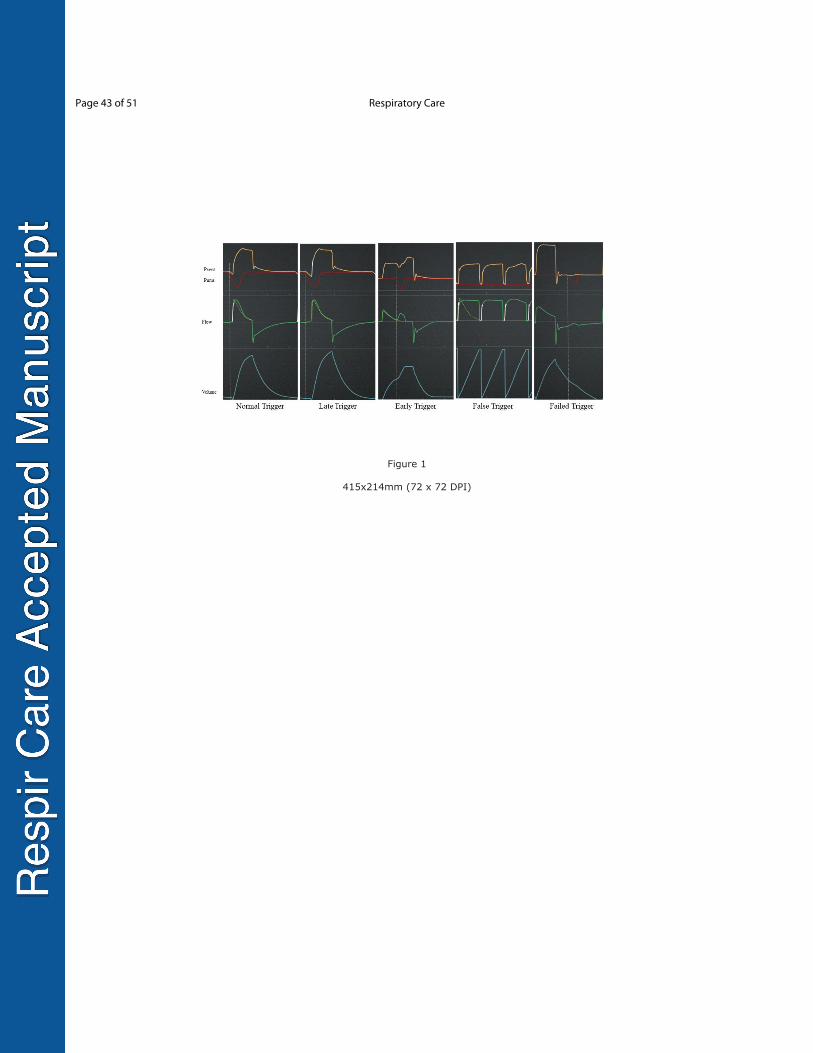
Trigger
The trigger event (start of mechanical inflation) is assessed in terms of synchrony (timing) with the start
of the patient’s inspiratory effort. It can occur early (before the patient signal), on time (synchrony), or
late (a clinical significant delay). There are two other conditions that are not related to timing, but rather
to ventilator function: false trigger, where a non Pmus signal triggers an inspiration; and a failed trigger,
where Pmus fails to trigger inspiration.
Normal (Synchrony)
The ventilator responds to a patient trigger effort with a delay that is clinically unimportant. Most
ventilators today have a very short trigger delay (ie, period from the start of trigger effort to the start of
flow delivery; sometimes defined as the delay from pressure drop below PEEP to return to PEEP).18 This
is the most common trigger interaction seen (Figure 5). Normal trigger is defined by absence of any other
abnormalities described below, as it is impractical to measure trigger delay at the bedside.
Late trigger
The ventilator responds to a patient trigger effort with a delay that may have important clinically
implications. In current modern ventilators, when trigger sensitivity is set appropriately the trigger lag is
Page 16 of 51Respiratory Care
17
< 100 ms18. This mainly occurs with inappropriate sensitivity settings (making it too hard to trigger). In
general, flow triggering results in less effort (trigger work) for the patient than pressure triggering18. Late
trigger is recognized when there is evidence of Pmus (either a drop in baseline pressure, or a rise in flow
above baseline) well before the start of inspiratory flow from the ventilator. Most current ventilators will
indicate patient triggering by pressure or flow by a color change in the trigger phase of the corresponding
waveform.
Another trigger observation, which is not necessarily related to the trigger being late, but manifests
similarly, is when the pressurization rate of the ventilator after trigger is not fast enough. This situation
occurs when the ventilator pressurization rate can’t match the patient effort, or more commonly, an
operator sets inappropriately long inspiratory rise times (Figure 5). Both these situations, late trigger and
delayed pressurization, will cause a prolonged trigger phase and increased work of breathing early in
inspiration.17, 18 For simplicity, we lump them both under the same classification.
Early trigger
A machine-triggered inspiration precedes the patient trigger effort. The key finding is the start of
inspiratory flow followed by evidence of Pmus, which may or may not trigger another breath (Figure 5).
The patient effort may occur any time during inspiration or early during expiration. This was initially
described 20 as reverse trigger, meaning that inspiratory flow from the ventilator somehow stimulated an
inspiratory effort from the patient, the reverse of the normal situation. It seems there are different causes
and variants, and a fair amount of work on its physiology has been described, but the phenomenon is still
being clarified.21–23 We use the term early trigger, as it describes the event in terms of the signals, not the
physiology, and thus it avoids changes in the taxonomy in the future. It is likely that many causes for
early trigger will be found.
Page 17 of 51 Respiratory Care
18
False Trigger
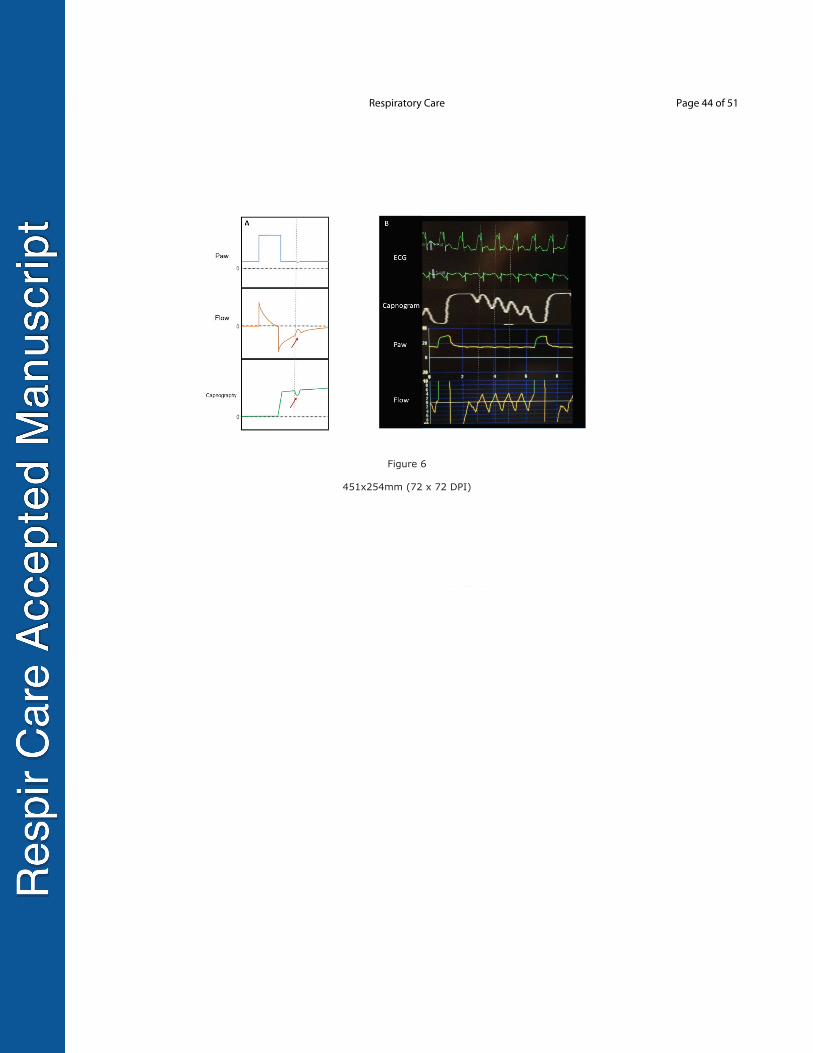
Inspiration is triggered by a non-Pmus signal (Figure 5). These (pressure or flow) signals are generally
caused by secretions or fluid in the circuit/endotracheal tube/airway, cardiac oscillations, etc. False
trigger can also be caused by a leak in the patient circuit. This can be challenging to recognize. Some
clues are the absence of evidence of Pmus during inspiration, presence of apparently patient-triggered
breaths in heavily sedated or paralyzed patients, or high frequency oscillations in the flow waveform.
Continuous capnography can provide a clue, as it will demonstrate oscillations in the expiratory
waveform tracing (figure 6, panel B). There are two techniques to help diagnose this. First is to assess
Pmus in the patient. Observe the neck muscles for evidence of effort, look at the abdomen, place your hand
on the patient. The second is to do an end expiratory pause, and observe for patient effort and for negative
deflections in the airway pressure, a manifestation of Pmus.
Failed Trigger
The patient effort fails to trigger inspiration. This is recognized in the expiratory flow waveform as
patient generated deflections towards the baseline that do not reach zero, a requirement for either flow or
pressure triggering. It can also be recognized in waveform capnography as a downward deflection in the
phase III expiratory plateau, often referred to as a “curare cleft” (figure 6, panel A). For flow triggering,
the inspiratory effort must generate a positive flow higher than the sensitivity threshold (eg, 2 L/min). For
pressure triggering, there must be enough positive flow to withdraw enough volume from the patient
circuit to drop airway pressure below the trigger threshold (eg, 3 cm H2O). Failed trigger efforts may
occur any time during the expiratory phase. Although there are many causes, the most concerning is
autoPEEP or air trapping, so we assess for other features of a high resistive load. (Note that Pmus during
the trigger effort must exceed autoPEEP for flow to cross zero and this is why muscular weakness or high
autoPEEP leads to failed trigger efforts). Other causes are over assistance (such as too large of volume
delivered leading to autoPEEP), excess sedation, and neuromuscular weakness. Naturally, a trigger
threshold set too high (ie, sensitivity too low) can cause a failed trigger effort even though the effort is
Page 18 of 51Respiratory Care
19
normal. In the waveform, high trigger threshold manifests differently from autoPEEP, as the flow will
cross zero but it will not reach the trigger threshold (Figure 5).
Inspiration
During the inspiratory phase (i.e., the period from the start of positive flow to the start of negative flow)
the patient-ventilation interaction is characterized by the relationship of work performed by the ventilator
and the patient (Figure 7).
Work shifting
In passive ventilation (Pmus = 0), the ventilator does all the work. In the simplest case, PC, where Pvent is
held constant, work is simply the product of Pvent and VT. On the other hand, when ventilatory assistance
is zero (eg, CPAP), then all the work is done by the patient (ie, Pmus generates the VT). When Pvent and Pmus
are active together, some portion of the total work is done by the ventilator and some by the patient. We
call this situation work shifting because some portion of the total work has shifted from the ventilator
(passive case) to the patient (active case). A work shifting index could be used to quantify and
characterize the relation.3 Work shifting can occur in any phase of inspiration, as it will depend when the
Pmus is active, the ventilator settings (mode, inspiratory time, trigger sensitivity, cycle threshold) and
patient-ventilator interaction.
The pattern of work shifting is affected by the mode and targeting scheme (Figure 7)24. In modes using
VC or that use adaptive targeting schemes, the relationship is inverse (i.e. as the patient does more work,
the ventilator does less work and total work remains constant). In PC modes that use set-point targeting,
the relationship is such that the work output of the ventilator per liter of tidal volume stays the same as the
patient work increases, although the total work increases due to the larger tidal volume. For modes which
use a servo targeting scheme, work output of the ventilator increases as the work output of the patient
increases. Be aware that when work shifting becomes extreme (i.e. high ventilatory drive due to
Page 19 of 51 Respiratory Care
20
hypoxemia or metabolic acidosis), this can result in either diaphragm or lung injury (i.e. tidal volume
overdose), and no mode or mode setting will ameliorate it. Sedation and paralysis may be required.
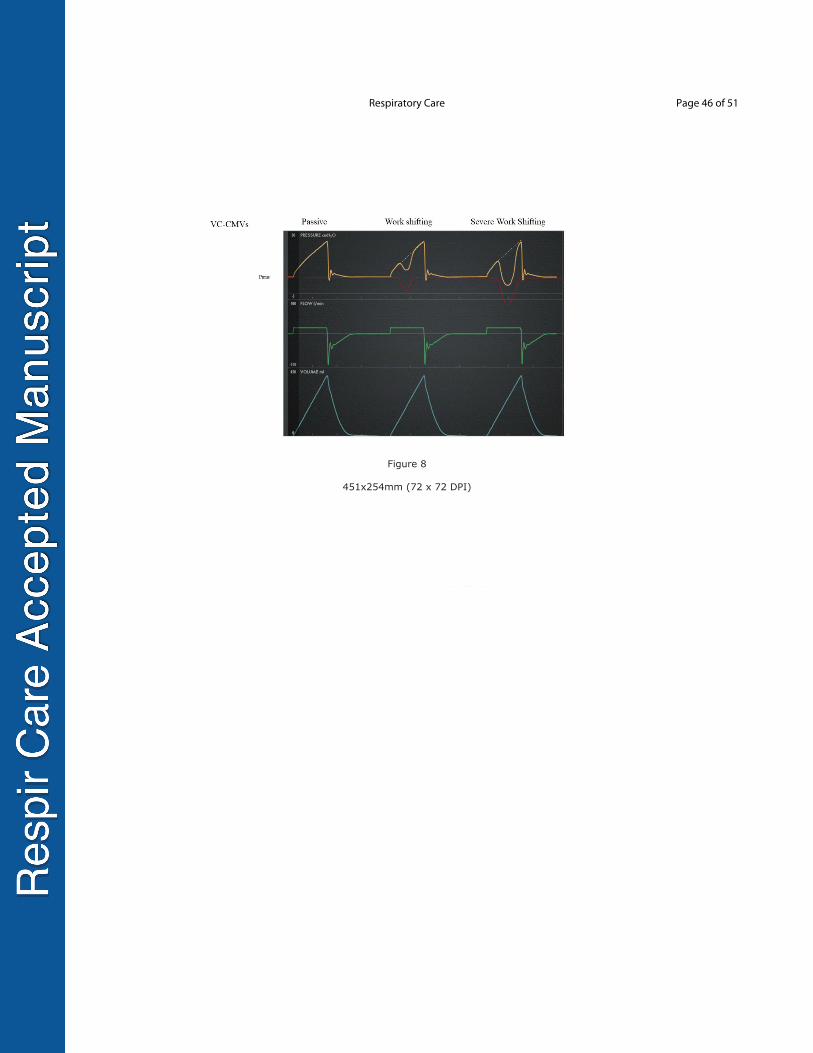
Volume Control with Set-point Targeting
During VC with set-point targeting, the operator sets the tidal volume, the peak flow, and sometimes the
flow waveform. If the patient is generating inspiratory effort, the magnitude of the flow delivered by the
ventilator in relation to the patient’s flow demand will affect the pressure waveform (Figure 8). The
inspiratory pressure waveform will move towards the baseline as Pmus increases. Remember, in the
equation of motion, Pmus and Pvent are on the same side of the equation, as the patient increases Pmus, the
Pvent will have to decrease to maintain the equality with the other side of the equation, representing the
pressure to deliver the tidal volume (elastic load, PE) and the pressure to deliver the flow (resistive load,
PR) as shown in Figure 8.
The total work of inspiration stays constant because volume and flow are unaffected by Pmus (i.e. the
patient can maximize effort but won’t get more volume) and the total pressure (Pvent + Pmus) stays
constant, hence work, a function of pressure and volume is unchanged. Pvent (and ventilator work)
decrease in exact proportion to the increase in Pmus (and patient work). Work shifting occurs whenever the
Pvent decreases in presence of Pmus. However, as long as the pressure remains above baseline (i.e. PEEP),
the ventilator is still performing work on the patient, and the flow delivered is still above the flow
requested by the patient. In extreme cases, when the patient generates high levels of Pmus, the Pvent
decreases below baseline (severe work shifting). In this case, the patient is actually doing work on the
ventilator system. This extreme, commonly called flow starvation, is most often seen during volume
control ventilation with set-point targeting. How much work shifting is appropriate depends on the
patient evaluation and clinician judgment, and an area we need further research. Severe work shifting
(AKA flow starvation) is never appropriate.
Page 20 of 51Respiratory Care
21
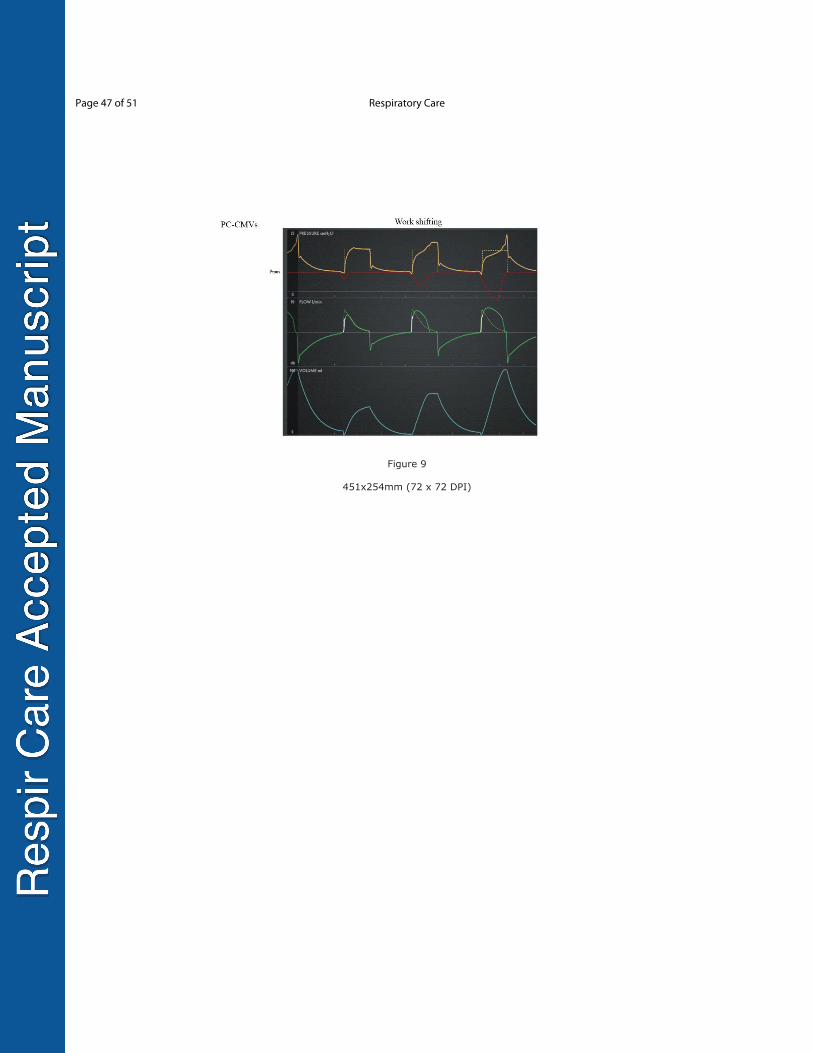
Pressure Control with Set-point Targeting
During PC with set-point targeting the operator sets the inspiratory pressure and either the inspiratory
time (CMV and IMV) or the flow cycle threshold (CSV). On some ventilators the operator can also set
the rise time which determines the time required to reach the target pressure and affects both peak flow
and tidal volume. Ideally, the ventilator should be able to achieve the target inspiratory pressure
regardless of any Pmus. In practice, ventilators vary in how well they can achieve this. The presence of Pmus
is identified by deformations in the flow waveform (Figure 4 and 9). Inspiratory Pmus will increase volume
and flow and vice versa. Because the total driving pressure (Pvent + Pmus), volume, and flow all increase,
the total work increases. Furthermore, the proportion of the total work the patient does increases because
Pmus increases relative to Pvent. In the presence of effort, the clinician can adjust the inspiratory pressure
target up or down according to the level of ventilatory support desired. If set too low, the patient is
assuming the majority of the work, and if the Pmus is large enough, airway pressure may even drop below
baseline. Monitoring the patient’s ventilatory effort is helpful in this case to adjust the inspiratory support.
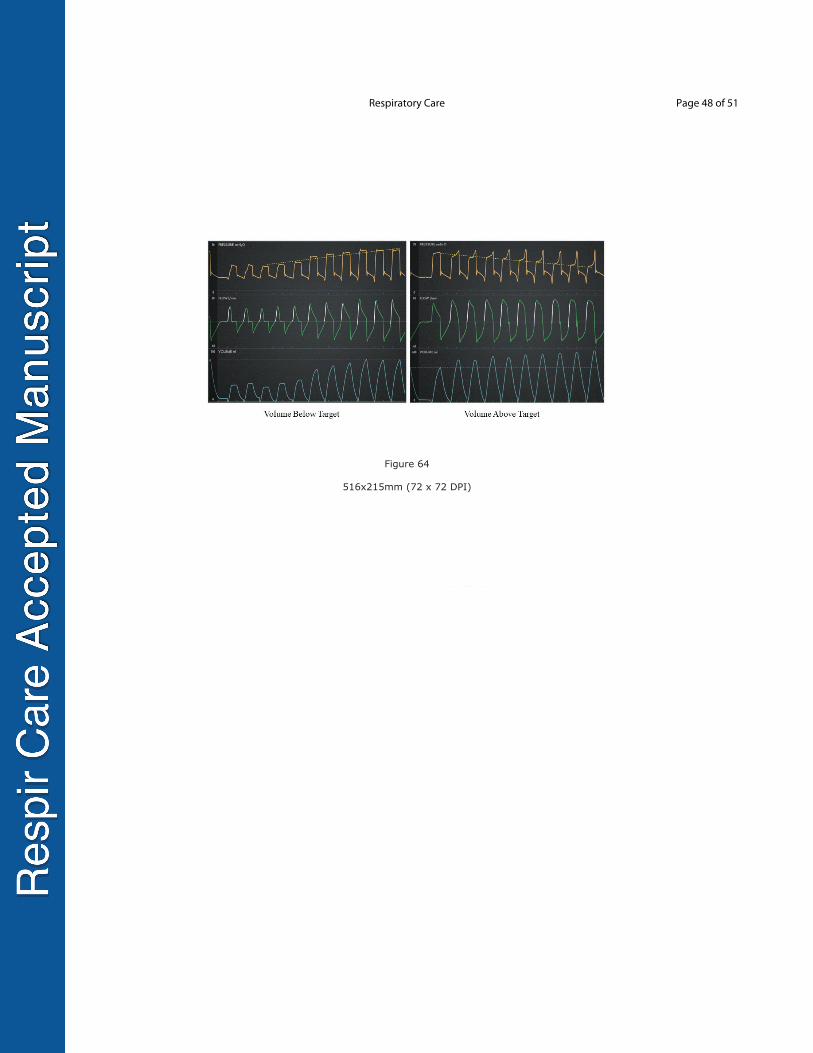
Pressure Control with Adaptive Targeting
In PC with adaptive targeting (eg, PC-CMVa, PC-CSVa PC-IMVa,a), the operator sets a target tidal
volume and the ventilator software automatically adjusts the inspiratory pressure between breaths to
achieve the target. As Pmus increases, the Pvent will decrease (Figure 10) in an attempt to maintain the VT
at target.15 The relationship of work is similar to VC with set-point targeting, the difference is that in PC
with adaptive targeting, the total work is not constant because the tidal volume can be larger than the set
target value on any given breath. The Pvent can only decrease so far (ie, PEEP or a little above depending
on the design of the ventilator).15 , in patients with high enough Pmus, the patient may be breathing at
PEEP level with little assistance from the ventilator and larger VT than target. Some degree of work
shifting may be clinically acceptable. In severe cases this is manifested by very low Pvent (at baseline), and
consistently larger tidal volumes, all generated by the patient. In some cases the Pvent will be below
baseline. Severe work shifting in adaptive targeting should be addressed promptly by the clinical team.
Page 21 of 51 Respiratory Care
22
Pressure Control with Servo Targeting
In PC with servo targeting (e.g. Neurally Adjusted Ventilatory Assist, NAVA, and Proportional Assist
Ventilation, PAV), the ventilator automatically adjusts inspiratory pressure in proportion to the Pmus
(Figure 7). With this targeting scheme, the ventilator keeps the relation between ventilator work and
patient work constant and controllable. Work shifting is minimized and can be adjusted by setting the
level of proportionality (PAV level or NAVA level). Recall that tidal volume is dependent on both the
level of assistance (Pvent) and Pmus.
Cycle
Cycle (start of expiration) is assessed in terms of synchrony (timing) with the end of the patient’s
inspiratory effort (ie, patient signal or Pmus). It can occur early (before the patient signal), on time
(synchrony), or late (a clinical significant delay). (Figure 11). Similar to triggering, there are two other
conditions that are not related to timing, but rather to ventilator function: false cycle, where a non-patient
signal cycles inspiration (e.g. pressure alarm); and a failed cycle, where patient cycle signal fails to cycle
the inspiration (e.g. runaway phenomena). However, these manifest as early or late cycle, thus, we
classified them as a cause, rather than a separate patient-ventilator discordance.
Normal (Synchrony)
Inspiration ends within a clinically acceptable time near the Pmus peak (ie, Pmus increases as the diaphragm
contracts and decreases as the diaphragm relaxes). In VC we observe the inspiratory pressure waveform,
and the expiratory pressure waveform. For PC, this is recognized by observing the flow waveform. There
should be no evidence early or late cycle. Sometimes a sharp rise in end inspiratory pressure can be a
ventilator artifact (see below) 25
Late cycle
Inspiration ends with a clinically important delay after the Pmus peak. Another way to state this is that the
patient’s “neural inspiratory time” is shorter than the inspiratory time imposed by the ventilator. It can
Page 22 of 51Respiratory Care
23
also be observed with spontaneous breaths if the flow cycle threshold is set too low or when patient effort
ceases but it fails to cycle inspiration. The primary example is the “runaway” phenomena in the mode
called Proportional Assist Ventilation, where the ventilator continues the assistance in spite of patient
terminating inspiratory effort due to the ventilator’s inaccurate estimation of lung mechanics.
Late cycling must be assessed according to the clinical context. For example, if a patient makes only a
short trigger effort and inspiration is time or volume cycled, then by definition this is late cycling. It may
be perfectly acceptable from both a patient safety and comfort point of view. However, late cycling
becomes relevant when there is evidence of expiratory effort before the cycle event. In VC, the pressure
waveform increases abruptly at end inspiration indicating expiratory effort or respiratory muscle
relaxation. The same can sometimes be seen with PC, and in addition, the expiratory effort will cause a
downward deflection in the flow waveform, possibly even crossing into negative flow before the
ventilator cycles inspiration (Figure 11). 26
Early Cycle
Inspiration ends within clinically important time before the Pmus peak. The cycle event occurs before the
patient effort ceases. Another way to say this is that the patient’s “neural inspiratory time” is longer than
the inspiratory time imposed by the ventilator (Figure 11). For both VC and PC, this is recognized in the
expiratory flow waveform as a distortion of the peak expiratory flow and disruption of the normally
smooth exponential flow decay of passive expiration. Early cycle is a common cause of multiple
triggering (a.k.a., “double trigger”). With PC, in some patients with very prolonged time constants (e.g.
COPD, asthma) flow may still be positive at the end of the inspiratory time. However, if there is no
evidence of inspiratory effort during the early expiratory phase, this is not a synchrony problem.
Early cycle can also occur if the ventilator cycles inspiration by a non-patient signal. This is typically
recognized as an unusually short inspiratory time. For example, a patient with very low compliance and a
rapid rise time in Pressure Support mode. This causes a high peak flow followed by rapid decay due to a
Page 23 of 51 Respiratory Care
24
short time constant, thereby too rapidly reaching the flow cycle threshold. It can also occur if ventilator
safety features, such as a pressure limit or a spontaneous tidal volume limit, are reached.
Expiration
During expiration (i.e., the period from the start of negative flow to the start of positive flow) the patient-
ventilation interaction is not characterized by timing (synchrony), but by work. Normal expiration is
passive. During expiration, the ventilator controls the pressure with set-point targeting (i.e., the target
value is PEEP). In a passive patient, we expect to see a smooth exponential decay of the expiratory flow
and volume waveforms. This allows us to observe the predominant physiology and the effects of trigger
and cycle discordances. The expiratory phase can demonstrate, as described above, other patient
ventilator interactions (early cycle and failed trigger), however the one that is proper to the expiratory
phase is expiratory work.
Expiratory work
Patient expiratory effort (ie, negative Pmus) will deform the flow waveform in a negative direction (away
from baseline). Expiratory work may be normal, as when exercising or coughing, but it may also indicate
the presence of high resistive load (e.g., pursed lip breathing in COPD), acidosis or anxiety (Figure 4).
Waveform Patterns
Ventilator waveform patterns are important to recognize as they may have clinical implications. A
waveform pattern is a sequence of or stereotypical waveforms which may have a clinical consequence
and are due to a patient-ventilator interaction. Many reports describe these patterns as a specific patient
ventilator interaction, however, as described below, they can have several etiologies. We approach these
separately from the standardized waveform analysis. Patterns should trigger further evaluation.
Page 24 of 51Respiratory Care
25
Multiple trigger
Multiple trigger is characterized by two or more ventilator breaths delivered in close succession without
complete expiration between them. Many ventilators have a “trigger window” immediately after
inspiration where another breath can’t be triggered, this leads to a brief but consistent pause between
mechanical inspirations Terminology for this phenomenon varies in the literature. It is sometimes called
double triggering, double cycling, clusters or breath stacking. All these terms have issues with meaning or
accuracy (see supplemental appendix). Although double trigger is the most common presentation, there
instances where multiple breaths are triggered, and thus the term “multiple”. Multiple trigger is a pattern
that has at least three causes (Figure 12): Early cycle, early trigger, and false trigger.27 Its presence has
been associated with poor outcomes28, the main concern being, in VC modes, overdosing of tidal volume
by “breath stacking” leading to ventilator induced lung injury (this is less so in PC, as VT is dependent on
R and C).
Tidal volume discrepancies
The volume waveform contains mostly the same information as the flow waveform, however there is one
area where it conveys specific information. Knowledge of how the ventilator displays volume is key. The
volume waveform is derived from the flow measurements for most ventilators; volume is the integral of
flow, which means that the area under the flow curve over the inspiratory flow time equals the tidal
volume. At the beginning of each breath (patient or machine triggered), the ventilator resets the volume
waveform to zero, so that the inspiratory tidal volume displayed is accurate. This means that differences
in inhaled and exhaled tidal volumes manifest with a pattern where the volume waveform has a sharp
drop (reset) prior to the next breath, similar to a square root sign. (Figure 13) This pattern has at least 4
causes: a) leak from the circuit, airway or lung; b) active exhalation during inspiration (some ventilators
do not account for VT exhaled during inspiration)26;c) air trapping, the patient has not been able to exhale
the inhaled VT and another breath is triggered, and d) flow sensor malfunction.
Page 25 of 51 Respiratory Care
26
There are multiple other artifacts and perhaps other patterns. This manuscript does not intend to be an
exhaustive review of all possible patient-ventilator interactions. Instead, we offer a standard nomenclature
and an organized method to read waveforms from which we are sure much will be added, researched and
improved.
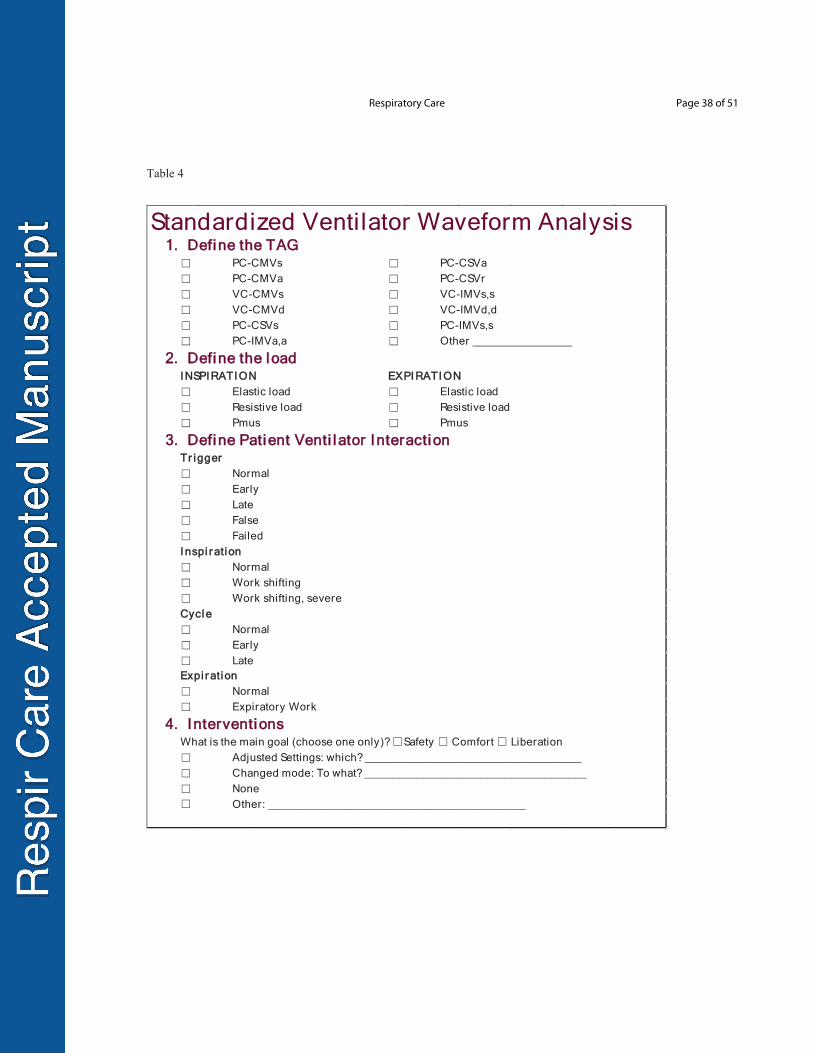
Applying the method
We have created a tool to aid the clinician in systematically reading waveforms (Table 4). This method
also allows one to summarize the patient state in a single sentence (e.g. The patient is on PC-CMVa, with
a high elastic load and has early triggers). It is common that more than one discordance is found in a
given tracing. Some discordances are associated with others (e.g. early trigger is commonly followed by
early cycle and work shifting) in which case we only mention the first discordance (i.e. early trigger).
Following this method will allow the clinician to decide if that patient ventilator interaction matches the
goals of ventilation, and if does not, to determine the changes in settings or modes needed to achieve the
goals.
In our practice, we emphasize that it is easier to decide what to do when you know what the goal is. There
are only three goals of mechanical ventilation (safety, comfort and liberation)7. They are not mutually
exclusive, but one must choose which is primary at the given time. For example, in a patient with ARDS
in the first days, the main goal is safety. We want to ensure the settings and interactions lead to lung
protective ventilation and ensure gas exchange. Comfort is important, but, we would not choose a mode
that favors comfort over lung protection. As the patient recovers, the clinician is likely to be attempting
liberation, yet if the patient is not ready, comfort (improving synchrony and work of breathing) in order to
minimize sedation would be the leading goal. Safety (i.e. preventing lung injury and ensuring gas
exchange) are still important, but modes that serve comfort and yet maintain safety should be preferred.7
Page 26 of 51Respiratory Care
27
This also helps put the interpretation of the waveform in context, as the changes done to the ventilator
should be in line with the goal of mechanical ventilation. For example, a patient with extreme work
shifting, in the setting of safety as a goal, will guide the clinician towards correcting the cause (e.g.
sedation, neuromuscular blockade, correction of metabolic acidosis).
A word of caution to the reader, patient-ventilator interactions occur breath by breath, and as such, they
will change with patient condition, level of awareness, interventions, etc. Many interactions will be
temporary, harmless and may be irrelevant clinically (e.g. mild work shifting), others may be harmful,
especially if frequent (e.g. multiple trigger in VC). Not every interaction requires an intervention.
Conclusions
Modern ICU ventilator displays provide a complex array of information on the patient’s condition. A
standard nomenclature is needed to ensure we communicate our findings clearly and consistently. A
systematic approach is needed to ensure consistent diagnosis and treatment for patient-ventilation
interaction issues, and ultimately improve outcomes. The methodical evaluation of the waveform provides
information that can lead to changes in how we implement an intervention that has the ability to save
lives, but also cause harm. Our proposal delivers a method and taxonomy based on prior published work
to help clinicians achieve these goals.
Page 27 of 51 Respiratory Care
28
References
1. de Haro C, Ochagavia A, López-Aguilar J, Fernandez-Gonzalo S, Navarra-Ventura G, Magrans R, et al. Patient-ventilator asynchronies during mechanical ventilation: current knowledge and research priorities. Intensive Care Med Exp. 2019;7(Suppl 1):43.
2. Holanda MA, Vasconcelos R dos S, Ferreira JC, Pinheiro BV. Patient-ventilator asynchrony. J Bras Pneumol. 2018;44(4):321-333.
3. Chatburn RL, Mireles-Cabodevila E. 2019 Year in Review: Patient-Ventilator Synchrony. Respir Care. 2020;65(4):558-572.
4. Grauer K. ECG -2014 Pocket Brain Book. Gainsville, FL: KG/EKG Press; 2014. http://www.r2library.com.p.atsu.edu/Resource/Title/9781930553255. Accessed April 11, 2021.
5. Chatburn RL, El-Khatib M, Mireles-Cabodevila E. A taxonomy for mechanical ventilation: 10 fundamental maxims. Respir Care. 2014;59(11):1747-1763.
6. Chatburn RL, Mireles-Cabodevila E. Closed-loop control of mechanical ventilation: description and classification of targeting schemes. Respir Care. 2011;56(1):85-102.
7. Mireles-Cabodevila E, Hatipo lu U, Chatburn RL. A rational framework for selecting modes of ventilation. Respir Care. 2013;58(2):348-366.
8. Chatburn RL. Mechanical Ventilation. In: Volsko TA, Chatburn RL, El-Khatib MF, eds. Equipment for Respiratory Care. 2nd edition. Burlington , MA.: Jones & Bartlett Learning; 2022:307-486.
9. Chatburn RL. Classification of mechanical ventilators and modes of ventilation. In: Tobin MJ, ed. Principles and Practice of Mechanical Ventilation. 3rd ed. New York: McGraw-Hill Medical; 2013:45-64.
10. Chatburn RL, Mireles-Cabodevila E. Design and function of mechanical ventilators. In: Webb AR, Angus DC, Finfer S, Gattinoni L, Singer M, eds. Oxford Textbook of Critical Care. 2nd ed. Oxford: Oxford University Press; 2016:419-429.
11. Chatburn RL, Volsko TA. Mechanical ventilators. In: Stoller JK, Egan DF, Kacmarek RM, eds. Egan’s Fundamentals of Respiratory Care. ; 2017.
12. Mireles-Cabodevila E, Chatburn RL, Duggal A. Modes of Mechanical Ventilation. In: Esquinas AM, Pravinkumar SE, Soubani AO, eds. Mechanical Ventilation in Critically Ill Cancer Patients: Rationale and Practical Approach. 1st ed. ; 2018:177-197.
13. Keszler M, Chatburn RL. Overview of assisted ventilation. In: Goldsmith JP, Karotkin EH, Suresh G, eds. Assisted Ventilation of the Neonate: An Evidence-Based Approach to Newborn Respiratory Care. 6th ed. Elsevier; 2017:140-152.
Page 28 of 51Respiratory Care
29
14. Chatburn RL, Volsko TA. Mechanical ventilators: Classification and principles of operation. In: Hess D, MacIntyre NR, Galvin WF, Mishoe SC, eds. Respiratory Care: Principles and Practice. 3rd ed. ; 2016:475-498.
15. Mireles-Cabodevila E, Chatburn RL. Work of breathing in adaptive pressure control continuous mandatory ventilation. Respir Care. 2009;54(11):1467-1472.
16. Grasso S, Terragni P, Mascia L, Fanelli V, Quintel M, Herrmann P, et al. Airway pressure-time curve profile (stress index) detects tidal recruitment/hyperinflation in experimental acute lung injury: Crit Care Med. 2004;32(4):1018-1027.
17. Arnal J-M, Garnero A, Saoli M, Chatburn RL. Parameters for Simulation of Adult Subjects During Mechanical Ventilation. Respir Care. 2018;63(2):158-168.
18. Sassoon CS. Triggering of the Ventilator in Patient-Ventilator Interactions. Respir Care. 2011;56(1):39-51.
19. Murata S, Yokoyama K, Sakamoto Y, Yamashita K, Oto J, Imanaka H, et al. Effects of Inspiratory Rise Time on Triggering Work Load During Pressure-Support Ventilation: A Lung Model Study. Respir Care. 2010;55(7):878-884.
20. Akoumianaki E, Lyazidi A, Rey N, Matamis D, Perez-Martinez N, Giraud R, et al. Mechanical Ventilation-Induced Reverse-Triggered Breaths: A Frequently Unrecognized Form of Neuromechanical Coupling. Chest. 2013;143(4):927-938.
21. Baedorf Kassis E, Su HK, Graham AR, Novack V, Loring SH, Talmor DS. Reverse Trigger Phenotypes in Acute Respiratory Distress Syndrome. Am J Respir Crit Care Med. 2020;203(1):67-77.
22. Yoshida T, Nakamura MAM, Morais CCA, Amato MBP, Kavanagh BP. Reverse Triggering Causes an Injurious Inflation Pattern during Mechanical Ventilation. Am J Respir Crit Care Med. 2018;198(8):1096-1099.
23. Delisle S, Charbonney E, Albert M, Ouellet P, Marsolais P, Rigollot M, et al. Patient–Ventilator Asynchrony due to Reverse Triggering Occurring in Brain-Dead Patients: Clinical Implications and Physiological Meaning. Am J Respir Crit Care Med. 2016;194(9):1166-1168.
24. Younes M. Proportional assist ventilation, a new approach to ventilatory support. Theory. Am Rev Respir Dis. 1992;145(1):114-120.
25. Younes M. Why does airway pressure rise sometimes near the end of inflation during pressure support? Intensive Care Med. 2008;34(1):1-3.
26. Chatburn RL, Mireles-Cabodevila E, Sasidhar M. Tidal volume measurement error in pressure control modes of mechanical ventilation: A model study. Comput Biol Med. 2016;75:235-242.
27. Liao K-M, Ou C-Y, Chen C-W. Classifying Different Types of Double Triggering Based on Airway Pressure and Flow Deflection in Mechanically Ventilated Patients. Respir Care. 2011;56(4):460-466.
Page 29 of 51 Respiratory Care

30
28. Sousa ML e A, Magrans R, Hayashi FK, Blanch L, Kacmarek RM, Ferreira JC. Clusters of Double Triggering Impact Clinical Outcomes: Insights From the EPIdemiology of Patient-Ventilator aSYNChrony (EPISYNC) Cohort Study. Crit Care Med. 2021;Latest Articles.
Page 30 of 51Respiratory Care
31
Figure legends
Figure 1. Summary of ventilator mode taxonomy and sample of TAG mode card. A mode can be described by 3 components: Breath Control Variable, Breath Sequence and Targeting scheme. We use a Taxonomic Attribution Grouping (TAG) to summarize these features. We can classify all modes present on a ventilator using a TAG Mode Card, which allows rapid identification of each modes features.
Figure 2. Graphic representation of the equation of motion and loads on ventilator waveforms. Pmus, Pressure generated by the patient; Pvent, pressure generated by the ventilator; E, elastance; V, volume; R, resistance; V, flow; PR, resistive load; PE, elastic load. Notice, for all modes, at the beginning of the breath, the main load is resistive; at the end of the breath, the elastic load predominates.
Figure 3. Effect of changes in Pmus, resistive and elastic loads in volume control. The flow and volume waveforms do not change as these are controlled by the ventilator. Changes in resistive load affect the initial step in Pvent without a change in slope. Changes in elastic load change the slope of pressure rise, Patient effort (Pmus) ads or subtracts to the airway pressure, in this case patient inspiratory effort subtracts to the airway pressure.
Figure 4. Effect of changes in Pmus, resistive and elastic loads in pressure control. The pressure waveform may demonstrate changes, however, it is being controlled by the ventilator. The time constant (RxC) describes a change of 63% per time constant in flow, volume and alveolar pressure. The decay of the waveforms is commonly termed “exponential decay” and is a manifestation of a passive patient. The presence of Pmus will deform the waveforms and will not allowing to determine the respiratory loads.
Figure 5. Classification of Trigger patient-ventilator interactions. Mode: PC-CMVs. Pvent: Airway pressure waveform displayed by ventilator. Pmus: Patient generated pressure waveform, simulated, overlay to demonstrate effect across waveforms. Vertical white dotted lines are for reference of the start of the Pmus. Normal Cycle, minimal drop in pressure with immediate pressurization. Late cycle: note flow crossing baseline, and a prolonged drop in pressure below baseline. Early cycle, machine triggered breath followed by evidence of patient effort (rise in flow above baseline), False trigger, Patient triggered breaths, however no evidence of Pmus. In this case triggered by circuit leak. Failed trigger, Pmus does not trigger a mechanical breath. Pmus is manifested as flow waveform moving towards baseline and a concomitant drop in airway pressure.
Figure 6. Capnography as an aid in recognizing asynchrony. In Panel A, the capnography demonstrates a deformation during exhalation consistent with a failed trigger. The waveform moves towards baseline, demonstrating and inspiratory effort. The vertical dashed line demonstrates the timing matching the deformations in pressure, flow and CO2 waveforms. In panel B, images from a patient that had false trigger due to cardiac oscillations transmitting to the airway. Notice capnogram demonstrates oscillations with progressive decrease of the CO2 level, this corresponds to oscillations in the flow waveform (gain increased to demonstrate the oscillations). The vertical dashed lines demonstrates the correlation electrocardiogram (ECG). Capnogram and flow waveforms.
Figure 7. Relation between patient effort and ventilator delivered pressure according to mode of mechanical ventilation. Pvent: Pressure delivered by the ventilator, Pmus: Pressure generated by patient respiratory effort. PAV: Proportional Assist Ventilation, NAVA: Neurally Adjusted Ventilatory Assist. PRVC: Pressure Regulated Volume Control. Representative sample of modes and mode names.
Figure 8. Work shifting in Volume Control Square Flow Waveform. Mode VC-CMVs. Pmus: Graphic representation of patient generated pressure. Passive breath, no Pmus. Work shifting: The pressure
Page 31 of 51 Respiratory Care
32
waveform is deformed towards baseline due to the presence of Pmus. It does not cross the baseline. Interrupted line demonstrates where the pressure waveform would be if Pmus was passive. The ventilator is still doing some amount of work on patient. It may be clinically appropriate. Severe Work Shifting: The pressure waveform is deformed due to the presence of Pmus, the pressure crosses the baseline (PEEP). Under this circumstances the patient is doing work against the ventilator. This is never clinically appropriate, needs immediate clinician attention. Note: red Pmus line was overlaid by hand onto a ventilator screen image and Pmus is shown inverted for clarity.
Figure 9. Work shifting in Pressure Control. Mode PC-CMVs. Pmus: Graphic representation of patient generated pressure. Work shifting: The pressure waveform is deformed towards baseline due to the presence of Pmus. It does not cross the baseline. Interrupted line demonstrates where the pressure waveform would be if Pmus was passive. Ventilators are unable to perfectly control the Pvent, thus the deformations. Green interrupted line demonstrates the passive flow waveform. The presence of Pmus will modify the flow waveform. In inspiration, flow will move away from baseline. Works shifting may be clinically appropriate. Notice the increase in volume as a manifestation of the added Pvent to Pmus. Note: red Pmus line was overlaid by hand onto a ventilator screen image and Pmus is shown inverted for clarity
Figure 10. Work shifting in Adaptive targeting schemes. Mode: PC-CMVa. Interrupted blue line demonstrates the target tidal volume. In right panel, volume is below target, the ventilator increases inspiratory pressure gradually to reach target tidal volume. Left panel, the patient effort (Pmus) leads to tidal volume above target, the ventilator gradually decreases inspiratory pressure in an aim to decrease delivered tidal volume. However the patient effort generates larger tidal volume. The spike in pressure at the end of the breath is a manifestation of late cycle.
Figure 11. Classification of Cycle patient-ventilator interactions. Mode: PC-CMVs. Pvent: Airway pressure waveform displayed by ventilator. Pmus: Patient generated pressure waveform, simulated, overlay to demonstrate effect across waveforms. Normal Cycle, Patient triggered, the effort was small, the flow decays passively to zero flow with no evidence of inspiratory or expiratory effort. Late cycle: Green dotted line demonstrates end of patient breath, flow reaches baseline and there is an increase of airway pressure due to relaxation of inspiratory muscles against a close valve (zero flow). Red dotted line demonstrates point where ventilator cycles. Early cycle, The machine cycles breath (red dotted line), expiratory flow with evidence of inspiratory patient effort (flow moves toward baseline); False trigger, ventilator cycles due to reaching a non-patient signal, in this case it was the high pressure alarm. Failed trigger, Patient cycle signal was missed flow continues until a safety cycle parameter (time) is reached. The cause was a circuit leak. Notice the flow never reaches baseline. Green dotted overlay to demonstrate passive flow waveform as a reference. Note: red Pmus line was overlaid by hand onto a ventilator screen image and Pmus is shown inverted for clarity
Figure 12. Causes of Multiple trigger. A. Early trigger, the pattern is mandatory breath with evidence of Pmus and a patient triggered breath, B. False trigger, no evidence of Pmus and triggering of a breath immediately after exhalation. C- D. Early cycle: Evidence of Pmus through first breath leading to triggering of next breath. Note: red Pmus line was overlaid by hand onto a ventilator screen image and Pmus is shown inverted for clarity.
Figure 13. There are many etiologies exist for inspiratory and expiratory discrepancy. This example is due to a leak (around endotracheal tube) causing false trigger. The ventilator flow trigger detects inspiratory flow (due to the leak) and triggers a breath. Note the characteristic “volumen reset” for the new breath leading to the “square root sign”.
Page 32 of 51Respiratory Care

33
Page 33 of 51 Respiratory Care
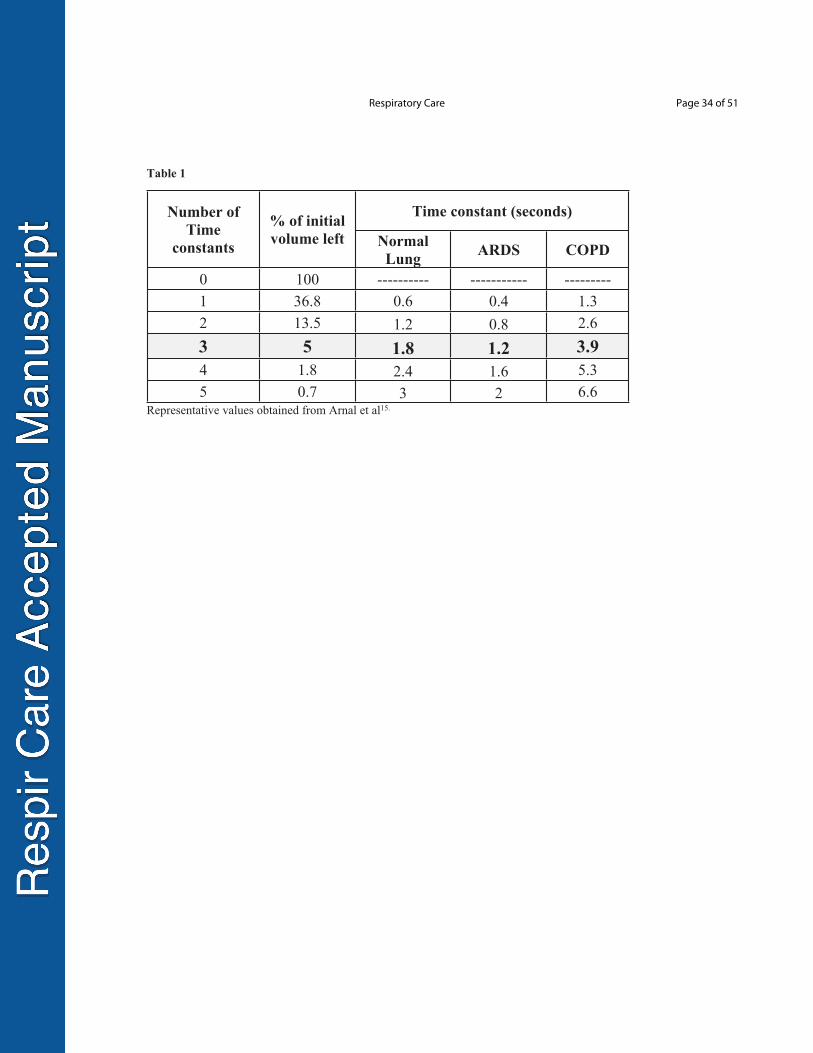
Table 1
Time constant (seconds)Number of Time
constants
% of initial volume left Normal
Lung ARDS COPD
0 100 ---------- ----------- ---------1 36.8 0.6 0.4 1.32 13.5 1.2 0.8 2.63 5 1.8 1.2 3.94 1.8 2.4 1.6 5.35 0.7 3 2 6.6
Representative values obtained from Arnal et al15.
Page 34 of 51Respiratory Care
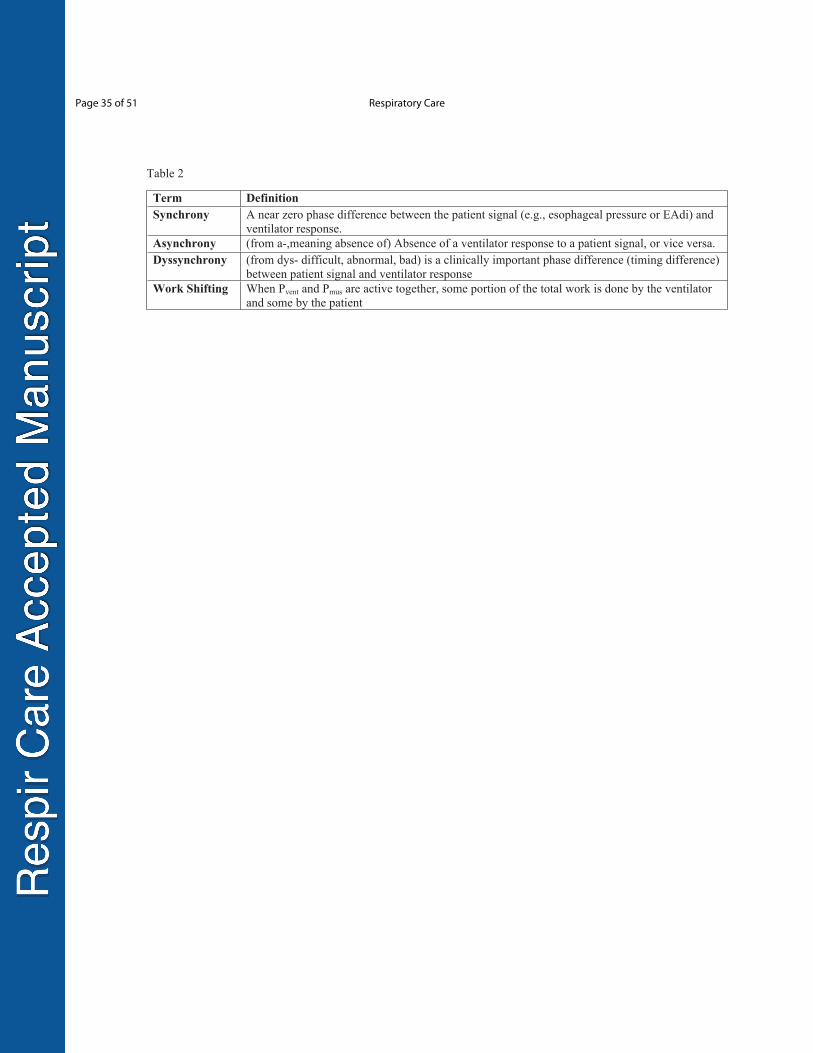
Table 2
Term DefinitionSynchrony A near zero phase difference between the patient signal (e.g., esophageal pressure or EAdi) and
ventilator response.Asynchrony (from a-,meaning absence of) Absence of a ventilator response to a patient signal, or vice versa.Dyssynchrony (from dys- difficult, abnormal, bad) is a clinically important phase difference (timing difference)
between patient signal and ventilator responseWork Shifting When Pvent and Pmus are active together, some portion of the total work is done by the ventilator
and some by the patient
Page 35 of 51 Respiratory Care
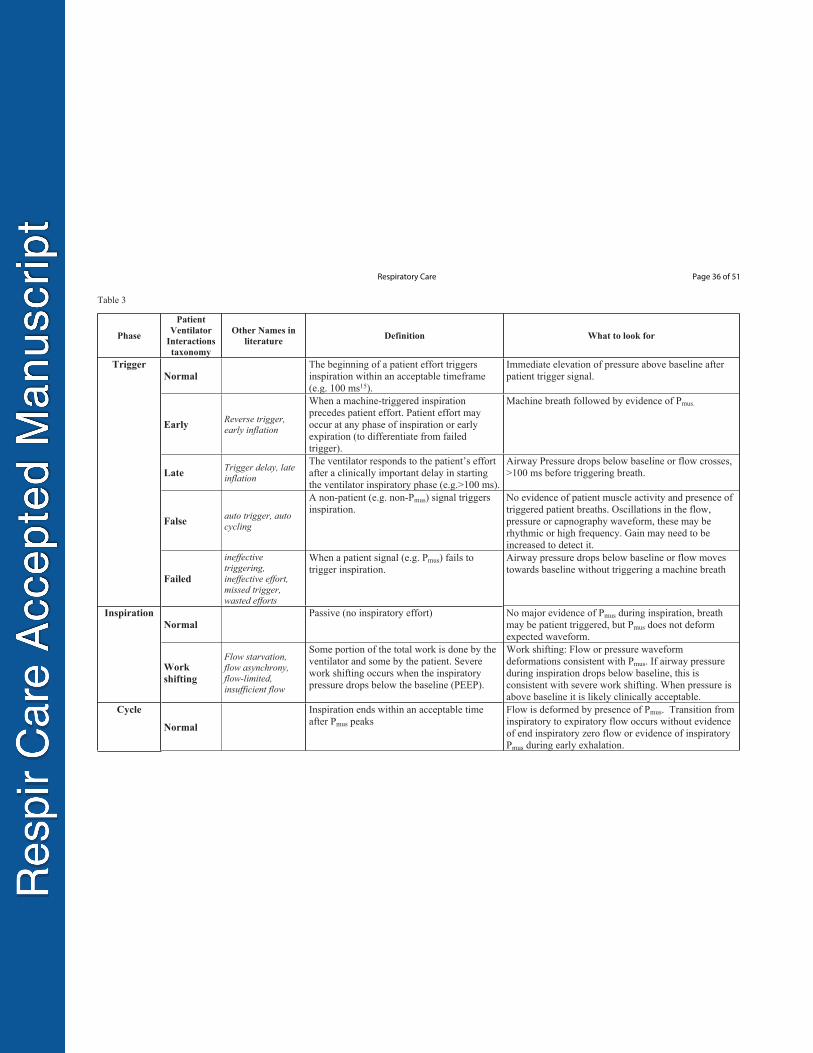
Table 3
Phase
Patient Ventilator
Interactions taxonomy
Other Names in literature Definition What to look for
Normal The beginning of a patient effort triggers inspiration within an acceptable timeframe (e.g. 100 ms15).
Immediate elevation of pressure above baseline after patient trigger signal.
Early Reverse trigger, early inflation
When a machine-triggered inspiration precedes patient effort. Patient effort may occur at any phase of inspiration or early expiration (to differentiate from failed trigger).
Machine breath followed by evidence of Pmus.
Late Trigger delay, late inflation
The ventilator responds to the patient’s effort after a clinically important delay in starting the ventilator inspiratory phase (e.g.>100 ms).
Airway Pressure drops below baseline or flow crosses, >100 ms before triggering breath.
False auto trigger, auto cycling
A non-patient (e.g. non-Pmus) signal triggers inspiration.
No evidence of patient muscle activity and presence of triggered patient breaths. Oscillations in the flow, pressure or capnography waveform, these may be rhythmic or high frequency. Gain may need to be increased to detect it.
Trigger
Failed
ineffective triggering, ineffective effort, missed trigger, wasted efforts
When a patient signal (e.g. Pmus) fails to trigger inspiration.
Airway pressure drops below baseline or flow moves towards baseline without triggering a machine breath
Normal Passive (no inspiratory effort) No major evidence of Pmus during inspiration, breath
may be patient triggered, but Pmus does not deform expected waveform.
Inspiration
Work shifting
Flow starvation, flow asynchrony, flow-limited, insufficient flow
Some portion of the total work is done by the ventilator and some by the patient. Severe work shifting occurs when the inspiratory pressure drops below the baseline (PEEP).
Work shifting: Flow or pressure waveform deformations consistent with Pmus. If airway pressure during inspiration drops below baseline, this is consistent with severe work shifting. When pressure is above baseline it is likely clinically acceptable.
Cycle
Normal
Inspiration ends within an acceptable time after Pmus peaks
Flow is deformed by presence of Pmus. Transition from inspiratory to expiratory flow occurs without evidence of end inspiratory zero flow or evidence of inspiratory Pmus during early exhalation.
Page 36 of 51Respiratory Care
Early
premature cycling, premature ventilator terminated breath, premature termination, short cycling
When inspiration ends before the end of patient effort (Pmus peak)
Early expiratory flow demonstrates evidence of inspiratory effort (Pmus), flow waveform is deviated towards baseline.
Late
prolonged cycling, delayed cycling, runaway phenomena, delayed termination
When the inspiration cycles after the end of patient effort (delay after the Pmus peak).
In a patient with inspiratory Pmus, the end expiratory flow demonstrate zero flow with or without concomitant increase in airway pressure.
Normal Passive (no expiratory effort) Exponential decay of the flow waveform.ExpirationExpiratory work none Evidence of increased expiratory flow
compared to passive expirationThe flow waveform moves away from baseline.
PVI: Patient Ventilator Interaction; AKA: Also Known As; PEEP: Positive End Expiratory Pressure; Pmus: Pressure generated by the ventilatory muscles
Page 37 of 51 Respiratory Care
For Peer Review
Table 4
Standardized Ventilator Waveform Analysis11. Define the TAG
PC-CMVs PC-CSVaPC-CMVa PC-CSVrVC-CMVs VC-IMVs,sVC-CMVd VC-IMVd,dPC-CSVs PC-IMVs,sPC-IMVa,a Other _________________
22. Define the loadII NSPI RATI ON EXPI RATI ON
Elastic load Elastic loadResistive load Resistive loadPmus Pmus
3. Define Patient Venti lator InteractionTr igger
NormalEarly Late False Failed
I nspi r ationNormalWork shiftingWork shifting, severe
CycleNormalEarly Late
Expi r ationNormalExpiratory Work
4. InterventionsWhat is the main goal (choose one only)? Safety Comfort Liberation
Adjusted Settings: which? _____________________________________Changed mode: To what? ______________________________________None
Other: ____________________________________________
Page 38 of 51Respiratory Care
For Peer Review
Figure 1
451x254mm (72 x 72 DPI)
Page 39 of 51 Respiratory Care
For Peer Review
Figure 1
45x2154mm (71 2 71 DPI)
Page 40 of 51Respiratory Care
For Peer Review
Figure 3
451x254mm (72 x 72 DPI)
Page 41 of 51 Respiratory Care
For Peer Review
Figure 1
145x241mm (72 x 72 DPI)
Page 42 of 51Respiratory Care
For Peer Review
Figure 1
415x214mm (72 x 72 DPI)
Page 43 of 51 Respiratory Care
For Peer Review
Figure 6
451x254mm (72 x 72 DPI)
Page 44 of 51Respiratory Care
For Peer Review
Figure 1
45x2m54( ( 71m 2 1m DPI)
Page 45 of 51 Respiratory Care
For Peer Review
Figure 8
451x254mm (72 x 72 DPI)
Page 46 of 51Respiratory Care
For Peer Review
Figure 9
451x254mm (72 x 72 DPI)
Page 47 of 51 Respiratory Care
For Peer Review
Figure 64
516x215mm (72 x 72 DPI)
Page 48 of 51Respiratory Care
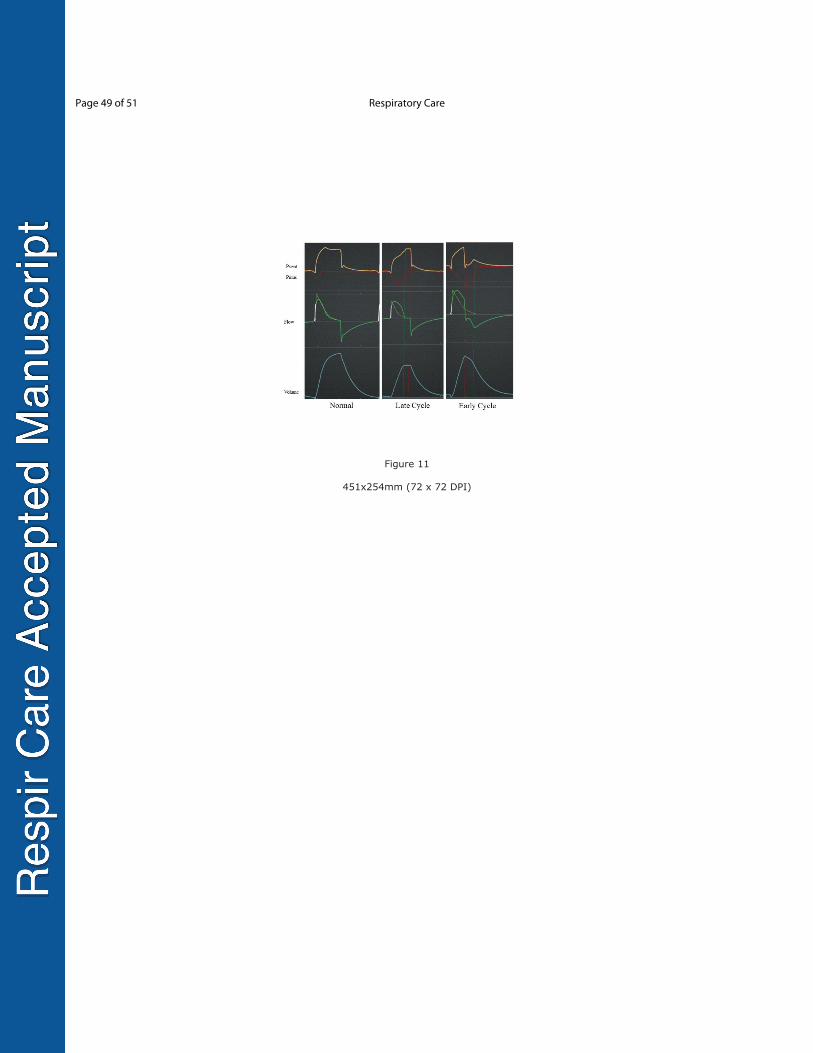
For Peer Review
Figure 11
451x254mm (72 x 72 DPI)
Page 49 of 51 Respiratory Care
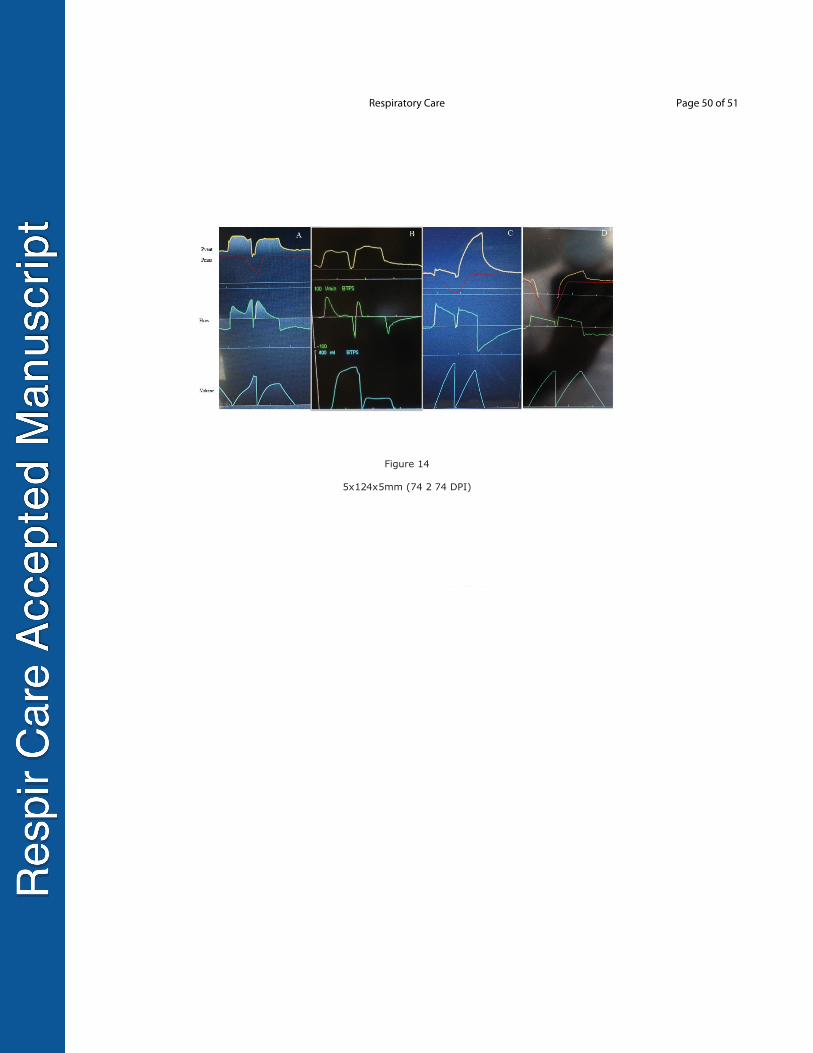
For Peer Review
Figure 14
5x124x5mm (74 2 74 DPI)
Page 50 of 51Respiratory Care
For Peer Review
Figure 34
513x215mm (72 x 72 DPI)
Page 51 of 51 Respiratory Care