Embed Size (px)
Citation preview
Introduction
The junction structure is part of a CSO system (Fig. 1). The Ordogarok channel is a relatively big, Ø474 cm closed conduit collecting sanitary and storm water from the north-west part of Budapest. In the CSO structure a weir is controlling the split of incoming water. The main volume of storm water is flowing toward the outflow into the Danube river. The
separated sanitary sewage part is flowing toward the main collector. The lateral flow of a sewage branch with an Ø120 cm diameter is joining into the main collector at the examined structure. The main collector is flowing along the Danube from north to south as Ø180 cm-Ø200 cm closed conduit and transporting the combined sewage to the Budapest Central Waste Water Treatment Plant (BCWWTP). At the outflow structure the Ordogarok conduit is flowing under the main collector in a syphon.
Pol. J. Environ. Stud. Vol. 30, No. 4 (2021), 3111-3116
Original Research
Fluid Flow Model Applied for Environmental Problems at a Combined Sewer Structure
Marcell Knolmar1*, Tamas Karches2, Nikolett Balogh1
1Department of Sanitary and Environmental Engineering, Budapest University of Technology and Economics, Budapest, Hungary
2National University of Public Service, Faculty of Water Science, Baja, Hungary
Received:10 October 2020Accepted: 14 November 2020
Abstract
A junction structure of the greatest combined sewers of Budapest (Hungary) was under hydrodynamic and water quality examinations. The selected junction performs an important role in the operation of a combined sewer overflow. The main environmental effects are on the receiving water body, on the biggest main sewer and on the wastewater treatment plant. In the first step, one-dimensional hydrodynamic simulation was executed for the main and lateral inflow sewers. The simulation results were presenting the open surface elevations of the water flow. In the next step, a 3D fluid flow model was built based on a steady state simulated flow assumption. The resulting velocity and turbulence distribution were showing the critical points of the structure and the joining conduits. The simulation without the lateral inflow highlighted the negative effect of the lateral inflow. The high velocity of the inflowing water is forcing the main branch flow to slow down. The water level and the sedimentation are increasing upstream in the main sewer. Historical sediment volumes data and frequent flooding complaints are confirming the simulation results. Suggestions based on 3D model simulations are given for the improvements.
Keywords: fluid dynamics, CSO, sediment, combined sewer, CFD
*e-mail: [email protected]
DOI: 10.15244/pjoes/130468 ONLINE PUBLICATION DATE: 2021-04-21

Knolmar M., et al.3112
The operation of this CSO system has several impacts on the environment: – the volume of the outflow without any treatment into
the receiving water means the main source of the effluent pollution [1],
– the sanitary sewage part of the combined sewage flowing into the main collector has a determining role in the operation of the BCWWTP,
– the sedimentation should be cleaned regularly in the main collector,
– the sedimentation is decreasing the capacity of the main collector, leading to backwater effect upstream from the examined junction structure leading to flood problems at the inflowing pipes,
– the high velocity water flow in the sewage branch is forcing the flow in the main collector to slow down, leading to sedimentation and flood problems.The purpose of the hydrodynamic examination is to
reduce the negative effects of the junction structure.
Material and Methods
Two simulation programs were used to calculate the flow conditions at the junction structure. One-dimensional (1D) quantitative and qualitative modelling of storm sewers can be simulated by EPA SWMM software [2]. For a preliminary 1D hydrodynamic calculation, we selected the Autodesk Storm and Sanitary Analysis [3] simulation software. Deriving from its 1D capabilities, the surface is linear between two junctions and the cross-sectional changes are
neglected. For acceptable simulation results, we were using the most precise available digital records of the sewer service provider (Budapest Sewage Works – FCSM). The records were including the inventory data and the flow measurement data in 2017–2018. The rainfall data were obtained from the Hungarian Meteorological Service for the same period. The water level and velocity at junctions could be calculated. The calculated results were not sufficiently detailed for our local examinations because: – the 1D limitations are acceptable for pipes but not
for 3D structures, – limited parameters of the junctions can be set (e.g.
diameter and depth), other parameters (e.g. friction, shape) are not included in SSA,
– the angle of the joining pipes is not taken into account.The detailed three-dimensional (3D) flow simulations
were executed by ANSYS Fluent Computational Fluid Dynamics (CFD) software [4]. The solid of the water body resulted from the SSA simulations was created in Autodesk Civil 3D and ANSYS SpaceClaim. In order to solve the equations in Fluent with finite-volumes methods, the meshing should be done. We chose the general purpose ANSYS Meshing software for the finite volume generation from the solid of the water body.
Fluid flow simulation of structures in case of wastewater flow is an accepted tool for the detailed examination. The performance of a grit chamber can be evaluated and the selection of the right geometry is helped by Fluent 3D simulations [5]. The adaptation of measurements in aerated tanks can be improved by
Fig. 1. Layout of the CSO system.

Fluid Flow Model Applied for Environmental... 3113
fluid flow calculations [6]. River flow is also driven by gravity and resulting in similar sedimentation and hydrodynamic phenomena [7] as storm sewer flow. CFD investigations were done for shallow settling tanks to calculate the ideal geometry [8]. There are also several case studies about the application of fluid flow simulations for a CSO [9], but only some in other combined sewer structures [10].
Results and Discussion
The task of the 1D simulations was to produce the steady state water body and the velocity at the upper boundaries required for the 3D simulations.
The examined junction structure is located in the middle of the SSA profile of the main collector (Fig. 2). The calculated water surface is showing the effect of the inflowing sewage branch. The increased diameter cannot decrease the water depth up to the examined junction. The water level is just above the crown level of the inflowing sewage branch pipe. The calculated velocity is 4.1 m s-1 in the sewage branch and 1.5 m s-1 in the main collector.
The geometry drawings of the water body were prepared in Autodesk Civil 3D (Fig. 3). The detailed drawings are showing the transition of the circular section from Ø180cm to Ø200cm at the structure. The sewage branch is joining at 49° to the main branch. On the last 2.3 m, its circular section is reduced to a partially filled circular section because of a built concrete sill.
The last checks and corrections of the geometry of the solids, e.g., the right joining of the 3D parts were assisted by the ANSYS SpaceClaim software. The rendering capabilities from any viewpoint, e.g., from inside the solid facilitates the geometry check. (Fig. 4).
The finite volumes of the water body solids can be prepared by the general purpose ANSYS Meshing software. The size and shape of the mesh is critical for the precision of the further fluid flow calculations. We applied the tetrahedral meshing in our model (Fig. 5). The length of the edges were in the range of 9.5-19 cm. At the transition sites the size of the meshing decreased. The further refinement of the meshing was not improving the fluid flow results.
The prepared mesh can be used in the ANSYS Fluent fluid flow simulation software. Several parameters should be set up, like the boundary conditions: – inlet of the main collector (velocity) – inlet of the lateral sewer branch (velocity),
Fig. 2. Steady state water surface in the main collector calculated by SSA.
Fig. 4. Water body drawing finalized in SpaceClaim.
Fig. 3. Water body drawings prepared in Civil 3D. Fig. 5. Meshing at the junction structure with scale in meters.
Knolmar M., et al.3114
– outlet at the main collector (free outflow), – free water surface in all conduits (defined as
symmetry in earlier Fluent versions), – pipe wall of all conduits and wall of the structure
(walls).The flow is incompressible, i.e. the density is not
depending on the pressure because the fluid is a mixture of sewage and storm water. The flow was set to change in time, therefore the water surface and velocity are calculated continuously.
The applied turbulence model is a critical point of fluid flow calculations. The following turbulence models are selectable: – k-ε – k-ω – k-ω SST
In the k-ε model the turbulent kinetic energy:
and the turbulent dissipation:
where:ε: turbulent dissipation [m2 s-3]k: turbulent kinetic energy [m2 s-2]C: model constantsσ: Schmidt numberG: quadrat of Frobenius norm of the deformation tensor vt: turbulent viscosity
In the k-ω model the turbulent kinetic energy:
and the turbulent dissipation:
where:Cμ: constantω: specific dissipation, ω = ε /k
In the current fluid flow analysis the turbulent model was set as k-ω SST. This hybrid turbulence model is integrating the advantages of the k-ε and the k-ω turbulence models. The k-ω turbulence method is much more precious close to the wall, while the k-ε model is better inside the fluid. Based on the calculated Reynolds number, the flow is in the turbulent range (>>2320). The turbulence intensity is in the intermediate range (2-3%), which is usual in the case of large pipes.
The time-step of the simulation was calculated based on the Courant-Fiedrich-Levy (CFL) number, which should be below 1.0 to reach stability:
where:U: average flow velocityΔt: time-stepΔx: the minimum edge length of the mesh
The time-step calculated from the CFL condition was 0.03 s. After 6000 time-steps, the quasi-steady state flow condition was reached, further simulation was not changing significantly the flow parameters.
The sensitivity analysis was showing a slight effect of the temperature and the selected turbulence model. The higher was the velocity, the higher were the local differences, but the maximum velocity values were almost insensitive.
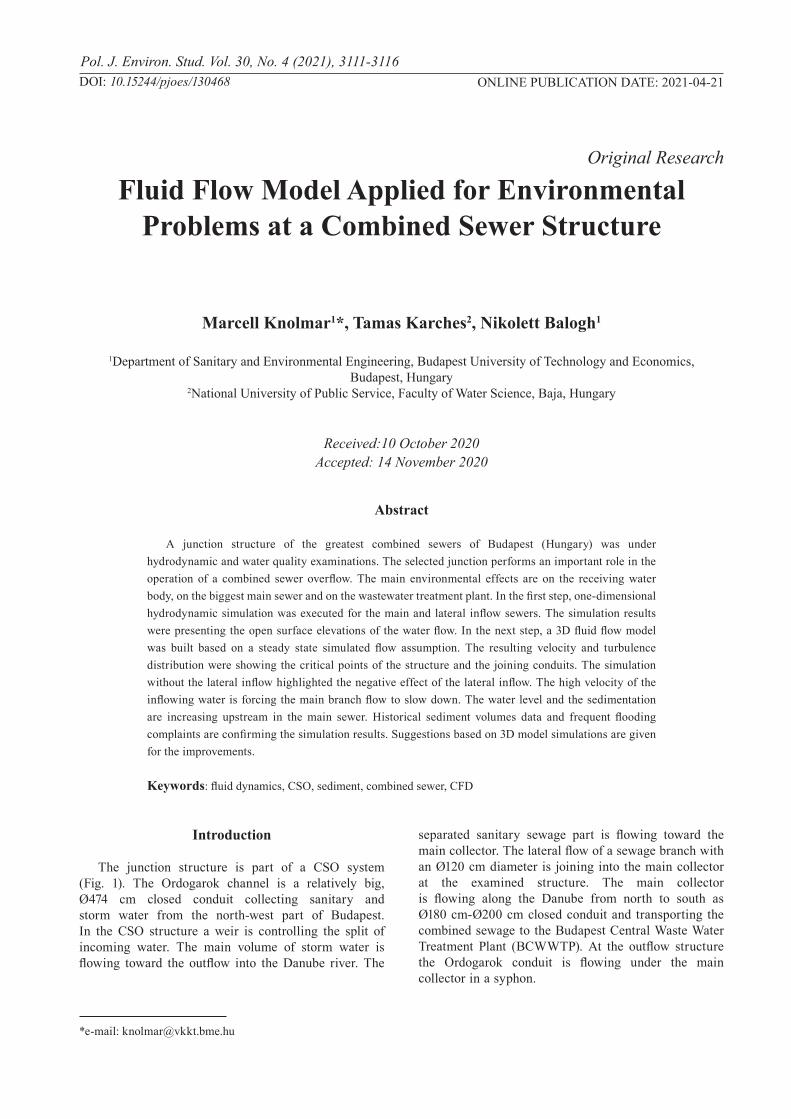
The velocity distribution is showing high spatial differences (Fig. 6). The lowest surface velocity is in the main collector up to the junction (1.5 m s-1). The high slopes in the lateral pipe are resulting in high
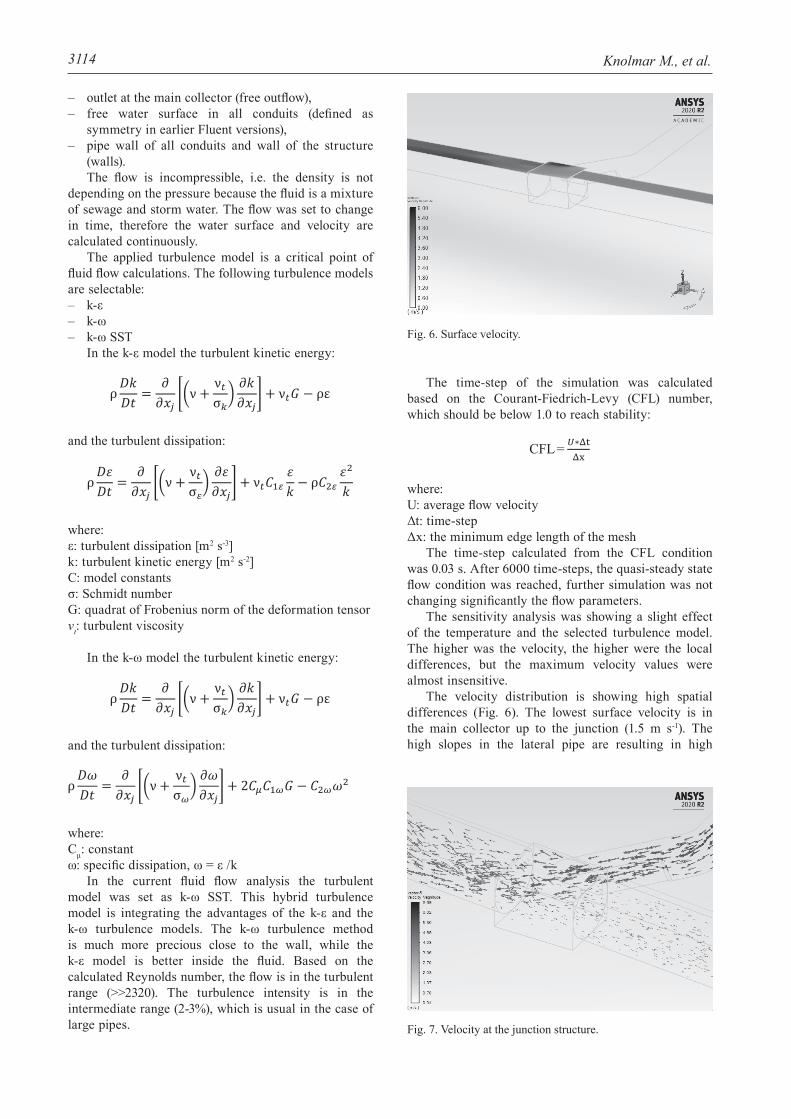
Fig. 7. Velocity at the junction structure.
Fig. 6. Surface velocity.
Fluid Flow Model Applied for Environmental... 3115
velocity (6 m s-1). The velocity is increasing significantly in the main collector as the effect of the lateral inflow (2.5-3.5 m s-1).
The lateral inflow is changing significantly the flow conditions in the main collector (Fig. 7). The high velocity flow from the lateral pipe is ruling the flow downstream. The flow in the main collector is slowing down upstream from the junction.
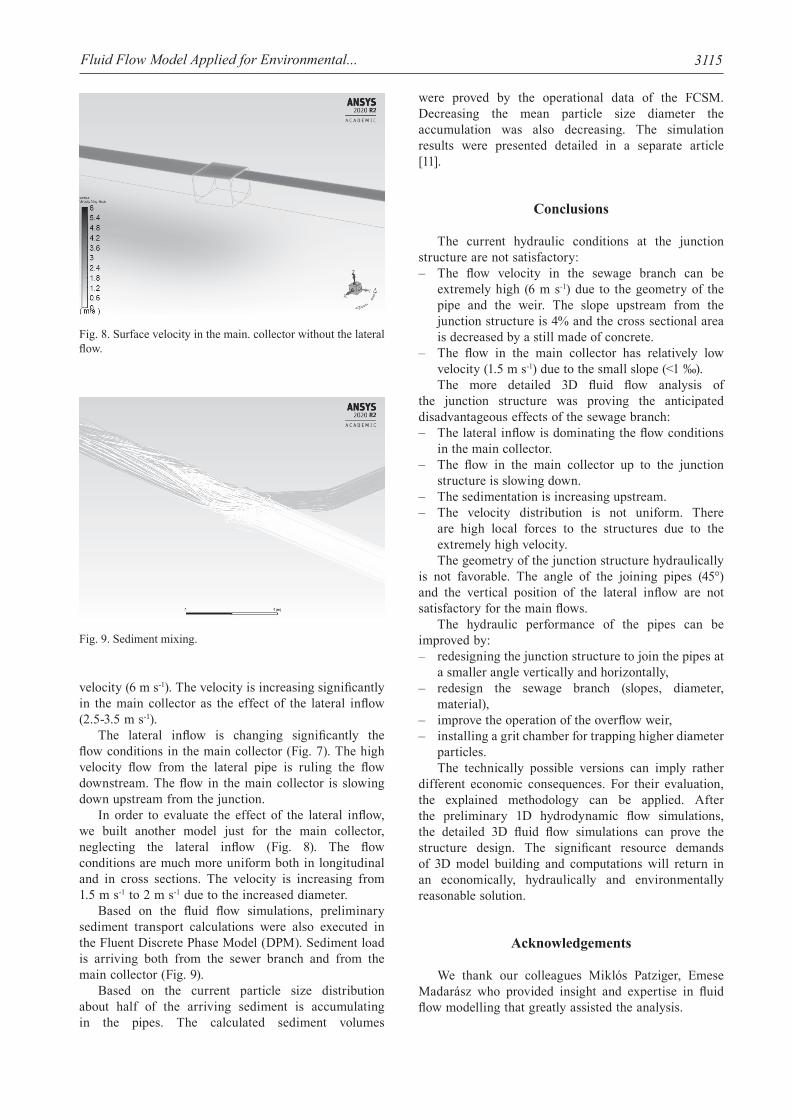
In order to evaluate the effect of the lateral inflow, we built another model just for the main collector, neglecting the lateral inflow (Fig. 8). The flow conditions are much more uniform both in longitudinal and in cross sections. The velocity is increasing from 1.5 m s-1 to 2 m s-1 due to the increased diameter.
Based on the fluid flow simulations, preliminary sediment transport calculations were also executed in the Fluent Discrete Phase Model (DPM). Sediment load is arriving both from the sewer branch and from the main collector (Fig. 9).
Based on the current particle size distribution about half of the arriving sediment is accumulating in the pipes. The calculated sediment volumes
were proved by the operational data of the FCSM. Decreasing the mean particle size diameter the accumulation was also decreasing. The simulation results were presented detailed in a separate article [11].
Conclusions
The current hydraulic conditions at the junction structure are not satisfactory: – The flow velocity in the sewage branch can be
extremely high (6 m s-1) due to the geometry of the pipe and the weir. The slope upstream from the junction structure is 4% and the cross sectional area is decreased by a still made of concrete.
– The flow in the main collector has relatively low velocity (1.5 m s-1) due to the small slope (<1 ‰).The more detailed 3D fluid flow analysis of
the junction structure was proving the anticipated disadvantageous effects of the sewage branch: – The lateral inflow is dominating the flow conditions
in the main collector. – The flow in the main collector up to the junction
structure is slowing down. – The sedimentation is increasing upstream. – The velocity distribution is not uniform. There
are high local forces to the structures due to the extremely high velocity.The geometry of the junction structure hydraulically
is not favorable. The angle of the joining pipes (45°) and the vertical position of the lateral inflow are not satisfactory for the main flows.
The hydraulic performance of the pipes can be improved by: – redesigning the junction structure to join the pipes at
a smaller angle vertically and horizontally, – redesign the sewage branch (slopes, diameter,
material), – improve the operation of the overflow weir, – installing a grit chamber for trapping higher diameter
particles.The technically possible versions can imply rather
different economic consequences. For their evaluation, the explained methodology can be applied. After the preliminary 1D hydrodynamic flow simulations, the detailed 3D fluid flow simulations can prove the structure design. The significant resource demands of 3D model building and computations will return in an economically, hydraulically and environmentally reasonable solution.
Acknowledgements
We thank our colleagues Miklós Patziger, Emese Madarász who provided insight and expertise in fluid flow modelling that greatly assisted the analysis.
Fig. 9. Sediment mixing.
Fig. 8. Surface velocity in the main. collector without the lateral flow.

Knolmar M., et al.3116
Conflict of Interest
The authors declare no conflict of interest.
References
1. JIN D., HUAIEN L , LAN C., CHAOLU Y. Water Quality Variation Characteristics in Stormwater Period and on Weihe River Time Scale. Polish Journal of Environmental Studies, 26 (6), 2495, 2017.
2. CHUNLIN L., MIAO L., YUANMAN H., JIPING G., YANYAN X. Modeling the Quality and Quantity of Runoff in a Highly Urbanized Catchment Using Storm Water Management Model. Polish Journal of Environmental Studies, 25 (4),1573, 2016.
3. AUTODESK Inc. Autodesk Storm and Sanitary Analysis 2014. User’s Guide, available online: https://images.autodesk.com/adsk/files/Autodesk_Storm_and_Sanitary_Analysis_2014.pdf (accessed on 10.10.2020)
4. ANSYS, Inc. Ansys Fluent Theory Guide 2020 R2, Publisher: ANSYS, Inc., Southpointe, US, available online: https://ansyshelp.ansys.com/account/secured?returnurl=/Views/Secured/corp/v202/en/flu_th/flu_th.html (accessed on 10.10.2020)
5. KARCHES T., SZELPAL D. Verification of Horizontal Flow Grit Chamber Performance at Various Load
Conditions. International Journal of Latest Research in Engineering and Technology, 3 (8), 44, 2017.
6. MADARASZ E., PATZIGER M. Improving and Adaptation of an In Situ Measurement Technic in Aerated Tanks. 10th Eastern European IWA Young Water Professionals Conference. Zagrab, Croatia, International Water Association (IWA), 335, 2018.
7. TÖRÖK G.T., JÓZSA J., BARANYA S. A Novel Sediment Transport Calculation Method-Based 3D CFD Model Investigation of a Critical Danube Reach. Polish Journal of Environmental Studies, 29 (4), 2889, 2020.
8. PATZIGER M.. Computational fluid dynamics investigation of shallow circular secondary settling tanks: Inlet geometry and performance indicators. Chemical Engineering Research and Design, 112, 122, 2016.
9. HE C., MARSALEK J., ROCHFORT Q. Numerical Modelling of Enhancing Suspended Solids Removal in a CSO Facility. Water Quality Resource Journal of Canada, 39 (4), 457, 2004.
10. KIM J.S., JO J.B., YOON S.E. Head Loss Reduction in Surcharged Four-Way Junction Manholes. Water, 10, 1741, 2018.
11. KNOLMAR M., KARCHES T., BALOGH N. Computational Fluid Dynamics Discrete Phase Modelling in Storm Sewers. Environmental Engineering and Management Journal, 19 (4), 557, 2020.