Embed Size (px)
Citation preview
Introduction
In coastal areas, environmental problems (such as water
quality deterioration, eutrophication, and algae bloom) is
produced by both natural and human activities. Coastal
environmental problems show not only various patterns of
spatial inshore-offshore and along-shore gradients, but
often also considerable year-to-year variations in both
intensity and extension, under the direct influence of both
natural and human activities [1]. Environmental problems
in coastal areas are determined by competing processes in
the water. Anthropogenic influences as well as natural
processes play a role in coastal water, and impair their use
for industrial, agricultural, recreational, or other purposes.
Therefore, researchers have been paying more attention to
the effects of natural and human activities on water quality,
in particular the key contributors of human activities to
nutrients and heavy metals [2, 3].
People are becoming more aware of the complexity of
nature and the delicate balance that exists within the glob-
al ecosystem [4]. The discharge of effluents and associat-
ed toxic compounds into aquatic systems represents an
ongoing environmental problem due to their possible
impact on communities in the receiving aquatic water, and
the potential effect on human health [5]. Diffuse pollu-
tants due to natural and human activities have been
increasingly declining water quality, and pollution pre-
vention requires a better understanding of water quality
and the impact by natural and human activities in coastal
areas.
Pol. J. Environ. Stud. Vol. 21, No. 5 (2012), 1445-1452
Original ResearchIdentification of Coastal Water Quality,
Including Heavy Metals, in the South China Sea
Mei-Lin Wu1, 2, 3, Yan-Ying Zhang2, 3, Li-Juan Long2, 3, Si Zhang2, 3, You-Shao Wang1, 2, 3,
Juan Ling1, 2, 3, Jun-De Dong1, 2, 3*
1State Key Laboratory of Tropical Oceanography, South China Sea Institute of Oceanology,
Chinese Academy of Sciences, Guangzhou 510301, China2Key Laboratory of Marine Bio-resources Sustainable Utilization, South China Sea Institute of Oceanology,
Chinese Academy of Sciences, Guangzhou 510301, China3Tropical Marine Biological Research Station in Hainan,
Chinese Academy of Sciences, Sanya 572000, China
Received: 17 June 2011Accepted: 6 December 2011
Abstract
Human activities and natural processes like mixing and/or upwelling driven by climate change have a
strong influence on water quality in the coastal regions. Human activities are the dominant factor for water
quality in the mouth of the Sanya River. This region exhibited the maximum influence of discharge from the
Saya estimated by higher nutrient levels and chlorophyll a (Chl a). Natural processes are the dominant factor
regarding water quality in outer bay. Both human activities and natural processes play important roles on water
quality in Sanya Bay. Each hydrologic and ecological zone has a specific water quality response associated
with the relative importance of both human activities and natural processes. Therefore, the information would
be useful for regional agencies in developing a strategy to carry out scientific plans for resource use based on
marine system functions.
Keywords: nutrients, heavy metals, monsoons, human activities, coastal ecosystem
*e-mail: [email protected]
This study identified the temporal and spatial variations
of water quality, including heavy metals, and particularly
the impacts of natural and human activities on water quali-
ty in order to enact better management policies in coastal
areas.
Materials and Methods
Study Area
Sanya Bay lies on the southern shore (from 109º20' to
109º30'E, 18º11' to 18º18'N) of Hainan Island, with a water
area of 120 km2 and an average depth of 16 m. It is a typi-
cal tropical bay in China. Dongmao Island, Ximao Island,
and Luhuitou possess mostly coastal coral reefs. The Sanya
River is in the eastern part of the bay (length 31.3 km,
drainage area 337 km2 and annual flow of 2.11×10⁹ m3) [6].
The wet and warm southwest monsoon prevails in the wet
season from April to September, which brings humid air
from low latitudes, resulting in gentle monsoonal rainfall in
spring and heavy rainfall in summer. In contrast, a dry and
cold northeast monsoon predominates in the dry season
from October to the following March.
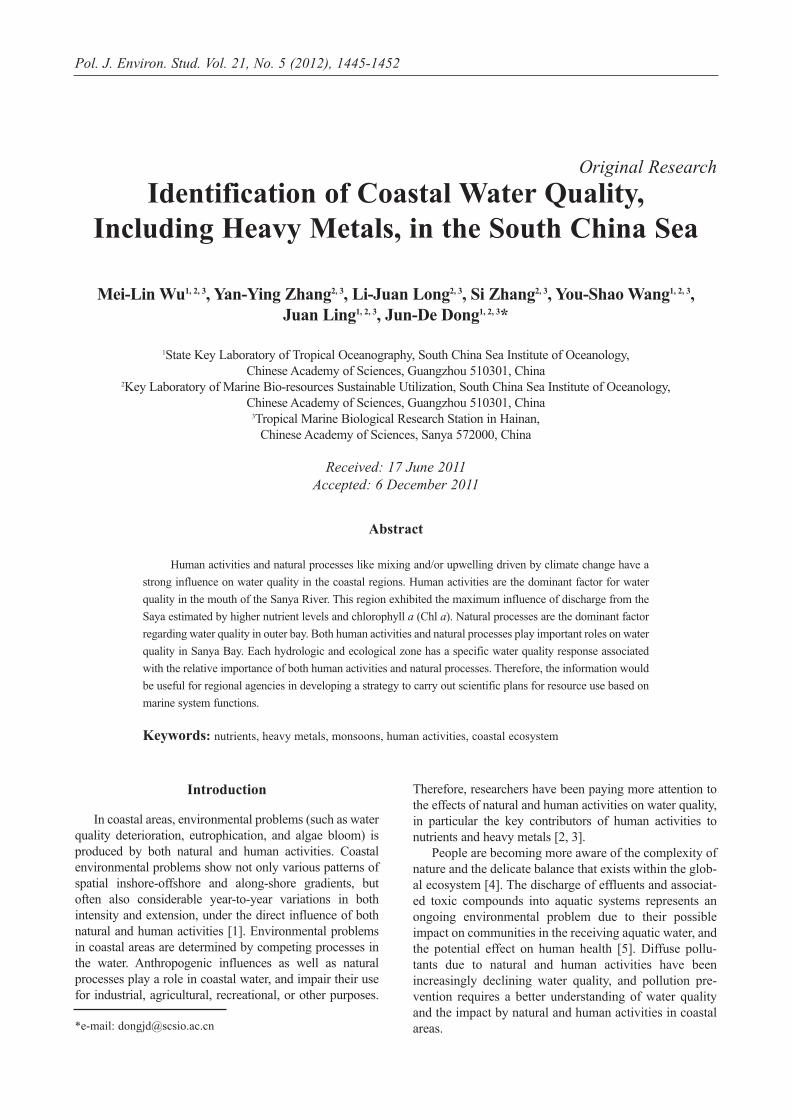
In order to evaluate the anthropogenic and natural
effects in this bay, the thirteen monitoring stations are in
Sanya Bay (Fig. 1).
Sampling and Analytical Method
Year-round sampling in the bay was conducted in win-
ter (13 January), spring (25 April), summer (20 July), and
autumn (20 October) in 2010. A Quanta® Water Quality
Monitoring System (Hydrolab Corporation, USA) was
employed to collect the data for temperature (T/ºC), pH,
and salinity (S/psu) in the surface and bottom layers.
Seawater samples for analysis of nutrients and heavy metal
were taken using 5 L GO FLO bottles at surface layer,
according to the methods and sampling tools of “The spe-
cialties for oceanography survey” (GB12763-91, China).
Water samples from the surface layer were analyzed for
nitrate (NO3-N/μmol·L-1), nitrite (NO2-N/μmol·L-1), and sil-
icate concentrations (SiO3-Si/μmol·L-1) with a SKALAR
auto-analyzer (Skalar Analytical B.V. SanPlus, Holland).
Ammonium concentrations (NH4-N/μmol·L-1) were ana-
lyzed with methods of oxidized hypobromite. Phosphorus
concentrations (PO4-P/ μmol·L-1) were analyzed using oxi-
dized methods by molybdophosphoric blue. Dissolved oxy-
gen concentrations (DO/mg·L-1) were determined using the
method of Winkler titration. Total nitrogen (TN/μmol·L-1),
total phosphus (TP/μmol·L-1), chlorophyll a (Chl a/μg·L-1),
chemical oxygen demand (COD/mg·L-1), 5-day bio-chemi-
cal oxygen demand (BOD5), and heavy metals (Zn/μg·L-1,
Pb/μg·L-1, Cd/μg·L-1, and Cu/μg·L-1) were tested according
to “specialties for marine monitoring” (GB17378.4-1998,
China).
During the observation period, daily climatological data
such as air temperature, precipitation, wind direction/speed,
and solar radiation at the Sanya Meteorological Observatory
Station of Tropical Marine Biological Research Station in
Hainan, Chinese Academy of Sciences, were obtained.
Data Analysis
Principal component analysis (PCA) is designed to
transform the original variables into new, uncorrelated vari-
ables (axes), called the principal components, which are lin-
ear combinations of the original variables. The new axes lie
along the directions of maximum variance [7]. It reduces
the dimensionality of the data set by explaining the correla-
tion among a large number of variables in terms of a small-
er number of underlying factors (principal components or
PCs) without losing much information [8-12]. The princi-
pal component (PC) can be expressed as:
...where z is the component score, pc is component loading,
x the measured value of variable, i the component number,
j the sample number, and m the total number of variables.
All the mathematical and statistical computations were
performed using MATLAB 2008b (Mathworks Inc., USA).
Results
Weather Condition
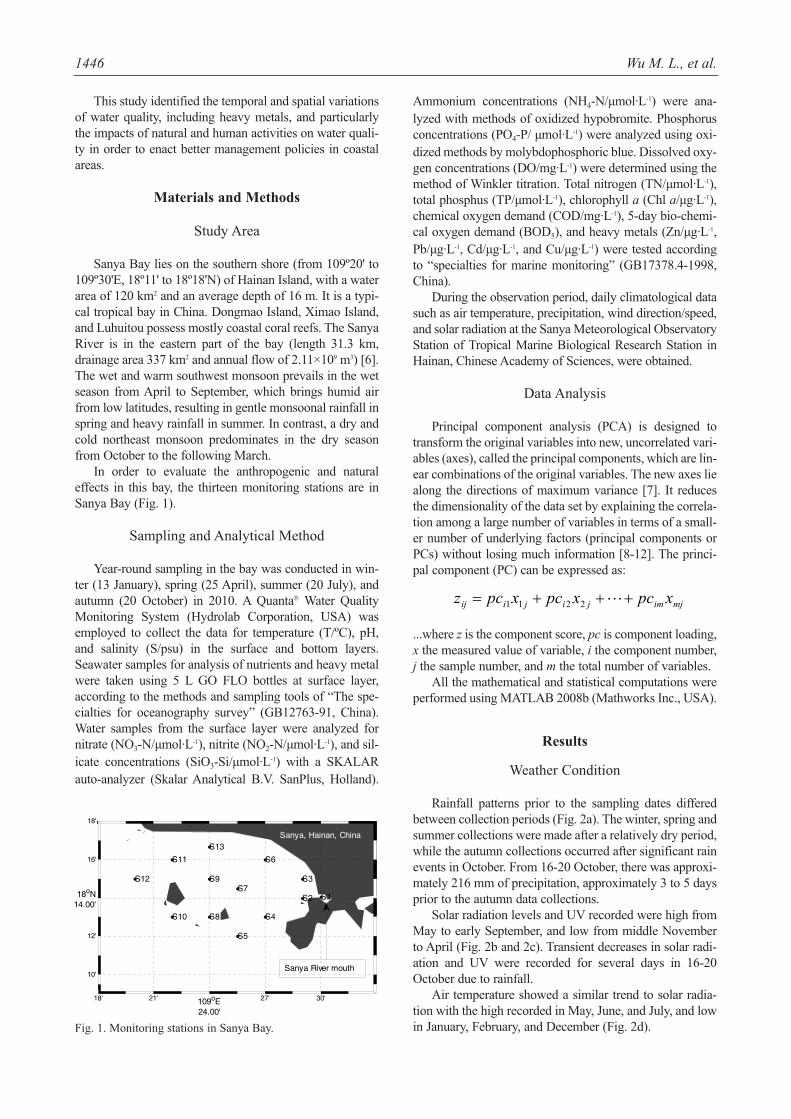
Rainfall patterns prior to the sampling dates differed
between collection periods (Fig. 2a). The winter, spring and
summer collections were made after a relatively dry period,
while the autumn collections occurred after significant rain
events in October. From 16-20 October, there was approxi-
mately 216 mm of precipitation, approximately 3 to 5 days
prior to the autumn data collections.
Solar radiation levels and UV recorded were high from
May to early September, and low from middle November
to April (Fig. 2b and 2c). Transient decreases in solar radi-
ation and UV were recorded for several days in 16-20
October due to rainfall.
Air temperature showed a similar trend to solar radia-
tion with the high recorded in May, June, and July, and low
in January, February, and December (Fig. 2d).
mjimjijiij xpcxpcxpcz 2211
1446 Wu M. L., et al.
18' 21' 109oE 24.00'
27' 30'
10'
12'
18oN14.00'
16'
18'
S2
S3
S4
S5
S6
S7
S8
S9
S10
S11
S12
S13
S1
Sanya River mouth
Sanya, Hainan, China
Fig. 1. Monitoring stations in Sanya Bay.
The prevailing winds were southerly from June to
September, with a daily mean velocity of 1.75 m·s-1,
northerly to northwesterly from October to March with
gusts of more than 2.30 m·s-1 (Fig. 2e and 2f). There was a
strong northerly wind with a daily mean velocity of 1.80
m·s-1 (maximum 5.40 m·s-1) associated with an autumnal
rain front on 16-20 October.
General Hydrography
The surface water temperature at the three sampling sta-
tions reflected the seasonal change in air temperature (Fig.
3a). Surface salinity decreased due to precipitation on 20
October (Fig. 3b). Low salinity levels were recorded at S1
located near the mouth of the Sanya. Surface salinity was
stable at 33 or more in January, April, and July.
Identification of Coastal Water Quality... 1447
0
20
40
60
80
100
120
Jan Feb Mar Apr May Jun Jul Aug Sep Oct Nov Dec
Pre
cipi
tatio
n (m
m)
a
16
18
20
22
24
26
28
30
32
Jan Feb Mar Apr May Jun Jul Aug Sep Oct Nov Dec
Air
tem
pera
ture
(�
)
d
0
10
20
30
40
50
60
Jan Feb Mar Apr May Jun Jul Aug Sep Oct Nov Dec
PA
R (
MJ
m2 )
b
N
NE
E
SE
S
SW
W
NW
N
Jan Feb Mar Apr May Jun Jul Aug Sep Oct Nov Dec
Win
d di
rect
ion
0
0.2
0.4
0.6
0.8
1
1.2
Jan Feb Mar Apr May Jun Jul Aug Sep Oct Nov Dec
UV
(M
J m
2 )
c
0
2
4
6
8
10
12
14
16
18
20
Jan Feb Mar Apr May Jun Jul Aug Sep Oct Nov Dec
Win
d sp
eed
(m s
-1)
Fig. 2. Seasonal variation in precipitation (a), solar radiation (b), UV (c), air temperature (d), wind direction (e), and wind speed (f)
from January 1, 2010 to December 31, 2010. Shaded bars highlight timing of 5 days prior to sampling time.
d)
e)
f)
b)
a)
c)
(ºC
)
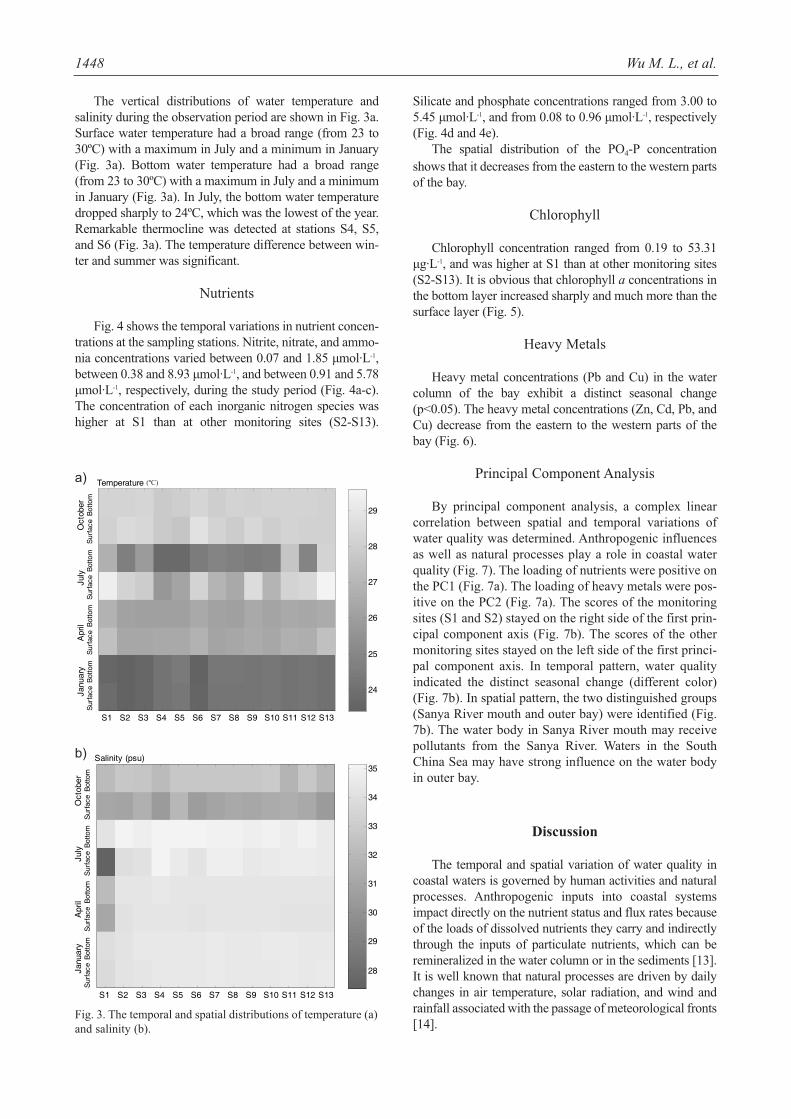
The vertical distributions of water temperature and
salinity during the observation period are shown in Fig. 3a.
Surface water temperature had a broad range (from 23 to
30ºC) with a maximum in July and a minimum in January
(Fig. 3a). Bottom water temperature had a broad range
(from 23 to 30ºC) with a maximum in July and a minimum
in January (Fig. 3a). In July, the bottom water temperature
dropped sharply to 24ºC, which was the lowest of the year.
Remarkable thermocline was detected at stations S4, S5,
and S6 (Fig. 3a). The temperature difference between win-
ter and summer was significant.
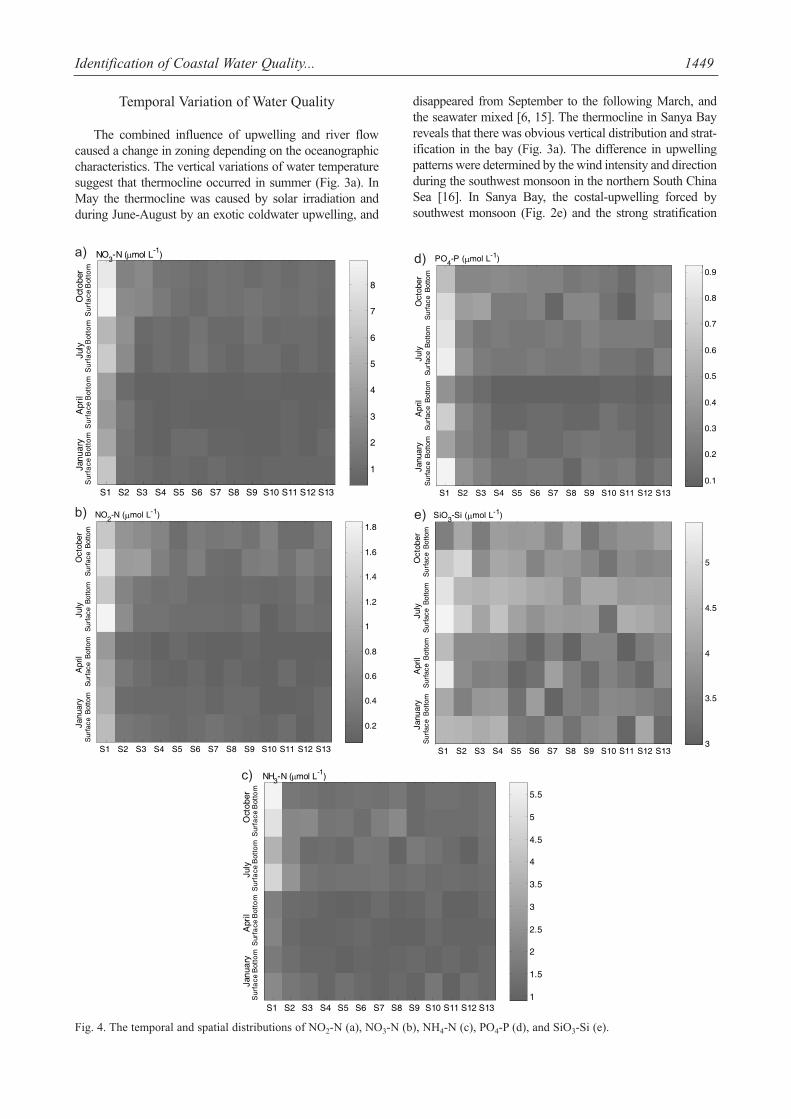
Nutrients
Fig. 4 shows the temporal variations in nutrient concen-
trations at the sampling stations. Nitrite, nitrate, and ammo-
nia concentrations varied between 0.07 and 1.85 μmol·L-1,
between 0.38 and 8.93 μmol·L-1, and between 0.91 and 5.78
μmol·L-1, respectively, during the study period (Fig. 4a-c).
The concentration of each inorganic nitrogen species was
higher at S1 than at other monitoring sites (S2-S13).
Silicate and phosphate concentrations ranged from 3.00 to
5.45 μmol·L-1, and from 0.08 to 0.96 μmol·L-1, respectively
(Fig. 4d and 4e).
The spatial distribution of the PO4-P concentration
shows that it decreases from the eastern to the western parts
of the bay.
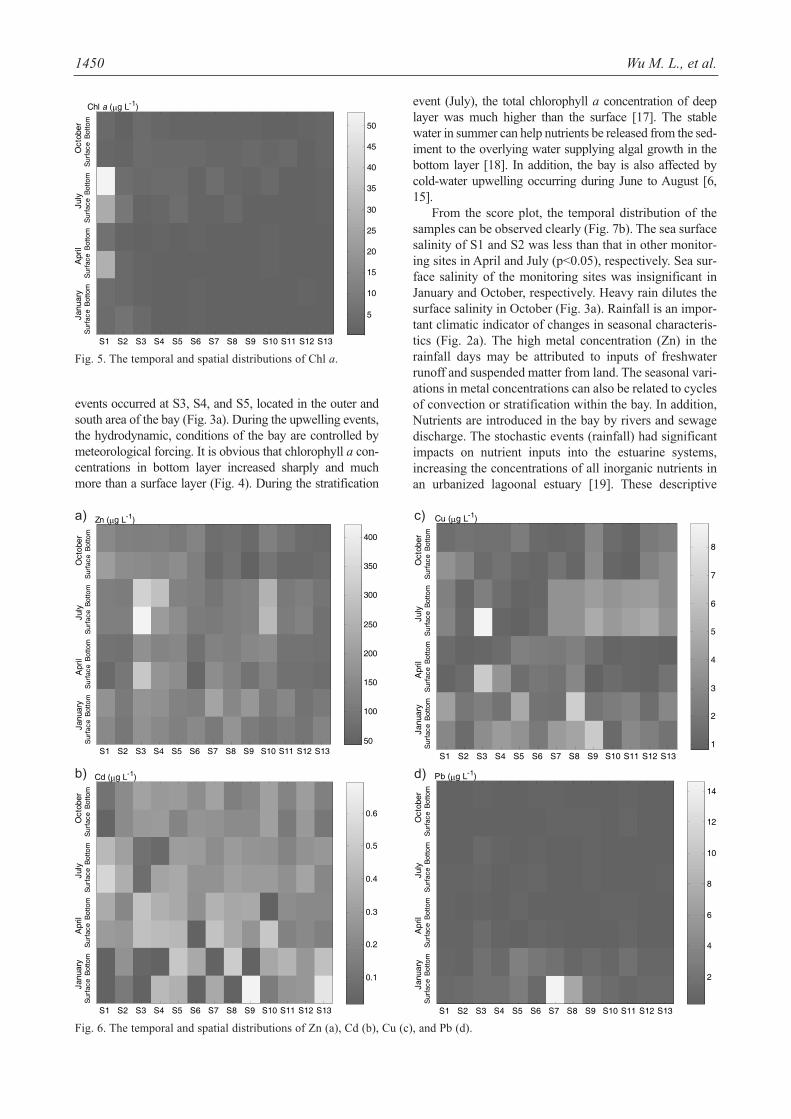
Chlorophyll
Chlorophyll concentration ranged from 0.19 to 53.31
μg·L-1, and was higher at S1 than at other monitoring sites
(S2-S13). It is obvious that chlorophyll a concentrations in
the bottom layer increased sharply and much more than the
surface layer (Fig. 5).
Heavy Metals
Heavy metal concentrations (Pb and Cu) in the water
column of the bay exhibit a distinct seasonal change
(p<0.05). The heavy metal concentrations (Zn, Cd, Pb, and
Cu) decrease from the eastern to the western parts of the
bay (Fig. 6).
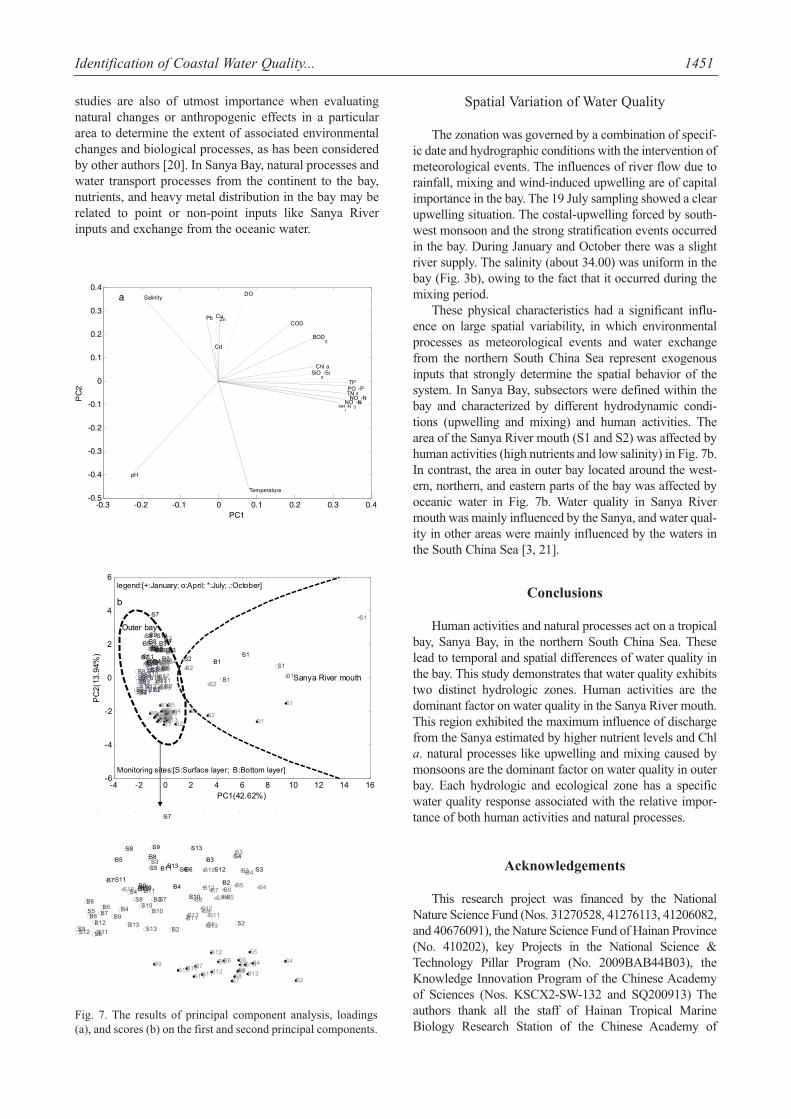
Principal Component Analysis
By principal component analysis, a complex linear
correlation between spatial and temporal variations of
water quality was determined. Anthropogenic influences
as well as natural processes play a role in coastal water
quality (Fig. 7). The loading of nutrients were positive on
the PC1 (Fig. 7a). The loading of heavy metals were pos-
itive on the PC2 (Fig. 7a). The scores of the monitoring
sites (S1 and S2) stayed on the right side of the first prin-
cipal component axis (Fig. 7b). The scores of the other
monitoring sites stayed on the left side of the first princi-
pal component axis. In temporal pattern, water quality
indicated the distinct seasonal change (different color)
(Fig. 7b). In spatial pattern, the two distinguished groups
(Sanya River mouth and outer bay) were identified (Fig.
7b). The water body in Sanya River mouth may receive
pollutants from the Sanya River. Waters in the South
China Sea may have strong influence on the water body
in outer bay.
Discussion
The temporal and spatial variation of water quality in
coastal waters is governed by human activities and natural
processes. Anthropogenic inputs into coastal systems
impact directly on the nutrient status and flux rates because
of the loads of dissolved nutrients they carry and indirectly
through the inputs of particulate nutrients, which can be
remineralized in the water column or in the sediments [13].
It is well known that natural processes are driven by daily
changes in air temperature, solar radiation, and wind and
rainfall associated with the passage of meteorological fronts
[14].
1448 Wu M. L., et al. O
ctob
erJu
lyA
pril
Janu
ary
Bot
tom
Sur
face
Bot
tom
Sur
face
Bot
tom
Sur
face
Bot
tom
Sur
face
a:Temperature (� )
S1 S2 S3 S4 S5 S6 S7 S8 S9 S10 S11 S12 S13
24
25
26
27
28
29
Oct
ober
July
Apr
ilJa
nuar
yB
otto
mS
urfa
ceB
otto
mS
urfa
ceB
otto
mS
urfa
ceB
otto
mS
urfa
ce
b:Salinity (psu)
S1 S2 S3 S4 S5 S6 S7 S8 S9 S10 S11 S12 S13
28
29
30
31
32
33
34
35
Fig. 3. The temporal and spatial distributions of temperature (a)
and salinity (b).
a)
b)
(ºC)
Temporal Variation of Water Quality
The combined influence of upwelling and river flow
caused a change in zoning depending on the oceanographic
characteristics. The vertical variations of water temperature
suggest that thermocline occurred in summer (Fig. 3a). In
May the thermocline was caused by solar irradiation and
during June-August by an exotic coldwater upwelling, and
disappeared from September to the following March, and
the seawater mixed [6, 15]. The thermocline in Sanya Bay
reveals that there was obvious vertical distribution and strat-
ification in the bay (Fig. 3a). The difference in upwelling
patterns were determined by the wind intensity and direction
during the southwest monsoon in the northern South China
Sea [16]. In Sanya Bay, the costal-upwelling forced by
southwest monsoon (Fig. 2e) and the strong stratification
Identification of Coastal Water Quality... 1449
Fig. 4. The temporal and spatial distributions of NO2-N (a), NO3-N (b), NH4-N (c), PO4-P (d), and SiO3-Si (e).
Oct
ober
July
Apr
ilJa
nuar
yB
otto
mS
urfa
ceB
otto
mS
urfa
ceB
otto
mS
urfa
ceB
otto
mS
urfa
ce
a:NO3-N ( mol L-1)
S1 S2 S3 S4 S5 S6 S7 S8 S9 S10 S11 S12 S13
1
2
3
4
5
6
7
8
Oct
ober
July
Apr
ilJa
nuar
yB
otto
mS
urfa
ceB
otto
mS
urfa
ceB
otto
mS
urfa
ceB
otto
mS
urfa
ce
d:PO4-P ( mol L-1)
S1 S2 S3 S4 S5 S6 S7 S8 S9 S10 S11 S12 S13
0.1
0.2
0.3
0.4
0.5
0.6
0.7
0.8
0.9
Oct
ober
July
Apr
ilJa
nuar
yB
otto
mS
urfa
ceB
otto
mS
urfa
ceB
otto
mS
urfa
ceB
otto
mS
urfa
ce
b:NO2-N ( mol L-1)
S1 S2 S3 S4 S5 S6 S7 S8 S9 S10 S11 S12 S13
0.2
0.4
0.6
0.8
1
1.2
1.4
1.6
1.8
Oct
ober
July
Apr
ilJa
nuar
yB
otto
mS
urfa
ceB
otto
mS
urfa
ceB
otto
mS
urfa
ceB
otto
mS
urfa
ce
e:SiO3-Si ( mol L-1)
S1 S2 S3 S4 S5 S6 S7 S8 S9 S10 S11 S12 S133
3.5
4
4.5
5
Oct
ober
July
Apr
ilJa
nuar
yB
otto
mS
urfa
ceB
otto
mS
urfa
ceB
otto
mS
urfa
ceB
otto
mS
urfa
ce
c:NH3-N ( mol L-1)
S1 S2 S3 S4 S5 S6 S7 S8 S9 S10 S11 S12 S131
1.5
2
2.5
3
3.5
4
4.5
5
5.5
a)d)
e)b)
c)
events occurred at S3, S4, and S5, located in the outer and
south area of the bay (Fig. 3a). During the upwelling events,
the hydrodynamic, conditions of the bay are controlled by
meteorological forcing. It is obvious that chlorophyll a con-
centrations in bottom layer increased sharply and much
more than a surface layer (Fig. 4). During the stratification
event (July), the total chlorophyll a concentration of deep
layer was much higher than the surface [17]. The stable
water in summer can help nutrients be released from the sed-
iment to the overlying water supplying algal growth in the
bottom layer [18]. In addition, the bay is also affected by
cold-water upwelling occurring during June to August [6,
15].
From the score plot, the temporal distribution of the
samples can be observed clearly (Fig. 7b). The sea surface
salinity of S1 and S2 was less than that in other monitor-
ing sites in April and July (p<0.05), respectively. Sea sur-
face salinity of the monitoring sites was insignificant in
January and October, respectively. Heavy rain dilutes the
surface salinity in October (Fig. 3a). Rainfall is an impor-
tant climatic indicator of changes in seasonal characteris-
tics (Fig. 2a). The high metal concentration (Zn) in the
rainfall days may be attributed to inputs of freshwater
runoff and suspended matter from land. The seasonal vari-
ations in metal concentrations can also be related to cycles
of convection or stratification within the bay. In addition,
Nutrients are introduced in the bay by rivers and sewage
discharge. The stochastic events (rainfall) had significant
impacts on nutrient inputs into the estuarine systems,
increasing the concentrations of all inorganic nutrients in
an urbanized lagoonal estuary [19]. These descriptive
1450 Wu M. L., et al. O
ctob
erJu
lyA
pril
Janu
ary
Bot
tom
Sur
face
Bot
tom
Sur
face
Bot
tom
Sur
face
Bot
tom
Sur
face
Chl a ( g L-1)
S1 S2 S3 S4 S5 S6 S7 S8 S9 S10 S11 S12 S13
5
10
15
20
25
30
35
40
45
50
Fig. 5. The temporal and spatial distributions of Chl a.
Oct
ober
July
Apr
ilJa
nuar
yB
otto
mS
urfa
ceB
otto
mS
urfa
ceB
otto
mS
urfa
ceB
otto
mS
urfa
ce
a:Zn ( g L-1)
S1 S2 S3 S4 S5 S6 S7 S8 S9 S10 S11 S12 S1350
100
150
200
250
300
350
400
Oct
ober
July
Apr
ilJa
nuar
yB
otto
mS
urfa
ceB
otto
mS
urfa
ceB
otto
mS
urfa
ceB
otto
mS
urfa
ce
c:Cu ( g L-1)
S1 S2 S3 S4 S5 S6 S7 S8 S9 S10 S11 S12 S131
2
3
4
5
6
7
8
Oct
ober
July
Apr
ilJa
nuar
yB
otto
mS
urfa
ceB
otto
mS
urfa
ceB
otto
mS
urfa
ceB
otto
mS
urfa
ce
b:Cd ( g L-1)
S1 S2 S3 S4 S5 S6 S7 S8 S9 S10 S11 S12 S13
0.1
0.2
0.3
0.4
0.5
0.6
Oct
ober
July
Apr
ilJa
nuar
yB
otto
mS
urfa
ceB
otto
mS
urfa
ceB
otto
mS
urfa
ceB
otto
mS
urfa
ce
d:Pb ( g L-1)
S1 S2 S3 S4 S5 S6 S7 S8 S9 S10 S11 S12 S13
2
4
6
8
10
12
14
Fig. 6. The temporal and spatial distributions of Zn (a), Cd (b), Cu (c), and Pb (d).
a) c)
d)b)
studies are also of utmost importance when evaluating
natural changes or anthropogenic effects in a particular
area to determine the extent of associated environmental
changes and biological processes, as has been considered
by other authors [20]. In Sanya Bay, natural processes and
water transport processes from the continent to the bay,
nutrients, and heavy metal distribution in the bay may be
related to point or non-point inputs like Sanya River
inputs and exchange from the oceanic water.
Spatial Variation of Water Quality
The zonation was governed by a combination of specif-
ic date and hydrographic conditions with the intervention of
meteorological events. The influences of river flow due to
rainfall, mixing and wind-induced upwelling are of capital
importance in the bay. The 19 July sampling showed a clear
upwelling situation. The costal-upwelling forced by south-
west monsoon and the strong stratification events occurred
in the bay. During January and October there was a slight
river supply. The salinity (about 34.00) was uniform in the
bay (Fig. 3b), owing to the fact that it occurred during the
mixing period.
These physical characteristics had a significant influ-
ence on large spatial variability, in which environmental
processes as meteorological events and water exchange
from the northern South China Sea represent exogenous
inputs that strongly determine the spatial behavior of the
system. In Sanya Bay, subsectors were defined within the
bay and characterized by different hydrodynamic condi-
tions (upwelling and mixing) and human activities. The
area of the Sanya River mouth (S1 and S2) was affected by
human activities (high nutrients and low salinity) in Fig. 7b.
In contrast, the area in outer bay located around the west-
ern, northern, and eastern parts of the bay was affected by
oceanic water in Fig. 7b. Water quality in Sanya River
mouth was mainly influenced by the Sanya, and water qual-
ity in other areas were mainly influenced by the waters in
the South China Sea [3, 21].
Conclusions
Human activities and natural processes act on a tropical
bay, Sanya Bay, in the northern South China Sea. These
lead to temporal and spatial differences of water quality in
the bay. This study demonstrates that water quality exhibits
two distinct hydrologic zones. Human activities are the
dominant factor on water quality in the Sanya River mouth.
This region exhibited the maximum influence of discharge
from the Sanya estimated by higher nutrient levels and Chl
a. natural processes like upwelling and mixing caused by
monsoons are the dominant factor on water quality in outer
bay. Each hydrologic and ecological zone has a specific
water quality response associated with the relative impor-
tance of both human activities and natural processes.
Acknowledgements
This research project was financed by the National
Nature Science Fund (Nos. 31270528, 41276113, 41206082,
and 40676091), the Nature Science Fund of Hainan Province
(No. 410202), key Projects in the National Science &
Technology Pillar Program (No. 2009BAB44B03), the
Knowledge Innovation Program of the Chinese Academy
of Sciences (Nos. KSCX2-SW-132 and SQ200913) The
authors thank all the staff of Hainan Tropical Marine
Biology Research Station of the Chinese Academy of
Identification of Coastal Water Quality... 1451
-0.3 -0.2 -0.1 0 0.1 0.2 0.3 0.4-0.5
-0.4
-0.3
-0.2
-0.1
0
0.1
0.2
0.3
0.4
Temperature
Salinity
pH
SiO3-Si
PO4-P
NO2-N
NO3-N
NH4-N
COD
BOD5
TP
TN
DO
Chl a
Zn
Cd
Pb Cu
a
PC1
PC
2
-4 -2 0 2 4 6 8 10 12 14 16-6
-4
-2
0
2
4
6
S2
S3
S4
S5S6
S7
S8S9
S10
S11S12
S13
S1
S2
S3
S4
S5
S6
S7S8
S9
S10
S11S12 S13
S1
S2
S3
S4S5
S6
S7S8
S9
S10
S11S12
S13
S1
S2S3S4
S5
S6S7S8
S9S10S11S12
S13
S1
B2
B3
B4
B5B6
B7
B8
B9B10
B11
B12
B13
B1
B2
B3B4B5
B6B7
B8
B9B10
B11
B12B13B1
B2
B3B4
B5
B6B7B8 B9
B10
B11
B12
B13B1
B2
B3B4B5B6B7
B8B9B10
B11
B12
B13 B1
PC1(42.62%)
PC
2(1
3.9
4%
)
Sanya River mouth
Outer bay
legend:[+:January; o:April; *:July; .:October]
b
Monitoring sites:[S:Surface layer; B:Bottom layer]
S3
S4
S5 S6
S7
S8 S9
S10
S11
S12
S13
S2
S3
S4
S5
S6
S7S8
S9
S10
S11S12S13
S3
S4
S5
S6
S7S8
S9
S10
S11S12
S13
S4
S5
S6
S7S8
S9
S10S11
S12S13
B2
B3
B4
B5
B6
B7
B8
B9B10
B11
B12
B13
B2
B3
B4B5
B6B7
B8
B9B10
B11
B12 B13
B3B4
B5
B6B7
B8 B9
B10
B11
B12
B13
B2
B3 B4B5B6B7
B8B9
B10B11
B12
B13
Fig. 7. The results of principal component analysis, loadings
(a), and scores (b) on the first and second principal components.
Sciences for providing support and help, and the information
system of China Ecosystem Research Network (CERN).
References
1. VOLLENWEIDER R. A., GIOVANARDI F., MONTA-
NARI G., RINALDI A. Characterization of the trophic con-
ditions of marine coastal waters with special reference to the
NW Adriatic Sea: Proposal for a trophic scale, turbidity and
generalized water quality index. Environmetrics 9, 329,
1998.
2. WU M. L.,WANG Y. S. Using chemometrics to evaluate
anthropogenic effects in Daya Bay, China. Estuar. Coast.
Shelf Sci. 72, 732, 2007.
3. DONG J. D., ZHANG Y. Y., ZHANG S., WANG Y. S.,
YANG Z. H., WU M. L. Identification of temporal and spa-
tial variations of water quality in Sanya Bay, China by three-
way principal component analysis. Environ. Earth Sci. 60,
1673, 2010.
4. DEMIRAK A., YILMAZ F., TUNA A. L., OZDEMIR N.
Heavy metals in water, sediment and tissues of Leuciscus
cephalus from a stream in southwestern Turkey.
Chemosphere 63, 1451, 2006.
5. ALKARKHI F. M. A., ISMAIL N., EASA A. M.
Assessment of arsenic and heavy metal contents in cockles
(Anadara granosa) using multivariate statistical techniques.
J. Hazard. Mater. 150, 783, 2008.
6. HUANG L. M., TAN Y. H., SONG X. Y., HUANG X. P.,
WANG H. K., ZHANG S., DONG J. D., CHEN R. Y. The
status of the ecological environment and a proposed protec-
tion strategy in Sanya Bay, Hainan Island, China. Mar.
Pollut. Bull. 47, 180, 2003.
7. SHRESTHA S.,KAZAMA F. Assessment of surface water
quality using multivariate statistical techniques: A case study
of the Fuji river basin, Japan. Environ. Modell. Softw. 22,
464, 2007.
8. VEGA M., PARDO R., BARRADO E., DEBAN L.
Assessment of seasonal and polluting effects on the quality
of river water by exploratory data analysis. Water Res. 32,
3581, 1998.
9. ALBERTO W. D., DEL PILAR D. M., VALERIA A. M.,
FABIANA P. S., CECILIA H. A., DE LOS ANGELES B.
M. Pattern recognition techniques for the evaluation of spa-
tial and temporal variations in water quality. A case study:
Suquia River basin (Cordoba-Argentina). Water Res. 35,
2881, 2001.
10. HELENA B., PARDO R., VEGA M., BARRADO E., FER-
NANDEZ J. M., FERNANDEZ L. Temporal evolution of
groundwater composition in an alluvial aquifer (Pisuerga
River, Spain) by principal component analysis. Water Res.
34, 807, 2000.
11. WU M. L., WANG Y. S., SUN C. C., WANG H. L., DONG
J. D., YIN J. P., HAN S. H. Identification of coastal water
quality by statistical analysis methods in Daya Bay, South
China Sea. Mar. Pollut. Bull. 60, 852, 2010.
12. LI S., GU S., TAN X., ZHANG Q. Water quality in the
upper Han River basin, China: The impacts of land use/land
cover in riparian buffer zone. J. Hazard. Mater. 165, 317,
2009.
13. FORJA J. M., BLASCO J., GOMEZPARRA A. Spatial and
Seasonal Variation of In Situ Benthic Fluxes in the Bay of
Cadiz (South-west Spain). Estuar. Coast. Shelf Sci. 39, 127,
1994.
14. COTE B., PLATT T. Day-to-day variations in the spring -
summer photosynthetic parameters of coastal marine phyto-
plankton. Limnol. Oceanogr. 28, 320, 1983.
15. DONG J. D., WANG H. K., ZHANG S., HUANG, M. L.
Vertical distribution characteristic of seawater temperature
and DIN in Sanya Bay. J. Top. Oceanogr. 21, 40, 2002 [In
Chinese]
16. SHANG S. L., ZHANG C. Y., HONG H. S., SHANG S. P.,
CHAI F. Short-term variability of chlorophyll associated
with upwelling events in the Taiwan Strait during the south-
west monsoon of 1998. Deep-Sea Res. Part II-Top. Stud.
Oceanogr. 51, 1113, 2004.
17. ZHANG Y. Y., DONG J. D., LING J. A., WANG Y. S.,
ZHANG S. Phytoplankton distribution and their relationship
to environmental variables in Sanya Bay, South China Sea.
Sci. Mar. 74, 783, 2010.
18. WANG H. K., DONG J. D., ZHANG S., HUANG L. M. A
study on release of phosphorus from sediments in Sanya
Bay. J. Top. Oceanogr. 22, 1, 2003 [In Chinese].
19. WHITE D. L., PORTER D. E., LEWITUS A. J., KEESEE
J. Spatial gradient analyses of nutrients and chlorophyll aBiomass in an urbanized lagoonal estuary: A comparison
between wet and dry periods. J. Coast. Res. 24, 649, 2008.
20. GRANGE N., WHITFIELD A. K., DE VILLIERS C. J.,
ALLANSON B. R. The response of two South African east
coast estuaries to altered river flow regimes. Aquat.
Conserv.-Mar. Freshw. Ecosyst. 10, 155, 2000.
21. DONG J. D., ZHANG Y. Y., WANG Y. S., WU M. L.,
ZHANG S., CAI C. H. Chemometry use in the evaluation of
the sanya bay water quality. Braz. J. Oceanogr. 58, 339, 2010.
1452 Wu M. L., et al.