Embed Size (px)
Citation preview

The Annals of the University Dunarea de Jos of Galati
Fascicle VI – Food Technology (2020), 44(2), 159-172
https://doi.org/10.35219/foodtechnology.2020.2.10
ORIGINAL RESEARCH PAPER
DEVELOPMENT OF ELEPHANT FOOT YAM CAKE AND ITS
EVALUATION
ANUJ SAKLANI1 AND RAVINDER KAUSHIK*2
1Shoolini University, Solan, Himachal Pradesh, India-173229.
2University of Petroleum and Energy Studies, Dehradun, India-143226 [email protected]
Received on 1 September 2020
Revised on 27 November 2020
Abstract
Cake is a wheat-based bakery product in which the gluten network development is
restricted by fat and sugar. The addition of gluten-free flour is an efficient method
to dilute wheat flour for weak gluten. Elephant foot yam is a tuber having multiple
health benefits. Therefore, composite flour was prepared by mixing elephant foot
yam flour (EFYF) and wheat flour (WF) for cake development. The effect of the
addition of EFYF on the quality of the formulated dough and cake was
determined. The water and fat absorption capacity varied among the powders
obtained from the mixture of EFYF and WF, depending on flours ratios. EFYF
was incorporated in WF at different concentrations (10, 20, 30 and 40%) and the
dough quality was evaluated. As the EFYF lacks gluten, its addition weakened the
gluten network. Cakes prepared from EFYF enriched flours up to 20% addition
had similar texture and sensorial characteristics (p>0.05) in comparison to the
control cake. The cake having 20% EFYF showed the best results in all quality
attributes, and is therefore recommended for cake preparation.
Keywords: cake, elephant foot yam, textural properties, sensory properties, flour
enrichment, composite flours
Introduction
Amorphophallus paeoniifolius (Dennst.), generally known as Elephant foot yam
(EFY), is cultivated at the Eastern boundary of Polynesia, Western Africa, Japan,
Philippines, Taiwan, New Guinea, Central Thailand, Southward via Sumatra,
Indonesia, Malaysia and several other parts of South Asian Countries, Ceylon and
Malaya (Hetterscheid, 1993). The plant is also grown throughout India. Its main
producing regions are Bengal, Sikkim, Kerala, Maharashtra, Tamil Nadu, Uttar
Pradesh, Punjab, Bihar, Assam and Odisha (Saxena and Brahmam, 1996). The
tubers are tremendously rich in nutrients. It is a healthy low-fat food containing a

Saklani and Ravinder et al. / AUDJG – Food Technology (2020), 44(2), 159-172
160
good amount of protein as well as starch, being also rich in fibre, potassium,
calcium (53 mg/100g), phosphorus (21 mg/100g) vitamin A (122 mg/100g),
vitamin B6 (0.2 mg/100g), as well as trace minerals like selenium, zinc and copper
(Das et al., 2009). The tubers contain 18.0% starch, 1-5% protein and up to 2% fat.
The tubers are quite acrid due to the high content of oxalates (Firdouse et al.,
2011).
EFY has been widely used as a natural medicinal product in traditional Indian
Ayurveda (De et al., 2010). Amorphophallus paeoniifolius tubers showed
gastroprotective, analgesic, antibacterial, antioxidant, anti-tumour, anti-
inflammatory, antibacterial, antifungal and cytotoxic activities (Khan et al., 2008).
Edible plants have always been used for the treatment of many chronic and fatal
diseases (Mittal et al., 2020). Amorphophallus paeoniifolius is traditionally used in
the treatment of elephantiasis, tumours, inflammations, haemorrhoids,
haemorrhages, vomiting, cough, bronchitis, appetizer, asthma, anorexia, dyspepsia,
flatulence, colic and constipation (Shilpi et al., 2005). Tubers are mainly consumed
after thorough cooking.
Chips and other snacks are also prepared from this starch-rich tuber. Cakes are
popular bakery products preferred by most consumers. This is mainly due to its
ready-to-eat nature, availability in different varieties and affordable cost. The
development of fibre-enriched bakery foods is an important contribution to a
broader supply of food products with health beneficial effect (Lohan et al., 2020).
Also, cakes have attained a relatively constant place in human diet and their
continuous popularity is encouraging the development of newer and more attractive
products to put on the market. EFY has wide medicinal applications, therefore, the
present study was undertaken to develop and evaluate cakes enriched with elephant
foot yam flour. The physicochemical properties of wheat flour mixtures with
different ratios of EFYF (10, 20, 30 and 40%) were analyzed. EFYF and WF cakes
were characterized in terms of physicochemical properties and sensory qualities.
Materials and methods
Sampling
The EFY was obtained from the local market of Solan, Himachal Pradesh, India.
After scraping a fine segment of the peel, the tubers were washed, shredded into 1
cm3 cubes and dried in a mini tray drying oven (Maro Scientific Works Pvt. Ltd.,
New Delhi, India) for 48 h at 50 °C. The dried cubes were milled using a roller-
mill (Chopin Laboratory CD-1 mill, France). To obtain uniform particle size, the
flour was sieved through a 60 mm mesh sieve. The flour was then packed in an
airtight plastic container for future use.
All the chemicals used were of analytical grade - sodium hydroxide (98.5% pure),
sulfuric acid (99.5% pure), petroleum ether (99% pure), ammonium borate (98.5%
pure).

Saklani and Ravinder et al. / AUDJG – Food Technology (2020), 44(2), 159-172
161
Chemical composition of EFY and WF and their proportionate mixture
The standard methods of AOAC (2005) were used to determine Moisture (AOAC –
925.10), fat (AOAC – 2003.05) by Soxhlet extraction, and ash (AOAC – 923.03)
by combustion. The protein content (AOAC – 960.52) was determined by the
Kjeldahl method.
Physicochemical analysis of EFYF and WF
The EFYF and WF bulk density was determined using the method described by
Kaushik et al. (2013). The flour was placed in a 100 ml measuring cylinder and its
weight was noted. Bulk density was calculated by dividing weight/volume.
The colour parameters of the flours were measured by means of a Lovibond®
Tintometer® Colorimeter Model F (The Tintometer Ltd., United Kingdom) based
on L*, a* and b* values (Ayadi et al., 2009).
The swelling capacity of the studied flours was determined according to the
method proposed by Robertson et al. (2000). In short, 0.2 g flour was accurately
weighed and placed in a graduated test tube; 10 mL of water containing 0.02%
sodium azide was added, and after thorough mixing, the tubes were allowed to
settle for 18 h at room temperature. Then the bed volume was recorded and the
swelling capacity (SC) was calculated as ml per gram of dry sample for 18 h, upon
which the final volume attained by the fibre was measured:
SC (ml/g) =
The water solubility index (WSI) was determined according to the method devised
by Robertson et al. (2000). An amount of 1g of flour was added to 10 ml distilled
water. The sample was then stirred and the suspension was poured into a centrifuge
tube. After centrifugation, the supernatant was dried and the weight of the solids in
the supernatant was used to calculate the WSI as a percentage of dry weight of the
exudate.
The water-holding capacity and fat-binding capacity were determined using the
methods of Kaushik et al. (2015a). The flour sample (500 mg) was dispersed in 10
ml of water, mixed thoroughly and agitated for 1 h, then centrifuged at 2000 rpm
for 30 min. The supernatant was discarded and the sediment was weighed.
To estimate the fat-binding capacity, the flour sample (500 mg) was added to 10 ml
of refined soybean oil (Fortune brand), mixed thoroughly and agitated for 1 h.
Then, the sample was centrifuged at 2000 rpm for 30 min. The supernatant was
discarded and the sediment was weighed.
The sodium dodecyl sulfate (SDS) sedimentation was determined as described by
Kaushik et al. (2017). The flour (5g) was first suspended in 50 ml water and
afterwards 50 ml of SDS –Lactic acid reagent (solution containing 0.9% lactic acid
and 2% SDS) were added. The mixture was allowed to settle for 40 minutes before
reading the sedimentation value in ml.
The wet and dry gluten contents were determined by the method described by
Kaushik et al. (2015a). The dough was washed and the gluten retained by the
Saklani and Ravinder et al. / AUDJG – Food Technology (2020), 44(2), 159-172
162
sieves was collected and weighed for the determination of the wet gluten yield. The
dry gluten yield was determined by drying the wet gluten in a freeze dryer for 24 h
and the dry yield was calculated.
Textural analysis of dough and cake
The texture characteristics of the dough and cake samples were evaluated by the
texture profile analysis (TPA) method using a TMS Texture Analyzer (Food
Technology Corporation, Sterling, Virginia, USA), equipped with a 1000 (N) load
cell, and a 0.05 (N) detection range. A dough sample was transferred into a
moulded polypropylene tube (5 cm height) that was placed in a fixture to hold it in
place under the texture analyzer. An acrylic cylindrical probe was used to compress
the sample to 50% of its original height (40 mm) at a speed of 10 mm/s. The
equipment was interfaced with a computer, which controlled and analyzed the data,
using the software supplied by Texture Technologies Corp. The textural parameters
(hardness, cohesiveness, stickiness and adhesion) were calculated from the TPA
curves. Hardness represents the peak force of the first compression cycle,
stickiness is the distance of the detected height of the product on the second
compression divided by the original compression distance, while cohesiveness
represents the extent to which the sample could be deformed prior to rupture.
Cake Preparation
The cake was prepared according to Ceserani et al. (1995) using the following
recipe: flour blend - 100g, fine powder sugar - 24g, eggs - 80g, butter - 40g and
water - 18ml. The sugar was added to the butter and beaten for 3 min. The eggs
were beaten and added gradually to the mixture and whipped for 2 min. The EFYF
was incorporated in the WF at different concentrations (10, 20, 30 and 40%), and
then the butter and sugar whipped cream was added and mixed for 7 min. The cake
batter was placed in a baking oven (Electric 2 Deck 4 Tray Oven, TME-2D-4) at a
temperature of 170°C for 20-25 min. The cakes were cooled and removed from the
pan after 30 min. The baked cakes were packaged in aluminium foils and kept on
the shelf for sample analysis.
Physical characteristics of cakes
The volume of cakes was measured using the rape-seed displacement method
(Rosell et al., 2001). The weight, length, width and height of the cakes were
measured. The textural properties of dough and cakes were measured using a
Texture Analyzer. Dough and cake slices (2.5 cm thick) were placed on the
Texture analyser platform. An acrylic cylindrical probe was used to compress the
cake sample up to 50% of its original height at a speed of 10 mm/s.
FTIR interpretation
The microstructural changes were measured by means of a FTIR spectrometer
(Rana et al., 2018) (CARY 630 Agilent Technologies, Santa Clara, California,
USA). The Microlab Software (Bozeman, Montana, USA) was used to generate
data with a resolution of 8 cm-1. The FTIR spectra were recorded in the
transmission mode between 4000 cm-1 and 500 cm-1 for the EFYF and WF

Saklani and Ravinder et al. / AUDJG – Food Technology (2020), 44(2), 159-172
163
mixtures. The spectra obtained using FTIR were analyzed using a method
described by Pavia et al. (2001).
Sensory evaluation
The sensory evaluation was carried out by students and teachers of the Shoolini
University (19 to 37 years old) and was performed at the Food and Nutrition
Laboratory. The judges evaluated the following attributes: colour, odour, flavour,
taste, texture and overall acceptability. The sensory analysis was conducted using
the 10 points hedonic scale, and each judge received the samples in white plastic
dishes, numbered with random 3 digits (Kumar et al., 2013). Prior to testing the
cake samples were left to cool for 4h. After cooling the samples were cut and
subjected to the sensory assessment panel.
Statistical analysis
All determinations were performed in triplicates. The data generated was entered
and analyzed using Microsoft Office 2010. The means and standard deviation were
calculated for the values obtained through the analysis. The analysis of variance
(ANOVA) was used to compare the values obtained (Kaushik et al., 2015b). The
level of significance was accepted at p<0.05.
Results and discussion
Physical and chemical characterization of EFYF and WF
The physical properties of the studied flours are summarized in Table 1. Bulk
density represents the weight of flour in a given volume, therefore, it is helpful in
determining the packaging material required and the area required for storage. The
bulk density of EFYF and WF was 0.684 and 0.652 g/cm3, respectively, and in the
different proportionate mixture (10, 20, 30 and 40%) bulk density increased with
the increase in the concentration of EFYF. Although the EFYF bulk density is
higher than that of wheat flour, it is not the highest among vegetable flour sources.
For instance, Ayadi et al. (2009) determined the bulk density of spiny (Opuntia
ficus indica f. amylocea) and spineless cladodes (O. ficus indica f. inermis) powder
and found values of 0.703 and 0.647g/cm3, respectively. The values of EFYF and
WF bulk densities were in between these values. The water solubility index was
27.98% for EFYF and 31.24% for WF, and the results revealed that with an
increase in the EFYF concentration in the flour mix, the water solubility index
decreased. The results showed that the EFY powder was significantly different
(p<0.05) in terms of swelling capacity and water solubility index. Flours with high
water solubility index have been reported to be good constituents in bakery
applications, as they improve solubility characteristics and lead to improved
freshness in baked products (Ma et al., 2011). The water holding capacity and fat
binding capacity of EFYF were significantly lower (p<0.05) in comparison to WF,
thus it may be said that when increasing the EFYF ratio in the flour mix, the values
for the two parameters decreased accordingly. However, in the case of the fat
binding capacity, significant differences resulted when the EFYF ratio in the flour
mix exceeded 30%, as the contents of 10% and 20% of EFYF in the mixture had

Saklani and Ravinder et al. / AUDJG – Food Technology (2020), 44(2), 159-172
164
no significant influence (p>0.05). Water holding capacity represents the ability of a
product to associate with water (Singh, 2001). The differences in water absorption
are mainly attributed to the greater number of hydroxyl groups that exist in the
fibre structure, allowing more water interactions through hydrogen bonding (Rosell
et al., 2001). Fat binding capacity is an important feature of polysaccharides. It is
partly related to the chemical composition, but more closely linked to the porosity
of the fibre structure than to the affinity of the fibre molecule to oil (Biswas et al.,
2009).

Saklani and Ravinder et al. / AUDJG – Food Technology (2020), 44(2), 159-172
165
From the data shown in Table 1, it can be observed that by increasing the EFYF
ratio above 20% in the flour mixtures, the moisture content, ash and crude fibre
increased significantly (p<0.05), whereas crude protein and carbohydrates
decreased (p<0.05). In the case of the fat content, the EFYF addition had no
significant influence (p>0.05). Similar results were reported for banana cake
(Owuno et al., 2009) and bread (Noor et al., 2007).
SDS sedimentation varied in EFYF and WF between 12.47 to 53.02%,
respectively, and in a different proportionate mixture of EFYF and WF, the SDS
value decreased. The SDS sedimentation volume is a good indicator of wheat flour
quality. The present SDS values are in agreement with the values determined by
Supekar et al. (2005) for aestivum, durum and dicoccum wheat cultivars. The SDS
sedimentation value of wheat flours is based on the fact that gluten absorbs water
and swells significantly when treated with lactic acid.
The addition of EFY flour to wheat resulted in a significant decrease of both wet
and dry gluten, taking into account that EFY is a gluten free tuber. The wet gluten
yield shows the quality of protein and the baking quality of flour. Autran et al.
(1997) determined that pentosans and hemicelluloses in flours have a strong effect
on gluten yield, and flour processing properties are strongly determined by the way
flour milling fractions are mixed. In a response surface study on gluten extraction
from low-grade flour and durum flour, it was found that the protein concentration
in the protein fraction increased as the water content in the dough increased from
400 to 710 g/kg (Dik et al., 2002). Gluten is an important constituent of wheat
because it provides strength to dough and texture to baked wheat products.
However, the dry gluten yield reported by Singh and Singh (2006) ranged between
5.9 and 10.1%. Supekar et al. (2005) found the dry gluten content to be in the range
of 9.4 to 12.7%. A similar dry gluten content was reported by Pharande et al.
(1988).
Colour is a significant parameter that includes the physical appearance of the
product (Bhandari et al., 2016). Table 2 shows the colour parameters values (L*,
a* and b*) of EFYF which ranged between L* 77.51, a* 3.89, b* 7.34 and WF L*
98.12, a* 0.48, b* 11.85, respectively.
Table 2. Colour characteristics of EFY, WF and different concentrations of flour.
Flour L* a* b*
WF 98.1±2.1e 0.5±0.1b 11.9±0.5d
EFYF 77.5±0.8a 3.89±0.5c 7.34±0.7a
EFYF/WF (%) 10:90 96.6±2.19d 0.6±0.1ab 10.2±0.5c
EFYF/WF (%) 20:80 94.9±2.11c 0.6±0.06ab 9.6±0.5c
EFYF/WF (%) 30:70 93.1±2.2b 0.7±0.0a 8.3±0.4b
EFYF/WF (%) 40:60 91.9±1.6b 0.7±0.0a 8.0±0.4b The data are presented as means±SEM (n=3) a-bMeans within columns with different superscript letters are significantly different
(p<0.05) from each other

Saklani and Ravinder et al. / AUDJG – Food Technology (2020), 44(2), 159-172
166
It was observed that as the concentration of the EFYF increased, a slight brown
colour was observed in the mixed flour samples. The L* value indicates the
lightness, 0–100 representing dark to light, the a* value gives the degree of the
red–green colour, i.e. a higher positive a* value means more red. The b* value
indicates the degree of the yellow–blue color, i.e. a higher positive b* value shows
more yellow (Ayadi et al., 2009). Upon adding EFYF to WF the most affected
parameters were whiteness and yellowness, which decreased significantly (p<0.05)
for all the EFY ratios used.
Textural properties of dough and cake
The textural properties, viz. hardness, cohesiveness, stickiness, and adhesion, were
analyzed to determine the effect of EFYF addition to WF on dough quality and the
final product obtained - cake. As reported by Carson and Sun (2001), texture
analysis is an objective physical examination of baked products and gives direct
information on product quality, as opposed to dough rheology tests that provide
information on the baking suitability of the flour as raw material. The textural
results of dough and cake made of different flour samples are shown in Table 3.
The gluten protein network developed in dough is important for the textural
properties of baked foods (Sharma et al., 2017).
Table 3. The textural properties of different dough and cake obtained from elephant foot
yam flour (EFYF) and wheat flour (WF).
Samples Cohesiveness
(mm)
Adhesion
(N)
Stickiness
(N)
Hardness
(N)
Textural properties of dough
WF (100%) 0.46±0.033b 0.20±0.026a 0.98±0.034a 0.63±0.029a
EFYF (100%) 0.41±0.028a 0.26±0.027c 1.09±0.031b 0.98±0.027c
EFYF:WF (%) 10:90 0.44±0.023b 0.22±0.035a 1.02±0.038ab 0.66±0.036a
EFYF:WF (%) 20:80 0.44±0.031a 0.24±0.031b 1.03±0.056ab 0.72±0.044ab
EFYF:WF (%) 30:70 0.43±0.025ab 0.25±0.029a 1.04±0.064b 0.77±0.042b
EFYF:WF (%) 40:60 0.42±0.029ab 0.25±0.025b 1.05±0.054b 0.83±0.033b
Textural properties of cake
WF (100%) 3.21±0.16a 1.11±0.19a 1.44±0.34a 0.98±0.27a
EFYF (100%) 3.15±0.19a 1.16±0.21b 1.55±0.36c 1.09±0.36c
EFYF:WF (%) 10:90 3.18±0.15a 1.13±0.24ab 1.47±0.41ab 1.01±0.28ab
EFYF:WF (%) 20:80 3.17±0.24a 1.14±0.17ab 1.49±0.35b 1.04±0.45b
EFYF:WF (%) 30:70 3.16±0.25a 1.15±0.11b 1.53±0.28bc 1.06±0.33bc
EFYF:WF (%) 40:60 3.16±0.31a 1.15±0.25b 1.54±0.19c 1.08±0.27bc
The data are presented as means±SEM (n=3) a-b Means within columns with different superscripts are significantly different (p<0.05) from each
other
The results showed a great improvement in the textural properties of dough
supplemented with EFYF. Except for cohesiveness, all textural parameters

Saklani and Ravinder et al. / AUDJG – Food Technology (2020), 44(2), 159-172
167
increased with the EFYF addition. Jeddou et al. (2016) prepared composite flour
using potato peel powder and wheat flour for the preparation of cake and reported
similar results.
Physical characteristics of cake
The effect of the EFYF incorporation on the physical properties of the cake is
summarized in Table 4. The cake length, width and final weight were not affected
by EFYF addition due to the increase of the fibre content; however, height and
volume decreased with the addition of EFYF in WF.

Saklani and Ravinder et al. / AUDJG – Food Technology (2020), 44(2), 159-172
168
The volume of the control WF cake was 694 cm3 whereas the volume of EFYF was
665 cm3. It was also observed that with the increase in EFYF in the cake, the cake
volume decreased. A decrease in cake volume prepared with spiny and spineless
cladode powders at a concentration of 10% as a source of dietary fibre also was
reported by (Ayadi et al., 2009).
FTIR analysis
FTIR is a cheap, fast, reliable, accurate and non-destructive method, used to find
the functional groups present in a sample (Schwanninger et al., 2004). The FTIR
analysis was carried out to determine the molecular chemistry of flour samples
(Figure 1). The FTIR spectra were recorded in transmission mode between 4000 cm-
1 and 500 cm-1 for EFYF and WF. The various functional groups present in EFY, WF
and their proportionate mixture (10, 20, 30 and 40%) were Ether (-C=C-O-C), Ester (-
C=O), Phenol (-C-OH), 1º and 2º Alcohol (-C-OH) and Alkyl (-C-H). The FTIR
spectrum of the same functional groups in the different samples reflects a similar
composition in point of the main constituents. There is no interaction between the
functional group of the different samples due to the addition of ingredients.
However, it was observed that the absorbance of the samples increased with the
addition of increased concentration of EFYF.
Figure 1. Spectra representation of FTIR analysis of EFYF, WF and different
concentration of EFYF and WF.
Sensory Evaluation
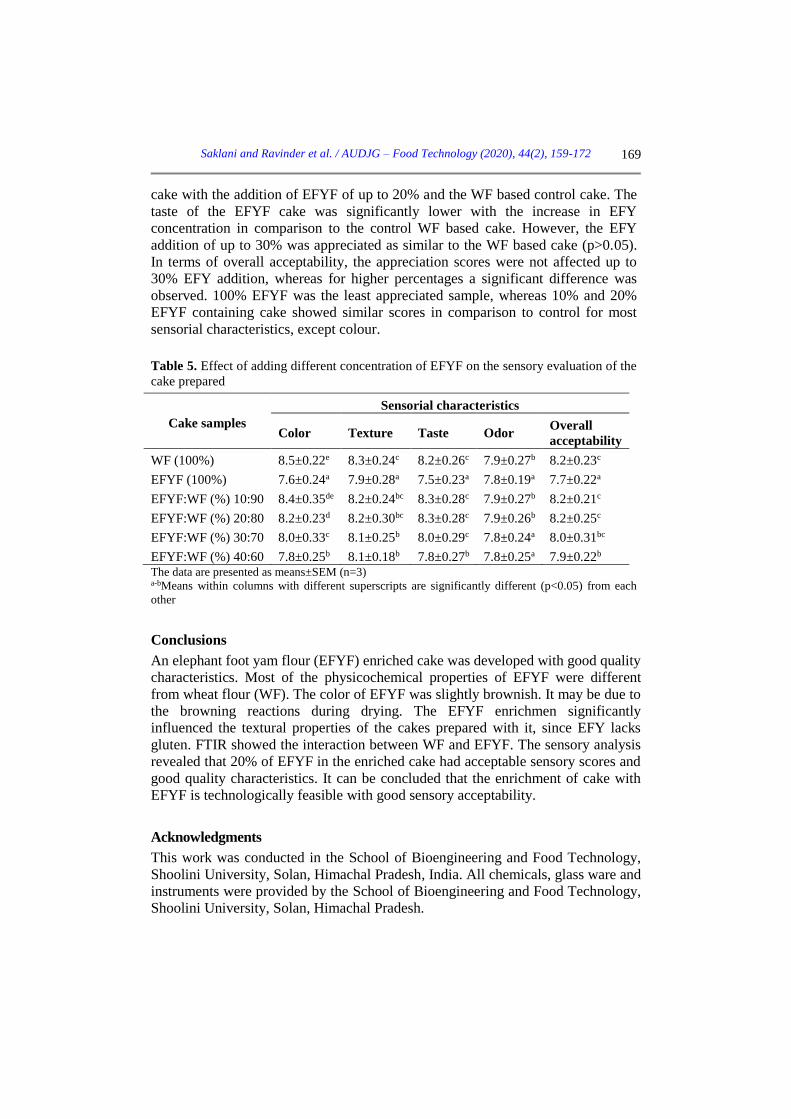
The sensory analysis results are shown in Table 5. The EFYF cake registered
lower colour scores in comparison to the other control cake (WF based), and it
was observed that with the increase in EFY the colour scores decreased. An
insignificant difference (p>0.05) was observed in the textural properties of the
Saklani and Ravinder et al. / AUDJG – Food Technology (2020), 44(2), 159-172
169
cake with the addition of EFYF of up to 20% and the WF based control cake. The
taste of the EFYF cake was significantly lower with the increase in EFY
concentration in comparison to the control WF based cake. However, the EFY
addition of up to 30% was appreciated as similar to the WF based cake (p>0.05).
In terms of overall acceptability, the appreciation scores were not affected up to
30% EFY addition, whereas for higher percentages a significant difference was
observed. 100% EFYF was the least appreciated sample, whereas 10% and 20%
EFYF containing cake showed similar scores in comparison to control for most
sensorial characteristics, except colour.
Table 5. Effect of adding different concentration of EFYF on the sensory evaluation of the
cake prepared
Cake samples
Sensorial characteristics
Color Texture Taste Odor Overall
acceptability
WF (100%) 8.5±0.22e 8.3±0.24c 8.2±0.26c 7.9±0.27b 8.2±0.23c
EFYF (100%) 7.6±0.24a 7.9±0.28a 7.5±0.23a 7.8±0.19a 7.7±0.22a
EFYF:WF (%) 10:90 8.4±0.35de 8.2±0.24bc 8.3±0.28c 7.9±0.27b 8.2±0.21c
EFYF:WF (%) 20:80 8.2±0.23d 8.2±0.30bc 8.3±0.28c 7.9±0.26b 8.2±0.25c
EFYF:WF (%) 30:70 8.0±0.33c 8.1±0.25b 8.0±0.29c 7.8±0.24a 8.0±0.31bc
EFYF:WF (%) 40:60 7.8±0.25b 8.1±0.18b 7.8±0.27b 7.8±0.25a 7.9±0.22b The data are presented as means±SEM (n=3) a-bMeans within columns with different superscripts are significantly different (p<0.05) from each
other
Conclusions
An elephant foot yam flour (EFYF) enriched cake was developed with good quality
characteristics. Most of the physicochemical properties of EFYF were different
from wheat flour (WF). The color of EFYF was slightly brownish. It may be due to
the browning reactions during drying. The EFYF enrichmen significantly
influenced the textural properties of the cakes prepared with it, since EFY lacks
gluten. FTIR showed the interaction between WF and EFYF. The sensory analysis
revealed that 20% of EFYF in the enriched cake had acceptable sensory scores and
good quality characteristics. It can be concluded that the enrichment of cake with
EFYF is technologically feasible with good sensory acceptability.
Acknowledgments
This work was conducted in the School of Bioengineering and Food Technology,
Shoolini University, Solan, Himachal Pradesh, India. All chemicals, glass ware and
instruments were provided by the School of Bioengineering and Food Technology,
Shoolini University, Solan, Himachal Pradesh.

Saklani and Ravinder et al. / AUDJG – Food Technology (2020), 44(2), 159-172
170
References
A.O.A.C. 2005. Official methods of analysis. The Association of Official Analytical
Chemists (18th ed.). 481. North Fredrick Avenue Gaithersburg, Maryland, USA.
Autran, J.C., Hamer, R.J., Plitjer, J.J., Pogna, N.E. 1997. Exploring and improving the
industrial uses of wheat. Cereal Foods World, 42, 221–226.
Ayadi, M.A., Abdelmaksoud, W., Ennouri, M., Attia H. 2009. Cladodes from Opuntia ficus
indica as a source of dietary fiber: Effect on dough characteristics and cake making.
Industrial Crops and Products, 30, 40–47
Bhandari, B.R., Patel, K.C., Chen, X.D. 2016. Spray drying of food materials – process and
product characteristics. In: Chen, X.D., Mujumdar, A.S., editors. Drying Technologies
in Food Processing. UK: Blackwell Publishing.
Biswas, A.K., Kumar, V., Bhosle, S., Sahoo, J., Chatli, M.K. 2009. Dietary fiber as
functional ingredients in meat products and their role in human health. International
Journal Livestock Production, 2(4), 45–54.
Carson, L., Sun, X.S. 2001. Creep-recovery of bread and correlation to sensory
measurements of textural attributes. Cereal Chemistry, 78, 101-104.
Ceserani, V., Kinkton, R., Foskett, D. 1995. Practical cooking. 8th ed. Holder and
Stronghton, London.
Das, S.S., Sen, M., Dey, Y.N., De, S., Ghosh, A.K. 2009. Effects of petroleum ether extract
of Amorphophallus paeoniifolius tuber on central nervous system in mice,
International Journal of Pharmacy and Life Sciences, 71(6), 651-655.
De, S., Dey, Y.N., Ghosh, A.K. 2010. Phytochemical investigation and chromatographic
evaluation of the different extracts of the tuber of Amorphophallus paeoniifolius.
International Journal on Pharmaceutical and Biomedical Research, 1(5), 150-157.
Dik, T., Yonderm-Makascioglu, F., Aytac, C.H., Kincal, N.S. 2002. Wet separation of
wheat flours into starch and gluten fractions: the combined effects of water to flour
ratio–dough maturation time and the effects of flour aging and ascorbic acid addition.
Journal of the Science of Food and Agriculture, 82(4), 405–413.
Firdouse. S., Gupta, J., Alam, P., Firdouse, A., Naaz, F., Durrani, M. 2011.
Pharmacognostic evaluation of Amorphophallus campanulatus tubers. International
Journal of Pharmacy and Life Sciences, 3, 2206-2208.
Hetterscheid, W.L.A. 1993. Sumatran Amorphophallus Adventures: 20 August - 1
September 1993. Aroideana, 17, 61-77.
Jeddou, K.B., Bouaziz, F., Ellouzi, S.Z., Chaari, F., Ellouz, C.S., Ellouz, G.R., Nouri, E.O.
2016. Improvement of texture and sensory properties of cakes by addition of potato
peel powder with high level of dietary fiber and protein. Food Chemistry, 217, 668-
677.
Kaushik, R., Chawla, P., Kumar, N., Kolish, M. 2017. Effect of pre-milling treatments on
wheat flour quality. The Annals of the University Dunarea de Jos of Galati - Food
Technology, 41(2), 141-152.
Kaushik, R., Sachdeva, B., Arora, S. 2015b. Heat stability and thermal properties of
calcium fortified milk. Cyta-Journal of Food, 13(2), 305-311.
Kaushik, R., Sharma, N., Swami, N., Sihag, M., Goyal, A., Chawla, P., Kumar, A., Pawar,
A. 2013. Physico-Chemical Properties, Extraction and Characterization of Gluten from

Saklani and Ravinder et al. / AUDJG – Food Technology (2020), 44(2), 159-172
171
Different Indian Wheat Cultivars. Research & Reviews: A Journal of Crop Science and
Technology, 2(2), 37-42.
Kaushik, R., Swami, N., Sihag, M., Ray, A. 2015a. Isolation, characterization of wheat
gluten and its regeneration properties. Journal of Food Science and Technology, 52(9),
5930-5937.
Khan, A., Rahman, M., Islam, M.S. 2008. Antibacterial, antifungal and cytotoxic activities
of amblyone isolated from Amorphophallus campanulatus. Indian Journal of
Pharmacology, 40, 41-44.
Kumar, N., Khatkar, B.S., Kaushik, R. 2013. Effect of Reducing Agents on Wheat Gluten
and Quality Characteristics of Flour and Cookies. The Annals of the University
Dunarea de Jos of Galati - Food Technology, 37(2), 68-81.
Lohan, A., Kaushik, R., Bansal, V., Gandhi, K. 2020. Flax seeds and finger millet enriched
functional rusk. International Journal of Food Studies, 9(1), 213–224.
Ma, Z., Boye, J.I., Simpson, B.K., Prasher, S.O., Monpetit, D., Malcolmson, L. 2011.
Thermal processing effects on the functional properties and microstructure of lentil,
chickpea, and pea flours. Food Research International, 44, 2534-2544.
Mittal, M., Thakur, A., Kaushik, R., Chawla, P. 2020. Physicochemical properties of
Ocimum sanctum enriched herbal fruit yoghurt. Journal of Food Processing and
Preservation, e14976.
Noor, A., See, E.F., Wan, N.W.A. 2007. Physico-Chemical and Sensory Evaluation of
Breads Supplemented with Pumpkin Flour. ASEAN Food Journal, 14, 123-130.
Owuno, F., Eke, J. and Sanni, S.A. 2009. Proximate and sensory properties of banana
cakes. Nigeria Food Journal 27, 102-106.
Pavia, D.L., Lampman, G.M., Kriz-jr. G.S. 2001. Introdoction to Spectroscopy: A Guide
for Students of Organic Chemistry, 3th Edition, London: Thomson Learning Inc.
Pharande, A.L., Dhotre, V.A., Adsule, R.N. 1988. Quality characteristics of recently
released wheat variety. Journal of Maharashtra Agricultural Universities, 13, 234–235.
Rana, B., Kaushik, R., Kaushal, K., Kaushal, A., Gupta S., Upadhay, N., Rani, P., Sharma
P. 2018. Application of biosensors for determination of physicochemical properties of
zinc fortified milk. Food Bioscience, 21, 117-124.
Robertson, J.A., Monredon, F.D., Dysseler, P., Guillon, F., Amadò, R., Thibault, J.F. 2000.
Hydration properties of dietary fiber and resistant starch: a European Collaborative
Study. Food Science and Technology, 33, 72–79.
Rosell, C.M., Rojas, J.A., Benedito de Barber, C. 2001. Influence of hydrocolloids on
dough rheology and bread quality. Food Hydrocolloids, 15, 75-81.
Saxena, H. O., Brahmam, M. 1996. The Flora of Orissa. IV: 2037-2039
Schwanninger, M., Rodrigues, J.C., Pereira, H., Hinterstoisser, B. 2004. Effects of short-
time vibratory ball milling on the shape of FT-IR spectra of wood and cellulose.
Vibrational Spectroscopy, 36(1), 23-40.
Sharma, N., Khatkar, B., Kaushik, R., Sharma P., Sharma R. 2017. Isolation and
development of wheat based gluten edible film and its physico-chemical properties.
International Food Research Journal, 24(1), 94-101.
Shilpi, J.A., Ray, P.K., Sarder, M.M., Uddin, S.J. 2005. Analgesic activity of
Amorphophallus paeoniifolius tuber. Fitoterpia; 76, 367- 369.

Saklani and Ravinder et al. / AUDJG – Food Technology (2020), 44(2), 159-172
172
Singh, B., Singh, N. 2006. Physico-chemical, water and oil absorption and thermal
properties of gluten isolated from different Indian wheat cultivars. Journal of the
Science Technology, 43(3), 251–255.
Singh, U. 2001. Functional properties of grain legume flours. Journal of Food Science and
Technology, 38(3), 191–199.
Supekar, D.T., Patil, S.R., Munjal, S.V. 2005. Comparative study of some important
aestivum, durum and dicoccum wheat cultivars for grain, flour quality and suitability
for chapati making characteristics. Journal of the Science Technology, 42(6), 488–492.