Embed Size (px)
Citation preview
149
Rajaul KarimA
Received: May 2020 | Accepted: July 2020
DOI: 10.5937/turizam24-26520
Abstract
Bangladesh being a neighboring country of India plays a crucial role in bringing millions of tourists every year. Bangladesh is the largest tourist generating market for India in which the India-Bangladesh relation is a key factor for this foreign tourist arrivals(FTAs) and tour-ism development. The main objective of this paper is to find out the trend of Bangladeshi for-eign tourist arrivals in India from 2018 to 2025 with respect to observed values of foreign tour-ist arrivals during previous years, analysis of segment-wise growth rate of Bangladeshi tourist arrivals according to purpose of travel and to make some policy prescriptions. The research is based on secondary data by applying descriptive statistics considering the published reports of the Indian Government from the Ministry of Tourism. The findings of the present research paper show that the trend and growth rate of FTAs are rising steadily as well as the impor-tance of Bangladeshi tourist arrivals in developing certain tourism segments of India that are lacking behind and have some potential for further expansion. Proper attention to these seg-ments is expected to make a positive contribution towards tourism development in particular and economic development in general of India.
Keywords: Foreign Tourist Arrivals (FTAs), Bangladeshi Tourist, Tourism Potentiality, Indian Tourism Development.
Introduction
Tourism is one of the major contributors to the economy of a country especially for the devel-oping countries like India where making a positive change in the economy is not an easy task. Balaguer and Cantavella-Jorda (2002) revealed in their analysis considering the case of Spain that relationship between economic growth and tourism exists in long run. It is also stated in their study that tourism led growth hypothesis has been supported with arguments. Witt and Turner (2002) has expected high growth rates in the coming years by forecasting inbound tourism from the source markets of China but there can be variations depending on different markets. Hyun
TURIZAMVolume 24, Issue 4 149–164 (2020)
ORIGINAL SCIENTIFIC PAPER Role of Foreign Tourist Arrivals (FTAs)
from Bangladesh in Indian Tourism Development: A Segment-wise Analysis
A Department of Tourism & Hospitality, DSMS College, Kazi Nazrul University, West Bengal, India; [email protected]
150 TURIZAM | Volume 24, Issue 4, 149–164 (2020)
Role of Foreign Tourist Arrivals from Bangladesh in Indian Tourism Development: A Segment-wise Analysis
Kim, Chen and Shawn Jang (2006) showed the reciprocal relation between tourism and econom-ic development considering the case of Taiwan. The World Travel and Tourism Council (WTTC) Economic Impact India Report (2018) clearly states that the contribution of travel and tourism in India has a positive rising trend in its forecast in terms of GDP, Employment, Visitor Exports and Investment. The Annual Report (2017-2018) of the Ministry of Tourism, Government of India has made an overview that tourism has the capacity to create employment of diverse kind as well as plays a crucial role in achieving sustainable growth. International tourist arrival in India has been an important factor for employment generation and foreign exchange earnings. Bangla-desh being very close and sharing the longest border with India has been a major source of tour-ist arrivals for India with 2156557 numbers of arrivals in 2017, having a share of around 21.49 percent out of total 10.04 million tourist arrivals in 2017. Bangladesh has also become India’s largest tourist generating market holding the top position among top 15 source markets followed by United States, United Kingdom, Canada, Australia, Malaysia, Sri Lanka, Russian Federation, Germany, France, China, Japan, Singapore, Nepal, Afghanistan as per India Tourism Statistics (2018). It is mainly the International tourist arrival in a country that determines its econom-ic development in regard to travel perspective, as more the foreign tourist arrival the more the contribution directly and indirectly to the economy. In fact Indian tourism industry has gone to new height in recent times. It is the 7th largest Tourism economy in terms of GDP according to WTTC. Both tourist arrival as well as revenue earned thereof are showing a steep hike in Indian tourism industry. As per WTTC (2018) Travel & Tourism Economic Impact Report of India, the total contribution of this sector in 2017 was INR 15,239.6bn (USD 234.0bn) which is 9.4% of GDP and is expected to rise by 9.9 % in 2028. The industry generated about 8.0% of total employment (41,622,500) jobs in 2017 and is expected to rise by 8.4% in 2028. In 2017 visitors export contrib-uted about INR 1,777.1bn (USD 27.3bn), 5.8% of total exports and is expected to grow 5.1% in 2028. As a whole, investment in Travel & Tourism in 2017 was INR 2,706.1 billion, 6.3% of total invest-ment and is expected to grow 6.1% of total investment in 2028. It is worth saying after looking the various reports that tourism industry has immense potentiality in creating an impact on GDP, employment, investment and visitors' exports but all these potentialities is observed when there is a rising growth as well as stable tourist inflow in a destination. Without tourist inflow in a des-tination the travel industry and other allied service industries related to tourism is useless. But the fact of quality and high spending tourists cannot be overlooked. It is the foreign tourists that contributes to foreign exchange earnings and has high spending capacity. Earnings from Foreign Exchange (FEEs) in 2017 accounted for INR 177874 core with a percentage change of 15.4% over previous year as per data provided on Open Government Data (OGD, 2018) Platform, Govern-ment of India.
This study was conducted to identify the role of Bangladeshi tourists’ arrival in the growth process of Indian tourism. Further their segment-wise contribution in terms of arrival to understand the stability of inbound tourists for various purposes which may favorably affect the tourism of India, has also been considered.
Need for the Study
Bangladesh being the top source market for India since 2016 plays a crucial role in developing the Indian tourism industry in particular and Indian economy in general. The tourist arrivals direct-ly and indirectly affects employment generation, hotel room occupancies, foreign exchange earn-ings, usages of different mode of transport facilities and medical facilities. Tourists from Bang-
TURIZAM | Volume 24, Issue 4, 149–164 (2020) 151
Rajaul Karim
ladesh form a large chunk of total tourists to India. During 2017, the percentage share of tourists from Bangladesh was around 21.49% out of total foreign tourist arrivals. Needless to say that this high percentage share of tourists plays a vital role in Indian economy. Data from a study conduct-ed by Indian Institute of Tourism and Travel Management (IITTM) and submitted to Ministry of Tourism, Government of India regarding “Study on Visit of Nationals of Bangladesh to India” (2018) also show that these tourists spend an average of 21223 BDT which is equivalent to INR 16978 per tourist, which is a considerable amount of expenditure on Indian goods and services. This might have a favorable impact on the economic growth of India.
Tourists from Bangladesh mainly come to Kolkata or use it as transit point. However, a part of them goes to different pilgrimage destinations like Ajmer, Mumbai and Delhi etc. Anoth-er part goes to places in southern India like Bangalore, Hyderabad, Chennai and Vellore etc for medical purposes. So, such arrival of tourists must have some impact on the Indian econ-omy as a whole. However, it may be admitted that the most important impact will be on the economy of West Bengal as a sizeable part of Bangladeshi tourist visits Kolkata in particular for treatment purpose as well as for the purpose of leisure or holiday in Eastern India. Thus the number of tourist arrivals from Bangladesh is an important factor for Indian Tourism having all India as well as regional impacts.
Literature Review
Foreign tourist arrivals play a vital role for the economic development of a country and it is such a kind of import which makes the economy of a country strong. Aliqah and Al-rfou (2010) highlighted in their study the impact of tourism sector on the economy of Jordan. They also found that the tourism sector is responsible for a significant growth in tourist arrivals along with infrastructural development, legislation, institutional framework and revenue generation. Du, Lew and Ng (2014) in their study showed that international tourism and growth have a sig-nificant association when standard income factors were not taken into account. Rout, Mishra and Pradhan (2016) pointed out the role of the Government in tourism development through trend analysis on Indian perspective. Ekanayake and Long (2012) investigated the relationship between tourism development and economic growth using Granger causality test consider-ing annual data. The result of their study suggested that in developing countries government should focus on economic policies in favour of tourism for economic growth. Cárdenas-García, Sánchez-Rivero and Pulido-Fernández (2013) examined in their study regarding relationship of tourism activity and economic growth by using structural equation modeling (SEM). The result of their study indicated that the relationship occurs more on the developed countries but throws a question about the least developed countries and developing countries. Sinclair (1998) has made an extensive survey of literature regarding tourism and economic develop-ment, and argued the problem of the use of environmental recourses which stem the failure in the market considering the methods for increasing, sustainably and the return. As per a recent study on Visit of National of Bangladesh to India (2019) people from Bangladesh are travel-ling extensively especially in the South Asian regions like India, Thailand, Malaysia and Singa-pore. The reason behind this travel trend is due to rising per capita income, best medical facili-ties in the neighboring countries as well as the role of budget carriers operating in Bangladesh. The percentage of FTAs from Bangladesh has increased at an increasing rate with a share of 10.92% out of total tourist arrival from Bangladesh in 2014. Since then it has increased to 14.13%, 15.68% and 21.49% in 2015, 2016, and 2017 respectively. Ohlan (2017) has shown in his study that
152 TURIZAM | Volume 24, Issue 4, 149–164 (2020)
Role of Foreign Tourist Arrivals from Bangladesh in Indian Tourism Development: A Segment-wise Analysis
inbound tourism contributes for the economic growth of India in both long-run and short-run. In the context of policy recommendations he suggested the policy-makers for encourage-ment of inbound tourism considering the investment goals made by the Government of India in the tourism industry for long-run economic growth. Bulgan, Maden and Yildirim (2019) made an empirical study on the effects of tourism sector on economic growth of Turkey and found a positive relationship between the variables studied upon. They found that an increase in income through tourism also contributes to per capita income and shows significant impact on Turkish economy. They highlighted the importance to support this sector due to its positive effect on macro variables. Lee and Chang (2007) applied a new type of heterogeneous panel co integration technique to investigate the long-run relation between tourism development and economic growth of OECD as well as non-OECD countries. Results indicated that develop-ment of tourism has more impact in non-OECD countries as compared to OECD countries in regard to GDP and considering the variable tourism receipts, the greater impact is in Sub-Sa-haran African countries. In the long-run the panel causality test showed unidirectional rela-tion between tourism development and economic development in OECD countries as com-pared to non-OECD countries which showed bidirectional relationships but in Asia with a weak relationship. Cortes-Jimenez and Pulina (2010) made an empirical investigation on the tourism sector of Spanish and Italian economies. Their study is demand based using inte-gration, co integration and multivariate Granger causality tests which showed the important role of incoming tourists for both the countries’ economy. Zuruba, Ionescua and Constantina (2015) discussed the correlation between sustainable development and tourism as well as ways to measure tourism development. In their study they made a comparison taking three emer-gent markets from European Union with Romania. The results revealed that most of the devel-oped economies consider tourism as a primary industry for the growth of the economy.
Methodology
Research Type
Quantitative Research Methodology has been applied for the study as the analysis is purely based on secondary data. This research study has three sections. The first section deals with the estimation and forecast of trend values of Bangladeshi FTAs to India in order to under-stand the growing trend. The second section deals with the analysis of growth rate of FTAs according to purpose of travel. The third section deals with the interpretation of the results based on the analysis.
Data Source
The data for the research is collected from secondary sources which include seventeen years of data. Basically India Tourism Statistics and Annual Reports data are taken for the research obtained from the publications of Ministry of Tourism, Government of India. Besides, data regarding tourism are also obtained from Open Government Data (OGD) Platform, Minis-try of Statistics & Programme Implementation; Government of India websites as well as vari-ous Journals related to the study. Data for some years regarding categories of Bangladeshi for-eign tourist arrivals were missing from the published government reports so those areas are not considered for the study.
TURIZAM | Volume 24, Issue 4, 149–164 (2020) 153
Rajaul Karim
Representation of Data
Both Linear and Non-Liner Trend Lines are plotted in time series data against the observed values of Foreign Tourist Arrivals (FTAs) for the estimation and analysis. Data regarding pur-pose of visit used to be collected earlier through disembarkation cards since 2009. But from 2014 this system of recording data was discontinued and FTAs according to Visa Type was taken into consideration instead of FTAs according to purpose of visit, both of which are very similar. The purpose of visit from the year 2009 to 2014 mainly were – Business, Leisure/Hol-idays, Medical, Indian Diaspora/VFR and Others but from 2014 to 2017 onwards according to Visa type are – Tourist Visa, Overseas Citizen of India (OCI), Business Visa, Medical Visa, Stu-dent Visa and Others. Among them five (5) purposes of visit as variables are considered for the research. They are - Business, Leisure/Holidays, Medical, Indian Diaspora/Visiting Friends & Relatives (VFR) and others.
Interpretation of Data
Statistical Package for Social Science (SPSS) version 25 is used for the analysis and interpreta-tion. The statistical tools used for the study are Mean, Standard Deviation, Coefficient of Var-iation and R2. Application of the coefficient of determination, R2 is done to determine the degree of association between dependent and independent variables.
Results
Foreign Tourist Arrivals (FTAs) from Bangladesh to India
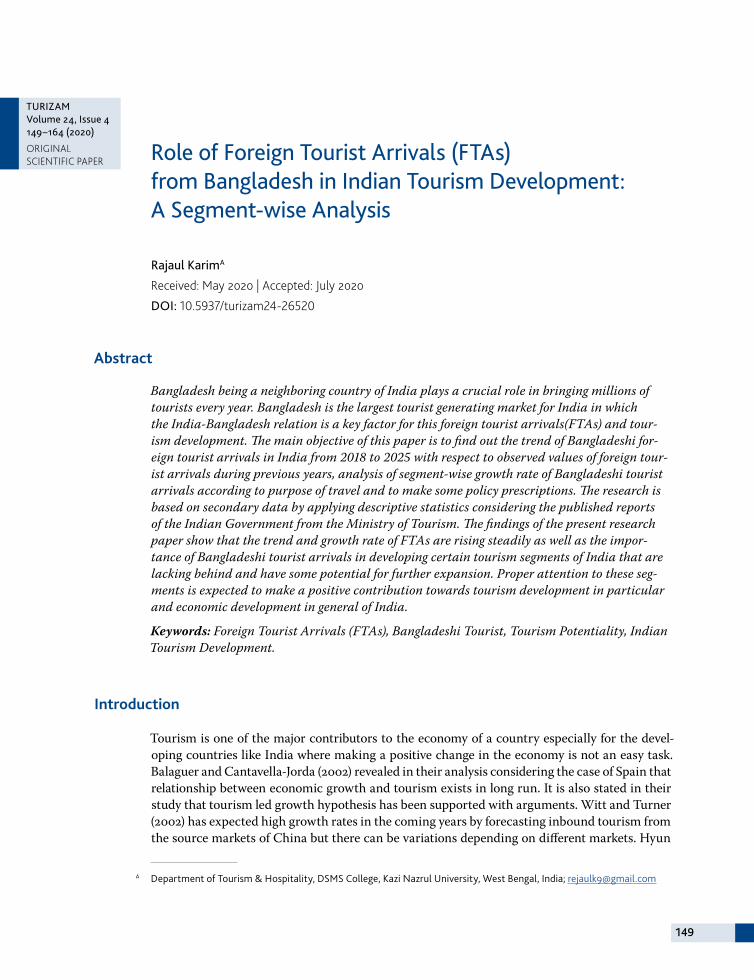
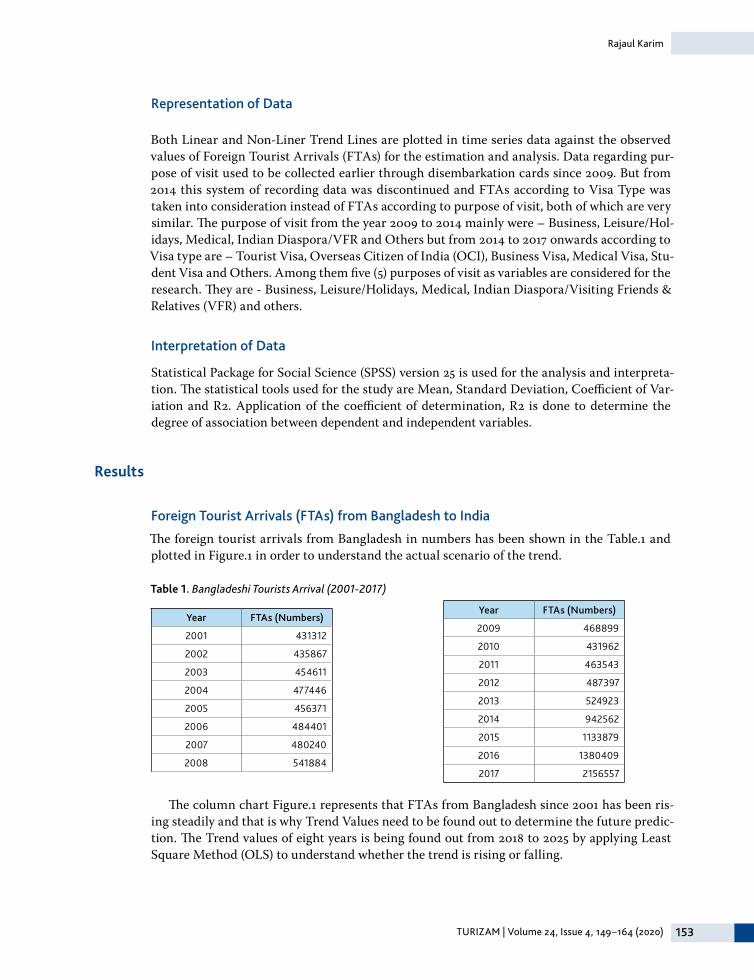
The foreign tourist arrivals from Bangladesh in numbers has been shown in the Table.1 and plotted in Figure.1 in order to understand the actual scenario of the trend.
Table 1. Bangladeshi Tourists Arrival (2001-2017)
Year FTAs (Numbers)
2001 431312
2002 435867
2003 454611
2004 477446
2005 456371
2006 484401
2007 480240
2008 541884
Year FTAs (Numbers)
2009 468899
2010 431962
2011 463543
2012 487397
2013 524923
2014 942562
2015 1133879
2016 1380409
2017 2156557
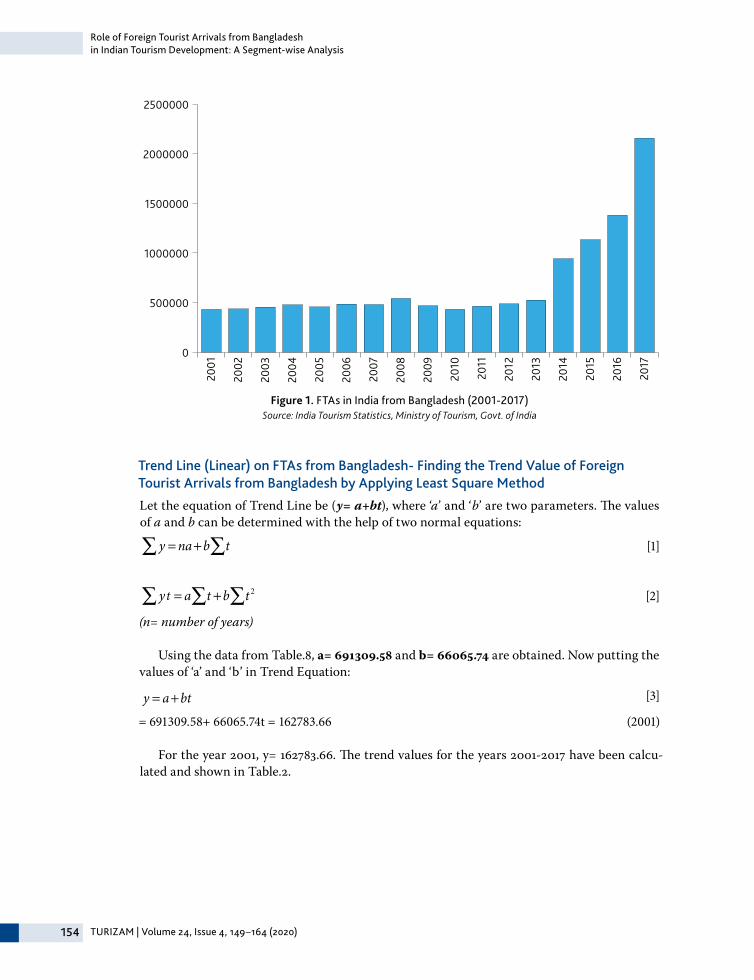
The column chart Figure.1 represents that FTAs from Bangladesh since 2001 has been ris-ing steadily and that is why Trend Values need to be found out to determine the future predic-tion. The Trend values of eight years is being found out from 2018 to 2025 by applying Least Square Method (OLS) to understand whether the trend is rising or falling.
154 TURIZAM | Volume 24, Issue 4, 149–164 (2020)
Role of Foreign Tourist Arrivals from Bangladesh in Indian Tourism Development: A Segment-wise Analysis
Trend Line (Linear) on FTAs from Bangladesh- Finding the Trend Value of Foreign Tourist Arrivals from Bangladesh by Applying Least Square Method
Let the equation of Trend Line be (y= a+bt), where ‘a’ and ‘b’ are two parameters. The values of a and b can be determined with the help of two normal equations:
y =na+b t∑∑ [1]
y∑ = a t +b t 2∑∑ y∑ = a t +b t 2∑∑
[2]
(n= number of years)
Using the data from Table.8, a= 691309.58 and b= 66065.74 are obtained. Now putting the values of ‘a’ and ‘b’ in Trend Equation:
y = a+bt [3]
= 691309.58+ 66065.74t = 162783.66 (2001)
For the year 2001, y= 162783.66. The trend values for the years 2001-2017 have been calcu-lated and shown in Table.2.
0
500000
1000000
1500000
2000000
2500000
2001
2002
2003
2004
2005
2006
2007
2008
2009
2010
2011
2012
2013
2014
2015
2016
2017
Figure 1. FTAs in India from Bangladesh (2001-2017)Source: India Tourism Statistics, Ministry of Tourism, Govt. of India
TURIZAM | Volume 24, Issue 4, 149–164 (2020) 155
Rajaul Karim
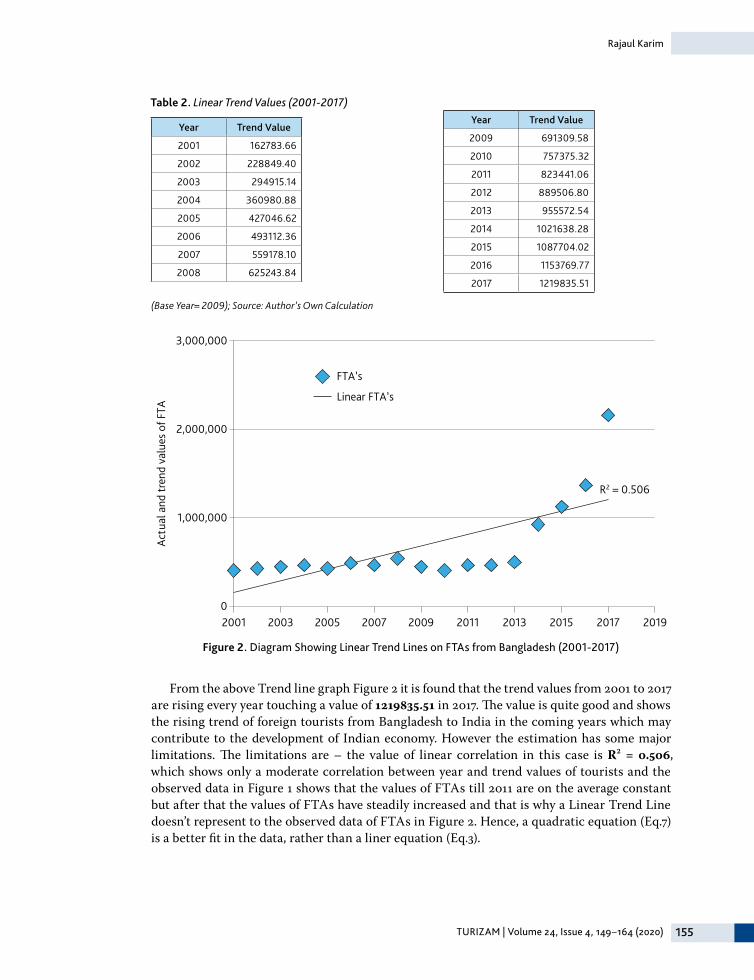
Table 2. Linear Trend Values (2001-2017)
Year Trend Value
2001 162783.66
2002 228849.40
2003 294915.14
2004 360980.88
2005 427046.62
2006 493112.36
2007 559178.10
2008 625243.84
Year Trend Value
2009 691309.58
2010 757375.32
2011 823441.06
2012 889506.80
2013 955572.54
2014 1021638.28
2015 1087704.02
2016 1153769.77
2017 1219835.51
(Base Year= 2009); Source: Author’s Own Calculation
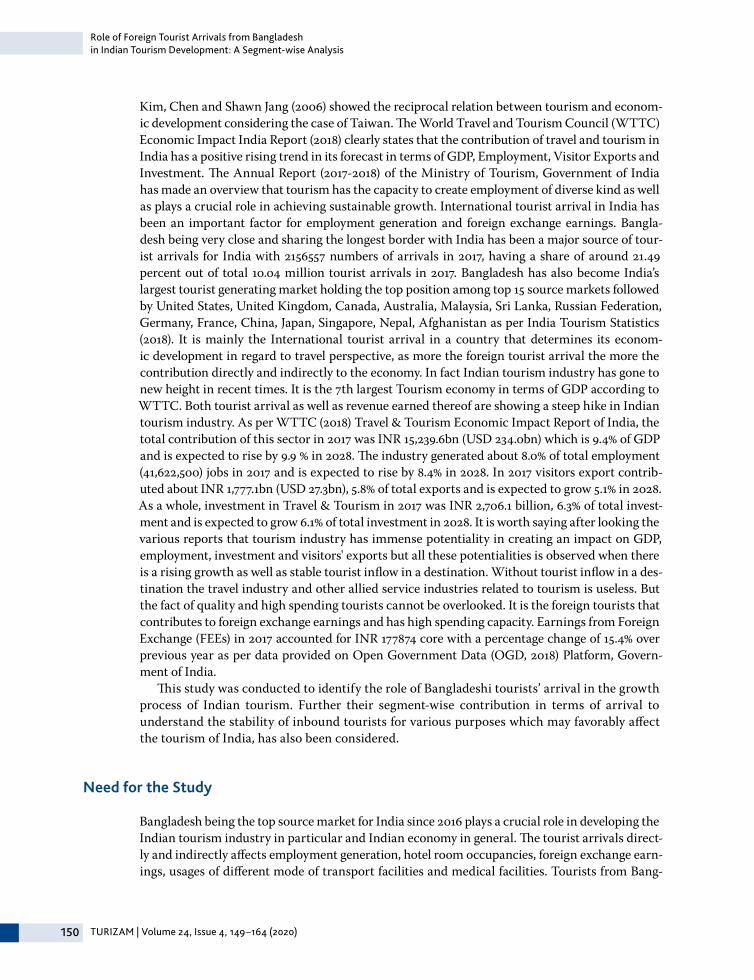
From the above Trend line graph Figure 2 it is found that the trend values from 2001 to 2017 are rising every year touching a value of 1219835.51 in 2017. The value is quite good and shows the rising trend of foreign tourists from Bangladesh to India in the coming years which may contribute to the development of Indian economy. However the estimation has some major limitations. The limitations are – the value of linear correlation in this case is R² = 0.506, which shows only a moderate correlation between year and trend values of tourists and the observed data in Figure 1 shows that the values of FTAs till 2011 are on the average constant but after that the values of FTAs have steadily increased and that is why a Linear Trend Line doesn’t represent to the observed data of FTAs in Figure 2. Hence, a quadratic equation (Eq.7) is a better fit in the data, rather than a liner equation (Eq.3).
2001 2003 2005 2007 2009 2011 2013 2015 2017 2019
3,000,000
2,000,000
1,000,000
0
Actu
al a
nd tr
end
valu
es o
f FTA
FTA’s
Linear FTA’s
R2 = 0.506
Figure 2. Diagram Showing Linear Trend Lines on FTAs from Bangladesh (2001-2017)
156 TURIZAM | Volume 24, Issue 4, 149–164 (2020)
Role of Foreign Tourist Arrivals from Bangladesh in Indian Tourism Development: A Segment-wise Analysis
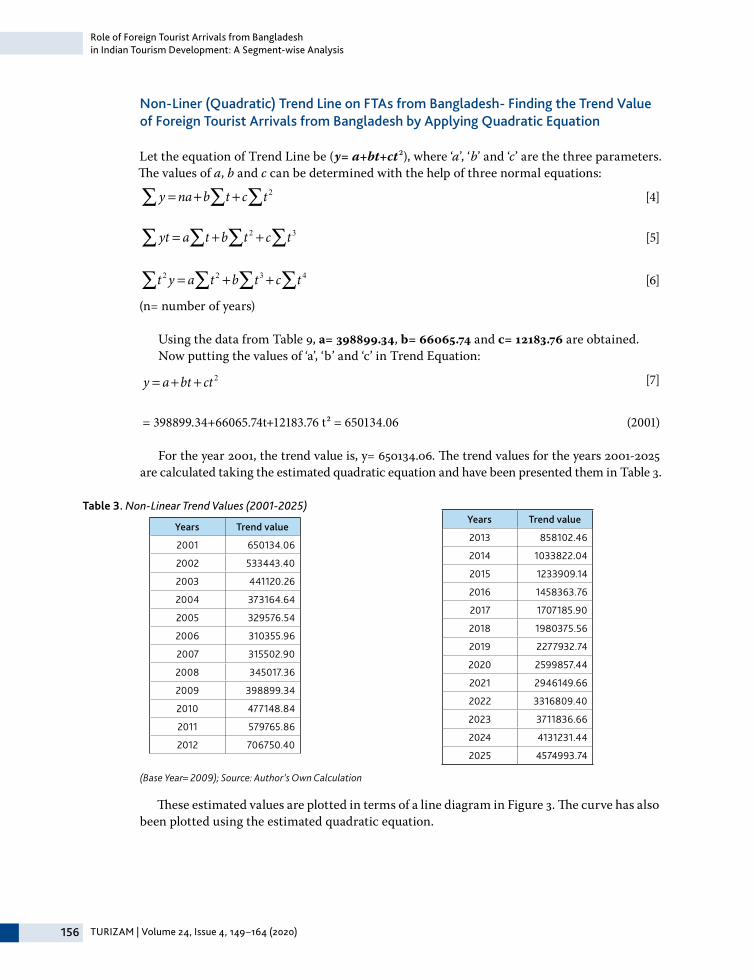
Non-Liner (Quadratic) Trend Line on FTAs from Bangladesh- Finding the Trend Value of Foreign Tourist Arrivals from Bangladesh by Applying Quadratic Equation
Let the equation of Trend Line be (y= a+bt+ct²), where ‘a’, ‘b’ and ‘c’ are the three parameters. The values of a, b and c can be determined with the help of three normal equations:
y∑ =na+b t∑ + c t 2∑ [4]
yt∑ = a t∑ +b t 2∑ + c t3∑ [5]
t 2y∑ = a t 2∑ +b t3∑ + c t 4∑ [6]
(n= number of years)
Using the data from Table 9, a= 398899.34, b= 66065.74 and c= 12183.76 are obtained.Now putting the values of ‘a’, ‘b’ and ‘c’ in Trend Equation:
y = a+bt + ct 2 [7]
= 398899.34+66065.74t+12183.76 t2 = 650134.06 (2001)
For the year 2001, the trend value is, y= 650134.06. The trend values for the years 2001-2025 are calculated taking the estimated quadratic equation and have been presented them in Table 3.
Table 3. Non-Linear Trend Values (2001-2025)
Years Trend value
2001 650134.06
2002 533443.40
2003 441120.26
2004 373164.64
2005 329576.54
2006 310355.96
2007 315502.90
2008 345017.36
2009 398899.34
2010 477148.84
2011 579765.86
2012 706750.40
Years Trend value
2013 858102.46
2014 1033822.04
2015 1233909.14
2016 1458363.76
2017 1707185.90
2018 1980375.56
2019 2277932.74
2020 2599857.44
2021 2946149.66
2022 3316809.40
2023 3711836.66
2024 4131231.44
2025 4574993.74
(Base Year= 2009); Source: Author’s Own Calculation
These estimated values are plotted in terms of a line diagram in Figure 3. The curve has also been plotted using the estimated quadratic equation.
TURIZAM | Volume 24, Issue 4, 149–164 (2020) 157
Rajaul Karim
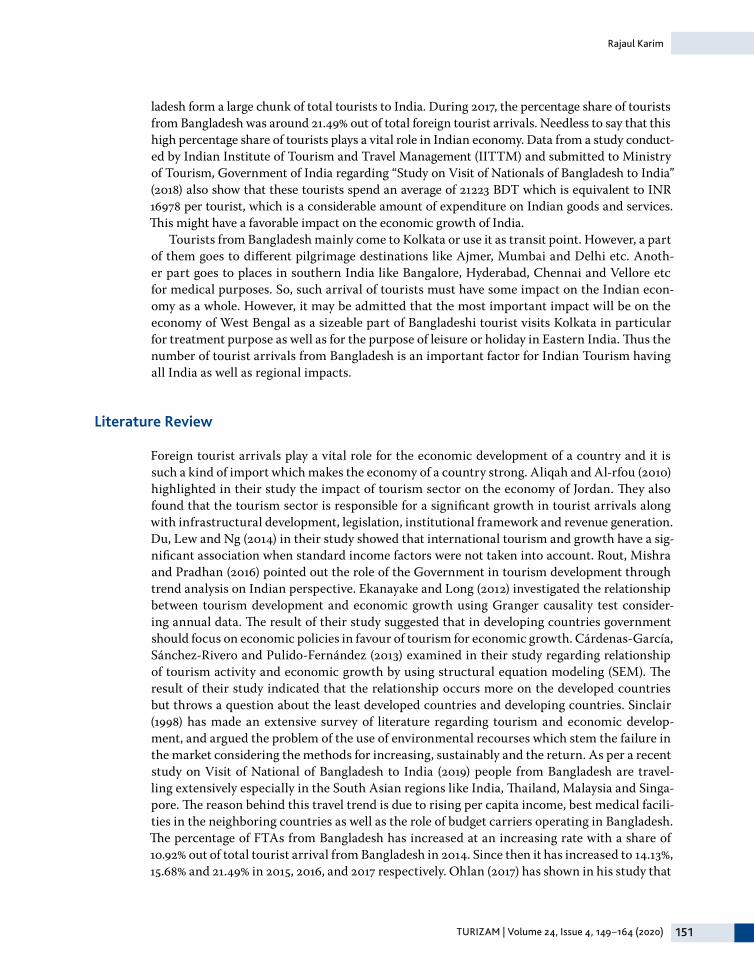
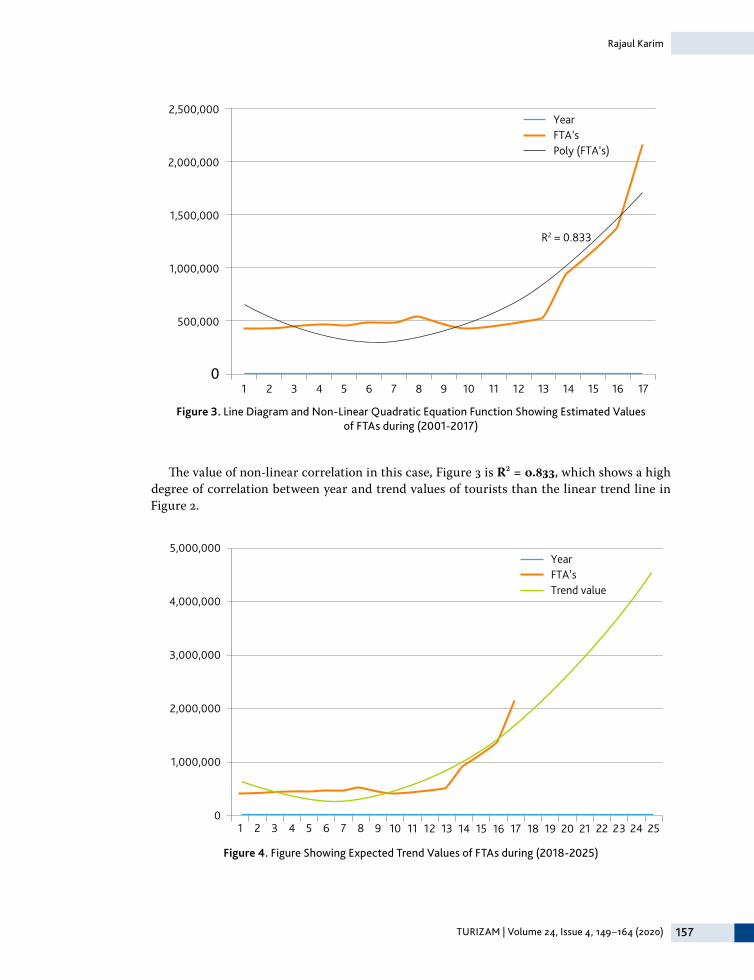
The value of non-linear correlation in this case, Figure 3 is R² = 0.833, which shows a high degree of correlation between year and trend values of tourists than the linear trend line in Figure 2.
Figure 3. Line Diagram and Non-Linear Quadratic Equation Function Showing Estimated Values of FTAs during (2001-2017)
2,500,000
2,000,000
1,500,000
1,000,000
500,000
01 2 3 4 5 6 7 8 9 10 11 12 13 14 15 16 17
R2 = 0.833
YearFTA’sPoly (FTA’s)
5,000,000
4,000,000
3,000,000
2,000,000
1,000,000
022 23 24 251 2 3 4 5 6 7 8 9 10 11 12 13 14 15 16 17 18 19 20 21
YearFTA’sTrend value
Figure 4. Figure Showing Expected Trend Values of FTAs during (2018-2025)
158 TURIZAM | Volume 24, Issue 4, 149–164 (2020)
Role of Foreign Tourist Arrivals from Bangladesh in Indian Tourism Development: A Segment-wise Analysis
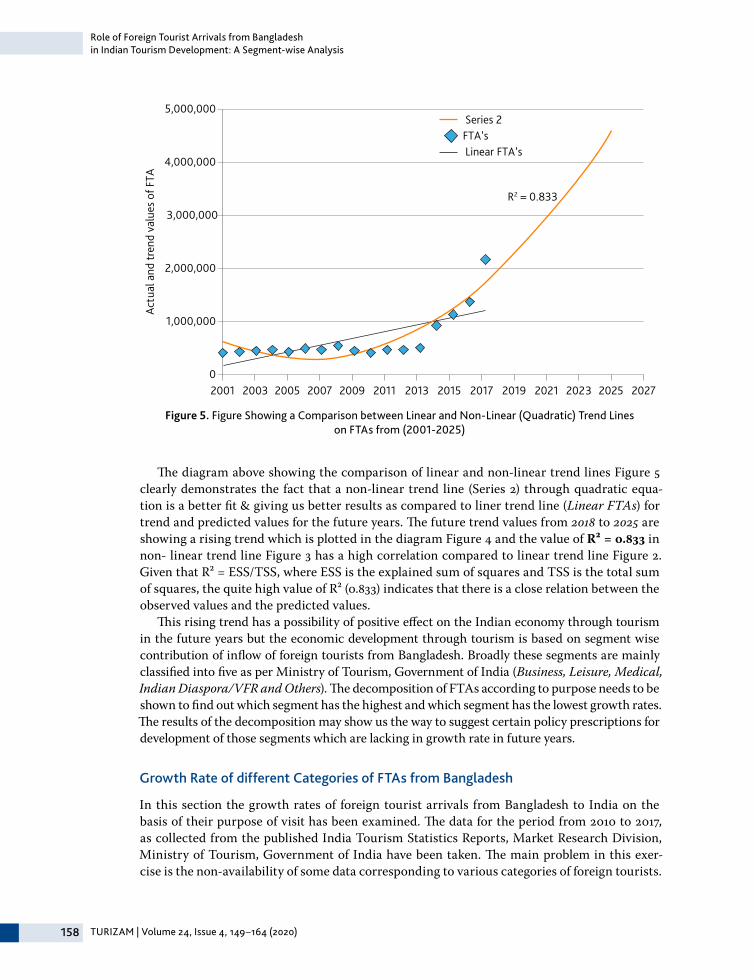
The diagram above showing the comparison of linear and non-linear trend lines Figure 5 clearly demonstrates the fact that a non-linear trend line (Series 2) through quadratic equa-tion is a better fit & giving us better results as compared to liner trend line (Linear FTAs) for trend and predicted values for the future years. The future trend values from 2018 to 2025 are showing a rising trend which is plotted in the diagram Figure 4 and the value of R² = 0.833 in non- linear trend line Figure 3 has a high correlation compared to linear trend line Figure 2. Given that R² = ESS/TSS, where ESS is the explained sum of squares and TSS is the total sum of squares, the quite high value of R² (0.833) indicates that there is a close relation between the observed values and the predicted values.
This rising trend has a possibility of positive effect on the Indian economy through tourism in the future years but the economic development through tourism is based on segment wise contribution of inflow of foreign tourists from Bangladesh. Broadly these segments are mainly classified into five as per Ministry of Tourism, Government of India (Business, Leisure, Medical, Indian Diaspora/VFR and Others). The decomposition of FTAs according to purpose needs to be shown to find out which segment has the highest and which segment has the lowest growth rates. The results of the decomposition may show us the way to suggest certain policy prescriptions for development of those segments which are lacking in growth rate in future years.
Growth Rate of different Categories of FTAs from Bangladesh
In this section the growth rates of foreign tourist arrivals from Bangladesh to India on the basis of their purpose of visit has been examined. The data for the period from 2010 to 2017, as collected from the published India Tourism Statistics Reports, Market Research Division, Ministry of Tourism, Government of India have been taken. The main problem in this exer-cise is the non-availability of some data corresponding to various categories of foreign tourists.
Figure 5. Figure Showing a Comparison between Linear and Non-Linear (Quadratic) Trend Lines on FTAs from (2001-2025)
2001 2003 2005 2007 2009 2011 2013 2015 2017 20272025202320212019
5,000,000
4,000,000
3,000,000
2,000,000
1,000,000
0
Actu
al a
nd tr
end
valu
es o
f FTA
FTA’sLinear FTA’s
Series 2
R2 = 0.833
TURIZAM | Volume 24, Issue 4, 149–164 (2020) 159
Rajaul Karim
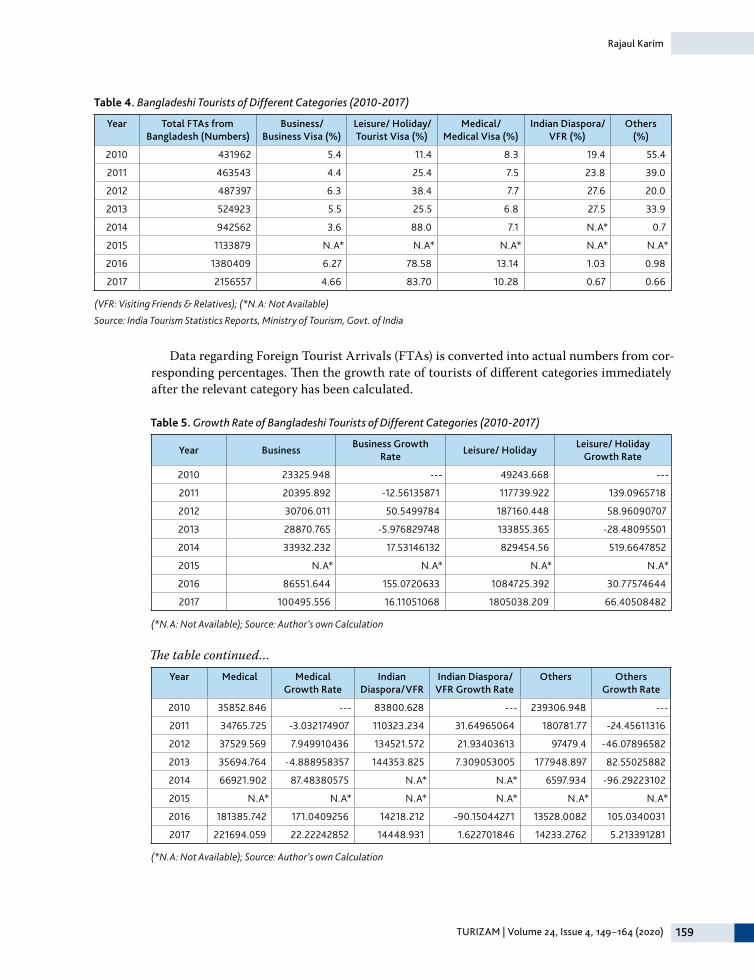
Table 4. Bangladeshi Tourists of Different Categories (2010-2017)
Year Total FTAs from Bangladesh (Numbers)
Business/ Business Visa (%)
Leisure/ Holiday/ Tourist Visa (%)
Medical/ Medical Visa (%)
Indian Diaspora/ VFR (%)
Others (%)
2010 431962 5.4 11.4 8.3 19.4 55.4
2011 463543 4.4 25.4 7.5 23.8 39.0
2012 487397 6.3 38.4 7.7 27.6 20.0
2013 524923 5.5 25.5 6.8 27.5 33.9
2014 942562 3.6 88.0 7.1 N.A* 0.7
2015 1133879 N.A* N.A* N.A* N.A* N.A*
2016 1380409 6.27 78.58 13.14 1.03 0.98
2017 2156557 4.66 83.70 10.28 0.67 0.66
(VFR: Visiting Friends & Relatives); (*N.A: Not Available)
Source: India Tourism Statistics Reports, Ministry of Tourism, Govt. of India
Data regarding Foreign Tourist Arrivals (FTAs) is converted into actual numbers from cor-responding percentages. Then the growth rate of tourists of different categories immediately after the relevant category has been calculated.
Table 5. Growth Rate of Bangladeshi Tourists of Different Categories (2010-2017)
Year BusinessBusiness Growth
RateLeisure/ Holiday
Leisure/ Holiday Growth Rate
2010 23325.948 --- 49243.668 ---
2011 20395.892 -12.56135871 117739.922 139.0965718
2012 30706.011 50.5499784 187160.448 58.96090707
2013 28870.765 -5.976829748 133855.365 -28.48095501
2014 33932.232 17.53146132 829454.56 519.6647852
2015 N.A* N.A* N.A* N.A*
2016 86551.644 155.0720633 1084725.392 30.77574644
2017 100495.556 16.11051068 1805038.209 66.40508482
(*N.A: Not Available); Source: Author’s own Calculation
The table continued…Year Medical Medical
Growth RateIndian
Diaspora/VFRIndian Diaspora/
VFR Growth RateOthers Others
Growth Rate
2010 35852.846 --- 83800.628 --- 239306.948 ---
2011 34765.725 -3.032174907 110323.234 31.64965064 180781.77 -24.45611316
2012 37529.569 7.949910436 134521.572 21.93403613 97479.4 -46.07896582
2013 35694.764 -4.888958357 144353.825 7.309053005 177948.897 82.55025882
2014 66921.902 87.48380575 N.A* N.A* 6597.934 -96.29223102
2015 N.A* N.A* N.A* N.A* N.A* N.A*
2016 181385.742 171.0409256 14218.212 -90.15044271 13528.0082 105.0340031
2017 221694.059 22.22242852 14448.931 1.622701846 14233.2762 5.213391281
(*N.A: Not Available); Source: Author’s own Calculation
160 TURIZAM | Volume 24, Issue 4, 149–164 (2020)
Role of Foreign Tourist Arrivals from Bangladesh in Indian Tourism Development: A Segment-wise Analysis
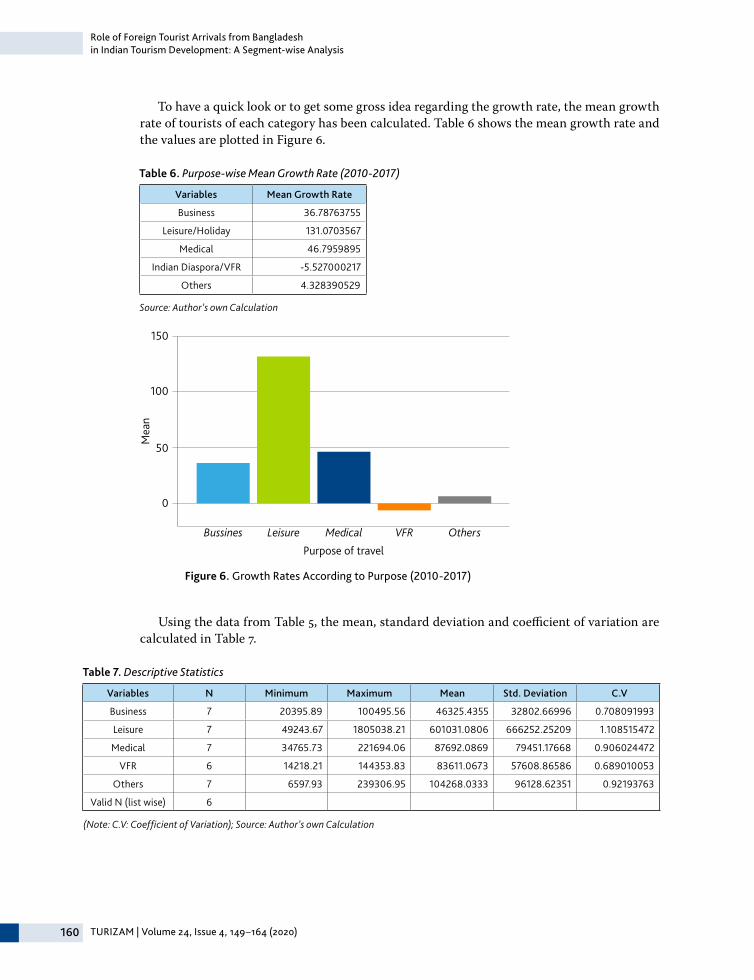
To have a quick look or to get some gross idea regarding the growth rate, the mean growth rate of tourists of each category has been calculated. Table 6 shows the mean growth rate and the values are plotted in Figure 6.
Table 6. Purpose-wise Mean Growth Rate (2010-2017)
Variables Mean Growth Rate
Business 36.78763755
Leisure/Holiday 131.0703567
Medical 46.7959895
Indian Diaspora/VFR -5.527000217
Others 4.328390529
Source: Author’s own Calculation
Using the data from Table 5, the mean, standard deviation and coefficient of variation are calculated in Table 7.
Table 7. Descriptive Statistics
Variables N Minimum Maximum Mean Std. Deviation C.V
Business 7 20395.89 100495.56 46325.4355 32802.66996 0.708091993
Leisure 7 49243.67 1805038.21 601031.0806 666252.25209 1.108515472
Medical 7 34765.73 221694.06 87692.0869 79451.17668 0.906024472
VFR 6 14218.21 144353.83 83611.0673 57608.86586 0.689010053
Others 7 6597.93 239306.95 104268.0333 96128.62351 0.92193763
Valid N (list wise) 6
(Note: C.V: Coefficient of Variation); Source: Author’s own Calculation
150
100
50
0
Mea
n
Purpose of travel
Bussines Leisure Medical VFR Others
Figure 6. Growth Rates According to Purpose (2010-2017)
TURIZAM | Volume 24, Issue 4, 149–164 (2020) 161
Rajaul Karim
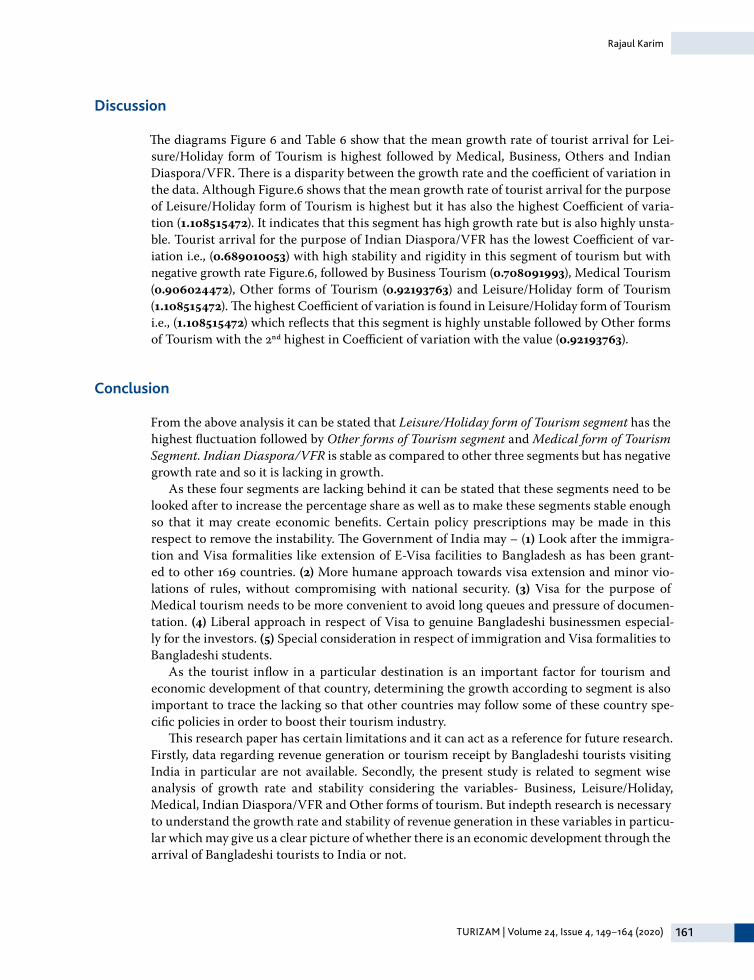
Discussion
The diagrams Figure 6 and Table 6 show that the mean growth rate of tourist arrival for Lei-sure/Holiday form of Tourism is highest followed by Medical, Business, Others and Indian Diaspora/VFR. There is a disparity between the growth rate and the coefficient of variation in the data. Although Figure.6 shows that the mean growth rate of tourist arrival for the purpose of Leisure/Holiday form of Tourism is highest but it has also the highest Coefficient of varia-tion (1.108515472). It indicates that this segment has high growth rate but is also highly unsta-ble. Tourist arrival for the purpose of Indian Diaspora/VFR has the lowest Coefficient of var-iation i.e., (0.689010053) with high stability and rigidity in this segment of tourism but with negative growth rate Figure.6, followed by Business Tourism (0.708091993), Medical Tourism (0.906024472), Other forms of Tourism (0.92193763) and Leisure/Holiday form of Tourism (1.108515472). The highest Coefficient of variation is found in Leisure/Holiday form of Tourism i.e., (1.108515472) which reflects that this segment is highly unstable followed by Other forms of Tourism with the 2nd highest in Coefficient of variation with the value (0.92193763).
Conclusion
From the above analysis it can be stated that Leisure/Holiday form of Tourism segment has the highest fluctuation followed by Other forms of Tourism segment and Medical form of Tourism Segment. Indian Diaspora/VFR is stable as compared to other three segments but has negative growth rate and so it is lacking in growth.
As these four segments are lacking behind it can be stated that these segments need to be looked after to increase the percentage share as well as to make these segments stable enough so that it may create economic benefits. Certain policy prescriptions may be made in this respect to remove the instability. The Government of India may – (1) Look after the immigra-tion and Visa formalities like extension of E-Visa facilities to Bangladesh as has been grant-ed to other 169 countries. (2) More humane approach towards visa extension and minor vio-lations of rules, without compromising with national security. (3) Visa for the purpose of Medical tourism needs to be more convenient to avoid long queues and pressure of documen-tation. (4) Liberal approach in respect of Visa to genuine Bangladeshi businessmen especial-ly for the investors. (5) Special consideration in respect of immigration and Visa formalities to Bangladeshi students.
As the tourist inflow in a particular destination is an important factor for tourism and economic development of that country, determining the growth according to segment is also important to trace the lacking so that other countries may follow some of these country spe-cific policies in order to boost their tourism industry.
This research paper has certain limitations and it can act as a reference for future research. Firstly, data regarding revenue generation or tourism receipt by Bangladeshi tourists visiting India in particular are not available. Secondly, the present study is related to segment wise analysis of growth rate and stability considering the variables- Business, Leisure/Holiday, Medical, Indian Diaspora/VFR and Other forms of tourism. But indepth research is necessary to understand the growth rate and stability of revenue generation in these variables in particu-lar which may give us a clear picture of whether there is an economic development through the arrival of Bangladeshi tourists to India or not.
162 TURIZAM | Volume 24, Issue 4, 149–164 (2020)
Role of Foreign Tourist Arrivals from Bangladesh in Indian Tourism Development: A Segment-wise Analysis
References
Aliqah, K.M.A., Al-rfou, A.N. 2010. The Role of Tourism Sector on Economic Development in Jordan during the Period 1990-2008. European Journal of Economics, Finance and Admin-istrative Sciences 18, 173-180.
Annual Report.2017-18. Ministry of Tourism, Government of India. Retrieved on 29th Febru-ary, 2020 from https://www.tourism.gov.in/.
Balaguer, J., Cantavella- Jorda, M. 2002. Tourism as a Long-Run Economic Growth Factor: The Spanish Case. Applied Economics 34(7), 877-884.
Bulgan, G., Maden, Işık., Yildirim, S. 2019. The Effect of Tourism Sector on Economic Growth: An Empirical Study on Turkey. Journal of Yaşar University 14(55), 215-225. doi: 10.19168/jyasar.529762
Cárdenas-García, P.J., Rivero, M.S., Pulido-Fernández, J.I. 2013. Does Tourism Growth Influence Economic Development?. Journal of Travel Research 54(2), 206- doi: 221. 10.1177/0047287513514297.
Du, D., Lew, A., Ng, P. 2014. Tourism and Economic Growth. Journal of Travel Research 55(4), 454-464. doi: 10.1177/0047287514563167.
Ekanayake, E.M, Long, A.E. 2012. Tourism Development and Economic Growth in Developing Countries. International Journal of Business and Finance Research 6(1), 51-63.
Implementation of e-Visa scheme for Tourist, Business and Medical purposes.2017.Bureau of Immigration, Ministry of Home Affairs, Government of India. Retrieved on 29th Febru-ary, 2020 from https://boi.gov.in/content/implementation-e-visa-scheme-tourist-busi-ness-and-medical-purposes-wef-01042017.
India Tourism Statistics Reports.2003-2018. Market Research Division, Ministry of Tourism, Government of India. Retrieved on 03rd March, 2020 from http://tourism.gov.in/mar-ket-research-and-statistics.
Jimenez, I.C., Pulina, M. 2010. Inbound Tourism and long-Run Economic Growth, Current Issues in Tourism 13(1), 61-74, DOI: 10.1080/13683500802684411
Kim, H.J., Chen, M.H., Jang, S. 2006. Tourism Expansion and Economic Development: The Case of Taiwan. Tourism Management 27(5), 925-933. doi:10.1016/j.tourman.2005.05.011.
Lee, C.C., Chang, C.P. 2008. Tourism Development and Economic Growth: A Closer Look at Panels. Tourism Management 29(1), 180-192. doi: 10.1016/j.tourman.2007.02.013.
Ohlan, R. 2017. The Relationship between Tourism, Financial Development and Economic Growth in India. Future Business Journal 3(1), 9-22. doi: 10.1016/j.fbj.2017.01.003.
Open Government Data (OGD) Platform India.2020. Government of India. Retrieved on 29th February, 2020 from https://data.gov.in/catalog/tourism-statistics india?filters%5Bfield_catalog_reference%5D=92149&format=json&offset=18&limit=6&sort%5Bcreated%5D=-desc.
Rout, H.B., Mishra, P.K., Pradhan, BB. 2016. Trend and Progress of Tourism in India: An Empir-ical Analysis. International Journal of Economic Research 13(5), 2265-2275.
Sinclair, M.T. 1998. Tourism and Economic Development: A Survey. Journal of Development Studies 34(5), 1-51. doi:10.1080/00220389808422535.
Study on Visit of Nationals of Bangladesh to India. 2018. Ministry of Tourism, Government of India. Retrieved on 03rd March, 2020 from http://tourism.gov.in/sites/default/files/Other/Final%20Report%20on%20Visit%20of%20Nationals%20of%20Bangladesh%20to%20India.pdf.
TURIZAM | Volume 24, Issue 4, 149–164 (2020) 163
Rajaul Karim
Travel and Tourism Economic Impact India. 2018. World Travel & Tourism Council (WTTC). Retrieved on 29th February, 2020 from https://www.wttc.org/economic-impact/coun-try-analysis/country-reports/.
Witt, S.F., Turner, L.W. 2002. Trends and Forecasts for Inbound Tourism to China. Journal of Travel & Tourism Marketing 13(1-2), 97-107. doi:10.1300/J073v13n01_07.
Zurub, H., Ionescu, A., Constantin,V. 2015. Measuring the Economic Impact of Tourism in European Emerging Markets.[Special Issue]. Procedia Economics and Finance 32. doi: 95-102. 10.1016/S2212-5671(15)01369-6.
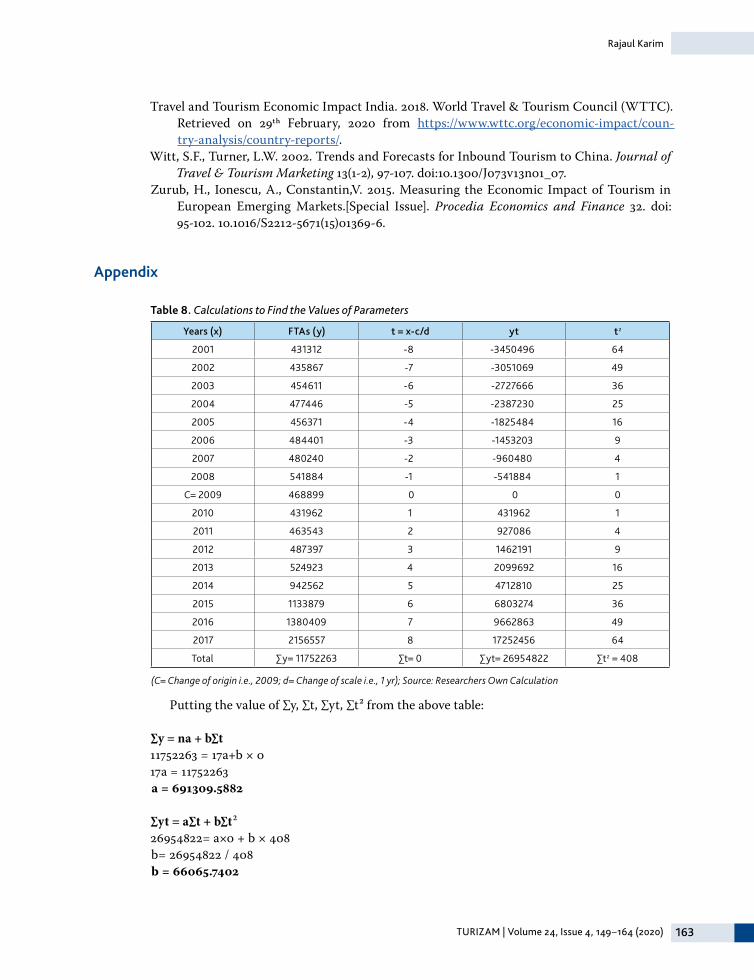
Appendix
Table 8. Calculations to Find the Values of Parameters
Years (x) FTAs (y) t = x-c/d yt t2
2001 431312 -8 -3450496 64
2002 435867 -7 -3051069 49
2003 454611 -6 -2727666 36
2004 477446 -5 -2387230 25
2005 456371 -4 -1825484 16
2006 484401 -3 -1453203 9
2007 480240 -2 -960480 4
2008 541884 -1 -541884 1
C= 2009 468899 0 0 0
2010 431962 1 431962 1
2011 463543 2 927086 4
2012 487397 3 1462191 9
2013 524923 4 2099692 16
2014 942562 5 4712810 25
2015 1133879 6 6803274 36
2016 1380409 7 9662863 49
2017 2156557 8 17252456 64
Total ∑y= 11752263 ∑t= 0 ∑yt= 26954822 ∑t2 = 408
(C= Change of origin i.e., 2009; d= Change of scale i.e., 1 yr); Source: Researchers Own Calculation
Putting the value of ∑y, ∑t, ∑yt, ∑t² from the above table:
∑y = na + b∑t 11752263 = 17a+b × 0 17a = 11752263 a = 691309.5882
∑yt = a∑t + b∑t2 26954822= a×0 + b × 408 b= 26954822 / 408 b = 66065.7402
164 TURIZAM | Volume 24, Issue 4, 149–164 (2020)
Role of Foreign Tourist Arrivals from Bangladesh in Indian Tourism Development: A Segment-wise Analysis
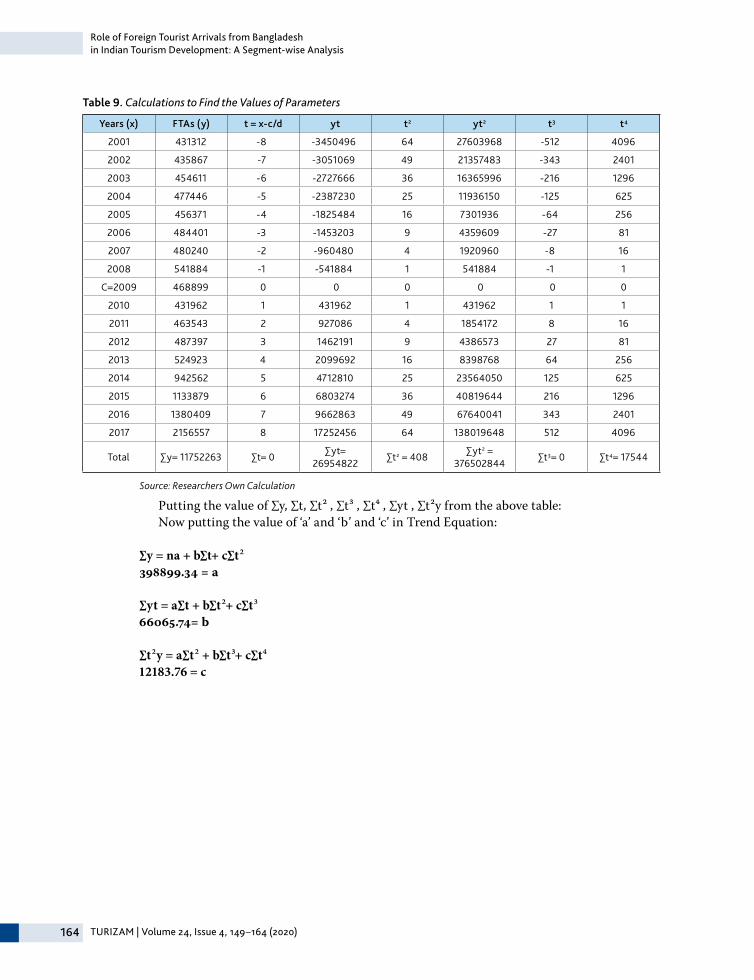
Table 9. Calculations to Find the Values of Parameters
Years (x) FTAs (y) t = x-c/d yt t2 yt2 t3 t4
2001 431312 -8 -3450496 64 27603968 -512 4096
2002 435867 -7 -3051069 49 21357483 -343 2401
2003 454611 -6 -2727666 36 16365996 -216 1296
2004 477446 -5 -2387230 25 11936150 -125 625
2005 456371 -4 -1825484 16 7301936 -64 256
2006 484401 -3 -1453203 9 4359609 -27 81
2007 480240 -2 -960480 4 1920960 -8 16
2008 541884 -1 -541884 1 541884 -1 1
C=2009 468899 0 0 0 0 0 0
2010 431962 1 431962 1 431962 1 1
2011 463543 2 927086 4 1854172 8 16
2012 487397 3 1462191 9 4386573 27 81
2013 524923 4 2099692 16 8398768 64 256
2014 942562 5 4712810 25 23564050 125 625
2015 1133879 6 6803274 36 40819644 216 1296
2016 1380409 7 9662863 49 67640041 343 2401
2017 2156557 8 17252456 64 138019648 512 4096
Total ∑y= 11752263 ∑t= 0∑yt=
26954822∑t2 = 408
∑yt2 = 376502844
∑t3= 0 ∑t4= 17544
Source: Researchers Own Calculation
Putting the value of ∑y, ∑t, ∑t² , ∑t3 , ∑t4 , ∑yt , ∑t²y from the above table:Now putting the value of ‘a’ and ‘b’ and ‘c’ in Trend Equation:
∑y = na + b∑t+ c∑t2 398899.34 = a
∑yt = a∑t + b∑t2+ c∑t3 66065.74= b
∑t2y = a∑t2 + b∑t3+ c∑t4 12183.76 = c


![Fw: [TELKOMNIKA] #5993: Foreign Tourist Arrivals ... K G Darmaputra Fw: [TELKOMNIKA] #5993: Foreign Tourist Arrivals Forecasting Using Recurrent Neural](https://img.pdfslide.net/doc/110x75/5af6521d7f8b9a8d1c8ec261/fw-telkomnika-5993-foreign-tourist-arrivals-k-g-darmaputra-ikgdarmaputraunudacid.jpg)