Embed Size (px)
Citation preview
Origins and Impacts of New Mammalian Exons
The MIT Faculty has made this article openly available. Please share how this access benefits you. Your story matters.
Citation Merkin, Jason J. et al. “Origins and Impacts of New MammalianExons.” Cell Reports (2015): n. pag.
As Published http://dx.doi.org/10.1016/j.celrep.2015.02.058
Publisher Elsevier
Version Final published version
Citable link http://hdl.handle.net/1721.1/96260
Terms of Use Creative Commons Attribution-NonCommercial-NoDerivs 3.0Unported License
Detailed Terms http://creativecommons.org/licenses/by-nc-nd/3.0/
Article
Origins and Impacts of New Mammalian Exons
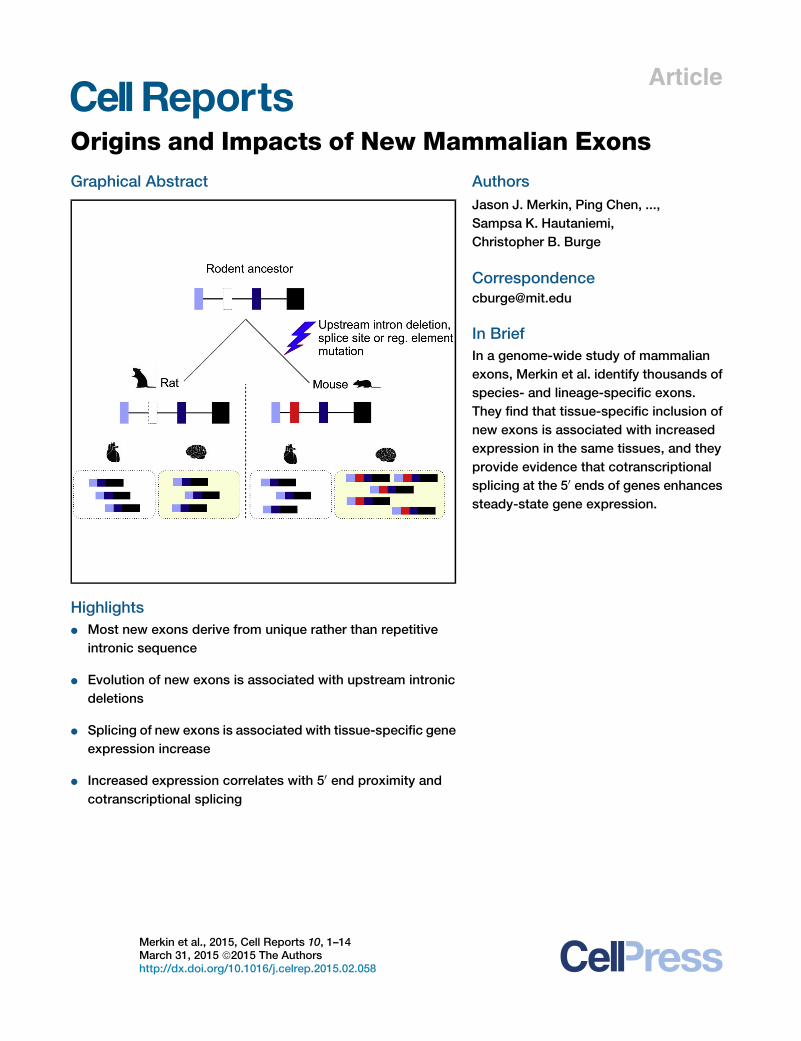
Graphical Abstract
Highlights
d Most new exons derive from unique rather than repetitive
intronic sequence
d Evolution of new exons is associated with upstream intronic
deletions
d Splicing of new exons is associated with tissue-specific gene
expression increase
d Increased expression correlates with 50 end proximity and
cotranscriptional splicing
Authors
Jason J. Merkin, Ping Chen, ...,
Sampsa K. Hautaniemi,
Christopher B. Burge
In Brief
In a genome-wide study of mammalian
exons, Merkin et al. identify thousands of
species- and lineage-specific exons.
They find that tissue-specific inclusion of
new exons is associated with increased
expression in the same tissues, and they
provide evidence that cotranscriptional
splicing at the 50 ends of genes enhances
steady-state gene expression.
Merkin et al., 2015, Cell Reports 10, 1–14March 31, 2015 ª2015 The Authorshttp://dx.doi.org/10.1016/j.celrep.2015.02.058
Cell Reports
Article
Origins and Impacts of NewMammalian ExonsJason J. Merkin,1,4 Ping Chen,3,4 Maria S. Alexis,1,2 Sampsa K. Hautaniemi,3 and Christopher B. Burge1,2,*1Departments of Biology and Biological Engineering2Program in Computational and Systems Biology
Massachusetts Institute of Technology, Cambridge, MA 02142, USA3Research Programs Unit, Genome-Scale Biology and Institute of Biomedicine, University of Helsinki, 00014 Helsinki, Finland4Co-first author*Correspondence: [email protected]
http://dx.doi.org/10.1016/j.celrep.2015.02.058
This is an open access article under the CC BY-NC-ND license (http://creativecommons.org/licenses/by-nc-nd/3.0/).
SUMMARY
Mammalian genes are composed of exons, but theevolutionary origins and functions of new internalexons are poorly understood. Here, we analyzed pat-terns of exon gain using deep cDNA sequencing datafrom five mammals and one bird, identifying thou-sands of species- and lineage-specific exons. Mostnew exons derived from unique rather than repeti-tive intronic sequence. Unlike exons conservedacross mammals, species-specific internal exonswere mostly located in 50 UTRs and alternativelyspliced. They were associated with upstream in-tronic deletions, increased nucleosome occupancy,and RNA polymerase II pausing. Genes containingnew internal exons had increased gene expression,but only in tissues in which the exon was included.Increased expression correlated with the level ofexon inclusion, promoter proximity, and signaturesof cotranscriptional splicing. Altogether, these find-ings suggest that increased splicing at the 50 endsof genes enhances expression and that changes in50 end splicing alter gene expression between tissuesand between species.
INTRODUCTION
The split structure of eukaryotic genes enables evolutionary
changes, such as exon gain or loss, that are not possible in pro-
karyotes but may contribute to changes in protein domain struc-
ture (Patthy, 2003). The evolutionary gain and loss of introns and
exons from genes has been studied in various lineages. Intron
gain by unknownmechanisms has been detected in nematodes,
fungi, and elsewhere (Kiontke et al., 2004; Nielsen et al., 2004),
but is rare or nonexistent in mammals, while intron loss has
been observed in many lineages (Roy et al., 2003). Similarly,
exon loss is detected in various lineages, by mechanisms
including genomic deletions and mutational disabling of splice
sites (Alekseyenko et al., 2007). Exons also have been gained
during evolution by various means, including exon duplication
(Kondrashov and Koonin, 2001) and acquisition of splice sites
and exonic features by an intronic segment (Alekseyenko et al.,
2007). The latter process has been most fully characterized for
primate-specific exons that have arisen from transposable ele-
ments of the Alu family (Lev-Maor et al., 2003; Sorek et al., 2004).
The functional consequences of changes in mRNA splicing
patterns can be diverse and have beenmost widely documented
for cases of alternative splicing. For example, inclusion or exclu-
sion of an exon can alter the DNA binding affinity of a transcrip-
tion factor (Gabut et al., 2011), convert amembrane protein into a
soluble protein (Izquierdo et al., 2005), or alter activity and allo-
steric regulation of an enzyme (Christofk et al., 2008). Evolu-
tionary gain and loss of exons have likely given rise to a similar
spectrum of protein functional changes.
Acquisition or loss of an intron also can impact mRNA func-
tion. For example, insertion of an intron into a previously in-
tronless expression construct often enhances expression, by
severalfold (or more) in both plant and animal systems, a phe-
nomenon known as intron-mediated enhancement (Callis et al.,
1987; Nott et al., 2003), and intronless genes are expressed at
lower levels overall (Shabalina et al., 2010). Some effects of in-
trons on mRNA decay (Sureau et al., 2001) or localization (Ha-
chet and Ephrussi, 2004) have been linked to the exon junction
complex (EJC), a protein complex deposited just upstream of
each exon-exon junction in metazoans that can contribute to
mRNA export, translation, and stability (Lu and Cullen, 2003;
Nott et al., 2003).
Much of what is known about the evolution of mammalian
exons has come from the analysis of cDNA fragments known
as expressed sequence tags (ESTs). Available EST databases
from human and mouse have depths of several million se-
quences. EST data have certain limitations and biases, including
uneven coverage across species (greatest in human andmouse,
lower in most others), bias toward cancer in human data, and
bias toward brain tissues in mouse, making it difficult to reliably
assess splicing in normal tissues or to compare between
species (Modrek and Lee, 2003; Roy et al., 2005; Zhang and
Chasin, 2006). These issues have contributed to disparities
among studies, with reported levels of conservation of alterna-
tive splicing between human and mouse ranging from about
one-quarter to over three-quarters, depending on the approach
that was used (reviewed by [Lareau et al., 2004]), and EST esti-
mates of the fraction of mammalian exons that derive from trans-
posable elements (TEs) ranging from less than 10% in mouse
(Wang et al., 2005) to more than 90% in primates (Zhang and
Chasin, 2006).
Cell Reports 10, 1–14, March 31, 2015 ª2015 The Authors 1
Please cite this article in press as: Merkin et al., Origins and Impacts of New Mammalian Exons, Cell Reports (2015), http://dx.doi.org/10.1016/j.cel-rep.2015.02.058
(legend on next page)
2 Cell Reports 10, 1–14, March 31, 2015 ª2015 The Authors
Subsequent studies increased the number of species and
evolutionary distances considered and used phylogenetic infor-
mation to classify exons by age (Zhang and Chasin, 2006; Alek-
seyenko et al., 2007). However, splicing patterns in the added
species generally had to be inferred from multi-species
genomic alignments, using the presence/absence of AG/GT
splice site dinucleotides (which are generally necessary but
not sufficient for splicing) to infer splicing/non-splicing of exons,
because EST databases were limited or absent from many
species. However, using comprehensive RNA sequencing
(RNA-seq) data, we observed that the presence of AG/GT is
not highly predictive of splicing; about half of the exons ex-
pressed in mouse, but not rat, had AG/GT sequences in rat,
while the other half did not (Figure 1). These data imply that
exon age classifications based on comparative genomics alone
are unreliable, raising questions about conclusions reached us-
ing this approach.
Only recently has deep RNA-seq analysis been performed
systematically across a range of tissues in diverse mammalian
species, enabling comprehensive and reliable inference of the
phylogenetic distribution of splicing events (Barbosa-Morais
et al., 2012; Merkin et al., 2012). In one we performed RNA-
seq analysis of nine diverse organs from four mammals and
one bird, in biological triplicate (Merkin et al., 2012). The
much deeper coverage provided by this RNA-seq dataset—bil-
lions of reads totaling hundreds of billions of bases (gigabases)
for each species, versus millions of sequences totaling at most
a few gigabases per species for EST data, and the much more
uniform distribution across tissues and species—make it much
better suited for evolutionary comparisons. The datasets used
here and in several previous evolutionary analyses are listed
in Table S1. In our previous study, we considered exons
conserved across mammals and birds, analyzing changes in
tissue-specific splicing patterns and conversion between
constitutive and alternative splicing. Here we used these
RNA-seq data to identify species- and lineage-specific exons,
and we assessed their origins, the types of mutations that
create them, and their impacts on host genes. Our analyses
challenge some previous finding based on EST analyses, un-
cover an unanticipated role for intronic deletions in exon crea-
tion, and provide evidence for a widespread impact of splicing
changes on tissue- and species-specific differences in gene
expression.
RESULTS
Identification of Thousands of Species- and Lineage-Specific ExonsWe combined genomic mappings of our mammalian RNA-seq
data with whole-genome alignments to classify exons as spe-
cies-specific, lineage-specific (e.g., unique to rodents, to pri-
mates, or to mammals), or ancient (present in both mammals
and birds) (Experimental Procedures). These classifications
were applied at both the genomic sequence level (genomic age)
andat the transcript level (splicing age) (Figure 1A),with sequence
coverage requirements described in the Supplemental Experi-
mental Procedures. Because our primary focus was splicing, we
analyzed internal exons, which are regulated by the splicing ma-
chinery, rather than first or last exons, which are generally regu-
lated by the transcription or cleavage/polyadenylationmachinery,
respectively.We also excluded several thousand exons that likely
arose from intra-genic duplications, because this class has been
thoroughly studied and is fairly well understood (Kondrashov
and Koonin, 2001; Gao and Lynch, 2009). Using the principle of
parsimony, we assigned both a genomic age and a splicing age
to�60,000 internal exons, restricting our analysis to unduplicated
protein-codinggenesconservedacross thesespecies to facilitate
accurate read mapping and assignment of orthology. Here
genomicageestimates thedurationoverwhich sequencessimilar
to the exonwere present in ancestral genomes, while splicing age
estimates the duration over which these sequences were spliced
into mRNAs, based on the RNA-seq data.
Most exons in the analyzed genes predated the split between
birds and mammals (�300 million years ago, Mya) in their
splicing age (87%) and genomic age (90%). Such exons are
designated MRQCG using a one-letter code for the five organ-
isms: M, present in mouse; R, present in rat; Q, present in ma-
caque; C, present in cow; and G, present inGallus (chicken) (Fig-
ure 1C). However, we found that creation of novel exons has
occurred fairly often during mammalian evolution. For example,
we classified 1,089mouse exons asmouse-specific (designated
M––––, with � indicating absence from an organism), as they
were detected in RNA-seq data from mouse but not from any
other species (Figure 1C), with 1,571 new exons in rat, and
1,417 in macaque. Exons in each species, most of which
were previously annotated, are listed in Table S2; examples
are given below. Much larger numbers of exons were observed
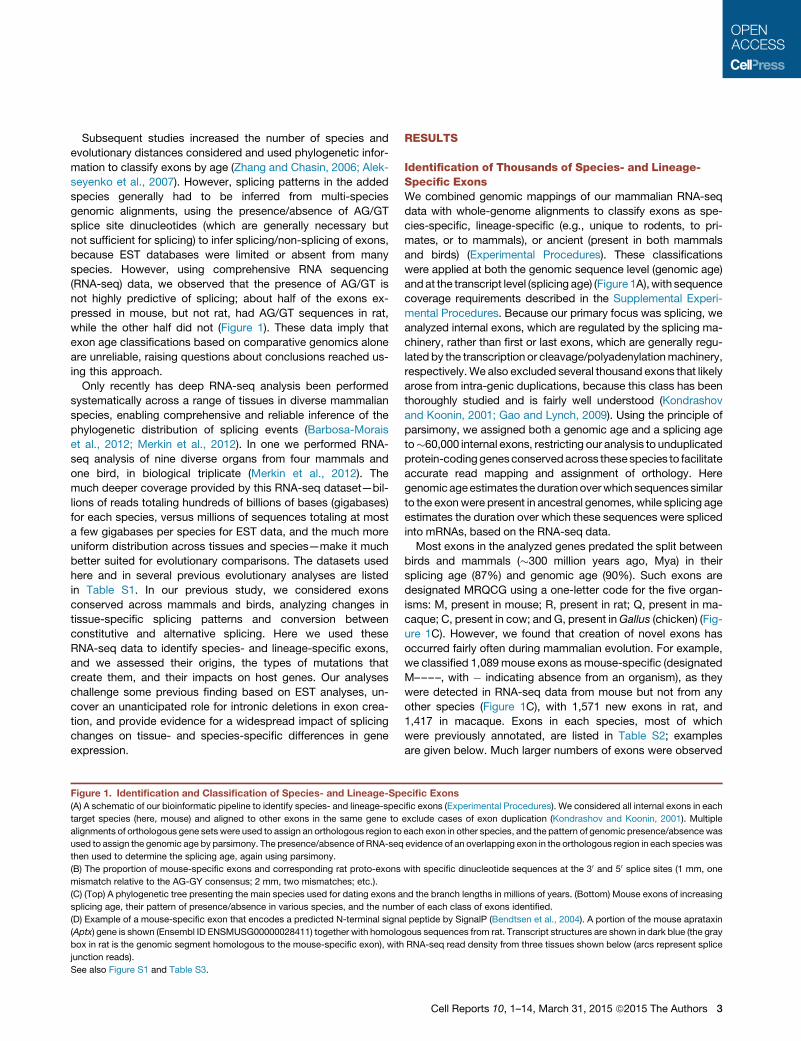
Figure 1. Identification and Classification of Species- and Lineage-Specific Exons
(A) A schematic of our bioinformatic pipeline to identify species- and lineage-specific exons (Experimental Procedures). We considered all internal exons in each
target species (here, mouse) and aligned to other exons in the same gene to exclude cases of exon duplication (Kondrashov and Koonin, 2001). Multiple
alignments of orthologous gene sets were used to assign an orthologous region to each exon in other species, and the pattern of genomic presence/absence was
used to assign the genomic age by parsimony. The presence/absence of RNA-seq evidence of an overlapping exon in the orthologous region in each species was
then used to determine the splicing age, again using parsimony.
(B) The proportion of mouse-specific exons and corresponding rat proto-exons with specific dinucleotide sequences at the 30 and 50 splice sites (1 mm, one
mismatch relative to the AG-GY consensus; 2 mm, two mismatches; etc.).
(C) (Top) A phylogenetic tree presenting the main species used for dating exons and the branch lengths in millions of years. (Bottom) Mouse exons of increasing
splicing age, their pattern of presence/absence in various species, and the number of each class of exons identified.
(D) Example of a mouse-specific exon that encodes a predicted N-terminal signal peptide by SignalP (Bendtsen et al., 2004). A portion of the mouse aprataxin
(Aptx) gene is shown (Ensembl ID ENSMUSG00000028411) together with homologous sequences from rat. Transcript structures are shown in dark blue (the gray
box in rat is the genomic segment homologous to the mouse-specific exon), with RNA-seq read density from three tissues shown below (arcs represent splice
junction reads).
See also Figure S1 and Table S3.
Cell Reports 10, 1–14, March 31, 2015 ª2015 The Authors 3
for phylogenetic distributions involving single exon gain and loss
events than for those requiring multiple gains/losses (Table S3).
The estimated false discovery rate (FDR) for new exons was
�1.5%. This value was estimated using the approach of Nielsen
et al. (2004), in which the rates of gain and loss of a feature (exons
here, introns in the previous study) along each branch of a phylo-
genetic tree are estimated by maximum likelihood from the
counts of each phylogenetic pattern of presence/absence, and
used to estimate an FDR as the frequency with which parsimony
assigns an incorrect age (i.e., an apparent exon gain actually re-
sulted from multiple losses).
Mouse-specific exons were assigned an age of <25My, corre-
sponding to the time of divergence between mouse and rat.
We also identified �7,000 mouse exons whose splicing was
restricted to mammals or to particular mammalian lineages (Fig-
ure 1C). Overall, the presence of one or more mouse- or rodent-
specific exons was detected in 17% of the �6,300 genes
analyzed. An example of a mouse-specific exon that is predicted
to encode a signal peptide and supporting RNA-seq data in
mouse and rat are shown in Figure 1D (see also Figure S1A).
To ask whether species-specific exons occurred at a similar
frequency in human, we compared our data to corresponding
tissue RNA-seq data from the Illumina Human Body Map 2.0 da-
taset (Bradley et al., 2012). In the human tissue dataset, which
included more tissues sequenced at lower depth, we identified
comparable numbers of exons at each splicing age (Figure S1B),
including 2,073 human-specific exons (not observed even in ma-
caque) occurring in 25% of analyzed human genes. Overall,
when comparing human genes to their mouse orthologs, we
observed that 35% of ortholog pairs differ by the presence/
absence of one or more exons. The prevalence of such spe-
cies-specific exons could contribute to functional differences
between human and mouse orthologs, complicating extrapola-
tions from mouse models to human phenotypes, though this
possibility remains to be explored.
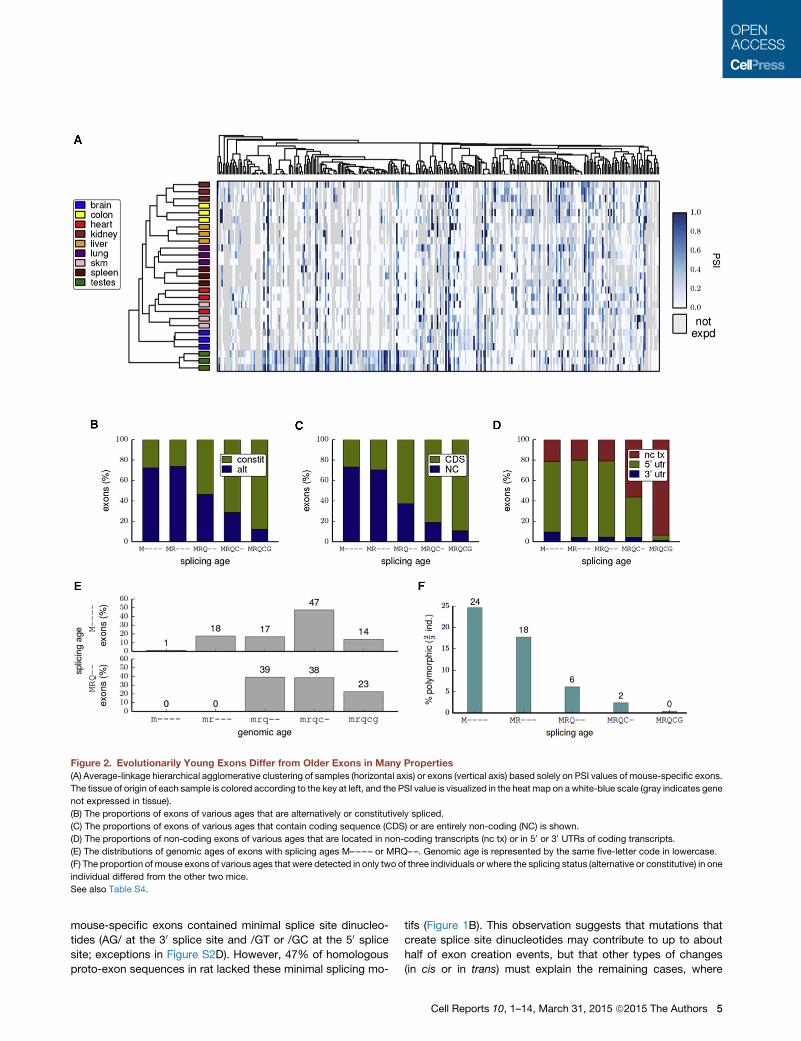
We performed clustering of tissue samples, based on tissue-
specific splicing patterns of species-specific exons, using the
standard percent spliced in (PSI) measure, which assesses the
fraction of a gene’s mRNAs that include the exon (Experimental
Procedures). This analysis revealed robust clustering by tissue
of origin across the three mouse strains analyzed (Figure 2A),
with the partial exception of (developmentally related) cardiac
and skeletal muscle. Many species-specific alternative exons
showed predominant inclusion in testis (Figure 2A). These obser-
vations suggest a possible role for germ cell transcription in exon
creation, perhaps related to mutations associated with open
chromatin and/or transcription-coupled DNA repair (Marques
et al., 2005; Levine et al., 2006).
Exons of different evolutionary ages had dramatically different
properties. Mouse-specific and other species-specific exons
were mostly alternatively spliced, non-coding, and located in
50 UTRs (Figures 2B–2D). Moreover, increasing exon age was
consistently associated with constitutive splicing and location
within the coding region (Modrek and Lee, 2003; Zhang and
Chasin, 2006). No enrichment for non-generic categories was
observed for the set of genes containing species-specific coding
exons (Table S4), suggesting that exon creation occurs with
reasonable frequency in diverse types of genes.
To understand the effects of exon inclusion on protein function
usually requires extensive experimental analysis. However, func-
tional impact could be inferred in somecases, such as newexons
that encode a predicted signal peptide (Figure 1D) or add a pre-
dicted transmembrane domain (Figure S1A). These two protein
motifs have relatively relaxed sequence requirements empha-
sizing hydrophobicity, suggesting they can evolve quickly.
Most Species-Specific Exons Arose from UniqueIntronic SequencesConsidering the genomic ages of recently created exons,
approximately 1% of mouse-specific exons arose in sequence
detected only in mouse, while 75% of mouse-specific exons
arose in sequence that predates the rodent-primate split,
despite being spliced exclusively as intron in the other species
studied; the remaining 24%were alignable to rat only (Figure 2E).
Exons with rodent-specific or rodent/primate-specific splicing
also could often be aligned to cow or chicken (Figure 2E; data
not shown). Some mouse-specific exons were detected in just
two of the three mouse strains analyzed (Figure 2F).
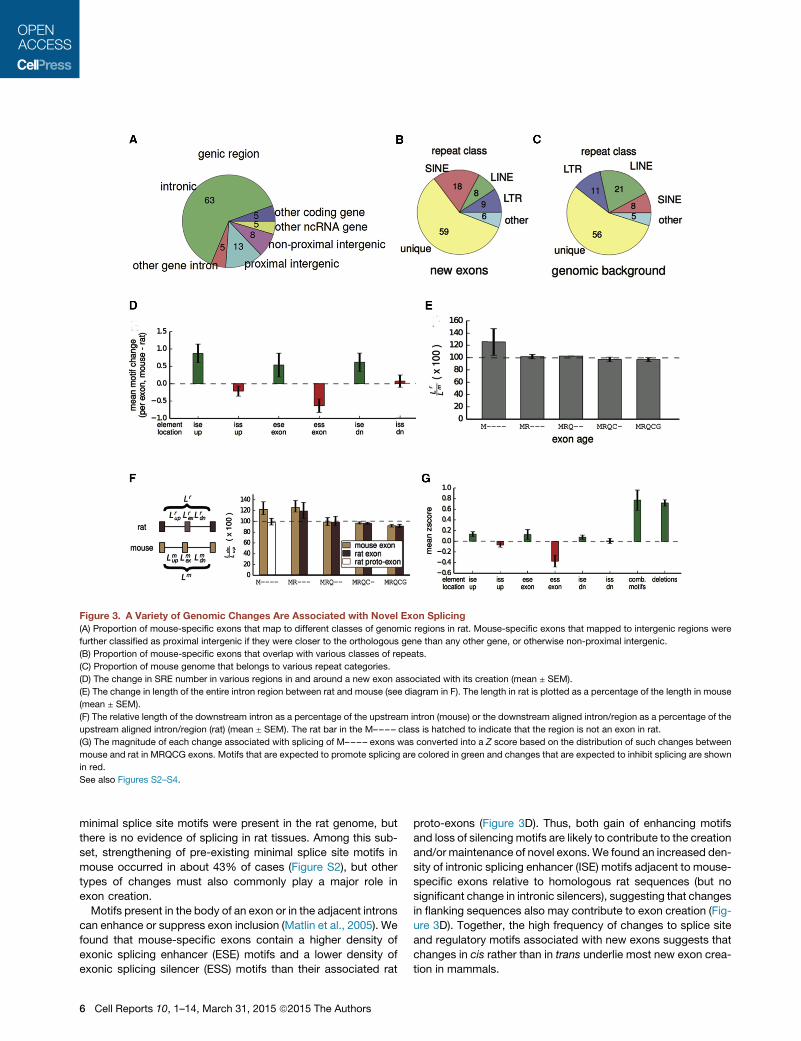
Notably, we observed that more than 60% of new internal
exons in mouse are derived from unique intronic sequence. In
most cases, these exons aligned to sequences in the ortholo-
gous intron in rat (Figure 3A). Applying a similar approach to
identify new human exons, using criteria designed to allow map-
ping to repetitive elements (Experimental Procedures), yielded a
similarly high proportion of uniquemapping (�54%) (Figure S2A).
Alu elements, a class of primate-specific SINE repeats, previ-
ously have been implicated as a major source of new exons in
primates (Sorek et al., 2002; Lev-Maor et al., 2003), and an
EST-based study concluded that a majority of new human exons
are repeat derived (Zhang and Chasin, 2006). Here we found
that �19% of exons classified as human-specific overlap with
Alus (Figure S2A). A similar proportion of mouse-specific exons
(�18%) overlapped with rodent B elements (Figure 3B), also
above the background genomic frequency of SINEs in this line-
age (Figure 3C; Figure S2B). Thus, we found that SINEs have
contributed to new exon creation to a similar extent in the rodent
lineage as in primates (Sela et al., 2007). Many newmouse exons
derived from B1 SINE elements aligned to the same positions
relative to the antisense B1 consensus (Figure S2C), consistent
with previous studies (Sela et al., 2007).
Our findings indicate that SINEs have contributed 2- to 3-fold
fewer new exons than unique genomic sequences in both ro-
dents and primates, contrasting with some previous reports
(Zhang and Chasin, 2006). The differences in conclusions pre-
sumably result from differences in data sources and methods
(e.g., biases in EST coverage of species, tissues, and normal
versus disease states). Other types of repetitive elements
(LINEs, LTRs, and others) together have contributed comparable
numbers of species-specific exons as SINEs in both human and
mouse (Figure 3B; Figure S2A).
Altered SplicingMotifs and Shortened Upstream IntronsAre Associated with Exon CreationMutations that create or disrupt splice site motifs frequently
cause changes in splicing patterns over evolutionary time pe-
riods (Lev-Maor et al., 2003; Bradley et al., 2012). Almost all
4 Cell Reports 10, 1–14, March 31, 2015 ª2015 The Authors
mouse-specific exons contained minimal splice site dinucleo-
tides (AG/ at the 30 splice site and /GT or /GC at the 50 splicesite; exceptions in Figure S2D). However, 47% of homologous
proto-exon sequences in rat lacked these minimal splicing mo-
tifs (Figure 1B). This observation suggests that mutations that
create splice site dinucleotides may contribute to up to about
half of exon creation events, but that other types of changes
(in cis or in trans) must explain the remaining cases, where
Figure 2. Evolutionarily Young Exons Differ from Older Exons in Many Properties
(A) Average-linkage hierarchical agglomerative clustering of samples (horizontal axis) or exons (vertical axis) based solely on PSI values of mouse-specific exons.
The tissue of origin of each sample is colored according to the key at left, and the PSI value is visualized in the heat map on awhite-blue scale (gray indicates gene
not expressed in tissue).
(B) The proportions of exons of various ages that are alternatively or constitutively spliced.
(C) The proportions of exons of various ages that contain coding sequence (CDS) or are entirely non-coding (NC) is shown.
(D) The proportions of non-coding exons of various ages that are located in non-coding transcripts (nc tx) or in 50 or 30 UTRs of coding transcripts.
(E) The distributions of genomic ages of exons with splicing ages M–––– or MRQ––. Genomic age is represented by the same five-letter code in lowercase.
(F) The proportion of mouse exons of various ages that were detected in only two of three individuals or where the splicing status (alternative or constitutive) in one
individual differed from the other two mice.
See also Table S4.
Cell Reports 10, 1–14, March 31, 2015 ª2015 The Authors 5
minimal splice site motifs were present in the rat genome, but
there is no evidence of splicing in rat tissues. Among this sub-
set, strengthening of pre-existing minimal splice site motifs in
mouse occurred in about 43% of cases (Figure S2), but other
types of changes must also commonly play a major role in
exon creation.
Motifs present in the body of an exon or in the adjacent introns
can enhance or suppress exon inclusion (Matlin et al., 2005). We
found that mouse-specific exons contain a higher density of
exonic splicing enhancer (ESE) motifs and a lower density of
exonic splicing silencer (ESS) motifs than their associated rat
proto-exons (Figure 3D). Thus, both gain of enhancing motifs
and loss of silencing motifs are likely to contribute to the creation
and/or maintenance of novel exons. We found an increased den-
sity of intronic splicing enhancer (ISE) motifs adjacent to mouse-
specific exons relative to homologous rat sequences (but no
significant change in intronic silencers), suggesting that changes
in flanking sequences also may contribute to exon creation (Fig-
ure 3D). Together, the high frequency of changes to splice site
and regulatory motifs associated with new exons suggests that
changes in cis rather than in trans underlie most new exon crea-
tion in mammals.
Figure 3. A Variety of Genomic Changes Are Associated with Novel Exon Splicing
(A) Proportion of mouse-specific exons that map to different classes of genomic regions in rat. Mouse-specific exons that mapped to intergenic regions were
further classified as proximal intergenic if they were closer to the orthologous gene than any other gene, or otherwise non-proximal intergenic.
(B) Proportion of mouse-specific exons that overlap with various classes of repeats.
(C) Proportion of mouse genome that belongs to various repeat categories.
(D) The change in SRE number in various regions in and around a new exon associated with its creation (mean ± SEM).
(E) The change in length of the entire intron region between rat and mouse (see diagram in F). The length in rat is plotted as a percentage of the length in mouse
(mean ± SEM).
(F) The relative length of the downstream intron as a percentage of the upstream intron (mouse) or the downstream aligned intron/region as a percentage of the
upstream aligned intron/region (rat) (mean ± SEM). The rat bar in the M–––– class is hatched to indicate that the region is not an exon in rat.
(G) The magnitude of each change associated with splicing of M–––– exons was converted into a Z score based on the distribution of such changes between
mouse and rat in MRQCG exons. Motifs that are expected to promote splicing are colored in green and changes that are expected to inhibit splicing are shown
in red.
See also Figures S2–S4.
6 Cell Reports 10, 1–14, March 31, 2015 ª2015 The Authors
Examining the rates of nucleotide divergence between rat and
mouse for mouse exons of different evolutionary ages revealed
an interesting pattern (Figure S3A). While ancient exons ex-
hibited the expected pattern of lower divergence in exons than
introns, and even lower divergence in core splice site motifs,
mouse-specific exons showed a distinct pattern in which the
central portion of the exon actually diverged more rapidly than
the flanking intron sequence (which is likely evolving neutrally).
This enhanced divergence suggests the existence of positive se-
lection on new exons, perhaps to tune their inclusion levels or
optimize their protein-coding or UTR sequence properties.
Intron length is associated with several splicing properties,
and longer flanking introns tend to be associated with lower in-
clusion levels of alternative exons (Yeo et al., 2005). We therefore
asked whether species-specific exons were associated with
changes in intron length. Notably, we found that the distance
between the exons flanking M–––– exons was shorter on
average than that flanking homologous rat proto-exons (rat dis-
tance exceeded mouse by 1.3-fold on average; interquartile
range: 0.9-fold to 1.7-fold; Figure 3E). The distance between
the exons flanking –R––– exons was even more biased, with
exons flankingmouse proto-exons longer by 1.7-fold on average
(Figure S3B). These observations suggest that substantial
changes in intron length often accompany exon creation.
Comparing the lengths of the upstream and downstream introns
flanking species-specific exons, we observed that the intron
downstream of M–––– exons was 1.2-fold longer on average
than the upstream intron, compared to no difference between
the regions flanking rat proto-exons (Figure 3F), with a somewhat
smaller effect observed for –R––– exons (Figure S3C). In rodent-
specific exons, a similar bias toward the presence of a longer
downstream intron was observed in both mouse and rat. Com-
parison to an outgroup (macaque) indicated that the differences
in flanking intron length most often reflect upstream deletions
rather than downstream insertions in the rodent that acquired a
new exon (Figures S3D and S3E). Older groups of exons showed
no such bias, suggesting that exons may acquire tolerance for
expansion of the upstream intron over time as other splicing de-
terminants strengthen. Together, these data argue that deletions
upstream of proto-exons favor the creation and/or maintenance
of novel exons. Previously, shortening of an upstream intron was
associated with enhancement of exon inclusion in aminigene re-
porter context (Fox-Walsh et al., 2005), perhaps by enhancing
intron definition or exon juxtaposition following exon definition,
but the generality of this effect and its evolutionary impact
have not been explored.
To compare the relative magnitudes of genomic changes
associated with species-specific exons, we converted them all
to Z scores, scaled by the SD of the differences observed be-
tween homologous mouse and rat ancient (MRQCG) exons.
Each sequence motif type had a relatively small Z score (<0.4).
However, upstream intronic deletions had an average Z score
of 0.75, comparable to the sum of the Z scores of all sequence
motifs analyzed (Figure 3G). This observation suggests that up-
stream intronic deletions may contribute to exon creation to a
similar extent as changes in known classes of splicing regulatory
elements (SREs; see also Figure S4 and Supplemental Experi-
mental Procedures). New exons associated with upstream in-
tronic deletions had a similar distribution of splice site dinu-
cleotides as other new exons, but lacked the increased ESE
frequency observed for other new exons (Figure S4). This obser-
vation is consistent with a model in which upstream intron short-
ening promotes exon inclusion to such an extent that selective
pressure to create or preserve ESEs is relaxed.
Upstream Indels Are Associated with NucleosomeOccupancy and RNA Pol II Pausing over Novel ExonsPrevious studies have suggested functional links between nucle-
osomes and splicing. Nucleosomes are often positioned near the
centers of internal exons, exon-associated nucleosomes have
higher density of the H3K36me3 histone modification (Schwartz
et al., 2009; Spies et al., 2009), and histone modifications
can impact recruitment of splicing factors (Luco et al., 2010).
Conceivably, insertions/deletions (indels) in flanking introns,
such as those in Figures 3E and 3F, might impact splicing by
altering nucleosome positioning near an exon. To explore this
possibility, we used published micrococcal nuclease (MNase)-
sequencing data from digestion of chromatin to identify nucleo-
some-protected regions in the vicinity of mouse-specific exons.
We observed a stronger enrichment for nucleosome positioning
over those mouse-specific exons that had shortened upstream
introns (relative to rat) compared to ancient exons, or to
mouse-specific exons without upstream shortening, or tomouse
proto-exons orthologous to rat-specific exons (Figure 4A; p <
10�4 for all three comparisons by Kolmogorov-Smirnov [KS]
test). This association suggested a connection between up-
stream deletions and changes in nucleosome positions. While
indels in either the upstream or downstream intron could poten-
tially impact nucleosome positioning on an exon, upstream dele-
tions may be more likely than other types of indels to promote
exon inclusion because a shorter intron promotes intron defini-
tion or exon juxtaposition, possibly augmented by effects on
exon-proximal nucleosome positioning.
We hypothesized that changes promoting stronger nucleo-
some positioning on novel exons might slow polymerase
elongation (Bentley, 2014) and thereby act to promote splicing
(Gunderson et al., 2011; Zhou et al., 2011; Ip et al., 2011). To
test this hypothesis, we used global run-on-sequencing (GRO-
seq) data, which detect nascent transcription, from a recent
study (Kaikkonen et al., 2013). We observed a strong GRO-seq
peak over ancient exons, almost twice the background level
(Figure 4B; p < 10�4, KS test), suggesting that polymerases
decelerate by roughly 2-fold while transcribing through these
exons; much smaller effects in this direction have been observed
using Pol II chromatin immunoprecipitation sequencing (ChIP-
seq) data (Schwartz et al., 2009; Spies et al., 2009). When
considering mouse-specific exons with an upstream intronic
deletion, we observed a GRO-seq peak �37% above the nearly
flat background observed in mouse-specific exons without up-
stream deletions (p < 10�4, KS test). Thus, although confirmation
is needed, the observations above suggest a model in which
upstream deletions enhance the inclusion of new exons, in part
by promoting nucleosome positioning and slowing polymerase
elongation.
Recent studies of the genetic basis for gene expression
variation also have identified thousands of genetic variants
Cell Reports 10, 1–14, March 31, 2015 ª2015 The Authors 7
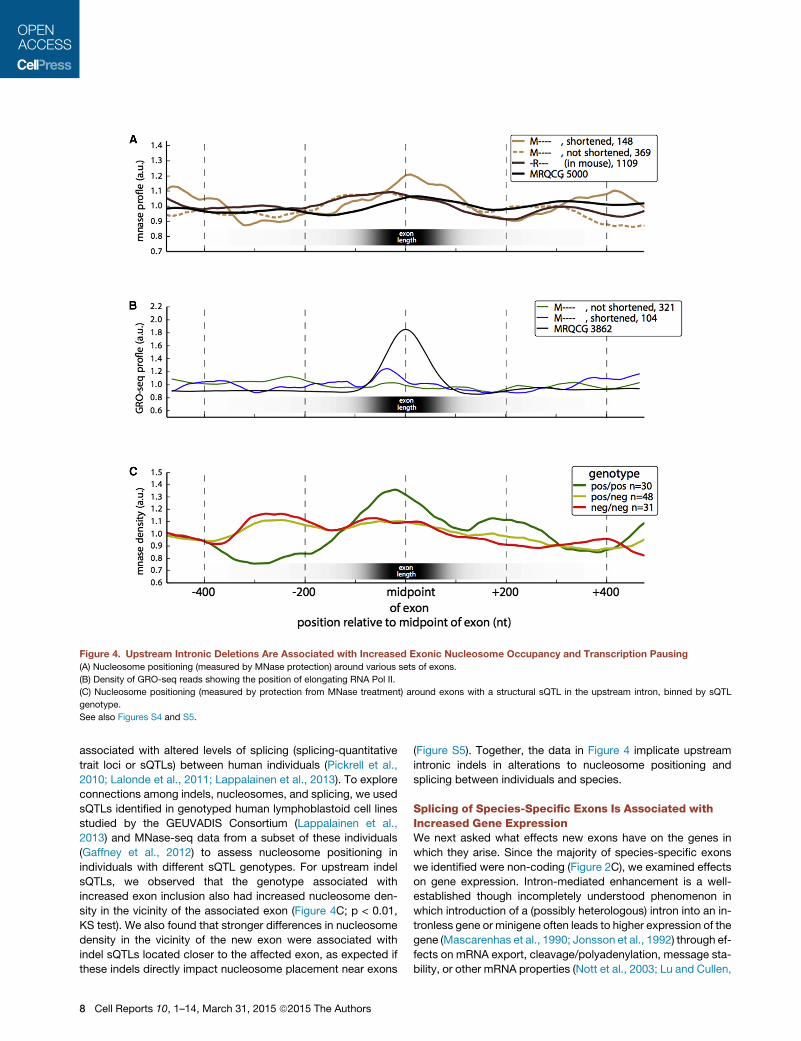
associated with altered levels of splicing (splicing-quantitative
trait loci or sQTLs) between human individuals (Pickrell et al.,
2010; Lalonde et al., 2011; Lappalainen et al., 2013). To explore
connections among indels, nucleosomes, and splicing, we used
sQTLs identified in genotyped human lymphoblastoid cell lines
studied by the GEUVADIS Consortium (Lappalainen et al.,
2013) and MNase-seq data from a subset of these individuals
(Gaffney et al., 2012) to assess nucleosome positioning in
individuals with different sQTL genotypes. For upstream indel
sQTLs, we observed that the genotype associated with
increased exon inclusion also had increased nucleosome den-
sity in the vicinity of the associated exon (Figure 4C; p < 0.01,
KS test). We also found that stronger differences in nucleosome
density in the vicinity of the new exon were associated with
indel sQTLs located closer to the affected exon, as expected if
these indels directly impact nucleosome placement near exons
(Figure S5). Together, the data in Figure 4 implicate upstream
intronic indels in alterations to nucleosome positioning and
splicing between individuals and species.
Splicing of Species-Specific Exons Is Associated withIncreased Gene ExpressionWe next asked what effects new exons have on the genes in
which they arise. Since the majority of species-specific exons
we identified were non-coding (Figure 2C), we examined effects
on gene expression. Intron-mediated enhancement is a well-
established though incompletely understood phenomenon in
which introduction of a (possibly heterologous) intron into an in-
tronless gene or minigene often leads to higher expression of the
gene (Mascarenhas et al., 1990; Jonsson et al., 1992) through ef-
fects on mRNA export, cleavage/polyadenylation, message sta-
bility, or other mRNA properties (Nott et al., 2003; Lu and Cullen,
Figure 4. Upstream Intronic Deletions Are Associated with Increased Exonic Nucleosome Occupancy and Transcription Pausing
(A) Nucleosome positioning (measured by MNase protection) around various sets of exons.
(B) Density of GRO-seq reads showing the position of elongating RNA Pol II.
(C) Nucleosome positioning (measured by protection from MNase treatment) around exons with a structural sQTL in the upstream intron, binned by sQTL
genotype.
See also Figures S4 and S5.
8 Cell Reports 10, 1–14, March 31, 2015 ª2015 The Authors
2003). Here we studied a different situation, in which an already
multi-exonic gene acquires a new internal exon within an intron,
incrementing the count of introns and exons in the transcript by
one. We observed significantly higher expression of genes con-
taining mouse-specific exons in mouse tissues relative to their
rat orthologs in corresponding rat tissues (Figure 5A). This effect
was specific to those mouse tissues where the new exon was
included (i.e., spliced into the mRNA), consistent with a positive
effect of splicing on steady-state expression levels (Figure 5A).
The inclusion of a new exon was associated with an increase
in gene expression of 10% overall (Figure 5A, inset), with much
larger effects observed for specific subsets of new exons (see
below). The distribution of splice junction read data supported
direct effects of splicing, ruling out alternative explanations
involving new promoters (Figure S6A).
The association between splicing and gene expression also
can be assessed by the ratio of the mean expression in tissues
where the exon is included to the mean expression in tissues
where the exon is excluded, a measure we call the exon-associ-
ated expression index (EEI). Dividing the EEI in the species that
contains the exon to the ratio of mean expression values in the
same pairs of tissues in the species lacking the exon yields an
exon-associated expression ratio (EER), with the log of the
EER distributed symmetrically around zero under the null hy-
pothesis that splicing of the new exon does not affect gene
expression. This approach controls for various technical factors
that could impact comparison of expression levels between
different species. Comparing EER values for genes containing
mouse-specific exons or rat-specific exons to controls (Fig-
ure 5B), we observed significantly elevated ratios (about 1.1) in
both cases, consistent with the 10% increase in expression
observed using the simpler approach of Figure 5A, providing
support for the alternative hypothesis that splicing in of new
exons enhances gene expression.
If splicing in of new exons directly enhances expression, then
higher PSI values should be associated with a greater increase in
expression. Consistently, we observed substantial increases in
expression (averaging �50%) for new exons with the highest
PSI values in mouse, and also independently in rat (combined
data shown in Figure 5C), supporting the model in which splicing
in of new exons directly enhances expression. To further explore
this phenomenon, we considered another set of exons: exons
whose presence in the transcriptome is ancient, but which un-
dergo exon skipping only in mouse (Merkin et al., 2012). We
observed that genes containing such exons had lower gene
expression in mouse than their rat orthologs, consistent with
reduced splicing contributing to reduced expression (Fig-
ure 5D). Furthermore, we observed a dose-dependent effect in
which reduced exon inclusion (lower PSI values) was associated
with a stronger decrease in gene expression (Figure 5E). We also
observed a positional effect, in which the strongest expression
differences were associated with exons located in the 50 endsof genes, with little effect observed for exons located at gene
30 ends (Figure 5F). Most of the species-specific exons analyzed
in Figure 5Awere located near the 50 ends of genes (Figure 2D). Acertain minimum level of expression is required to detect exon
skipping and to detect novel exons. However, we tookmeasures
to counteract such biases (Experimental Procedures), and we
note that any such bias would tend to oppose the effect on
expression observed in Figures 5D–5F.
Splicing of pre-mRNAs can impact cytoplasmic mRNA decay
(e.g., mediated by effects of EJC proteins deposited after
splicing), but recent studies also have pointed to connections be-
tween splicing and transcription in various systems. These con-
nections include reports that splicing can influence transcription
initiation (Damgaard et al., 2008) or elongation (Singh and Padg-
ett, 2009; Lin et al., 2008) and recent evidence in yeast of a check-
point in which the polymerase pauses during intron transcription
until partial spliceosomeassembly occurs (Chathoth et al., 2014).
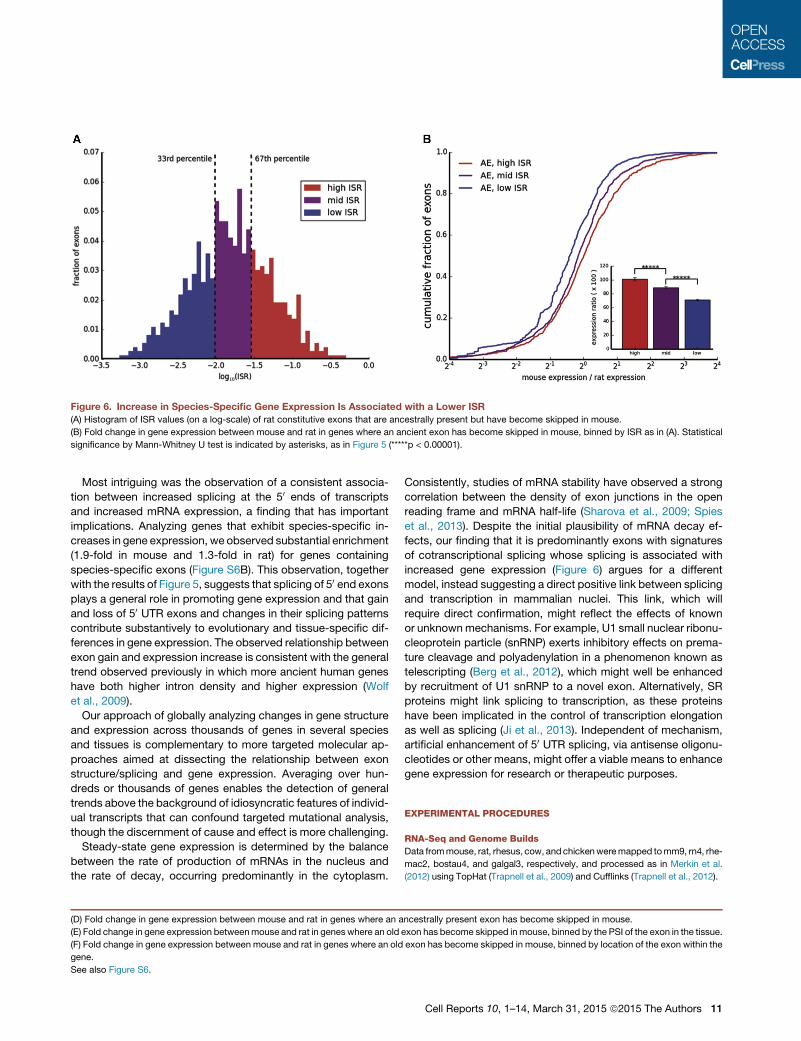
A direct effect of splicing on transcriptionwould be expected to
occur only for exons and introns that are cotranscriptionally
spliced, while an effect on cytoplasmic mRNA decay should be
independent of co- versus post-transcriptional splicing. To
address this issue, we used a measure of post-transcriptional
splicing, here termed the incomplete splicing ratio (ISR) (Brugiolo
et al., 2013; Experimental Procedures). ISRmeasures the ratio of
intronic to exonic transcript reads, with higher values associated
with greater post-transcriptional splicing and lower values asso-
ciated with greater co-transcriptional splicing; the distribution of
ISR values is shown in Figure 6A. Notably, we observed that the
decrease in gene expression in mouse relative to rat associated
with mouse-specific exon skipping was greatest for exons with
low ISR, andnonexistent for exonswith high ISR,with amoderate
decrease observed for the exons with intermediate levels of ISR
(Figure 6B). In other words, the association between reduced
splicing and reduced expression was correlated with the extent
of cotranscriptional splicing. This observation makes sense if
there is direct linkage between splicing and transcription elonga-
tion, but is difficult to reconcile with models involving effects of
splicing on cytoplasmic decay. Interestingly, cotranscriptional
splicing is reported to be much more efficient for introns located
far from the 30 ends of genes (Khodor et al., 2012). Therefore,
the positive association between expression and splicing at the
50 but not the 30 ends of genes observed above (Figure 5F) may
be related to the extent of cotranscriptional splicing.
DISCUSSION
Here we identified and analyzed thousands of orthologous gene
sets differing by evolutionary gain of a single exon, most often
alternatively spliced and located in the 50 UTR, offering a natural
system in which to examine the effects of exons and splicing on
host genes. Various factors may contribute to the bias for new
exons to occur in 50 UTRs, including the greater length of first
introns relative to later introns (Kriventseva and Gelfand, 1999),
the low frequency of 30 UTR introns (Giorgi et al., 2007), and
the potential for some new coding and 30 UTR exons to destabi-
lize messages by eliciting NMD. Several phenomena reported
here, including the strong association between upstream dele-
tions and emergence of new exons (Figure 3) and the associated
changes in chromatin structure and polymerase dynamics (Fig-
ure 4), have not been observed in previous EST-based studies;
and, our conclusion that most new exons derive from unique se-
quences (Figure 2) differs from that obtained in some previous
EST-based studies (Zhang and Chasin, 2006), emphasizing the
difference that use of comprehensive RNA-seq data can make.
Cell Reports 10, 1–14, March 31, 2015 ª2015 The Authors 9
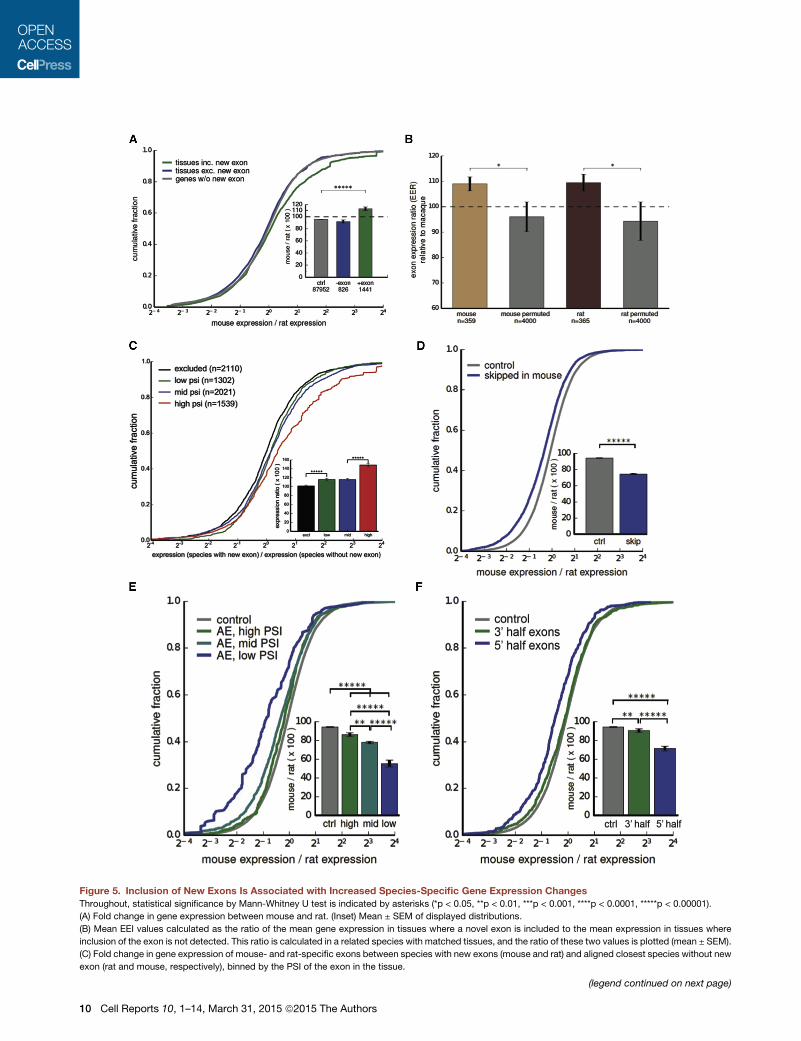
Figure 5. Inclusion of New Exons Is Associated with Increased Species-Specific Gene Expression Changes
Throughout, statistical significance by Mann-Whitney U test is indicated by asterisks (*p < 0.05, **p < 0.01, ***p < 0.001, ****p < 0.0001, *****p < 0.00001).
(A) Fold change in gene expression between mouse and rat. (Inset) Mean ± SEM of displayed distributions.
(B) Mean EEI values calculated as the ratio of the mean gene expression in tissues where a novel exon is included to the mean expression in tissues where
inclusion of the exon is not detected. This ratio is calculated in a related species with matched tissues, and the ratio of these two values is plotted (mean ± SEM).
(C) Fold change in gene expression of mouse- and rat-specific exons between species with new exons (mouse and rat) and aligned closest species without new
exon (rat and mouse, respectively), binned by the PSI of the exon in the tissue.
(legend continued on next page)
10 Cell Reports 10, 1–14, March 31, 2015 ª2015 The Authors
Most intriguing was the observation of a consistent associa-
tion between increased splicing at the 50 ends of transcripts
and increased mRNA expression, a finding that has important
implications. Analyzing genes that exhibit species-specific in-
creases in gene expression, we observed substantial enrichment
(1.9-fold in mouse and 1.3-fold in rat) for genes containing
species-specific exons (Figure S6B). This observation, together
with the results of Figure 5, suggests that splicing of 50 end exons
plays a general role in promoting gene expression and that gain
and loss of 50 UTR exons and changes in their splicing patterns
contribute substantively to evolutionary and tissue-specific dif-
ferences in gene expression. The observed relationship between
exon gain and expression increase is consistent with the general
trend observed previously in which more ancient human genes
have both higher intron density and higher expression (Wolf
et al., 2009).
Our approach of globally analyzing changes in gene structure
and expression across thousands of genes in several species
and tissues is complementary to more targeted molecular ap-
proaches aimed at dissecting the relationship between exon
structure/splicing and gene expression. Averaging over hun-
dreds or thousands of genes enables the detection of general
trends above the background of idiosyncratic features of individ-
ual transcripts that can confound targeted mutational analysis,
though the discernment of cause and effect is more challenging.
Steady-state gene expression is determined by the balance
between the rate of production of mRNAs in the nucleus and
the rate of decay, occurring predominantly in the cytoplasm.
Consistently, studies of mRNA stability have observed a strong
correlation between the density of exon junctions in the open
reading frame and mRNA half-life (Sharova et al., 2009; Spies
et al., 2013). Despite the initial plausibility of mRNA decay ef-
fects, our finding that it is predominantly exons with signatures
of cotranscriptional splicing whose splicing is associated with
increased gene expression (Figure 6) argues for a different
model, instead suggesting a direct positive link between splicing
and transcription in mammalian nuclei. This link, which will
require direct confirmation, might reflect the effects of known
or unknownmechanisms. For example, U1 small nuclear ribonu-
cleoprotein particle (snRNP) exerts inhibitory effects on prema-
ture cleavage and polyadenylation in a phenomenon known as
telescripting (Berg et al., 2012), which might well be enhanced
by recruitment of U1 snRNP to a novel exon. Alternatively, SR
proteins might link splicing to transcription, as these proteins
have been implicated in the control of transcription elongation
as well as splicing (Ji et al., 2013). Independent of mechanism,
artificial enhancement of 50 UTR splicing, via antisense oligonu-
cleotides or other means, might offer a viable means to enhance
gene expression for research or therapeutic purposes.
EXPERIMENTAL PROCEDURES
RNA-Seq and Genome Builds
Data frommouse, rat, rhesus, cow, andchickenweremapped tomm9, rn4, rhe-
mac2, bostau4, and galgal3, respectively, and processed as in Merkin et al.
(2012) using TopHat (Trapnell et al., 2009) and Cufflinks (Trapnell et al., 2012).
(D) Fold change in gene expression between mouse and rat in genes where an ancestrally present exon has become skipped in mouse.
(E) Fold change in gene expression betweenmouse and rat in genes where an old exon has become skipped inmouse, binned by the PSI of the exon in the tissue.
(F) Fold change in gene expression between mouse and rat in genes where an old exon has become skipped in mouse, binned by location of the exon within the
gene.
See also Figure S6.
Figure 6. Increase in Species-Specific Gene Expression Is Associated with a Lower ISR
(A) Histogram of ISR values (on a log-scale) of rat constitutive exons that are ancestrally present but have become skipped in mouse.
(B) Fold change in gene expression between mouse and rat in genes where an ancient exon has become skipped in mouse, binned by ISR as in (A). Statistical
significance by Mann-Whitney U test is indicated by asterisks, as in Figure 5 (*****p < 0.00001).
Cell Reports 10, 1–14, March 31, 2015 ª2015 The Authors 11
Assignment of Ages to Exons
We used exons from Merkin et al. (2012), where exons were defined as having
FPKM R 2 and meeting splice site junction read requirements implicit in the
TopHat mapping. Alignment of exons to other species were collected using
whole-genome alignments generated by PECAN and EPO (Paten et al.,
2008) and pairwise alignments from BLASTZ (Schwartz et al., 2003). Genomic
and splicing ages were defined by the pattern of species with genomic regions
aligned to the exon or with an expressed region in the orthologous gene over-
lapping the aligned region, respectively. We used parsimony to find the mini-
mum number of changes that could explain these patterns (Alekseyenko
et al., 2007; Roy et al., 2008).
Basic Exon Properties
Exons with 0% < PSI < 97% in at least one tissue and two individuals were
categorized as skipped exons (SE). Exons with PSIR 97% in all expressed tis-
sues were defined as constitutive exons (CE), if the gene was expressed in at
least three tissues and two individuals. Open reading frames (ORFs) were an-
notated as in Merkin et al. (2012) and used to classify exons as coding, 50 UTR,30 UTR, and non-coding.
Genomic Sources of New Exons
Exons were categorized as intronic, proximal intergenic, non-proximal inter-
genic, other coding gene, other intron, and other ncRNA gene if their aligned
region in the closest species was located in the intronic regions of the same
gene, intergenic regions but closer to the orthologous gene than any other
gene, other intergenic regions, exonic regions of other genes, intronic regions
of other genes, and other regions of ncRNA, respectively. Using Repeat-
Masker, exons were categorized as containing SINEs, LINEs, LTRs, other re-
peats (rarer categories), or designated as unique if not overlapping any repeat
class.
Splice Site and SRE Analysis
The dinucleotide frequencies of the 50 and 30 splice sites of mouse new exons
and their aligned regions in rat were compared in Figure 1D. In Figure 3D, the
100 nt upstream and downstream of eachmouse exon (or aligned region in rat)
was considered for searching for intronic SREs. The entire exon was searched
for exonic SREs.
Intron Length Analyses
For each exon age, the sum of lengths of each mouse exon and its flanking in-
trons were compared to the corresponding sum for the rat exon or proto-exon
(Figure 3E). In Figure 3F, the length of the downstream mouse intron was
divided by the length of the upstream mouse intron (the same was done for
the rat exon or proto-exon).
Z Score Conversion for Comparisons
We determined the empirical distribution of the changes considered (changes
in intronic or exonic splicing enhancers or silencers, or deletions) in the ancient
exons (MRQCG). We then calculated a Z score for each change for each new
exon using the empirical mean and SD for ancient exons (Figure 3G).
Nucleosome Localization and GRO-Seq Analyses
We used MNase-seq data from Gaffney et al. (2012) and GRO-seq data from
Kaikkonen et al. (2013), and we determined the read density in a 1-kb window
for each exon. These profiles were normalized, averaged, smoothed, and
centered on the exon midpoint. To investigate the impact of intronic structural
variants on nucleosome localization (Figure 4C), we used the MNase-seq data
above and corresponding sQTL (Lappalainen et al., 2013) and genotype data
(Abecasis et al., 2012). We then compiled the MNase profiles of individuals
with genotypes representing shorter and longer upstream introns.
New Exon Inclusion and Species-Specific Expression Changes
Gene expression in mouse was compared to that in rat by taking the ratio of
mouse to rat expression. In Figure 5A, we considered genes with a new
exon, grouped by whether the exon was included or not in a given tissue. In
Figure 5C, we considered mouse- and rat-specific exons, taking the expres-
sion ratio relative to rat and mouse, respectively. We also compared the
expression ratio for ancient exons included in rat but skipped in mouse (Fig-
ure 5D), grouped by PSI (Figure 5E) or position within the gene (Figure 5E).
The intra-species expression ratio is calculated by dividing the mean mouse
gene expression in tissues where the exon is included by the mean expression
in the other tissues. This ratio was then calculated in rat, matching the tissues
in the fore- and background, and the ratio of these two values was analyzed.
This statistic was recalculated with shuffled tissue labels as a control.
The ISR was determined for the exons used in Figure 5D. The ISR of an exon
is calculated by dividing the mean read density in its flanking introns by that of
its neighboring exons, averaged across tissues.
SUPPLEMENTAL INFORMATION
Supplemental Information includes Supplemental Experimental Procedures,
six figures, and four tables and can be found with this article online at http://
dx.doi.org/10.1016/j.celrep.2015.02.058.
AUTHOR CONTRIBUTIONS
J.J.M., P.C., S.K.H., and C.B.B. initially conceived the project. P.C. and J.J.M.
performed analyses related to Figures 1, 2, and 3. J.J.M. performed analyses
related to Figure 4. J.J.M., P.C., andM.S.A. performed analyses related to Fig-
ure 5. M.S.A. performed analyses related to Figure 6 and Table S1. P.C. and
J.J.M. performed analyses related to other supplemental material. All authors
interpreted the data and wrote the paper. C.B.B. managed the project.
ACKNOWLEDGMENTS
We thank A. Berglund, M. Garber, B. Graveley, D. Page, A. Regev, P. Sharp,
and members of the Burge lab for helpful comments on this work and on the
manuscript. This work was supported by a doctoral dissertation grant from
the Finnish Cancer Organisations and Oskar Oflunds Stiftelse (P.C.); by a Na-
tional Defense Science and Engineering Graduate Fellowship (M.S.A.); by the
Academy of Finland, Center of Excellence in Cancer Genetics Research
(S.K.H.); by the National Science Foundation under grant 0821391 (C.B.B.);
and by NIH grant 5-R01-HG002439 (C.B.B.).
Received: October 29, 2014
Revised: January 9, 2015
Accepted: February 23, 2015
Published: March 19, 2015
REFERENCES
Abecasis, G.R., Auton, A., Brooks, L.D., DePristo, M.A., Durbin, R.M., Hand-
saker, R.E., Kang, H.M., Marth, G.T., and McVean, G.A.; 1000 Genomes
Project Consortium (2012). An integrated map of genetic variation from
1,092 human genomes. Nature 491, 56–65.
Alekseyenko, A.V., Kim, N., and Lee, C.J. (2007). Global analysis of exon cre-
ation versus loss and the role of alternative splicing in 17 vertebrate genomes.
RNA 13, 661–670.
Barbosa-Morais, N.L., Irimia, M., Pan, Q., Xiong, H.Y., Gueroussov, S., Lee,
L.J., Slobodeniuc, V., Kutter, C., Watt, S., Colak, R., et al. (2012). The evolu-
tionary landscape of alternative splicing in vertebrate species. Science 338,
1587–1593.
Bendtsen, J.D., Nielsen, H., von Heijne, G., and Brunak, S. (2004). Improved
prediction of signal peptides: SignalP 3.0. J. Mol. Biol. 340, 783–795.
Bentley, D.L. (2014). Coupling mRNA processing with transcription in time and
space. Nat. Rev. Genet. 15, 163–175.
Berg, M.G., Singh, L.N., Younis, I., Liu, Q., Pinto, A.M., Kaida, D., Zhang, Z.,
Cho, S., Sherrill-Mix, S., Wan, L., and Dreyfuss, G. (2012). U1 snRNP deter-
mines mRNA length and regulates isoform expression. Cell 150, 53–64.
Bradley, R.K., Merkin, J., Lambert, N.J., and Burge, C.B. (2012). Alternative
splicing of RNA triplets is often regulated and accelerates proteome evolution.
PLoS Biol. 10, e1001229.
12 Cell Reports 10, 1–14, March 31, 2015 ª2015 The Authors
Brugiolo, M., Herzel, L., and Neugebauer, K.M. (2013). Counting on co-tran-
scriptional splicing. F1000Prime Rep. 5, 9.
Callis, J., Fromm, M., and Walbot, V. (1987). Introns increase gene expression
in cultured maize cells. Genes Dev. 1, 1183–1200.
Chathoth, K.T., Barrass, J.D., Webb, S., and Beggs, J.D. (2014). A splicing-
dependent transcriptional checkpoint associated with prespliceosome forma-
tion. Mol. Cell 53, 779–790.
Christofk, H.R., Vander Heiden, M.G., Wu, N., Asara, J.M., and Cantley, L.C.
(2008). Pyruvate kinase M2 is a phosphotyrosine-binding protein. Nature
452, 181–186.
Damgaard, C.K., Kahns, S., Lykke-Andersen, S., Nielsen, A.L., Jensen, T.H.,
and Kjems, J. (2008). A 50 splice site enhances the recruitment of basal tran-
scription initiation factors in vivo. Mol. Cell 29, 271–278.
Fox-Walsh, K.L., Dou, Y., Lam, B.J., Hung, S.P., Baldi, P.F., and Hertel, K.J.
(2005). The architecture of pre-mRNAs affects mechanisms of splice-site pair-
ing. Proc. Natl. Acad. Sci. USA 102, 16176–16181.
Gabut, M., Samavarchi-Tehrani, P., Wang, X., Slobodeniuc, V., O’Hanlon, D.,
Sung, H.K., Alvarez, M., Talukder, S., Pan, Q., Mazzoni, E.O., et al. (2011). An
alternative splicing switch regulates embryonic stem cell pluripotency and re-
programming. Cell 147, 132–146.
Gaffney, D.J., McVicker, G., Pai, A.A., Fondufe-Mittendorf, Y.N., Lewellen, N.,
Michelini, K.,Widom, J., Gilad, Y., and Pritchard, J.K. (2012). Controls of nucle-
osome positioning in the human genome. PLoS Genet. 8, e1003036.
Gao, X., and Lynch, M. (2009). Ubiquitous internal gene duplication and intron
creation in eukaryotes. Proc. Natl. Acad. Sci. USA 106, 20818–20823.
Giorgi, C., Yeo, G.W., Stone, M.E., Katz, D.B., Burge, C., Turrigiano, G., and
Moore, M.J. (2007). The EJC factor eIF4AIII modulates synaptic strength and
neuronal protein expression. Cell 130, 179–191.
Gunderson, F.Q., Merkhofer, E.C., and Johnson, T.L. (2011). Dynamic histone
acetylation is critical for cotranscriptional spliceosome assembly and spliceo-
somal rearrangements. Proc. Natl. Acad. Sci. USA 108, 2004–2009.
Hachet, O., and Ephrussi, A. (2004). Splicing of oskar RNA in the nucleus is
coupled to its cytoplasmic localization. Nature 428, 959–963.
Ip, J.Y., Schmidt, D., Pan, Q., Ramani, A.K., Fraser, A.G., Odom, D.T., and
Blencowe, B.J. (2011). Global impact of RNA polymerase II elongation inhibi-
tion on alternative splicing regulation. Genome Res. 21, 390–401.
Izquierdo, J.M., Majos, N., Bonnal, S., Martınez, C., Castelo, R., Guigo, R., Bil-
bao, D., and Valcarcel, J. (2005). Regulation of Fas alternative splicing by
antagonistic effects of TIA-1 and PTB on exon definition. Mol. Cell 19,
475–484.
Ji, X., Zhou, Y., Pandit, S., Huang, J., Li, H., Lin, C.Y., Xiao, R., Burge, C.B., and
Fu, X.D. (2013). SR proteins collaborate with 7SK and promoter-associated
nascent RNA to release paused polymerase. Cell 153, 855–868.
Jonsson, J.J., Foresman, M.D., Wilson, N., and McIvor, R.S. (1992). Intron
requirement for expression of the human purine nucleoside phosphorylase
gene. Nucleic Acids Res. 20, 3191–3198.
Kaikkonen, M.U., Spann, N.J., Heinz, S., Romanoski, C.E., Allison, K.A., Sten-
der, J.D., Chun, H.B., Tough, D.F., Prinjha, R.K., Benner, C., and Glass, C.K.
(2013). Remodeling of the enhancer landscape during macrophage activation
is coupled to enhancer transcription. Mol. Cell 51, 310–325.
Khodor, Y.L., Menet, J.S., Tolan, M., and Rosbash, M. (2012). Cotranscrip-
tional splicing efficiency differs dramatically between Drosophila and mouse.
RNA 18, 2174–2186.
Kiontke, K., Gavin, N.P., Raynes, Y., Roehrig, C., Piano, F., and Fitch, D.H.
(2004). Caenorhabditis phylogeny predicts convergence of hermaphroditism
and extensive intron loss. Proc. Natl. Acad. Sci. USA 101, 9003–9008.
Kondrashov, F.A., and Koonin, E.V. (2001). Origin of alternative splicing by tan-
dem exon duplication. Hum. Mol. Genet. 10, 2661–2669.
Kriventseva, E.V., and Gelfand, M.S. (1999). Statistical analysis of the exon-
intron structure of higher and lower eukaryote genes. J. Biomol. Struct. Dyn.
17, 281–288.
Lalonde, E., Ha, K.C., Wang, Z., Bemmo, A., Kleinman, C.L., Kwan, T., Pasti-
nen, T., and Majewski, J. (2011). RNA sequencing reveals the role of splicing
polymorphisms in regulating human gene expression. Genome Res. 21,
545–554.
Lappalainen, T., Sammeth, M., Friedlander, M.R., ’t Hoen, P.A., Monlong, J.,
Rivas, M.A., Gonzalez-Porta, M., Kurbatova, N., Griebel, T., Ferreira, P.G.,
et al.; Geuvadis Consortium (2013). Transcriptome and genome sequencing
uncovers functional variation in humans. Nature 501, 506–511.
Lareau, L.F., Green, R.E., Bhatnagar, R.S., and Brenner, S.E. (2004). The
evolving roles of alternative splicing. Curr. Opin. Struct. Biol. 14, 273–282.
Lev-Maor, G., Sorek, R., Shomron, N., and Ast, G. (2003). The birth of an alter-
natively spliced exon: 30 splice-site selection in Alu exons. Science 300, 1288–
1291.
Levine, M.T., Jones, C.D., Kern, A.D., Lindfors, H.A., and Begun, D.J. (2006).
Novel genes derived from noncoding DNA in Drosophila melanogaster are
frequently X-linked and exhibit testis-biased expression. Proc. Natl. Acad.
Sci. USA 103, 9935–9939.
Lin, S., Coutinho-Mansfield, G., Wang, D., Pandit, S., and Fu, X.D. (2008). The
splicing factor SC35 has an active role in transcriptional elongation. Nat.
Struct. Mol. Biol. 15, 819–826.
Lu, S., and Cullen, B.R. (2003). Analysis of the stimulatory effect of splicing on
mRNA production and utilization in mammalian cells. RNA 9, 618–630.
Luco, R.F., Pan, Q., Tominaga, K., Blencowe, B.J., Pereira-Smith, O.M., and
Misteli, T. (2010). Regulation of alternative splicing by histone modifications.
Science 327, 996–1000.
Marques, A.C., Dupanloup, I., Vinckenbosch, N., Reymond, A., and Kaess-
mann, H. (2005). Emergence of young human genes after a burst of retroposi-
tion in primates. PLoS Biol. 3, e357.
Mascarenhas, D., Mettler, I.J., Pierce, D.A., and Lowe, H.W. (1990). Intron-
mediated enhancement of heterologous gene expression in maize. Plant
Mol. Biol. 15, 913–920.
Matlin, A.J., Clark, F., and Smith, C.W. (2005). Understanding alternative
splicing: towards a cellular code. Nat. Rev. Mol. Cell Biol. 6, 386–398.
Merkin, J., Russell, C., Chen, P., and Burge, C.B. (2012). Evolutionary dy-
namics of gene and isoform regulation in mammalian tissues. Science 338,
1593–1599.
Modrek, B., and Lee, C.J. (2003). Alternative splicing in the human, mouse and
rat genomes is associated with an increased frequency of exon creation and/or
loss. Nat. Genet. 34, 177–180.
Nielsen, C.B., Friedman, B., Birren, B., Burge, C.B., and Galagan, J.E. (2004).
Patterns of intron gain and loss in fungi. PLoS Biol. 2, e422.
Nott, A., Meislin, S.H., and Moore, M.J. (2003). A quantitative analysis of intron
effects on mammalian gene expression. RNA 9, 607–617.
Paten, B., Herrero, J., Beal, K., Fitzgerald, S., and Birney, E. (2008). Enredo and
Pecan: genome-wide mammalian consistency-based multiple alignment with
paralogs. Genome Res. 18, 1814–1828.
Patthy, L. (2003). Modular assembly of genes and the evolution of new func-
tions. Genetica 118, 217–231.
Pickrell, J.K., Marioni, J.C., Pai, A.A., Degner, J.F., Engelhardt, B.E., Nkadori,
E., Veyrieras, J.B., Stephens, M., Gilad, Y., and Pritchard, J.K. (2010). Under-
standing mechanisms underlying human gene expression variation with RNA
sequencing. Nature 464, 768–772.
Roy, S.W., Fedorov, A., and Gilbert, W. (2003). Large-scale comparison of
intron positions in mammalian genes shows intron loss but no gain. Proc.
Natl. Acad. Sci. USA 100, 7158–7162.
Roy, M., Xu, Q., and Lee, C. (2005). Evidence that public database records for
many cancer-associated genes reflect a splice form found in tumors and lack
normal splice forms. Nucleic Acids Res. 33, 5026–5033.
Roy, M., Kim, N., Xing, Y., and Lee, C. (2008). The effect of intron length on
exon creation ratios during the evolution of mammalian genomes. RNA 14,
2261–2273.
Cell Reports 10, 1–14, March 31, 2015 ª2015 The Authors 13
Schwartz, S., Kent, W.J., Smit, A., Zhang, Z., Baertsch, R., Hardison, R.C.,
Haussler, D., and Miller, W. (2003). Human-mouse alignments with BLASTZ.
Genome Res. 13, 103–107.
Schwartz, S., Meshorer, E., and Ast, G. (2009). Chromatin organization marks
exon-intron structure. Nat. Struct. Mol. Biol. 16, 990–995.
Sela, N., Mersch, B., Gal-Mark, N., Lev-Maor, G., Hotz-Wagenblatt, A., and
Ast, G. (2007). Comparative analysis of transposed element insertion within
human and mouse genomes reveals Alu’s unique role in shaping the human
transcriptome. Genome Biol. 8, R127.
Shabalina, S.A., Ogurtsov, A.Y., Spiridonov, A.N., Novichkov, P.S., Spirido-
nov, N.A., and Koonin, E.V. (2010). Distinct patterns of expression and evolu-
tion of intronless and intron-containing mammalian genes. Mol. Biol. Evol. 27,
1745–1749.
Sharova, L.V., Sharov, A.A., Nedorezov, T., Piao, Y., Shaik, N., and Ko, M.S.
(2009). Database for mRNA half-life of 19 977 genes obtained by DNA micro-
array analysis of pluripotent and differentiating mouse embryonic stem cells.
DNA Res. 16, 45–58.
Singh, J., and Padgett, R.A. (2009). Rates of in situ transcription and splicing in
large human genes. Nat. Struct. Mol. Biol. 16, 1128–1133.
Sorek, R., Ast, G., and Graur, D. (2002). Alu-containing exons are alternatively
spliced. Genome Res. 12, 1060–1067.
Sorek, R., Lev-Maor, G., Reznik, M., Dagan, T., Belinky, F., Graur, D., and Ast,
G. (2004). Minimal conditions for exonization of intronic sequences: 50 splicesite formation in alu exons. Mol. Cell 14, 221–231.
Spies, N., Nielsen, C.B., Padgett, R.A., and Burge, C.B. (2009). Biased
chromatin signatures around polyadenylation sites and exons. Mol. Cell 36,
245–254.
Spies, N., Burge, C.B., and Bartel, D.P. (2013). 30 UTR-isoform choice has
limited influence on the stability and translational efficiency of most mRNAs
in mouse fibroblasts. Genome Res. 23, 2078–2090.
Sureau, A., Gattoni, R., Dooghe, Y., Stevenin, J., and Soret, J. (2001). SC35 au-
toregulates its expression by promoting splicing events that destabilize its
mRNAs. EMBO J. 20, 1785–1796.
Trapnell, C., Pachter, L., and Salzberg, S.L. (2009). TopHat: discovering splice
junctions with RNA-Seq. Bioinformatics 25, 1105–1111.
Trapnell, C., Roberts, A., Goff, L., Pertea, G., Kim, D., Kelley, D.R., Pimentel,
H., Salzberg, S.L., Rinn, J.L., and Pachter, L. (2012). Differential gene and tran-
script expression analysis of RNA-seq experiments with TopHat and Cufflinks.
Nat. Protoc. 7, 562–578.
Wang, W., Zheng, H., Yang, S., Yu, H., Li, J., Jiang, H., Su, J., Yang, L., Zhang,
J., McDermott, J., et al. (2005). Origin and evolution of new exons in rodents.
Genome Res. 15, 1258–1264.
Wolf, Y.I., Novichkov, P.S., Karev, G.P., Koonin, E.V., and Lipman, D.J. (2009).
The universal distribution of evolutionary rates of genes and distinct character-
istics of eukaryotic genes of different apparent ages. Proc. Natl. Acad. Sci.
USA 106, 7273–7280.
Yeo, G.W., Van Nostrand, E., Holste, D., Poggio, T., and Burge, C.B. (2005).
Identification and analysis of alternative splicing events conserved in human
and mouse. Proc. Natl. Acad. Sci. USA 102, 2850–2855.
Zhang, X.H., and Chasin, L.A. (2006). Comparison of multiple vertebrate ge-
nomes reveals the birth and evolution of human exons. Proc. Natl. Acad.
Sci. USA 103, 13427–13432.
Zhou, H.L., Hinman, M.N., Barron, V.A., Geng, C., Zhou, G., Luo, G., Siegel,
R.E., and Lou, H. (2011). Hu proteins regulate alternative splicing by inducing
localized histone hyperacetylation in an RNA-dependent manner. Proc. Natl.
Acad. Sci. USA 108, E627–E635.
14 Cell Reports 10, 1–14, March 31, 2015 ª2015 The Authors