Embed Size (px)
Citation preview

Origins of large‐volume, compositionally zoned volcanic eruptions:New constraints from U‐series isotopes and numerical thermalmodeling for the 1912 Katmai‐Novarupta eruption
Simon Turner,1 Mike Sandiford,2 Mark Reagan,3 Chris Hawkesworth,4 and Wes Hildreth5
Received 8 December 2009; revised 11 June 2010; accepted 1 July 2010; published 1 December 2010.
[1] We present the results of a combined U‐series isotope and numerical modeling studyof the 1912 Katmai‐Novarupta eruption in Alaska. A stratigraphically constrained set ofsamples have compositions that range from basalt through basaltic andesite, andesite,dacite, and rhyolite. The major and trace element range can be modeled by 80–90%closed‐system crystal fractionation over a temperature interval from 1279°C to 719°C at100 MPa, with an implied volume of parental basalt of ∼65 km3. Numerical modelssuggest, for wall rock temperatures appropriate to this depth, that 90% of this volume ofmagma would cool and crystallize over this temperature interval within a few tens ofkiloyears. However, the range in 87Sr/86Sr, (230Th/238U), and (226Ra/230Th) requiresopen‐system processes. Assimilation of the host sediments can replicate the range of Srisotopes. The variation of (226Ra/230Th) ratios in the basalt to andesite compositional rangerequires that these were generated less than several thousand years before eruption.Residence times for dacites are close to 8000 years, whereas the rhyolites appear to be50–200 kyr old. Thus, the magmas that erupted within only 60 h had a wide range ofcrustal residence times. Nevertheless, they were emplaced in the same thermal regime andevolved along similar liquid lines of descent from parental magmas with similarcompositions. The system was built progressively with multiple inputs providing bothmass and heat, some of which led to thawing of older silicic material that provided muchof the rhyolite.
Citation: Turner, S., M. Sandiford, M. Reagan, C. Hawkesworth, and W. Hildreth (2010), Origins of large‐volume,compositionally zoned volcanic eruptions: New constraints from U‐series isotopes and numerical thermal modeling for the 1912Katmai‐Novarupta eruption, J. Geophys. Res., 115, B12201, doi:10.1029/2009JB007195.
1. Introduction
[2] Volcanoes provide a visually stunning testament to theexistence of the Earth′s thermal engine, and there is jointpublic and scientific interest in volcanoes, both as a naturalhazard and as a window into the primary mechanism of theEarth′s differentiation. Large‐volume, caldera‐forming, high‐silica, pyroclastic rhyolites are the most destructive volcaniceruptions on Earth. They typically erupt at high temperaturesand emit large volumes of H2O, H2S, SO2 and CO2 that havea demonstrable influence on global climate [Robock andMao, 1992]. The high SiO2 and volatile contents in theseeruptions suggest these magmas represent the products of
extended magmatic differentiation, yet exactly how suchlarge and potentially explosive magma volumes are formedremains enigmatic. Several decades of field and fluiddynamic research [e.g., Turner and Campbell, 1986] haveidentified three increasingly well‐defined models: the evac-uation of long‐lived, zoned magma chambers [Hildreth,1981] generated largely by crystal fractionation [Bacon andDruitt, 1988]; the re‐melting of granitic plutons by intru-sion of basaltic magmas [Huppert and Sparks, 1988]; and theshallow‐level interaction of magmas of contrasting com-position just prior to eruption [Eichelberger and Izbekov,2000]. More recently, Annen et al. [2006] have consideredthe extent to which injection of basalt combined with partialmelting and mixing in the lower crust might produce inter-mediate and silicic magmas. Price et al. [2005] and Reubiand Blundy [2009] have also argued that intermediate com-position magmas in many systems reflect mixing betweenmafic and silicic melts. All these models differ in the pre-dicted relations between different magma types, and in thetime scales of magma formation and residence underground.Thus, short‐lived (U‐series) isotopes and numerical thermalmodels, combined with the results of detailed field work,provide an opportunity to now test these models in ways that
1GEMOC, Department of Earth and Planetary Sciences, MacquarieUniversity, North Ryde, New South Wales, Australia.
2School of Earth Sciences, University of Melbourne, Parkville, Victoria,Australia.
3Department of Geoscience, University of Iowa, Iowa City, Iowa, USA.4Department of Earth Sciences, University of Bristol, Bristol, UK.5United States Geological Survey, Menlo Park, California, USA.
Copyright 2010 by the American Geophysical Union.0148‐0227/10/2009JB007195
JOURNAL OF GEOPHYSICAL RESEARCH, VOL. 115, B12201, doi:10.1029/2009JB007195, 2010
B12201 1 of 22
were less possible when they were originally proposed.Quantifying the rates of magma build‐up may provide usefulinsights into present preeruptive conditions that may aidpredictions of future volcanic activity.[3] Our knowledge of the processes that occur in magma
chambers stems largely from the study of their erupted vol-canic products, since plutons provide, at best, only a time‐integrated view of the solidified remains of magma chambers[e.g., Brown and Rushmer, 2006]. In particular, the zoneddeposits of large pyroclastic eruptions and the inference thatthese deposits represent the inverted stratigraphy of under-lying magma chambers have been the basis for models inwhich magma chambers develop compositional layering.Most notably, Hildreth [1981] presented evidence that thesedeposits could be derived from long‐lived, thermally andcompositionally stratified magma chambers maintained andfed from below by mantle‐derived magmas. The notion oflong‐lived, layered magma chambers has become some-what of a paradigm extrapolated to many zoned, pyro-clastic deposits.[4] Radiogenic isotopes and trace element ratios have been
widely used to distinguish comagmatic suites. However, withthe addition of U‐series isotope analyses it is now possibleto distinguish magmas that may have similar bulk compo-sitions but different ages on time scales of 102–105 years[e.g., Hawkesworth et al., 2000]. This offers the opportunityof exciting new insights into the dynamics of magma systemsfrom the variations in composition and preeruption ageswithin zoned eruptive units. The increasing sophistication ofnumerical models has also highlighted that a key discrimi-nator of the different models is the predicted timescale ofmagma formation and residence underground. Zoned magmachambers tens to hundreds of square kilometers in size require104–105 years to form and become stratified in a stablemanner [Trial and Spera, 1990; Wolff et al., 1990]. Oncestratified, the chambers could, in theory, remain unmixedfor 105–106 years [Oldenburg et al., 1989]. However, suchmodels require particular thermal conditions, since pluton‐sized bodies will also cool on a time scale of 104–105 years[Spera, 1980]. Remelting of preexisting granitic plutons, onthe other hand, is predicted to occur on markedly shortertime scales of 102–103 years [Huppert and Sparks, 1988],and in this model the more mafic magmas are likely to havecontrasting trace element and isotope signatures. More con-troversially, it has been suggested that some zoned, high‐silica eruptions reflect the injection of rhyolite into anandesitic magma chamber [Eichelberger and Izbekov, 2000],in which case the silicic magma could have a shorter crustalresidence time than the andesite with no genetic link predictedbetween them. Finally, the “hot zone” model predicts incu-bation over 0.1–10 Myr with little U‐series disequilibriapredicted unless the melts contain significant recent con-tributions from the mantle [Annen et al., 2006].[5] Much of the debate has centered around the interpre-
tation of controversial long residence times inferred for high‐silicamagmas at LongValley where Rb‐Sr isochron evidencefor magma residence times of up to 0.7 Myr seemed tostrongly support the long‐lived chamber paradigm [Hallidayet al., 1989]. However, Sparks et al. [1990] strongly ques-tioned the interpretation of these isochrons, invoking insteadthe remelting of 0.7 Ma plutons sometime in the previousfew hundreds to thousands of years [Huppert and Sparks,
1988]. This ongoing controversy has led to numerousattempts to verify the residence times of the Long Valleyhigh‐silica magmas and the development of some interme-diate models [Halliday et al., 1989; Sparks et al., 1990; vanden Bogaard and Schirnick, 1995; Davies and Halliday,1998; Christensen and DePaolo, 1993; Mahood, 1990;Hildreth and Wilson, 2007]. However, the compositionalrange of the deposits studied at Long Valley does not includemore primitive rocks that could be the parental magmas inthe zoned magma chamber model, the heat source in there‐melting model, or the resident magma in the shallowinteraction model. Moreover, these rocks are too old forshort‐lived U‐series isotope studies and the only naturallaboratory of a zoned magmatic system in which the fullcomplement of radiogenic isotopes, numerical predictionsandU‐series isotopes can be applied is the Katmai‐Novaruptaeruption of 1912.[6] Accordingly, we have undertaken an integrated radio-
genic and U‐series isotope and numerical thermal modelingstudy of a stratigraphically constrained section through theKatmai‐Novarupta deposits. Clasts of andesite, dacite andrhyolite are present at most stratigraphic levels [Hildreth andFierstein, 2000] and these were individually analyzed toinvestigate the scale of temporal variations in the magmasprior to eruption and the time scales over which they are inter‐related.
2. The Katmai‐Novarupta 1912 Eruption
[7] In June 1912, the biggest and one of the most com-positionally diverse eruptions of the last century took placein the Katmai group of volcanoes on the Alaska Peninsula(Figure 1). In the space of 60 h, 13 km3 of rhyolite, dacite,and andesite magma were explosively ejected, producing anash cloud covering 77,000 km2 that extended as far east asGreece and filled the Valley of Ten Thousand Smokes. Theeruption was larger than the 1883 Krakatau eruption,releasing more HCl than Mount St. Helens in 1980, as muchH2SO4 as the Minoan eruption of Santorini, and producing250 times more seismic energy than Pinatubo in 1991[Westrich et al., 1991; Hildreth and Fierstein, 2000]. ThePinatubo eruption reduced northern hemisphere tempera-tures by 0.2°C, having a similar effect to that of El Niño[Rampino and Self, 1984]. Although the eruption took placefrom a vent at the site of the present‐day Novarupta dome(Figure 1), it involved lateral magma transport from thesummit of Mount Katmai, 10 km to the east, which startedto collapse some 11 h after the onset of the eruption to forma 5.5 km3 caldera [Hildreth and Fierstein, 2000].[8] Detailed stratigraphic studies by Fierstein and Hildreth
[1992] and Fierstein and Wilson [2005] have divided theeruption into three main episodes. During episode 1 (8.8 km3),the onset of the eruption was marked by the plinian dis-persal of 3 km3 of high‐silica, crystal‐poor rhyolitic magma(layer A). This was followed by a gradual increase in theproportions of dacitic and andesitic material (layer B), leadingto a progressive shift from bulk rhyolite pumice throughto andesite scoria in the resulting zoned ignimbrite sheetemplaced in the Valley of the Ten Thousand Smokes.Episode 2 (4.8 km3) began after a brief lull with a plinianeruption of more phenocryst‐rich andesite and dacite(layers C and D). Subordinate rhyolite was deposited in the
TURNER ET AL.: U‐SERIES ISOTOPES IN KATMAI MAGMAS B12201B12201
2 of 22

Figure 1. (a) Map of the Katmai volcanic cluster with inset showing location on the Alaskan Peninsula.(b) Schematic cross section of region A‐A′ in Figure 1a [after Hildreth and Fierstein, 2000].
TURNER ET AL.: U‐SERIES ISOTOPES IN KATMAI MAGMAS B12201B12201
3 of 22

lower part of layer C but was very sparse thereafter. Afteranother brief lull, episode 3 (3.4 km3) deposited plinian dacitelayers F and G. Layer H is a postplinian ashfall deposit.Figure 2 illustrates how the proportions of rhyolitic (55%),dacitic (35%), and andesitic (10%) clasts changed systemat-ically during the eruption. The total 17 km3 of fall depositscorrespond to ∼13 km3 of magma [Fierstein and Wilson,2005].[9] Previous activity in the area dominantly involved
Holocene andesitic magmatism [Hildreth and Fierstein,2000] down to 2.5 ka, suggesting that it may have taken atleast a couple of thousand years to develop the 8 km3 ofvolatile‐rich, high‐silica rhyolite which is unique to the 1912eruption. The crystal‐poor nature of the high‐silica rhyoliteis striking, and one interpretation is that it was a residualliquid extruded from an andesite‐dacite mush [Hildreth andFierstein, 2000]. Degassing might have been restricted byeruption through relatively impermeable Naknek Formationsediments, leading to the explosive nature of the eruption.All other eruptions in the area occurred through rocks ofhigher permeability and by contrast were largely effusive[Hildreth and Fierstein, 2000].[10] As summarized by Hildreth [1983], the andesites and
dacites are 30–50% composed of phenocrysts of plagioclase,orthopyroxene, augite, and oxides in the proportions 5:2:1:1,with minor olivine found in some andesite clasts. In contrast,the rhyolites are 1–3% composed of phenocrysts of quartz,
plagioclase, orthopyroxene, and opaques in the proportions5:5:2:1. Overall, the SiO2 contents of the clasts range dis-continuously from 50 wt %–77 wt %, with a silica gap that is68 wt %–76 wt % SiO2. However, the continuous variation inFe‐Ti oxide temperatures and redox in the three magma types(Figure 3) led Hildreth [1983] to suggest that the zonederuption had been fed by a single, layered magma chamberbeneath Katmai. Moreover, interstitial glass in the andesiteis similar to the composition of the bulk dacite, and theglass in the dacite is nearly identical to the bulk rhyolite.However, there is no evidence that the dacite reflects mixingbetween the rhyolite and andesite end‐members [Hildrethand Fierstein, 2000].[11] Experimental work on erupted materials from the
1912 eruption suggests that under H2O‐saturated conditionsthe andesite and dacite were stored at 930°C –960°C and100–75 MPa and 850°C–880°C and 50–25 MPa, respec-tively [Hammer et al., 2002], while the rhyolite was held at800°C–850°C at 100–40 MPa [Coombs and Gardner,2001]. Thus, magma storage was at very shallow depths(1–5 km) before eruption. However, if all three magmaswere H2O‐saturated, then the rhyolite would have resideddeeper and thus would have been laterally displaced fromthe andesite and dacite [Coombs and Gardner, 2001;Hammer et al., 2002]. Alternately, if the andesite and dacitewere H2O‐undersaturated, it is possible that all three mag-mas coexisted in a single vertically zoned magma chamber[Coombs and Gardner, 2001; Hammer et al., 2002]. This isconsistent with the model proposed byHildreth and Fierstein[2000] having an elongate flattened chamber, 1.3 km deep,2 km across, and 5 km long, holding 13 km3 of eruptedmagma. This chamber was also inevitably underlain by anunknown volume of unerupted cumulate mush (Figure 1b).[12] In previous U‐series isotope work, George et al.
[2003], Reagan et al. [2003], and Turner et al. [2004] haveall presented preliminary U‐series isotope data from someof the Katmai Group volcanics. Reagan et al. [2003] usedU‐Th isotope data to suggest that the generation of theKatmai rhyolite occurred by fractionation of andesite magmacombined with assimilation of preexisting intrusives over>105 years. Turner et al. [2004] presented 210Pb data fromthe 1958 eruptions of nearby Mount Trident that indicated
Figure 2. Stratigraphy of the 1912 eruption showing thedivision of the various layers into three eruptive episodes[after Fierstein and Hildreth, 1992].
Figure 3. Oxygen fugacity and geothermometry data fromthe 1912 eruption [after Hildreth, 1983]. Water contents(squares) are from Westrich et al. [1991].
TURNER ET AL.: U‐SERIES ISOTOPES IN KATMAI MAGMAS B12201B12201
4 of 22

the presence of magma that had been undergoing shallow‐level degassing for about a decade prior to eruption, and thisis consistent with seismic evidence for the present‐daypresence of magma in the area [Ward et al., 1991].
3. Sample Details and Analytical Techniques
[13] The majority of the 28 samples analyzed are a subsetof a stratigraphically constrained suite for which major andtrace element concentrations were previously determinedusing methods described elsewhere [e.g., Fierstein andHildreth, 1992]. They include three near‐vent scoria fallsamples from the S bed described by Fierstein et al. [1997]and one sample from the lava dome at Novarupta. We alsoincluded a sample of the Naknek Formation sediments(sample AM23 from Lowenstern and Mahood [1991]) as apotential contaminant. Sr and U‐Th‐Ra isotopes were ana-lyzed, either at the University of Bristol, following methodsoutlined by George et al. [2003], or at Macquarie Universityusing the protocols described subsequently.[14] At Macquarie University, Sr isotopic analyses used
∼100 mg of powdered sample that was dissolved usingHF‐HNO3 in a heated Teflon pressure bomb. Sr fractionswere separated using a cationic column and loaded ontosingle Re filaments and analyzed in static mode on aThermoFinnigan Triton® TIMS. Mass fractionation wascorrected for by normalizing to 86Sr/88Sr = 0.1194. Anal-yses of SRM987 and BHVO‐2 performed at the same timeyielded 87Sr/86Sr = 0.710287 ± 25 (n = 4) and 0.703496 ±36 (n = 7), respectively.[15] U, Th, and Ra concentrations and isotope ratios
were determined on samples that were spiked with thesame 226U−229Th and 228Ra tracers used in Bristol and dis-solved using an HF‐HNO3‐HCl mix in heated Teflonpressure bombs. The product was converted to chlorideusing 6N HCl and then 6N HCl saturated with H3BO3 toremove residual fluorides. The final product was convertedto nitrate using 14N HNO3 and finally taken up in 7N HNO3.U and Th purification was achieved via a single pass througha 4 ml anionic resin column using 7N HNO3, 6N HCl and0.2N HNO3 as elutants. Concentrations and isotope ratioswere measured in dynamic mode on an Nu Instruments®MC‐ICP‐MS at Macquarie University. 238U and 235U wereanalyzed on Faraday cups, using the 238U/235U ratio todetermine the mass bias, assuming 238U/235U = 137.88,while 236U and 234U were alternately collected in the IC0 ioncounter that is equipped with a deceleration lens. The IC0gain was determined during interspersed dynamic analysesof CRM145, assuming a 234U/238U ratio of 5.286 × 10⁻⁵
[Cheng et al., 2000]. Methods for Th‐isotope measurementsemployed a dynamic routine with 232Th in Faraday cups and230Th and 229Th alternating on IC0, as described in fulldetail in Sims et al. [2008]. Accuracy (<0.3%) and precision(<0.1%) were assessed by regular analyses of the U010and ThA solution standards. Multiple analyses of the secularequilibrium rock standard TML‐3 (n = 5) performed at thesame time as the samples yielded the following results:U = 10.54 ppm, Th = 29.61 ppm, (234U/238U) = 0.993,(230Th/232Th) = 1.088, and (230Th/238U) = 1.007; theseresults are within the error of secular equilibrium and pub-lished values for this rock [Sims et al., 2008].
[16] Ra was taken from the first elution from the anioniccolumn and converted to chloride using 6N HCl. This wasthen loaded in 3N HCl onto an 8 ml cationic column andeluted using 3.75M HNO3 and the process repeated on ascaled‐down 0.6 ml column. Ra and Ba were then chro-matographically separated using ElChrom® Sr‐spec resin™and 3N HNO3 as elutant in a 150 ml procedure. Samples wereloaded onto degassed Re filaments using a Ta‐HF‐H3PO4
activator solution, and 228Ra/226Ra ratios were measured to aprecision typically ∼0.5% in dynamic ion counting mode on aThermoFinnigan Triton® TIMS at Macquarie University.Organic interferences often noted at low temperatures duringTIMS analysis for Ra were eliminated by the purchasing ofthe instrument fitted with a dry scroll pump instead of thestandard rotary pump, preventing leakage of organic mole-cules into the source during venting. Accuracy was assessedvia replicate analyses (n = 5) of TML‐3 that yielded 226Ra =3534 fg/g and (226Ra/230Th) = 1.002 ± 0.008 that is withinerror of secular equilibrium.
4. Results
[17] Complete data for the samples analyzed are presentedin Table 1 and supplemented in some of the figures by datafrom basaltic andesite obtained from Novarupta dome(97ND02), as published by George et al. [2003], and datafrom another basaltic andesite (K851), as published byReagan et al. [2003]. The samples range in SiO2 from asingle, nearly primitive basalt (50.4 wt % SiO2 and 11.4 wt %MgO) and two basaltic andesites through the andesite‐dacitecontinuum and across a silica gap (68 wt %–77 wt % SiO2) torhyolites that reach up to 77.7 wt % SiO2 (Figure 4a). Overthis silica range the corresponding MgO and FeO* contentsdecrease from 11.43 wt % to 0.02 wt % and 10.6 wt % to 1.3wt %, respectively. CaO decreases and K2O increases withdecreasing MgO, whereas FeO* (Figure 4b) and Al2O3,Na2O, and P2O5 (not shown) form curvilinear trends againstMgO. Figure 4c shows that Al2O3 initially increases andthen decreases with decreasing CaO. Across this composi-tional range, concentrations of compatible trace elementssuch as Sc decrease while incompatible element concentra-tions increase. In contrast, Ti, Zr, Sr, and Eu exhibit inflectedtrends that are initially increasing and then constant ordecreasing in concentration with increasing SiO2 (notshown). The overall incompatible trace element variation isillustrated on normalized incompatible element diagrams inFigure 5 which show a general parallelism and patternstypical of arc rocks from the Aleutians and elsewhere, withpeaks in fluid‐mobile elements (e.g., Ba, U, Sr, and Pb) anddepletions in immobile elements such as Th, Nb, and Ti.[18] Sr isotopes were measured on samples chosen to
encompass the major element compositional range. The new87Sr/86Sr data expand the previously reported restricted range[Hildreth and Fierstein, 2000] to 0.70339–0.70374, mainlybecause of the measurement of an 87Sr/86Sr ratio of 0.70339in the basaltic scoria clast from the S bed. The range overlapsbut is slightly smaller than the 0.70302–0.70388 variationreported for the present‐day Aleutian arc in general [Georgeet al., 2003]. It is clear from a plot of 87Sr/86Sr versus SiO2
that not all of the 1912 products can be interrelated by anysimple liquid line of descent (Figure 6a). The Naknek samplewas a sandstone with generally low incompatible element
TURNER ET AL.: U‐SERIES ISOTOPES IN KATMAI MAGMAS B12201B12201
5 of 22

Tab
le1.
Geochem
ical
andIsotop
icAnalysesFrom
Katmaia
Sam
ple#
Stratigraph
ySiO
2TiO
2Al 2O3
FeO
*MnO
MgO
CaO
Na 2O
K2O
P2O5
LOI
Total
Sc
Rb
Sr
YZr
Nb
Cs
Ba
La
Ce
Pr
K10
00a
layerA
botto
m77
.48
0.14
12.18
1.30
0.04
0.18
0.85
4.21
3.16
0.05
1.69
97.31
7.5
55.8
6239
.713
04.41
2.28
843
16.82
35.04
4.56
K10
79a
layerA
top
77.46
0.14
12.20
1.26
0.04
0.17
0.86
4.26
3.15
0.05
1.36
97.98
7.5
56.9
6140
.413
24.35
2.33
859
16.94
35.37
4.57
K24
66b
layerB
59.64
0.73
16.70
6.76
0.13
3.59
7.16
3.41
1.31
0.17
0.34
98.58
28.2
25.7
298
25.2
106
3.50
1.00
417
9.77
20.54
2.75
K24
88d
layerB
61.38
0.70
16.59
6.15
0.13
3.00
6.44
3.55
1.49
0.18
1.12
97.51
25.3
28.4
272
26.0
114
3.18
1.11
452
10.29
21.72
2.89
K01
00c
mainignimbrite
64.02
0.68
15.69
5.57
0.12
2.51
5.31
3.93
1.61
0.15
1.24
98.08
19.6
26.9
254
27.1
120
3.10
1.07
460
10.27
21.90
2.90
K01
21mainignimbrite
77.70
0.13
12.11
1.25
0.04
0.16
0.86
4.11
3.20
0.05
2.80
96.27
6.8
53.8
5837
.312
23.94
3.02
794
15.71
32.64
4.19
K01
35d
mainignimbrite
59.85
0.73
16.73
6.76
0.13
3.54
7.14
3.27
1.30
0.15
0.73
98.44
24.5
23.6
289
23.0
982.66
0.92
391
8.99
18.95
2.52
K01
62mainignimbrite
64.52
0.66
16.11
5.16
0.10
2.27
4.79
4.08
1.78
0.13
n.d.
98.24
17.4
33.6
232
30.8
142
3.73
1.37
550
11.98
25.33
3.37
K01
82mainignimbrite
65.52
0.67
15.77
5.03
0.09
2.11
4.56
3.91
1.80
0.13
n.d.
97.70
18.8
31.3
239
29.2
137
3.70
1.28
532
11.65
24.52
3.29
K02
00mainignimbrite
62.52
0.70
16.06
5.98
0.12
2.79
5.90
3.86
1.52
0.14
1.29
97.98
22.9
27.9
261
27.3
121
3.18
1.13
468
10.50
22.34
2.98
K05
81mainignimbrite
59.69
0.72
16.56
6.84
0.13
3.46
7.13
3.61
1.31
0.14
0.43
98.62
27.1
24.5
291
24.2
106
2.68
0.98
407
9.35
19.88
2.69
K13
65mainignimbrite
77.54
0.14
12.22
1.26
0.04
0.19
0.86
4.12
3.19
0.05
3.02
96.21
8.6
60.0
6443
.114
04.68
2.37
908
17.99
37.74
4.85
K14
90mainignimbrite
67.72
0.57
15.10
4.37
0.10
1.59
3.91
4.08
2.03
0.13
1.61
97.65
17.3
35.3
212
31.2
134
3.90
1.41
576
12.34
25.94
3.41
K25
82a
mainignimbrite
66.09
0.59
15.44
4.71
0.11
2.03
4.60
3.91
1.94
0.19
1.60
97.99
17.3
38.8
227
28.7
150
3.88
1.63
586
12.15
25.25
3.27
K12
71b
layerC
botto
m61
.90
0.68
16.47
6.11
0.12
2.92
6.24
3.55
1.49
0.13
1.49
98.00
23.7
27.8
279
26.0
113
2.87
1.11
451
10.20
21.51
2.83
K12
70a
layerC
top
65.81
0.64
15.45
5.08
0.11
1.91
4.57
4.09
1.78
0.14
2.09
97.32
18.4
30.8
235
30.1
137
3.78
1.22
515
11.47
24.30
3.18
K12
69c
layerD
botto
m66
.54
0.59
15.40
4.69
0.10
1.84
4.46
3.96
1.90
0.12
2.26
97.00
17.8
34.2
223
30.7
133
3.71
1.38
552
12.10
25.62
3.40
K12
68b
layerD
top
59.92
0.72
16.55
6.84
0.13
3.45
7.11
3.42
1.30
0.14
1.26
98.07
28.4
23.8
299
24.7
100
2.55
0.96
397
9.16
19.46
2.60
K12
68f
layerD
top
62.04
0.70
16.13
6.37
0.12
3.00
6.17
3.41
1.52
0.14
2.11
96.97
23.4
28.6
260
26.3
114
2.99
1.13
456
10.31
21.78
2.87
K12
67b
layerFbo
ttom
65.43
0.64
15.74
5.09
0.11
1.96
4.71
4.02
1.74
0.14
1.85
97.42
22.9
28.4
262
26.9
120
3.04
1.11
467
10.38
21.90
2.90
K12
67c
layerFbo
ttom
62.95
0.67
16.04
5.91
0.12
2.74
5.84
3.63
1.56
0.13
1.63
97.46
28.4
23.8
299
24.7
100
2.55
0.96
397
9.16
19.46
2.60
K12
66c
layerG
top
65.13
0.64
15.78
5.10
0.11
1.99
4.86
4.15
1.70
0.14
0.39
99.10
18.5
29.8
236
29.3
134
3.37
1.19
508
11.20
23.65
3.14
K12
66f
layerG
top
63.42
0.65
15.75
5.76
0.11
2.69
5.71
3.71
1.69
0.13
0.38
98.63
22.0
30.9
248
26.9
120
3.06
1.24
490
10.64
22.34
2.94
K05
43Sbedscoria
fall
50.41
0.69
14.03
10.13
0.17
11.43
10.12
2.02
0.50
0.09
0.20
99.37
45.1
8.0
270
14.2
421.08
0.30
155
4.22
9.26
1.34
K15
95c
Sbedscoria
fall
61.44
0.70
16.70
6.11
0.12
2.99
6.40
3.52
1.44
0.18
1.19
98.39
24.5
25.2
273
24.3
104
2.55
1.00
416
9.45
19.95
2.63
K20
15c
Sbedscoria
fall
65.60
0.64
15.64
4.97
0.11
1.93
4.54
4.26
1.75
0.16
1.10
98.07
18.5
30.6
231
29.3
135
3.83
1.24
509
11.36
23.77
3.15
K01
84layerF‐G
59.47
0.72
16.77
6.81
0.12
3.56
7.03
3.63
1.35
0.15
n.d.
99.70
24.4
26.1
266
24.1
106
2.77
1.07
429
9.81
20.68
2.78
K00
16Nov
arup
tado
me
76.86
0.17
12.53
1.43
0.05
0.02
0.95
4.35
3.21
0.02
n.d.
97.68
7.2
60.9
6542
.713
94.81
2.44
907
18.01
37.39
4.81
AM23
Naknekform
ation
66.20
0.52
15.80
5.57
0.08
2.61
4.48
2.41
1.62
0.09
n.d.
99.38
14.6
34.3
348
14.5
213.72
1.17
779
8.89
18.10
2.37
Sam
ple#
Nd
Sm
Eu
Gd
Tb
Dy
Ho
Er
Tm
Yb
Lu
Hf
Ta
Pb
Th
U226Ra(fg/g)
87Sr/86Sr
(234U/238U)
(238U/232Th)
(230Th/
232Th)
(230Th/
238U)
(226Ra/230Th)
K10
00a
19.59
5.30
0.79
5.66
1.02
6.53
1.42
4.05
0.64
4.06
0.66
4.59
0.83
11.51
4.76
22.32
781
9.9
0.70
370
0.99
71.48
21.46
00.98
51.05
3K10
79a
19.59
5.46
0.80
5.77
1.04
6.67
1.45
4.12
0.65
4.12
0.67
4.62
0.60
11.49
4.86
72.37
379
9.6
n.d.
0.99
91.47
91.46
30.98
91.00
3K24
66b
12.63
3.66
1.04
3.90
0.69
4.37
0.94
2.58
0.40
2.43
0.40
3.11
2.26
5.74
1.13
00.51
636
6.3
0.70
358
1.00
41.38
61.38
91.00
22.08
5K24
88d
13.18
3.76
1.03
4.08
0.72
4.55
0.97
2.67
0.42
2.57
0.42
3.37
1.10
5.83
3.05
61.40
457
4.3
n.d.
1.00
61.39
41.38
20.99
11.21
5K01
00c
13.12
3.75
1.03
4.05
0.72
4.63
1.00
2.84
0.43
2.77
0.45
3.55
0.42
5.76
2.81
71.33
349
4.3
n.d.
1.00
21.43
61.40
20.97
71.01
2K01
2118
.22
5.02
0.71
5.21
0.94
6.16
1.35
3.83
0.60
3.86
0.62
4.35
0.51
9.77
5.21
42.50
484
1.1
n.d.
0.99
81.45
71.43
70.98
60.99
8K01
35d
11.54
3.30
0.94
3.56
0.62
4.01
0.86
2.39
0.36
2.30
0.37
3.01
0.68
5.60
1.23
20.56
244
5.6
0.70
368
1.00
21.38
51.38
10.99
72.33
9K01
6215
.17
4.27
1.14
4.60
0.81
5.25
1.10
3.12
0.48
3.03
0.50
4.17
0.50
7.02
3.30
31.56
751
5.6
n.d.
1.00
61.43
91.39
90.97
20.99
2K01
8214
.93
4.22
1.14
4.48
0.78
5.11
1.11
3.12
0.48
3.09
0.51
4.03
0.27
13.10
2.86
31.35
950
5.2
n.d.
1.00
51.44
01.42
20.98
71.06
9K02
0013
.69
3.93
1.07
4.30
0.74
4.83
1.03
2.85
0.43
2.78
0.45
3.61
0.24
7.14
2.77
91.28
846
6.7
0.70
373
1.00
51.40
71.38
90.98
71.07
0K05
8112
.36
3.64
1.04
3.84
0.67
4.20
0.91
2.51
0.38
2.40
0.39
3.17
0.20
7.39
2.62
61.18
845
9.5
0.70
368
1.00
31.37
21.36
90.99
81.11
9K13
6521
.19
5.80
0.86
6.09
1.11
7.11
1.56
4.39
0.69
4.35
0.70
4.84
0.41
11.63
5.21
52.49
481
5.2
n.d.
1.00
41.45
11.43
30.98
80.97
0K14
9015
.44
4.38
1.08
4.74
0.83
5.37
1.13
3.20
0.50
3.14
0.51
4.02
0.58
7.59
3.51
81.68
155
5.7
n.d.
0.99
41.45
01.40
90.97
20.99
7K25
82a
14.48
4.03
0.99
4.30
0.75
4.78
1.04
2.97
0.45
2.91
0.48
4.34
0.77
8.30
3.84
61.77
360
5.7
0.70
362
1.00
11.39
91.40
21.00
20.99
9K12
71b
12.96
3.71
1.04
3.99
0.70
4.46
0.96
2.68
0.42
2.56
0.41
3.28
0.39
5.80
3.04
61.41
664
8.3
0.70
364
1.00
31.41
01.39
00.98
61.36
8K12
70a
14.78
4.33
1.11
4.57
0.81
5.07
1.10
3.15
0.47
3.00
0.50
3.98
0.46
6.39
3.03
01.44
747
8.5
n.d.
1.00
21.44
91.40
20.96
81.00
6K12
69c
15.32
4.39
1.12
4.67
0.84
5.27
1.13
3.21
0.48
3.08
0.50
3.98
0.52
7.07
3.27
21.55
652
0.1
0.70
361
1.00
31.44
41.40
70.97
41.00
9K12
68b
12.10
3.50
1.03
3.81
0.67
4.29
0.91
2.48
0.39
2.40
0.39
2.93
0.41
4.97
1.10
40.50
843
4.8
0.70
370
1.00
31.39
51.39
51.00
02.52
2
TURNER ET AL.: U‐SERIES ISOTOPES IN KATMAI MAGMAS B12201B12201
6 of 22

Tab
le1.
(con
tinued)
Sam
ple#
Nd
Sm
Eu
Gd
Tb
Dy
Ho
Er
Tm
Yb
Lu
Hf
Ta
Pb
Th
U226Ra(fg/g)
87Sr/86Sr
(234U/238U)
(238U/232Th)
(230Th/
232Th)
(230Th/
238U)
(226Ra/230Th)
K12
68f
13.07
3.81
0.98
4.01
0.73
4.57
0.97
2.68
0.42
2.58
0.42
3.36
0.64
5.96
3.02
11.39
265
7.9
0.70
373
1.00
11.39
81.39
00.99
41.39
9K12
67b
13.26
3.79
1.04
4.19
0.73
4.65
0.99
2.85
0.43
2.67
0.44
3.57
0.46
5.92
2.99
81.41
848
2.2
0.70
360
1.00
21.43
51.40
70.98
01.03
8K12
67c
12.10
3.50
1.03
3.81
0.67
4.29
0.91
2.48
0.39
2.40
0.39
2.93
0.41
4.97
2.98
71.38
960
2.4
0.70
374
1.00
51.41
11.39
90.99
11.28
8K12
66c
14.16
4.08
1.06
4.51
0.78
5.01
1.08
3.11
0.47
2.97
0.47
3.92
0.61
6.49
2.94
81.41
147
2.3
n.d.
1.00
31.45
31.40
70.96
81.01
8K12
66f
13.12
3.77
0.97
4.06
0.72
4.62
1.00
2.71
0.43
2.70
0.43
3.58
0.52
6.15
3.33
21.53
554
0.9
n.d.
1.00
31.39
81.38
90.99
31.04
4K05
436.53
2.13
0.67
2.40
0.41
2.59
0.55
1.51
0.22
1.37
0.22
1.36
0.07
2.39
1.03
00.43
518
5.6
0.70
339
1.00
31.28
11.35
01.05
41.20
6K15
95c
12.21
3.52
0.99
3.83
0.67
4.23
0.90
2.48
0.39
2.40
0.39
3.09
0.19
5.81
2.88
81.33
052
2.2
0.70
371
1.00
21.39
71.38
90.99
41.16
3K20
15c
14.23
4.12
1.05
4.41
0.78
5.02
1.07
3.07
0.46
3.00
0.49
3.98
0.86
6.28
3.01
71.43
847
3.0
n.d.
1.00
31.44
61.40
80.97
41.00
4K01
8412
.65
3.61
0.99
3.89
0.68
4.27
0.93
2.60
0.39
2.43
0.40
3.21
0.21
5.10
1.47
50.67
439
8.1
0.70
374
1.00
51.38
71.38
40.99
81.74
1K00
1620
.81
5.68
0.84
5.90
1.07
7.15
1.53
4.41
0.69
4.46
0.72
5.05
0.41
11.99
5.31
22.52
587
0.2
0.70
372
1.00
21.44
21.42
80.99
01.04
2AM23
9.57
2.22
0.90
2.33
0.38
2.29
0.49
1.43
n.d.
1.42
0.22
0.87
0.47
6.41
2.46
00.96
0n.d.
0.70
480
n.d.
1.18
4n.d.
n.d.
n.d.
a InInferred
Stratigraph
icOrder
from
botto
mto
topof
thesequ
ence;major
elem
entsarein
wt%
andtraceelem
entsarein
ppm
unless
otherw
isespecified;
n.d.,no
tdeterm
ined.
Figure 4. Plots of (a) total alkalis versus SiO2, (b) FeO*versus MgO, and (c) Al2O3 versus CaO showing the com-positional range of the products of the 1912 eruption (solid,shaded, and open circles designating the basalt‐andesite,dacite, and rhyolite compositional ranges, respectively, areused in this and subsequent figures). Note that the curvatureof the trends precludes models involving pure two‐end‐member mixing. Also shown are the results of a four‐stageleast squares model of fractional crystallization (see Table 2)and the results of MELTS modeling at 0.1 GPa (shaded line)and 0.5 GPa (dashed shaded line).
TURNER ET AL.: U‐SERIES ISOTOPES IN KATMAI MAGMAS B12201B12201
7 of 22

Figure 5. Primitive‐mantle normalized incompatible trace element diagrams showing the general paral-lelism of patterns for the basalt (K0543), andesite (K2466b), and rhyolite (K1000a) used in fractionalcrystallization modeling; the results are shown as dashed lines.
TURNER ET AL.: U‐SERIES ISOTOPES IN KATMAI MAGMAS B12201B12201
8 of 22

concentrations and an 87Sr/86Sr ratio of 0.70480. We acceptthat this is a single sample; the Naknek Formation overall islikely to be significantly more isotopically diverse.[19] Glassy pumice clasts are susceptible to surficial alter-
ation that can lead to loss of 234U situated in recoil‐damagedsites. However, all but one of the samples analyzed has(234U/238U)within 2s analytical error (6‰) of 1 (Table 1). Asshown in Table 1, Th content increases from 1.03 to 5.32 ppmand U from 0.43 to 2.53 ppm between the basalt and the
rhyolites. Over the same compositional spectrum, (238U/232Th)ranges from 1.28 to 1.48 and (230Th/232Th) from 1.35 to 1.46,leading to a restricted range in (230Th/238U) from 0.97 to 1.05,overlapping the range observed from the Alaska‐Aleutianarc in general [George et al., 2003]. The new U‐Th isotopedata are also in excellent agreement with earlier Katmai datareported by Reagan et al. [2003]. On a U‐Th equiline dia-gram (Figure 7a), the basalt and basaltic andesites lie to theleft of the equiline with 5–7% 230Th excess. While this isunusual in oceanic arcs, it is relatively common in arcsdeveloped on thicker crust such as the Alaskan Peninsula[e.g., George et al., 2003]. In all other respects, these moremafic rocks have the typical arc signature characterized byother Katmai rocks. In contrast, the andesites and daciteshave up to 3% 238U excesses and form an array extendingfrom and to the right of the equiline. Excepting the NovaruptaDome sample and the rhyolites, the bulk of the samples in thebasalt to dacite compositional range scatter about the 40 kyrreference line for Katmai andesites and dacites observed byReagan et al. [2003]. Finally, the rhyolites have some of the
Figure 6. (a) Plot of 87Sr/86Sr versus SiO2 with hypothet-ical liquid evolution trends discussed in the text. (b) Plot of87Sr/86Sr versus Rb/Sr showing model trends for mixing(in 10% increments) between the basalt and the NaknekFormation sediment from Table 1 and also fractional crys-tallization combined with assimilation (AFC) of both theNaknek sediment and silicic material assumed to have thecomposition of rhyolite K1000a (ticks indicate increments of10% crystallization; r, the rate of crystallization to assimila-tion, was set at 0.3). Inset shows an expanded scale to includethe rhyolites. The bulk partition coefficients (DSr = 1.021,DRb = 0.046) were calculated from the data in Table 3assuming a fractionating assemblage composed of 60% pla-gioclase, 30% pyroxene, 9% magnetite, and 1% apatite.
Figure 7. Plots of (a) U‐Th equiline diagram and(b) (226Ra/230Th) versus (230Th/238U) with a 40 kyr iso-chron superimposed from Reagan et al. [2003]. Dashedlines represent secular equilibrium.
TURNER ET AL.: U‐SERIES ISOTOPES IN KATMAI MAGMAS B12201B12201
9 of 22

highest U/Th ratios in the sample suite and are displaced tohigher (230Th/232Th) ratios below the equiline and above thedacites.[20] The first Ra data fromKatmai are presented in Table 1.
226Ra concentrations range from 185 to 870 fg/g and(226Ra/230Th) ratios from 0.97 to 2.52. The lowest values arefrom the rhyolites and highest silica dacites, and it is likelythat these samples are in secular equilibrium. Given the likelyaccuracy of the measurements (limited by the 3% uncertaintyon the NIST 4969 226Ra standard), we consider the intrinsicrange of (226Ra/230Th) to be from 2.52 to 1. On a plot of(226Ra/230Th) versus U‐Th disequilibria (Figure 7b), the basaltand basaltic andesites, which both have (230Th/238U) > 1,have moderate (226Ra/230Th) values of 1.21–1.09. Andesites,which are characterized by near equilibrium (230Th/238U),have a wide range of (226Ra/230Th) values (1.07–2.52). Thisrange is similar to that (1–2.2) reported for all Aleutian andAlaskan arc front volcanoes [George et al., 2003, 2004].Withthree exceptions, essentially all of the Katmai dacites andrhyolites are within 2s analytical error (1%) of Ra‐Th secularequilibrium. The exceptions are three dacites (K1276b,K0182,and K0016) with 4–7% 226Ra excesses. Combined, the238U−230Th−226Ra data imply that the andesite‐dacite arrayis not a 40 kyr isochron representing an instantaneousfractionation event, but an array that must have been gen-
erated by a process or processes operating over a variety oftimescales.
5. Geochemical Modeling
[21] The products found in the Valley of Ten ThousandSmokes come from one of the most studied eruptions onEarth, so it is surprising that these products have receivedlittle quantitative geochemical treatment. Given the historicaldevelopment of ideas, we begin by assessing the extent towhich the simplest closed‐system model can account for thedata and then show how both long‐ and short‐lived isotopesand numerical thermal models require an open‐system.
5.1. Major Elements
[22] The major element, trace element, and Sr isotopetrends are consistent with the variation being dominated byfractional crystallization, and we chose in the first instance tomodel this using a simple least squares numerical approach.The results, including phase compositions and proportions,are documented in Table 2 and illustrated in Figure 4,showing that it is possible to broadly simulate the suite infour successive stages of crystallization from basalt (K0543)to basaltic andesite (K0851) to andesite (K0581) to dacite(K1267c) and finally to rhyolite (K1000a). The minimiza-tion used mineral compositions obtained from the andesites
Table 2. Input Parameters and Results of Least Squares Models
Parent Magma Daughter Magma% of Total
Crystallization Olivine
Mineral Fractions in Cumulate
Magnetite Apatite R2Clinopyroxene Orthopyroxene Plagioclase
Stage 1: Basalt to Basaltic AndesiteK0543 K0851 51 29 32 0 34 4 0 0.05
Stage 2: Basaltic Andesite to AndesiteK0851 K0581 47 0 23 14 56 7 0 0.04
Stage 3: Andesite to DaciteK0581 K1267c 21 0 19 11 60 9 1 0.06
Stage 4: Dacite to RhyoliteK1267c K1000a 50 0 15 11 64 9 0.5 0.06
Mineral Compositions (Stages 1 and 2)a
SiO2 38.35 53.00 53.00 52.90 0.00 0.00TiO2 0.00 0.37 0.25 0.00 8.60 0.00Al2O3 0.03 2.30 1.46 29.90 3.41 0.00FeO total 21.16 7.95 18.10 0.00 78.90 0.21MgO 40.24 16.55 25.40 0.00 3.02 0.54CaO 0.16 20.00 1.33 12.67 0.00 52.40Na2O 0.00 0.18 0.03 4.15 0.00 0.00K2O 0.00 0.00 0.00 0.00 0.00 0.00P2O5 0.00 0.00 0.00 0.00 0.00 40.98
Mineral Compositions (Stage 3)b
SiO2 51.00 52.70 54.00 0.00 0.00TiO2 0.55 0.23 0.00 9.50 0.00Al2O3 2.40 2.60 29.70 2.45 0.00FeO total 9.10 16.40 0.00 79.90 0.21MgO 14.80 25.80 0.00 2.20 0.54CaO 20.90 1.59 11.50 0.00 52.40Na2O 0.30 0.01 4.90 0.00 0.00K2O 0.00 0.00 0.19 0.00 0.00P2O5 0.00 0.00 0.00 0.00 40.98
aCore compositions from K140 andesite [Hildreth, 1983, and unpublished data].bCore compositions from K101 dacite [Hildreth, 1983, and unpublished data].
TURNER ET AL.: U‐SERIES ISOTOPES IN KATMAI MAGMAS B12201B12201
10 of 22

and dacites themselves [Hildreth, 1983, also unpublisheddata, 2009]. The fractionating assemblage is essentiallygabbroic and involves apatite in the final two steps, consistentwith a rapid decrease in P2O5 between the dacites and therhyolites (not shown). The calculated mineral proportionsdiffer somewhat from themodal assemblages in the rocks, butthe latter can be partly entrained during magma migration[Price et al., 2005] and are clearly not the crystals that sep-arated from the liquids to produce the bulk compositionalrange. The calculations yielded very satisfactory fits (sums ofresiduals squared <0.1), bearing in mind the very largecompositional range being simulated (see Table 2).[23] To calibrate the temperatures of the system at differing
degrees of fractionation for eventual use in constraining thepotential timescale of crystallizing the Katmai magma body,we next used the MELTS software algorithm [Ghiorso andSack, 1995; Asimow and Ghiorso, 1998]. The starting com-position was the composition of basalt K0543, and we used25°C steps between the calculated liquidus (1279°C) untilrhyolitic compositions were achieved near the solidus at794°C. Additional input parameters were an oxygen fugacitybuffered at QFM +2 log units, which is consistent with thefO2 values calculated using coexisting oxides for the Katmaiejecta (Figure 3), and a pressure of 0.1 GPa, which is in linewith the experimental findings of Coombs and Gardner[2001] and Hammer et al. [2002]. The starting basalt wasassigned 0.8 wt % H2O, and this led to calculated H2O con-tents of 1.5 wt % in the andesite, 2.2 wt % in the dacite, and3.8 wt % in the rhyolite, which is closely consistent with themelt inclusion observations of Westrich et al. [1991] (seeFigure 3). As noted by Westrich et al. [1991], these H2Ocontents would lead to saturation of the andesites, dacites, andrhyolites at depths of 4, 2, and 0.5 km, respectively.[24] Figure 8 shows the extent of crystallization and change
in SiO2 versus temperature drop calculated by the MELTSmodel. The liquidus of the K0543 was determined to be1279°C. Half of the crystallization occurs over a 150°Ctemperature interval from 1144°C–994°C that corresponds tothe evolution of the predicted liquid composition frombasaltic andesite to dacite (51 wt %–66 wt % SiO2). Inter-estingly, the rate of crystallization increase per °C is signifi-cantly lower across the range of 68wt%–77wt%SiO2, so theorigin of the silica gap probably reflects the physics ofextraction of interstitial liquid from a crystal mush or eutecticremelting of silicic rocks.[25] In Figure 8b, we also compare the SiO2‐temperature
relationship from the MELTS model, with the oxide tem-peratures from Hildreth [1983] shown in Figure 3, as well aswater‐saturated liquidus temperatures for andesite, dacite,and rhyolite, experimentally constrained by Coombs andGardner [2001] and Hammer et al. [2002]. The tempera-tures predicted by MELTS are somewhat higher than therange measured using groundmass oxides from the andesite.The water‐saturated experimental liquidus for the andesiticcomposition is 55°C–35°C lower than the significantlywater‐undersaturated MELTS model. The comparison forthe dacite is better, and the agreement of the MELTS andoxide temperatures for the rhyolite, which is nearly aphyric,is excellent. The experimental and calculated liquidus tem-peratures for the rhyolite and dacite compositions are nearlyidentical, which are water saturated and nearly water satu-rated, respectively, in the MELTS models. Thus, MELTS
appears to do a reasonable job in simulating the energyconstraints of the system, providing confidence to use theextent‐of‐crystallization versus temperature function in thenumerical thermal models described subsequently.[26] Although it was not our primary purpose, the calcu-
lated liquid line of descent from the MELTS model is alsocompared with the whole rock data in Figure 4. The simu-lation is generally satisfactory through the intermediatemagmas, bearing in mind the extreme compositional andcrystallization range being simulated. However, MELTS isknown to work less well for minimum melt compositions.Thus, at very high degrees of crystallization (required togenerate the rhyolites) the MELTS model overestimated theSiO2 content and underestimated the Al2O3 and alkali con-tents of the rhyolites because of feldspar crystallization thatmay be unrealistically extensive. FeO* is also underestimatedacross the andesite‐dacite compositional range because of therapid removal of magnetite near 1100°C by the MELTSprogram. In light of the imperfect fit of this MELTS modelto the data, we chose to use the phase proportions and extentsof crystallization from the least squares modeling in the traceelement modeling described in section 5.2.[27] Although the experimental studies indicate a shallow
level origin for the evolution of the Katmai eruptives, it isconceivable that these simply reflect the last pressure ofequilibration (i.e., shallow‐level assembly) of magmas whosebulk composition was determined at greater depth. Forexample, Annen et al. [2006] have suggested that someintermediate to silicic arc magmas are produced in lowercrustal hot zones. For the Katmai products, the lack ofdepletion in the heavy rare earth elements (see Figure 5)clearly precludes a lower crustal origin, since garnet will bestable at these depths. Evolution at midcrustal levels is harderto assess, but MELTS modeling of crystallization performedat 0.5 GPa provided significantly poorer fits to the data (seeFigure 4) than the 0.1 GPa model. This is due to the earlyonset of orthopyroxene crystallization and subsequent ortho-pyroxene‐plus‐clinopyroxene crystallization, which causesSiO2 concentrations to initially decrease and then rapidlyincrease when magnetite begins to fractionate. Higher pres-sures also lead to the late onset of plagioclase crystallization,which elevates concentrations of Al2O3 above those observedin the Katmai samples (Figure 4c). The high modal pyroxenein the crystallizing assemblage along the entire liquid line ofdescent also causes greater enrichment in incompatible ele-ment abundances at a given SiO2 concentration in the 0.5 GPamodel than that observed in the Katmai samples (Figure 4a).The sharp variations in the slope of FeO* concentrations,when plotted against measures of fractionation such as MgO(Figure 4b), contrast with the consistent changes in slopeobserved for Katmai lavas. This contrast implies that someinternal mixing in the basalt through andesite compositionalrange could have occurred. However, the closer fit ofobserved compositional trends and the model trends at0.1 GPa, as compared to the trends at 0.5 GPa, suggests thatthe bulk compositions of the Katmai magmas were notformed in the deep or even middle crust but rather at shallowdepths.[28] In both the least squares and the MELTS models, the
total extent of crystallization from basalt K0543 to rhyoliteK1000a is 80–90%, and so for an erupted rhyolite volume of7.2 km3, the implied volume of parental basalt is of the order
TURNER ET AL.: U‐SERIES ISOTOPES IN KATMAI MAGMAS B12201B12201
11 of 22

of 65 km3. Evolution from an andesitic composition (e.g.,K0581) requires only 59% crystallization and a calculatedvolume of 17 km3, similar to that estimated by Hildreth andFierstein [2000].
5.2. Trace Elements
[29] In order to further test the major element modeling, thephase proportions and extents of crystallization from the leastsquares models were combined with the published partitioncoefficient data listed in Table 3 in a Rayleigh fractional
crystallization simulation of the incompatible trace elementvariation across the suite. Separate partition coefficients forthe basalt‐to‐dacite and dacite‐to‐rhyolite stages were takenfrom Rollinson [1993] with the following exceptions. Theclinopyroxene rare earth‐element partition coefficients werecalculated following the method outlined by Wood andBlundy [1997]. For U and Th the plagioclase partition coef-ficients were taken from Blundy and Wood [2003], whiletheir inferred Ra partition coefficient of 0.03 lies in therange determined experimentally by Miller et al. [2007] and
Figure 8. Plots of (a) extent of crystallization and (b) SiO2 versus temperature for the Katmai system fromthe MELTS modeling. The curve on Figure 8a shows the fit of the parameterized crystallization functionfrom section 7 to the MELTS output (black diamonds). In Figure 8b, the shaded boxes indicate the tem-perature ranges for andesite, dacite, and rhyolite obtained from Fe‐Ti oxide thermometry [Hildreth, 1983].Horizontal lines indicate the experimentally determined (H2O‐saturated) liquidus temperatures for theandesite, dacite, and rhyolite from Hammer et al. [2002]. For the dacite, the experimental temperature isshown as a arrow indicating the minimum appropriate temperature for this composition.
TURNER ET AL.: U‐SERIES ISOTOPES IN KATMAI MAGMAS B12201B12201
12 of 22

Fabbrizio et al. [2009]. Bulk pyroxene U and Th partitioncoefficients were derived from measured bulk pyroxenedata from Katmai andesite and dacite [Reagan et al., 2003]which were adjusted for glass contamination and guidedby the lattice‐strain model of Blundy and Wood [2003].The apatite partition coefficients represent the averages ofsamples 77 and 61B analyzed by Prowatke and Klemme[2006].[30] The results of the trace element modeling are com-
pared with the observed trace element compositions ofsamples K0581, K1267c, and K1000a in Figure 8. Althoughsome elements were better modeled than others, the generalshape of the patterns was reasonably well approximated ineach stage. This provides validation that the overall extentsof fractionation and the resultant volume calculations deter-
mined from the major element treatment are reasonablyrobust. In detail, there are discrepancies present for someelements like Ti, Zr, and P which probably reflect somecombination of errors resulting from the partition coeffi-cients chosen and the phase proportions from the least squaresmodeling. For example, inflections in both Zr and P2O5
concentrations around 65 wt % SiO2 (not shown in Figure 8)suggest the onset of accessory phase crystallization in themagmas. Apatite is commonly found in thin section, whereaszircon is generally not. Nevertheless, the zircon saturationcalculations [Watson and Harrison, 1983] indicate that therhyolites would crystallize zircon at a temperature <900°Cthat is significantly hotter than that inferred for these rocks inthe experiments of Coombs and Gardner [2001] and in theMELTS model presented above. Thus, zircon should have
Table 3. Partition Coefficients Used in Trace Element Modelinga
Olivine Orthopyroxene Clinopyroxene Plagioclase Magnetite Apatite
Basalt to Andesite to DaciteRb 0.03 0.02 0.05 0.04 0.15 0Ba 0.03 0.006 0.006 0.17 0 0.13Ra 0 0.002 0.002 0.03 0 0.1Th 0.00031746 0.008 0.008 0.0034 0.09 1.18U 0.002 0.0083 0.0083 0.0006 0 0.74Nb 0.01 0.13 0.027 0.026 0.7 52.6K 0.007 0.009 0.015 0.1 0.045 0La 0.0002 0.0031 0.257 0.32 0.055 0Ce 0.00007 0.0021 0.426 0.21 0.096 0.73Pb 0.0003 0.0014 0.0075 0.7 0.019 0Sr 0.01 0.15 0.075 2.41 0.11 0.518Nd 0.0003 0.0023 0.939 0.14 0.25 0Sm 0.01 0.0037 1.492 0.11 0.32 0Zr 0.012 0.18 0.26 0.048 0.127 4.76Hf 0.0029 0.019 0.33 0.06 4 0Eu 0.01 0.02 1.709 0.34 0.062 0Ti 0.015 0.205 0.265 0.083 16.5 0Gd 0.002 0.0085 1.885 0.09 0 0Tb 0.002 0.0085 2.003 0.09 0.52 0Dy 0.002 0.0085 2.053 0.09 0 0Y 0.0082 0.015 2.048 0.04 0.52 0Yb 0.024 0.038 1.755 0.04 0.5 0Lu 0.024 0.038 1.637 0.06 0.43 0
Dacite to RhyoliteRb 0.02 0.05 0.04 0.15 0Ba 0.006 0.006 0.17 0 0.13Ra 0.002 0.002 0.03 0 0.1Th 0.008 0.008 0.0034 0.09 1.18U 0.0083 0.0083 0.0006 0 0.74Nb 0.13 0.027 0.026 0.7 52.6K 0.009 0.015 0.1 0.045 0La 0.0031 0.412 0.32 0.055 0Ce 0.0021 0.696 0.21 0.096 0.73Pb 0.0014 0.0075 0.7 0.019 0Sr 0.15 0.075 2.41 0.11 0.518Nd 0.0023 1.57 0.14 0.25 0Sm 0.0037 2.504 0.11 0.32 0Zr 0.2 0.6 0.135 0.8 4.76Hf 0.019 0.33 0.06 4 0Eu 0.02 2.859 0.34 0.062 0Ti 0.205 0.265 0.083 16.5 0Gd 0.0085 3.133 0.09 0 0Tb 0.0085 3.299 0.09 0.52 0Dy 0.0085 3.341 0.09 0 0Y 0.015 3.304 0.04 0.52 0Yb 0.038 2.699 0.04 0.5 0Lu 0.038 2.484 0.06 0.43 0
aOn the basis of Wood and Blundy [1997], Blundy and Wood [2003], Prowatke and Klemme [2006], and the compilation byRollinson [1993]. Ba, Ra, Th and U values for pyroxene are based on measured bulk pyroxene data from Reagan et al. [2003],adjusted for glass contamination, and guided by Blundy and Wood [2003].
TURNER ET AL.: U‐SERIES ISOTOPES IN KATMAI MAGMAS B12201B12201
13 of 22

crystallized over an interval of up to 100°C, and we note thatLowenstern [1993] has observed tiny zircon crystals adheringto quartz phenocrysts in the rhyolite. Irrespective of thesecaveats, the trace element modeling concurs with the majorelement results since both show that closed‐system frac-tionation can explain much of the variation in Katmaimagma compositions.
5.3. Sr Isotopes
[31] Despite the observation that a simple fractionalcrystallization model does a good job at explaining the first‐order variation in the compositional data, the new Sr isotoperesults preclude production of the different Katmai rocks viaclosed‐system differentiation of a common parental magma.Moreover, as the hypothetical evolutionary paths sketchedon Figure 6a illustrate, there is no single liquid line of descentthat can link all of the products. Some form of mixing orcoupled assimilation and crystal fractionation (AFC) isrequired by the basalt‐andesite array. The rhyolites couldthen be produced by fractional crystallization from the mostradiogenic andesites, whereas the dacites could be producedeither by fractional crystallization, from magmas with Srisotope compositions like the less radiogenic basaltic andesiteparents, or by back‐mixing between the rhyolites and thebasaltic andesites (see Figure 6a). An alternative scenario isone in which the system is built up over time by multipleinjections of magmas [e.g., Jellinek and DePaolo, 2003;Annen et al., 2008] with variable 87Sr/86Sr compositions.[32] Potential assimilants include the Naknek Formation
sediments, within which the Katmai magmas are inferred tohave been stored [Hildreth and Fierstein, 2000], and oldersilicic material. In a model of progressive magma chamberbuild‐up [e.g., Annen et al., 2008], this could representrecently solidified fractionated magma that evolved fromearlier injections of mafic magma. Such material wouldaccordingly be anticipated to be similar in composition tothe erupted rhyolites [Reagan et al., 2003]. Evidence for theinvolvement of solidified silicic rocks is provided by thepresence of granitic clasts in the final ejecta around Novaruptadome [Hildreth and Fierstein, 2000].[33] Two‐end‐member mixing will be linear on the
87Sr/86Sr versus Rb/Sr plot on Figure 6b, and a mixingvector between the basalt and a Naknek sediment compo-sition completely misses the Katmai data array. The inset toFigure 6b shows that simple mixing between the primitivebasalt and the rhyolites cannot account for the compositionof the dacites, nor can back‐mixing between the rhyolites andandesites (banded pumice fragments indicate that magmamingling, rather than magma mixing, occurred [Hildrethand Fierstein, 2000]. In any case, the curvilinear trendsobserved for several major and trace elements (compare withFigures 4b and 4c) preclude simple two‐end‐member mixingmodels that may be important in other arc volcanic systems[e.g., Price et al., 2005; Reubi and Blundy, 2009].[34] One potential explanation for the variation in the Sr
isotopic compositions in Katmai lavas is assimilation duringfractional crystallization (AFC). In Figure 6b we show theresults of AFC modeling [DePaolo, 1981] using both theNaknek sediments (AM23 from Table 1) and a rhyolite aspotential contaminants (we chose sample K1000a for thispurpose). Bulk partition coefficients (DSr = 1.021; DRb =0.046) were based on the trace element modeling described
previously (see Table 3). As can be seen, assimilation of theNaknek sediments during fractional crystallization can accountfor increasing 87Sr/86Sr among the basalt‐andesite array. Therate of assimilation to fractional crystallization (r) was chosento be 0.3, as inferred to be typical of many magmatic systems.Note that because the Naknek sediment has a broadly similarcomposition to the dacites (see Table 1), moderate amountsof assimilation will not significantly affect the major ele-ment composition of the Katmai magmas. Replication of the87Sr/86Sr ratios of the rhyolites and some of the dacitesrequires an additional and subsequent period of closed‐system fractional crystallization. Alternatives to accountfor the composition of the andesites and dacites includeAFC involving silicic material followed by contaminationby the Naknek sediments (see Figure 6b) or injections ofmagma with varying 87Sr/86Sr. Narrowing the possibilitiesbetween these sequences of events is possible using theU‐series data.
6. U‐Series Constraints and the Time Scalesof Magmatic Evolution
[35] It is generally accepted that U‐series disequilibria inyoung volcanic rocks are inherited from the mantle, and con-vergent margin volcanic rocks typically preserve U‐Th‐Radisequilibria produced by fluid addition to their sourceregions [Turner et al., 2003]. The U‐series data presentedhere span a significant compositional range for an individualeruption and support the Sr isotope evidence for open‐systemmagmatic evolution beneath Katmai. As noted in many pre-vious studies, closed‐system fractionation in the absenceof significant modal proportions of accessory phases has alimited ability to fractionate U/Th ratios because both ele-ments are highly incompatible. This is well illustrated by thecalculated 90% fractionation vector in Figure 9a. An ines-capable consequence is that internally differentiated productsfrom closed systems are predicted to show little or no varia-tion in U‐Th isotopes, and this is clearly not the case atKatmai. The data therefore requires either input of magmaswith variable U/Th ratios, assimilation of a material with highU/Th, or fractionation of accessory phases with DTh > DU.[36] We explore this by transposing the same mixing and
AFC models discussed previously onto the U‐Th equilineand (226Ra/230Th) versus Th concentration diagrams shownin Figure 9. As for Figure 6b, two‐end‐member mixing islinear on the U‐Th equiline diagram. However, mixing withthe Naknek sediment or silicic plutonics is precluded by theSr isotope‐Rb/Sr relationships shown in Figure 6b. The twomodels of AFC, followed by subsequent bulk mixing withthe Naknek sediment that could satisfactorily explain the Srisotope data on Figure 6b, are also plotted in Figure 9. It isclear from Figure 9a, assuming the basalt as a starting com-position, that AFC involving the Naknek sediment cannotaccount for the data, leading instead to a negative slopedtrend.[37] AFC involving silicic material does a better job at
simulating the data, producing a positive trend that encom-passes much of the U‐Th range of the basalt‐andesite array(see Figure 9a). However, it does not reach the compositionsof the dacites or rhyolites and extrapolation of this AFCcurve would pass above the data at significantly higher(230Th/232Th). The reason for this is that the low partition
TURNER ET AL.: U‐SERIES ISOTOPES IN KATMAI MAGMAS B12201B12201
14 of 22

coefficients for U (and Th) do not allow the full U/Th rangeof the data to be reproduced. An additional AFC modelusing higher partition coefficients, as shown in Figure 9a,can provide a better approximation to the full basalt‐dacitecompositional array (we return to the rhyolites later). Sub-sequent mixing with the Naknek sediment (compare withFigure 6b) could explain the displacement of some of thesamples below this model curve to lower (230Th/232Th).However, partition data for phases in intermediate to silicicmagmas remain much less well constrained than in more
mafic systems. The higher partition coefficients used in thismodel lie at the upper end of those typically measured aswell as the ranges reported in compilations such as those byRollinson [1993]; they would likely require fractionation ofan accessory phase with DTh > DU such as apatite, but notzircon. Whereas this scenario cannot be ruled out, if thevariation in U/Th is related to assimilation of a high U/Thmaterial and fractional crystallization, then U‐Th shouldvary with measures of differentiation such as SiO2. Whilethis appears to be broadly true of the 1912 ejecta, it is nottrue when one considers the compositions of lavas eruptedfrom the geographically larger magmatic system. For example,an andesite lava erupted from Trident in 1959 has a U‐Thcomposition that is more similar to the Katmai dacites,whereas the Falling Mountain and Cerberus dacite domeshave compositions more akin to the Katmai andesites [seeReagan et al., 2003].[38] A more probable explanation for the variation in U/Th
and Sr isotope ratios in the Katmai magmas is that thebasaltic magmas feeding the system varied in compositionwith time (Figure 10a). In this scenario, variations in themajor and trace element concentrations would remain dom-inated by fractional crystallization. However, U/Th and Sr
Figure 9. Plots of (a) U‐Th equiline diagram and(b) (226Ra/230Th) versus Th showing the results of numer-ical fractionation and combined assimilation and fractionation(AFC) models (in 10% increments) using the same input para-meters as those detailed for Figure 6b (DU = 0.0193, DTh =0.0243, DRa = 0.02). The U‐series composition of the Nakneksediment was calculated from its measured U and Th con-centrations and assuming secular equilibrium. The modellabeled “(2) AFC rhyolite,” in Figure 9a assumed bulk Th andU partition coefficients of 0.265 and 0.205, respectively. Theeffects of additional aging from the latter model curve tosimulate the (230Th/232Th) ratios of the highest U/Th rhyolitesare indicated on the equiline diagram.
Figure 10. Plots of (a) 87Sr/86Sr and (b) Ba/La versus U/Thshowing the good correlation for the Katmai rocks that sug-gest variable slab‐derived signatures in the contributingmagmas.
TURNER ET AL.: U‐SERIES ISOTOPES IN KATMAI MAGMAS B12201B12201
15 of 22

isotope ratios changed because these ratios were higher forthe earlier mafic magmas that differentiated to form theKatmai andesites, dacites, and rhyolites compared with thosemagmasmore recently intruded into the system as representedby the erupted basalt and basaltic andesites. U‐Th data formafic lavas from the continental portion of the Aleutian arcshow such variability [George et al., 2003]. Additional sup-port for this contention can be found in the observation thatonly the basalt and basaltic andesite with 230Th‐excesseshave 87Sr/86Sr values less than 0.7035, whereas all othersamples have (230Th/238U) ≤ 1 and 87Sr/86Sr values in therange of 0.7036–0.7037. This can be attributed to the lattersamples having a slightly elevated contribution of Sr fromthe subducting slab compared with the former (Figure 6aand Table 1). The good correlation of U/Th with Ba/La(Figure 10b) for Katmai ejecta also suggests that the magmasfeeding this system had varying contributions from subductedcomponents. These changes would need to have occurredon a timescale less than the lifetime of U‐Th disequilibria(∼350 kyr) and they are thus unlikely to reflect changes inthe thermal state of the subducting plate. However, theycould reflect changes in subducted fluid contributions [Turneret al., 2003], or perhaps the assemblage of residual accessoryphases in the slab that can control the contributions of Thand La relative to more fluid mobile elements like U, Sr,and Ba [e.g., Kessel et al., 2005; Klimm et al., 2008; Planket al., 2009].[39] Our new 226Ra disequilibria data, especially in the
mafic rocks, provide even tighter constraints on the pro-cesses and timescales involved. Most critically, all of theandesites and several of the dacites have (226Ra/230Th) > 1,indicating that differentiation to generate some of the silicicmagmas in the Katmai system occurred over a much shortertime frame than might be inferred from the U‐Th data alone[cf. Reagan et al., 2003]. Overall, there is a general decreasein (226Ra/230Th) with the extent of differentiation, as indi-cated by increasing Th content (Figure 9b). However, thesamples with the largest 226Ra‐excess are not the basalt orbasaltic andesite but the andesites (Table 1), and the biggestincrease in the Sr‐isotope ratio is between the basalt and thebasaltic andesites. Nevertheless, the highest measured valuesprovide a reasonable maximum primary value for the inputmagmas, since higher (226Ra/230Th) ratios have not beenobserved in any other Aleutian lavas [George et al., 2003].Therefore, the modeling shown in Figure 9b assumes aninitial basaltic magma composition with a (226Ra/230Th) ratioof 2.5.[40] As illustrated in Figure 9b, because both Ra and Th
are highly incompatible, closed‐system (instantaneous) frac-tional crystallization has little effect on (226Ra/230Th) ratios.Assimilation of older silicic material (assumed to be in secularequilibrium) does result in AFC curves where (226Ra/230Th)decreases with increasing Th content, as observed, but thesestill predict higher (226Ra/230Th) ratios than those measuredin most of the Katmai samples (Figure 9b). Subsequentmixing with the Naknek sediment could result in a shiftbelow the AFC curves, as observed for many of the samples.However, the effects of the time taken for magmatic evo-lution are also likely to be important, and more specificconstraints implied by the U‐series data will be explored
subsequently in this paper following a discussion of thethermal budget of the Katmai magmatic system.
7. Numerical Thermal Models
[41] The well‐documented volumes of the 1912 eruption,combined with the geochemical and experimental con-straints on their depth of origin, afford an excellent oppor-tunity to compare the timescale constraints from a numericalmodeling of a cooling magma chamber with those obtainedfrom U‐series isotopes. As for the major and trace elementmodeling, the simplest, end‐member model is one in whichthe 1912 eruption products reflect closed‐system differen-tiation of a magma body into a layered chamber. The min-imum volume of this chamber is 13 km3, but it is highlylikely that not all of the magma was erupted. The geo-chemical modeling presented in this section suggests that itwould require some 90% fractionation to produce the rhyolitefrom the basalt. We therefore model magma volumes rangingfrom 15 to 65 km3 encompassing a range in erupted to none-rupted magma ratios of 0 to 5, which is broadly consistentwith the findings of Crisp [1984].[42] The way a magma chamber cools reflects a number of
processes, including the thermal structure of the surroundingcrust, its history of replenishment, the sequence of crystalli-zation, and the chamber shape and way convective processesboth within and outside the chamber facilitate redistributionof heat [Spera, 1980; Brandeis and Jaupart, 1986; Marsh,1988; Annen et al., 2008]. Our objective is not to exploreall of the contributory processes, many of which lack ade-quate constraints (such as the magma supply rate [Annenet al., 2008]). Rather, we are interested in establishing lim-iting bounds on the cooling of magma chambers of the sizeappropriate to Katmai.[43] The thermal budget of a cooling magma chamber is
significantly affected by the latent heat released duringcrystallization, for which our geochemical modeling providesrobust constraints, so we aim to establish upper bounds onlikely crystallization timescales, explicitly incorporating thecrystallization history. We focus our analysis on the coolingof a spherical stagnant magma chamber as a reference case.We also consider the likely effect of different aspect ratiosand the role that convective process within the magmachamber may play in accelerating cooling relative to thisreference case.[44] We approximated the MELTS‐derived crystallization
history using a series of Gaussian functions of the form
A* exp � T� Ttransð Þ2=dT2� �
=p
�� dT2� �
:
Our fit, which deviates from the MELTS model by at mosta few degrees (see Figure 8a), has three Gaussian terms,with the parameters listed in Table 4.[45] A key parameter in the cooling history is the tem-
perature of the surrounding crust. In view of the shallowdepths of the magma chamber, between 1 and 5 km andlikely 2–3 km [Hammer et al., 2002], we consider a tem-perature range of 100°C–500°C. The likelihood is that wallrock temperatures were less than 300°C, so we use this as a
TURNER ET AL.: U‐SERIES ISOTOPES IN KATMAI MAGMAS B12201B12201
16 of 22
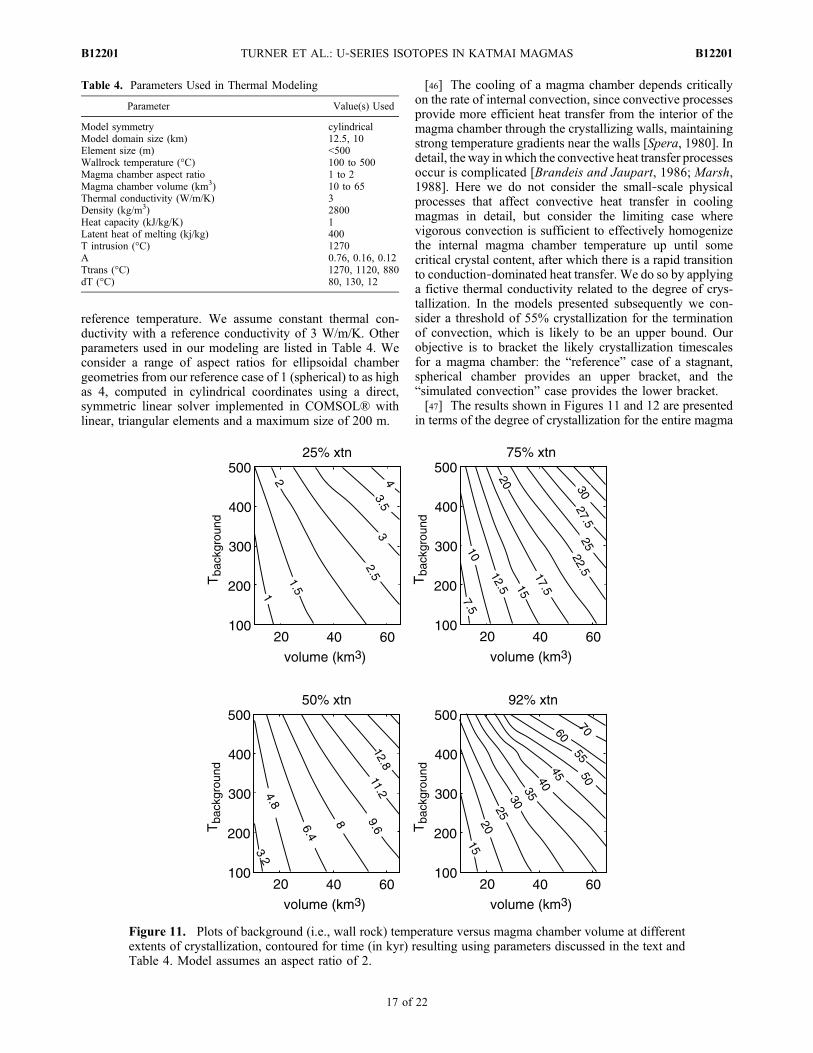
reference temperature. We assume constant thermal con-ductivity with a reference conductivity of 3 W/m/K. Otherparameters used in our modeling are listed in Table 4. Weconsider a range of aspect ratios for ellipsoidal chambergeometries from our reference case of 1 (spherical) to as highas 4, computed in cylindrical coordinates using a direct,symmetric linear solver implemented in COMSOL® withlinear, triangular elements and a maximum size of 200 m.
[46] The cooling of a magma chamber depends criticallyon the rate of internal convection, since convective processesprovide more efficient heat transfer from the interior of themagma chamber through the crystallizing walls, maintainingstrong temperature gradients near the walls [Spera, 1980]. Indetail, the way in which the convective heat transfer processesoccur is complicated [Brandeis and Jaupart, 1986; Marsh,1988]. Here we do not consider the small‐scale physicalprocesses that affect convective heat transfer in coolingmagmas in detail, but consider the limiting case wherevigorous convection is sufficient to effectively homogenizethe internal magma chamber temperature up until somecritical crystal content, after which there is a rapid transitionto conduction‐dominated heat transfer. We do so by applyinga fictive thermal conductivity related to the degree of crys-tallization. In the models presented subsequently we con-sider a threshold of 55% crystallization for the terminationof convection, which is likely to be an upper bound. Ourobjective is to bracket the likely crystallization timescalesfor a magma chamber: the “reference” case of a stagnant,spherical chamber provides an upper bracket, and the“simulated convection” case provides the lower bracket.[47] The results shown in Figures 11 and 12 are presented
in terms of the degree of crystallization for the entire magma
Table 4. Parameters Used in Thermal Modeling
Parameter Value(s) Used
Model symmetry cylindricalModel domain size (km) 12.5, 10Element size (m) <500Wallrock temperature (°C) 100 to 500Magma chamber aspect ratio 1 to 2Magma chamber volume (km3) 10 to 65Thermal conductivity (W/m/K) 3Density (kg/m3) 2800Heat capacity (kJ/kg/K) 1Latent heat of melting (kj/kg) 400T intrusion (°C) 1270A 0.76, 0.16, 0.12Ttrans (°C) 1270, 1120, 880dT (°C) 80, 130, 12
Figure 11. Plots of background (i.e., wall rock) temperature versus magma chamber volume at differentextents of crystallization, contoured for time (in kyr) resulting using parameters discussed in the text andTable 4. Model assumes an aspect ratio of 2.
TURNER ET AL.: U‐SERIES ISOTOPES IN KATMAI MAGMAS B12201B12201
17 of 22

Figure 12. Panels showing the effects of varying key input variables into thermal models such as thatpresented in Figure 11. (a–c) Varying aspect ratio (labeled “ar”) for different magma chamber volumesizes. (d) Varying wall rock temperature for a 30 km3 chamber. (e) varying chamber volume. (f) Varyinglatent heat of melting. On all panels the effects of simulated convection (labeled “sc”) are indicated byshaded curves.
TURNER ET AL.: U‐SERIES ISOTOPES IN KATMAI MAGMAS B12201B12201
18 of 22

chamber as a function of time (in kyr), as obtained by inte-grating over the chamber volume. Figure 11 shows back-ground (i.e., wall rock) temperature versus volume (i.e., totalchamber size) at different extents of crystallization, con-toured for time for a chamber with an aspect ratio of 2. InFigure 12, we illustrate the relative importance and effectsof varying parameters to the model, such as the aspect ratiofor different‐sized magma chambers (Figures 12a, 12b, and12c), varying wall rock temperature (Figure 12d), and latentheat of melting (Figure 12f). The gray curves on Figure 12illustrate the potential importance of the effect of convection,which leads to nearly an order of magnitude decrease in thetime required to crystallize up to 50–70% of the magma body.Assuming an aspect ratio of 2, a wall rock temperature of300°C, latent heat of melting of 400 kJ/kg, and a volume of65 km3, Figure 12e shows that it would take ∼15 kyr for amagma body of the size inferred to be appropriate for the
1912 eruption to crystallize 50%, and 45 kyr to crystallize90%. If convection is important, then 50% crystallizationcould occur in as little as 2.5 kyr, and 90% could occurwithin 35 kyr (see gray curves in Figure 12e). Note thatlayered convection would probably be required in order tonot destroy the development and preservation of composi-tional variations.
8. Integration of the Numerical and GeochemicalModels
[48] Returning now to the U‐series data, we investigatethe consequences of implementing the timescales deducedfrom the thermal models. In Figure 13, the black curvesrepresent the rhyolite AFC model assuming a stagnant65 km3 cooling magma chamber from Figure 12e, while thegray curves show the same model assuming a simulatedconvection model. Since these thermal models take intoaccount the effects of the latent heat of crystallization andconvection but do not consider the consequences of heatconsumed by partial melting of wall rocks, which isrequired for assimilation, the timescales for both can beconsidered as maxima. Importantly, because the time forcooling and crystallization is short compared to the half‐lifeof 230Th (75 kyr) and irrespective of the cooling modelassumed, the effect upon the AFC curves in the U‐Thequiline diagram is quite restricted (Figure 13a). Thus, U‐Thisotopes are probably most sensitive to (variable) parentalmagma composition and the effects of assimilation. In con-trast, the time taken for cooling and crystallization is verysignificant with respect to the half‐life of 226Ra (1.6 kyr),leading to rapid decreases in (226Ra/230Th) that come muchcloser to simulating the Katmai data. The results show thatthe data are encompassed by the end‐member‐scenariothermal models of stagnant and convecting magma chambers(see Figure 13b). In essence, these bracket the likely time-scales involved, but there are several observations that addfurther important detail to the simple time‐dependent AFCmodels just described.[49] As noted in Section 6, it is likely that the variation in
U/Th ratios and Sr isotopes reflects variation in the com-positions of the basaltic magmas feeding the system overtime. This is supported by the observation that several ofthe andesites have higher (226Ra/230Th) ratios than eitherthe basalt or basaltic andesite. Assuming that the highest(226Ra/230Th) ratios might be representative of the unmodifiedmantle signal, this suggests that the andesites probably hadcrustal residence times of <1000 years. Furthermore, itwould appear that the andesites are generally younger (i.e.,have higher (226Ra/230Th) ratios) than the dacites (whichcould be up to ∼8000 years old). Because basalt and basalticandesite would more likely evolve over shorter time periodsthan the andesites [e.g., Reagan et al., 2003], these basalticmagmas were likely to have evolved from parental magmasthat had lower initial (226Ra/230Th) ratios than the andesites.This latter explanation would also suggest that the andesiteshad the same crustal residence time as the basalt andbasaltic andesite, but the data do not allow us to distinguishbetween these two possibilities.[50] In contrast, the rhyolites have a (226Ra/230Th) ratio of
∼1 and plot at higher (230Th/232Th) than can be achieved byany of the AFC models. This suggests that these are sig-
Figure 13. Plots of (a) U‐Th equiline diagram. (b) (226Ra/230Th) versus Th showing the results of combining theAFC (rhyolite) and thermal models, assuming the rates ofcrystallization versus time taken from Figure 12e; the blackcurves show stagnant convection, shaded curves show sim-ulated convection (time elapsed in kyr).
TURNER ET AL.: U‐SERIES ISOTOPES IN KATMAI MAGMAS B12201B12201
19 of 22

nificantly older than the other magmas, and this age dif-ference is estimated in Figure 9a to range from ∼50–200 kyr[cf. Jellinek and DePaolo, 2003]. Importantly, since thethermal models indicate that even the largest likely volumeof magma would have solidified in a few tens of kiloyears(see Figures 11 and 12), the rhyolites could not have residedin the upper crust as liquids. Thus, the thermal models alsopreclude a closed system. Instead, we suggest that they wereinstead formed by thawing of earlier near‐eutectic, silicicmaterials that produced an aphyric magma. We note that themajor and trace element continuity with the associatedejecta nevertheless strongly suggests that any such materialwas produced from magmas evolving along a similar liquidline of descent.[51] The overall analysis leads to a preferred model in
which the magmatic system was built progressively overtime [e.g., Jellinek and DePaolo, 2003; Annen et al., 2008]with multiple mafic magma inputs providing both mass andheat, some of which led to thawing of an older, preexistingsilicic material that provided much of the magma mass forthe rhyolite. These mafic magmas were fluxing the systemuntil shortly before, or at the same time as, the final erup-tion. We have not attempted to construct a coupled thermaland U‐series model of this more complex (but realistic)scenario because there are too many unknown variables forthis to be worthwhile at this time. In particular, Jellinek andDePaolo [2003] and Annen et al. [2008] have shown thatthe mafic magma supply rate is a critical parameter in suchmodels. This can be estimated for steady state volcanicsystems, but clearly Katmai is neither steady state nor typ-ical of the Aleutian arc. Thus, we have little constraint forrealistic open‐system modeling. Nevertheless, the principalconclusion, that magmas ranging in composition from basaltto rhyolite had a wide range of crustal residence times,appears to be robust.
9. Conclusions
[52] Models invoked to explain the occurrence of large,compositionally zoned volcanic deposits that include sig-nificant volumes of rhyolite include long‐lived magmachambers that evolved through closed‐system fractionation,remelting of silicic plutons, and injection of rhyolite intounrelated andesitic magma chambers. The products of the1912 Katmai‐Novarupta eruption have major and traceelement and thermal‐redox continuity that is permissive ofthe first model. However, new Sr and particularly U‐seriesisotope data, along with new thermal models, eliminate thepossibility that these ejecta were derived from a closed‐system magma chamber. They require variable and minoramounts of assimilation and indicate that the differentmagma compositions had different crustal residence times.These residence times appear to be not linked to bulkcomposition in any simple way, and the system most likelywas built over time with progressive mafic inputs whichcontinued until shortly before or up until the 1912 eruption.It appears that the rhyolite was dominantly formed by eutecticmelting of earlier formed and compositionally related silicicmaterial. There is good evidence that the magmas were notgenerated in a deep crustal hot zone [cf. Annen et al., 2006],the major and trace element continuity does not supportmodels of interaction of unrelated magmas, and the rhyolite
is certainly not younger than the andesite [cf. Eichelbergerand Izbekov, 2000].[53] Accordingly, the evidence is that some combination
of the first two models is most appropriate, and we envisagethe following scenario: the Katmai magmatic system devel-oped over the last few hundred kiloyears, during which timemantle input probably waxed and waned. During periods ofincreased flux, the magmatic system grew and becamestratified, while periods of reduced flux led to greater crys-tallization. So long as the parental magmas had roughly thesame bulk composition and were emplaced under thesame pressure‐temperature conditions, each batch would beexpected to follow the same liquid line of descent. Thus, themajor and trace element data mimic closed‐system evolutionof a single body of magma undergoing internal differentia-tion. High‐silica, near‐eutectic liquid at the top of thechamber solidifies but remains close to its solidus, allowinga large amount of rhyolite to be produced with a very smalltemperature increase. During the final period of increasedmantle flux, the system volume grows, the silicic cap melts,and the combination of chamber volume and increasingvolatile pressure in the differentiating magmas leads toeruption [cf. Jellinek and DePaolo, 2003]. Although thisscenario is increasingly envisaged as a common one, itcannot be deduced from field observations or major andtrace element compositional variation. Only the short‐livedisotope data are sensitive to processes such as protractedmagma build‐up, differentiation, assimilation, and eruption.
[54] Acknowledgments. We wish to thank the organizers of the 2001Penrose Conference on Longevity and Dynamics of Rhyolitic Magma Sys-tems for inspiration and J. Lowenstern for providing the Naknek sample.We thank J. Blundy and an anonymous reviewer for constructive commentsand J. Lowenstern and M. Clynne for internal USGS reviews. This studywas supported by NERC grant NER/A/S/2000/01284 and NSF grantEAR0001003 (M.R.) and also used instrumentation funded by ARC LIEFand DEST Systemic Infrastructure Grants, Macquarie University, andindustry. S.T. acknowledges the support of the Royal Society UniversityResearch Fellowship and subsequently ARC Federation and ProfessorialFellowships. Initial analytical work was undertaken by R. George. Thisis contribution 656 from the Australian Research Council National KeyCentre for the Geochemical Evolution and Metallogeny of Continents(http://www.gemoc.mq.edu.au).
ReferencesAnnen, C., J. D. Blundy, and R. S. J. Sparks (2006), The genesis of inter-mediate and silicic magmas in deep crustal hot zones, J. Petrol., 47,505–539, doi:10.1093/petrology/egi084.
Annen, C., M. Pichavant, O. Bachmann, and A. Burgisser (2008), Condi-tions for the growth of a long‐lived shallow crustal magma chamberbelowMount Pelee volcano (Martinique, Lesser Antilles Arc), J. Geophys.Res., 113, B07209, doi:10.1029/2007JB005049.
Asimow, P. D., and M. S. Ghiorso (1998), Algorithmic modificationsextending MELTS to calculate subsolidus phase relations, Am. Mineral.,83, 1127–1131.
Bacon, C. R., and T. H. Druitt (1988), Compositional evolution of the zonedcalcalkaline magma chamber of Mount Mazama, Crater Lake, Oregon,Contrib. Mineral. Petrol., 98, 224–256, doi:10.1007/BF00402114.
Blundy, J., and B. Wood (2003), Mineral‐melt partitioning of Uranium,Thorium and their daughters, Rev. Mineral. Geochem., 52, 59–123,doi:10.2113/0520059.
Brandeis, G., and C. Jaupart (1986), On the interaction between convectionand crystallization in cooling magma chambers, Earth Planet. Sci. Lett.,77, 345–361, doi:10.1016/0012-821X(86)90145-7.
Brown, M., and T. Rushmer (2006), The Differentiation and Evolution of theContinental Crust, 553 pp., Cambridge Univ. Press, Cambridge, U. K.
Cheng, H., R. L. Edwards, J. Hoff, C. D. Gallup, D. A. Richards, andY. Asmerom (2000), The half lives of uranium‐234 and thorium‐230,Chem. Geol., 169, 17–33, doi:10.1016/S0009-2541(99)00157-6.
TURNER ET AL.: U‐SERIES ISOTOPES IN KATMAI MAGMAS B12201B12201
20 of 22

Christensen, J. N., and D. J. DePaolo (1993), Time scales of large volumesilicic magma systems: Sr isotopic systematics of phenocrysts and glassfrom the Bishop Tuff, Long Valley, California, Contrib. Mineral. Petrol.,113, 100–114, doi:10.1007/BF00320834.
Coombs, M. L., and J. E. Gardner (2001), Shallow‐storage conditions forthe rhyolite of the 1912 eruption at Novarupta, Alaska, Geology, 29,775–778, doi:10.1130/0091-7613(2001)029<0775:SSCFTR>2.0.CO;2.
Crisp, J. A. (1984), Rates of magma emplacement and volcanic output, J. Vol-canol. Geotherm. Res., 20, 177–211, doi:10.1016/0377-0273(84)90039-8.
Davies, G. R., and A. N. Halliday (1998), Development of the Long Valleyrhyolitic magma system: Strontium and neodymium isotope evidencefrom glasses and individual phenocrysts, Geochim. Cosmochim. Acta,62, 3561–3574, doi:10.1016/S0016-7037(98)00247-6.
DePaolo, D. J. (1981), Trace element and isotopic effects of combined wallrock assimilation and fractional crystallization, Earth Planet. Sci. Lett.,53, 189–202, doi:10.1016/0012-821X(81)90153-9.
Eichelberger, J. C., and P. E. Izbekov (2000), Eruption of andesite triggeredby dike injection: Contrasting cases at Karymsky volcano, Kamchatkaand Mount Katmai, Philos. Trans. R. Soc. London, Ser. A, 358,1465–1485, doi:10.1098/rsta.2000.0599.
Fabbrizio, A., M. W. Schmidt, D. Gunther, and J. Eikenberg (2009), Exper-imental determination of Ra mineral/melt partitioning for feldsparsand 226Ra‐disequilibrium crystallization ages of plagioclase andalkali‐feldspar, Earth Planet. Sci. Lett., 280, 137–148, doi:10.1016/j.epsl.2009.01.022.
Fierstein, J., and W. Hildreth (1992), The plinian eruptions of 1912 atNovarupta, Katmai National Park, Alaska, Bull. Volcanol., 54, 646–684,doi:10.1007/BF00430778.
Fierstein, J., and C. J. N. Wilson (2005), Assembling an ignimbrite: Com-positionally defined eruptive packages in the 1912 Valley of Ten Thou-sand Smokes ignimbrite, Alaska, Geol. Soc. Am. Bull., 117, 1094–1107,doi:10.1130/B25621.1.
Fierstein, J., B. F. Houghton, C. J. N. Wilson, and W. Hildreth (1997),Complexities of plinian fall deposition at vent: An example from the1912 Novarupta eruption (Alaska), J. Volcanol. Geotherm. Res., 76,215–227, doi:10.1016/S0377-0273(96)00081-9.
George, R., S. Turner, C. Hawkesworth, J. Morris, C. Nye, J. Ryan, andS.‐H. Zheng (2003), Melting processes and fluid and sediment transportrates along the Alaska‐Aleutian arc from an integrated U‐Th‐Ra‐Be iso-tope study, J. Geophys. Res., 108(B5), 2252, doi:10.1029/2002JB001916.
George, R., S. Turner, C. Hawkesworth, C. Nye, C. Bacon, P. Stelling, andS. Dreher (2004), Chemical versus temporal controls on the evolution oftholeiitic and calc‐alkaline magmas at two volcanoes in the Aleutian arc,J. Petrol., 45, 203–219, doi:10.1093/petrology/egg086.
Ghiorso, M. S., and R. O. Sack (1995), Chemical mass transfer in mag-matic processes. IV A revised and internally consistent thermodynamicmodel for the interpretation and extrapolation of liquid‐solid equilibriain magmatic systems at elevated temperatures and pressures, Contrib.Mineral. Petrol., 119, 197–212, doi:10.1007/BF00307281.
Halliday, A. N., G. A. Mahood, P. Holden, J. M. Metz, T. J. Dempster, andJ. P. Davidson (1989), Evidence for long residence times of rhyoliticmagma in the Long Valley magmatic system: The isotope record in pre-caldera lavas of Glass Mountain, Earth Planet. Sci. Lett., 94, 274–290,doi:10.1016/0012-821X(89)90146-5.
Hammer, J. E., M. J. Rutherford, and W. Hildreth (2002), Magma storageprior to the 1912 eruption at Novarupta, Alaska, Contrib. Mineral. Petrol.,144, 144–162.
Hawkesworth, C. J., S. Blake, P. Evans, R. Hughes, R. Macdonald, L. E.Thomas, S. P. Turner, and G. Zellmer (2000), The time scales of crystalfractionation in magma chambers: Integrating physical, isotopic, andgeochemical perspectives, J. Petrol., 41, 991–1006, doi:10.1093/petrology/41.7.991.
Hildreth, W. (1981), Gradients in silicis magma chambers: Implications forlithospheric magmatism, J. Geophys. Res., 86, 10,153–10,192,doi:10.1029/JB086iB11p10153.
Hildreth, W. (1983), The compositionally zoned eruption of 1912 inthe Valley of Ten Thousand Smokes, Katmai National Park, Alaska,J. Volcanol. Geotherm. Res., 18, 1–56, doi:10.1016/0377-0273(83)90003-3.
Hildreth, W., and J. Fierstein (2000), Katmai volcanic cluster and the greateruption of 1912, Geol. Soc. Am. Bull., 112, 1594–1620, doi:10.1130/0016-7606(2000)112<1594:KVCATG>2.0.CO;2.
Hildreth, W., and C. J. N. Wilson (2007), Compositional zoning of theBishop Tuff, J. Petrol., 48, 951–999, doi:10.1093/petrology/egm007.
Huppert, H. E., and R. S. J. Sparks (1988), The generation of granitic mag-mas by intrusion of basalt into continental crust, J. Petrol., 29, 599–624.
Jellinek, A. M., and D. J. DePaolo (2003), A model for the origin of largesilicic magma chambers: Precursors of caldera‐forming eruptions, Bull.Volcanol., 65, 363–381, doi:10.1007/s00445-003-0277-y.
Kessel, R., M. W. Schmidt, P. Ulmer, and T. Pettke (2005), Trace elementsignature of subduction‐zone fluids, melts and supercritical liquids at120–180 km depth, Nature, 437, 724–727, doi:10.1038/nature03971.
Klimm, K., J. D. Blundy, and T. H. Green (2008), Trace element partition-ing and accessory phase saturation during H2O‐saturated melting ofbasalt with implications for subduction zone chemical fluxes, J. Petrol.,49, 523–553, doi:10.1093/petrology/egn001.
Lowenstern, J. B. (1993), Evidence for a copper‐bearing fluid in magmaerupted at the Valley of Ten Thousand Smokes, Alaska, Contrib. Mineral.Petrol., 114, 409–421, doi:10.1007/BF01046542.
Lowenstern, J. B., and G. A. Mahood (1991), Petrogenesis of high‐silicarhyolite on the Alaska Peninsula, Geophys. Res. Lett., 18, 1565–1568,doi:10.1029/91GL01554.
Mahood, G. A. (1990), Second reply to comment of R. S. J. Sparks, H. E.Huppert, and C. J.N. Wilson on “Evidence for long residence times ofrhyolitic magma in the Long Valley magmatic system: The isotoperecord in precaldera lavas of Glass Mountain,”, Earth Planet. Sci. Lett.,99, 395–399, doi:10.1016/0012-821X(90)90145-N.
Marsh, B. D. (1988), On convective style and vigor in sheet‐like magmachambers, J. Petrol., 30, 479–530.
Miller, S., D. S. Burnett, P. D. Asmow, D. L. Phinney, and I. D. Hutcheon(2007), Experimental study of radium partitioning between anorthite andmelt at 1 atm, Am. Mineral., 92, 1535–1538, doi:10.2138/am.2007.2640.
Oldenburg, C., F. Spera, D. Yuen, and G. Sewell (1989), Dynamic mixingin magma bodies: Theory, simulations, and implications, J. Geophys.Res., 94, 9215–9236, doi:10.1029/JB094iB07p09215.
Plank, T., L. B. Cooper, and C. E. Manning (2009), Emerginggeothermometers for estimating slab surface temperatures, Nat. Geosci.,2, 611–615, doi:10.1038/ngeo614.
Price, R. C., J. A. Gamble, I. E. M. Smith, R. B. Stewart, S. Eggins, andI. C. Wright (2005), An integrated model for the temporal evolution ofandesites and rhyolites and crustal development in New Zealand’sNorth Island, J. Volcanol. Geotherm. Res., 140, 1–24, doi:10.1016/j.jvolgeores.2004.07.013.
Prowatke, S., and S. Klemme (2006), Trace element partitioning betweenapatite and silicate melts, Geochim. Cosmochim. Acta, 70, 4513–4527,doi:10.1016/j.gca.2006.06.162.
Rampino, M. R., and S. Self (1984), Sulphur‐rich volcanic eruptions andstratospheric aerosols, Nature, 310, 677–679, doi:10.1038/310677a0.
Reagan, M. K., K. W. W. Sims, J. Erich, R. B. Thomas, H. Cheng, R. L.Edwards, G. Layne, and L. Ball (2003), Time‐scales of differentiationfrom mafic parents to rhyolite in North American continental arcs,J. Petrol., 44, 1703–1726, doi:10.1093/petrology/egg057.
Reubi, O., and J. Blundy (2009), A dearth of intermediate melts at subduc-tion zone volcanoes and the petrogenesis of arc andesites, Nature, 461,1269–1273, doi:10.1038/nature08510.
Robock, A., and J. Mao (1992), Winter warming from large volcanic erup-tions, Geophys. Res. Lett., 19, 2405–2408, doi:10.1029/92GL02627.
Rollinson, H. (1993), Using Geochemical Data: Evaluation, Presentation,Interpretation, 352 pp., Longman, Harlow, U. K.
Sims, K. W., et al. (2008), An interlaboratory assessment of the Th isotopiccomposition of synthetic and rock standards, Geostand. Geoanal. Res.,32, 65–91, doi:10.1111/j.1751-908X.2008.00870.x.
Sparks, R. S. J., H. E. Huppert, and C. J. N. Wilson (1990), Comment on“Evidence for long residence times of rhyolitic magma in the LongValley magmatic system: The isotope record in precaldera lavas of GlassMountain” by A. N. Halliday, G. A. Mahood, P. Holden, J. M. Metz,T. J. Dempster and J. P. Davidson (1990), Earth Planet. Sci. Lett., 99,387–389, doi:10.1016/0012-821X(90)90143-L.
Spera, F. J. (1980), Thermal evolution of plutons: A parameterisedapproach, Science, 207, 299–301, doi:10.1126/science.207.4428.299.
Trial, A. F., and F. J. Spera (1990), Mechanisms for the generation of com-positional heterogeneities in magma chambers, Geol. Soc. Am. Bull., 102,353–367, doi:10.1130/0016-7606(1990)102<0353:MFTGOC>2.3.CO;2.
Turner, J. S., and I. H. Campbell (1986), Convection and mixing in magmachambers, Earth Sci. Rev., 23, 255–352, doi:10.1016/0012-8252(86)90015-2.
Turner, S., B. Bourdon, and J. Gill (2003), Insights into magma genesis atconvergent margins from U‐series isotopes, Rev. Mineral. Geochem., 52,255–315, doi:10.2113/0520255.
Turner, S., S. Black, and K. Berlo (2004), 210Pb−226Ra and 232Th−228Rasystematics in young arc lavas: Implications for magma degassing andascent rates, Earth Planet. Sci. Lett., 227, 1–16, doi:10.1016/j.epsl.2004.08.017.
van den Bogaard, P., and C. Schirnick (1995), 40Ar/39Ar laser probe ages ofBishop Tuff quartz phenocrysts substantiate long‐lived silicic magmachamber at Long Valley, U.S, Geology, 23, 759–762, doi:10.1130/0091-7613(1995)023<0759:AALPAO>2.3.CO;2.
TURNER ET AL.: U‐SERIES ISOTOPES IN KATMAI MAGMAS B12201B12201
21 of 22

Ward, P. L., A. M. Pitt, and E. Endo (1991), Seismic evidence for magma inthe vicinity of Mt. Katmai, Alaska, Geophys. Res. Lett., 18, 1537–1540,doi:10.1029/91GL01906.
Watson, E. B., and T. M. Harrison (1983), Zircon saturation revisited: Tem-perature and composition effects in a variety of crustal magma types,Earth Planet. Sci. Lett., 64, 295–304, doi:10.1016/0012-821X(83)90211-X.
Westrich, H. R., J. C. Eichelberger, and R. L. Hervig (1991), Degassing ofthe 1912 Katmai magmas, Geophys. Res. Lett., 18, 1561–1564,doi:10.1029/91GL01667.
Wolff, J. A., G. Wörner, and S. Blake (1990), Gradients in physical para-meters in zoned felsic magma bodies: Implications for evolution and erup-tive withdrawal, J. Volcanol. Geotherm. Res., 43, 37–55, doi:10.1016/0377-0273(90)90043-F.
Wood, B., and J. Blundy (1997), A predictive model for rare earth elementpartitioning between clinopyroxene and anhydrous silicate melt, Contrib.Mineral. Petrol., 129, 166–181, doi:10.1007/s004100050330.
C. Hawkesworth, Department of Earth Sciences, University of Bristol,Wills Memorial Building, Queen’s Road, Bristol BS8 1RJ, UK.W. Hildreth, United States Geological Survey, 345 Middlefield Rd.,
Menlo Park, CA 94025, USA.M. Reagan, Department of Geoscience, University of Iowa, Trowbridge
Hall, N. Capitol St., Iowa City, IA 52242 USA.M. Sandiford, School of Earth Sciences, University of Melbourne,
Parkville, VIC 3010, Australia.S. Turner, GEMOC, Department of Earth and Planetary Sciences,
Macquarie University, North Ryde, NSW 2109, Australia. ([email protected])
TURNER ET AL.: U‐SERIES ISOTOPES IN KATMAI MAGMAS B12201B12201
22 of 22