Embed Size (px)
Citation preview

Orion Investor
Presentation
Updated on 19 July 2016

This presentation contains forward-looking statements which involve risks and uncertainty factors. These statements are not based on historical facts but relate to the Company’s future activities and performance. They include statements about future strategies and anticipated benefits of these strategies.
These statements are subject to risks and uncertainties. Actual results may differ substantially from those stated in any forward-looking statement. This is due to a number of factors, including the possibility that Orion may decide not to implement these strategies and the possibility that the anticipated benefits of implemented strategies are not achieved. Orion assumes no obligation to update or revise any information included in this presentation.
Forward-looking statements
Investor Presentation (updated on 19 Jul 2016) 2
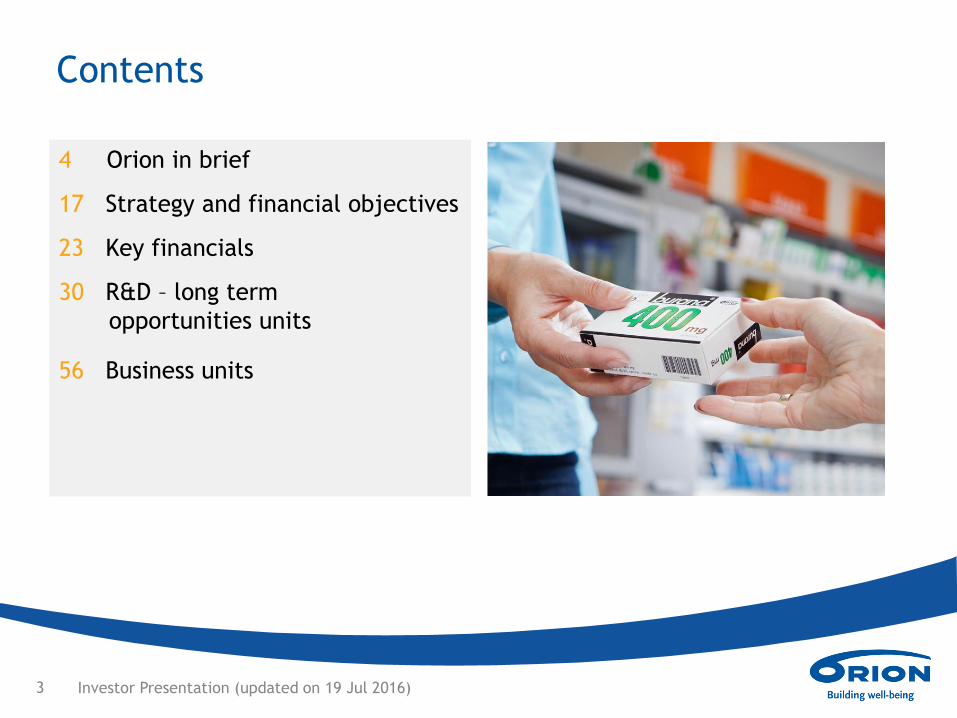
Contents
4 Orion in brief
17 Strategy and financial objectives
23 Key financials
30 R&D – long term
opportunities units
56 Business units
Investor Presentation (updated on 19 Jul 2016) 3

Orion in brief

Fermion (API production)
Investor Presentation (updated on 19 Jul 2016)
Specialty Products
(Gx + OTC)
Orion today – building well-being since 1917
Net sales ~mEUR 1,000
Personnel ~3,400
R&D expenses ~11% of
net sales
Six production sites in
Finland
Sales organisation in
>20 European
countries Proprietary Products
Animal Health
Contract Manufacturing
Orion Diagnostica
5

Steady development despite patent expiries
Investor Presentation (updated on 19 Jul 2016)
0%
2%
4%
6%
8%
10%
12%
0
200
400
600
800
1000
1200
2010 2011 2012 2013 2014 2015
Parkinson's franchise + Precedex
Other products
Growth, %
26%
27%
28%
29%
30%
31%
32%
0
50
100
150
200
250
300
2010 2011 2012 2013 2014 2015
Operating profit
Operating profit margin
EUR million EUR million
Net sales Operating profit
6

Investor Presentation (updated on 19 Jul 2016)
Product mix has changed
0
1
Category 1 Category 2 Category 3 Category 4
Proprietary Products Specialty Products (generics+OTC)
Animal Health Fermion
Contract Manufacturing & other Orion Diagnostica
45%
35%
7%
5% 3%
5%
Sales split by business 2011
32%
46%
7%
5% 4%
6%
Sales split by business 2015
7
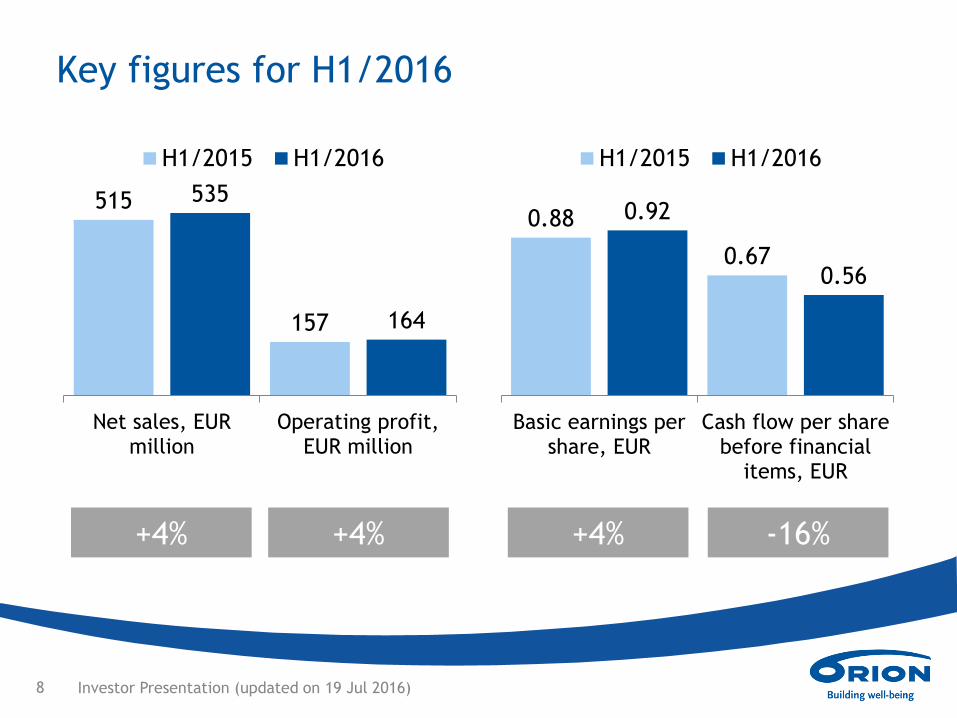
Key figures for H1/2016
Investor Presentation (updated on 19 Jul 2016)
515
157
535
164
Net sales, EURmillion
Operating profit,EUR million
H1/2015 H1/2016
0.88
0.67
0.92
0.56
Basic earnings pershare, EUR
Cash flow per sharebefore financial
items, EUR
H1/2015 H1/2016
+4% +4% +4% -16%
8

Investor Presentation (updated on 19 Jul 2016)
Breakdown of net sales
31%
16% 31%
8%
14%
Sales split by market area in 2015
Finland Scandinavia
Other Europe North America
Other countries
Net sales, EUR million H1/16
Change
vs.
H1/15 2015
Change
vs.
2014
Pharmaceuticals 509 +5% 961 -0%
Proprietary Products 185 +8% 323 -14%
Specialty Products 246 +10% 471 +10%
Animal Health 38 -13% 77 +10%
Fermion 20 -29% 53 -8%
Contract manufacturing
& other 19 -1% 37 +9%
Orion Diagnostica 28 -8% 58 +3%
Group items -2 -10% -3 +1%
Group total 535 +4% 1,016 +0%
9

Investor Presentation (updated on 19 Jul 2016)
Best-selling pharmaceuticals
Product Indication
Net sales
EUR million
H1/16
Change
vs. H1/15
Net sales
EUR million
2015
Parkinson’s disease 72 -11% 138
Asthma, COPD 32 +27% 51
Intensive care sedative 28 +27% 45
Acute decompensated
heart failure 28 +7% 51
Rheumatoid arthritis,
inflammatory bowel
diseases
22 +161% 28
Animal sedatives 12 -25% 27
Inflammatory pain 10 -6% 23
Intensive care sedative 10 +19% 18
Anticoagulant 9 -14% 19
Rheumatoid arthritis,
cancer 9 +35% 12
10

Investor Presentation (updated on 19 Jul 2016)
Key clinical pharmaceutical development projects 1/2
Project Indication PHASE Registration
Easyhaler® budesonide-formoterol 1) Asthma, COPD I II III Registration
Easyhaler® salmeterol-fluticasone Asthma, COPD I II III
ODM-201 (androgen receptor antagonist) 2) Prostate cancer
(nmCRPC) I II III
ODM-201 (androgen receptor antagonist) 2) Prostate cancer
(mHSPC) I II
Levosimendan 3) Low Cardiac Output
Syndrome I II III
ORM-12741 (alpha-2c adrenoceptor antagonist) 4) Alzheimer’s disease I IIa
Dexmedetomidine (intranasal) 5) Treatment of pain I IIb
ODM-109 (oral levosimendan) ALS I II
1) Aim is to obtain marketing authorisation for product in at least some European
countries not included in decentralised marketing authorisation application process. 2) In collaboration with Bayer 3) Partner: Tenax Therapeutics, Inc. 4) In collaboration with Janssen Pharmaceuticals 5) Partner: Recro Pharma, Inc.
= Phase completed
= Phase ongoing
= New project
More info about R&D projects at: http://www.orion.fi/en/rd/orion-rd/pipeline/
11
Investor Presentation (updated on 19 Jul 2016)
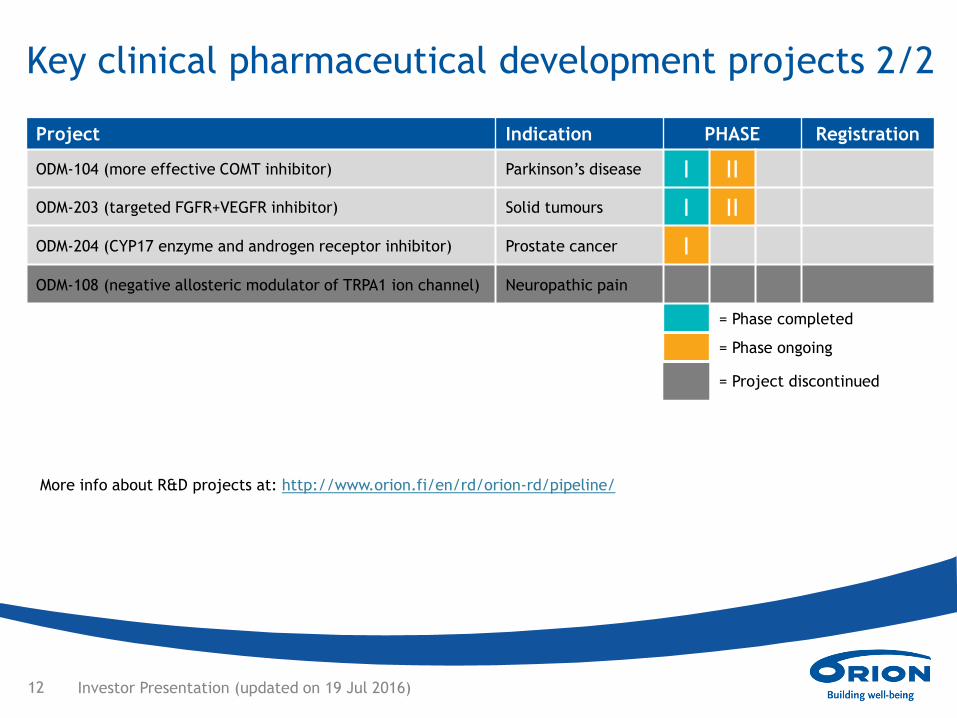
Key clinical pharmaceutical development projects 2/2
Project Indication PHASE Registration
ODM-104 (more effective COMT inhibitor) Parkinson’s disease I II
ODM-203 (targeted FGFR+VEGFR inhibitor) Solid tumours I II
ODM-204 (CYP17 enzyme and androgen receptor inhibitor) Prostate cancer I
ODM-108 (negative allosteric modulator of TRPA1 ion channel) Neuropathic pain
= Phase completed
= Phase ongoing
= Project discontinued
More info about R&D projects at: http://www.orion.fi/en/rd/orion-rd/pipeline/
12

Investor Presentation (updated on 19 Jul 2016)
Balancing mid-term − building long-term
Operational flexibility and efficiency. Global pricing pressure.
Easyhaler® combinations and
dexdor® for European markets.
Generic competition for Parkinson’s
franchise.
Generic drugs and self-care products.
(Specialty Products)
Long-term growth opportunities from
R&D pipeline. Milestone payments.
13

Two share classes, broad shareholder base
40%
42%
6%
5% 5% 2% 0%
By number of shares on 30 Jun
Households (Finnish retail investors)Non-Finnish holders and nominee registeredPrivate corporationsPublic sectorNon-profit institutionsFinancial and insurance corporationsOther
62%
9%
13%
7%
8% 1% 0%
By number of votes on 30 Jun
Households (Finnish retail investors)
Non-Finnish holders and nominee registered
Private corporations
Public sector
Non-profit institutions
Financial and insurance corporations
Other
Investor Presentation (updated on 19 Jul 2016)
Altogether 141.3 million shares and ca. 49,000 shareholders. Both share classes, A and B, are listed on
Nasdaq Helsinki since 1 July 2006. A share (ORNAV) has 20 votes/share and B share (ORNBV)
has 1 vote/share in the AGM, but they have equal rights to assets and dividends.
Monthly updated info available at: http://orion.fi/en/Orion-
group/investors/shareholders/ownership-structure/ 14

50
100
150
200
250
300
350
400
MSCI Europe Pharmaceuticals OMX Helsinki Cap Orion B Orion B total return
Orion B share performance 3 July 2006─30 June 2016
Investor Presentation (updated on 19 Jul 2016)
Index 3 July 2006 = 100
15

Orion listed to Helsinki
Stock Exchange
From conglomerate to pharmaceuticals and
diagnostics company
Investor Presentation (updated on 19 Jul 2016)
2006
Demerger into
Orion Oyj and
Oriola-KD Oyj
2003
Noiro divested
1993 1999
Normet divested
Chymos divested
1663
824
535
217
131 98
Orion in 1990 (sales FIM million)
Pharmaceuticals Oriola (wholesale)
Chymos (food industry) Noiro (technochemicals)
Normet (engineering) Orion Diagnostica
1995
16

Orion’s strategy
and financial
objectives

Investor Presentation (updated on 19 Jul 2016)
Orion’s strategy –
Mission to build well-being
18

Investor Presentation (updated on 19 Jul 2016)
Orion’s financial objectives
Increasing net sales.
Achievement of this objective requires continuous investment in
development of the product portfolio.
> Maintaining profitability at a good level.
The aim is operating profit that exceeds 20% of net sales.
≥ Keeping the equity ratio at least 50%.
€ Distributing an annual dividend that in the next few years will
be at least EUR 1.20 per share, and increasing the dividend in
the long term.
19

5%
10%
15%
20%
25%
30%
35%
0
50
100
150
200
250
300
Operating profit
Operatingprofit, EURmillion
Operatingprofit, % of netsales
Operatingprofit target>20%
Orion’s financial objectives
Investor Presentation (updated on 19 Jul 2016)
10%
20%
30%
40%
50%
60%
70%
0
50
100
150
200
250
300
Equity ratio and interest-bearing liabilities
Interest-bearingliabilities, EURmillionEquity ratio, %
Equity ratiotarget >50 %
-2%0%2%4%6%8%10%12%
-
200
400
600
800
1,000
1,200
Net sales
Net sales, EURmillion
Growth, %
EUR 0.00
EUR 0.30
EUR 0.60
EUR 0.90
EUR 1.20
EUR 1.50
Dividend
Dividend pershare
Dividend target>EUR 1.20
20

Dividend distribution
Investor Presentation (updated on 19 Jul 2016)
Dividend distribution policy
Orion’s dividend distribution takes into account distributable funds and capital
expenditure and other financial requirements in medium and long term to achieve the
financial objectives. 1.0
0
0.9
5
1.0
0
1.2
0
1.3
0
1.3
0
1.2
5
1.3
0
1.3
0
0.10
0.06 0.12
60%
65%
70%
75%
80%
85%
90%
95%
100%
EUR 0.00
EUR 0.20
EUR 0.40
EUR 0.60
EUR 0.80
EUR 1.00
EUR 1.20
EUR 1.40
EUR 1.60
Repayment of capital pershare
Dividend per share
Dividend payout ratio
Dividend distribution history
21

Investor Presentation (updated on 19 Jul 2016)
Outlook for 2016 (updated on 15 June 2016)
Net sales Net sales are estimated to be slightly higher than in 2015
(net sales were EUR 1,016 million in 2015).
Operating profit
Operating profit excluding possible capital gains is
estimated to exceed EUR 270 million (operating profit
was EUR 267 million in 2015).
The new outlook estimate provided on 15 June 2016 does not include potential
capital gains, such as a potential capital gain of about EUR 11 million to the
Company from the potential sale of Ekokem Corporation shares owned by the
Company based on the tender offer for Ekokem Corporation shares published by
Fortum Corporation.
22

Key financials
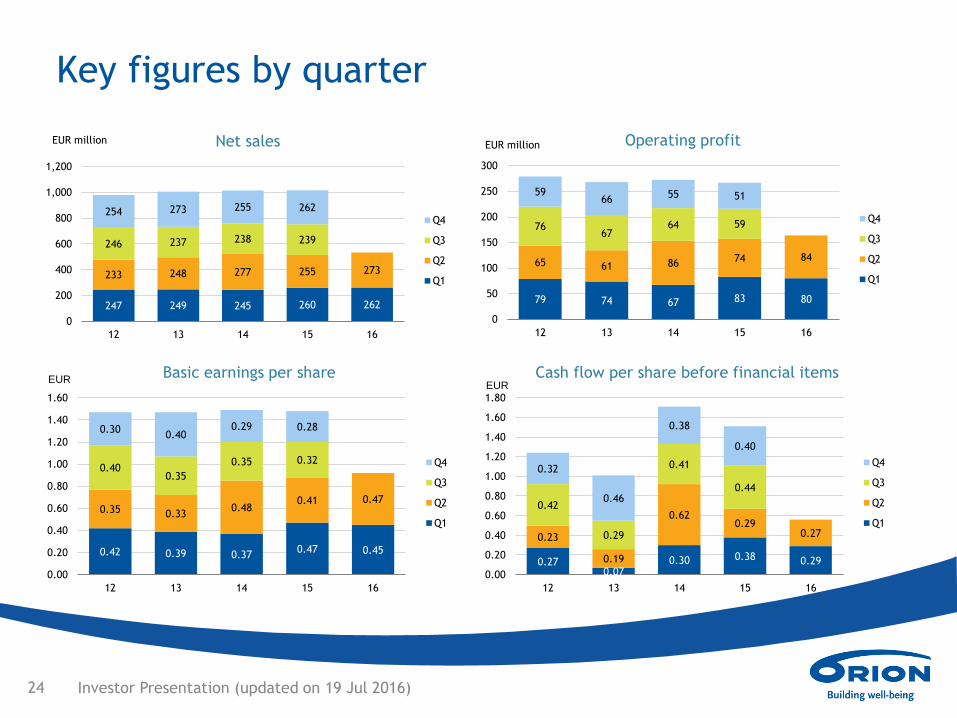
Key figures by quarter
79 74 67 83 80
65 61 86 74 84
76 67
64 59
59 66
55 51
0
50
100
150
200
250
300
12 13 14 15 16
Operating profit
Q4
Q3
Q2
Q1
EUR million
247 249 245 260 262
233 248 277 255 273
246 237 238 239
254 273 255 262
0
200
400
600
800
1,000
1,200
12 13 14 15 16
Net sales
Q4
Q3
Q2
Q1
EUR million
0.42 0.39 0.37 0.47 0.45
0.35 0.33 0.48
0.41 0.47
0.40 0.35
0.35 0.32
0.30 0.40
0.29 0.28
0.00
0.20
0.40
0.60
0.80
1.00
1.20
1.40
1.60
12 13 14 15 16
Basic earnings per share
Q4
Q3
Q2
Q1
EUR
0.27 0.07
0.30 0.38 0.29
0.23
0.19
0.62 0.29
0.27
0.42
0.29
0.41
0.44
0.32
0.46
0.38
0.40
0.00
0.20
0.40
0.60
0.80
1.00
1.20
1.40
1.60
1.80
12 13 14 15 16
Cash flow per share before financial items
Q4
Q3
Q2
Q1
EUR
Investor Presentation (updated on 19 Jul 2016) 24

Key figures for 2012─YTD6/2016
Orion’s key figures 2012 2013 2014 2015 YTD6/2016
Change %
vs.
YTD6/2015
Net sales, EUR million 980.4 1,006.9 1,015.3 1015.6 535.1 +3.9%
Operating profit, EUR million 278.3 267.7 272.4 266.6 163.9 +4.3%
Profit before taxes, EUR million 276.6 264.0 267.8 262.3 162.3 +4.3%
R&D expenses, EUR million 105.8 101.9 106.2 -108.1 53.4 +0.3%
Equity ratio, % 61.0% 53.6% 52.3% 57.4% 56.5%
Gearing, % -1.7% 8.4% -4.7% -9.6% 12.8%
ROCE (before taxes), % 45.9% 38.5% 36.6% 35.7% 45.2%
Return on equity, % 41.0% 40.3% 41.1% 37.5% 46.2%
Basic earnings per share, EUR 1.47 1.46 1.50 1.48 0.92 +4.4%
Cash flow per share before financial
items, EUR 1.23 1.02 1.72 1.51 0.56 -16.2%
Dividend per share, EUR 1.30 1.25 1.30 1.30
Investor Presentation (updated on 19 Jul 2016) 25

Income Statement 2011─YTD6/2016
Formation of profits,
EUR million 2012 2013 2014 2015 YTD6/2016
Change %
vs.
YTD6/2015
Net sales 980.4 1,006.9 1,015.3 1015.6 535.1 +3.9%
Cost of goods sold -350.8 -393.5 -401.7 -405.8 -201.7 +8.5%
Gross profit 629.6 613.4 613.6 609.8 333.4 +1.3%
Other operating income and
expenses 6.3 5.6 1.7 1.5 -0.1 -80.0%
Sales and marketing expenses -206.1 -204.9 -193.4 -190.4 -92.8 -2.2%
R&D expenses -105.8 -101.9 -106.2 -108.1 -53.4 +0.3%
Administrative expenses -45.7 -44.5 -43.3 -46.2 -23.4 -1.0%
Operating profit 278.3 267.7 272.4 266.6 163.9 +4.3%
Profit before taxes 276.6 264.0 267.8 262.3 162.3 +4.3%
Profit for the period 206.9 206.2 211.3 208.2 129.0 +4.5%
Investor Presentation (updated on 19 Jul 2016) 26

Investor Presentation (updated on 19 Jul 2016)
Capex normalising after investment program
0
20
40
60
80
100
2007 2008 2009 2010 2011 2012 2013 2014 2015
Orion Capex
Intangible assets
Property, plant and equipment
Depreciation, amortisation and impairment
EUR million
27

Financial position
Investor Presentation (updated on 19 Jul 2016)
EUR million 6/16 6/15 Change%
Non-current assets total 371.4 350.5 +6.0%
Inventories 213.6 199.4 +7.1%
Trade receivables 186.9 178.8 +4.5%
Other receivables 44.1 46.1 -4.3%
Cash & cash equivalents &
money market investments 119.7 169.4 -29.3%
Current assets total 564.3 593.7 -4.9%
Assets total 935.7 944.1 -0.9%
EUR million 6/16 6/15 Change%
Equity total 523.0 461.0 +13.5%
Interest-bearing non-
current liabilities 175.7 204.3 -14.0%
Non-current liabilities
total 216.5 272.9 -20.7%
Current liabilities total 196.1 210.3 -6.7%
Liabilities total 412.6 483.2 -14.6%
Equity and liabilities
total 935.7 944.1 -0.9%
28

Development of Net working capital
-25%
-15%
-5%
5%
15%
25%
35%
2012 2013 2014 2015 2016
ReceivablesInventoriesShort-term non-interest bearing liabilitiesNet Working Capital
-250
-150
-50
50
150
250
2012 2013 2014 2015 2016
ReceivablesInventoriesShort-term non-interest bearing liabilitiesNet Working Capital
Investor Presentation (updated on 19 Jul 2016)
EUR million % of net sales
29

Orion R&D –
long term
opportunities

Orion’s R&D strategy
Investor Presentation (updated on 19 Jul 2016)
Focused therapy
areas
Focus on three core therapy areas • Central nervous system diseases
• Oncology and critical care
• Easyhaler pulmonary drugs
Shared risks and
rewards
Emphasis on collaboration and partnerships
• Clinical studies are performed globally, Orion’s focus on Europe
• Partnerships are usually sought for clinical phase III at the latest
• Partners are important in marketing authorisation cases in countries outside Europe
• Orion holds the rights for further develop and market the candidate compounds
Focus on
strengths
In-house R&D covers mainly late-stage research and early-stage development phases
• i.e. discovery, preclinical phase and clinical phases I and II
Diversification
Constant strive to • Increase the overall number of programmes
• Balance the risks of individual projects
• Acquire new early research molecules
• Improve the life-cycle management of own innovative treatments
31

Collaborative networks across the R&D value chain
Investor Presentation (updated on 19 Jul 2016)
Late stage
development Early development Research
Early stage partnering
Target
identification and validation
Hit to Lead
generation
Lead
optimisation
Candidate
selection,
preclinical
development
Phase I Phase III Phase II
Late stage partnering
KEY CHARACTERISTICS OF LATE STAGE PARTNERING
• Late stage partnering typically after Proof of Concept
• Risk and reward sharing
• Partner has commercial capabilities especially in USA
• Potential for income before commercial sales in form of milestones
32
ODM-201
In collaboration with Bayer
A novel second generation
androgen receptor (AR)
antagonist for the treatment of
prostate cancer

• Orion and Bayer will jointly develop ODM-201, with Bayer
contributing a major share of the costs of future development
• Bayer will commercialize ODM-201 globally and Orion has the option
to co-promote ODM-201 in Europe
• Orion is eligible to receive milestone payments from Bayer upon
achievement of certain development, tech transfer and
commercialization milestones
• Orion will receive substantial royalties on future sales
• Orion will be responsible for manufacturing of the product
ODM-201: Partnership with Bayer – Financial terms
Investor Presentation (updated on 19 Jul 2016) http://www.orion.fi/en/rd/orion-rd/pipeline/ 34
Investor Presentation (updated on 19 Jul 2016)
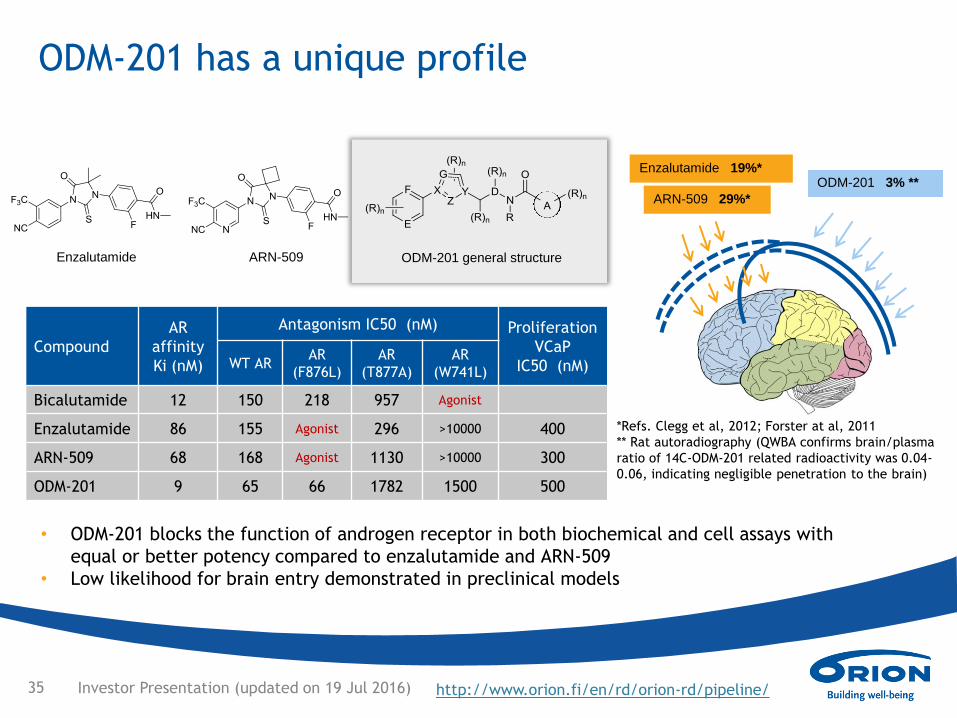
ODM-201 has a unique profile
Compound
AR
affinity
Ki (nM)
Antagonism IC50 (nM) Proliferation
VCaP
IC50 (nM) WT AR AR
(F876L)
AR
(T877A)
AR
(W741L)
Bicalutamide 12 150 218 957 Agonist
Enzalutamide 86 155 Agonist 296 >10000 400
ARN-509 68 168 Agonist 1130 >10000 300
ODM-201 9 65 66 1782 1500 500
• ODM-201 blocks the function of androgen receptor in both biochemical and cell assays with
equal or better potency compared to enzalutamide and ARN-509
• Low likelihood for brain entry demonstrated in preclinical models
Enzalutamide 19%*
ARN-509 29%*
ODM-201 3% **
*Refs. Clegg et al, 2012; Forster at al, 2011
** Rat autoradiography (QWBA confirms brain/plasma
ratio of 14C-ODM-201 related radioactivity was 0.04-
0.06, indicating negligible penetration to the brain)
Enzalutamide ARN-509 ODM-201 general structure
http://www.orion.fi/en/rd/orion-rd/pipeline/ 35

Investor Presentation (updated on 19 Jul 2016)
ODM-201: Phase III study ongoing in non-metastatic
castration resistant prostate cancer (nmCRPC)
• nmCRPC patients who are at high risk for
developing metastatic disease are included
(n=1500)
• Primary endpoint
– ODM-201 over placebo in metastasis-free survival
(MFS)
• Secondary endpoints
– Overall survival, time to first symptomatic skeletal
event (SSE), time to first initiation of cytotoxic
chemotherapy, time to pain progression, and to
characterize the safety and tolerability of ODM-201.
• Operational responsibility transferred from Orion to
Bayer in December 2014
• The study is proceeding as planned with estimated
completion in 2018
ODM-201 (androgen receptor antagonist) 2) Prostate cancer I II III
ClinicalTrials.gov identifier:
NCT02200614
http://www.orion.fi/en/rd/orion-rd/pipeline/ 36

ODM-201: Phase III study initiating in metastatic
hormone sensitive prostate cancer (mHSPC)
Investor Presentation (updated on 19 Jul 2016)
• ARASENS is a randomized, double-blind, placebo-controlled multicenter study that
is planned to be initiated towards the end of 2016
• Approximately 1,300 patients will be randomized (1:1 ratio) to receive either ODM-
201 or placebo in combination with an ADT of investigator’s choice (LHRH
agonist/antagonists or orchiectomy), started ≤12 weeks before randomization. Six
cycles of docetaxel will be administered after randomization.
• Primary endpoint
– overall survival
• Secondary endpoints
– time to castration-resistant prostate cancer, time to initiation of subsequent
antineoplastic therapy, symptomatic skeletal event free survival, time to first
symptomatic skeletal event, time to initiation of opioid use, time to pain progression,
time to worsening of physical symptoms of disease and safety.
ODM-201 (androgen receptor antagonist) 2) Prostate cancer
(mHSPC) I II
37

ODM-203 A unique and selective dual
FGFR+VEGFR inhibitor for
FGFR-dependent tumors

Investor Presentation (updated on 19 Jul 2016)
Angiogenic indications with altered FGFR signalling
Tumor type Genomic alterations of FGFRs and FGFs
Breast (luminal) ~35% (FGFR1 amp, FGFR2 amp, FGFR4 amp, FGFs)
NSCLC-SCC ~20% (FGFR1 amp, FGFR2 amp)
Bladder (invasive) ~15% (FGFR3 fusions, FGFR1 amp, FGFs)
Prostate ~14% (FGFR1 amp, FGFR2&3 fusions)
Colorectal ~10% (FGFR1 amp, FGFR3 mut)
Endometrial ~10% (FGFR2 mut)
Gastric ~7% (FGFR2 amp)
Renal ~6% (FGFR4 amp)
http://www.orion.fi/en/rd/orion-rd/pipeline/ 39

Investor Presentation (updated on 19 Jul 2016)
ODM-203 has strong in vivo antitumor activity FGFR xenograft model (RT4)
0
100
200
300
400
500
600
0 2 4 6 8 10 12 14 16 18 20 Treatment day
Vehicle control p.o. Selective FGFRi (12.5 mg/kg)
ODM - 203 (20 mg/kg) ODM - 203 (40 mg/kg)
Angiogenic kidney cancer model (Renca)
• Superior activity in angiogenic tumor models
• Strong antitumor activity in several FGFR dependent models
• No effect in a FGFR and VEGFR independent xenograft model
ODM-203 (targeted FGFR+VEGFR inhibitor) Solid tumours I II ClinicalTrials.gov identifier: NCT02264418
Phase II trial ongoing
http://www.orion.fi/en/rd/orion-rd/pipeline/ 40

ODM-204 Target:
Best-in-class treatment for
metastatic
Castration Resistant Prostate
Cancer (mCRPC)

Investor Presentation (updated on 19 Jul 2016)
Positioning of ODM-204
CRPC
Non-metastatic
Metastatic Metastatic Metastatic
Pre-Chemo Post-Chemo
Post Xtandi / Zytiga
AR F876L
AR-V7
Zytiga Zytiga
Xtandi Xtandi
ODM-204 ODM-201
Note: Zytiga/Xtandi combination trials are ongoing
http://www.orion.fi/en/rd/orion-rd/pipeline/ 42

Investor Presentation (updated on 19 Jul 2016)
ODM-204 – current status
• Phase I/II DUALIDES trial ongoing
– Safety and Pharmacokinetics of ODM-204 in Patients With
Metastatic Castration-Resistant Prostate Cancer (DUALIDES)
– Subgroups:
ClinicalTrials.gov identifier: NCT02344017
Number of
subjects
(approx.)
Chemotherapy Second-generation AR inhibitor
(e.g. enzalutamide)
CYP17A1i
(e.g. abiraterone
acetate)
15 Naive Naive Naive
15 Naive or pre-treated Naive Pre-treated
15 Naive or pre-treated Pre-treated Naive
ODM-204 (CYP17 enzyme and androgen receptor inhibitor) Prostate cancer I
http://www.orion.fi/en/rd/orion-rd/pipeline/ 43

ORM-12741
for Alzheimer’s
disease
In collaboration with Janssen

• Licence agreement announced on 19 December 2013
(includes ORM-12741 and other compounds)
• Orion received USD 31 million upfront payment which will
mainly be used against additional Phase IIa study costs
• Orion is eligible to receive milestone payments from Janssen
upon successful completion of certain development and
commercialization events, as well as royalties on future sales
• Orion has exclusive commercialization rights in Europe
• Janssen has worldwide exclusive license to develop ORM-12741
and an exclusive right to commercialize it outside Europe
• Orion and Janssen will co-fund the development after an
additional Phase IIa study is completed successfully by Orion
ORM-12741 – collaboration with Janssen
Investor Presentation (updated on 19 Jul 2016) http://www.orion.fi/en/rd/orion-rd/pipeline/ 45

Investor Presentation (updated on 19 Jul 2016)
ORM-12741
Imp
rovem
en
t
Quality of Memory
• Highly potent and selective alpha-
2C adrenoceptor antagonist
• Rodent models predict beneficial
effects on cognition and
neuropsychiatric symptoms (NPS)
• Phase 1 studies (healthy subjects)
– Possible to administer orally
– Well tolerated
– Displacement of an alpha-2C PET
tracer
• Phase 2a study in AD patients
– Positive signals of efficacy in
– Episodic and working memory
– and
– Neuropsychiatric symptoms
ClinicalTrials.gov identifier: NCT01324518
http://www.orion.fi/en/rd/orion-rd/pipeline/ 46

Objectives
• To evaluate efficacy of ORM-12741 on agitation & aggression and other
neuropsychiatric symptoms
• To evaluate efficacy of ORM-12741 on cognitive performance
• To evaluate safety
Design and methodology
• Randomised, double-blind, placebo-controlled, parallel-group, Phase 2 study
• Patients with mild to moderately severe Alzheimer’s disease
• 2 dose levels of ORM-12741 and placebo
Sample size
• 100/group = ~300
Investor Presentation (updated on 19 Jul 2016) http://www.orion.fi/en/rd/orion-rd/pipeline/
Phase 2 study on efficacy of ORM-12741 in AD
Improved formulation for the current Phase 2 study
• New formulation improving pharmacokinetic (PK) properties of ORM-12741 has been developed
• Phase 1 PK studies conducted to confirm qualities of the new formulation
• The improved formulation is used in the current Phase 2 study
ORM-12741 (alpha-2c adrenoceptor antagonist) Alzheimer’s disease I IIa
47

ODM-104

Investor Presentation (updated on 19 Jul 2016)
New COMT-inhibitor ODM-104 for Parkinson’s
disease treatment
• In phase I*, ODM-104 has been in well tolerated and superior to entacapone
by improving COMT inhibition and levodopa pharmacokinetics in man
• Optimized carbidopa component further improves ODM-104 effect with
double action on levodopa PK - levodopa exposure (AUC) increased over 30%
when compared to entacapone
• Phase II: ODM-104/optimized carbidopa/long-acting levodopa will be
compared with Stalevo® (levodopa/carbidopa/entacapone combination) in
PD patients with end-of-dose wearing-off symptoms
*) ClinicalTrials.gov identifier: NCT01840423
ODM-104 (more effective COMT inhibitor) Parkinson’s disease I II
http://www.orion.fi/en/rd/orion-rd/pipeline/ 49
ODM-109 Target:
Best symptomatic treatment
for Amyotrophic Lateral
Sclerosis (ALS)

Investor Presentation (updated on 19 Jul 2016)
LEVALS study - levosimendan in ALS patients
Levosimendan potentially delays the need for respiratory support and
improves QoL in ALS patients by increasing skeletal muscle force
• The first phase II study aims to demonstrate beneficial effects on respiratory
function
• Double-blind, cross-over design with 3 treatment periods
• Cross-over part of the study is followed by an open-label part for 6 months –
an opportunity to study long term effects
• The study will recruit approx. 50-60 patients in Europe
ODM-109 (oral levosimendan) ALS I II
Regulatory considerations for ODM-109
• Possibility to seek parallel orphan designation in EU and US
• Several options for fast track designation
http://www.orion.fi/en/rd/orion-rd/pipeline/ 51

Levosimendan for
Low Cardiac
Output Syndrome
Partner Tenax Therapeutics
*) www.tenaxthera.com and www.clinicaltrials.gov
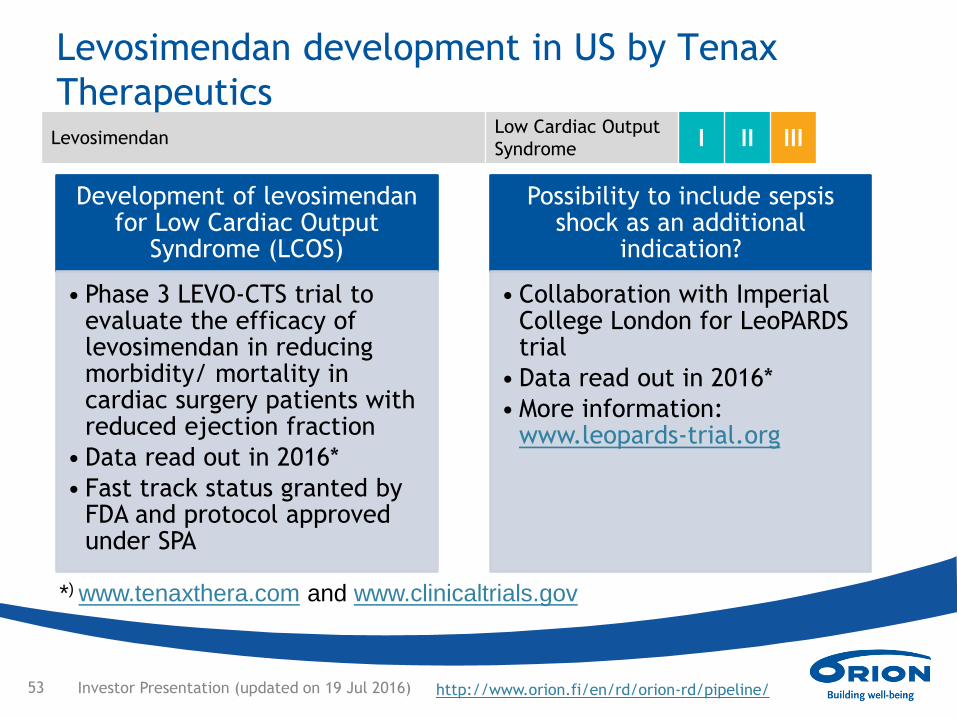
Development of levosimendan for Low Cardiac Output
Syndrome (LCOS)
• Phase 3 LEVO-CTS trial to evaluate the efficacy of levosimendan in reducing morbidity/ mortality in cardiac surgery patients with reduced ejection fraction
• Data read out in 2016*
• Fast track status granted by FDA and protocol approved under SPA
Possibility to include sepsis shock as an additional
indication?
• Collaboration with Imperial College London for LeoPARDS trial
• Data read out in 2016*
• More information: www.leopards-trial.org
Levosimendan Low Cardiac Output
Syndrome I II III
Levosimendan development in US by Tenax
Therapeutics
Investor Presentation (updated on 19 Jul 2016) http://www.orion.fi/en/rd/orion-rd/pipeline/ 53

Dexmedetomidine
for treatment of
pain
Partner Recro Pharma

Dexmedetomidine development for acute post-
operative pain by Recro Pharma
• Phase II trial to study the effect and safety of intranasal formulation
of dexmedetomidine in adult patients undergoing bunionectomy
surgery in US
• Possibility to avoid many of the side-effects associated with opioids
• Primary efficacy endpoint is summed pain intensity difference SPID48,
over 48 hours starting on post op day 1.
• Phase IIb trial completed in July 2015. Recro evaluating next steps *)
*) www.recropharma.com
ClinicalTrials.gov identifier: NCT02284243
Dexmedetomidine (intranasal) Treatment of pain I IIb
Investor Presentation (updated on 19 Jul 2016) http://www.orion.fi/en/rd/orion-rd/pipeline/ 55

Business units

Proprietary products
• Mainly Orion in-house developed
prescription drugs with valid
product protect
• Global partner network in sales
and R&D
Current main drivers
Generic competition for Stalevo,
Comtan/Comtess
Dexdor, Easyhaler & Simdax
Possible milestones from
development pipeline projects
Investor Presentation (updated on 19 Jul 2016)
0
50
100
150
200
250
300
350
400
450
2011 2012 2013 2014 2015
Sales, EUR million
Other
Stalevo
Comtan/Comtess
Precedex
Simdax
Easyhaler
Dexdor
57

Investor Presentation (updated on 19 Jul 2016)
Parkinson’s drugs
1) including sales to hospitals and retail distributors 2) sales to retail distributors only 3) Novartis sales area
Source: IMS Health sales statistics MAT3/2016
Market shares of Orion’s
branded Parkinson’s drugs MAT3/
2016
MAT3/
2015
Finland 1) 14% 19%
Sweden 1) 7% 13%
Norway 1) 15% 15%
Denmark 1) 5% 13%
Germany 2) 8% 12%
UK 2) 11% 12%
United States 2) 3) 2% 2%
Japan 1) 3) 12% 11%
0
10
20
30
40
50
60
Q1Q2Q3Q4Q1Q2Q3Q4Q1Q2Q3Q4Q1Q2
2013 2014 2015 16
EU
R m
illion
Deliveries to Novartis
Orion's own sales
58

Investor Presentation (updated on 19 Jul 2016)
Easyhaler® for asthma and COPD Easyhaler products = Orion invented inhaler + generic APIs
1993 Buventol Easyhaler® (salbutamol)
1994 Beclomet Easyhaler® (beclomethasone)
2002 Budesonide Easyhaler® (budesonide)
2004 Formoterol Easyhaler® (formoterol)
2014 Bufomix Easyhaler® (budesonide-formoterol)
2010 Development of fluticasone-salmeterol
0
2
4
6
8
10
12
14
16
18
Q1Q2Q3Q4Q1Q2Q3Q4Q1Q2Q3Q4Q1Q2
2013 2014 2015 16
EU
R m
illion
Others Bufomix Easyhaler
59

dexdor® intensive care sedative
Investor Presentation (updated on 19 Jul 2016)
66%
14%
7%
13%
Propofol EUR 348 million (+3%)
Midazolam EUR 74 million (-2%)
Dexmedetomidine EUR 38 million (+27%)
Remifentanil EUR 67 million (+5%)
European sedative market MAT3/2016* Total market value EUR 527 million (+4%)
Dexdor sales
*Source: IMS Health sales statistics MAT3/2016
0
2
4
6
8
10
12
14
16
Q1Q2Q3Q4Q1Q2Q3Q4Q1Q2Q3Q4Q1Q2
2013 2014 2015 16
EU
R m
illion
60
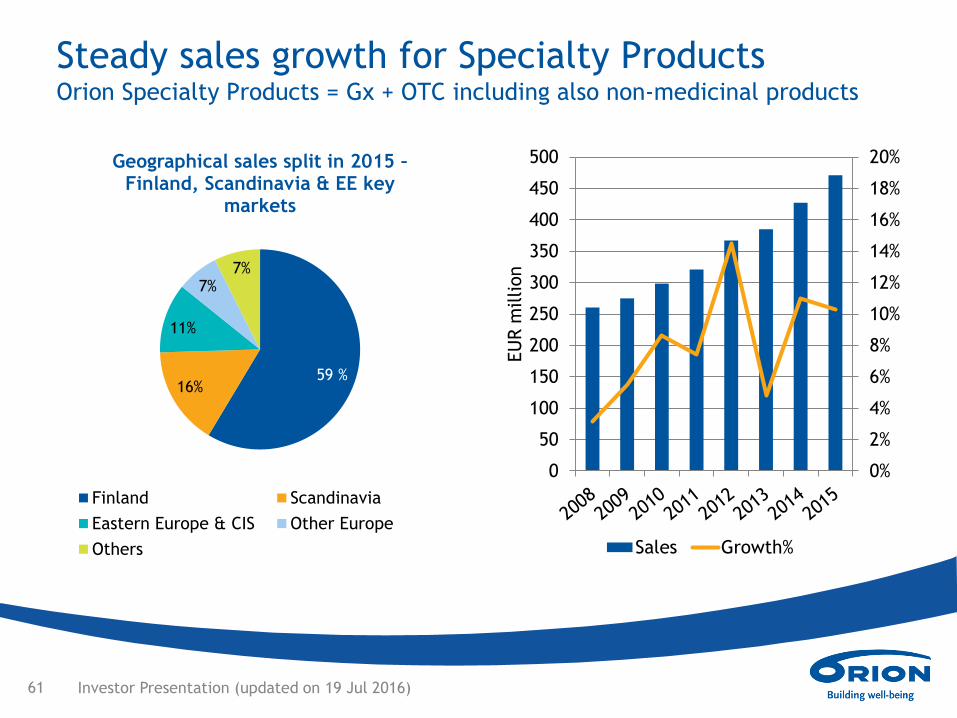
Steady sales growth for Specialty Products Orion Specialty Products = Gx + OTC including also non-medicinal products
Investor Presentation (updated on 19 Jul 2016)
0%
2%
4%
6%
8%
10%
12%
14%
16%
18%
20%
0
50
100
150
200
250
300
350
400
450
500
EU
R m
illion
Sales Growth%
59 % 16%
11%
7% 7%
Geographical sales split in 2015 – Finland, Scandinavia & EE key
markets
Finland Scandinavia
Eastern Europe & CIS Other Europe
Others
61

Investor Presentation (updated on 19 Jul 2016)
Specialty Products growing strongly in Scandinavia
• Remsima growth is expected to
slow in second half of the year
due to timing of tendering
competitions
Scandinavia Vs.
H1/15
42 +33%
Finland Vs.
H1/15
143 +8%
Eastern
Europe &
Russia
Vs.
H1/15
26 +3%
Net sales in key market areas in
H1/2016 (EUR million)
TOP 3 Products
Net sales
H1/2016
EUR million
Change
vs.
H1/2015
22 +161%
10 -6%
9 -14%
62

Orion Pharma Animal Health
Investor Presentation (updated on 19 Jul 2016)
Orion Pharma Animal Health direct sales
Global sales coverage through
partner network
-2%0%2%4%6%8%10%12%
0
15
30
45
60
75
90
2011 2012 2013 2014 2015
EU
R m
illion
Net sales Growth, %
Product portfolio
• Medicinal and non-medicinal products for
companion animals and livestock
• In-house developed proprietary products
sold globally both through own sales
network and through partners
• In-licensed products sold in own sales areas
63

Fermion has strategic importance
Investor Presentation (updated on 19 Jul 2016)
USA 47%
EU 31%
ROW 22%
Sales split in 2015*
-20%
-10%
0%
10%
20%
30%
40%
0
10
20
30
40
50
60
70
201020112012201320142015
EU
R m
illion
Net sales* Growth, %
*) Excluding supply to Orion
Fermion develops, manufactures and sells
active pharmaceutical ingredients (APIs)
Business segments: • NCEs for Orion’s existing and new proprietary
products
• Generics to Orion and other pharmaceutical
companies worldwide
• Custom development and manufacturing for
innovators with focus on high potency APIs
Main markets: USA, EU and Japan, ca. 100
customers
Ca. 35 products, both innovative and generic
APIs
64

Contract manufacturing & other
-30%
-15%
0%
15%
30%
45%
0
10
20
30
40
50
2011 2012 2013 2014 2015
EU
R m
illion
Net sales Growth, %
• Pharmaceutical
manufacturing for other
pharma companies
• Supply to global markets
• Orion has special know-how
ie. in hormonal semi-solids
and solutions
Read more http://www.orion.fi/en/contractmanufacturing
Investor Presentation (updated on 19 Jul 2016) 65

Orion Diagnostica
• Diagnostic test systems for
point-of-care testing in
healthcare and hygiene testing
for industry
• Main market areas: Europe
(especially northern), China,
USA, Japan
• Own sales units in 9 European
countries, distributor network
covering over 60 countries
• Focus in point-of-care IVD
• Key products: QuikRead® and
GenRead® platforms
-2%
0%
2%
4%
6%
8%
10%
0
10
20
30
40
50
60
70
2011 2012 2013 2014 2015
EU
R m
illion
Net sales Operating profit
Sales growth, %
Investor Presentation (updated on 19 Jul 2016) 66

Orion Investor
Relations
Jari Karlson
CFO
+358 10 426 2883
Tuukka Hirvonen
Communications Manager
Financial Communications & Investor Relations
+358 10 426 2721
Heidi Ahti
Executive Assistant (Investor meeting requests)
+358 10 426 2169
www.orion.fi/EN/Investors
twitter.com/OrionCorpIR