Embed Size (px)
Citation preview
Copyright © 2017 ORIX Corporation All rights reserved.
ORIX Corporation Third Quarter Consolidated Financial Results
For the Nine-Month Period Ended December 31, 2016
(TSE: 8591; NYSE: IX)
Kazuo Kojima Deputy President & CFO
Shintaro Agata Corporate Executive Vice President,
Head of Treasury Headquarters
Takao Kato Corporate Senior Vice President,
Head of Accounting Headquarters
January 26, 2017
Copyright © 2017 ORIX Corporation All rights reserved. 1
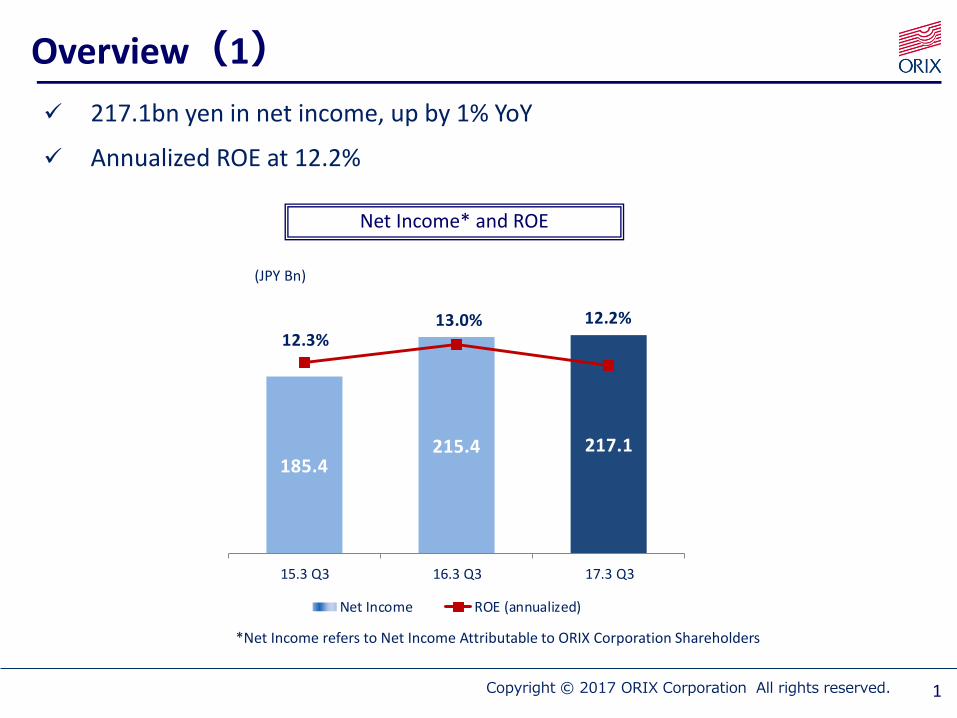
217.1bn yen in net income, up by 1% YoY
Annualized ROE at 12.2%
Overview(1)
Net Income* and ROE
*Net Income refers to Net Income Attributable to ORIX Corporation Shareholders
(JPY Bn)
185.4215.4 217.1
12.3%13.0% 12.2%
50
70
90
110
130
150
170
190
210
230
15.3 Q3 16.3 Q3 17.3 Q3
Net Income ROE (annualized)
Copyright © 2017 ORIX Corporation All rights reserved. 2
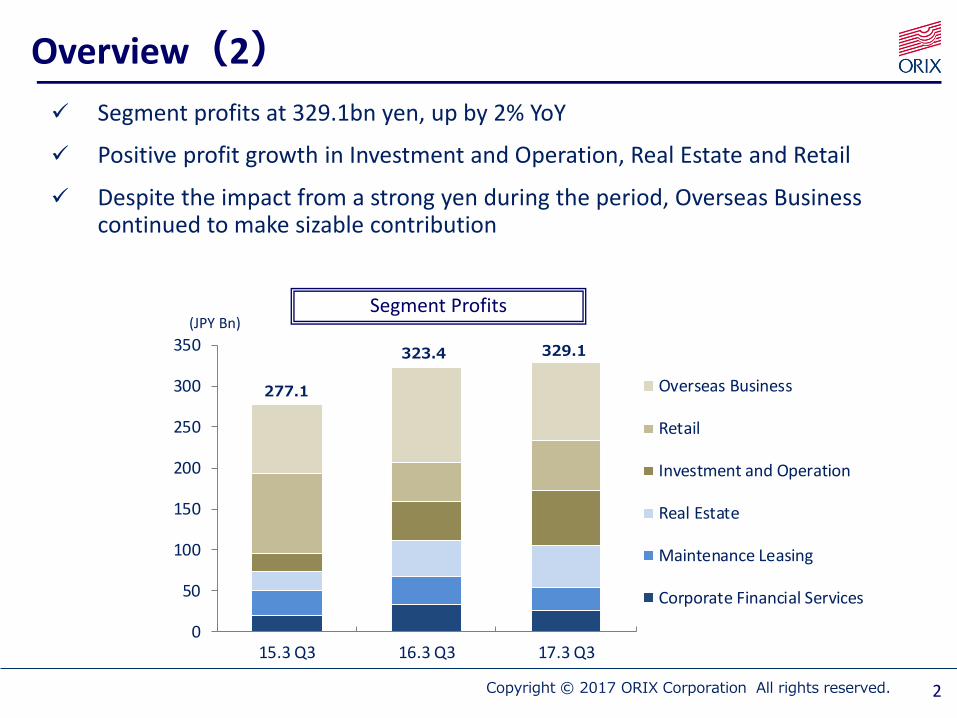
Segment profits at 329.1bn yen, up by 2% YoY
Positive profit growth in Investment and Operation, Real Estate and Retail
Despite the impact from a strong yen during the period, Overseas Business continued to make sizable contribution
Overview(2)
Segment Profits(JPY Bn)
0
50
100
150
200
250
300
350
15.3 Q3 16.3 Q3 17.3 Q3
Overseas Business
Retail
Investment and Operation
Real Estate
Maintenance Leasing
Corporate Financial Services
277.1
323.4 329.1
Copyright © 2017 ORIX Corporation All rights reserved. 3
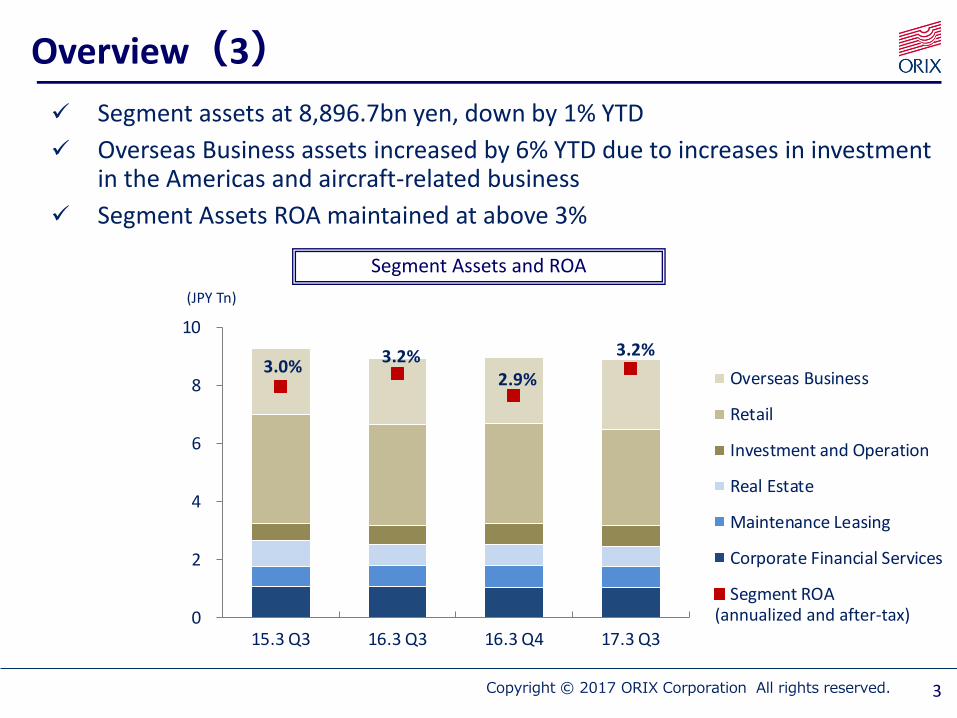
Segment assets at 8,896.7bn yen, down by 1% YTD
Overseas Business assets increased by 6% YTD due to increases in investment in the Americas and aircraft-related business
Segment Assets ROA maintained at above 3%
Overview(3)
Segment Assets and ROA
(JPY Tn)
3.0%3.2%
2.9%
3.2%
-0.2%
0.3%
0.8%
1.3%
1.8%
2.3%
2.8%
3.3%
3.8%
0
2
4
6
8
10
15.3 Q3 16.3 Q3 16.3 Q4 17.3 Q3
Overseas Business
Retail
Investment and Operation
Real Estate
Maintenance Leasing
Corporate Financial Services
Segment ROA(annualized and after-tax)

Copyright © 2017 ORIX Corporation All rights reserved.
8,972.4
287.5
77.5
137.8
81.6
59.47.0
8,896.7
16.3 Q4 17.3 Q3
RE
Sales of investments
Securitization
Foreginexchange
impact
HLIKK
Existingoperation (incl.new
investees)
334.7
14.8
98.2
30.993.9
21.0
334.1
16.3 Q3 17.3 Q3
Existingoperation (incl. new investees)
Gains on sales of
investments and others
Gains on
sales of RE*Gains on sales
of investments
and others in
FY16.3 Q3
Gains on
sales of RE*
in FY16.3
Q3
* Gains on sales of real estate includes "gains on sales of rental
property", "gains on investment securities and dividends" , "gains on sales of subsidiaries and affiliates and liquidation losses", and "gains on sales of equity method affil iates"(excl. condominium related gains) under Real Estate segment
4
Pretax profits: 0.6bn yen decrease YoY (▲0%) Recent strong yen reduced pretax profits by 12.5bn yen YoY Environment and energy business and Concession business made positive contribution as part of
the existing operation; income from aircraft-related business also increased Gains on sales of PE investments including investees in the Americas were recognized; higher gains
on sales of Real Estate assets YoY
Segment assets: 75.8bn yen decrease YTD (▲1%) Asset increase by 287.5bn yen due to increases mainly in auto-related business, environment and
energy business, Americas, and aircraft-related business
Overview(4)
0.6bn yen decrease YoY (▲0%)
YoY Changes in Pretax Profits
(JPY Bn)
YTD Changes in Segment Assets
(JPY Bn)
75.8bn yen decrease YTD
(▲1%)

Copyright © 2017 ORIX Corporation All rights reserved.
1.5%
2.7% 2.6%2.3%
0.0%
1.0%
2.0%
3.0%
4.0%
0
200
400
600
800
1,000
1,200
15.3 Q3 16.3 Q3 16.3 Q4 17.3 Q3
Direct financing leases Installment loans
Goodwill & otherintangible assets
Others
Segment ROA
18.7
33.8
26.3
0.0
5.0
10.0
15.0
20.0
25.0
30.0
35.0
40.0
0
20
40
60
80
100
15.3 Q3 16.3 Q3 17.3 Q3
Finance revenues Services income
Others Segment profits
5
Segment Performance(1)Corporate Financial Services
Segment profits: 26.3bn yen, down by 7.5bn yen YoY (▲22%) Finance revenues decreased due to lower installment loan balance, and gains on
sales of securities were lower compared to last year Services income continued to increase steadily
Segment assets: 1,038.9bn yen, down by 11.0bn yen YTD (▲1%) Installment loan balance decreased
Segment Revenues/Profits Segment Assets/ROAServices Income(JPY Bn)
(JPY Bn)
(JPY Bn)
0
5
10
15
20
25
30
35
15.3 Q3 16.3 Q3 17.3 Q3
Yayoi
(annualized and after-tax)

Copyright © 2017 ORIX Corporation All rights reserved.
4.2%4.3%
4.1%
3.6%
0.0%
0.5%
1.0%
1.5%
2.0%
2.5%
3.0%
3.5%
4.0%
4.5%
5.0%
0
200
400
600
800
15.3 Q3 16.3 Q3 16.3 Q4 17.3 Q3
Operating leases Direct financing leases
Others Segment ROA
6
Segment Performance(2)Maintenance Leasing
Segment profits: 28.6bn yen, down by 5.0bn yen YoY (▲15%) Profit contribution from Operating leases, which includes gains on sales of used
vehicles, decreased by 3.8bn yen YoY
Segment assets: 731.5bn yen, up by 0.2bn yen YTD (0%) Increase in new auto leases more than offset the decrease by securitization
(▲37.5bn yen)
Segment Revenues/Profits Segment Assets/ROA(JPY Bn) (JPY Bn)
31.633.7
28.6
0
50
100
150
200
250
15.3 Q3 16.3 Q3 17.3 Q3
Operating leases revenues Services income
Others Segment profits(annualized and after-tax)
Copyright © 2017 ORIX Corporation All rights reserved.
2.1%
5.0%
3.6%
6.4%
0.0%
1.0%
2.0%
3.0%
4.0%
5.0%
6.0%
7.0%
0
200
400
600
800
1,000
15.3 Q3 16.3 Q3 16.3 Q4 17.3 Q3
Rental property Operating facil ities
Others Segment ROA
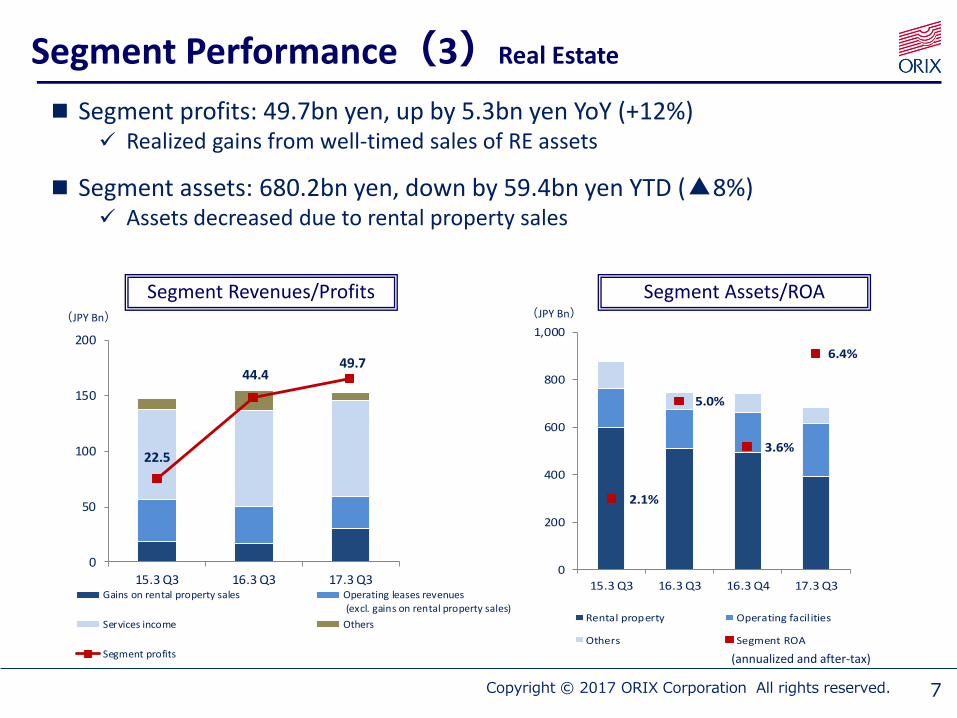
Segment Performance(3)Real Estate
Segment profits: 49.7bn yen, up by 5.3bn yen YoY (+12%) Realized gains from well-timed sales of RE assets
Segment assets: 680.2bn yen, down by 59.4bn yen YTD (▲8%) Assets decreased due to rental property sales
Segment Revenues/Profits Segment Assets/ROA(JPY Bn)(JPY Bn)
7
22.5
44.449.7
0
10
20
30
40
50
60
0
50
100
150
200
15.3 Q3 16.3 Q3 17.3 Q3Gains on rental property sales Operating leases revenues
(excl. gains on rental property sales)
Services income Others
Segment profits (annualized and after-tax)

Copyright © 2017 ORIX Corporation All rights reserved.
3.4%
6.4%
5.6%
8.9%
0.0%
1.0%
2.0%
3.0%
4.0%
5.0%
6.0%
7.0%
8.0%
9.0%
10.0%
0
100
200
300
400
500
600
700
800
15.3 Q3 16.3 Q3 16.3 Q4 17.3 Q3Loan servicing Principal investment
Environment and energy Others (incl. Daikyo)
Segment ROA
23.0
46.7
68.8
0.0
10.0
20.0
30.0
40.0
50.0
60.0
70.0
80.0
0
200
400
600
800
1,000
15.3 Q3 16.3 Q3 17.3 Q3
OthersServices incomeSales of goods and real estateSegment profits
8
Segment Performance(4)Investment and Operation
Segment profits: 68.8bn yen, up by 22.1bn yen YoY (+47%)
Profit growth largely driven by exit of PE investments and services income growth in environment and energy business
Segment assets: 697.6bn yen, down by 6.6bn yen YTD (▲1%)
New investments were made while we exit existing investments; assets in environment and energy business grew primarily in mega solar projects
Segment Revenues/Profits Segment Assets/ROAServices Income
(JPY Bn)
(JPY Bn)(JPY Bn)
0
50
100
150
200
250
15.3 Q3 16.3 Q3 17.3 Q3
Others
Real estate management & contract work
Environment & energy related business
(annualized and after-tax)
Copyright © 2017 ORIX Corporation All rights reserved.
96.6
48.8
60.1
0
20
40
60
80
100
0
100
200
300
400
15.3 Q3 16.3 Q3 17.3 Q3Others Finance revenues
Life insurance premiums andrelated investment income
Segment profits
9
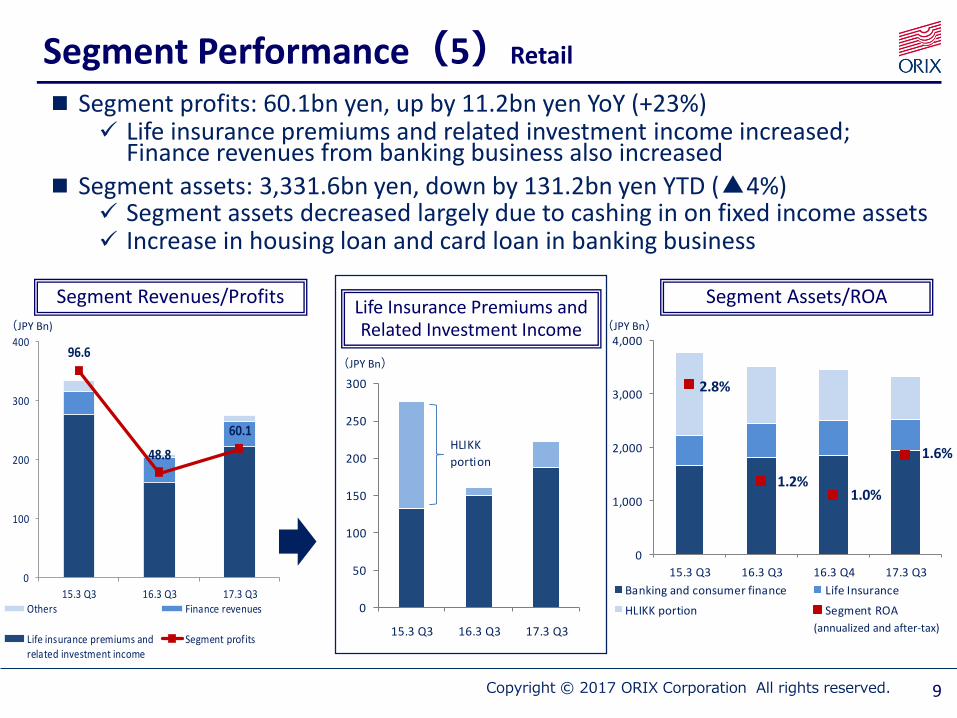
Segment Performance(5)Retail
Segment profits: 60.1bn yen, up by 11.2bn yen YoY (+23%) Life insurance premiums and related investment income increased;
Finance revenues from banking business also increased
Segment assets: 3,331.6bn yen, down by 131.2bn yen YTD (▲4%) Segment assets decreased largely due to cashing in on fixed income assets Increase in housing loan and card loan in banking business
Segment Revenues/Profits Segment Assets/ROALife Insurance Premiums and Related Investment Income(JPY Bn)
(JPY Bn)
(JPY Bn)
0
50
100
150
200
250
300
15.3 Q3 16.3 Q3 17.3 Q3
HLIKK
portion
2.8%
1.2%1.0%
1.6%
0.0%
0.5%
1.0%
1.5%
2.0%
2.5%
3.0%
3.5%
0
1,000
2,000
3,000
4,000
15.3 Q3 16.3 Q3 16.3 Q4 17.3 Q3
Banking and consumer finance Life Insurance
HLIKK portion Segment ROA
(annualized and after-tax)
Copyright © 2017 ORIX Corporation All rights reserved.
84.8
116.0
95.6
0
20
40
60
80
100
120
140
0
100
200
300
400
500
15.3 Q3 16.3 Q3 17.3 Q3
Finance revenues Services income Operating leases
Others Segment profits
3.4%
4.6%4.3%
3.7%
0.0%
0.5%
1.0%
1.5%
2.0%
2.5%
3.0%
3.5%
4.0%
4.5%
5.0%
0
500
1,000
1,500
2,000
2,500
15.3 Q3 16.3 Q3 16.3 Q4 17.3 Q3
Americas Leasing operation (excl. Americas)
Investment operation (excl. Americas) Robeco
Segment ROA
10
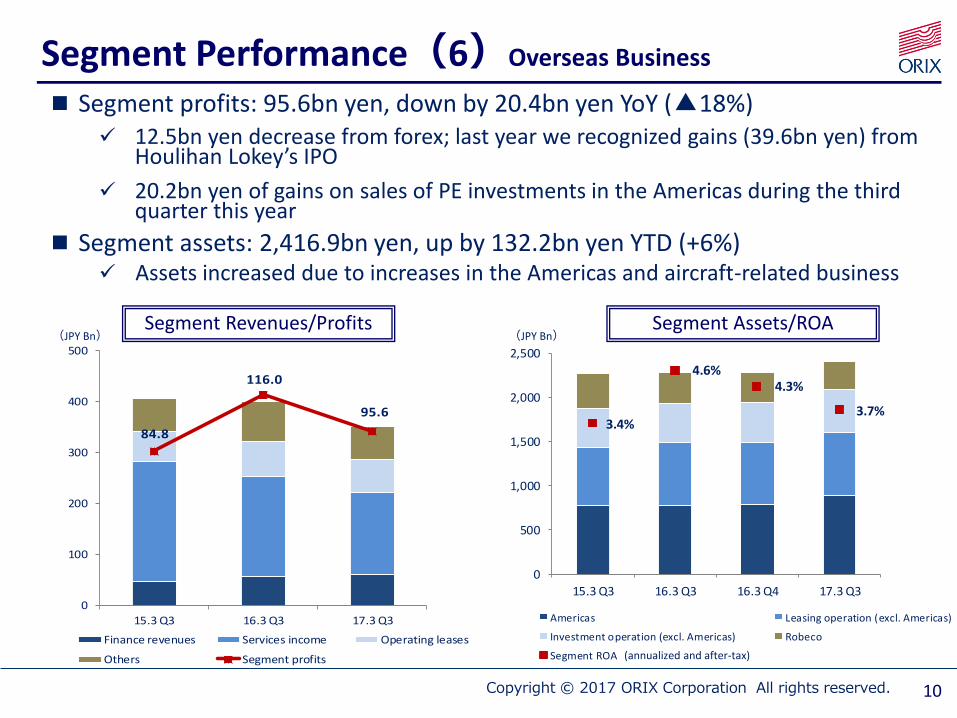
Segment Performance(6)Overseas Business
Segment profits: 95.6bn yen, down by 20.4bn yen YoY (▲18%) 12.5bn yen decrease from forex; last year we recognized gains (39.6bn yen) from
Houlihan Lokey’s IPO
20.2bn yen of gains on sales of PE investments in the Americas during the third quarter this year
Segment assets: 2,416.9bn yen, up by 132.2bn yen YTD (+6%) Assets increased due to increases in the Americas and aircraft-related business
Segment Assets/ROASegment Revenues/Profits(JPY Bn) (JPY Bn)
(annualized and after-tax)
Copyright © 2017 ORIX Corporation All rights reserved.
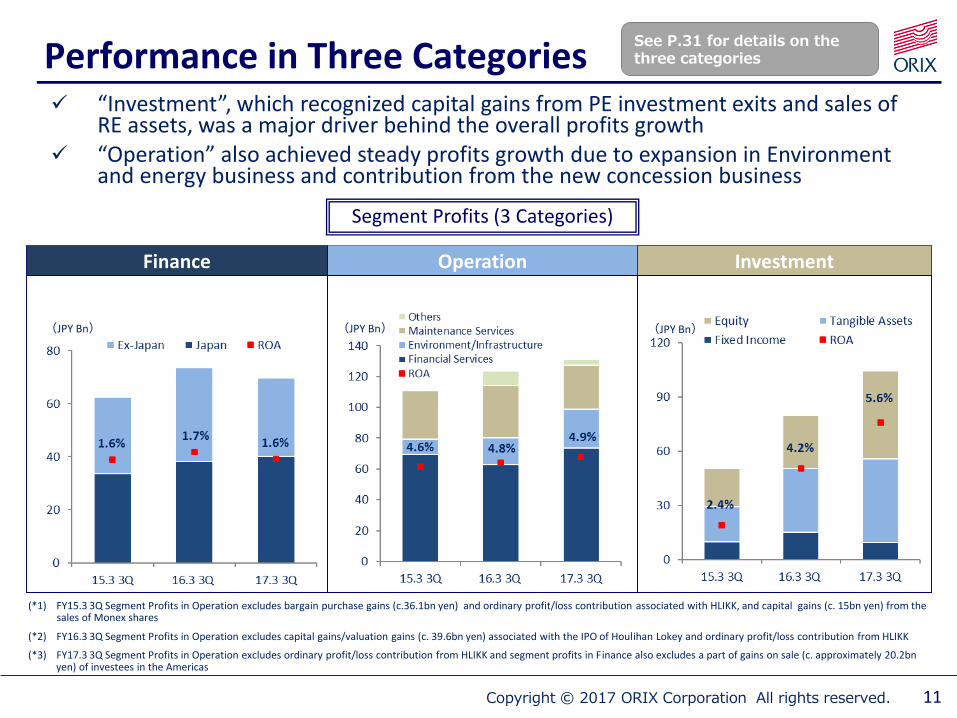
Performance in Three Categories
Segment Profits (3 Categories)
11
“Investment”, which recognized capital gains from PE investment exits and sales of RE assets, was a major driver behind the overall profits growth
“Operation” also achieved steady profits growth due to expansion in Environment and energy business and contribution from the new concession business
(JPY Bn)
OperationFinance Investment
(JPY Bn) (JPY Bn)
(*1) FY15.3 3Q Segment Profits in Operation excludes bargain purchase gains (c.36.1bn yen) and ordinary profit/loss contribution associated with HLIKK, and capital gains (c. 15bn yen) from the sales of Monex shares
(*2) FY16.3 3Q Segment Profits in Operation excludes capital gains/valuation gains (c. 39.6bn yen) associated with the IPO of Houlihan Lokey and ordinary profit/loss contribution from HLIKK
(*3) FY17.3 3Q Segment Profits in Operation excludes ordinary profit/loss contribution from HLIKK and segment profits in Finance also excludes a part of gains on sale (c. approximately 20.2bn yen) of investees in the Americas
See P.31 for details on the three categories
Copyright © 2017 ORIX Corporation All rights reserved.
Summary
Net income at 217.1bn yen, annualized ROE at 12.2%
Solid overall results
With a focus on “Operation” and “Investment”, continue to develop new businesses and further strengthen stable earning streams
12
Copyright © 2017 ORIX Corporation All rights reserved.
Appendix
13
Copyright © 2017 ORIX Corporation All rights reserved.
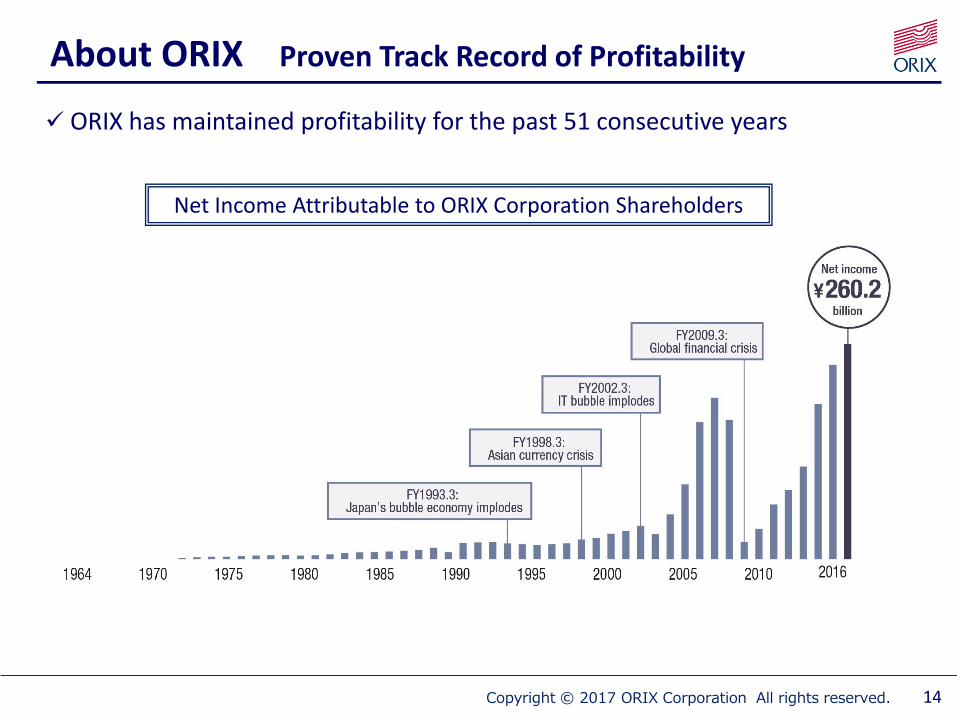
ORIX has maintained profitability for the past 51 consecutive years
Net Income Attributable to ORIX Corporation Shareholders
About ORIX Proven Track Record of Profitability
14
Copyright © 2017 ORIX Corporation All rights reserved.
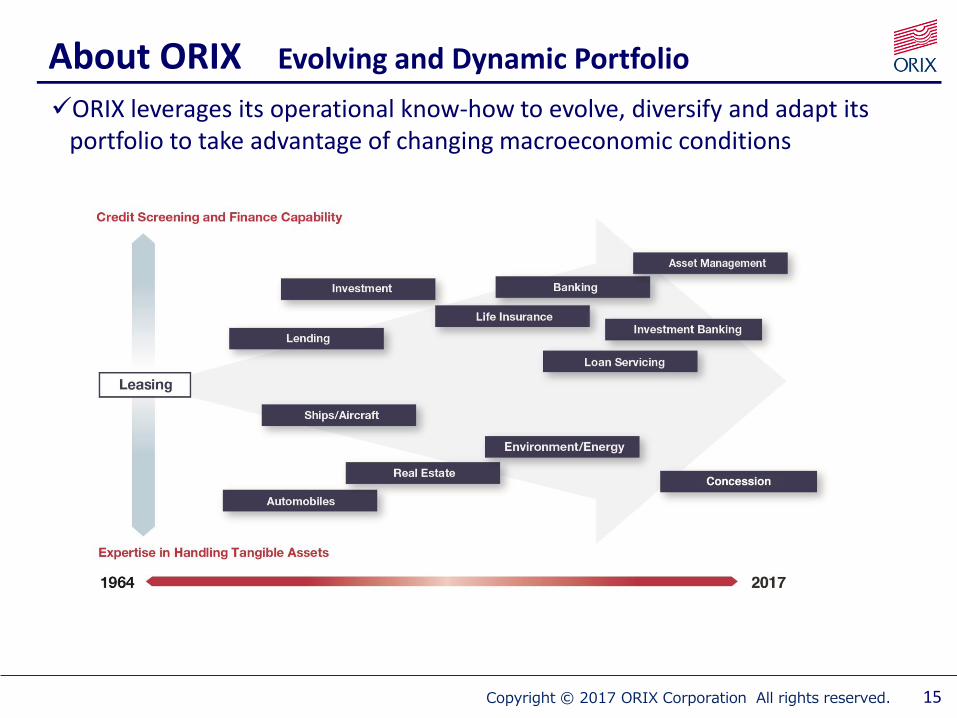
ORIX leverages its operational know-how to evolve, diversify and adapt its portfolio to take advantage of changing macroeconomic conditions
About ORIX Evolving and Dynamic Portfolio
15
Infrastructure

Copyright © 2017 ORIX Corporation All rights reserved.
11%
11%
11%
15%14%
38%
HL*
12%
8%
8%
8%
39%
25%
Segment Assets9tn yen
FY2016.3
Our highly diversified company contains many complementary businesses, providing ample opportunity for synergies and knowledge sharing
About ORIX Business by Segment
16
Corporate Financial Services
Lending, Leasing, Fee businesses
Maintenance Leasing
Automobile leasing and rentals, Car sharing, Test and measurement instruments and IT-related equipment rentals and leasing
Real Estate
Real estate development/rental, facility operation, REIT asset management, and real estate investment and advisory services
Investment and Operation
Environment and energy business, Principal investment and Loan servicing, Concession business
RetailLife insurance, Banking, Card loan business
Overseas BusinessLeasing, Lending, Investment in bonds, Asset management, Ship/Aircraft-related operations
Segment Profits 380bn yen
FY2016.3
*Houlihan Lokey IPO resulted 39.6bn yen of capital gains and valuation gains in Overseas Business
Copyright © 2017 ORIX Corporation All rights reserved.
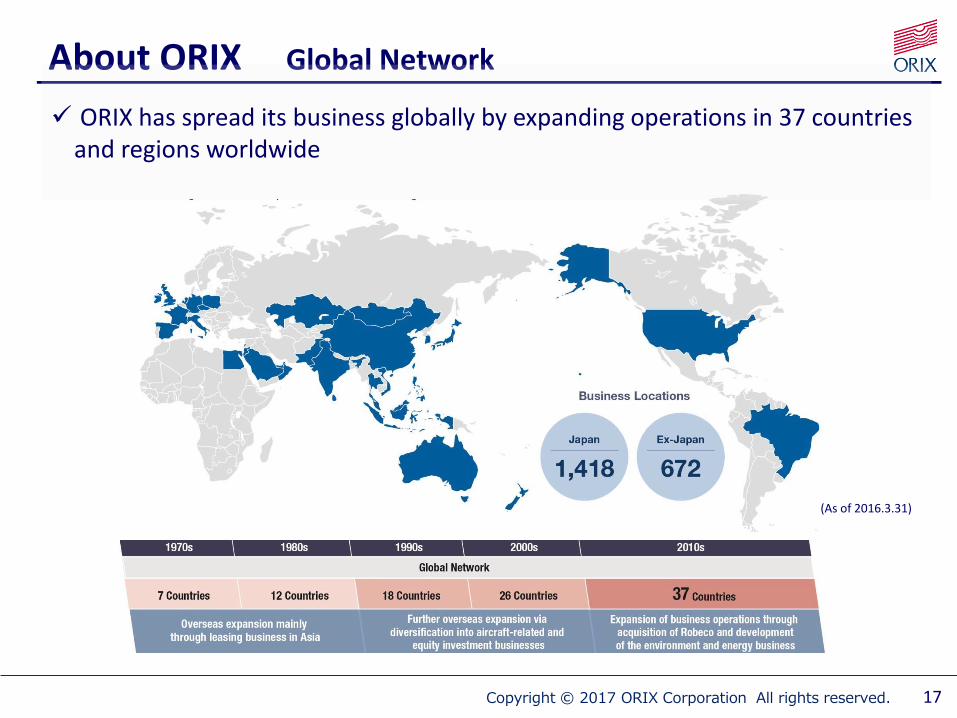
About ORIX Global Network
ORIX has spread its business globally by expanding operations in 37 countries and regions worldwide
17
(As of 2016.3.31)
Copyright © 2017 ORIX Corporation All rights reserved.
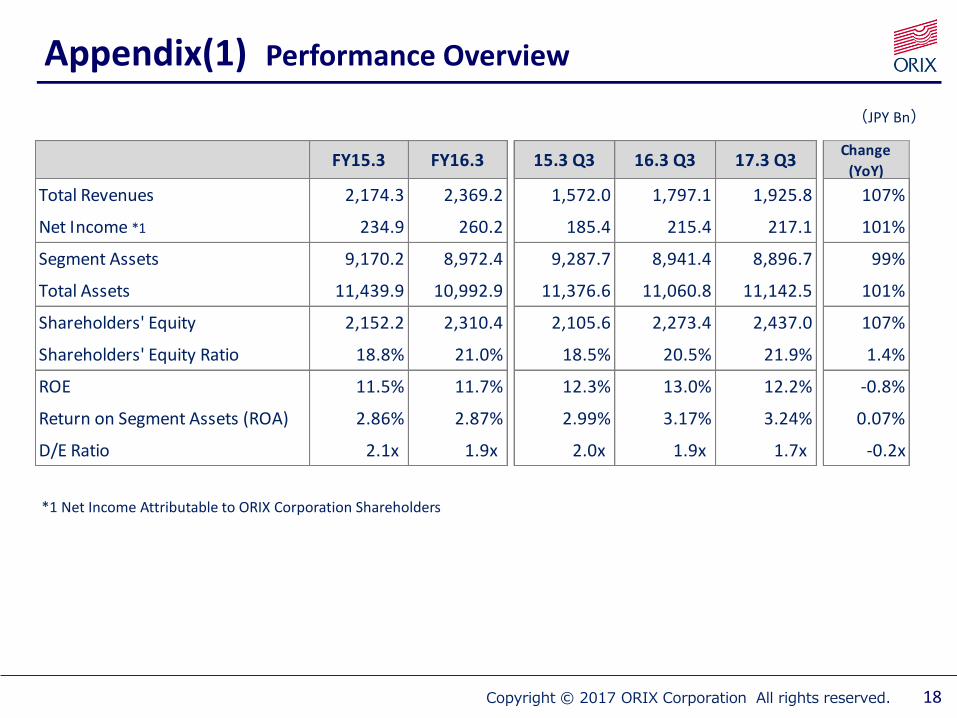
Appendix(1) Performance Overview
(JPY Bn)
*1 Net Income Attributable to ORIX Corporation Shareholders
18
FY15.3 FY16.3 15.3 Q3 16.3 Q3 17.3 Q3Change
(YoY)
Total Revenues 2,174.3 2,369.2 1,572.0 1,797.1 1,925.8 107%
Net Income *1 234.9 260.2 185.4 215.4 217.1 101%
Segment Assets 9,170.2 8,972.4 9,287.7 8,941.4 8,896.7 99%
Total Assets 11,439.9 10,992.9 11,376.6 11,060.8 11,142.5 101%
Shareholders' Equity 2,152.2 2,310.4 2,105.6 2,273.4 2,437.0 107%
Shareholders' Equity Ratio 18.8% 21.0% 18.5% 20.5% 21.9% 1.4%
ROE 11.5% 11.7% 12.3% 13.0% 12.2% -0.8%
Return on Segment Assets (ROA) 2.86% 2.87% 2.99% 3.17% 3.24% 0.07%
D/E Ratio 2.1x 1.9x 2.0x 1.9x 1.7x -0.2x

Copyright © 2017 ORIX Corporation All rights reserved.
Appendix(2) Profits by Segment
The Company evaluates the performance of segments based on income before income taxes and discontinued operations, adjusted for results of discontinued operations, net income attributable to the non-controlling interests and net income attributable to the redeemable non-controlling interests before applicable tax effect.
(JPY Bn)
19
FY15.3 FY16.3 15.3 Q3 16.3 Q3 17.3 Q3Change
(YoY)
Corporate Financial Services 25.5 42.4 18.7 33.8 26.3 78%
Maintenance Leasing 40.4 42.9 31.6 33.7 28.6 85%
Real Estate 3.5 42.9 22.5 44.4 49.7 112%
Investment and Operation 42.4 57.2 23.0 46.7 68.8 147%
Retail 120.6 51.8 96.6 48.8 60.1 123%
Overseas Business 104.1 142.9 84.8 116.0 95.6 82%
Total Segment Profits 336.5 380.1 277.1 323.4 329.1 102%
Copyright © 2017 ORIX Corporation All rights reserved.
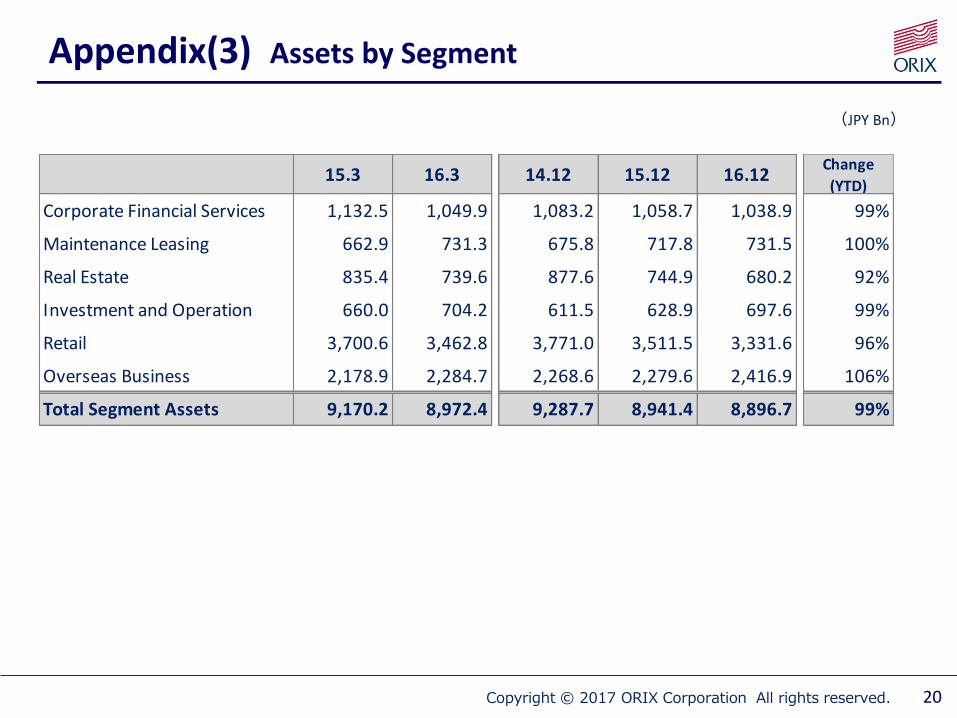
Appendix(3) Assets by Segment
(JPY Bn)
20
15.3 16.3 14.12 15.12 16.12Change
(YTD)
Corporate Financial Services 1,132.5 1,049.9 1,083.2 1,058.7 1,038.9 99%
Maintenance Leasing 662.9 731.3 675.8 717.8 731.5 100%
Real Estate 835.4 739.6 877.6 744.9 680.2 92%
Investment and Operation 660.0 704.2 611.5 628.9 697.6 99%
Retail 3,700.6 3,462.8 3,771.0 3,511.5 3,331.6 96%
Overseas Business 2,178.9 2,284.7 2,268.6 2,279.6 2,416.9 106%
Total Segment Assets 9,170.2 8,972.4 9,287.7 8,941.4 8,896.7 99%
Copyright © 2017 ORIX Corporation All rights reserved.
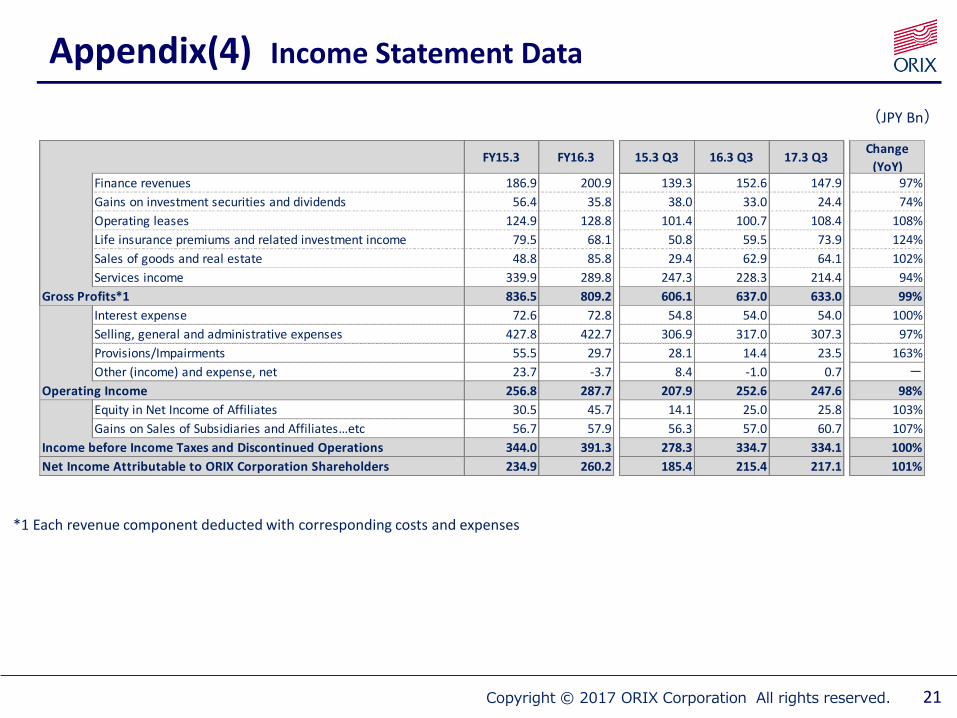
Appendix(4) Income Statement Data
(JPY Bn)
*1 Each revenue component deducted with corresponding costs and expenses
21
FY15.3 FY16.3 15.3 Q3 16.3 Q3 17.3 Q3Change
(YoY)Finance revenues 186.9 200.9 139.3 152.6 147.9 97%
Gains on investment securities and dividends 56.4 35.8 38.0 33.0 24.4 74%
Operating leases 124.9 128.8 101.4 100.7 108.4 108%
Life insurance premiums and related investment income 79.5 68.1 50.8 59.5 73.9 124%
Sales of goods and real estate 48.8 85.8 29.4 62.9 64.1 102%
Services income 339.9 289.8 247.3 228.3 214.4 94%
Gross Profits*1 836.5 809.2 606.1 637.0 633.0 99%
Interest expense 72.6 72.8 54.8 54.0 54.0 100%
Selling, general and administrative expenses 427.8 422.7 306.9 317.0 307.3 97%
Provisions/Impairments 55.5 29.7 28.1 14.4 23.5 163%
Other (income) and expense, net 23.7 -3.7 8.4 -1.0 0.7 -
Operating Income 256.8 287.7 207.9 252.6 247.6 98%
Equity in Net Income of Affiliates 30.5 45.7 14.1 25.0 25.8 103%
Gains on Sales of Subsidiaries and Affiliates…etc 56.7 57.9 56.3 57.0 60.7 107%
Income before Income Taxes and Discontinued Operations 344.0 391.3 278.3 334.7 334.1 100%
Net Income Attributable to ORIX Corporation Shareholders 234.9 260.2 185.4 215.4 217.1 101%
Copyright © 2017 ORIX Corporation All rights reserved.
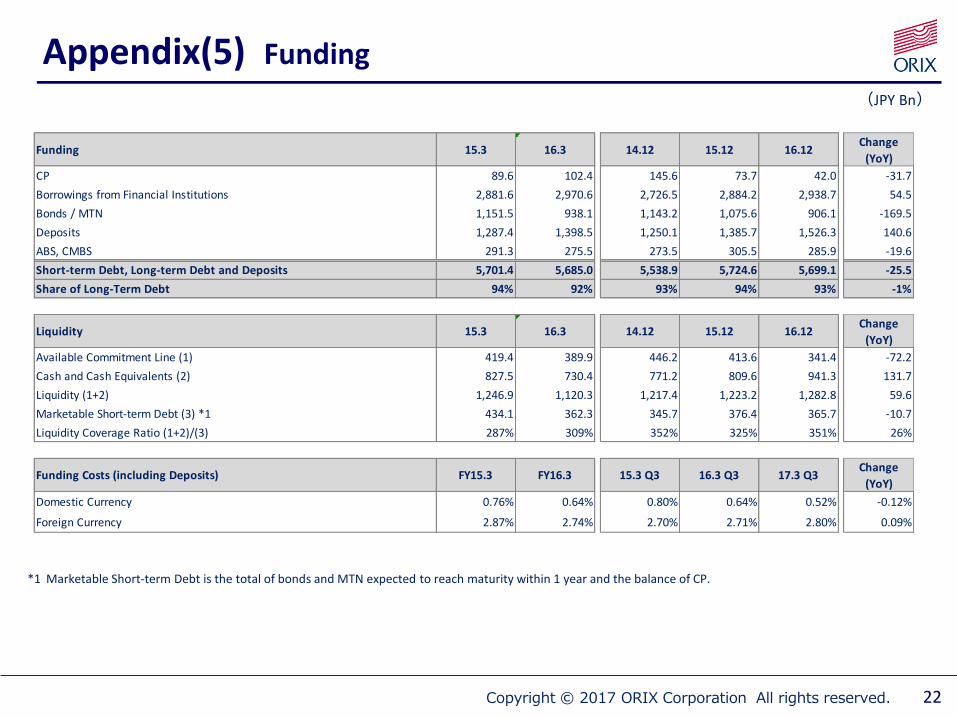
Appendix(5) Funding
(JPY Bn)
*1 Marketable Short-term Debt is the total of bonds and MTN expected to reach maturity within 1 year and the balance of CP.
22
Funding 15.3 16.3 14.12 15.12 16.12Change
(YoY)
CP 89.6 102.4 145.6 73.7 42.0 -31.7
Borrowings from Financial Institutions 2,881.6 2,970.6 2,726.5 2,884.2 2,938.7 54.5
Bonds / MTN 1,151.5 938.1 1,143.2 1,075.6 906.1 -169.5
Deposits 1,287.4 1,398.5 1,250.1 1,385.7 1,526.3 140.6
ABS, CMBS 291.3 275.5 273.5 305.5 285.9 -19.6
Short-term Debt, Long-term Debt and Deposits 5,701.4 5,685.0 5,538.9 5,724.6 5,699.1 -25.5
Share of Long-Term Debt 94% 92% 93% 94% 93% -1%
Liquidity 15.3 16.3 14.12 15.12 16.12Change
(YoY)
Available Commitment Line (1) 419.4 389.9 446.2 413.6 341.4 -72.2
Cash and Cash Equivalents (2) 827.5 730.4 771.2 809.6 941.3 131.7
Liquidity (1+2) 1,246.9 1,120.3 1,217.4 1,223.2 1,282.8 59.6
Marketable Short-term Debt (3) *1 434.1 362.3 345.7 376.4 365.7 -10.7
Liquidity Coverage Ratio (1+2)/(3) 287% 309% 352% 325% 351% 26%
Funding Costs (including Deposits) FY15.3 FY16.3 15.3 Q3 16.3 Q3 17.3 Q3Change
(YoY)
Domestic Currency 0.76% 0.64% 0.80% 0.64% 0.52% -0.12%
Foreign Currency 2.87% 2.74% 2.70% 2.71% 2.80% 0.09%
Copyright © 2017 ORIX Corporation All rights reserved.
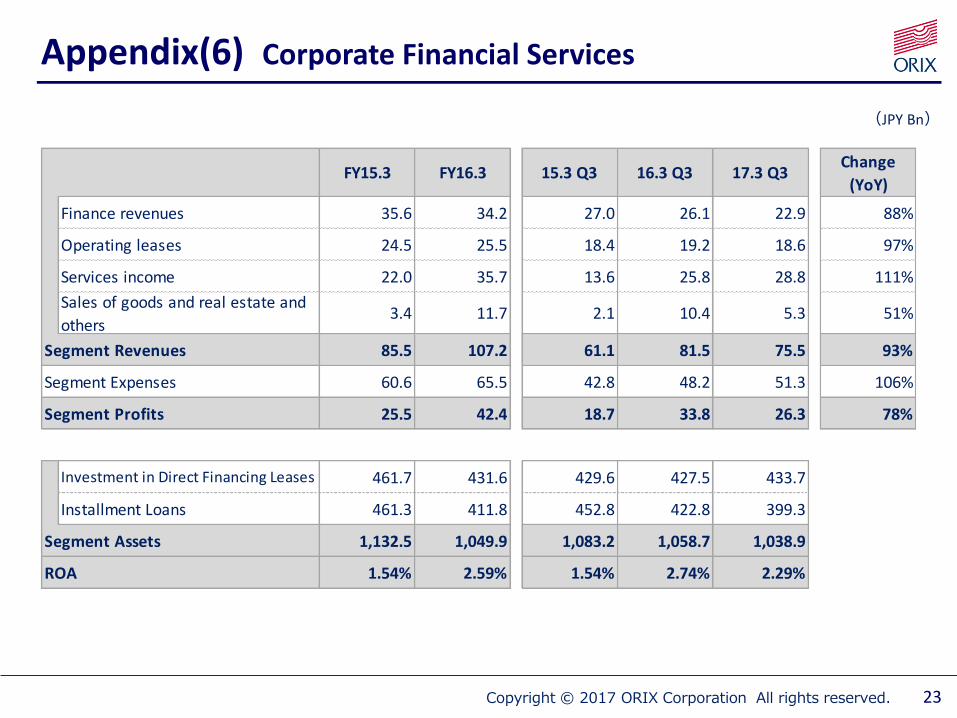
Appendix(6) Corporate Financial Services
(JPY Bn)
23
FY15.3 FY16.3 15.3 Q3 16.3 Q3 17.3 Q3Change
(YoY)
Finance revenues 35.6 34.2 27.0 26.1 22.9 88%
Operating leases 24.5 25.5 18.4 19.2 18.6 97%
Services income 22.0 35.7 13.6 25.8 28.8 111%
Sales of goods and real estate and
others3.4 11.7 2.1 10.4 5.3 51%
Segment Revenues 85.5 107.2 61.1 81.5 75.5 93%
Segment Expenses 60.6 65.5 42.8 48.2 51.3 106%
Segment Profits 25.5 42.4 18.7 33.8 26.3 78%
Investment in Direct Financing Leases 461.7 431.6 429.6 427.5 433.7
Installment Loans 461.3 411.8 452.8 422.8 399.3
Segment Assets 1,132.5 1,049.9 1,083.2 1,058.7 1,038.9
ROA 1.54% 2.59% 1.54% 2.74% 2.29%
Copyright © 2017 ORIX Corporation All rights reserved.
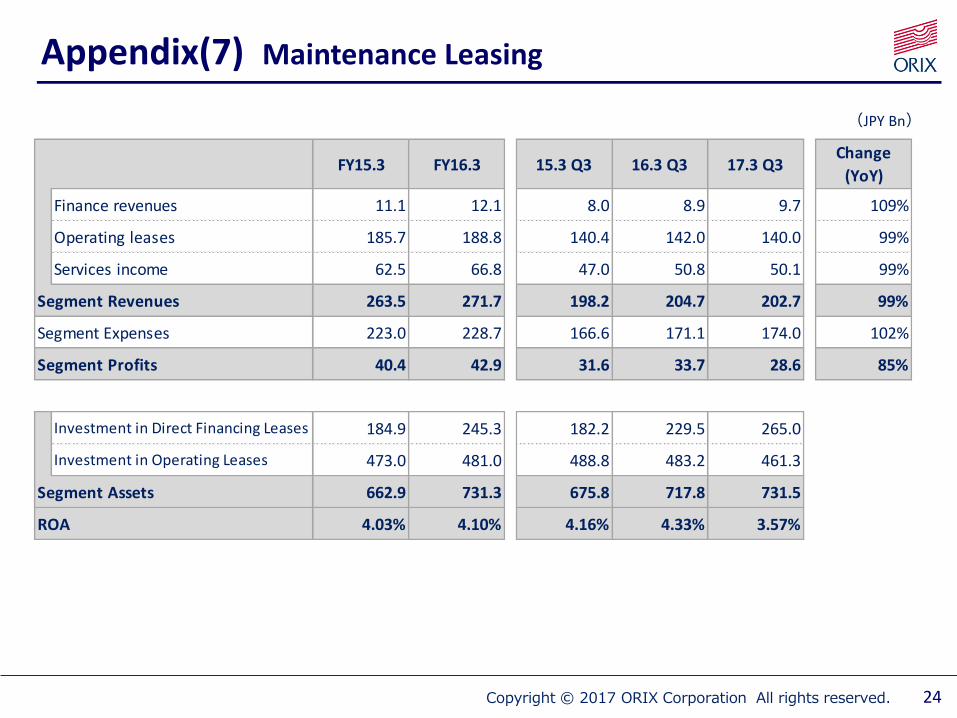
Appendix(7) Maintenance Leasing
(JPY Bn)
24
FY15.3 FY16.3 15.3 Q3 16.3 Q3 17.3 Q3Change
(YoY)
Finance revenues 11.1 12.1 8.0 8.9 9.7 109%
Operating leases 185.7 188.8 140.4 142.0 140.0 99%
Services income 62.5 66.8 47.0 50.8 50.1 99%
Segment Revenues 263.5 271.7 198.2 204.7 202.7 99%
Segment Expenses 223.0 228.7 166.6 171.1 174.0 102%
Segment Profits 40.4 42.9 31.6 33.7 28.6 85%
Investment in Direct Financing Leases 184.9 245.3 182.2 229.5 265.0
Investment in Operating Leases 473.0 481.0 488.8 483.2 461.3
Segment Assets 662.9 731.3 675.8 717.8 731.5
ROA 4.03% 4.10% 4.16% 4.33% 3.57%
Copyright © 2017 ORIX Corporation All rights reserved.
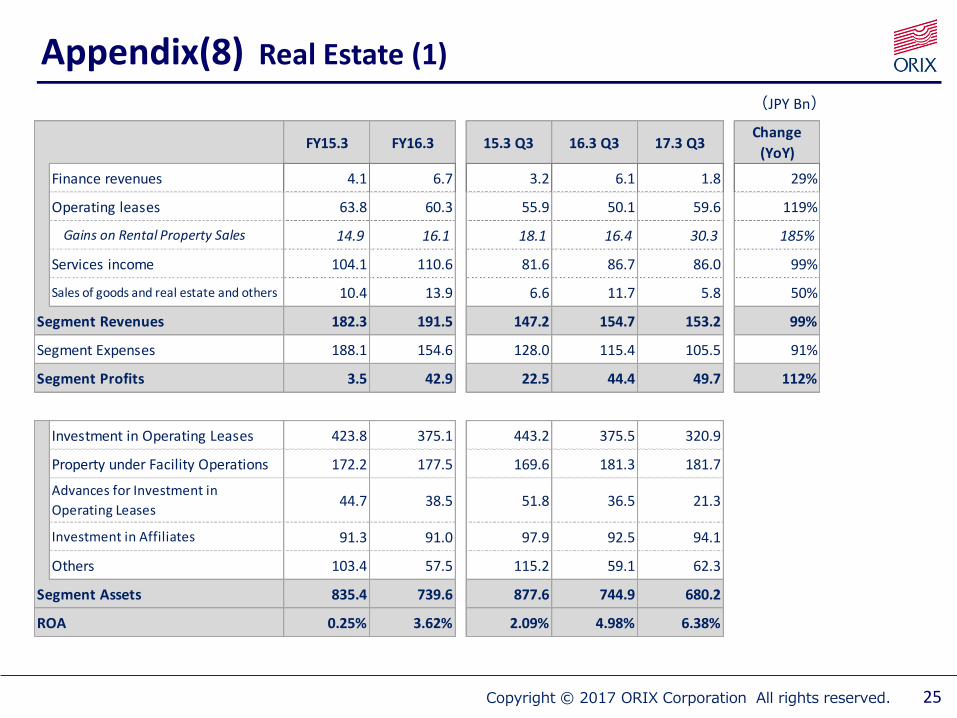
Appendix(8) Real Estate (1)
(JPY Bn)
25
FY15.3 FY16.3 15.3 Q3 16.3 Q3 17.3 Q3Change
(YoY)
Finance revenues 4.1 6.7 3.2 6.1 1.8 29%
Operating leases 63.8 60.3 55.9 50.1 59.6 119%
Gains on Rental Property Sales 14.9 16.1 18.1 16.4 30.3 185%
Services income 104.1 110.6 81.6 86.7 86.0 99%
Sales of goods and real estate and others 10.4 13.9 6.6 11.7 5.8 50%
Segment Revenues 182.3 191.5 147.2 154.7 153.2 99%
Segment Expenses 188.1 154.6 128.0 115.4 105.5 91%
Segment Profits 3.5 42.9 22.5 44.4 49.7 112%
Investment in Operating Leases 423.8 375.1 443.2 375.5 320.9
Property under Facility Operations 172.2 177.5 169.6 181.3 181.7
Advances for Investment in
Operating Leases44.7 38.5 51.8 36.5 21.3
Investment in Affiliates 91.3 91.0 97.9 92.5 94.1
Others 103.4 57.5 115.2 59.1 62.3
Segment Assets 835.4 739.6 877.6 744.9 680.2
ROA 0.25% 3.62% 2.09% 4.98% 6.38%
Copyright © 2017 ORIX Corporation All rights reserved.
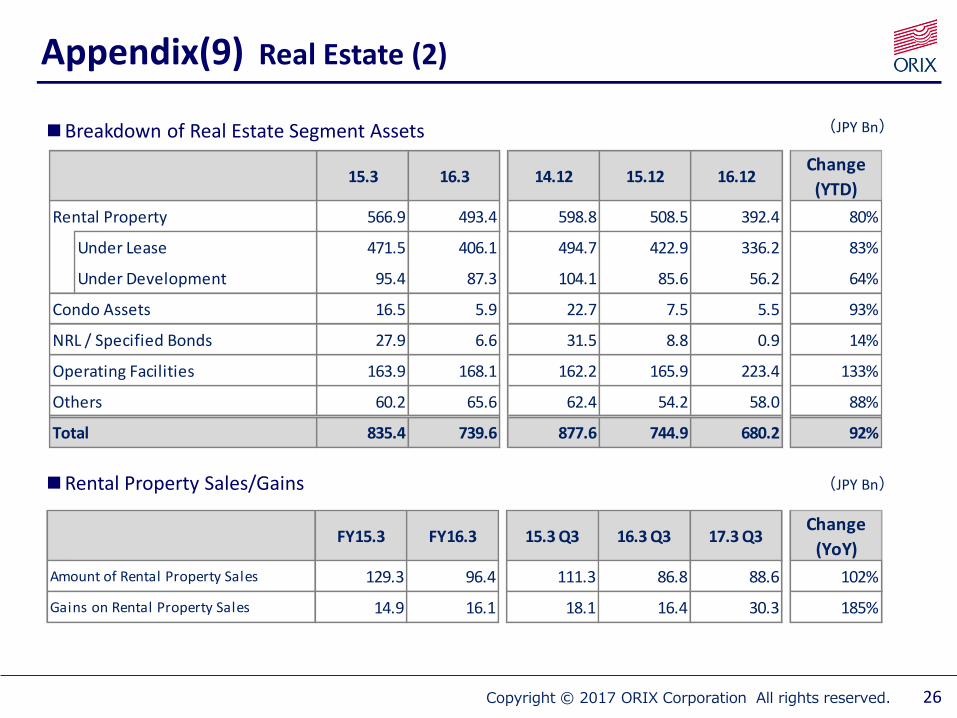
Appendix(9) Real Estate (2)
■Breakdown of Real Estate Segment Assets
■Rental Property Sales/Gains
(JPY Bn)
(JPY Bn)
26
15.3 16.3 14.12 15.12 16.12Change
(YTD)
Rental Property 566.9 493.4 598.8 508.5 392.4 80%
Under Lease 471.5 406.1 494.7 422.9 336.2 83%
Under Development 95.4 87.3 104.1 85.6 56.2 64%
Condo Assets 16.5 5.9 22.7 7.5 5.5 93%
NRL / Specified Bonds 27.9 6.6 31.5 8.8 0.9 14%
Operating Facilities 163.9 168.1 162.2 165.9 223.4 133%
Others 60.2 65.6 62.4 54.2 58.0 88%
Total 835.4 739.6 877.6 744.9 680.2 92%
FY15.3 FY16.3 15.3 Q3 16.3 Q3 17.3 Q3Change
(YoY)
Amount of Rental Property Sales 129.3 96.4 111.3 86.8 88.6 102%
14.9 16.1 18.1 16.4 30.3 185%Gains on Rental Property Sales
Copyright © 2017 ORIX Corporation All rights reserved.
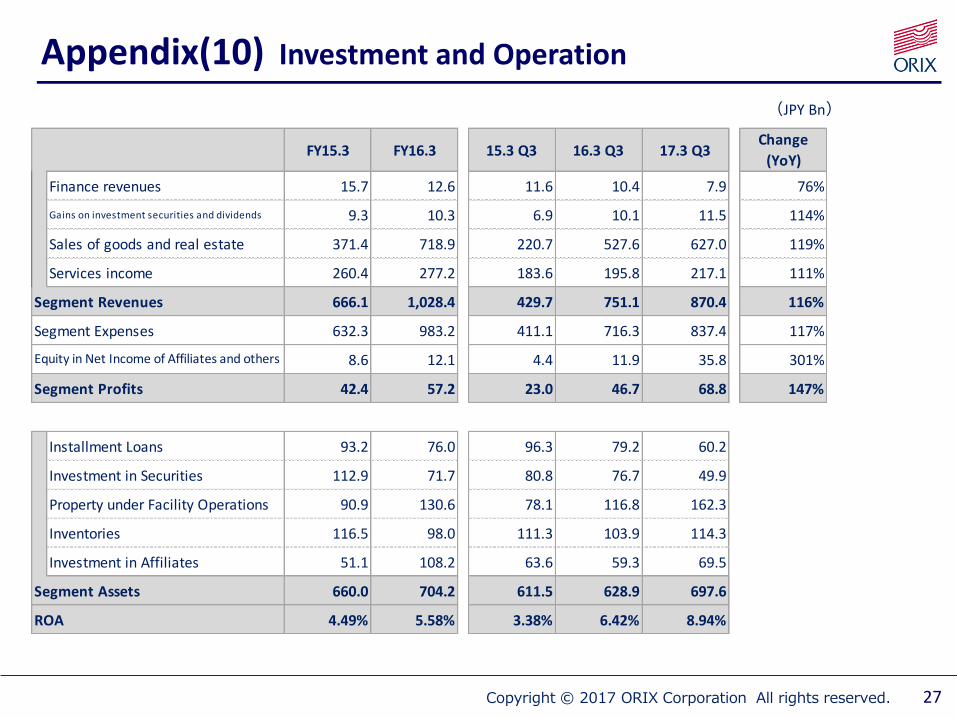
Appendix(10) Investment and Operation
(JPY Bn)
27
FY15.3 FY16.3 15.3 Q3 16.3 Q3 17.3 Q3Change
(YoY)
Finance revenues 15.7 12.6 11.6 10.4 7.9 76%
Gains on investment securities and dividends 9.3 10.3 6.9 10.1 11.5 114%
Sales of goods and real estate 371.4 718.9 220.7 527.6 627.0 119%
Services income 260.4 277.2 183.6 195.8 217.1 111%
Segment Revenues 666.1 1,028.4 429.7 751.1 870.4 116%
Segment Expenses 632.3 983.2 411.1 716.3 837.4 117%
8.6 12.1 4.4 11.9 35.8 301%
Segment Profits 42.4 57.2 23.0 46.7 68.8 147%
Installment Loans 93.2 76.0 96.3 79.2 60.2
Investment in Securities 112.9 71.7 80.8 76.7 49.9
Property under Facility Operations 90.9 130.6 78.1 116.8 162.3
Inventories 116.5 98.0 111.3 103.9 114.3
Investment in Affiliates 51.1 108.2 63.6 59.3 69.5
Segment Assets 660.0 704.2 611.5 628.9 697.6
ROA 4.49% 5.58% 3.38% 6.42% 8.94%
Equity in Net Income of Affiliates and others
Copyright © 2017 ORIX Corporation All rights reserved.
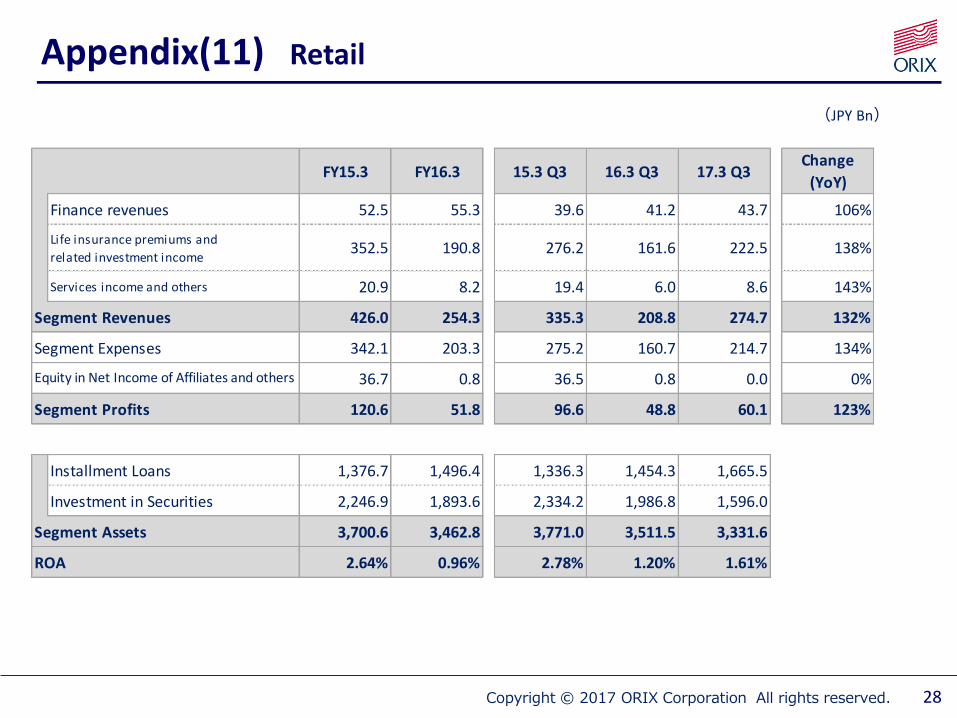
Appendix(11) Retail
(JPY Bn)
28
FY15.3 FY16.3 15.3 Q3 16.3 Q3 17.3 Q3Change
(YoY)
Finance revenues 52.5 55.3 39.6 41.2 43.7 106%
Life insurance premiums and
related investment income352.5 190.8 276.2 161.6 222.5 138%
Services income and others 20.9 8.2 19.4 6.0 8.6 143%
Segment Revenues 426.0 254.3 335.3 208.8 274.7 132%
Segment Expenses 342.1 203.3 275.2 160.7 214.7 134%
36.7 0.8 36.5 0.8 0.0 0%
Segment Profits 120.6 51.8 96.6 48.8 60.1 123%
Installment Loans 1,376.7 1,496.4 1,336.3 1,454.3 1,665.5
Investment in Securities 2,246.9 1,893.6 2,334.2 1,986.8 1,596.0
Segment Assets 3,700.6 3,462.8 3,771.0 3,511.5 3,331.6
ROA 2.64% 0.96% 2.78% 1.20% 1.61%
Equity in Net Income of Affiliates and others
Copyright © 2017 ORIX Corporation All rights reserved.
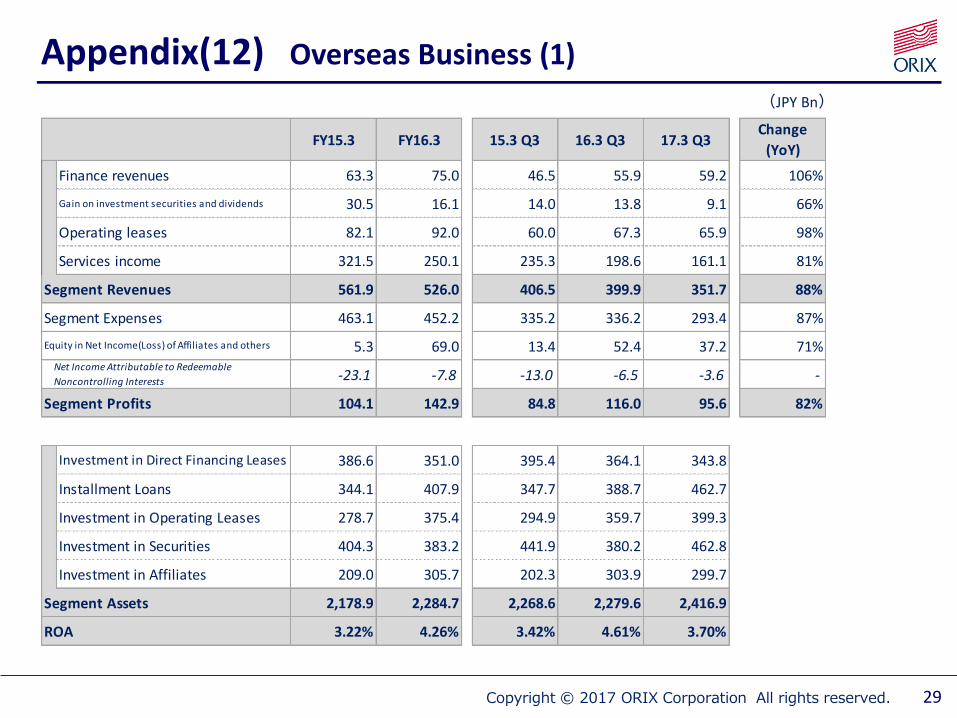
Appendix(12) Overseas Business (1)
(JPY Bn)
29
FY15.3 FY16.3 15.3 Q3 16.3 Q3 17.3 Q3Change
(YoY)
Finance revenues 63.3 75.0 46.5 55.9 59.2 106%
Gain on investment securities and dividends 30.5 16.1 14.0 13.8 9.1 66%
Operating leases 82.1 92.0 60.0 67.3 65.9 98%
Services income 321.5 250.1 235.3 198.6 161.1 81%
Segment Revenues 561.9 526.0 406.5 399.9 351.7 88%
Segment Expenses 463.1 452.2 335.2 336.2 293.4 87%
5.3 69.0 13.4 52.4 37.2 71%
-23.1 -7.8 -13.0 -6.5 -3.6 -
Segment Profits 104.1 142.9 84.8 116.0 95.6 82%
Investment in Direct Financing Leases 386.6 351.0 395.4 364.1 343.8
Installment Loans 344.1 407.9 347.7 388.7 462.7
Investment in Operating Leases 278.7 375.4 294.9 359.7 399.3
Investment in Securities 404.3 383.2 441.9 380.2 462.8
Investment in Affiliates 209.0 305.7 202.3 303.9 299.7
Segment Assets 2,178.9 2,284.7 2,268.6 2,279.6 2,416.9
ROA 3.22% 4.26% 3.42% 4.61% 3.70%
Equity in Net Income(Loss) of Affiliates and others
Net Income Attributable to Redeemable
Noncontrolling Interests
Copyright © 2017 ORIX Corporation All rights reserved.
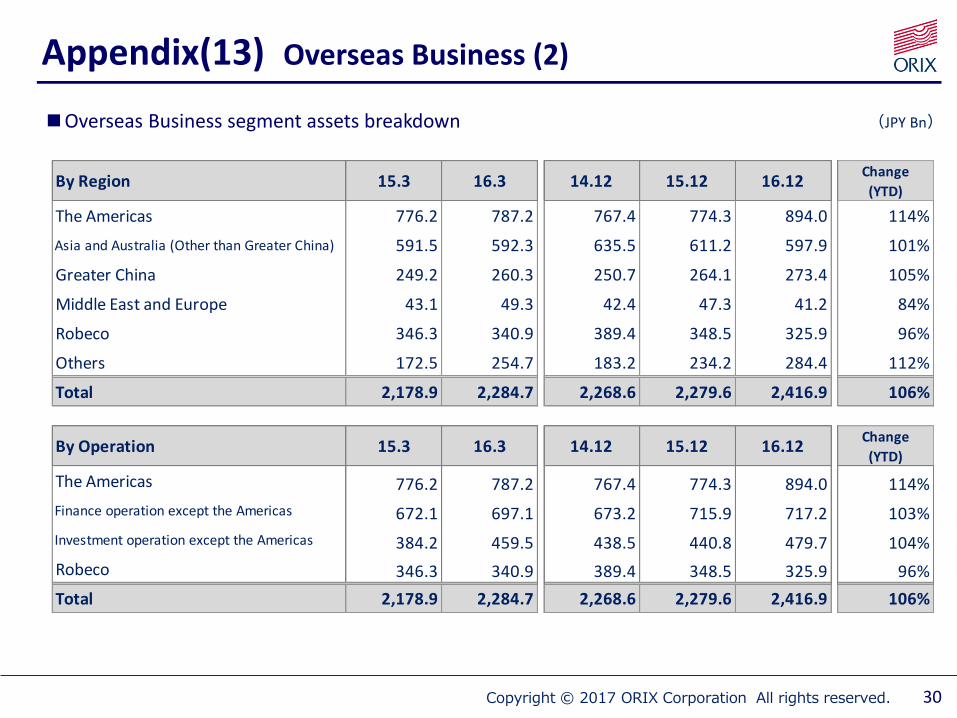
Appendix(13) Overseas Business (2)
■Overseas Business segment assets breakdown (JPY Bn)
30
By Region 15.3 16.3 14.12 15.12 16.12Change
(YTD)
The Americas 776.2 787.2 767.4 774.3 894.0 114%
Asia and Australia (Other than Greater China) 591.5 592.3 635.5 611.2 597.9 101%
Greater China 249.2 260.3 250.7 264.1 273.4 105%
Middle East and Europe 43.1 49.3 42.4 47.3 41.2 84%
Robeco 346.3 340.9 389.4 348.5 325.9 96%
Others 172.5 254.7 183.2 234.2 284.4 112%
Total 2,178.9 2,284.7 2,268.6 2,279.6 2,416.9 106%
By Operation 15.3 16.3 14.12 15.12 16.12Change
(YTD)
The Americas 776.2 787.2 767.4 774.3 894.0 114%
Finance operation except the Americas 672.1 697.1 673.2 715.9 717.2 103%
Investment operation except the Americas 384.2 459.5 438.5 440.8 479.7 104%
Robeco 346.3 340.9 389.4 348.5 325.9 96%
Total 2,178.9 2,284.7 2,268.6 2,279.6 2,416.9 106%
Copyright © 2017 ORIX Corporation All rights reserved.
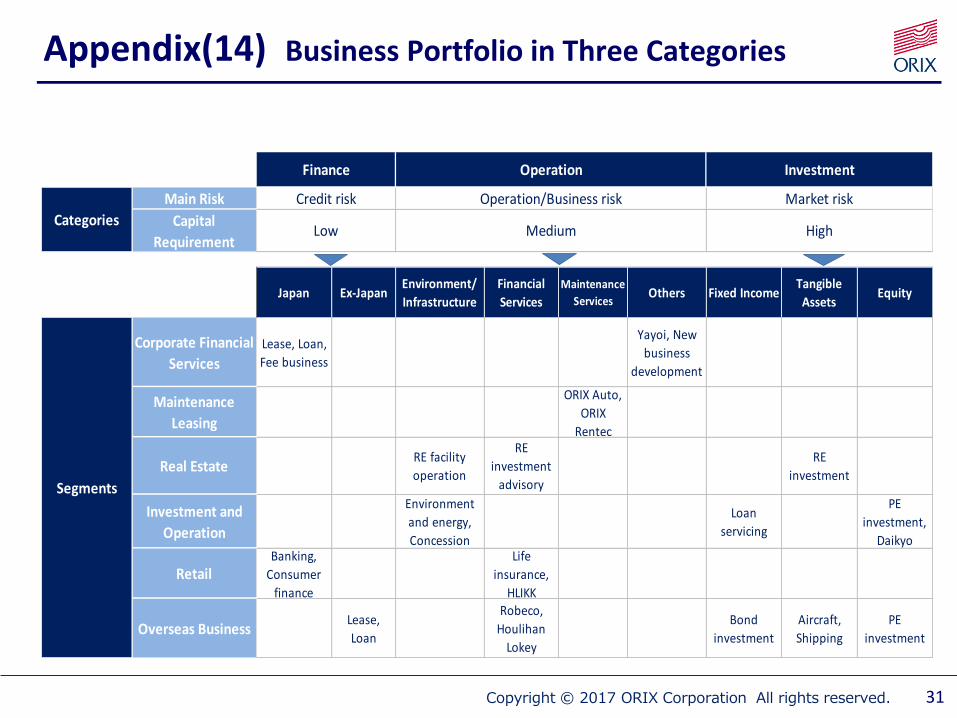
Appendix(14) Business Portfolio in Three Categories
31
Main Risk
Capital
Requirement
Japan Ex-JapanEnvironment/
Infrastructure
Financial
Services
Maintenance
ServicesOthers Fixed Income
Tangible
AssetsEquity
Corporate Financial
Services
Lease, Loan,
Fee business
Yayoi, New
business
development
Maintenance
Leasing
ORIX Auto,
ORIX
Rentec
Real EstateRE facility
operation
RE
investment
advisory
RE
investment
Investment and
Operation
Environment
and energy,
Concession
Loan
servicing
PE
investment,
Daikyo
RetailBanking,
Consumer
finance
Life
insurance,
HLIKK
Overseas BusinessLease,
Loan
Robeco,
Houlihan
Lokey
Bond
investment
Aircraft,
Shipping
PE
investment
Segments
Finance Operation Investment
Categories
Credit risk Operation/Business risk Market risk
Low Medium High

Copyright © 2017 ORIX Corporation All rights reserved.
Reference Data
32
Copyright © 2017 ORIX Corporation All rights reserved. 33
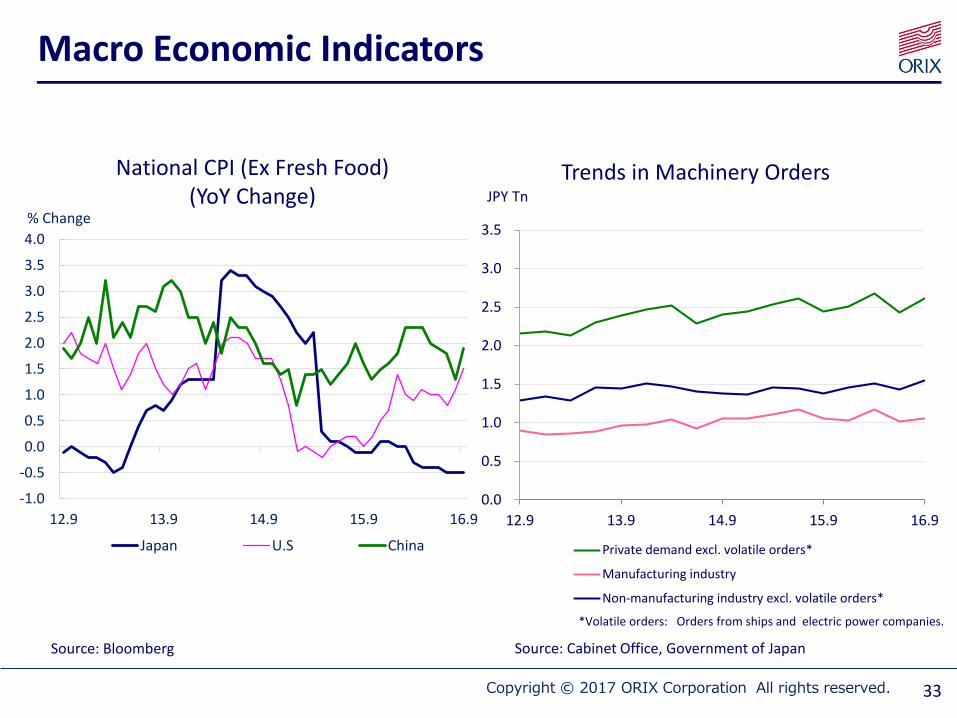
Macro Economic Indicators
National CPI (Ex Fresh Food) (YoY Change)
Source: Bloomberg
Trends in Machinery Orders
Source: Cabinet Office, Government of Japan
*Volatile orders: Orders from ships and electric power companies.
-1.0
-0.5
0.0
0.5
1.0
1.5
2.0
2.5
3.0
3.5
4.0
12.9 13.9 14.9 15.9 16.9
Japan U.S China
% Change
0.0
0.5
1.0
1.5
2.0
2.5
3.0
3.5
12.9 13.9 14.9 15.9 16.9
Private demand excl. volatile orders*
Manufacturing industry
Non-manufacturing industry excl. volatile orders*
JPY Tn
Copyright © 2017 ORIX Corporation All rights reserved.
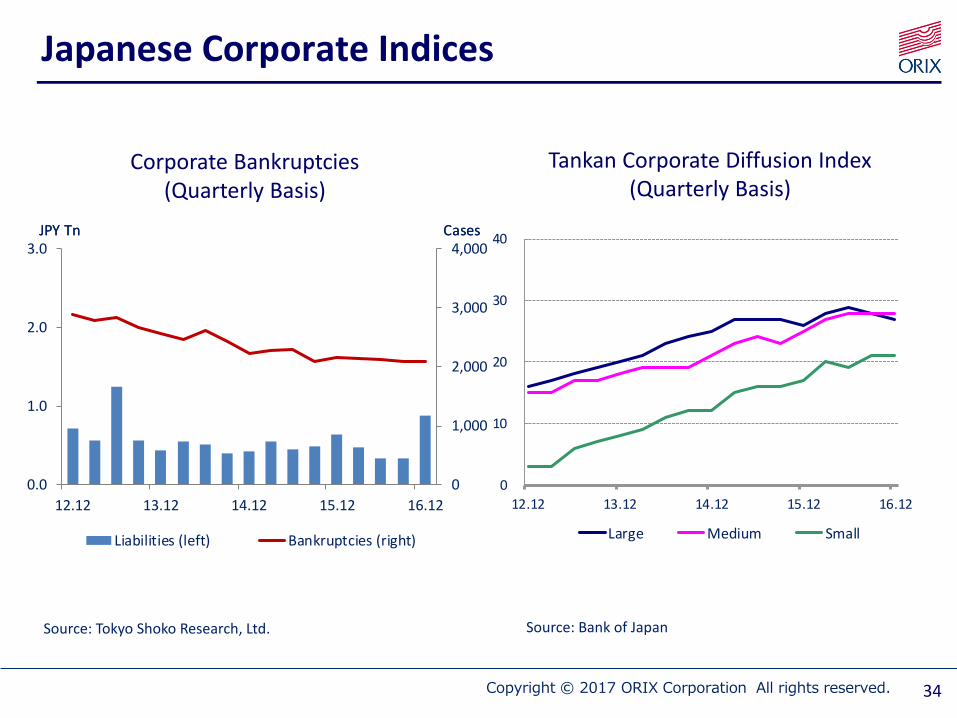
Japanese Corporate Indices
Tankan Corporate Diffusion Index(Quarterly Basis)
Corporate Bankruptcies(Quarterly Basis)
Source: Bank of JapanSource: Tokyo Shoko Research, Ltd.
34
0
1,000
2,000
3,000
4,000
0.0
1.0
2.0
3.0
12.12 13.12 14.12 15.12 16.12
Liabilities (left) Bankruptcies (right)
JPY Tn CasesJPY Tn Cases
0
10
20
30
40
12.12 13.12 14.12 15.12 16.12
Large Medium Small
Copyright © 2017 ORIX Corporation All rights reserved. 35
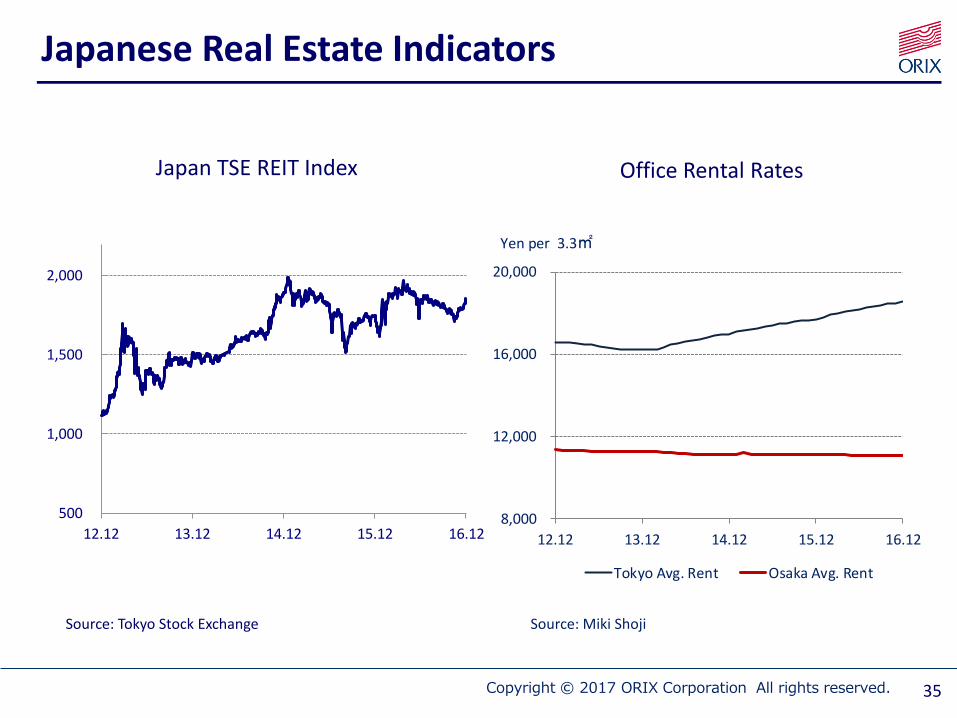
Japanese Real Estate Indicators
Japan TSE REIT Index
Source: Tokyo Stock Exchange
Office Rental Rates
Source: Miki Shoji
500
1,000
1,500
2,000
12.12 13.12 14.12 15.12 16.128,000
12,000
16,000
20,000
12.12 13.12 14.12 15.12 16.12
Tokyo Avg. Rent Osaka Avg. Rent
Yen per 3.3㎡
Copyright © 2017 ORIX Corporation All rights reserved. 36
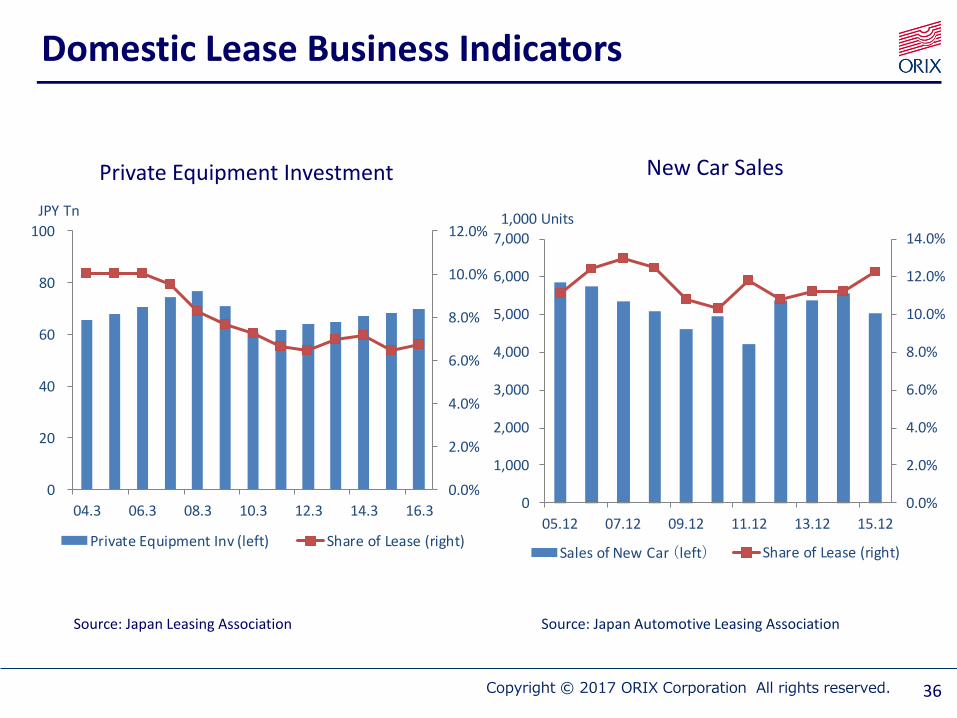
Domestic Lease Business Indicators
Private Equipment Investment New Car Sales
Source: Japan Leasing Association Source: Japan Automotive Leasing Association
0.0%
2.0%
4.0%
6.0%
8.0%
10.0%
12.0%
0
20
40
60
80
100
04.3 06.3 08.3 10.3 12.3 14.3 16.3
千
Private Equipment Inv (left) Share of Lease (right)
JPY Tn
0.0%
2.0%
4.0%
6.0%
8.0%
10.0%
12.0%
14.0%
0
1,000
2,000
3,000
4,000
5,000
6,000
7,000
05.12 07.12 09.12 11.12 13.12 15.12
Sales of New Car (left) Share of Lease (right)
1,000 Units
Copyright © 2017 ORIX Corporation All rights reserved. 37
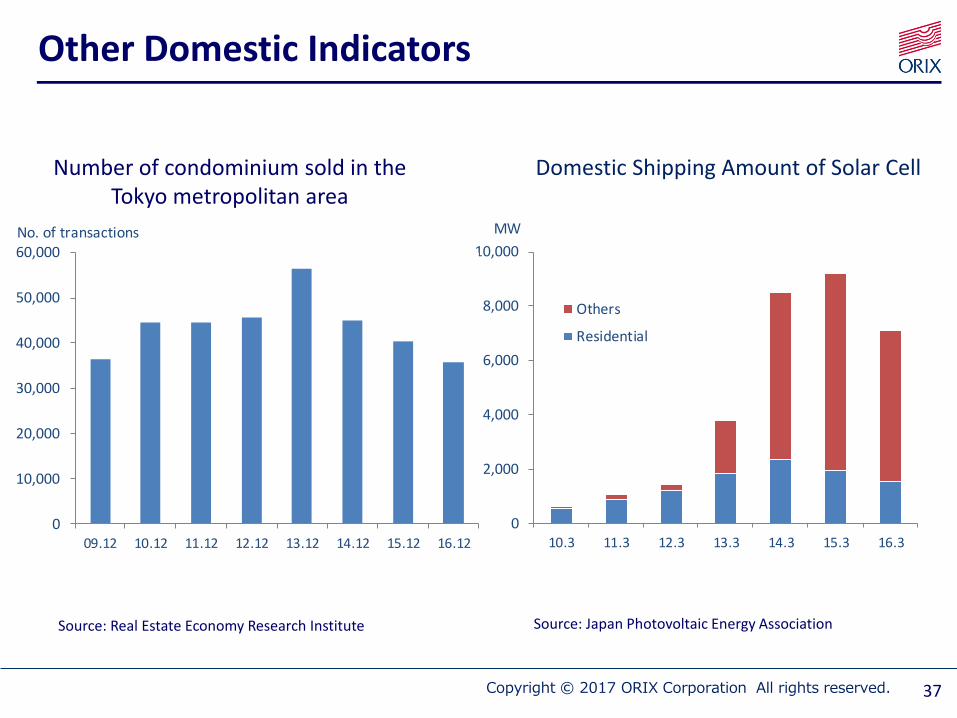
Number of condominium sold in the Tokyo metropolitan area
Source: Real Estate Economy Research Institute
Other Domestic Indicators
Domestic Shipping Amount of Solar Cell
Source: Japan Photovoltaic Energy Association
0
2,000
4,000
6,000
8,000
10,000
10.3 11.3 12.3 13.3 14.3 15.3 16.3
Others
Residential
MW
0
10,000
20,000
30,000
40,000
50,000
60,000
09.12 10.12 11.12 12.12 13.12 14.12 15.12 16.12
No. of transactions

Copyright © 2017 ORIX Corporation All rights reserved.
Other Domestic Indicators
The number of M&A deals
Source: RECOF Corporation Source: Tokyo Stock Exchange
The number of the New Listed Companies
38
0
500
1,000
1,500
2,000
2,500
3,000
10.12 11.12 12.12 13.12 14.12 15.12
OUT-IN
IN-OUT
IN-IN
0
20
40
60
80
100
10.12 11.12 12.12 13.12 14.12 15.12 16.12
Copyright © 2017 ORIX Corporation All rights reserved.
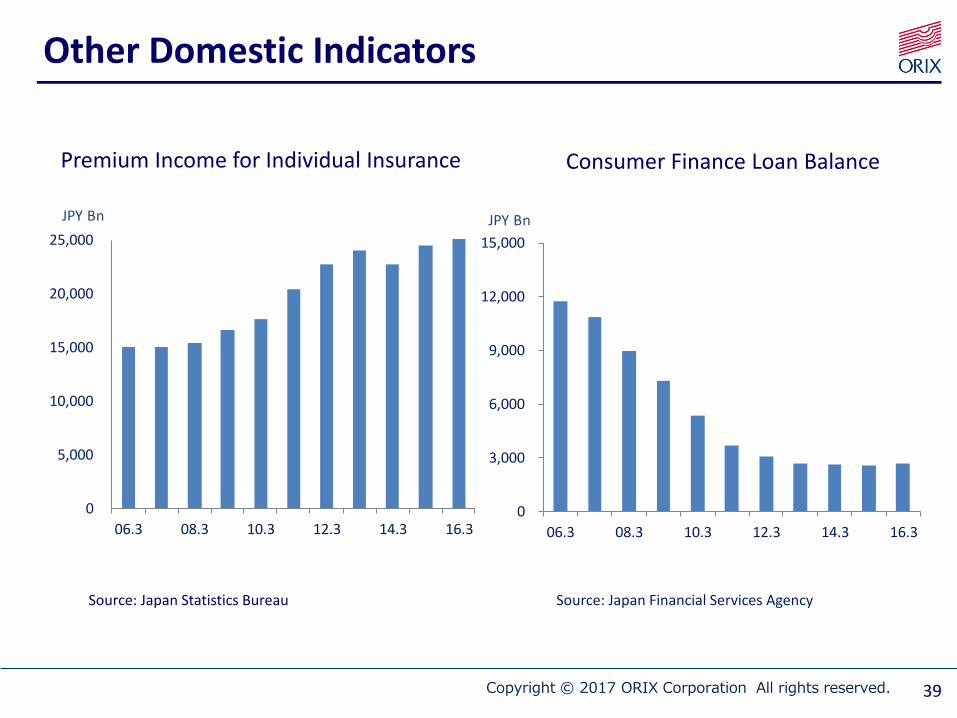
Other Domestic Indicators
Consumer Finance Loan BalancePremium Income for Individual Insurance
Source: Japan Statistics Bureau Source: Japan Financial Services Agency
39
0
3,000
6,000
9,000
12,000
15,000
06.3 08.3 10.3 12.3 14.3 16.3
JPY Bn
0
5,000
10,000
15,000
20,000
25,000
06.3 08.3 10.3 12.3 14.3 16.3
JPY Bn
Copyright © 2017 ORIX Corporation All rights reserved.
These materials have been prepared by ORIX Corporation (“ORIX” or the “Company”) solely for your information and are subject to change without notice. The information contained in these materials has not been independently verified and its accuracy is not guaranteed. No representations, warranties or undertakings, express or implied, are made as to, and no reliance should be placed on, the accuracy, fairness, or completeness, or correctness of the information or the opinions presented or contained in these materials.
These materials contain forward-looking statements that reflect the Company’s intent, belief and current expectations about future events and financial results. These statements can be recognized by the use of words such as “expects,” “plans,” “will,” “estimates,” “projects,” “intends,” or words of similar meaning. These forward-looking statements are not guarantees of future performance. They are based on a number of assumptions about the Company’s operations and are subject to risks, uncertainties and other factors beyond the Company’s control. Accordingly, actual results may differ materially from these forward-looking statements. Factors that could cause such differences include, but are not limited to, those described under “Risk Factors” in the Company’s most recent annual report on Form 20-F filed with the U.S. Securities and Exchange Commission and under “Business Risk” of the securities report (yukashouken houkokusho) filed with the Director of the Kanto Local Finance Bureau.
Some of the financial information in these materials is unaudited.
The Company believes that it will be considered a “passive foreign investment company” for United States Federal income tax purpose in the year to which these consolidated financial results relate and for the foreseeable future by reason of the composition of its assets and the nature of its income. A U.S. holder of the shares or ADSs of the Company is therefore subject to special rules generally intended to eliminate any benefits from the deferral of U.S. Federal income tax that a holder could derive from investing in a foreign corporation that does not distribute all of its earnings on a current basis. Investors should consult their tax advisors with respect to such rules, which are summarized in the Company’s annual report.
ORIX Life Insurance has completed merger proceeding on its subsidiary Hartford Life Insurance K.K. on July 1, 2015 and is committed to continue serving its policy holders. ORIX Life insurance has no affiliation with The Hartford Financial Services Group, Inc. or its affiliates.
Nothing in this document shall be considered as an offer to sell or solicitation of an offer to buy any security, commodity or other instrument, including securities issued by the Company or any affiliate thereof.
Disclaimer
40
41Copyright © 2016 ORIX Corporation All rights reserved.
ORIX Corporation
※ テンプレートデザインの個別編集禁止
For the current IR materials and archives of past financial data please access our website
ORIX Websitehttp://www.orix.co.jp/grp/en/
IR Sectionhttp://www.orix.co.jp/grp/en/ir/
ORIX Corporation Corporate Planning DepartmentWorld Trade Center Building., 2-4-1, Hamamatsu-cho, Minato-ku, Tokyo 105-6135, Japan
Tel: +81-3-3435-3121 Fax: [email protected]