Embed Size (px)
Citation preview
ORNL/TM-2017/305 CRADA/NFE-07-01094
Air-Source Integrated Heat Pump Development – Final Report
Van D. Baxter C. Keith Rice Jeffrey D. Munk Moonis R. Ally Bo Shen R. B. “Dutch” Uselton (Lennox)
July 2017
Approved for public release. Distribution is unlimited.
CRADA final report for CRADA number NFE-07-01094

DOCUMENT AVAILABILITY
Reports produced after January 1, 1996, are generally available free via US Department of Energy (DOE) SciTech Connect. Website http://www.osti.gov/scitech/ Reports produced before January 1, 1996, may be purchased by members of the public from the following source: National Technical Information Service 5285 Port Royal Road Springfield, VA 22161 Telephone 703-605-6000 (1-800-553-6847) TDD 703-487-4639 Fax 703-605-6900 E-mail [email protected] Website http://classic.ntis.gov/ Reports are available to DOE employees, DOE contractors, Energy Technology Data Exchange representatives, and International Nuclear Information System representatives from the following source: Office of Scientific and Technical Information PO Box 62 Oak Ridge, TN 37831 Telephone 865-576-8401 Fax 865-576-5728 E-mail [email protected]
Website http://www.osti.gov/contact.html
This report was prepared as an account of work sponsored by an agency of the United States Government. Neither the United States Government nor any agency thereof, nor any of their employees, makes any warranty, express or implied, or assumes any legal liability or responsibility for the accuracy, completeness, or usefulness of any information, apparatus, product, or process disclosed, or represents that its use would not infringe privately owned rights. Reference herein to any specific commercial product, process, or service by trade name, trademark, manufacturer, or otherwise, does not necessarily constitute or imply its endorsement, recommendation, or favoring by the United States Government or any agency thereof. The views and opinions of authors expressed herein do not necessarily state or reflect those of the United States Government or any agency thereof.

ORNL/TM-2017/305
CRADA/NFE-07-01094
Energy and Transportation Science Division
AIR-SOURCE INTEGRATED HEAT PUMP SYSTEM DEVELOPMENT – FINAL
REPORT
ORNL
Van D. Baxter
C. Keith Rice
Jeffrey D. Munk
Moonis R. Ally
Bo Shen
Lennox Industries, Inc.
R. B. “Dutch” Uselton
Date Published: July 2017
Prepared by
OAK RIDGE NATIONAL LABORATORY
Oak Ridge, Tennessee 37831-6283
managed by
UT-BATTELLE, LLC
for the
US DEPARTMENT OF ENERGY
under contract DE-AC05-00OR22725

iii
CONTENTS
LIST OF FIGURES ...................................................................................................................................... v LIST OF TABLES ...................................................................................................................................... vii LIST OF ACRONYMS ............................................................................................................................... ix ACKNOWLEDGMENTS ........................................................................................................................... xi EXECUTIVE SUMMARY ....................................................................................................................... xiii 1. INTRODUCTION ................................................................................................................................ 1 2. BACKGROUND—AS-IHP CONCEPT DEVELOPMENT ................................................................ 3 3. FIRST-GENERATION WH/DH PROTOTYPE DESIGN AND SIMULATION APPROACH ......... 8 4. ANNUAL ENERGY USE ANALYSIS AND SAVINGS PREDICTIONS FOR AS-IHP
BASED ON FIRST WH/DH PROTOTYPE DESIGN ...................................................................... 17 5. SECOND-GENERATION WH/DH PROTOTYPE AND AS-IHP FIELD-TEST SYSTEM
DEVELOPMENT ............................................................................................................................... 19 6. FIELD-TEST SYSTEM PERFORMANCE AND ANALYSIS ......................................................... 23 7. FURTHER COMMERCIAL PRODUCT DEVELOPMENT PLANS .............................................. 39 8. CONCLUSIONS ................................................................................................................................ 39 9. REFERENCES ................................................................................................................................... 40 APPENDIX A. INVENTION DISCLOSURES FILED UNDER CRADA WORK PROGRAM ........... A-1


v
LIST OF FIGURES
Figure 1. Conceptual installation of residential AS-IHP. ............................................................................. 1 Figure 2 AS-IHP system schematic with SC plus “on-demand” WH mode shown. .................................... 2 Figure 3. Two-unit AS-IHP concept schematic. ........................................................................................... 3 Figure 4. Fluted tube-in-tube water-to-refrigerant heat exchanger (Rice et al. 2014). ................................. 8 Figure 5. CAD Drawing of prototype WH/DH module layout (Rice et al. 2014). ....................................... 9 Figure 6. Refrigerant-side design in WH and DH modes (Uselton 2014). ................................................. 10 Figure 7. WH/DH indoor airflow and condenser subcooling parametrics (Rice et al. 2014). ................... 10 Figure 8. WH/DH module as received with bover removed: (a) compressor; (b) WH mode
condenser; (c) DH mode condenser; (d) evaporator; (e) mode switch valve; (f) thermal
expansion valve and distributor; (g) water pump; (h) blower housing; and (i) air filter
(Rice et al. 2014). ........................................................................................................................... 13 Figure 9. Steady-state WH capacity test results showing performance improvement after isolating
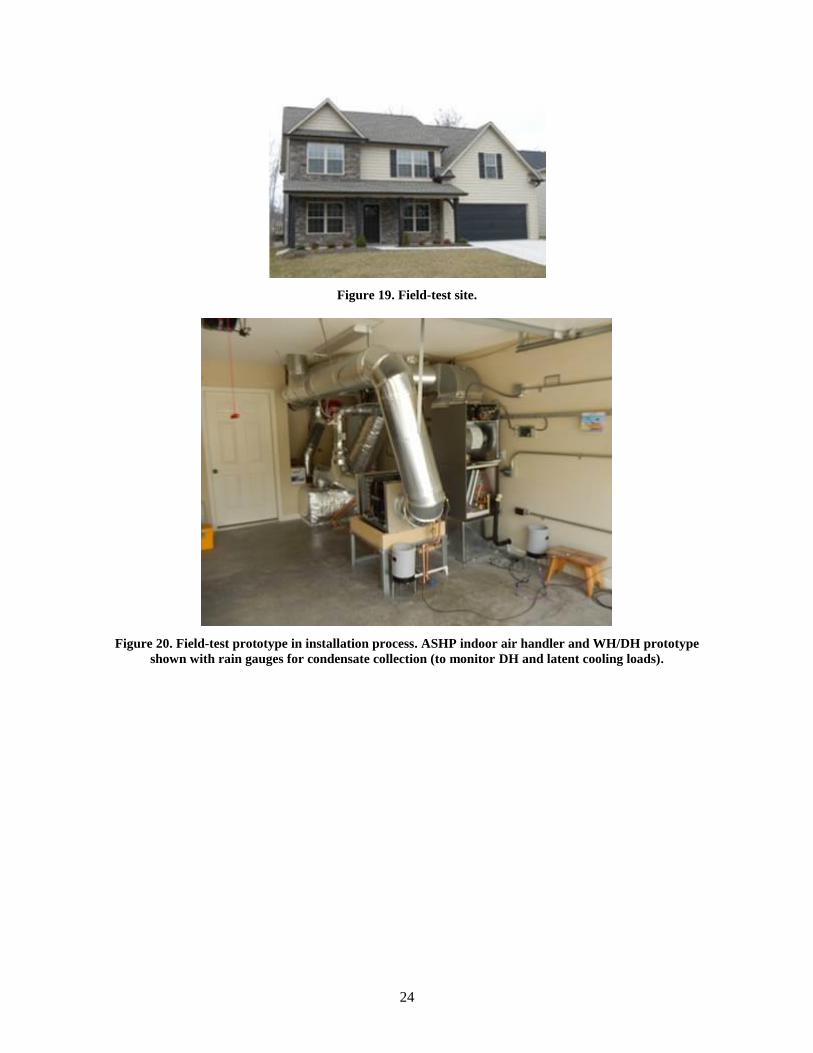
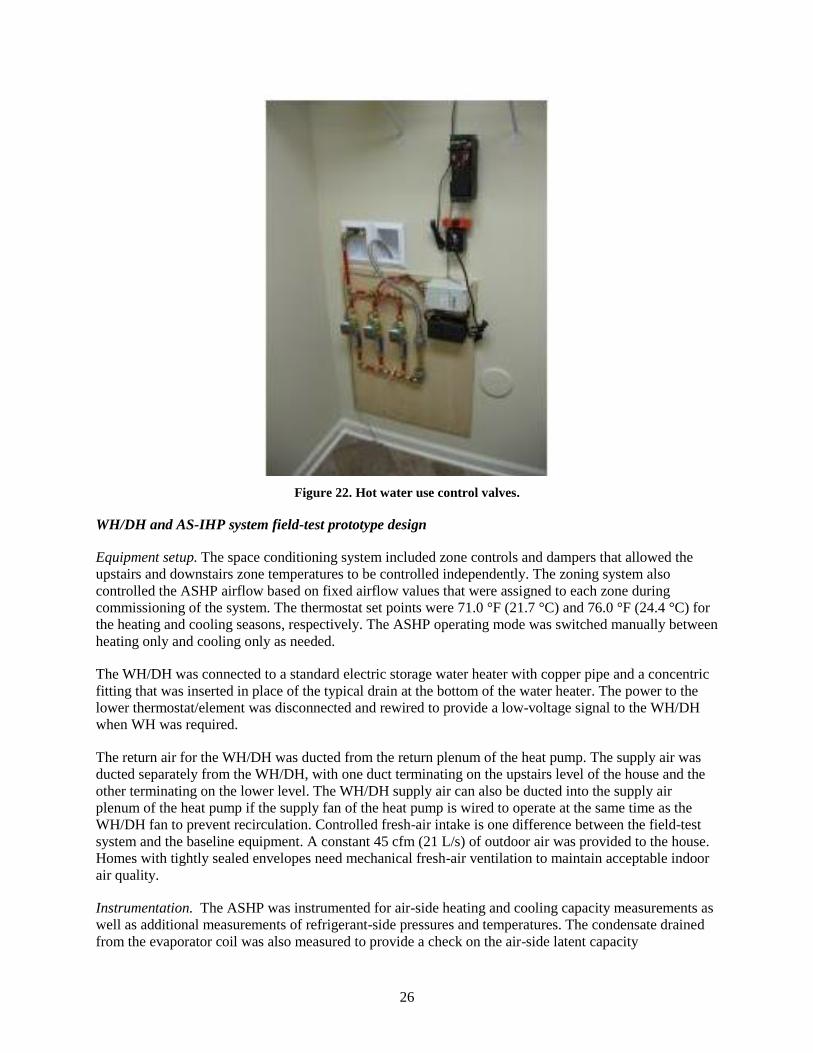
condenser with insulation (Rice et al. 2014). ................................................................................. 15 Figure 10. WH/DH EF test water inlet and outlet temperatures (Rice et al. 2014). ................................... 16 Figure 11. Final steady-state WH COP test results—Prototype 1 (Rice et al. 2014). ................................. 16 Figure 12. Assumed daily hot water draw schedule from DHW tank (Rice et al. 2014). ........................... 17 Figure 13. Second-generation WH/DH module prototype. ........................................................................ 19 Figure 14. Second-generation prototype blower performance vs. first-generation blower. ........................ 20 Figure 15. Schematic of coaxial tank water fitting. .................................................................................... 21 Figure 16. Field-test WH/DH prototype. .................................................................................................... 21 Figure 17. CAD drawing of field-test prototype WH/DH module. ............................................................ 22 Figure 18. Two-unit AS-IHP field-test system arrangment. ....................................................................... 23 Figure 19. Field-test site. ............................................................................................................................ 24 Figure 20. Field-test prototype in installation process. ASHP indoor air handler and WH/DH
prototype shown with rain gauges for condensate collection (to monitor DH and latent
cooling loads). ................................................................................................................................ 24 Figure 21. Field data acquisition system. .................................................................................................... 25 Figure 22. Hot water use control valves. .................................................................................................... 26 Figure 23. WH/DH cycling between DH mode and V mode with condensate evaporation during
ventilation, for equal V and DH airflow rates (top plot) and with reduced airflow during
V mode (bottom plot) (Munk et al. 2017). ..................................................................................... 28 Figure 24. Monthly DH efficiency and runtime (Munk et al, 2017). .......................................................... 28 Figure 25. Histogram of daily hot water use at the research house (Munk et al. 2017).............................. 29 Figure 26. WH mode COP for various entering air and DHW temperatures with percentage of
total WH operating hours labeled for each set of conditions (Munk et al. 2017). ......................... 30 Figure 27. Monthly average WH mode COPs of the WH/DH HP with and without backup
resistance heat use and heat losses from the storage tank and water lines connecting the
WH/DH to the storage tank (Munk et al. 2017). ............................................................................ 31 Figure 28. Field-test house 2015–2016 heating and cooling load lines ...................................................... 34 Figure 29. Field-test house 2015–2016 heating and cooling load lines vs. AHRI 210/240 load
lines (max and min). ...................................................................................................................... 34 Figure 30. Average hourly heating, sensible cooling, and latent cooling loads of the field-test
house (Munk et al. 2017). .............................................................................................................. 37 Figure 31. Cooling and heating season hours falling within outdoor air temperature bins (Munk et
al. 2017). ........................................................................................................................................ 37

vii
LIST OF TABLES
Table 1. Daily hot water draw schedule assumed for analysis ..................................................................... 5 Table 2. Annual SH, SC, WH, and demand DH loads for an nZEH-ready house in five US
locations ........................................................................................................................................... 5 Table 3. Annual site HVAC/WH system energy use and hourly peak demand for an nZEH-ready
house with baseline HVAC/WH system .......................................................................................... 6 Table 4. Estimated annual site HVAC/WH system energy use and hourly peak demand with AS-
IHP system (winter humidification active) ...................................................................................... 6 Table 5. Detailed AS-IHP performance vs. baseline system ........................................................................ 7 Table 6. Energy use comparison between Lennox AS-IHP prototype (based on first-generation
WH/DH) and baseline one- and two-speed equipment suites ........................................................ 12 Table 7. Inlet air and water conditions for DH and WH steady-state testing of WH/DH unit
(Rice et al. 2014) ............................................................................................................................ 14 Table 8. Energy use and savings predictions for AS-IHP with reduced flow WH/DH unit
configuration (Rice et al. 2014) ..................................................................................................... 18 Table 9. WH load fraction for 2600 ft2 house used in Table 6 and nZEH-ready house (Table 2) .............. 19 Table 10. Field-test WH/DH prototype unit key components list .............................................................. 22 Table 11. SC data for the ASHP and AS-IHP system including the cooling and heating
byproducts of the WH/DH (Munk et al. 2017) .............................................................................. 32 Table 12. SH data for the ASHP and AS-IHP system including the cooling and heating
byproducts of the WH/DH (Munk et al. 2017) .............................................................................. 33 Table 13. Site-measured seasonal SH and SC COPs vs. estimated AHRI 210/240 ratings for
ASHP unit used in AS-IHP system ................................................................................................ 33 Table 14. Average vs. 2015–2016 test site heating and cooling degree days ............................................. 36 Table 15. Estimated annual energy savings for the AS-IHP relative to baseline equipment – based
on bin-hour analysis (Munk et al. 2017) ........................................................................................ 38 Table 16. AS-IHP system 2015–2016 energy savings vs. estimated baseline system performance
at test site ((based on 13 SEER ASHP field tests in 2011–2012) .................................................. 39

viii
ix
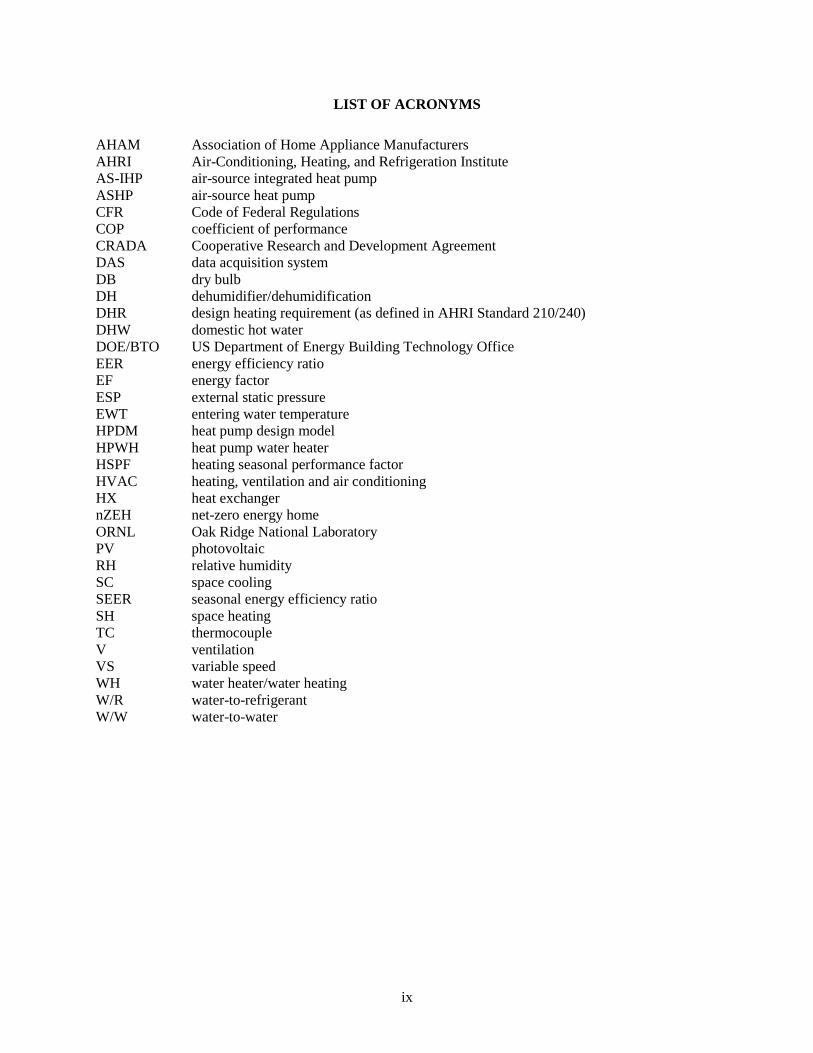
LIST OF ACRONYMS
AHAM Association of Home Appliance Manufacturers
AHRI Air-Conditioning, Heating, and Refrigeration Institute
AS-IHP air-source integrated heat pump
ASHP air-source heat pump
CFR Code of Federal Regulations
COP coefficient of performance
CRADA Cooperative Research and Development Agreement
DAS data acquisition system
DB dry bulb
DH dehumidifier/dehumidification
DHR design heating requirement (as defined in AHRI Standard 210/240)
DHW domestic hot water
DOE/BTO US Department of Energy Building Technology Office
EER energy efficiency ratio
EF energy factor
ESP external static pressure
EWT entering water temperature
HPDM heat pump design model
HPWH heat pump water heater
HSPF heating seasonal performance factor
HVAC heating, ventilation and air conditioning
HX heat exchanger
nZEH net-zero energy home
ORNL Oak Ridge National Laboratory
PV photovoltaic
RH relative humidity
SC space cooling
SEER seasonal energy efficiency ratio
SH space heating
TC thermocouple
V ventilation
VS variable speed
WH water heater/water heating
W/R water-to-refrigerant
W/W water-to-water


xi
ACKNOWLEDGMENTS
The authors thank Mr. Dutch Uselton and Mr. Travis Crawford of the Lennox Industries, Inc., project
team for their considerable contributions to the Cooperative Research and Development Agreement
(CRADA) project and to this report. We express appreciation to our ORNL colleagues Dr. Som Shrestha
for technical review of the document, Ms. Kathryn Lord for preparation of the draft manuscript, and Ms.
Laurie Varma for technical editing of the manuscript. The authors also thank Mr. Antonio Bouza of the
US Department of Energy Building Technology Office for supporting Oak Ridge National Laboratory’s
CRADA efforts under Contract No. DE-AC05-00OR22725 with UT-Battelle, LLC.


xiii
EXECUTIVE SUMMARY
Between October 2007 and September 2017, Oak Ridge National Laboratory (ORNL) and Lennox
Industries, Inc. (Lennox) engaged in a Cooperative Research and Development Agreement (CRADA) to
develop an air-source integrated heat pump (AS-IHP) system for the US residential market. The Lennox
AS-IHP concept consisted of a high-efficiency air-source heat pump (ASHP) for space heating and
cooling services and a separate heat pump water heater/dehumidifier (WH/DH) module for domestic
water heating and dehumidification (DH) services. A key feature of this system approach with the
separate WH/DH is capability to pretreat (i.e., dehumidify) ventilation air and dedicated whole-house DH
independent of the ASHP. Two generations of laboratory prototype WH/DH units were designed,
fabricated, and lab tested. Performance maps for the system were developed using the latest research
version of the US Department of Energy/ORNL heat pump design model (Rice 1992; Rice and Jackson
2005; Shen et al. 2012) as calibrated against the lab test data. These maps served as the input to TRNSYS
(Solar Energy Laboratory et al. 2010) to predict annual performance relative to a baseline suite of
equipment meeting minimum efficiency standards in effect in 2006 (i.e., a combination of an ASHP with
a seasonal energy efficiency ratio (SEER) of 13 and resistance water heater with an energy factor (EF) of
0.9). Predicted total annual energy savings (based on use of a two-speed ASHP and the second-generation
WH/DH prototype for the AS-IHP), while providing space conditioning, water heating, and
dehumidification for a tight, well-insulated 2600 ft2 (242 m2) house at three US locations, ranged from 33
to 36%, averaging 35%, relative to the baseline system. The lowest savings were seen at the cold-climate
Chicago location. Predicted energy use for water heating was reduced by about 50 to 60% relative to a
resistance WH.
Based on the lab prototype tests and analyses results, a field-test prototype WH/DH was designed and
fabricated by Lennox. The WH/DH prototype and a variable-speed ASHP were installed in a 2400 ft2
(223 m2) research house in Knoxville, Tennessee, and field tested from August 2015 to October 2016.
Additional field testing of the WH/DH unit continued through May 2017 to evaluate several design
changes intended to improve the DH performance. For the 2015–2016 AS-IHP system test period,
overall space conditioning efficiencies were 4.72 for space cooling (SC) and 2.23 for space heating (SH).
For water heating (WH), the overall average coefficient of performance (COP) was 2.75 for the WH/DH
unit only and 2.19 for the total system, including COP degradations due to heat losses from the
connecting lines between the WH/DH and tank (~10%), heat losses from the water tank (~8%), and
backup electric heat usage (~3%). The WH COP was also negatively impacted by a 20-day period in
January 2016 during which there were no hot water draws due to a control issue. Overall, the field
demonstrated DH efficiency (when examining only the months with significant run hours in DH mode)
was 1.7 L/kWh; monthly averages ranged from 1.5 to 2.1.
Based on the demonstrated field performance of the AS-IHP prototype and estimated performance of a
baseline system operating under the same loads and weather conditions, a bin analysis estimated that the
prototype would achieve ~30% energy savings relative to the minimum efficiency suite. The estimated
WH savings were ~60%, and SC mode savings were >30%. However, estimated SH savings were only
about 10%. We found that the heating load for the field-test house was about 50% higher at the 5°F
design condition than that used for heating seasonal performance factor ratings calculations for this size
unit. This resulted in a higher level of use of backup electric resistance heating (at a COP of 1) than would
be assumed for the ratings calculations. Issues were also found with the zone control system, which
penalized the space conditioning (particularly the space cooling) performance of the variable speed
ASHP. A secondary comparison based on earlier field tests of two baseline 13 SEER ASHPs in another
house in the same area with lower heating loads indicated ~40% overall energy savings for the AS-IHP:
~60% WH savings, ~45% SC savings, and ~25% SH savings.

1
1. INTRODUCTION
Oak Ridge National Laboratory (ORNL), UT-Battelle, LLC, and Lennox Industries, Inc. (Lennox)
initiated a Cooperative Research and Development Agreement (CRADA) to support development of a
new residential heating, ventilation and air conditioning (HVAC) & water heating (WH) product—an air-
source integrated heat pump (AS-IHP). The goal was to introduce a new, highly efficient class of products
for providing energy services (e.g., space heating and cooling [SH/SC], WH, and indoor humidity
control) to residential and small commercial buildings while consuming ~50% less energy than current
minimum efficiency equipment. This project was one of two similar CRADA projects devoted to AS-
IHP prototype system development. The other was conducted in partnership with Nordyne, LLC, and has
been summarized in a report by Baxter et al. (2015).
The US Department of Energy’s Building Technologies Office (DOE-BTO) has a long-term goal to
reduce the energy use intensity of US buildings by 30% vs. 2010 levels by 2030, increasing to 50% in the
long term (Risser 2016). To achieve this vision, a deep reduction of the energy used by the energy service
equipment providing SH/SC, WH, and indoor humidity control is required—50% compared with today’s
best common practice. One approach to achieving this is to produce a single system that provides multiple
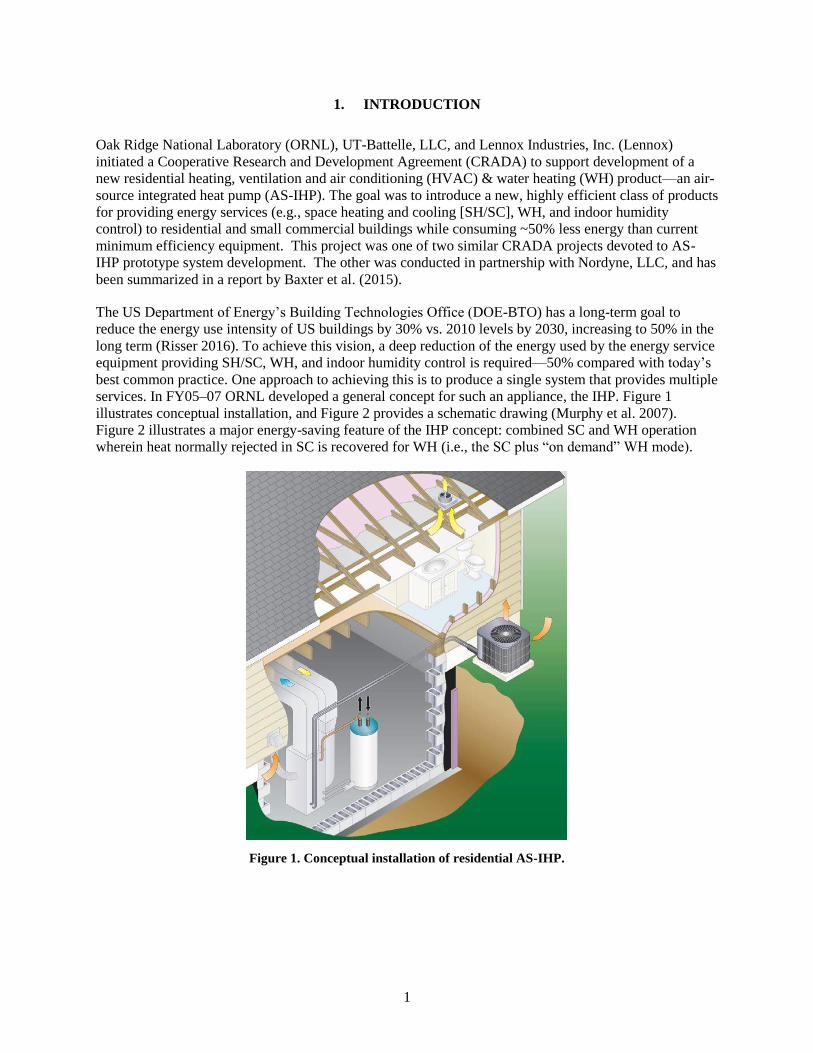
services. In FY05–07 ORNL developed a general concept for such an appliance, the IHP. Figure 1
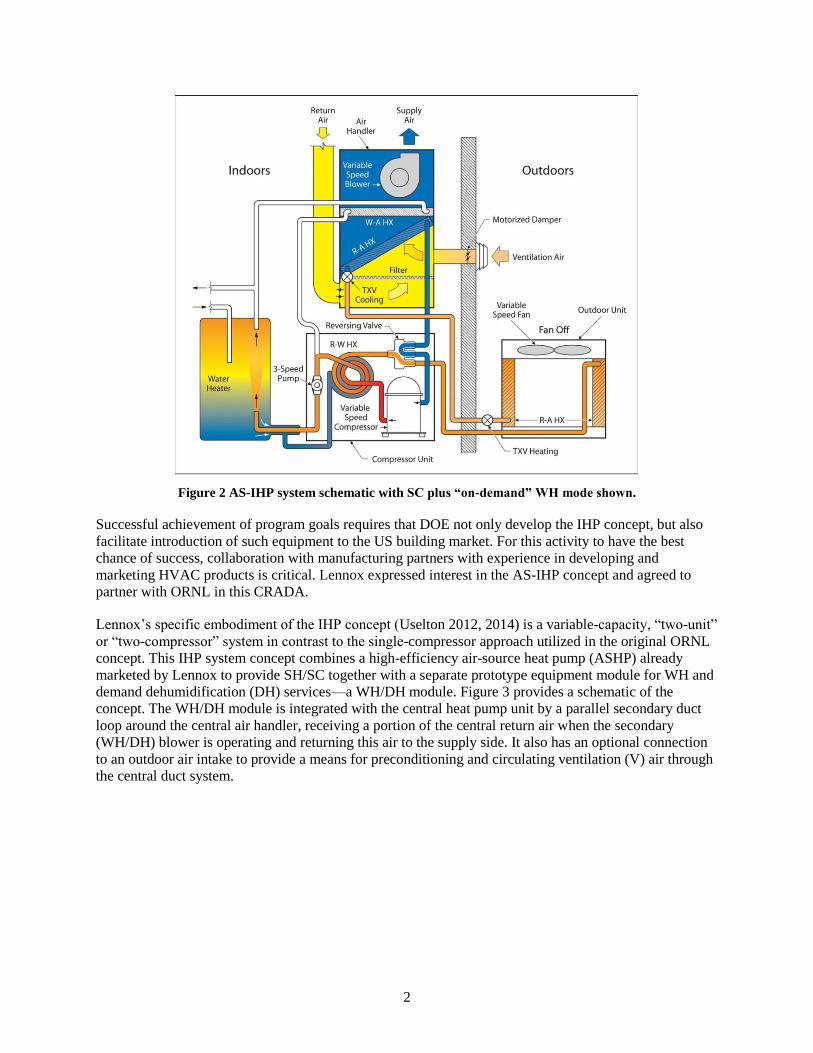
illustrates conceptual installation, and Figure 2 provides a schematic drawing (Murphy et al. 2007).
Figure 2 illustrates a major energy-saving feature of the IHP concept: combined SC and WH operation
wherein heat normally rejected in SC is recovered for WH (i.e., the SC plus “on demand” WH mode).
Figure 1. Conceptual installation of residential AS-IHP.
2
Figure 2 AS-IHP system schematic with SC plus “on-demand” WH mode shown.
Successful achievement of program goals requires that DOE not only develop the IHP concept, but also
facilitate introduction of such equipment to the US building market. For this activity to have the best
chance of success, collaboration with manufacturing partners with experience in developing and
marketing HVAC products is critical. Lennox expressed interest in the AS-IHP concept and agreed to
partner with ORNL in this CRADA.
Lennox’s specific embodiment of the IHP concept (Uselton 2012, 2014) is a variable-capacity, “two-unit”
or “two-compressor” system in contrast to the single-compressor approach utilized in the original ORNL
concept. This IHP system concept combines a high-efficiency air-source heat pump (ASHP) already
marketed by Lennox to provide SH/SC together with a separate prototype equipment module for WH and
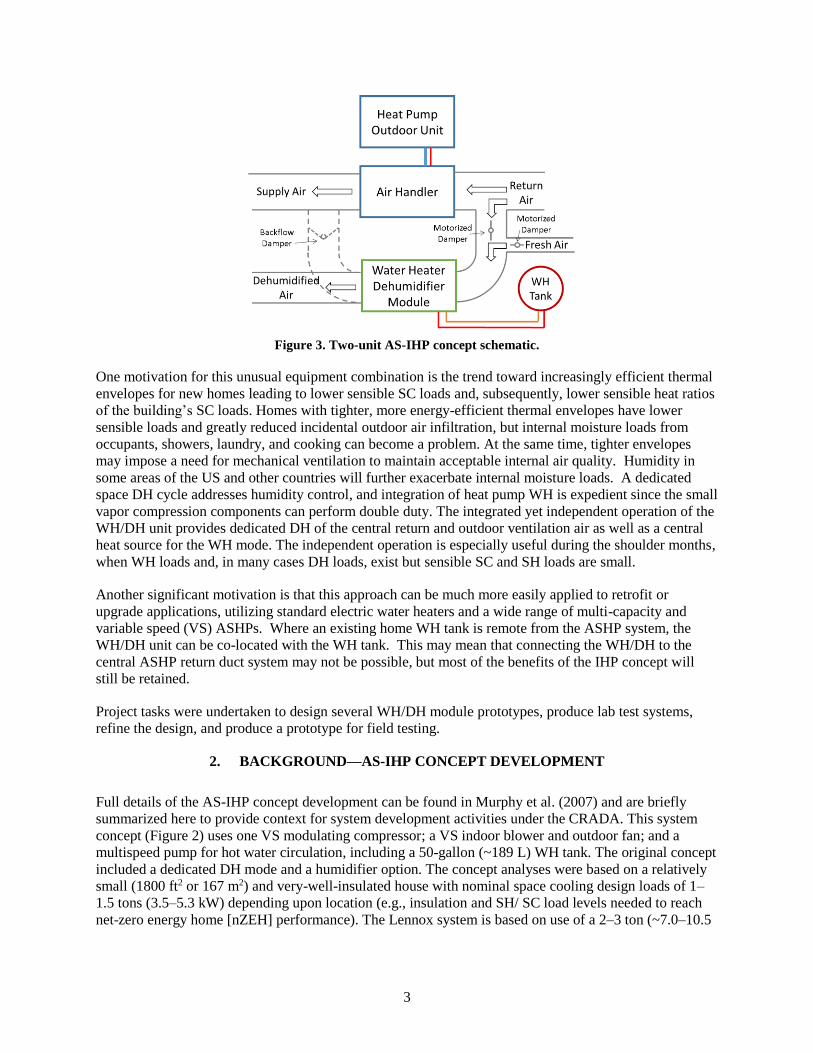
demand dehumidification (DH) services—a WH/DH module. Figure 3 provides a schematic of the
concept. The WH/DH module is integrated with the central heat pump unit by a parallel secondary duct
loop around the central air handler, receiving a portion of the central return air when the secondary
(WH/DH) blower is operating and returning this air to the supply side. It also has an optional connection
to an outdoor air intake to provide a means for preconditioning and circulating ventilation (V) air through
the central duct system.
3
Figure 3. Two-unit AS-IHP concept schematic.
One motivation for this unusual equipment combination is the trend toward increasingly efficient thermal
envelopes for new homes leading to lower sensible SC loads and, subsequently, lower sensible heat ratios
of the building’s SC loads. Homes with tighter, more energy-efficient thermal envelopes have lower
sensible loads and greatly reduced incidental outdoor air infiltration, but internal moisture loads from
occupants, showers, laundry, and cooking can become a problem. At the same time, tighter envelopes
may impose a need for mechanical ventilation to maintain acceptable internal air quality. Humidity in
some areas of the US and other countries will further exacerbate internal moisture loads. A dedicated
space DH cycle addresses humidity control, and integration of heat pump WH is expedient since the small
vapor compression components can perform double duty. The integrated yet independent operation of the
WH/DH unit provides dedicated DH of the central return and outdoor ventilation air as well as a central
heat source for the WH mode. The independent operation is especially useful during the shoulder months,
when WH loads and, in many cases DH loads, exist but sensible SC and SH loads are small.
Another significant motivation is that this approach can be much more easily applied to retrofit or
upgrade applications, utilizing standard electric water heaters and a wide range of multi-capacity and
variable speed (VS) ASHPs. Where an existing home WH tank is remote from the ASHP system, the
WH/DH unit can be co-located with the WH tank. This may mean that connecting the WH/DH to the
central ASHP return duct system may not be possible, but most of the benefits of the IHP concept will
still be retained.
Project tasks were undertaken to design several WH/DH module prototypes, produce lab test systems,
refine the design, and produce a prototype for field testing.
2. BACKGROUND—AS-IHP CONCEPT DEVELOPMENT
Full details of the AS-IHP concept development can be found in Murphy et al. (2007) and are briefly
summarized here to provide context for system development activities under the CRADA. This system
concept (Figure 2) uses one VS modulating compressor; a VS indoor blower and outdoor fan; and a
multispeed pump for hot water circulation, including a 50-gallon (~189 L) WH tank. The original concept
included a dedicated DH mode and a humidifier option. The concept analyses were based on a relatively
small (1800 ft2 or 167 m2) and very-well-insulated house with nominal space cooling design loads of 1–
1.5 tons (3.5–5.3 kW) depending upon location (e.g., insulation and SH/ SC load levels needed to reach
net-zero energy home [nZEH] performance). The Lennox system is based on use of a 2–3 ton (~7.0–10.5
4
kW) nominal size ASHP designed for somewhat larger residences typical of new construction practice.
For such homes, the fraction of the total load due to WH is reduced from the original concept.
Annual energy use simulations for a baseline suite of individual systems and the AS-IHP were performed
using the TRNSYS16 platform. The baseline suite consisted of a 13 SEER/7.7 HSPF ASHP, 0.90 energy
factor (EF) electric WH, standalone dehumidifier representative of average units available in 2006, the
humidifier option, and ventilation per American Society of Heating, Refrigerating and Air-Conditioning
Engineers (ASHRAE) standard 62.2 (ASHRAE 2007) requirements. Annual subhourly simulations were
performed for the baseline system and the IHP in an 1800 ft2, NZE-ready house for five locations:
• Atlanta (mixed–humid climate)
• Houston (hot–humid climate)
• Phoenix (hot–dry climate)
• San Francisco (marine climate)
• Chicago (cold climate)
The relatively small house coupled with its NZE-ready insulation characteristics resulted in very low
cooling design loads and nominal IHP cooling capacity levels. Simulating the IHP systems required that
the ORNL heat pump design model (HPDM) be utilized to develop detailed performance maps for each
operating mode, which were then input to TRNSYS. Set points for space heating and cooling were 71 °F
and 76 °F (21.7 °C and 24.4 °C), respectively. The WH set point was 120 °F (48.9 °C) and total daily hot
water use of ~64.5 gallons (~245 L) was assumed using the schedule shown in Table 1. The systems’
humidity control set points (i.e., dehumidifier and humidifier for the baseline; dedicated dehumidification
mode and humidifier for the IHP) were set to maintain indoor relative humidity (RH) of ≤60% in summer,
fall, and spring and ≥30% in winter.
5
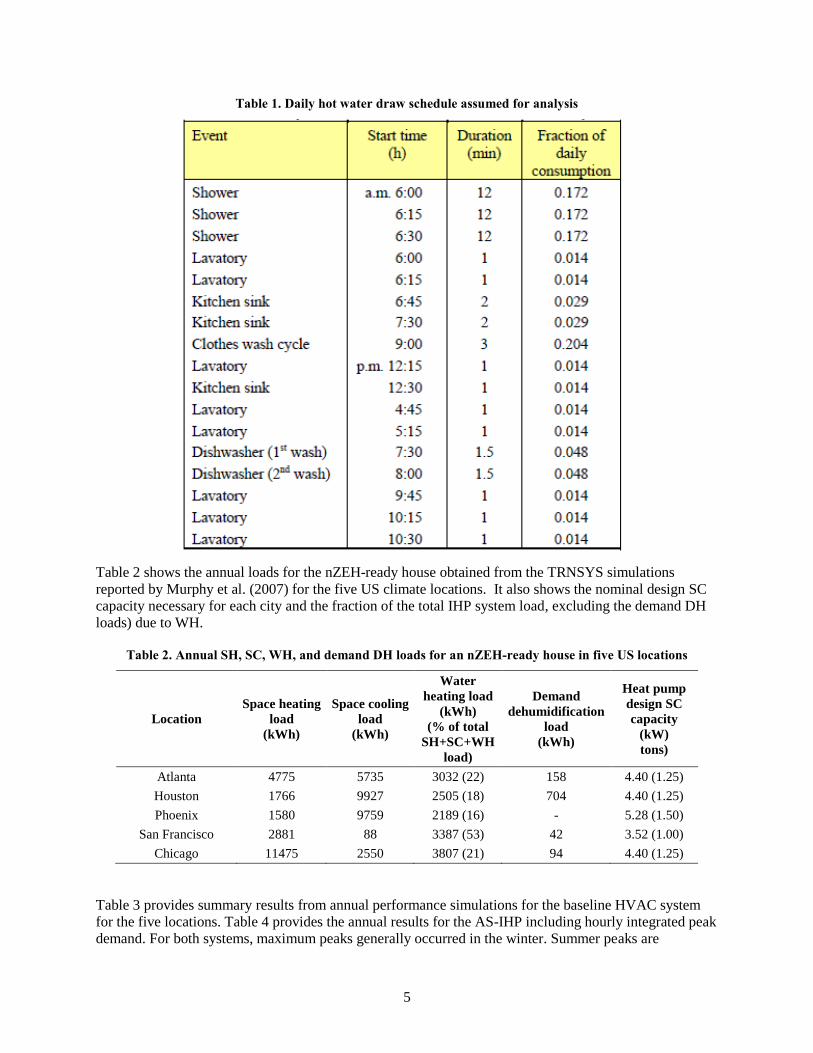
Table 1. Daily hot water draw schedule assumed for analysis
Table 2 shows the annual loads for the nZEH-ready house obtained from the TRNSYS simulations
reported by Murphy et al. (2007) for the five US climate locations. It also shows the nominal design SC
capacity necessary for each city and the fraction of the total IHP system load, excluding the demand DH
loads) due to WH.
Table 2. Annual SH, SC, WH, and demand DH loads for an nZEH-ready house in five US locations
Location
Space heating
load
(kWh)
Space cooling
load
(kWh)
Water
heating load
(kWh)
(% of total
SH+SC+WH
load)
Demand
dehumidification
load
(kWh)
Heat pump
design SC
capacity
(kW)
tons)
Atlanta 4775 5735 3032 (22) 158 4.40 (1.25)
Houston 1766 9927 2505 (18) 704 4.40 (1.25)
Phoenix 1580 9759 2189 (16) - 5.28 (1.50)
San Francisco 2881 88 3387 (53) 42 3.52 (1.00)
Chicago 11475 2550 3807 (21) 94 4.40 (1.25)
Table 3 provides summary results from annual performance simulations for the baseline HVAC system
for the five locations. Table 4 provides the annual results for the AS-IHP including hourly integrated peak
demand. For both systems, maximum peaks generally occurred in the winter. Summer peaks are

6
somewhat lower and generally occurred in July or August. Detailed results from the simulations are given
in Table 5. The total energy consumption and consumption by individual modes for the baseline system
are from the TRNSYS simulations. For the AS-IHP, the total energy consumption, for the ventilation fan
and electric backup WH and SH, are from the detailed TRNSYS simulations. Breakdowns for the other
AS-IHP modes were taken from the hourly simulations as well, but with adjustments to fairly charge the
water pump power in combined modes to the WH function.
Table 3. Annual site HVAC/WH system energy use and hourly peak demand for an nZEH-ready house with
baseline HVAC/WH system
Location
Heat pump
cooling capacity
(kW)
(tons)
Site energy use
(kWh)
Hourly peak kW
demand
(W/S/SA)*
Atlanta 4.40 (1.25) 7230 8.6/4.6/2.1
Houston 4.40 (1.25) 7380 6.1/4.4/2.2
Phoenix 5.28 (1.50) 6518 6.1/3.9/2.1
San Francisco 3.52 (1.00) 4968 5.7/5.6/1.6
Chicago 4.40 (1.25) 10773 9.7/6.1/2.4
* W–winter morning; S–summer maximum; SA–summer midafternoon.
Table 4. Estimated annual site HVAC/WH system energy use and hourly peak demand with AS-IHP system
(winter humidification active)
Location
Heat pump
cooling capacity
(tons)
Site energy use
(kWh)
Hourly peak kW
demand
(W/S/SA)*
% energy savings vs.
baseline HVAC
Atlanta 4.40 (1.25) 3349 2.2/1.5/1.2 53.7
Houston 4.40 (1.25) 3418 1.9/1.1/1.1 53.7
Phoenix 5.28 (1.50) 3361 2.1/1.7/1.7 48.4
San Francisco 3.52 (1.00) 1629 1.8/1.6/0.8 67.2
Chicago 4.40 (1.25) 5865 7.3/1.6/1.0 45.6
* W–winter morning; S–summer maximum; SA–summer midafternoon.
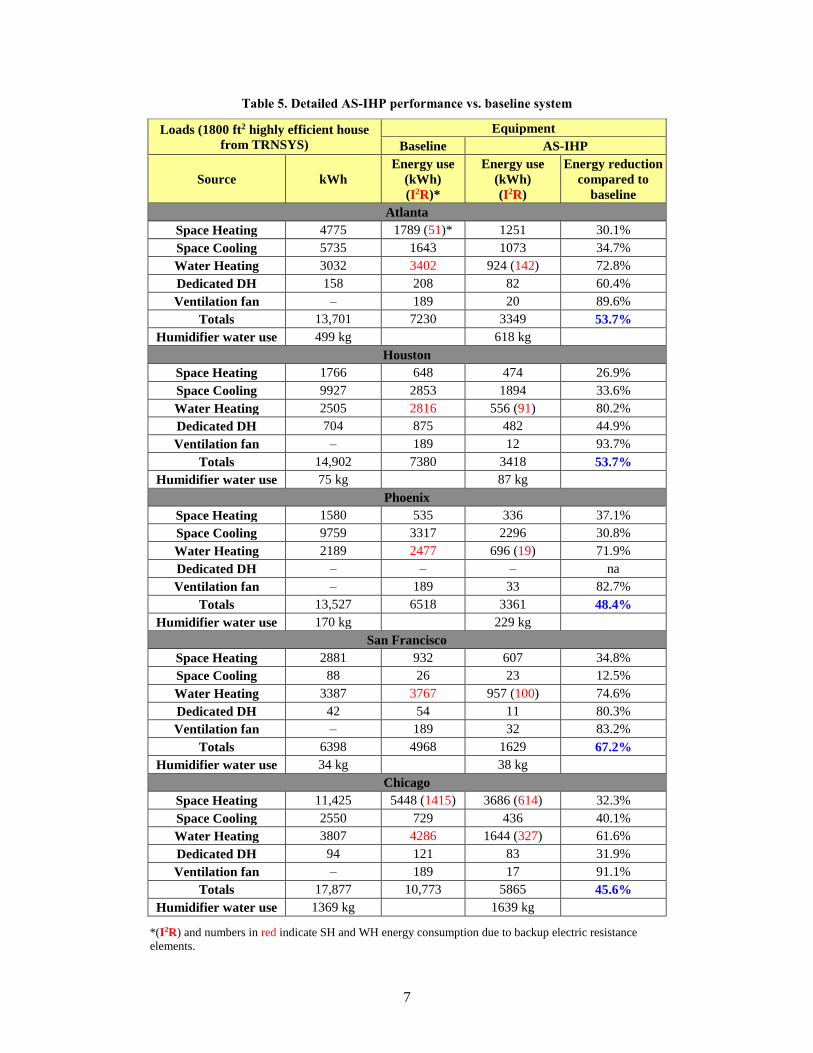
The results summarized in Tables 4 and 5 show that the AS-IHP exceeded 50% savings over the baseline
system in three of the five locations, almost reaching 70% in the mild San Francisco climate. The summer
cooling performance of the concept system design under the extreme hot outdoor conditions seen in
Phoenix is not quite high enough to enable reaching 50% annual savings in this SC-dominated climate. In
Chicago, the energy service loads are dominated by heating—SH and WH together constitute ~84% of
the total load—and the AS-IHP heating performance declines during the extremely cold temperatures
encountered in this climate.
Winter peak demand was approximately 25 to 75% lower for the AS-IHPs than for the baseline.
Maximum summer peaks usually occurred in the morning during peak domestic hot water (DHW)
demand periods and were about 55 to 75% lower vs. the baseline. Summer midafternoon peaks were ~20
to 60% lower than those of the base system, depending upon location.
7
Table 5. Detailed AS-IHP performance vs. baseline system
Loads (1800 ft2 highly efficient house
from TRNSYS)
Equipment
Baseline AS-IHP
Source kWh
Energy use
(kWh)
(I2R)*
Energy use
(kWh)
(I2R)
Energy reduction
compared to
baseline
Atlanta
Space Heating 4775 1789 (51)* 1251 30.1%
Space Cooling 5735 1643 1073 34.7%
Water Heating 3032 3402 924 (142) 72.8%
Dedicated DH 158 208 82 60.4%
Ventilation fan – 189 20 89.6%
Totals 13,701 7230 3349 53.7%
Humidifier water use 499 kg 618 kg
Houston
Space Heating 1766 648 474 26.9%
Space Cooling 9927 2853 1894 33.6%
Water Heating 2505 2816 556 (91) 80.2%
Dedicated DH 704 875 482 44.9%
Ventilation fan – 189 12 93.7%
Totals 14,902 7380 3418 53.7%
Humidifier water use 75 kg 87 kg
Phoenix
Space Heating 1580 535 336 37.1%
Space Cooling 9759 3317 2296 30.8%
Water Heating 2189 2477 696 (19) 71.9%
Dedicated DH – – – na
Ventilation fan – 189 33 82.7%
Totals 13,527 6518 3361 48.4%
Humidifier water use 170 kg 229 kg
San Francisco
Space Heating 2881 932 607 34.8%
Space Cooling 88 26 23 12.5%
Water Heating 3387 3767 957 (100) 74.6%
Dedicated DH 42 54 11 80.3%
Ventilation fan – 189 32 83.2%
Totals 6398 4968 1629 67.2%
Humidifier water use 34 kg 38 kg
Chicago
Space Heating 11,425 5448 (1415) 3686 (614) 32.3%
Space Cooling 2550 729 436 40.1%
Water Heating 3807 4286 1644 (327) 61.6%
Dedicated DH 94 121 83 31.9%
Ventilation fan – 189 17 91.1%
Totals 17,877 10,773 5865 45.6%
Humidifier water use 1369 kg 1639 kg
*(I2R) and numbers in red indicate SH and WH energy consumption due to backup electric resistance
elements.

8
3. FIRST-GENERATION WH/DH PROTOTYPE DESIGN AND SIMULATION APPROACH
The AS-IHP concept investigation summarized above led to collaboration with Lennox aimed at
developing a design suitable for residential applications typical of current construction practices. Much
of the information presented in this and the next three sections are taken from two papers: Rice et al.
(2014) and Munk et al. (2017).
WH/DH prototype design goals and analyses.
Design performance goals for the WH/DH unit are to meet or exceed Energy Star performance levels for
WH and DH modes of operation. For the DH mode, the EF requirement for Energy Star rating from
October 1, 2012 through October 24, 2016 (Energy Star 2012) was ≥1.85 L/kWh for units with DH
capacity of <75 pints/day (1.48 L/h) [after October 25, 2016, the EF requirement was increased to ≥2.00
(Energy Star 2016)]. Note that the DH EF values noted here are based on standard indoor ambient
conditions of 60% RH and 80 °F temperature. This capacity was determined adequate for the homes and
climate locations analyzed for this AS-IHP approach, including those locations with the highest DH
loads: Atlanta, Chicago, and Houston. For the WH mode, an EF of ≥2.0 (W/W) is required for Energy
Star designation for electric water heaters (Energy Star 2013, 2015). The remaining design goal was to
provide WH capacity of ~2 kW, about twice that for standalone residential heat pump water heaters
(HPWHs).
A prototype design suitable for lab testing was assembled by Lennox, starting from a whole-house
dehumidifier unit. The prototype uses an R-410A rotary compressor rated at about 7000 Btu/h (2 kW) and
9.5 Btu/Wh energy efficiency ratio (EER) (COP of 2.8) under air-conditioning conditions. Separate
condensers are used for each operating mode—a 1-ton (3.5 kW) fluted tube-in-tube double-walled water-
to-refrigerant (W/R) heat exchanger (HX) and a three-row fin-and-tube air-to-refrigerant HX, in
combination with a common two-row fin-and-tube evaporator. Figure 4 shows the tube-in-tube HX unit
and a cutaway of the fluted tube design, where water flows through the inner fluted tube and refrigerant
flows through the fluted annulus. This HX was installed around the rotary compressor as can be seen in
the CAD drawing of Figure 5.
Figure 4. Fluted tube-in-tube water-to-refrigerant heat exchanger (Rice et al. 2014).
9
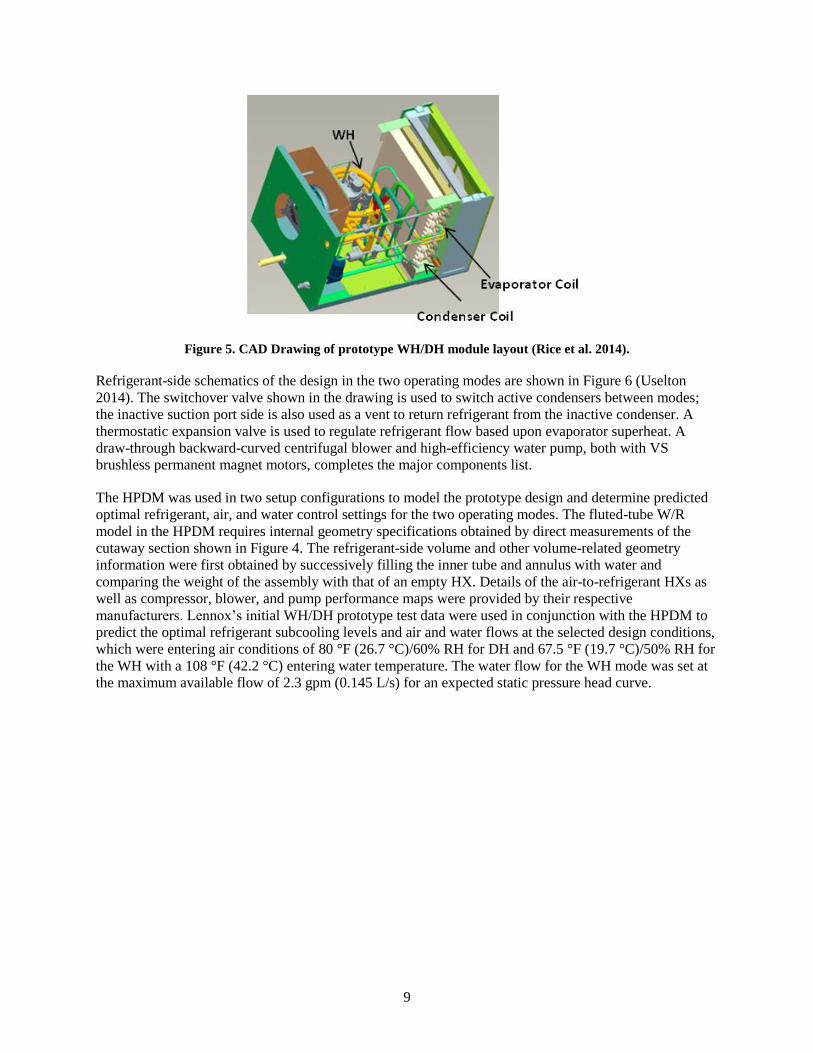
Figure 5. CAD Drawing of prototype WH/DH module layout (Rice et al. 2014).
Refrigerant-side schematics of the design in the two operating modes are shown in Figure 6 (Uselton
2014). The switchover valve shown in the drawing is used to switch active condensers between modes;
the inactive suction port side is also used as a vent to return refrigerant from the inactive condenser. A
thermostatic expansion valve is used to regulate refrigerant flow based upon evaporator superheat. A
draw-through backward-curved centrifugal blower and high-efficiency water pump, both with VS
brushless permanent magnet motors, completes the major components list.
The HPDM was used in two setup configurations to model the prototype design and determine predicted
optimal refrigerant, air, and water control settings for the two operating modes. The fluted-tube W/R
model in the HPDM requires internal geometry specifications obtained by direct measurements of the
cutaway section shown in Figure 4. The refrigerant-side volume and other volume-related geometry
information were first obtained by successively filling the inner tube and annulus with water and
comparing the weight of the assembly with that of an empty HX. Details of the air-to-refrigerant HXs as
well as compressor, blower, and pump performance maps were provided by their respective
manufacturers. Lennox’s initial WH/DH prototype test data were used in conjunction with the HPDM to
predict the optimal refrigerant subcooling levels and air and water flows at the selected design conditions,
which were entering air conditions of 80 °F (26.7 °C)/60% RH for DH and 67.5 °F (19.7 °C)/50% RH for
the WH with a 108 °F (42.2 °C) entering water temperature. The water flow for the WH mode was set at
the maximum available flow of 2.3 gpm (0.145 L/s) for an expected static pressure head curve.

10
Top: WH mode Bottom: DH mode
Figure 6. Refrigerant-side design in WH and DH modes (Uselton 2014).
For the WH mode, the optimum COP was approximately 10 °F (5.6 °C) subcooling and 300 cfm (142
L/s), as shown in Figure 7a by the bold X. For the DH mode, the design goal of <75 pints/day (1.48 L/h)
and Energy Star efficiency could be achieved with the same subcooling and airflow as denoted in Figure
7b by the bold X. This design subcooling level and related charge quantity, lower than for a typical DH
design, was a compromise made to ensure compatibility with efficient operation in WH mode.
(a) WH mode (b) DH mode
Figure 7. WH/DH indoor airflow and condenser subcooling parametrics
(Rice et al. 2014).
Preliminary AS-IHP energy savings estimates based on first- generation WH/DH prototype design.
Using test data provided by Lennox for their 2-ton, two-speed ASHP (SEER of 18.4 and HSPF of 9.1)
(Lennox 2009a, 2009b), and the prototype WH/DH, the team developed calibrated HPDM models for
11
each operational configuration. Available design parameters such as air and water flow rates and
refrigerant charge were optimized for the DH and WH modes. Initial control logic was provided by
Lennox, and this was refined during setup and testing of the TRNSYS simulations to allow independent
operation of the DH or WH modes, as appropriate, along with the primary space conditioning modes.
Bottom-line results (Table 6) show estimated energy savings for an AS-IHP design based on the selected
ASHP. The first WH/DH prototype ranged from just over 36% for Chicago to almost 39% for Atlanta and
Houston. These savings are relative to the primary baseline suite of an R-410A ASHP (SEER of 13,
HSPF of 7.7); standalone dehumidifier (DH EF of 1.4); and 0.9 EF electric resistance WH in a 2600 ft2
(242 m2) nZEH-ready house. WH-only savings range from ~56 to 60% (average annual WH COP of
~2.1–2.2). The second baseline included in the table replaces the minimum-efficiency ASHP with two-
speed Lennox unit with the same DH, WH, and ventilation options. By comparing the energy use in
SH/SC with that of the integrated approach, one can see the increase in SH energy use and the decrease in
SC use caused by the WH system’s cooling of the air, the relative sizes of which vary by climate. Note
also that the DH energy use for the AS-IHP prototype is 28% less than for the baseline cases.

12
Table 6. Energy use comparison between Lennox AS-IHP prototype (based on first-generation WH/DH) and
baseline one- and two-speed equipment suites
13
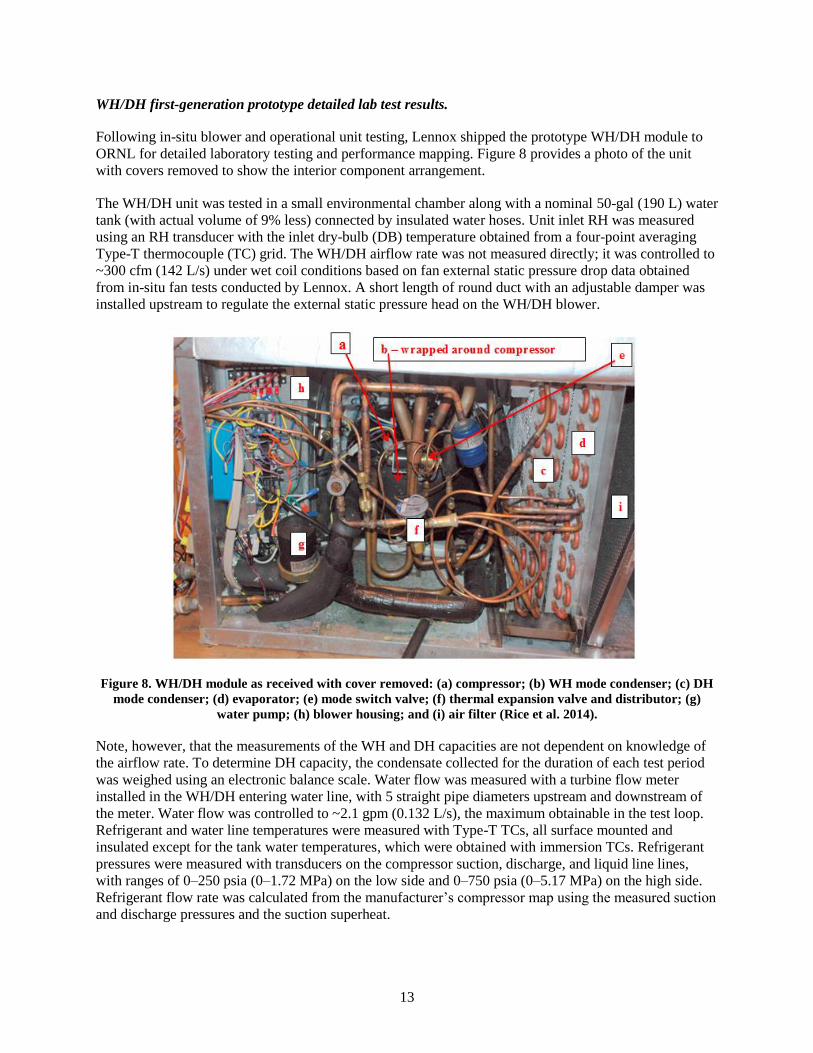
WH/DH first-generation prototype detailed lab test results.
Following in-situ blower and operational unit testing, Lennox shipped the prototype WH/DH module to
ORNL for detailed laboratory testing and performance mapping. Figure 8 provides a photo of the unit
with covers removed to show the interior component arrangement.
The WH/DH unit was tested in a small environmental chamber along with a nominal 50-gal (190 L) water
tank (with actual volume of 9% less) connected by insulated water hoses. Unit inlet RH was measured
using an RH transducer with the inlet dry-bulb (DB) temperature obtained from a four-point averaging
Type-T thermocouple (TC) grid. The WH/DH airflow rate was not measured directly; it was controlled to
~300 cfm (142 L/s) under wet coil conditions based on fan external static pressure drop data obtained
from in-situ fan tests conducted by Lennox. A short length of round duct with an adjustable damper was
installed upstream to regulate the external static pressure head on the WH/DH blower.
Figure 8. WH/DH module as received with cover removed: (a) compressor; (b) WH mode condenser; (c) DH
mode condenser; (d) evaporator; (e) mode switch valve; (f) thermal expansion valve and distributor; (g)
water pump; (h) blower housing; and (i) air filter (Rice et al. 2014).
Note, however, that the measurements of the WH and DH capacities are not dependent on knowledge of
the airflow rate. To determine DH capacity, the condensate collected for the duration of each test period
was weighed using an electronic balance scale. Water flow was measured with a turbine flow meter
installed in the WH/DH entering water line, with 5 straight pipe diameters upstream and downstream of
the meter. Water flow was controlled to ~2.1 gpm (0.132 L/s), the maximum obtainable in the test loop.
Refrigerant and water line temperatures were measured with Type-T TCs, all surface mounted and
insulated except for the tank water temperatures, which were obtained with immersion TCs. Refrigerant
pressures were measured with transducers on the compressor suction, discharge, and liquid line lines,
with ranges of 0–250 psia (0–1.72 MPa) on the low side and 0–750 psia (0–5.17 MPa) on the high side.
Refrigerant flow rate was calculated from the manufacturer’s compressor map using the measured suction
and discharge pressures and the suction superheat.

14
A steady-state test matrix was developed for WH and DH performance mapping tests over a range of inlet
air conditions and water temperatures. As indicated in Table 7, for the DH mode, three ambient
temperatures and three RHs were used, giving nine test points to span the range of expected return air
conditions. In the WH mode, twelve test points were run, using the three most likely indoor DB/RH
conditions in combinations with four entering water temperatures (EWTs).
The steady-state WH and DH tests were run for a minimum of 30 minutes and 1 hour, respectively. In
addition to the performance mapping, tests were conducted to estimate the EF (24-h duration) and first-
hour ratings for the WH mode and the EF rating (6-h duration) for the DH mode using the standard rating
test procedures for each mode (US Code of Federal Regulations [CFR] 2010, for WH; Association of
Home Appliance Manufacturers [AHAM] 2008, for DH).
Table 7. Inlet air and water conditions for DH and WH steady-state testing of WH/DH unit (Rice et al. 2014)
Steady-state DH tests were conducted first to establish the required design charge at DH rating conditions
and ~10°F condenser subcooling and to determine the DH capacity. After determining the refrigerant
charge needed to achieve the desired superheat and subcooling control, a 6-hour DH standard rating test
was run. This confirmed that the capacity was just below the 75 pints/day (1.48 L/h) target with an EF
above 2, exceeding the 2012 and 2016 Energy Star minimums for this size dehumidifier. The condensate
amount was recorded at the end of each hour of the test, which provided hourly measurements with a
maximum deviation of 3.5%. Following this, 1-h steady-state tests were run for each of the nine inlet air
condition combinations in Table 1.
Initial steady-state WH tests followed using the same refrigerant charge as for the DH testing. These test
results showed somewhat lower WH capacities and COPs than predicted from the simulation. From the
refrigerant- and water-side energy flows, the team determined that, for the higher EWTs, there was
significant heat loss from the refrigerant in the outer annulus of the WH condenser HX to the cool air
stream leaving the evaporator.
Next, a baseline WH mode EF for the “as received” unit was obtained based on the standard 24-h use test
procedure in effect prior to April 2015 (US CFR 2010); a value of ~1.5 (lower than expected) indicated
that the heat losses within the unit were significant. To minimize heat losses and improve WH
Inlet DB,
°C
RH
%
Inlet DB,
°C
RH
%
EWT
°C
1 26.7 60 1 20.0 50 21.1
2 26.7 55 2 20.0 50 32.2
3 26.7 50 3 20.0 50 43.3
4 23.3 55 4 20.0 50 54.4
5 23.3 60 5 23.3 55 21.1
6 23.3 50 6 23.3 55 32.2
7 20.0 60 7 23.3 55 43.3
8 20.0 55 8 23.3 55 54.4
9 20.0 50 9 26.7 60 21.1
10 26.7 60 32.2
11 26.7 60 43.3
12 26.7 60 54.4
Test Matrix for WH Mode
Test #
Test Condition
Test #
Test Condition
Test Matrix for DH Mode
15
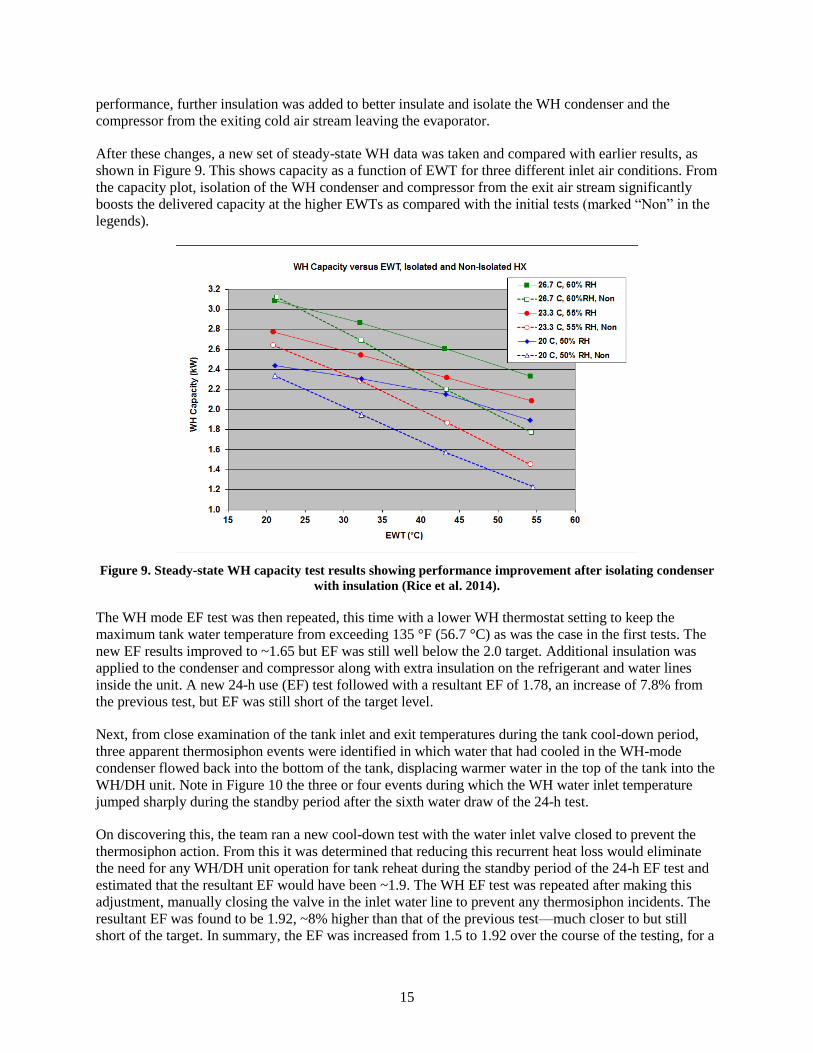
performance, further insulation was added to better insulate and isolate the WH condenser and the
compressor from the exiting cold air stream leaving the evaporator.
After these changes, a new set of steady-state WH data was taken and compared with earlier results, as
shown in Figure 9. This shows capacity as a function of EWT for three different inlet air conditions. From
the capacity plot, isolation of the WH condenser and compressor from the exit air stream significantly
boosts the delivered capacity at the higher EWTs as compared with the initial tests (marked “Non” in the
legends).
Figure 9. Steady-state WH capacity test results showing performance improvement after isolating condenser
with insulation (Rice et al. 2014).
The WH mode EF test was then repeated, this time with a lower WH thermostat setting to keep the
maximum tank water temperature from exceeding 135 °F (56.7 °C) as was the case in the first tests. The
new EF results improved to ~1.65 but EF was still well below the 2.0 target. Additional insulation was
applied to the condenser and compressor along with extra insulation on the refrigerant and water lines
inside the unit. A new 24-h use (EF) test followed with a resultant EF of 1.78, an increase of 7.8% from
the previous test, but EF was still short of the target level.
Next, from close examination of the tank inlet and exit temperatures during the tank cool-down period,
three apparent thermosiphon events were identified in which water that had cooled in the WH-mode
condenser flowed back into the bottom of the tank, displacing warmer water in the top of the tank into the
WH/DH unit. Note in Figure 10 the three or four events during which the WH water inlet temperature
jumped sharply during the standby period after the sixth water draw of the 24-h test.
On discovering this, the team ran a new cool-down test with the water inlet valve closed to prevent the
thermosiphon action. From this it was determined that reducing this recurrent heat loss would eliminate
the need for any WH/DH unit operation for tank reheat during the standby period of the 24-h EF test and
estimated that the resultant EF would have been ~1.9. The WH EF test was repeated after making this
adjustment, manually closing the valve in the inlet water line to prevent any thermosiphon incidents. The
resultant EF was found to be 1.92, ~8% higher than that of the previous test—much closer to but still
short of the target. In summary, the EF was increased from 1.5 to 1.92 over the course of the testing, for a
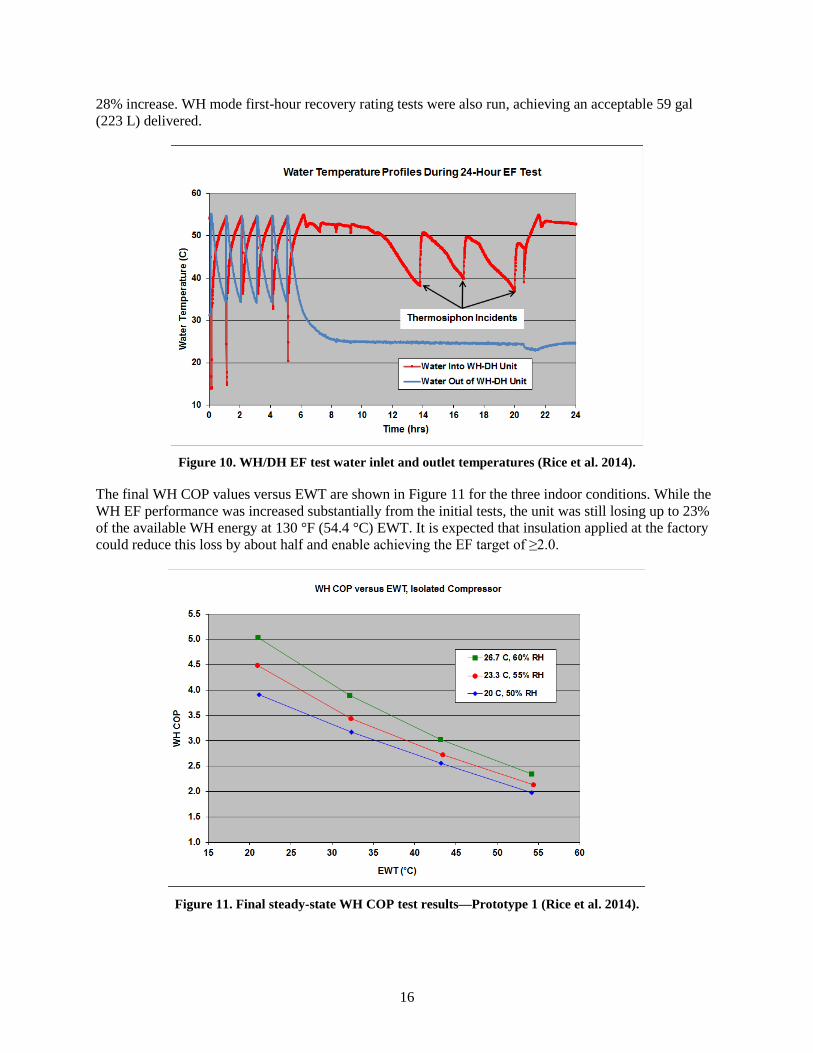
16
28% increase. WH mode first-hour recovery rating tests were also run, achieving an acceptable 59 gal
(223 L) delivered.
Figure 10. WH/DH EF test water inlet and outlet temperatures (Rice et al. 2014).
The final WH COP values versus EWT are shown in Figure 11 for the three indoor conditions. While the
WH EF performance was increased substantially from the initial tests, the unit was still losing up to 23%
of the available WH energy at 130 °F (54.4 °C) EWT. It is expected that insulation applied at the factory
could reduce this loss by about half and enable achieving the EF target of ≥2.0.
Figure 11. Final steady-state WH COP test results—Prototype 1 (Rice et al. 2014).
17
4. ANNUAL ENERGY USE ANALYSIS AND SAVINGS PREDICTIONS FOR AS-IHP BASED
ON FIRST WH/DH PROTOTYPE DESIGN
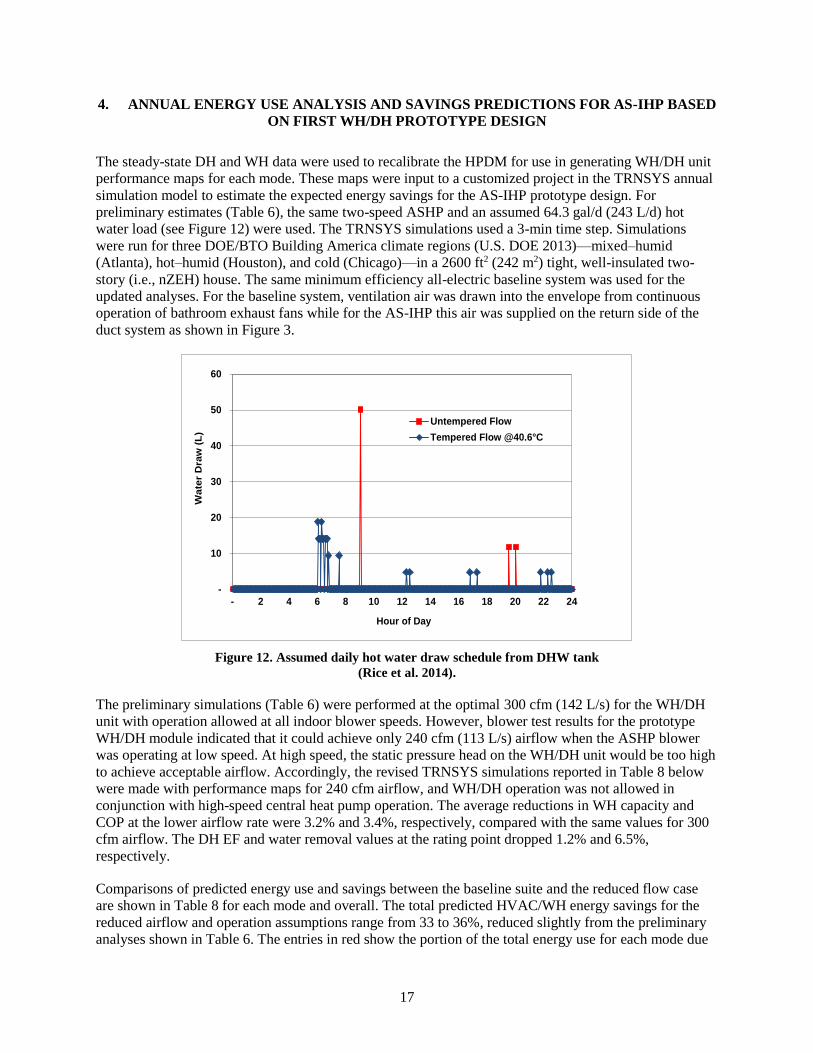
The steady-state DH and WH data were used to recalibrate the HPDM for use in generating WH/DH unit
performance maps for each mode. These maps were input to a customized project in the TRNSYS annual
simulation model to estimate the expected energy savings for the AS-IHP prototype design. For
preliminary estimates (Table 6), the same two-speed ASHP and an assumed 64.3 gal/d (243 L/d) hot
water load (see Figure 12) were used. The TRNSYS simulations used a 3-min time step. Simulations
were run for three DOE/BTO Building America climate regions (U.S. DOE 2013)—mixed–humid
(Atlanta), hot–humid (Houston), and cold (Chicago)—in a 2600 ft2 (242 m2) tight, well-insulated two-
story (i.e., nZEH) house. The same minimum efficiency all-electric baseline system was used for the
updated analyses. For the baseline system, ventilation air was drawn into the envelope from continuous
operation of bathroom exhaust fans while for the AS-IHP this air was supplied on the return side of the
duct system as shown in Figure 3.
Figure 12. Assumed daily hot water draw schedule from DHW tank
(Rice et al. 2014).
The preliminary simulations (Table 6) were performed at the optimal 300 cfm (142 L/s) for the WH/DH
unit with operation allowed at all indoor blower speeds. However, blower test results for the prototype
WH/DH module indicated that it could achieve only 240 cfm (113 L/s) airflow when the ASHP blower
was operating at low speed. At high speed, the static pressure head on the WH/DH unit would be too high
to achieve acceptable airflow. Accordingly, the revised TRNSYS simulations reported in Table 8 below
were made with performance maps for 240 cfm airflow, and WH/DH operation was not allowed in
conjunction with high-speed central heat pump operation. The average reductions in WH capacity and
COP at the lower airflow rate were 3.2% and 3.4%, respectively, compared with the same values for 300
cfm airflow. The DH EF and water removal values at the rating point dropped 1.2% and 6.5%,
respectively.
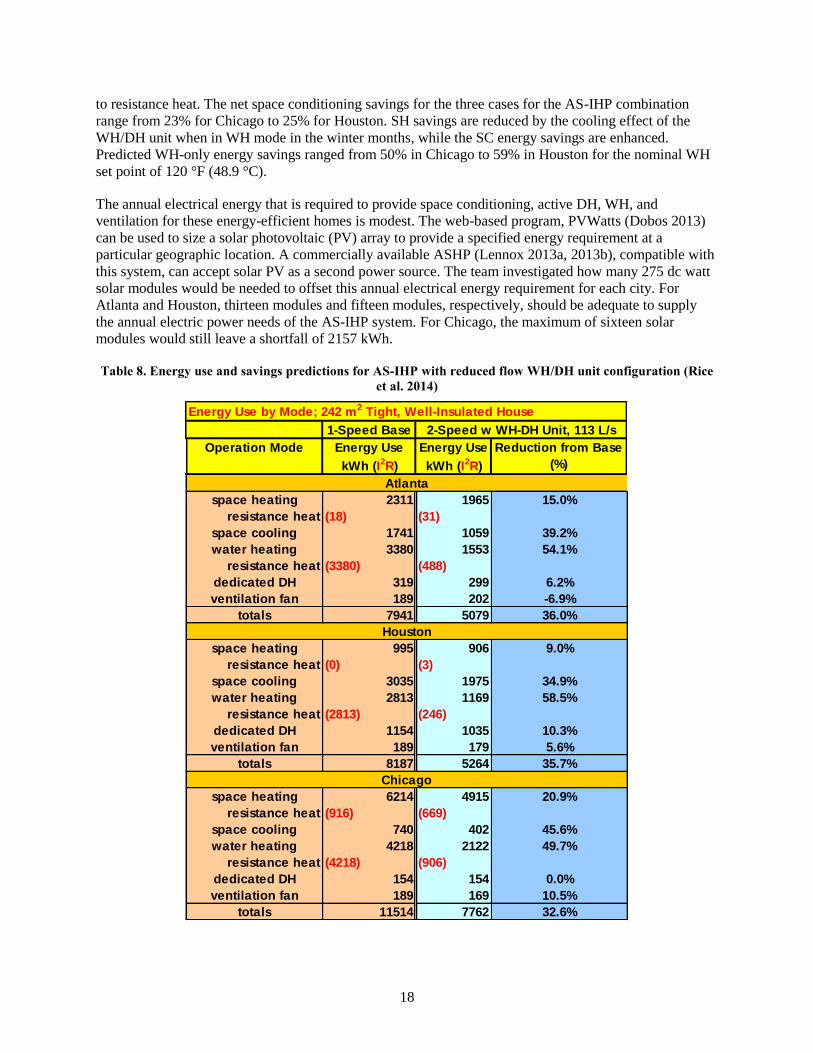
Comparisons of predicted energy use and savings between the baseline suite and the reduced flow case
are shown in Table 8 for each mode and overall. The total predicted HVAC/WH energy savings for the
reduced airflow and operation assumptions range from 33 to 36%, reduced slightly from the preliminary
analyses shown in Table 6. The entries in red show the portion of the total energy use for each mode due
-
10
20
30
40
50
60
- 2 4 6 8 10 12 14 16 18 20 22 24
Wate
r D
raw
(L
)
Hour of Day
Untempered Flow
Tempered Flow @40.6°C
18
to resistance heat. The net space conditioning savings for the three cases for the AS-IHP combination
range from 23% for Chicago to 25% for Houston. SH savings are reduced by the cooling effect of the
WH/DH unit when in WH mode in the winter months, while the SC energy savings are enhanced.
Predicted WH-only energy savings ranged from 50% in Chicago to 59% in Houston for the nominal WH
set point of 120 °F (48.9 °C).
The annual electrical energy that is required to provide space conditioning, active DH, WH, and
ventilation for these energy-efficient homes is modest. The web-based program, PVWatts (Dobos 2013)
can be used to size a solar photovoltaic (PV) array to provide a specified energy requirement at a
particular geographic location. A commercially available ASHP (Lennox 2013a, 2013b), compatible with
this system, can accept solar PV as a second power source. The team investigated how many 275 dc watt
solar modules would be needed to offset this annual electrical energy requirement for each city. For
Atlanta and Houston, thirteen modules and fifteen modules, respectively, should be adequate to supply
the annual electric power needs of the AS-IHP system. For Chicago, the maximum of sixteen solar
modules would still leave a shortfall of 2157 kWh.
Table 8. Energy use and savings predictions for AS-IHP with reduced flow WH/DH unit configuration (Rice
et al. 2014)
Energy Use by Mode; 242 m2 Tight, Well-Insulated House
1-Speed Base
Operation Mode Energy Use
kWh (I2R)
Energy Use
kWh (I2R)
Reduction from Base
(%)
space heating 2311 1965 15.0%
resistance heat (18) (31)
space cooling 1741 1059 39.2%
water heating 3380 1553 54.1%
resistance heat (3380) (488)
dedicated DH 319 299 6.2%
ventilation fan 189 202 -6.9%
totals 7941 5079 36.0%
space heating 995 906 9.0%
resistance heat (0) (3)
space cooling 3035 1975 34.9%
water heating 2813 1169 58.5%
resistance heat (2813) (246)
dedicated DH 1154 1035 10.3%
ventilation fan 189 179 5.6%
totals 8187 5264 35.7%
space heating 6214 4915 20.9%
resistance heat (916) (669)
space cooling 740 402 45.6%
water heating 4218 2122 49.7%
resistance heat (4218) (906)
dedicated DH 154 154 0.0%
ventilation fan 189 169 10.5%
totals 11514 7762 32.6%
2-Speed w WH-DH Unit, 113 L/s
Atlanta
Houston
Chicago
19
Table 9 compares the WH load fraction for the larger home used in the analyses reported in Tables 6 and
8 (2.2-ton SC design load and capacity) with that for the smaller nZEH-ready house used in the concept
analyses (1–1.5-ton SC design load/capacity). The WH load fractions for the larger house are slightly
lower than those for the smaller concept house.
Table 9. WH load fraction for 2600 ft2 house used in Table 6 and nZEH-ready house (Table 2)
Location
WH load fraction
(% of total SC+SH+WH load)
Table 6 house Table 2 house
Atlanta 20 22
Houston 16 18
Chicago 19 21
5. SECOND-GENERATION WH/DH PROTOTYPE AND AS-IHP FIELD-TEST SYSTEM
DEVELOPMENT
WH/DH second-generation prototype development and lab test results
A second-generation WH/DH prototype was built and tested by Lennox in 2014. It used the same
compressor and DH mode condenser as the first unit. A brazed-plate W/R HX replaced the tube-in-tube
design to provide a lighter-weight, more compact, and easily insulated design. New, thicker 3/8 in. (9.5
mm) closed-cell neoprene sheet was used to insulate the W/R HX, and it was located in a position less
exposed to the air stream. The tube-in-tube W/R HX of the first prototype was insulated with 1/8 in. (3.2
mm) neoprene tape. This together with its size and location led to the high heat losses noted above.
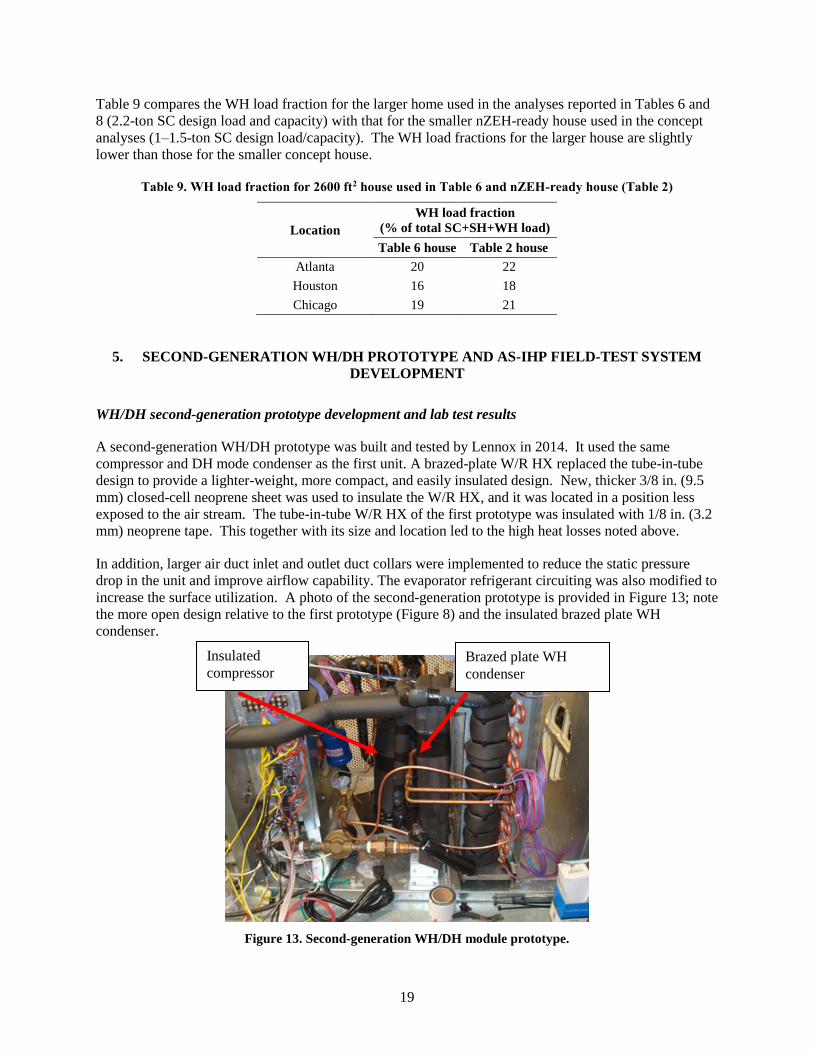
In addition, larger air duct inlet and outlet duct collars were implemented to reduce the static pressure
drop in the unit and improve airflow capability. The evaporator refrigerant circuiting was also modified to
increase the surface utilization. A photo of the second-generation prototype is provided in Figure 13; note
the more open design relative to the first prototype (Figure 8) and the insulated brazed plate WH
condenser.
Figure 13. Second-generation WH/DH module prototype.
Brazed plate WH
condenser
Insulated
compressor
20
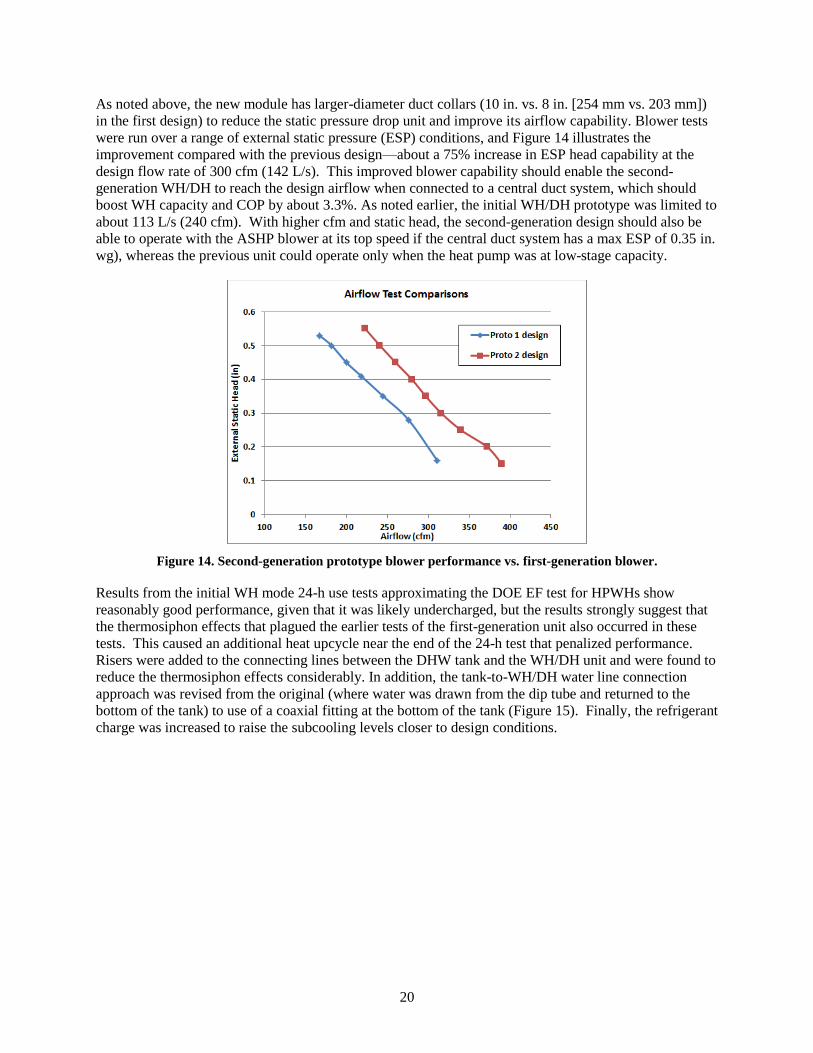
As noted above, the new module has larger-diameter duct collars (10 in. vs. 8 in. [254 mm vs. 203 mm])
in the first design) to reduce the static pressure drop unit and improve its airflow capability. Blower tests
were run over a range of external static pressure (ESP) conditions, and Figure 14 illustrates the
improvement compared with the previous design—about a 75% increase in ESP head capability at the
design flow rate of 300 cfm (142 L/s). This improved blower capability should enable the second-
generation WH/DH to reach the design airflow when connected to a central duct system, which should
boost WH capacity and COP by about 3.3%. As noted earlier, the initial WH/DH prototype was limited to
about 113 L/s (240 cfm). With higher cfm and static head, the second-generation design should also be
able to operate with the ASHP blower at its top speed if the central duct system has a max ESP of 0.35 in.
wg), whereas the previous unit could operate only when the heat pump was at low-stage capacity.
Figure 14. Second-generation prototype blower performance vs. first-generation blower.
Results from the initial WH mode 24-h use tests approximating the DOE EF test for HPWHs show
reasonably good performance, given that it was likely undercharged, but the results strongly suggest that
the thermosiphon effects that plagued the earlier tests of the first-generation unit also occurred in these
tests. This caused an additional heat upcycle near the end of the 24-h test that penalized performance.
Risers were added to the connecting lines between the DHW tank and the WH/DH unit and were found to
reduce the thermosiphon effects considerably. In addition, the tank-to-WH/DH water line connection
approach was revised from the original (where water was drawn from the dip tube and returned to the
bottom of the tank) to use of a coaxial fitting at the bottom of the tank (Figure 15). Finally, the refrigerant
charge was increased to raise the subcooling levels closer to design conditions.

21
Figure 15. Schematic of coaxial tank water fitting.
After these modifications were completed, new ratings tests approximating the DH and WH EF
conditions (within the limitations of the test facility capabilities) were run at Lennox. DH mode tests of
the second-generation prototype have shown about a 7% improved DH EF relative to that for the first
prototype: ~2.2 L/kWh vs. ~2 L/kWh for prototype 1 (exceeding the current Energy Star requirement
(Energy Star 2016)). This appears to be due to the improved evaporator refrigerant flow distribution and
more uniform airflow over the evaporator and condenser from the larger inlet/outlet ducts. WH mode test
results showed an EF of ~2.05, slightly exceeding the WH performance goal for the project. Lennox also
reported that the new coaxial water line connection maintained better tank stratification than with the
original arrangement.
WH/DH and AS-IHP system field test prototype design
After completing lab tests of the second-generation WH/DH, Lennox modified the design to create a
field-test prototype. The field-test design is generally based on the prototype 2 architecture implementing
its operating mode efficiency improvements. A revised, solid-state control system was specified based on
a UNO model solid-state microcontroller manufactured by Arduino, eliminating many of the relays used
in the second-generation lab prototype. Figure 16 presents a photo of the field-test WH/DH unit with side
panels removed to show the control board. Figure 17 provides a CAD drawing of the general layout of
the field-test prototype WH/DH design. A list of its component parts is given in Table 10.
Figure 16. Field-test WH/DH prototype.
Control board,
Arduino UNO
22
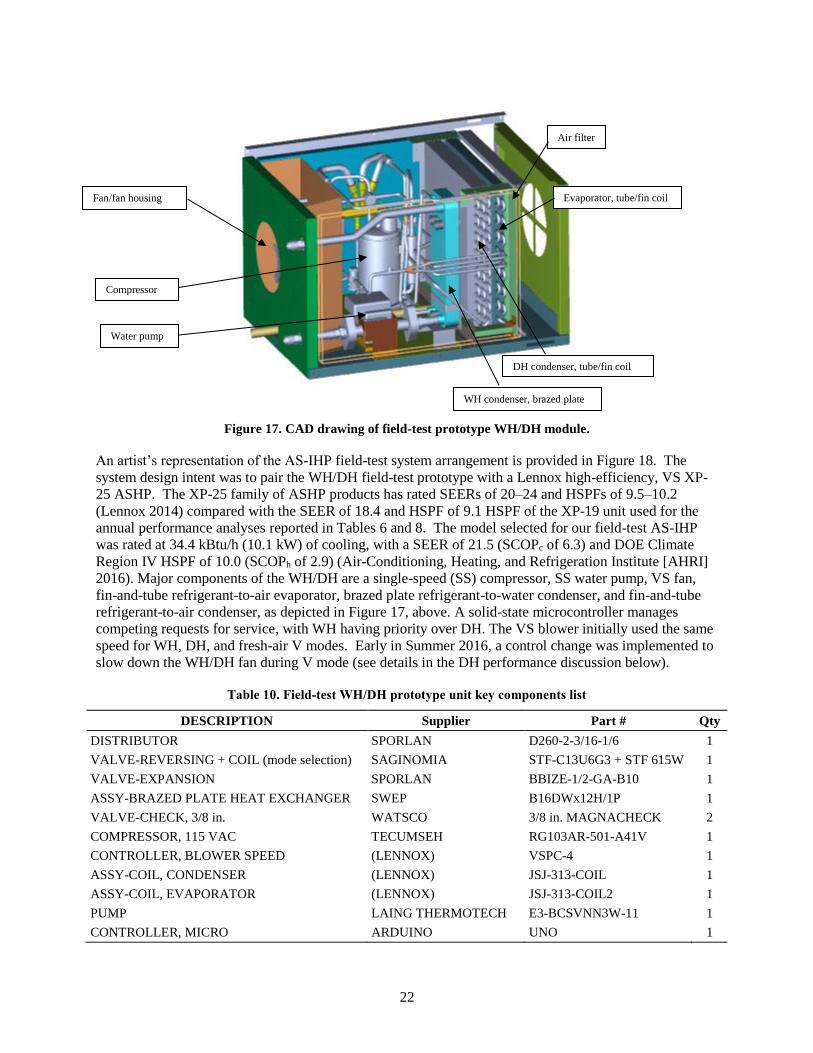
Figure 17. CAD drawing of field-test prototype WH/DH module.
An artist’s representation of the AS-IHP field-test system arrangement is provided in Figure 18. The
system design intent was to pair the WH/DH field-test prototype with a Lennox high-efficiency, VS XP-
25 ASHP. The XP-25 family of ASHP products has rated SEERs of 20–24 and HSPFs of 9.5–10.2
(Lennox 2014) compared with the SEER of 18.4 and HSPF of 9.1 HSPF of the XP-19 unit used for the
annual performance analyses reported in Tables 6 and 8. The model selected for our field-test AS-IHP
was rated at 34.4 kBtu/h (10.1 kW) of cooling, with a SEER of 21.5 (SCOPc of 6.3) and DOE Climate
Region IV HSPF of 10.0 (SCOPh of 2.9) (Air-Conditioning, Heating, and Refrigeration Institute [AHRI]
2016). Major components of the WH/DH are a single-speed (SS) compressor, SS water pump, VS fan,
fin-and-tube refrigerant-to-air evaporator, brazed plate refrigerant-to-water condenser, and fin-and-tube
refrigerant-to-air condenser, as depicted in Figure 17, above. A solid-state microcontroller manages
competing requests for service, with WH having priority over DH. The VS blower initially used the same
speed for WH, DH, and fresh-air V modes. Early in Summer 2016, a control change was implemented to
slow down the WH/DH fan during V mode (see details in the DH performance discussion below).
Table 10. Field-test WH/DH prototype unit key components list
DESCRIPTION Supplier Part # Qty
DISTRIBUTOR SPORLAN D260-2-3/16-1/6 1
VALVE-REVERSING + COIL (mode selection) SAGINOMIA STF-C13U6G3 + STF 615W 1
VALVE-EXPANSION SPORLAN BBIZE-1/2-GA-B10 1
ASSY-BRAZED PLATE HEAT EXCHANGER SWEP B16DWx12H/1P 1
VALVE-CHECK, 3/8 in. WATSCO 3/8 in. MAGNACHECK 2
COMPRESSOR, 115 VAC TECUMSEH RG103AR-501-A41V 1
CONTROLLER, BLOWER SPEED (LENNOX) VSPC-4 1
ASSY-COIL, CONDENSER (LENNOX) JSJ-313-COIL 1
ASSY-COIL, EVAPORATOR (LENNOX) JSJ-313-COIL2 1
PUMP LAING THERMOTECH E3-BCSVNN3W-11 1
CONTROLLER, MICRO ARDUINO UNO 1
Compressor
Water pump
DH condenser, tube/fin coil
WH condenser, brazed plate
Evaporator, tube/fin coil Fan/fan housing
Air filter

23
PAN-DRAIN, (ASSEMBLY) (LENNOX) JSJ-322-XX 1
RELAY (LENNOX) 69J5601 3
TRANSFORMER (LENNOX) TBD 1
ASSY-BLOWER EBM R3G220AD 1
RING, VENTURI EBM TBD 1
AIR FILTER (LENNOX) TBD 1
TERMINAL-STRIP, 5 POSITION, 24VAC (LENNOX) TBD 1
Figure 18. Two-unit AS-IHP field-test system arrangment.
6. FIELD-TEST SYSTEM PERFORMANCE AND ANALYSIS
The XP-25 ASHP and WH/DH prototype were shipped to ORNL in early 2015 and installed in June/July
2015 at a 2400-ft2 test house (Figure 19) in Yarnell Station subdivision, in Knoxville, Tennessee, to
facilitate a one-year field test. A photo of the field-test system is included in Figure 20 with the field data
acquisition system (DAS) shown in Figure 21. Dutch Uselton of Lennox visited the test site on July 7-8,
2015, for startup of the WH/DH module and system commissioning. Full data monitoring of the AS-IHP
system began in August 2015 and continued through September 2016. Monitoring of the WH/DH
module continued through May 2017 to evaluate the impact of some design and control modifications
implemented because of the initial test-year results.
24
Figure 19. Field-test site.
Figure 20. Field-test prototype in installation process. ASHP indoor air handler and WH/DH prototype
shown with rain gauges for condensate collection (to monitor DH and latent cooling loads).

25
Figure 21. Field data acquisition system.
Before the field testing started, work was done to set up the test house occupancy simulation. The water
draw schedule used at the site is based on the latest Building America water draw generator (DOE/BTO
Building America Program, 2013). Latent, sensible, and other building internal loads are based on the
Building America House Simulation Protocols (Hendron and Engebrecht 2010). Occupancy simulation
devices follow a schedule that is input via a database that is read by a programmed controller for
operating space heaters to simulate sensible heat, and humidifiers to simulate latent heat. Hot water loads
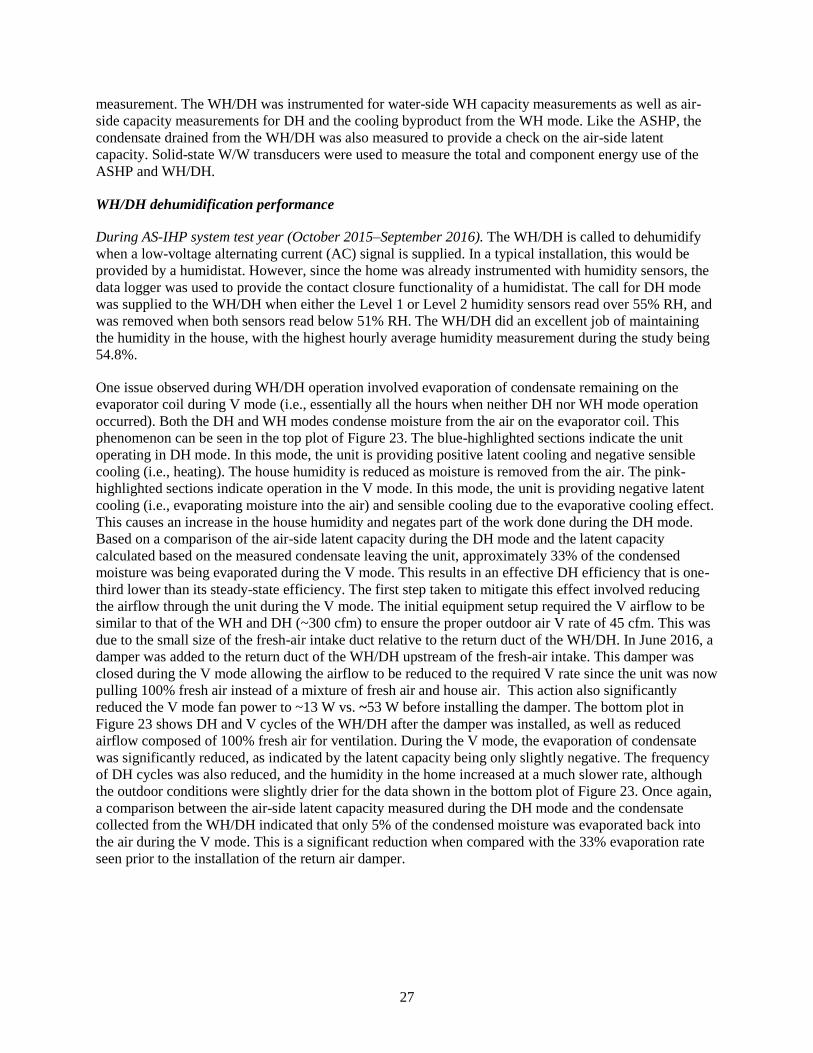
(e.g., dishwasher, clothes washer, showers, sinks) are simulated by operating solenoid- controlled water
valves according to the programmed schedule, with an average hot water use of 56.3 gal/day. Figure 22
shows the hot water valves and controller setup.
The DAS was set up to collect data at 15 s intervals with 1 min, 15 min, 1 h, and daily averages. Data
were stored on servers located at ORNL. A dedicated internet connection was set up that allowed the
Lennox project team to monitor data collection in real time.
26
Figure 22. Hot water use control valves.
WH/DH and AS-IHP system field-test prototype design
Equipment setup. The space conditioning system included zone controls and dampers that allowed the
upstairs and downstairs zone temperatures to be controlled independently. The zoning system also
controlled the ASHP airflow based on fixed airflow values that were assigned to each zone during
commissioning of the system. The thermostat set points were 71.0 °F (21.7 °C) and 76.0 °F (24.4 °C) for
the heating and cooling seasons, respectively. The ASHP operating mode was switched manually between
heating only and cooling only as needed.
The WH/DH was connected to a standard electric storage water heater with copper pipe and a concentric
fitting that was inserted in place of the typical drain at the bottom of the water heater. The power to the
lower thermostat/element was disconnected and rewired to provide a low-voltage signal to the WH/DH
when WH was required.
The return air for the WH/DH was ducted from the return plenum of the heat pump. The supply air was
ducted separately from the WH/DH, with one duct terminating on the upstairs level of the house and the
other terminating on the lower level. The WH/DH supply air can also be ducted into the supply air
plenum of the heat pump if the supply fan of the heat pump is wired to operate at the same time as the
WH/DH fan to prevent recirculation. Controlled fresh-air intake is one difference between the field-test
system and the baseline equipment. A constant 45 cfm (21 L/s) of outdoor air was provided to the house.
Homes with tightly sealed envelopes need mechanical fresh-air ventilation to maintain acceptable indoor
air quality.
Instrumentation. The ASHP was instrumented for air-side heating and cooling capacity measurements as
well as additional measurements of refrigerant-side pressures and temperatures. The condensate drained
from the evaporator coil was also measured to provide a check on the air-side latent capacity
27
measurement. The WH/DH was instrumented for water-side WH capacity measurements as well as air-
side capacity measurements for DH and the cooling byproduct from the WH mode. Like the ASHP, the
condensate drained from the WH/DH was also measured to provide a check on the air-side latent
capacity. Solid-state W/W transducers were used to measure the total and component energy use of the
ASHP and WH/DH.
WH/DH dehumidification performance
During AS-IHP system test year (October 2015–September 2016). The WH/DH is called to dehumidify
when a low-voltage alternating current (AC) signal is supplied. In a typical installation, this would be
provided by a humidistat. However, since the home was already instrumented with humidity sensors, the
data logger was used to provide the contact closure functionality of a humidistat. The call for DH mode
was supplied to the WH/DH when either the Level 1 or Level 2 humidity sensors read over 55% RH, and
was removed when both sensors read below 51% RH. The WH/DH did an excellent job of maintaining
the humidity in the house, with the highest hourly average humidity measurement during the study being
54.8%.
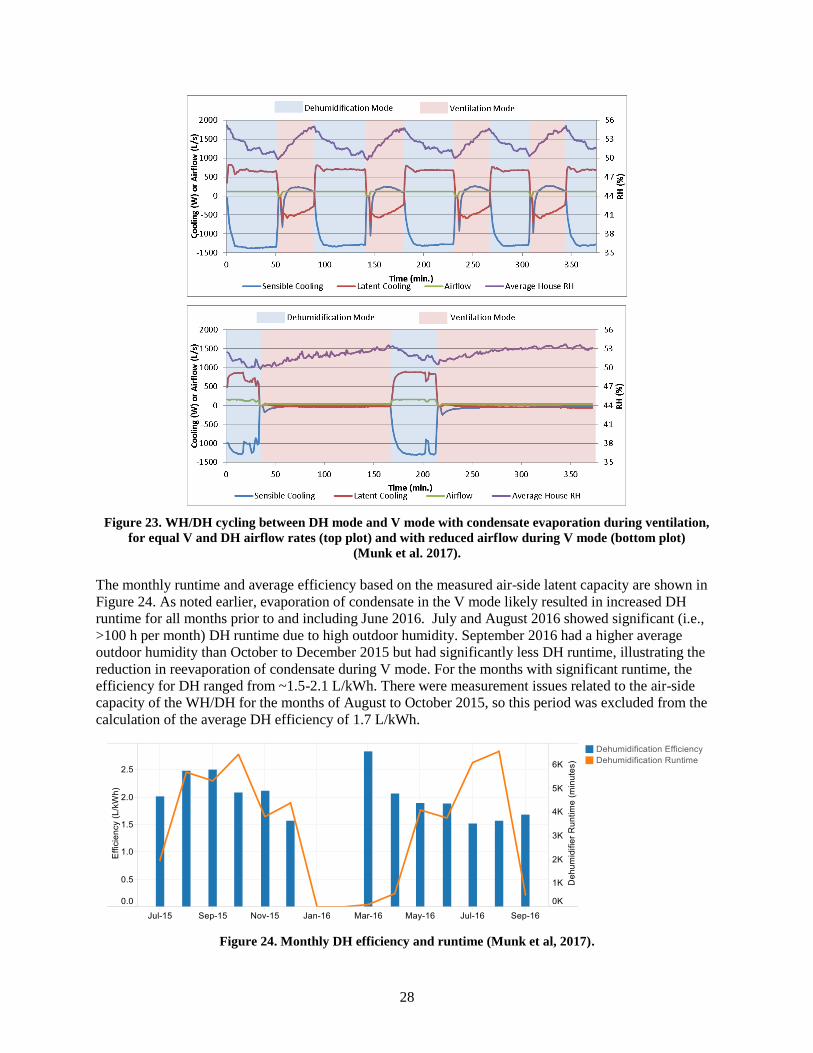
One issue observed during WH/DH operation involved evaporation of condensate remaining on the
evaporator coil during V mode (i.e., essentially all the hours when neither DH nor WH mode operation
occurred). Both the DH and WH modes condense moisture from the air on the evaporator coil. This
phenomenon can be seen in the top plot of Figure 23. The blue-highlighted sections indicate the unit
operating in DH mode. In this mode, the unit is providing positive latent cooling and negative sensible
cooling (i.e., heating). The house humidity is reduced as moisture is removed from the air. The pink-
highlighted sections indicate operation in the V mode. In this mode, the unit is providing negative latent
cooling (i.e., evaporating moisture into the air) and sensible cooling due to the evaporative cooling effect.
This causes an increase in the house humidity and negates part of the work done during the DH mode.
Based on a comparison of the air-side latent capacity during the DH mode and the latent capacity
calculated based on the measured condensate leaving the unit, approximately 33% of the condensed
moisture was being evaporated during the V mode. This results in an effective DH efficiency that is one-
third lower than its steady-state efficiency. The first step taken to mitigate this effect involved reducing
the airflow through the unit during the V mode. The initial equipment setup required the V airflow to be
similar to that of the WH and DH (~300 cfm) to ensure the proper outdoor air V rate of 45 cfm. This was
due to the small size of the fresh-air intake duct relative to the return duct of the WH/DH. In June 2016, a
damper was added to the return duct of the WH/DH upstream of the fresh-air intake. This damper was
closed during the V mode allowing the airflow to be reduced to the required V rate since the unit was now
pulling 100% fresh air instead of a mixture of fresh air and house air. This action also significantly
reduced the V mode fan power to ~13 W vs. ~53 W before installing the damper. The bottom plot in
Figure 23 shows DH and V cycles of the WH/DH after the damper was installed, as well as reduced
airflow composed of 100% fresh air for ventilation. During the V mode, the evaporation of condensate
was significantly reduced, as indicated by the latent capacity being only slightly negative. The frequency
of DH cycles was also reduced, and the humidity in the home increased at a much slower rate, although
the outdoor conditions were slightly drier for the data shown in the bottom plot of Figure 23. Once again,
a comparison between the air-side latent capacity measured during the DH mode and the condensate
collected from the WH/DH indicated that only 5% of the condensed moisture was evaporated back into
the air during the V mode. This is a significant reduction when compared with the 33% evaporation rate
seen prior to the installation of the return air damper.
28
Figure 23. WH/DH cycling between DH mode and V mode with condensate evaporation during ventilation,
for equal V and DH airflow rates (top plot) and with reduced airflow during V mode (bottom plot)
(Munk et al. 2017).
The monthly runtime and average efficiency based on the measured air-side latent capacity are shown in
Figure 24. As noted earlier, evaporation of condensate in the V mode likely resulted in increased DH
runtime for all months prior to and including June 2016. July and August 2016 showed significant (i.e.,
>100 h per month) DH runtime due to high outdoor humidity. September 2016 had a higher average
outdoor humidity than October to December 2015 but had significantly less DH runtime, illustrating the
reduction in reevaporation of condensate during V mode. For the months with significant runtime, the
efficiency for DH ranged from ~1.5-2.1 L/kWh. There were measurement issues related to the air-side
capacity of the WH/DH for the months of August to October 2015, so this period was excluded from the
calculation of the average DH efficiency of 1.7 L/kWh.
Figure 24. Monthly DH efficiency and runtime (Munk et al, 2017).

29
Further field tests to evaluate impact of WH/DH system and control design modifications. After the
AS-IHP system field test was concluded, Lennox developed a design for an adjustable damper to block
part of the WH/DH evaporator during the V mode operation. The intent was to further reduce the amount
of condensate reevaporation during the V mode. This was implemented in late March 2017, and the
modified WH/DH was tested with and without the damper for a few humid days in April 2017 to evaluate
the impact of the design change. Test results showed no significant change in condensate reevaporation
during V mode compared with reduced V mode airflow (Figure 23, bottom plot). While a significant
portion of the evaporator was blocked by the damper, the exposed area had much- higher-velocity air
travelling over it to maintain the same fresh-air ventilation rate. This higher velocity air results in locally
increased evaporation rates and may explain why no significant change was seen in the overall
condensate reevaporation rate. At this point the project had to be concluded to make way for other uses
of the field-test site. The prototype WH/DH was shipped back to Lennox in May 2017.
WH/DH water heating performance
As noted earlier the hot water draw schedule varied from day to day based on realistic probability
distributions of hot water draws. Figure 25 presents a histogram of the daily hot water use for the period
of October 2015 to September 2016. The average daily hot water draw for this period was 55.2 gal/day
(209 L/day), slightly below the target of 58.1 gal/day (220 L/day). This difference resulted from an issue
with the hot water draw system that occurred in January 2016, resulting in 20 days of no hot water use.
Figure 25. Histogram of daily hot water use at the research house (Munk et al. 2017).
The efficiency of a heat pump is impacted by the temperature of the heat source and the temperature of
the heat sink. For the case of WH, the heat source is the air entering the WH/DH unit, and the heat sink is
the entering water. Figure 26 shows a color map, based on 1 min resolution data, of the WH mode COP
for various entering air and entering water temperatures experienced during field testing. As expected, the
COP of the system increases with an increase in entering air temperature (i.e., heat source) and decreases
with an increase in entering water temperature (i.e., heat sink), as seen by the color trend of red to blue
from the lower right of the map to the upper left. The percentages located within each cell indicate the
percentage of the total WH runtime at the given conditions. Most of the operating time occurs at higher
entering water temperatures—95°F (35°C) and up—indicating that the bottom of the tank stayed
relatively warm most of the time. During heavy hot water use, the lower portion of the tank can become
saturated with cold water, resulting in entering water temperatures near the temperature of the cold water
supply.
The WH/DH was set up to pull a mixture of house air and fresh air for V during WH operation. This
approach maintains continuous V in the home and provides warmer, more humid return air during
summer months. However, when it is cool or cold outside, the fresh air reduces the efficiency of the WH
mode. During extremely cold weather, it is also possible for the evaporator to freeze. This occurred early
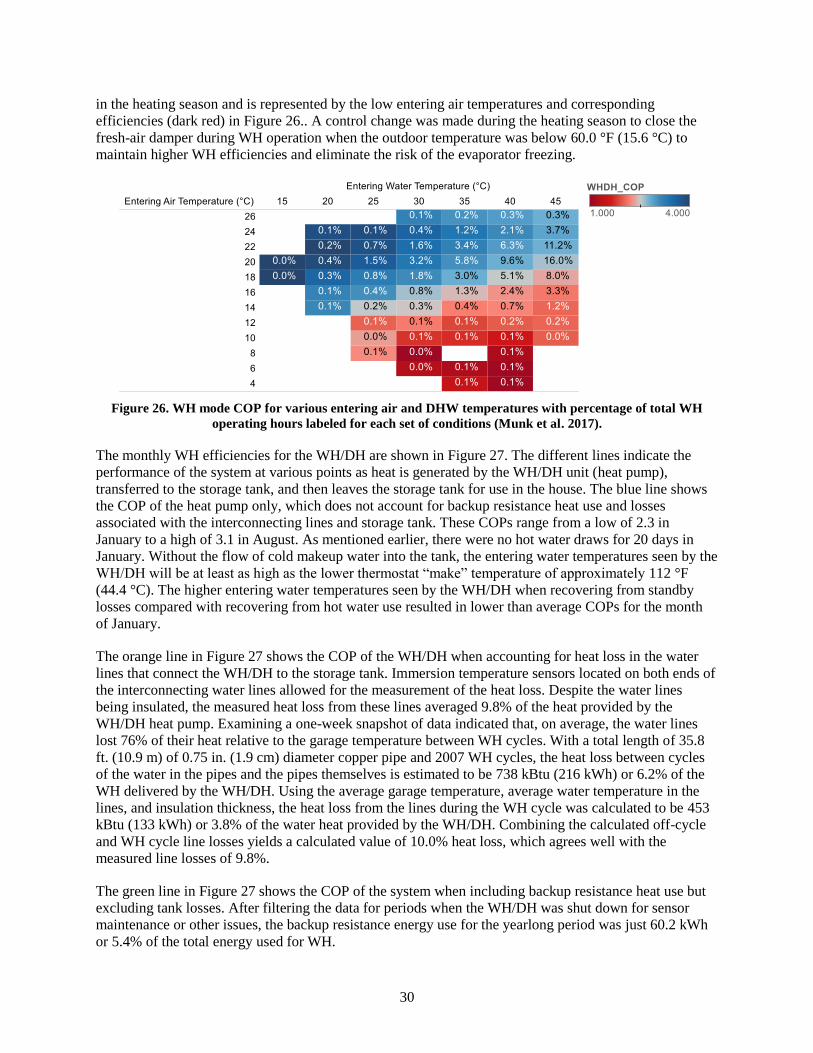
30
in the heating season and is represented by the low entering air temperatures and corresponding
efficiencies (dark red) in Figure 26.. A control change was made during the heating season to close the
fresh-air damper during WH operation when the outdoor temperature was below 60.0 °F (15.6 °C) to
maintain higher WH efficiencies and eliminate the risk of the evaporator freezing.
Figure 26. WH mode COP for various entering air and DHW temperatures with percentage of total WH
operating hours labeled for each set of conditions (Munk et al. 2017).
The monthly WH efficiencies for the WH/DH are shown in Figure 27. The different lines indicate the
performance of the system at various points as heat is generated by the WH/DH unit (heat pump),
transferred to the storage tank, and then leaves the storage tank for use in the house. The blue line shows
the COP of the heat pump only, which does not account for backup resistance heat use and losses
associated with the interconnecting lines and storage tank. These COPs range from a low of 2.3 in
January to a high of 3.1 in August. As mentioned earlier, there were no hot water draws for 20 days in
January. Without the flow of cold makeup water into the tank, the entering water temperatures seen by the
WH/DH will be at least as high as the lower thermostat “make” temperature of approximately 112 °F
(44.4 °C). The higher entering water temperatures seen by the WH/DH when recovering from standby
losses compared with recovering from hot water use resulted in lower than average COPs for the month
of January.
The orange line in Figure 27 shows the COP of the WH/DH when accounting for heat loss in the water
lines that connect the WH/DH to the storage tank. Immersion temperature sensors located on both ends of
the interconnecting water lines allowed for the measurement of the heat loss. Despite the water lines
being insulated, the measured heat loss from these lines averaged 9.8% of the heat provided by the
WH/DH heat pump. Examining a one-week snapshot of data indicated that, on average, the water lines
lost 76% of their heat relative to the garage temperature between WH cycles. With a total length of 35.8
ft. (10.9 m) of 0.75 in. (1.9 cm) diameter copper pipe and 2007 WH cycles, the heat loss between cycles
of the water in the pipes and the pipes themselves is estimated to be 738 kBtu (216 kWh) or 6.2% of the
WH delivered by the WH/DH. Using the average garage temperature, average water temperature in the
lines, and insulation thickness, the heat loss from the lines during the WH cycle was calculated to be 453
kBtu (133 kWh) or 3.8% of the water heat provided by the WH/DH. Combining the calculated off-cycle
and WH cycle line losses yields a calculated value of 10.0% heat loss, which agrees well with the
measured line losses of 9.8%.
The green line in Figure 27 shows the COP of the system when including backup resistance heat use but
excluding tank losses. After filtering the data for periods when the WH/DH was shut down for sensor
maintenance or other issues, the backup resistance energy use for the yearlong period was just 60.2 kWh
or 5.4% of the total energy used for WH.
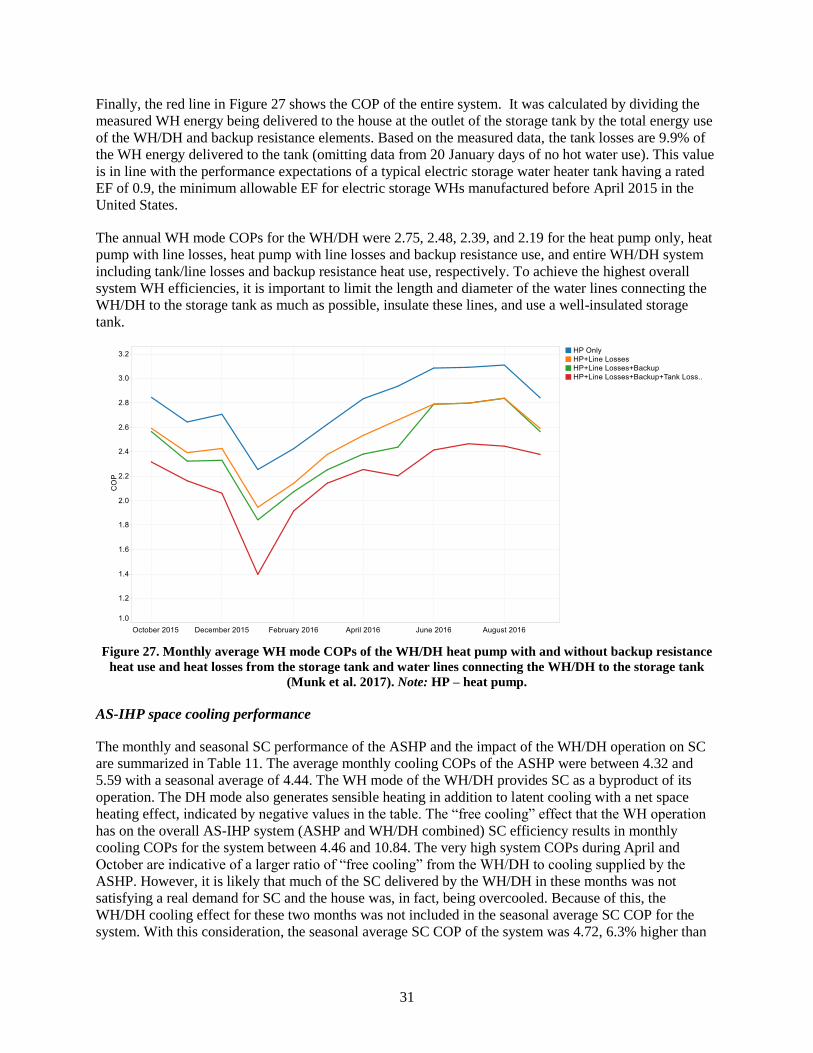
31
Finally, the red line in Figure 27 shows the COP of the entire system. It was calculated by dividing the
measured WH energy being delivered to the house at the outlet of the storage tank by the total energy use
of the WH/DH and backup resistance elements. Based on the measured data, the tank losses are 9.9% of
the WH energy delivered to the tank (omitting data from 20 January days of no hot water use). This value
is in line with the performance expectations of a typical electric storage water heater tank having a rated
EF of 0.9, the minimum allowable EF for electric storage WHs manufactured before April 2015 in the
United States.
The annual WH mode COPs for the WH/DH were 2.75, 2.48, 2.39, and 2.19 for the heat pump only, heat
pump with line losses, heat pump with line losses and backup resistance use, and entire WH/DH system
including tank/line losses and backup resistance heat use, respectively. To achieve the highest overall
system WH efficiencies, it is important to limit the length and diameter of the water lines connecting the
WH/DH to the storage tank as much as possible, insulate these lines, and use a well-insulated storage
tank.
Figure 27. Monthly average WH mode COPs of the WH/DH heat pump with and without backup resistance
heat use and heat losses from the storage tank and water lines connecting the WH/DH to the storage tank
(Munk et al. 2017). Note: HP – heat pump.
AS-IHP space cooling performance
The monthly and seasonal SC performance of the ASHP and the impact of the WH/DH operation on SC
are summarized in Table 11. The average monthly cooling COPs of the ASHP were between 4.32 and
5.59 with a seasonal average of 4.44. The WH mode of the WH/DH provides SC as a byproduct of its
operation. The DH mode also generates sensible heating in addition to latent cooling with a net space
heating effect, indicated by negative values in the table. The “free cooling” effect that the WH operation
has on the overall AS-IHP system (ASHP and WH/DH combined) SC efficiency results in monthly
cooling COPs for the system between 4.46 and 10.84. The very high system COPs during April and
October are indicative of a larger ratio of “free cooling” from the WH/DH to cooling supplied by the
ASHP. However, it is likely that much of the SC delivered by the WH/DH in these months was not
satisfying a real demand for SC and the house was, in fact, being overcooled. Because of this, the
WH/DH cooling effect for these two months was not included in the seasonal average SC COP for the
system. With this consideration, the seasonal average SC COP of the system was 4.72, 6.3% higher than
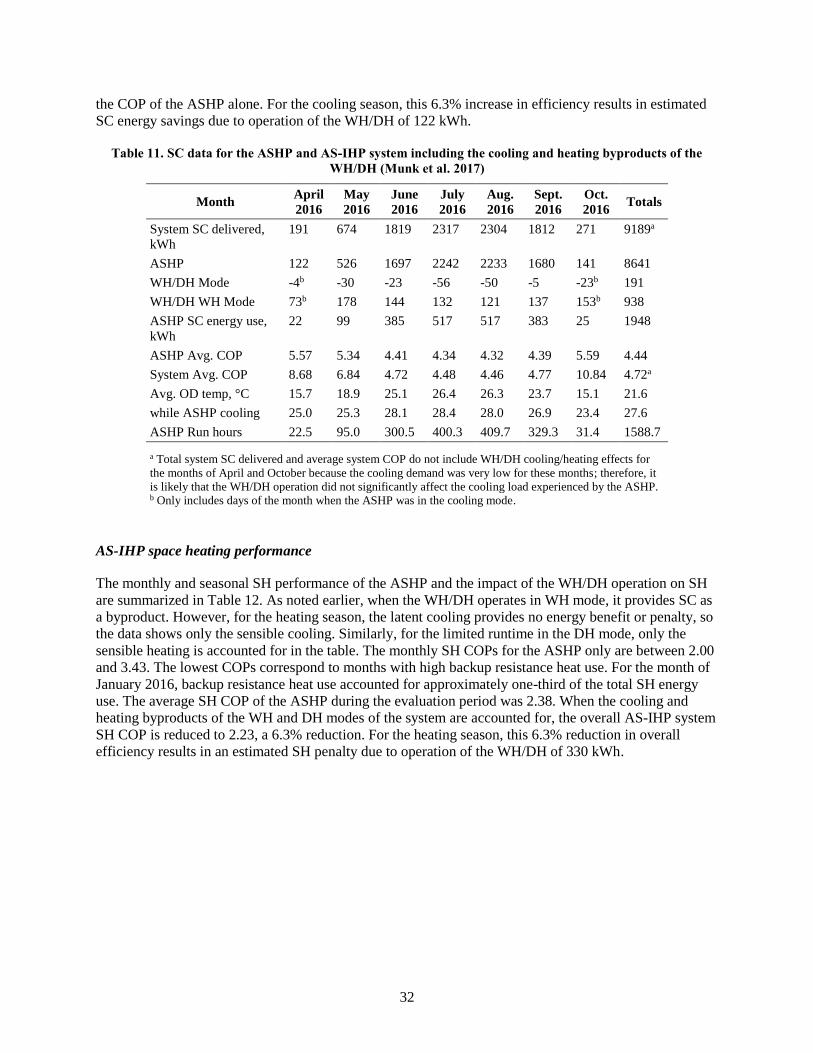
32
the COP of the ASHP alone. For the cooling season, this 6.3% increase in efficiency results in estimated
SC energy savings due to operation of the WH/DH of 122 kWh.
Table 11. SC data for the ASHP and AS-IHP system including the cooling and heating byproducts of the
WH/DH (Munk et al. 2017)
Month April
2016
May
2016
June
2016
July
2016
Aug.
2016
Sept.
2016
Oct.
2016 Totals
System SC delivered,
kWh
191 674 1819 2317 2304 1812 271 9189a
ASHP 122 526 1697 2242 2233 1680 141 8641
WH/DH Mode -4b -30 -23 -56 -50 -5 -23b 191
WH/DH WH Mode 73b 178 144 132 121 137 153b 938
ASHP SC energy use,
kWh
22 99 385 517 517 383 25 1948
ASHP Avg. COP 5.57 5.34 4.41 4.34 4.32 4.39 5.59 4.44
System Avg. COP 8.68 6.84 4.72 4.48 4.46 4.77 10.84 4.72a
Avg. OD temp, °C 15.7 18.9 25.1 26.4 26.3 23.7 15.1 21.6
while ASHP cooling 25.0 25.3 28.1 28.4 28.0 26.9 23.4 27.6
ASHP Run hours 22.5 95.0 300.5 400.3 409.7 329.3 31.4 1588.7
a Total system SC delivered and average system COP do not include WH/DH cooling/heating effects for
the months of April and October because the cooling demand was very low for these months; therefore, it
is likely that the WH/DH operation did not significantly affect the cooling load experienced by the ASHP. b Only includes days of the month when the ASHP was in the cooling mode.
AS-IHP space heating performance
The monthly and seasonal SH performance of the ASHP and the impact of the WH/DH operation on SH
are summarized in Table 12. As noted earlier, when the WH/DH operates in WH mode, it provides SC as
a byproduct. However, for the heating season, the latent cooling provides no energy benefit or penalty, so
the data shows only the sensible cooling. Similarly, for the limited runtime in the DH mode, only the
sensible heating is accounted for in the table. The monthly SH COPs for the ASHP only are between 2.00
and 3.43. The lowest COPs correspond to months with high backup resistance heat use. For the month of
January 2016, backup resistance heat use accounted for approximately one-third of the total SH energy
use. The average SH COP of the ASHP during the evaluation period was 2.38. When the cooling and
heating byproducts of the WH and DH modes of the system are accounted for, the overall AS-IHP system
SH COP is reduced to 2.23, a 6.3% reduction. For the heating season, this 6.3% reduction in overall
efficiency results in an estimated SH penalty due to operation of the WH/DH of 330 kWh.

33
Table 12. SH data for the ASHP and AS-IHP system including the cooling and heating byproducts of the
WH/DH (Munk et al. 2017)
Month Oct.
2015
Nov.
2015
Dec.
2015
Jan.
2016
Feb.
2016
March
2016
April
2016 Totals
Total Sensible Heating
delivered, kWh
172 1344 1687 4029 2723 1192 384 11,651a
ASHP 171 1431 1764 4158 2974 1408 505 12,411
WH/DH Mode 43b 77 77 0 0 1 1b 199
WH/DH WH Mode -42b -164 -154 -129 -251 -216 -122b -1078
Space Heating energy
use, kWh
Total 50 502 677 2076 1289 478 153 5225
backup 0 0 120 684 299 32 1 1136
defrost 0 0 19 54 24 8 0 105
Avg. ASHP COP 3.43 2.85 2.61 2.00 2.31 2.94 3.29 2.38
Avg. System COP 3.44 2.68 2.49 1.94 2.11 2.49 2.51 2.23a
Avg. OD Temp, °C 15.1 11.5 10.6 1.5 5.4 12.5 15.7 10.3
While ASHP heating 10.2 5.9 5.3 0.2 2.1 5.8 7.6 3.3
Run hours 27.0 260.2 289.2 592.0 449.0 241.3 87.9 1946.6
Defrost hours 0.0 0.0 4.0 10.7 5.1 2.1 0.2 22.1
a Total system SH delivered and average system COP do not include WH/DH cooling/heating effects for
the months of April and October because the heating demand was very low for these months; therefore, it
is likely that the WH/DH operation did not significantly affect the heating load experienced by the ASHP. b Only includes days of the month when the ASHP was in the heating mode.
Both the SC and SH average measured seasonal efficiencies (COP or EER in Btu/Wh) for the ASHP unit
deviated significantly from AHRI 210/240 (AHRI 2008) rated values, as seen in Table 13. The AHRI
estimates were computed using both the minimum and maximum house load line or design heating
requirement (DHRmin and DHRmax) assumptions and for the actual measured test house load lines for
the 2015–2016 field-test period (Figure 28). In Figure 29, these heating and cooling loads are shown
compared with the AHRI 210/240 heating and cooling load lines based on the rated heating capacity
Q(47) at 47 °F (8.3 °C) ambient and the rated cooling capacity Q(95) at 95 °F (35 °C).
Table 13. Site-measured seasonal SH and SC COPs vs. estimated AHRI 210/240 ratings for ASHP unit used
in AS-IHP system
Mode Site-measured COP
(EER in Btu/Wh)
AHRI 210/240 ratings
(Btu/Wh)
% deviation,
field vs. rated
SH 2.38 (8.12) Region IV HSPF:
For DHRmin load—10.00a
For DHRmax load—7.59
For house loads—7.98
−18.8
+7.0
+1.8
SC 4.44 (15.15) SEER:
For default load and Cd—21.501
For house loads—23.55
−29.5
−35.7
aFrom AHRI (2016)
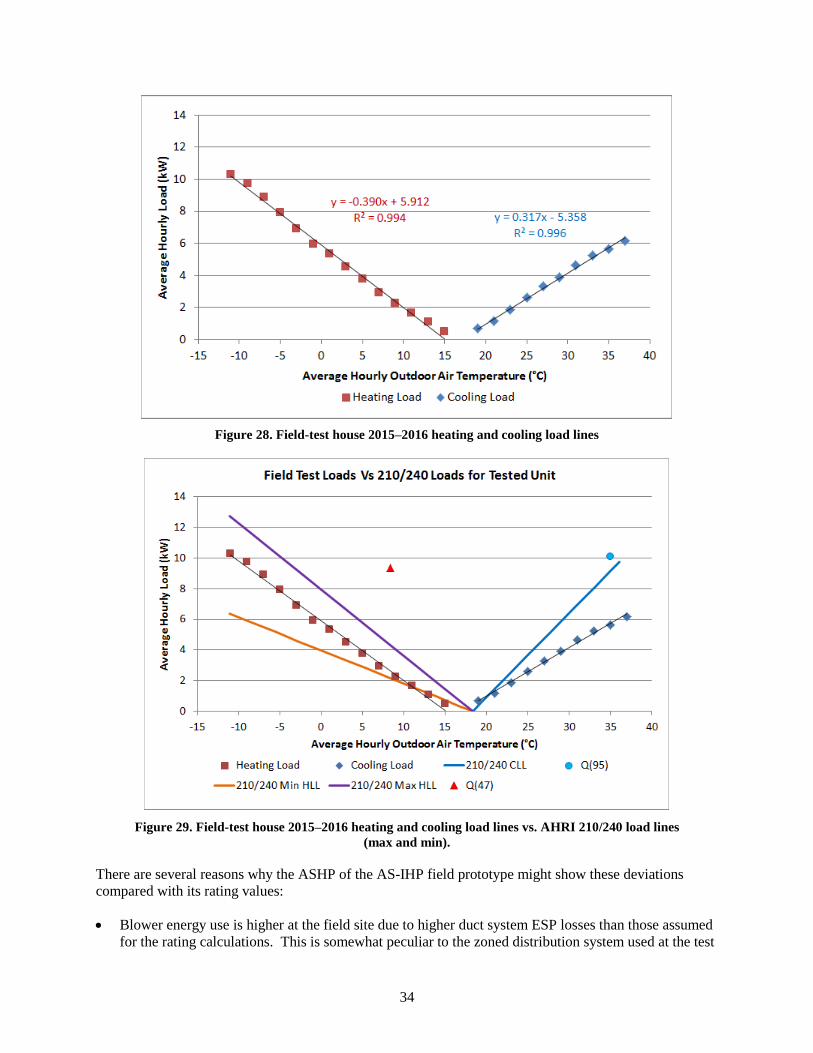
34
Figure 28. Field-test house 2015–2016 heating and cooling load lines
Figure 29. Field-test house 2015–2016 heating and cooling load lines vs. AHRI 210/240 load lines
(max and min).
There are several reasons why the ASHP of the AS-IHP field prototype might show these deviations
compared with its rating values:
• Blower energy use is higher at the field site due to higher duct system ESP losses than those assumed
for the rating calculations. This is somewhat peculiar to the zoned distribution system used at the test

35
house and to other changes made in the ducting system to accommodate the AS-IHP. In general,
however, residential duct systems have higher ESPs than that implicitly assumed in AHRI 210/240
(0.15 in. water gauge).
• The two-zone duct system in the test house caused the ASHP to operate at higher speeds than the
space loads would warrant during times when both zones simultaneously called for SC or SH (Munk
et al. 2017). This reduced the energy savings that could have accrued from lower speed operation
during mild weather periods in both SH and SC seasons. (The effect was greater in the SC season.)
Additionally, the data indicates that the compressor speed was allowed to vary even though the
supply airflow was dictated by the zone(s) calling for conditioning. This results in the system running
at suboptimal combinations of compressor speed and airflow, also reducing efficiency. See further
discussion on this point in the next section.
• The HSPF procedure does not account for defrost tempering heat usage. This accounted for ~2% of
the total field system SH energy use during the test year.
• The indoor temperature during the heating season averaged 71.4 °F while the HSPF calculation
procedure assumes 70 °F.
• The indoor DB temperature during the cooling season averaged 76.0 °F while the SEER procedure
assumes 80 °F. Additionally, the SEER procedure uses a 67 °F wet bulb temperature while the house
condition was maintained at less than 64.5 °F wet bulb.
• The standard minimum house load line used in the HSPF procedure has a lower slope than that
experienced at the test house this winter (see Figure 29). This results in a lower design heating load
than that experienced by the test house. This is a primary reason that ~22% of the total SH seasonal
energy use for the field-test system was from backup resistance heat (Table 13), even though the
2015–2016 SH heating season in Knoxville was warmer than average, having ~18% fewer heating
degree-days based on the local airport weather station (Table 14). Note that in the TRNSYS
simulations (Tables 6 and 8), resistance heating use was ~14% of the total in Chicago and <2% in
Atlanta and Houston. With a significant amount of resistance heat usage (cf. the Chicago case in
Tables 6 and 8), the potential annual energy savings for an AS-IHP drops significantly.
• The test year cooling season in Knoxville was significantly warmer than average, having ~39% more
cooling degree days as measured at the local airport weather station (Table 14). This resulted in many
more hours of high-speed operation during SC than normally expected, adding to the impacts from
the zoned duct system noted above.
Table 14 compares average heating and cooling degree days for Knoxville to those experienced during
the 2011–2012 and 2015–2016 test years. The table provides the average degree days for the three
simulation locations as well for comparison.
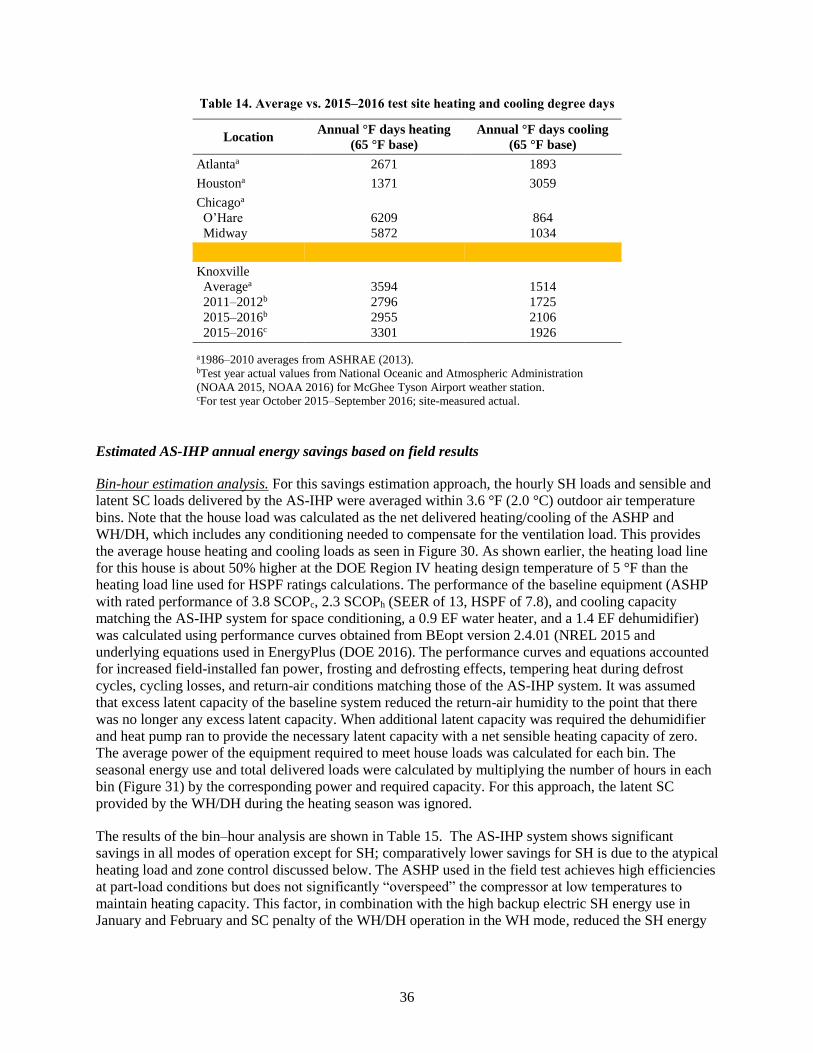
36
Table 14. Average vs. 2015–2016 test site heating and cooling degree days
Location Annual °F days heating
(65 °F base)
Annual °F days cooling
(65 °F base)
Atlantaa 2671 1893
Houstona 1371 3059
Chicagoa
O’Hare
Midway
6209
5872
864
1034
Knoxville
Averagea
2011–2012b
2015–2016b
2015–2016c
3594
2796
2955
3301
1514
1725
2106
1926
a1986–2010 averages from ASHRAE (2013). bTest year actual values from National Oceanic and Atmospheric Administration
(NOAA 2015, NOAA 2016) for McGhee Tyson Airport weather station. cFor test year October 2015–September 2016; site-measured actual.
Estimated AS-IHP annual energy savings based on field results
Bin-hour estimation analysis. For this savings estimation approach, the hourly SH loads and sensible and
latent SC loads delivered by the AS-IHP were averaged within 3.6 °F (2.0 °C) outdoor air temperature
bins. Note that the house load was calculated as the net delivered heating/cooling of the ASHP and
WH/DH, which includes any conditioning needed to compensate for the ventilation load. This provides
the average house heating and cooling loads as seen in Figure 30. As shown earlier, the heating load line
for this house is about 50% higher at the DOE Region IV heating design temperature of 5 °F than the
heating load line used for HSPF ratings calculations. The performance of the baseline equipment (ASHP
with rated performance of 3.8 SCOPc, 2.3 SCOPh (SEER of 13, HSPF of 7.8), and cooling capacity
matching the AS-IHP system for space conditioning, a 0.9 EF water heater, and a 1.4 EF dehumidifier)
was calculated using performance curves obtained from BEopt version 2.4.01 (NREL 2015 and
underlying equations used in EnergyPlus (DOE 2016). The performance curves and equations accounted
for increased field-installed fan power, frosting and defrosting effects, tempering heat during defrost
cycles, cycling losses, and return-air conditions matching those of the AS-IHP system. It was assumed
that excess latent capacity of the baseline system reduced the return-air humidity to the point that there
was no longer any excess latent capacity. When additional latent capacity was required the dehumidifier
and heat pump ran to provide the necessary latent capacity with a net sensible heating capacity of zero.
The average power of the equipment required to meet house loads was calculated for each bin. The
seasonal energy use and total delivered loads were calculated by multiplying the number of hours in each
bin (Figure 31) by the corresponding power and required capacity. For this approach, the latent SC
provided by the WH/DH during the heating season was ignored.
The results of the bin–hour analysis are shown in Table 15. The AS-IHP system shows significant
savings in all modes of operation except for SH; comparatively lower savings for SH is due to the atypical
heating load and zone control discussed below. The ASHP used in the field test achieves high efficiencies
at part-load conditions but does not significantly “overspeed” the compressor at low temperatures to
maintain heating capacity. This factor, in combination with the high backup electric SH energy use in
January and February and SC penalty of the WH/DH operation in the WH mode, reduced the SH energy
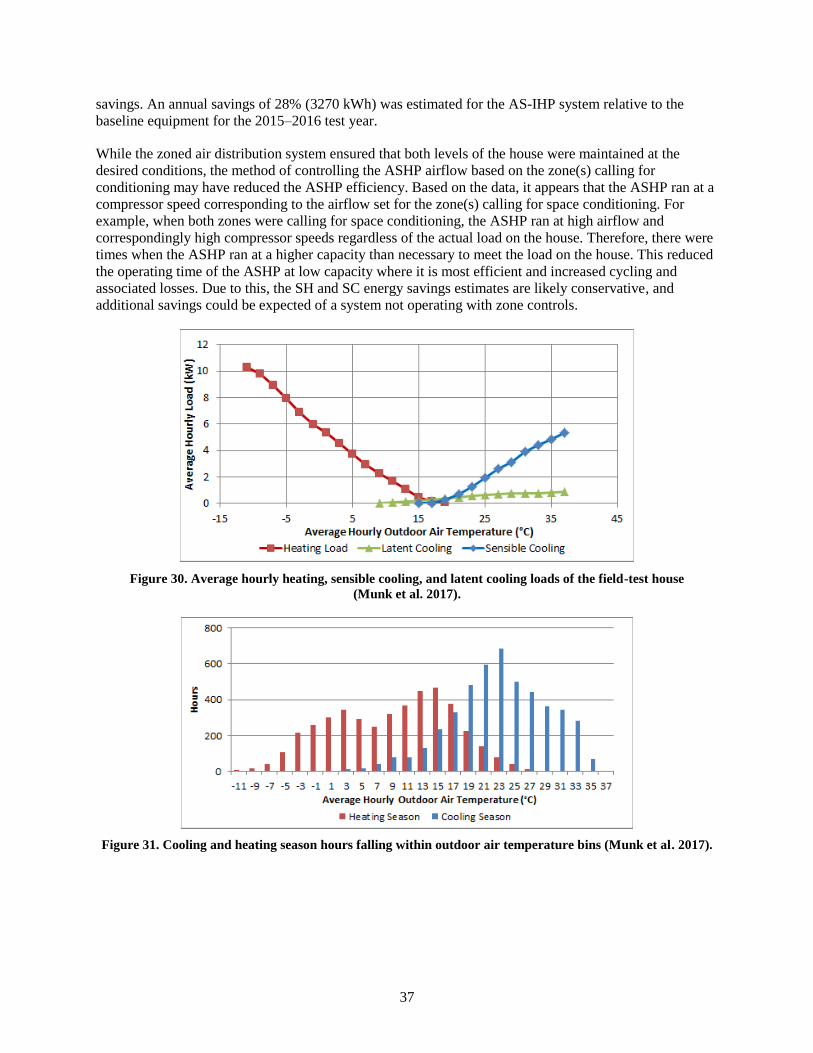
37
savings. An annual savings of 28% (3270 kWh) was estimated for the AS-IHP system relative to the
baseline equipment for the 2015–2016 test year.
While the zoned air distribution system ensured that both levels of the house were maintained at the
desired conditions, the method of controlling the ASHP airflow based on the zone(s) calling for
conditioning may have reduced the ASHP efficiency. Based on the data, it appears that the ASHP ran at a
compressor speed corresponding to the airflow set for the zone(s) calling for space conditioning. For
example, when both zones were calling for space conditioning, the ASHP ran at high airflow and
correspondingly high compressor speeds regardless of the actual load on the house. Therefore, there were
times when the ASHP ran at a higher capacity than necessary to meet the load on the house. This reduced
the operating time of the ASHP at low capacity where it is most efficient and increased cycling and
associated losses. Due to this, the SH and SC energy savings estimates are likely conservative, and
additional savings could be expected of a system not operating with zone controls.
Figure 30. Average hourly heating, sensible cooling, and latent cooling loads of the field-test house
(Munk et al. 2017).
Figure 31. Cooling and heating season hours falling within outdoor air temperature bins (Munk et al. 2017).
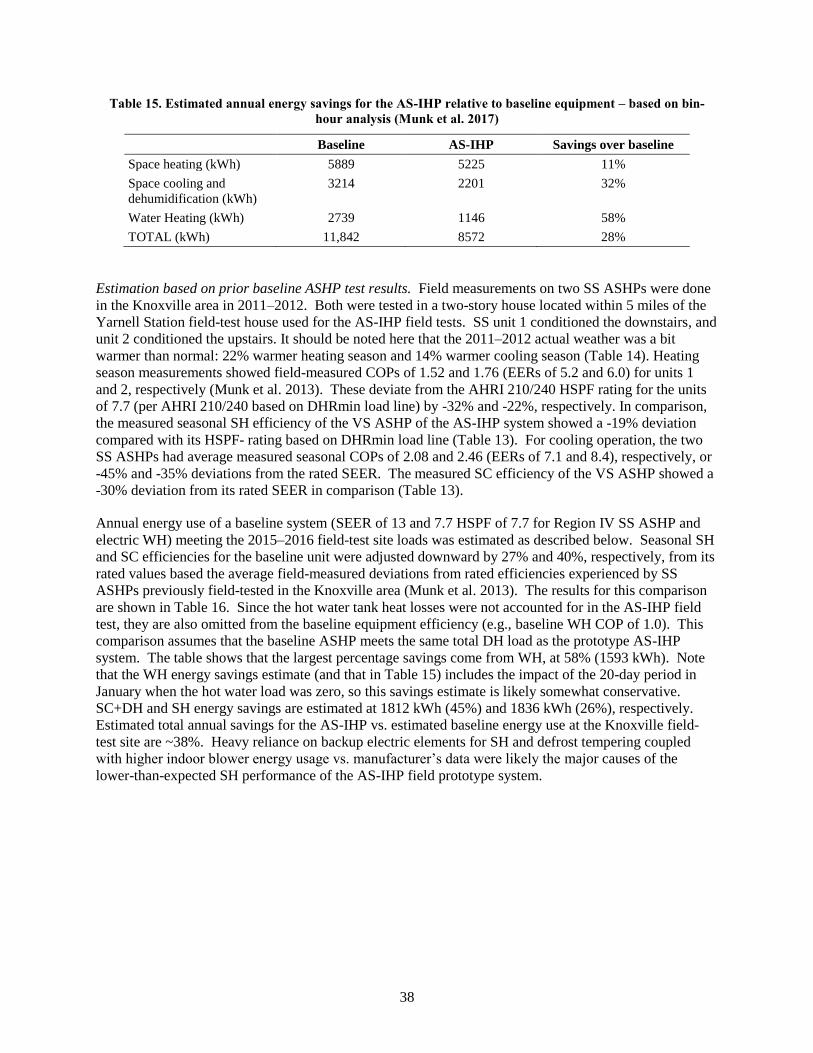
38
Table 15. Estimated annual energy savings for the AS-IHP relative to baseline equipment – based on bin-
hour analysis (Munk et al. 2017)
Baseline AS-IHP Savings over baseline
Space heating (kWh) 5889 5225 11%
Space cooling and
dehumidification (kWh)
3214 2201 32%
Water Heating (kWh) 2739 1146 58%
TOTAL (kWh) 11,842 8572 28%
Estimation based on prior baseline ASHP test results. Field measurements on two SS ASHPs were done
in the Knoxville area in 2011–2012. Both were tested in a two-story house located within 5 miles of the
Yarnell Station field-test house used for the AS-IHP field tests. SS unit 1 conditioned the downstairs, and
unit 2 conditioned the upstairs. It should be noted here that the 2011–2012 actual weather was a bit
warmer than normal: 22% warmer heating season and 14% warmer cooling season (Table 14). Heating
season measurements showed field-measured COPs of 1.52 and 1.76 (EERs of 5.2 and 6.0) for units 1
and 2, respectively (Munk et al. 2013). These deviate from the AHRI 210/240 HSPF rating for the units
of 7.7 (per AHRI 210/240 based on DHRmin load line) by -32% and -22%, respectively. In comparison,
the measured seasonal SH efficiency of the VS ASHP of the AS-IHP system showed a -19% deviation
compared with its HSPF- rating based on DHRmin load line (Table 13). For cooling operation, the two
SS ASHPs had average measured seasonal COPs of 2.08 and 2.46 (EERs of 7.1 and 8.4), respectively, or
-45% and -35% deviations from the rated SEER. The measured SC efficiency of the VS ASHP showed a
-30% deviation from its rated SEER in comparison (Table 13).
Annual energy use of a baseline system (SEER of 13 and 7.7 HSPF of 7.7 for Region IV SS ASHP and
electric WH) meeting the 2015–2016 field-test site loads was estimated as described below. Seasonal SH
and SC efficiencies for the baseline unit were adjusted downward by 27% and 40%, respectively, from its
rated values based the average field-measured deviations from rated efficiencies experienced by SS
ASHPs previously field-tested in the Knoxville area (Munk et al. 2013). The results for this comparison
are shown in Table 16. Since the hot water tank heat losses were not accounted for in the AS-IHP field
test, they are also omitted from the baseline equipment efficiency (e.g., baseline WH COP of 1.0). This
comparison assumes that the baseline ASHP meets the same total DH load as the prototype AS-IHP
system. The table shows that the largest percentage savings come from WH, at 58% (1593 kWh). Note
that the WH energy savings estimate (and that in Table 15) includes the impact of the 20-day period in
January when the hot water load was zero, so this savings estimate is likely somewhat conservative.
SC+DH and SH energy savings are estimated at 1812 kWh (45%) and 1836 kWh (26%), respectively.
Estimated total annual savings for the AS-IHP vs. estimated baseline energy use at the Knoxville field-
test site are ~38%. Heavy reliance on backup electric elements for SH and defrost tempering coupled
with higher indoor blower energy usage vs. manufacturer’s data were likely the major causes of the
lower-than-expected SH performance of the AS-IHP field prototype system.

39
Table 16. AS-IHP system 2015–2016 energy savings vs. estimated baseline system performance at test site
(based on 13 SEER ASHP field tests in 2011–2012)
Mode AS-IHP Baseline system
estimated performancea
Percent
Savings Over
Baseline
Space Cooling +
DH
Delivered (kWh) 9189 9189
Consumed (kWh) 2201 4013 45%
Space Heating Delivered (kWh) 11,651 11,651
Consumed (kWh) 5225 7061 26%
Water Heating
COP 2.39 1
Delivered (kWh) 2739 2739
Consumed (kWh) 1146 2739 58%
Total Consumed (kWh) 8572 13,813 38%
aEstimated per average measured performance of two 13 SEER ASHPs tested in the Knoxville area in 2011–2012; baseline
WH performance assumed equal to that in Table 15.
7. FURTHER COMMERCIAL PRODUCT DEVELOPMENT PLANS
Further commercial development of this AS-IHP concept or the WH/DH module is currently a low
priority for Lennox. Their available resources are focused on dealing with upcoming changes anticipated
in the efficiency rules and testing requirements as well as an anticipated A2L refrigerant phase-in later
this decade. The WH/DH will not be part of their product plan in the near future due to the current
number of products they already have in development. The team is exploring the possibility of engaging
with another company to manufacture the WH/DH. Lennox may be willing to license the technology.
8. CONCLUSIONS
Between October 2007 and September 2017, ORNL and Lennox engaged in a CRADA to develop an AS-
IHP system for the US residential market. The Lennox AS-IHP concept consisted of a high-efficiency
ASHP for SH/SC services and a separate heat pump WH/DH module for domestic WH/DH services. A
key feature of this system approach with the separate WH/DH is the capability to pretreat (i.e.,
dehumidify) ventilation air and dedicated whole-house DH independent of the ASHP. Two generations
of laboratory-prototype WH/DH units were designed, fabricated, and lab tested. Performance maps for the
system were developed using the latest research version of the DOE/ORNL HPDM, as calibrated against
the lab test data. These maps were the input to the TRNSYS system to predict annual performance
relative to a baseline suite of equipment meeting minimum efficiency standards in effect in 2006
(combination of SEER 13 ASHP and electric resistance water heater with EF of 0.9). Predicted total
annual energy savings, based on use of a two-speed ASHP and the second-generation WH/DH prototype
for the AS-IHP—while providing space conditioning and WH for a tight, well insulated (i.e., nZEH-
ready) 2600 ft2 (242 m2) house at 3 US locations with relative high DH loads—ranged from 33 to 36%,
averaging 35%, relative to the baseline system (The lowest savings were realized at the cold-climate
Chicago location.) Predicted energy use for WH was reduced by about 50 to 60% relative to resistance
WH.
Based on the lab prototype test and results of analyses, Lennox designed and fabricated a field-test
prototype WH/DH. The WH/DH prototype, together with a VS ASHP was installed in a 2400 ft2 (223
m2) house in Knoxville, TN and field tested from August 2015 to October 2016. Further field testing of

40
the WH/DH unit continued through May 2017 to evaluate several design changes intended to improve
DH performance. For the 2015–2016 AS-IHP system test period, overall space conditioning efficiencies
were 4.72 for SC) and 2.23 for SH. For WH, the overall average COP was 2.75 for the WH/DH unit only
and was 2.19 for the total system including COP degradations due to (1) heat losses of ~10% from the
connecting lines between WH/DH and tank, (2) heat losses of ~8% from the water tank, and backup
electric heat usage of ~3%. The WH COP was also negatively impacted by a 20-day period in January
2016 when there were no hot water draws due to a control issue. Overall, the DH efficiency, including
only months with significant run hours in DH mode, was 1.7 l/kWh; monthly averages ranged from 1.5 to
2.1.
Based on the demonstrated field performance of the AS-IHP prototype and estimated performance of a
baseline system operating under the same loads and weather conditions, a bin analysis estimated that the
prototype would achieve ~30% energy savings relative to the minimum efficiency suite. The estimated
WH savings were ~60%, and SC mode savings were >30%. Estimated SH savings were only about 10%
due to the atypically high heating load; zone control issues also played a part in reducing the expected
heating performance. A secondary comparison based on prior field tests of two baseline 13 SEER ASHPs
in another house with more typical heating-to-cooling-load ratios in the same area indicated ~40% overall
energy savings for the AS-IHP (~60% WH savings, ~45% SC savings, and ~25% SH savings).
9. REFERENCES
Air-Conditioning, Heating, and Refrigeration Institute (AHRI). 2008 Standard for Performance Rating of
Unitary Air-Conditioning & Air-Source Heat Pump Equipment. AHRI 210/240. Arlington, VA: AHRI,
2008.
AHRI. Directory of Certified Product Performance. Accessed September 30, 2016.
https://www.ahridirectory.org.
ANSI/Association of Home Appliance Manufacturers (AHAM). Dehumidifiers. DH-1 2008. Washington,
DC: AHAM, 2008.
American Society of Heating, Refrigerating and Air-Conditioning Engineers (ASHRAE). Ventilation and
Acceptable Indoor Air Quality in Low-Rise Residential Buildings. ASHRAE Standard 62.2-2007. Atlanta:
ASHRAE, 2007.
ASHRAE. ASHRAE Handbook: Fundamentals. Atlanta: ASHRAE, 2013.
Baxter, V. D., C. K. Rice, J. D. Munk, M. R. Ally, and B. Shen. Advanced Variable Speed Air-Source
Integrated Heat Pump (AS-IHP) Development - CRADA Final Report. ORNL/TM-2015/525, September
2015.
Code of Federal Regulations, US. “Uniform Test Methods for Measuring the Energy Consumption of
Water Heaters.” Code of Federal Regulations, title 10, chap. II, vol. 3, part 430, subpart B, appendix E.
2010.
Dobos, A. P. PVWatts Version 1 Technical Reference, Technical Report NREL/TP-6A20-60272, National
Renewable Energy Laboratory (NREL), October 2013. http://www.nrel.gov/docs/fy14osti/60272.pdf.
Department of Energy, US (DOE). Building Science-Based Climate Maps. PNNL-SA-90570. January
2013. http://apps1.eere.energy.gov/buildings/publications/pdfs/building_america/-
4_3a_ba_innov_buildingscienceclimatemaps_011713.pdf.
41
DOE. EnergyPlus Version 8.6 Documentation: Engineering Reference. September 30, 2016.
https://energyplus.net/sites/all/modules/custom/nrel_custom/pdfs/pdfs_v8.6.0/EngineeringReference.pdf.
DOE/BTO Building America Program. Building America Analysis Spreadsheets: DHW Event Schedule
Generator. Last accessed on September 24, 2015. http://energy.gov/eere/buildings/-building-america-
analysis-spreadsheets.
Energy Star 2012. ENERGY STAR® Program Requirements for Dehumidifiers, Version 3.0. US
Environmental Protection Agency Energy Star Program.
Energy Star 2013. ENERGY STAR® Program Requirements for Residential Water Heaters, Version 2.0,
July 1. US Environmental Protection Agency Energy Star Program.
Energy Star 2015. ENERGY STAR® Program Requirements for Residential Water Heaters, Version 3.1,
April 16. US Environmental Protection Agency Energy Star Program.
https://www.energystar.gov/products/water_heaters/heat_pump_water_heaters
Energy Star 2016. ENERGY STAR® Program Requirements for Dehumidifiers, Version 4.0, October 25.
US Environmental Protection Agency Energy Star Program.
https://www.energystar.gov/products/appliances/dehumidifiers/key_efficiency_criteria
Hendron, R. and C. Engebrecht. Building America House Simulation Protocols. NREL Report: TP-550-
49426, October 2010.
Hendron, R., J. Burch, and G. Barker. Tool for Generating Realistic Residential Hot Water Event
Schedules. Preprint. United States: s.n., 2010. NREL/CP-550-47685.
Lennox Industries Inc. “Lennox Engineering Data, Heat Pump Outdoor Units, XP19.” Bulletin No.
210415, March 2009a.
Lennox Industries Inc. “Lennox Engineering Data, Heat Pump Outdoor Units, XP19, Expanded Ratings
Tables”, Bulletin No. 210415R, April 2009b.
Lennox Industries Inc. “SunSource® Home Energy System Product Specifications.”
Publication #210664, September 2013a.
Lennox Industries Inc. “SunSource® Home Energy System Application and Design Guidelines.”
Publication #CORP1312-L2, July 2013b.
Lennox Industries Inc. “Lennox XP-25 2 to 5 Ton Heat Pump Product Specifications,” Bulletin 210659,
May 2014.
Munk, J. D., C. Halford, and R. Jackson. Component and System Level Research of Variable-Capacity
Heat Pumps. ORNL/TM-2013/36, Oak Ridge National Laboratory, June 2013.
Munk, J. D., V. D. Baxter, A. C. Gehl, M. R. Ally, B. Shen, C. K. Rice, and R. B. Uselton. “Prototype
Air-Source Integrated Heat Pump Field Evaluation Results.” Paper O.1.4.1 in Proceedings of the 12th IEA
Heat Pump Conference, Rotterdam, The Netherlands, May 15–18, 2017.
Murphy, R.W., V. D. Baxter, C. K. Rice, and W. G. Craddick. Air-Source Integrated Heat Pump for Near
Zero Energy Houses: Technology Status Report. ORNL/TM-2007/112, December 2007.
42
National Oceanic and Atmospheric Administration (NOAA) NOAA Online Weather Data. Accessed
August 3, 2015, and August 14, 2015. http://w2.weather.gov/climate/xmacis.php?wfo=mrx.
NOAA. NOAA Online Weather Data. Accessed December 22, 2016.
http://w2.weather.gov/climate/xmacis.php?wfo=mrx
NREL. BEopt version 2.4.0.1. Golden, CO: NREL, 2015.
Rice, C. K. “Benchmark Performance Analysis of an ECM-Modulated Air-to-Air Heat Pump with a
Reciprocating Compressor.” ASHRAE Transactions vol. 98, part 1, 1992.
Rice, C. K. and W. L. Jackson 2005. DOE/ORNL Heat Pump Design Model on the Web, Mark VII
Version. Last updated August 2, 2013. http://www.ornl.gov/~wlj/hpdm/MarkVII.shtml.
Rice, C. K., B. Shen, V. D. Baxter, S. S. Shrestha, and R. B. Uselton. “Development of an Air-Source
Heat Pump Integrated with a Water Heating/Dehumidification Module.” Conference Proceedings of the
11thIEA Heat Pump Conference, Montréal (Québec), Canada, May 12-16.
Risser, R. “Driving Innovation, Speeding Adoption, Scaling Savings – an Overview of the DOE Building
Technologies Office,” Presented at the 2016 DOE/BTO Peer Review Meeting, Washington, DC, April 4,
2016. https://energy.gov/eere/buildings/building-technologies-office-2016-peer-review-0
Shen, B., O. A. Abdelaziz, and C. K. Rice. “Auto-Calibration and Control Strategy Determination for a
Variable-Speed Heat Pump Water Heater Using Optimization,” International Journal of HVAC&R vol.
18, no. 5, October 2012.
Solar Energy Laboratory, University of Wisconsin, TRANSSOLAR Energietechnik, CSTB—Centre,
Scientifique et Technique du Bâtiment, and TESS—Thermal Energy System Specialists. TRNSYS 16: a
TRaNsient SYstem Simulation Program, version 16.01.0000.
Uselton, R. Dedicated Dehumidifier and Water Heater. United States Patent Application Publication,
Pub. No. US 2012/0047930 A1, March 1, 2012.
Uselton, R. Dedicated Dehumidifier and Water Heater, United States Patent 8,689,574 B2, April 1, 2014.

A-1
APPENDIX A. INVENTION DISCLOSURES FILED UNDER CRADA
WORK PROGRAM
This appendix lists invention disclosures resulting from work done under this CRADA project.
1. Joint disclosures by Lennox and ORNL – none
2. Disclosures by ORNL – Invention Disclosure - “Condensate Removal Aid for Heat Exchangers,”
October 2015, Docket Number 201503585
3. Disclosures by Lennox – patent titled “Dedicated Dehumidifier and Water Heater” (patent No.: US
2014/8,689,574 B2) was awarded by US patent office on April 1, 2014.