Embed Size (px)
Citation preview

02 DIRECTORS’ REPORT
2017 FINANCIAL YEAR RESULTS 1
2017 Financial Year Results
Orocobre Limited (ORE:ASX ORL: TSX)
For
per
sona
l use
onl
y
01 REVIEW OF OPERATIONS
2017 FINANCIAL YEAR RESULTS 2
Review of results Group financial performance To assist readers to better understand the financial results of Orocobre (the Company or the Group), the financial information in this Operating and Financial Review includes non-IFRS unaudited financial information.
Summary of results for the year ended 30 June 2017 (US$)
Revenue includes revenue and all other income from continuing operations ‘EBITDAIX is ‘Earnings before interest, tax, depreciation and amortisation, impairment, and foreign exchange
gains (losses)’ ‘EBITIX is ‘Earnings before interest, tax, impairment and foreign exchange gains (losses)’ ‘EBTIX is ‘Earnings before tax, impairment and foreign exchange gains (losses)’
The Group produced a net profit after tax of US $19.4 million (30 June 2016: US $22 million loss), based on a full 12 months production at Olaroz operations, augmented with profits from the sale of South American Salar Minerals Pty Ltd.
Borax total sales revenue, excluding other income, was up 11% on the previous corresponding period following a sustained effort to lift production volumes.
Year Ended Year Ended
30 June 2017 30 June 2016
US $ US $
Revenue and other income1 17,439,410 18,524,449
EBITDAIX2
(8,306,318) (7,750,580)
Less Depreciation & Amortisation (1,743,249) (1,685,753)
EBITIX3 (10,049,567) (9,436,333)
Less Interest 1,788,828 474,501
EBTIX4
(8,260,739) (8,961,832)
Less Impairment (8,104,583) -
Less Foreign currency gains/(losses) 625,033 (2,528,110)
Less share of profit / (loss) of joint venture 21,479,881 (11,000,508) Group profit/(loss) before tax from continuing operations 5,739,592 (22,490,450)
Income tax expense (1,108,074) 634,438 Net profit/(loss) after tax from continuing operations 4,631,518 (21,856,012)
Net profit/(loss) after tax from discontinued operations 14,783,988 (78,062) Net profit/(loss) after tax 19,415,506 (21,934,074)
For
per
sona
l use
onl
y
01 REVIEW OF OPERATIONS
2017 FINANCIAL YEAR RESULTS 3
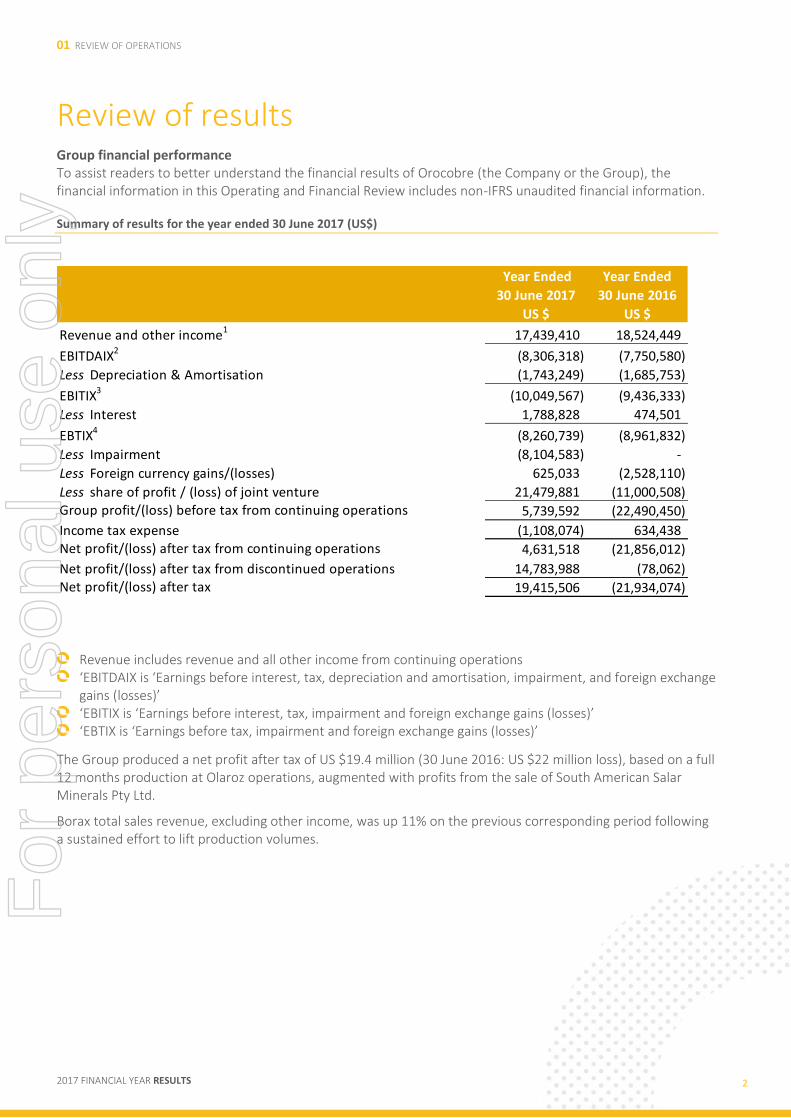
Review of Operations The Group’s key assets are the Olaroz Lithium Facility, the boron mines and processing facilities of Borax Argentina and a portfolio of brine exploration projects. They are all located in northern Argentina.
For
per
sona
l use
onl
y
01 REVIEW OF OPERATIONS
2017 FINANCIAL YEAR RESULTS 4
The Company’s key properties are owned and held by Argentine operating company (ORE 66.5%), Sales de Jujuy S.A (“SDJ”) and contain those properties associated with the Olaroz Lithium Facility. Orocobre’s partners in SDJ are Toyota Tsusho Corporation (“TTC”) (25%) and “JEMSE” (8.5%).
During the year Orocobre divested other brine assets in Salta and Jujuy provinces and as part of the transaction with LSC Lithium acquired 3,821 Ha of additional properties at Olaroz which are expected to be incorporated into the Joint Venture in due course.
The Company’s boron mineral assets are held through its 100% owned subsidiary, Borax Argentina S.A.
Olaroz Lithium Facility (66.5%)
Our first full year of production…
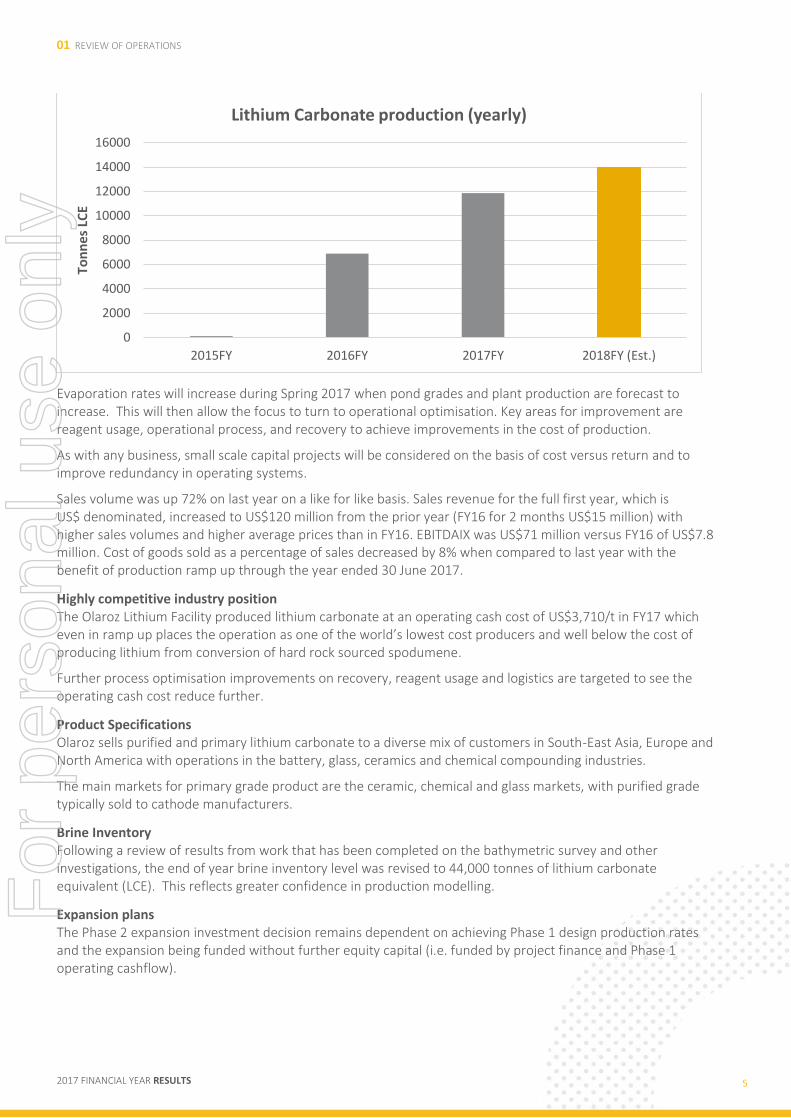
A low cost, high margin brine based lithium carbonate producer FY17 production up 72% on FY16 High growth industry, with improving fundamentals Demand growth @ 17% CAGR (mid-point of ORE estimates) Sustained market prices of >US$10,000/t lithium carbonate equivalent (LCE) at end of FY17 Large long-life world class resource capable of supporting multiple phases of expansion Multiple phase expansion likely, next phase studies underway to double capacity to 35,000 tpa with a
10,000 tpa lithium hydroxide plant (to be built in Japan) Plant optimisation expected to decrease operating cash costs
The Olaroz Lithium Facility is located in Jujuy Province in northern Argentina, approximately 230 kilometres northwest of the capital city of Jujuy. The operations are at an altitude of 3,900 metres above sea level and produce lithium carbonate from the Salar de Olaroz brine resource. The plant at Olaroz is unique as it incorporates a large-scale purification circuit with the potential to produce battery grade lithium carbonate on site.
The 17,500 tonnes per year design capacity plant has been operating since early 2015 and produces a range of highly sought-after lithium carbonate products that are sold into global markets. Demand for our products continues to increase as the world’s consumers require high quality lithium batteries in applications that are increasingly dominated by state of the art high performance electric vehicles and grid power storage applications at residential and commercial scale. Consumer electronics continue to provide significant underlying demand but it is the wholesale adoption of electric vehicle (EV) technology by global auto manufacturers that will drive unprecedented growth in lithium demand over the next decade.
The first sale of lithium carbonate from the Olaroz Lithium Facility occurred in April 2015 and volumes had been consistently increasing until a pond management issue was identified in February 2017. This resulted in production being feedstock constrained over the 2017 winter period, though production volumes are expected to lift significantly from the December 2017 quarter onwards.
Prior to the pond issue, ramp up in the plant had progressed so that the primary circuit runs consistently with a maximum achieved throughput of 66 tonnes per day (tpd), some 35% above design rate of 48 tpd. The purification circuit achieved a maximum throughput rate of 43 tpd and runs consistently at 35-40 tpd (73-83% of nameplate). Hydrocyclones fitted early in the 2017 calendar year are expected to allow the purification circuit to achieve nameplate capacity of approximately 48 tonnes per day.
For
per
sona
l use
onl
y
01 REVIEW OF OPERATIONS
2017 FINANCIAL YEAR RESULTS 5
Evaporation rates will increase during Spring 2017 when pond grades and plant production are forecast to increase. This will then allow the focus to turn to operational optimisation. Key areas for improvement are reagent usage, operational process, and recovery to achieve improvements in the cost of production.
As with any business, small scale capital projects will be considered on the basis of cost versus return and to improve redundancy in operating systems.
Sales volume was up 72% on last year on a like for like basis. Sales revenue for the full first year, which is US$ denominated, increased to US$120 million from the prior year (FY16 for 2 months US$15 million) with higher sales volumes and higher average prices than in FY16. EBITDAIX was US$71 million versus FY16 of US$7.8 million. Cost of goods sold as a percentage of sales decreased by 8% when compared to last year with the benefit of production ramp up through the year ended 30 June 2017.
Highly competitive industry position The Olaroz Lithium Facility produced lithium carbonate at an operating cash cost of US$3,710/t in FY17 which even in ramp up places the operation as one of the world’s lowest cost producers and well below the cost of producing lithium from conversion of hard rock sourced spodumene.
Further process optimisation improvements on recovery, reagent usage and logistics are targeted to see the operating cash cost reduce further.
Product Specifications Olaroz sells purified and primary lithium carbonate to a diverse mix of customers in South-East Asia, Europe and North America with operations in the battery, glass, ceramics and chemical compounding industries.
The main markets for primary grade product are the ceramic, chemical and glass markets, with purified grade typically sold to cathode manufacturers.
Brine Inventory Following a review of results from work that has been completed on the bathymetric survey and other investigations, the end of year brine inventory level was revised to 44,000 tonnes of lithium carbonate equivalent (LCE). This reflects greater confidence in production modelling.
Expansion plans The Phase 2 expansion investment decision remains dependent on achieving Phase 1 design production rates and the expansion being funded without further equity capital (i.e. funded by project finance and Phase 1 operating cashflow).
0
2000
4000
6000
8000
10000
12000
14000
16000
2018FY (Est.)2017FY2016FY2015FY
Ton
nes
LC
E
Lithium Carbonate production (yearly)
For
per
sona
l use
onl
y
01 REVIEW OF OPERATIONS
2017 FINANCIAL YEAR RESULTS 6
Revised Scope of Phase 2 Expansion Studies On 15 December 2016, Orocobre announced the results of scoping studies into the expansion of Olaroz and the proposed doubling of production at a cost of US$190 million including US$25 million contingency. Subsequently, these plans have been simplified to remove the purification circuit from the incremental production. The resultant product mix is 17,500 tonnes per annum purified lithium carbonate (>99.5%) from the existing purification circuit, and 17,500 tonnes per annum Primary Grade lithium carbonate (avg. 99.0%), of which ~9,000 tonne per annum will be used to feed the planned 10,000 tonnes per annum lithium hydroxide plant.
This simplified strategy results in lower capital expenditure of approximately US$160 million including a US$25 million contingency and lower implementation risk as the project is based around a simple duplication of the bores, ponds and primary circuit of Phase 1 at Olaroz. It should be noted that the full cost of the pond system contained within the total capital expenditure estimate for Phase 2 is US$75 million.
Orocobre has appointed GHD for the basic engineering and the process to obtain necessary permits and approvals for Phase 2 continues to run concurrently with engineering and design. Selection of mechanical equipment such as centrifuges, filters and reactors has commenced. Test work is continuing to allow further optimisation of design and process beyond that already identified from commissioning and operation of Phase 1.
The expansion studies are not managed by the SDJ operating team but by consultants and a dedicated study manager.
Lithium Hydroxide Plant
Update on Progress Olaroz primary grade lithium carbonate has been used as feedstock for testing of process design to produce lithium hydroxide by two specialised engineering firms. The test work demonstrated that a very high quality lithium hydroxide for the battery industry could be produced from Olaroz lithium carbonate using a customised process. The test work has also highlighted opportunities to reduce lithium losses during conversion from carbonate to hydroxide.
Lithium hydroxide currently sells at a significant premium compared to lithium carbonate.
Contract negotiations are continuing with the two firms to determine the preferred contractor. The selection criteria for choice of engineering contractor includes turn-key commissioning and personnel training with process, product quality and performance guarantees.
Capital and operating costs, and a project timeline for the lithium hydroxide plant will be advised by the engineering firms during the September quarter. The current preferred location for the plant is in Japan.
The project remains subject to joint venture approvals, Board approval and finalisation of financing and permitting, and construction. Orocobre does not anticipate the need to raise equity capital for this project.
Market Conditions
Lithium market Contract prices for lithium carbonate remain above US$10,000/t after doubling in 2016. Market growth rates have lifted from 10% p.a. to over 12% p.a. and are expected to exceed 15% by 2020. The key driver for demand growth has also shifted – the adoption of lithium-ion battery in personal electronics such as laptops, tablets and phones which drove the first demand surge has reached the mature phase of the product life cycle (in developed economies at least). However, a more significant growth catalyst in terms of potential lithium consumption has emerged, being world-wide adoption of EV’s encouraged by government incentives and infrastructure, falling costs of battery packs, improved performance of rechargeable batteries and a greater range of EV models to suit end-consumer needs.
For
per
sona
l use
onl
y
01 REVIEW OF OPERATIONS
2017 FINANCIAL YEAR RESULTS 7
Orocobre is considering lithium hydroxide production as demand increases with the use of high nickel cathode format batteries such as those produced by Panasonic for Tesla.
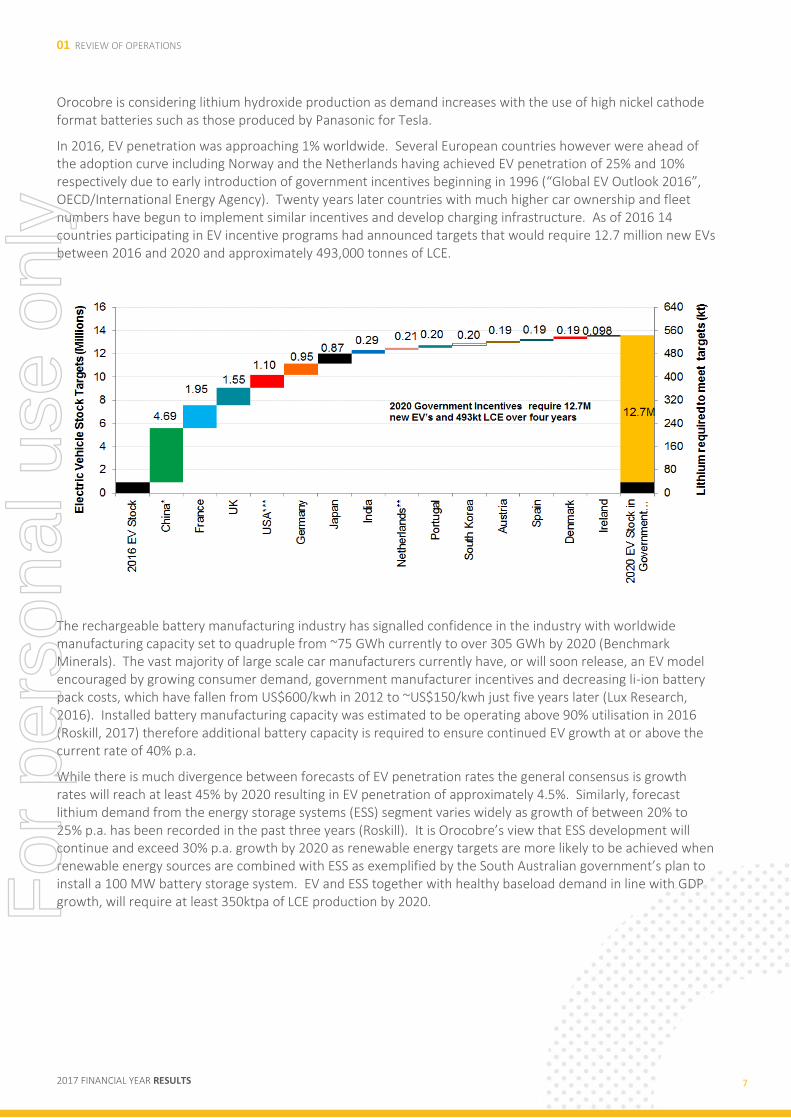
In 2016, EV penetration was approaching 1% worldwide. Several European countries however were ahead of the adoption curve including Norway and the Netherlands having achieved EV penetration of 25% and 10% respectively due to early introduction of government incentives beginning in 1996 (“Global EV Outlook 2016”, OECD/International Energy Agency). Twenty years later countries with much higher car ownership and fleet numbers have begun to implement similar incentives and develop charging infrastructure. As of 2016 14 countries participating in EV incentive programs had announced targets that would require 12.7 million new EVs between 2016 and 2020 and approximately 493,000 tonnes of LCE.
The rechargeable battery manufacturing industry has signalled confidence in the industry with worldwide manufacturing capacity set to quadruple from ~75 GWh currently to over 305 GWh by 2020 (Benchmark Minerals). The vast majority of large scale car manufacturers currently have, or will soon release, an EV model encouraged by growing consumer demand, government manufacturer incentives and decreasing li-ion battery pack costs, which have fallen from US$600/kwh in 2012 to ~US$150/kwh just five years later (Lux Research, 2016). Installed battery manufacturing capacity was estimated to be operating above 90% utilisation in 2016 (Roskill, 2017) therefore additional battery capacity is required to ensure continued EV growth at or above the current rate of 40% p.a.
While there is much divergence between forecasts of EV penetration rates the general consensus is growth rates will reach at least 45% by 2020 resulting in EV penetration of approximately 4.5%. Similarly, forecast lithium demand from the energy storage systems (ESS) segment varies widely as growth of between 20% to 25% p.a. has been recorded in the past three years (Roskill). It is Orocobre’s view that ESS development will continue and exceed 30% p.a. growth by 2020 as renewable energy targets are more likely to be achieved when renewable energy sources are combined with ESS as exemplified by the South Australian government’s plan to install a 100 MW battery storage system. EV and ESS together with healthy baseload demand in line with GDP growth, will require at least 350ktpa of LCE production by 2020.
For
per
sona
l use
onl
y
01 REVIEW OF OPERATIONS
2017 FINANCIAL YEAR RESULTS 8
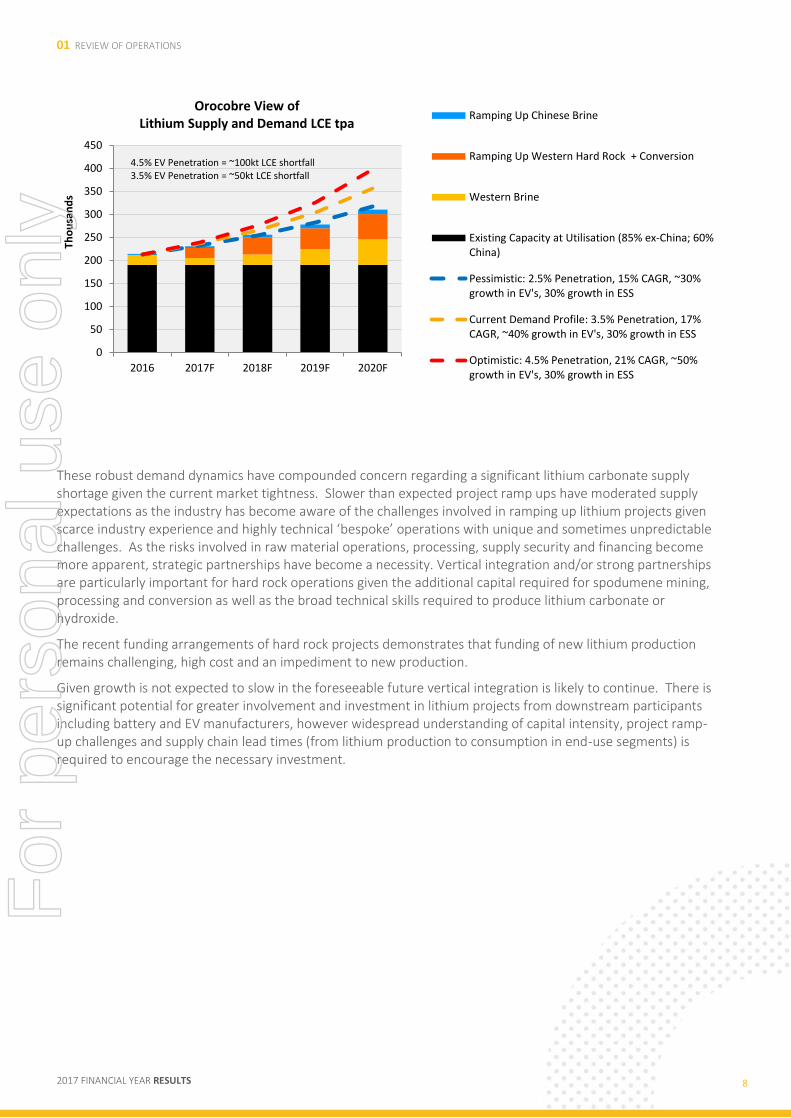
These robust demand dynamics have compounded concern regarding a significant lithium carbonate supply shortage given the current market tightness. Slower than expected project ramp ups have moderated supply expectations as the industry has become aware of the challenges involved in ramping up lithium projects given scarce industry experience and highly technical ‘bespoke’ operations with unique and sometimes unpredictable challenges. As the risks involved in raw material operations, processing, supply security and financing become more apparent, strategic partnerships have become a necessity. Vertical integration and/or strong partnerships are particularly important for hard rock operations given the additional capital required for spodumene mining, processing and conversion as well as the broad technical skills required to produce lithium carbonate or hydroxide.
The recent funding arrangements of hard rock projects demonstrates that funding of new lithium production remains challenging, high cost and an impediment to new production.
Given growth is not expected to slow in the foreseeable future vertical integration is likely to continue. There is significant potential for greater involvement and investment in lithium projects from downstream participants including battery and EV manufacturers, however widespread understanding of capital intensity, project ramp-up challenges and supply chain lead times (from lithium production to consumption in end-use segments) is required to encourage the necessary investment.
0
50
100
150
200
250
300
350
400
450
2016 2017F 2018F 2019F 2020F
Tho
usa
nd
s
Orocobre View of Lithium Supply and Demand LCE tpa
Ramping Up Chinese Brine
Ramping Up Western Hard Rock + Conversion
Western Brine
Existing Capacity at Utilisation (85% ex-China; 60%China)
Pessimistic: 2.5% Penetration, 15% CAGR, ~30%growth in EV's, 30% growth in ESS
Current Demand Profile: 3.5% Penetration, 17%CAGR, ~40% growth in EV's, 30% growth in ESS
Optimistic: 4.5% Penetration, 21% CAGR, ~50%growth in EV's, 30% growth in ESS
4.5% EV Penetration = ~100kt LCE shortfall3.5% EV Penetration = ~50kt LCE shortfall
For
per
sona
l use
onl
y
01 REVIEW OF OPERATIONS
2017 FINANCIAL YEAR RESULTS 9
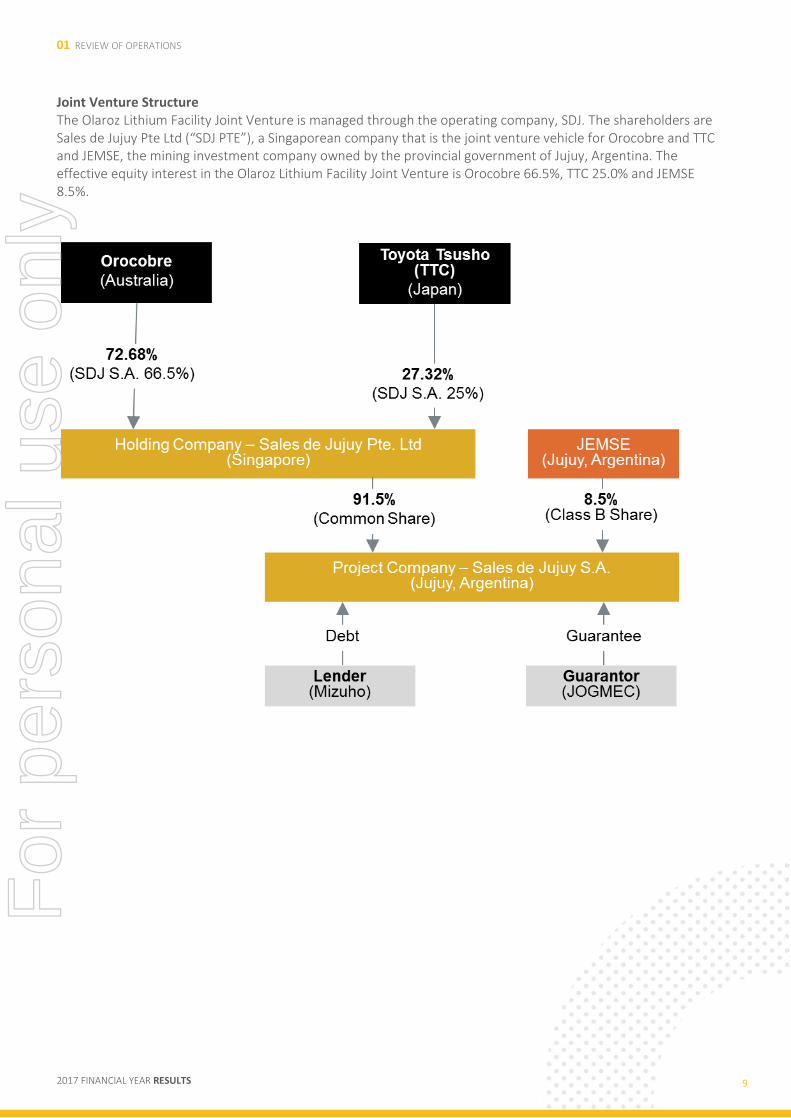
Joint Venture Structure
The Olaroz Lithium Facility Joint Venture is managed through the operating company, SDJ. The shareholders are Sales de Jujuy Pte Ltd (“SDJ PTE”), a Singaporean company that is the joint venture vehicle for Orocobre and TTC and JEMSE, the mining investment company owned by the provincial government of Jujuy, Argentina. The effective equity interest in the Olaroz Lithium Facility Joint Venture is Orocobre 66.5%, TTC 25.0% and JEMSE 8.5%.
For
per
sona
l use
onl
y
01 REVIEW OF OPERATIONS
2017 FINANCIAL YEAR RESULTS 10
Borax Argentina (100%)
Focus on maximising production and delivering higher volumes Costs have been higher than expected, margins have been lower Asset value has been impaired by US$8,104,583 to reflect current operating environment Significant long-life assets Expansion studies underway
Borax Argentina has operated in the Salta-Jujuy region for over 50 years and its operations, include three open pit mines, concentrators, refining capacity and significant land holdings. The mining operations are located in Tincalayu, Porvenir and Sijes.
The products produced by Borax Argentina can be divided into three groups being: minerals, refined products and boric acid. The minerals historically produced are ulexite, colemanite and hydroboracite. Ulexite has traditionally been used as a feedstock for the production of boric acid, however hydroboracite is now the primary feedstock allowing for a lower cost of production and a product with a lower chloride content to be produced. Hydroboracite and colemanite are supplied into the ceramic market and more recently hydroboracite into agricultural and oil and gas markets. The refined products are comprised of borax decahydrate, borax pentahydrate and borax anhydrous. These refined products have applications in a wide range of markets from agriculture, ceramics, glass, insulation fibreglass, textile fibreglass, gold assay and smelting fluxes, wood protection and a number of specialty applications.
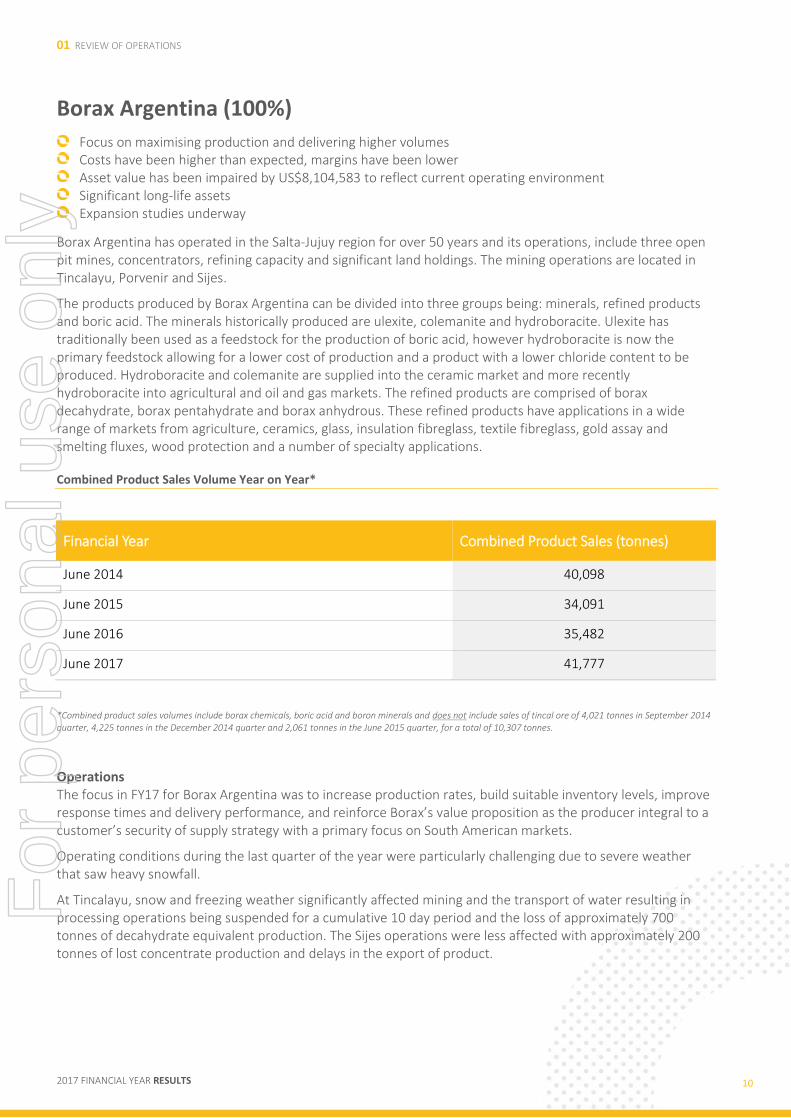
Combined Product Sales Volume Year on Year*
Financial Year Combined Product Sales (tonnes)
June 2014 40,098
June 2015 34,091
June 2016 35,482
June 2017 41,777
*Combined product sales volumes include borax chemicals, boric acid and boron minerals and does not include sales of tincal ore of 4,021 tonnes in September 2014 quarter, 4,225 tonnes in the December 2014 quarter and 2,061 tonnes in the June 2015 quarter, for a total of 10,307 tonnes.
Operations The focus in FY17 for Borax Argentina was to increase production rates, build suitable inventory levels, improve response times and delivery performance, and reinforce Borax’s value proposition as the producer integral to a customer’s security of supply strategy with a primary focus on South American markets.
Operating conditions during the last quarter of the year were particularly challenging due to severe weather that saw heavy snowfall.
At Tincalayu, snow and freezing weather significantly affected mining and the transport of water resulting in processing operations being suspended for a cumulative 10 day period and the loss of approximately 700 tonnes of decahydrate equivalent production. The Sijes operations were less affected with approximately 200 tonnes of lost concentrate production and delays in the export of product.
For
per
sona
l use
onl
y

01 REVIEW OF OPERATIONS
2017 FINANCIAL YEAR RESULTS 11
Sales volume was up 18% on last year on a like for like basis. Sales revenue, which is US$ denominated/ pegged, increased by 11% from the prior year due to higher sales volumes but lower average prices than in FY16. EBITDAIX was a loss of US $1,651,097 versus FY16 loss of US $773,799. Cost of goods sold increased by 9% when compared to last year as a result of an increase in sales whilst administration expenses remained consistent to prior year.
Borax Argentina was EBITDAX positive in H1 FY2017 demonstrating that the business can deliver locally generated improvements in a very challenging market and economic environment at the bottom of the price cycle. However, results deteriorated in the second half of the year with production impacted by severe weather impacts.
A substantial portion of Borax’s costs are Argentine (ARS) Peso based (~65%). For the financial year devaluation of the ARS$ against the US$ was 10.8% versus inflation of 21.8%. This resulted in 11% higher than expected US$ costs for ARS peso denominated expenses.
A devaluing ARS benefits Borax as ARS costs become cheaper in US$, and US$ sales revenues translate to more ARS. A downside of a devaluing ARS is that recoverable VAT reduces in US$ terms.
Impairment of assets As a result of the impairment assessment of Borax Argentina, the carrying values of its net assets have been written down to their recoverable amount, being their fair value less costs of disposal. For the year ended 30 June 2017, this resulted in a total impairment charge amounting to US$8,104,583.
Environment The economic environment in Argentina has proved difficult in the past financial year due to inflation impacts not being completely offset by currency devaluation resulting in cost pressure. This is symptomatic of the economic transition period being experienced due to the economic reforms implemented by the new Macri administration. These economic reforms, although positive in nature, have created a short term disconnect between the relationship of inflation and currency devaluation resulting in higher peso denominated costs making it more difficult to achieve production unit cost reductions.
Production Performance The focus for Borax Argentina has continued to be on improving manufacturing efficiency and achieving reductions in the unit cost of production. Despite the economic environment hurdles over the past year the business has demonstrated a track record of consistently reducing the unit cost of production across the Tincalayu, Campo Quijano boric acid plant and Sijes operations.
The Tincalayu operation produces refined sodium borate products of borax decahydrate and borax pentahydrate. During the year the operation had some production process challenges and was negatively impacted by adverse weather conditions during the recent winter period.
The boric acid plant has recently been producing at an average production of 27 tpd with maximum production rates of 33 tpd achieved. Production costs have also been reduced significantly with the previous introduction of hydroboracite as the main feedstock last year and plant augmentation that occurred during the year.
Production at Sijes has been reprofiled with a focus on higher-specification, higher value products that are sold predominantly into the ceramics and agriculture markets. The tailings from these products is used as feed for the boric acid plant assisting in lowering the unit cost of production of boric acid.
Refined Borates Expansion Study An expansion study continues to evaluate a potential expansion of the Tincalayu refined borates operation from its current production capacity of 30,000tpa to 100-120,000tpa borax decahydrate equivalent and a 40,000 tpa boric acid plant. It is anticipated that the potential expansion will further enhance efficiencies in the production of refined borates at Tincalayu and contribute to improved manufacturing unit costs. This study will consolidate the work already undertaken on a new gas pipeline for which permitting is underway.
For
per
sona
l use
onl
y

01 REVIEW OF OPERATIONS
2017 FINANCIAL YEAR RESULTS 12
Market & Customers Borax Argentina is the only South American based boron producer with a wide range of refined products and relatively unique mineral products. The value proposition to customers is that it is a local high-quality manufacturer and supplier of boron products well positioned to provide value particularly in the form of security of supply to businesses predominantly in South America and to the operations of these companies and other key customers offshore.
Market conditions have continued to be challenging which has provided significant motivation to achieve cost reductions and efficiencies in production. Although the business has been successful in consistently driving down production costs, the rate of reduction has not kept pace with the deterioration in market prices.
However, the business remains focused on developing the key elements of a robust and successful business. In line with these goals, over the past year delivery performance has improved markedly to recently achieve 99% delivered to promise. Appropriate inventory levels are being achieved in order to support this level of delivery performance and Borax Argentina’s value proposition to customers.
Based on historical price cycle performance, market prices are due to demonstrate recovery however, this will be influenced by market conditions in key South American countries, world GDP performance, rates of urbanisation and the pricing behaviour of market leaders. Borax Argentina sales contracts are denominated in, or pegged to, the US$.
Health Safety and Community The Company fosters a “zero harm” approach when it comes to the safety of our employees and project contractors. Orocobre’s goal regarding the safety of our operations is to continuously improve the reporting of and reduction in workplace risks and incidents. The safety statistics for Borax Argentina and Sales de Jujuy employees and contractors is presented in the table below (TRIFR = Total Recordable Injury Frequency Rate):
FY17 Employee TRIFR
FY16 Employee TRIFR
FY15 Employee TRIFR
FY17 Contractor TRIFR
FY16 Contractor TRIFR
FY15 Contractor TRIFR
Borax Argentina 9.6 10.2 7.4 8.3 7.0 7.4
Sales de Jujuy 3.9 14.5 10.1 3.5 22 3.7
The trend of TRIFR has demonstrated improvement from 2016 to 2017 for employees and contractors at SDJ. Pleasingly the TRIFR has shown the most improvement at SDJ where the nature of activity has changed over the last three years from construction and commissioning to early operations and now routine production. This is a strong endorsement of the continuing process improvement and maturity of the operations. It remains a key focus of the Company to significantly reduce the number of incidents and improve the TRIFR performance.
The Company operates a wide range of programs in Argentina aimed at fostering the entrepreneurial skills of local businesses and improving the health and education of our personnel and that of the local communities. The Company has also undertaken a number of campaigns which focus on creating awareness for the prevention and early-detection of conditions such as breast cancer and substance dependency. The Company has been actively involved in community initiatives which focus on improving the formal education graduation rate at primary, high school and speciality levels. Additionally, health care programs are conducted year-round that provide dentistry, ophthalmology, cardiology and paediatric services for both our employees and the local community.
For
per
sona
l use
onl
y
01 REVIEW OF OPERATIONS
2017 FINANCIAL YEAR RESULTS 13
Sales de Jujuy and Borax Argentina have both achieved ISO accreditation for ISO 31000 Risk Management, and re-accreditation for ISO 9001 Quality Control and ISO 14001 Environmental Management. Both subsidiary companies have also implemented the OHSAS 18001 Occupational Health and Safety Management System.
Exploration and Resources Olaroz Resource Estimate In 2011, the Company defined a measured and indicated resource of 1,752 million cubic metres of brine at 690 mg/L lithium, 5,730 mg/L potassium and 1,050 mg/L boron at the Olaroz Project, which is equivalent to 6.4 million tonnes of lithium carbonate and 19.3 million tonnes of potash (potassium chloride) based on 5.32 tonnes of lithium carbonate being equivalent to 1 tonne of lithium and 1.91 tonnes of potash being equivalent to one tonne of potassium.
Details of the measured and indicated resources are given in the table below.
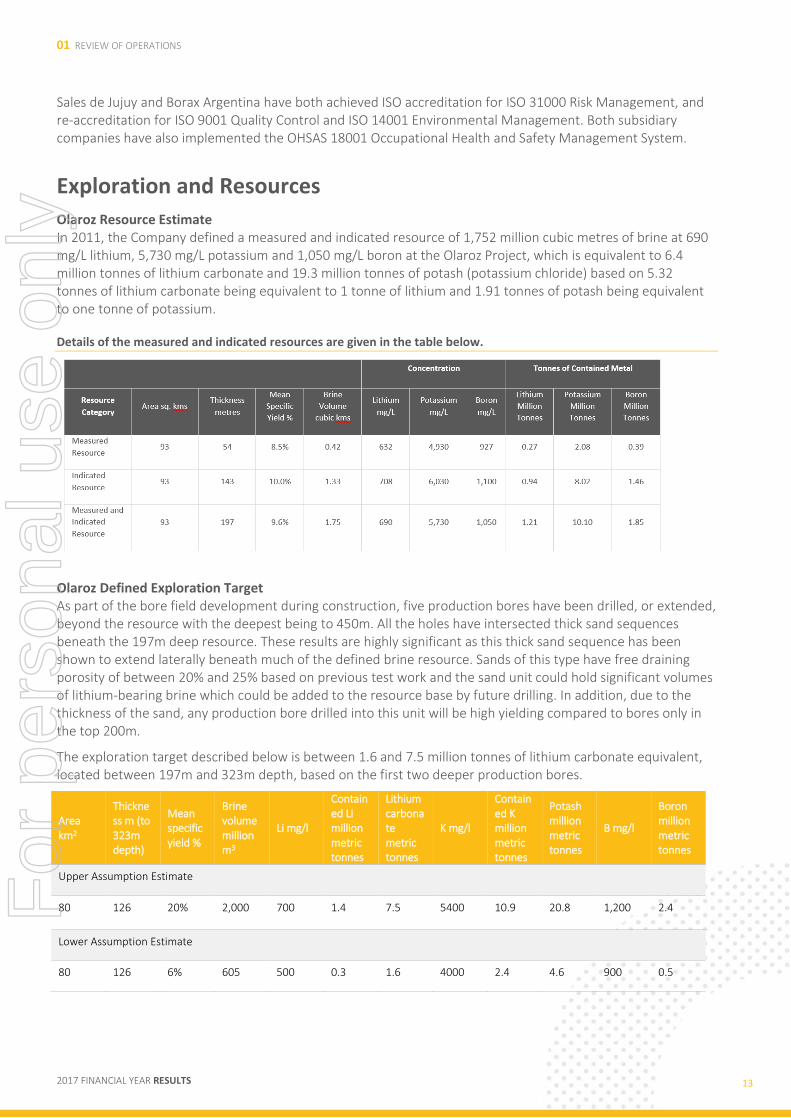
Olaroz Defined Exploration Target As part of the bore field development during construction, five production bores have been drilled, or extended, beyond the resource with the deepest being to 450m. All the holes have intersected thick sand sequences beneath the 197m deep resource. These results are highly significant as this thick sand sequence has been shown to extend laterally beneath much of the defined brine resource. Sands of this type have free draining porosity of between 20% and 25% based on previous test work and the sand unit could hold significant volumes of lithium-bearing brine which could be added to the resource base by future drilling. In addition, due to the thickness of the sand, any production bore drilled into this unit will be high yielding compared to bores only in the top 200m.
The exploration target described below is between 1.6 and 7.5 million tonnes of lithium carbonate equivalent, located between 197m and 323m depth, based on the first two deeper production bores.
Area km2
Thickness m (to 323m depth)
Mean specific yield %
Brine volume million m3
Li mg/l
Contained Li million metric tonnes
Lithium carbonate metric tonnes
K mg/l
Contained K million metric tonnes
Potash million metric tonnes
B mg/l
Boron million metric tonnes
Upper Assumption Estimate
80 126 20% 2,000 700 1.4 7.5 5400 10.9 20.8 1,200 2.4
Lower Assumption Estimate
80 126 6% 605 500 0.3 1.6 4000 2.4 4.6 900 0.5
For
per
sona
l use
onl
y
01 REVIEW OF OPERATIONS
2017 FINANCIAL YEAR RESULTS 14
Additional exploration targets have been identified to the north and the south of the defined target area. It must be stressed that an Exploration Target is not a Mineral Resource. The potential quantity and grade of the Exploration Target is conceptual in nature, and there has been insufficient exploration to define a Mineral Resource in the volume where the Exploration Target is outlined. It is uncertain if further exploration drilling will result in the determination of a Mineral Resource in this volume. Re-interpretation of the geophysical surveys has indicated the Salar may be over 600m deep with potential for further Exploration Targets to be developed beneath the current 323m.
Deeper drilling will be conducted to further evaluate the exploration target and to assist longer term development planning.
Advantage Lithium During the March quarter 2017, Orocobre completed the sale of a suite of exploration assets to Advantage Lithium Corp (TSV:AAL). AAL is well funded having raised CDN $20,000,000 capital in February 2017. Orocobre holds 46,325,000 (35%) of the issued shares of AAL and 2,550,000 warrants exercisable at CDN $1.
Orocobre retains a 42.5% interest (50% less 8.5% minority interest) and a 1% gross royalty in the Cauchari Project, and AAL has the right to increase its interest to a total of 75% by the expenditure of US$5,000,000 or production of a Feasibility Study. AAL also took a 100% interest in five other lithium properties that were previously held by Orocobre totalling 85,543 Hectares.
The AAL technical team is led by Callum Grant. Callum is an engineer with broad experience from exploration to production focusing on South America and in particular, Argentina.
The flagship Cauchari Property has an existing inferred resource of 470,000 tonnes of Lithium Carbonate Equivalent and a large exploration target to be tested with a 17 hole drill program. Drilling commenced in May 2017 with the successful casing of Hole CAU07, the first of the five-hole Phase One program located in the North-West block of the Cauchari property. The drill program is on budget with work including initial sampling and geophysical profiling which will provide key information on target zones through the salt lake sedimentary sequence.
The objective of work at Cauchari is to rapidly advance the property through exploration and towards development by 2018/2019. A diamond drill program to complement the rotary program will be conducted over the December half year. The overall objective for 2017 remains an updated resource estimate combining both NW and SE blocks of Cauchari, moving into a Scoping Study in early 2018. More advanced technical and engineering studies will continue through 2018 and into 2019 leading to a bankable Feasibility Study with the required environmental permits for the development phase.
Salinas Grandes Orocobre completed an agreement for the sale of exploration tenure at Salinas Grandes to LSC Lithium Limited (TSXV:LSC) in June 2017.
Pursuant to the Orocobre-LSC Agreement, LSC acquired mining properties located at Salinas Grandes in Salta and Jujuy provinces, Argentina (“Salinas Grandes Tenements”), which were held by Orocobre.
For
per
sona
l use
onl
y
01 REVIEW OF OPERATIONS
2017 FINANCIAL YEAR RESULTS 15
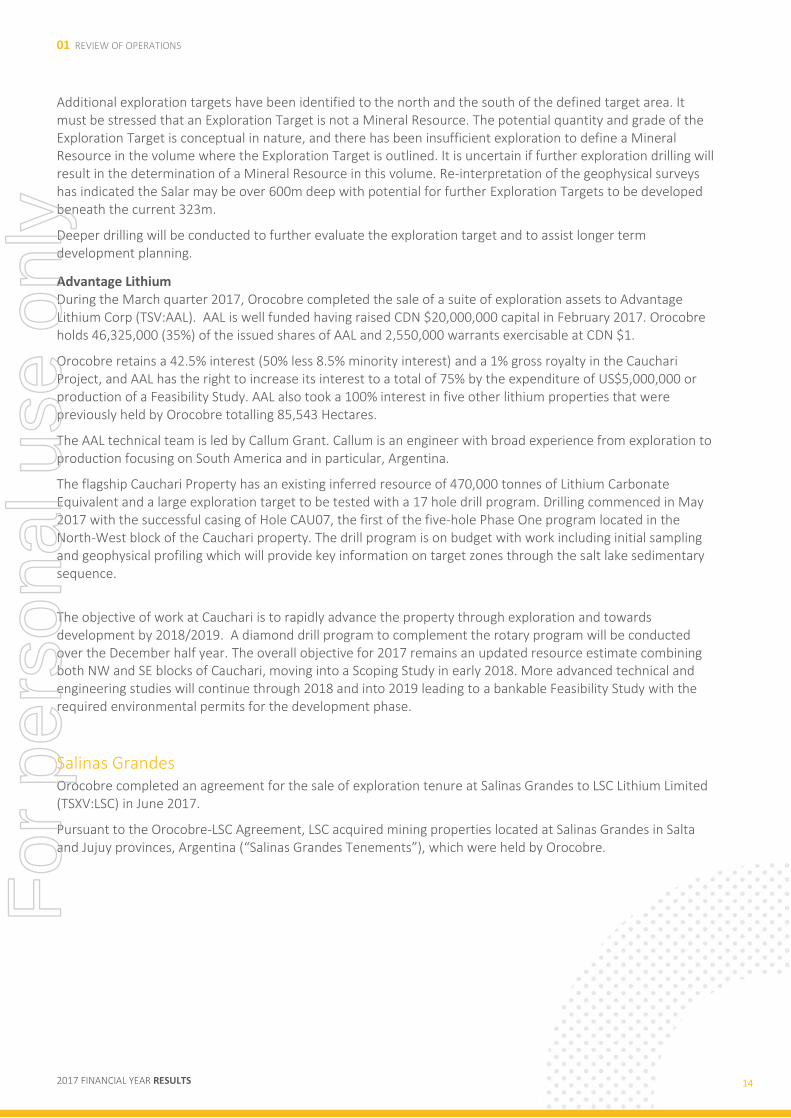
As consideration for the sale of the Salinas Grandes Tenements, LSC:
Paid Orocobre US$4 million; Transferred to Orocobre three properties located at Olaroz (“Olaroz
Tenements”) adjacent to current project properties covering approximately 3,821 hectares, thus strengthening Orocobre’s position at its flagship project; and
Granted Orocobre a 2% royalty on the brine concentrate produced from Salinas Grandes Tenements, calculated on the same basis as the royalties paid by Sales de Jujuy at the Olaroz Lithium Facility to the Jujuy Provincial Government.
LSC will pay a further US$3 million (US$2.7m on a discounted basis) payable by way of three annual tranches of US$1 million in June 2018, June 2019 and June 2020.
Cauchari Project (Orocobre 50%, moving to 25%) As described Orocobre retains a 50% interest in the Cauchari Project and AAL has the right to increase its interest to a total of 75% by the expenditure of US$5,000,000 or production of a Feasibility Study. The Cauchari Lithium-Potash Project has an inferred resource estimated to contain approximately 470,000 tonnes of lithium carbonate equivalent and 1.6 million tonnes of potash based on 5.32 tonnes of lithium carbonate being equivalent to one tonne of lithium and 1.91 tonnes of potash being equivalent to one tonne of potassium. Details are given in the table below.
The maiden resource is based on five diamond holes in the eastern Cauchari properties and is only to an average depth of 170m in the northern resource area and 50m in the southern resource area.
Lithium and potassium mineralisation was encountered to the base of drilling at 249m in hole CAU001D. An adjacent property owner, Lithium Americas Corp (TSX:LAC), previously drilled to a 464m depth and therefore future Orocobre drilling could substantially increase the maiden resource.
Inferred Resource Area
Brine Body Parameters Average Resource Concentrations
Tonnes Contained
Area km2
Average thickness m
Mean specific yield %
Brine volume million m3
Lithium mg/l
Potassium mg/l
Boron mg/l
Lithium Potassium
Boron
North 170m deep 19.69 170 6.1% 204.5 399 3,833 547 81,497 783,829 111,901
South 50m deep 11.35 50 4.6% 26 264 2,502 421 6,851 64,932 10,916
Combined 31.05 - - 230.4 383 2,683 533 88,348 848,761 122,817
For
per
sona
l use
onl
y
01 REVIEW OF OPERATIONS
2017 FINANCIAL YEAR RESULTS 16
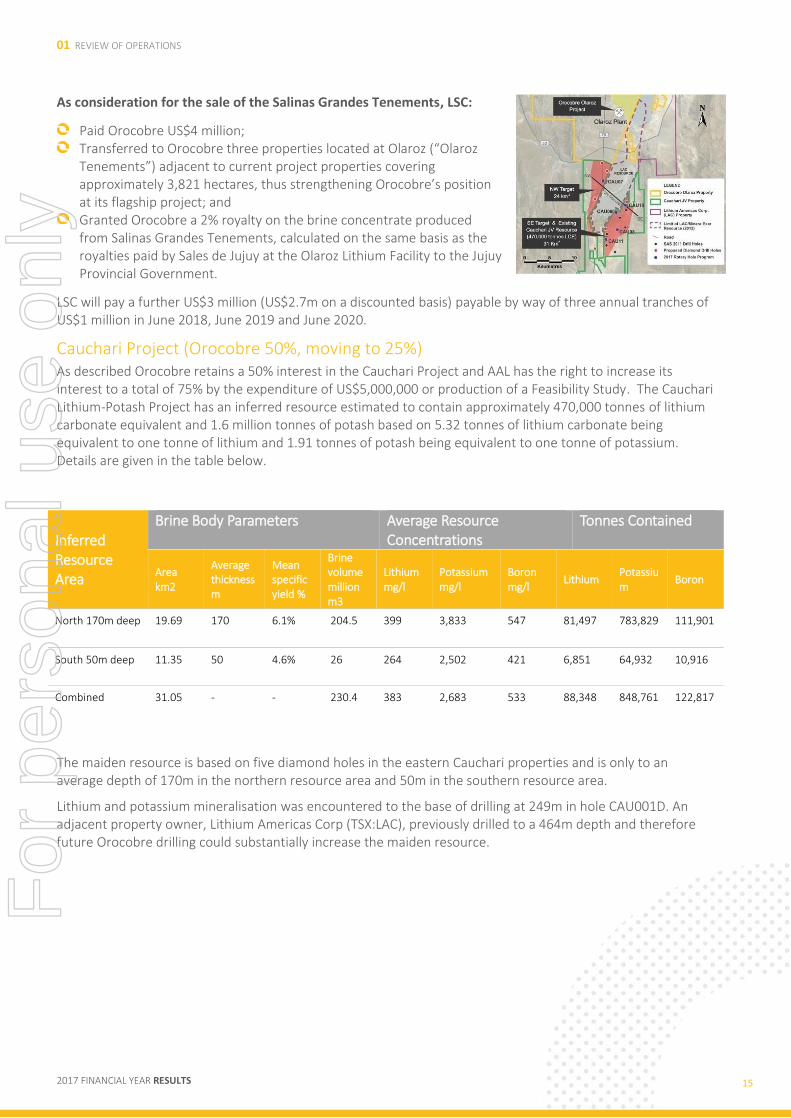
Figure 1: Location of the Cauchari drill holes. The black line marks the section line shown in Figure 2
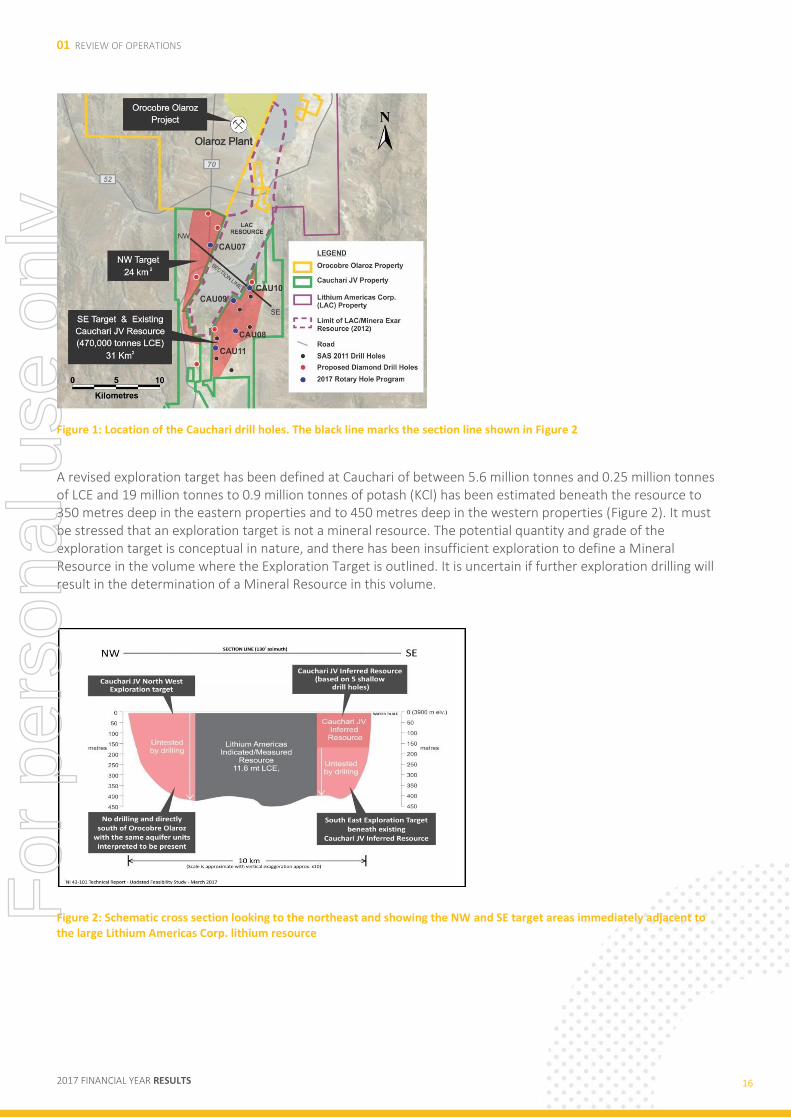
A revised exploration target has been defined at Cauchari of between 5.6 million tonnes and 0.25 million tonnes of LCE and 19 million tonnes to 0.9 million tonnes of potash (KCl) has been estimated beneath the resource to 350 metres deep in the eastern properties and to 450 metres deep in the western properties (Figure 2). It must be stressed that an exploration target is not a mineral resource. The potential quantity and grade of the exploration target is conceptual in nature, and there has been insufficient exploration to define a Mineral Resource in the volume where the Exploration Target is outlined. It is uncertain if further exploration drilling will result in the determination of a Mineral Resource in this volume.
Figure 2: Schematic cross section looking to the northeast and showing the NW and SE target areas immediately adjacent to the large Lithium Americas Corp. lithium resource
For
per
sona
l use
onl
y

01 REVIEW OF OPERATIONS
2017 FINANCIAL YEAR RESULTS 17
Whilst a lower grade than Olaroz, the brine chemistry is similar to that at Olaroz, with an attractive low Mg/Li ratio (2.8) and high K/Li ratio (10). Initial evaluation of the process route suggests the brine could be processed in an expanded Olaroz plant. Cauchari is located approximately 20kms south of the Olaroz Lithium Facility.
Considering the similarities between the Cauchari and Olaroz projects and their close proximity, there are compelling synergies between the projects, including the expected use of shared infrastructure and processing plants and the likelihood that any future development of the Cauchari brine would use the Olaroz facilities at a relatively low incremental capital cost.
This information in regard to the Inferred Resource at Cauchari was prepared and first disclosed under the JORC Code 2004. It has not been updated since to comply with the JORC Code 2012 on the basis that the information has not materially changed since it was last reported.
For
per
sona
l use
onl
y
01 REVIEW OF OPERATIONS
2017 FINANCIAL YEAR RESULTS 18
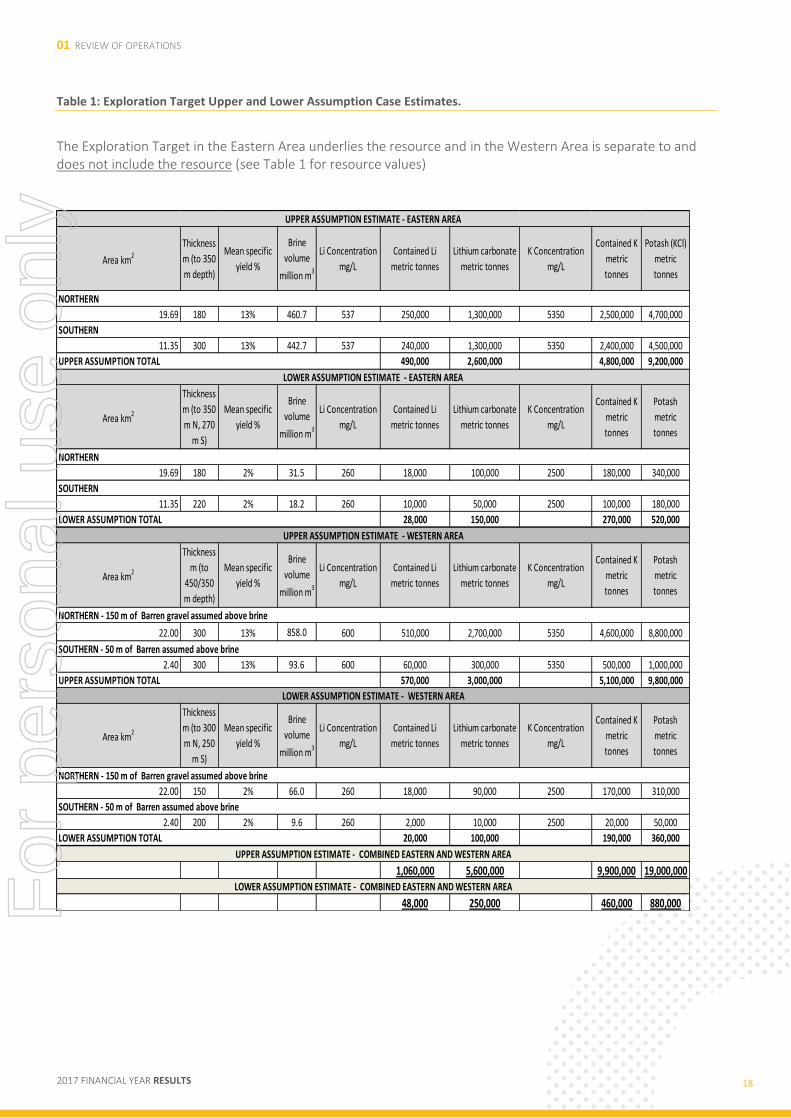
Table 1: Exploration Target Upper and Lower Assumption Case Estimates.
The Exploration Target in the Eastern Area underlies the resource and in the Western Area is separate to and does not include the resource (see Table 1 for resource values)
Area km2
Thickness
m (to 350
m depth)
Mean specific
yield %
Brine
volume
million m3
Li Concentration
mg/L
Contained Li
metric tonnes
Lithium carbonate
metric tonnes
K Concentration
mg/L
Contained K
metric
tonnes
Potash (KCl)
metric
tonnes
19.69 180 13% 460.7 537 250,000 1,300,000 5350 2,500,000 4,700,000
11.35 300 13% 442.7 537 240,000 1,300,000 5350 2,400,000 4,500,000
490,000 2,600,000 4,800,000 9,200,000
Area km2
Thickness
m (to 350
m N, 270
m S)
Mean specific
yield %
Brine
volume
million m3
Li Concentration
mg/L
Contained Li
metric tonnes
Lithium carbonate
metric tonnes
K Concentration
mg/L
Contained K
metric
tonnes
Potash
metric
tonnes
19.69 180 2% 31.5 260 18,000 100,000 2500 180,000 340,000
11.35 220 2% 18.2 260 10,000 50,000 2500 100,000 180,000
28,000 150,000 270,000 520,000
Area km2
Thickness
m (to
450/350
m depth)
Mean specific
yield %
Brine
volume
million m3
Li Concentration
mg/L
Contained Li
metric tonnes
Lithium carbonate
metric tonnes
K Concentration
mg/L
Contained K
metric
tonnes
Potash
metric
tonnes
22.00 300 13% 858.0 600 510,000 2,700,000 5350 4,600,000 8,800,000
2.40 300 13% 93.6 600 60,000 300,000 5350 500,000 1,000,000
570,000 3,000,000 5,100,000 9,800,000
Area km2
Thickness
m (to 300
m N, 250
m S)
Mean specific
yield %
Brine
volume
million m3
Li Concentration
mg/L
Contained Li
metric tonnes
Lithium carbonate
metric tonnes
K Concentration
mg/L
Contained K
metric
tonnes
Potash
metric
tonnes
22.00 150 2% 66.0 260 18,000 90,000 2500 170,000 310,000
2.40 200 2% 9.6 260 2,000 10,000 2500 20,000 50,000
20,000 100,000 190,000 360,000
1,060,000 5,600,000 9,900,000 19,000,000
48,000 250,000 460,000 880,000
LOWER ASSUMPTION TOTAL
UPPER ASSUMPTION ESTIMATE - COMBINED EASTERN AND WESTERN AREA
LOWER ASSUMPTION ESTIMATE - COMBINED EASTERN AND WESTERN AREA
SOUTHERN - 50 m of Barren assumed above brine
UPPER ASSUMPTION TOTAL
LOWER ASSUMPTION ESTIMATE - WESTERN AREA
NORTHERN - 150 m of Barren gravel assumed above brine
SOUTHERN - 50 m of Barren assumed above brine
UPPER ASSUMPTION ESTIMATE - EASTERN AREA
NORTHERN
SOUTHERN
UPPER ASSUMPTION TOTAL
LOWER ASSUMPTION ESTIMATE - EASTERN AREA
NORTHERN
SOUTHERN
LOWER ASSUMPTION TOTAL
UPPER ASSUMPTION ESTIMATE - WESTERN AREA
NORTHERN - 150 m of Barren gravel assumed above brine
For
per
sona
l use
onl
y
01 REVIEW OF OPERATIONS
2017 FINANCIAL YEAR RESULTS 19
Borax Argentina
JORC Compliance Program Following the upgrading of the Porvenir historical estimate to a JORC compliant Measured and Indicated resource in 2014, the Tincalayu resource upgrade was completed in FY15. The program is continuing with the Sijes deposit. The Diablillos “historical estimate” will not be upgraded as the majority has been flooded by the artisanal bores caused by Rodinia Lithium’s drilling programs.
Resources
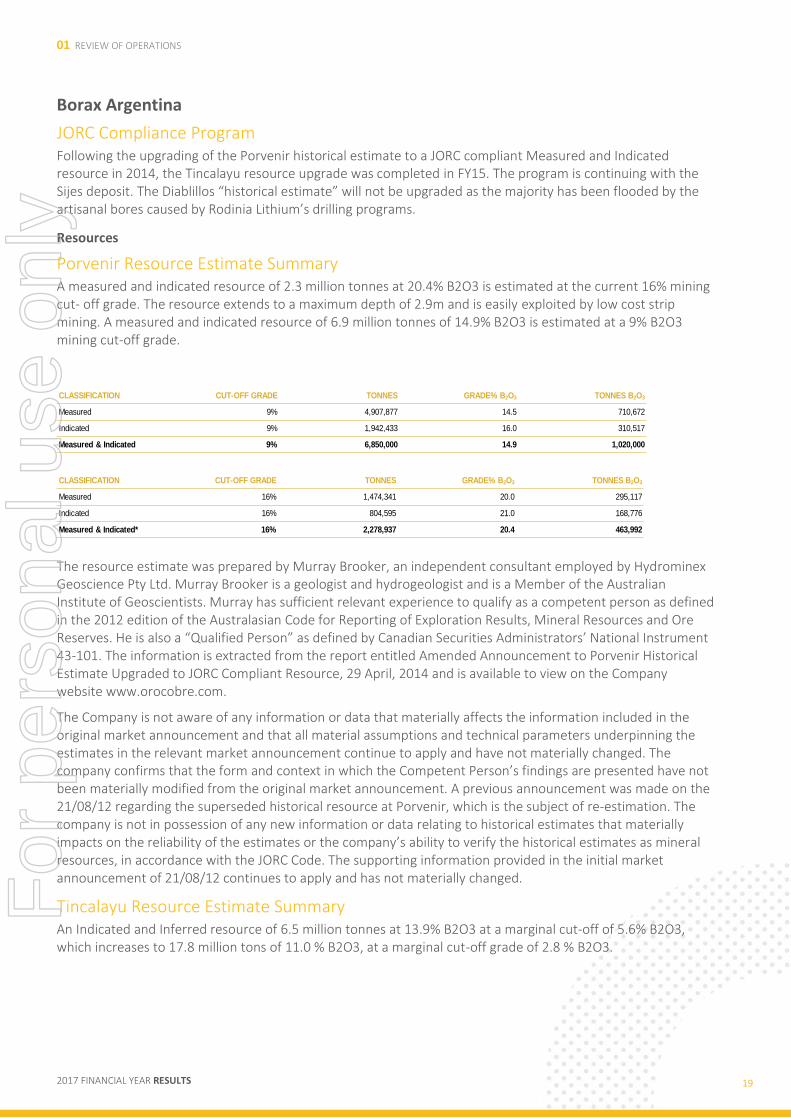
Porvenir Resource Estimate Summary A measured and indicated resource of 2.3 million tonnes at 20.4% B2O3 is estimated at the current 16% mining cut- off grade. The resource extends to a maximum depth of 2.9m and is easily exploited by low cost strip mining. A measured and indicated resource of 6.9 million tonnes of 14.9% B2O3 is estimated at a 9% B2O3 mining cut-off grade.
The resource estimate was prepared by Murray Brooker, an independent consultant employed by Hydrominex Geoscience Pty Ltd. Murray Brooker is a geologist and hydrogeologist and is a Member of the Australian Institute of Geoscientists. Murray has sufficient relevant experience to qualify as a competent person as defined in the 2012 edition of the Australasian Code for Reporting of Exploration Results, Mineral Resources and Ore Reserves. He is also a “Qualified Person” as defined by Canadian Securities Administrators’ National Instrument 43-101. The information is extracted from the report entitled Amended Announcement to Porvenir Historical Estimate Upgraded to JORC Compliant Resource, 29 April, 2014 and is available to view on the Company website www.orocobre.com.
The Company is not aware of any information or data that materially affects the information included in the original market announcement and that all material assumptions and technical parameters underpinning the estimates in the relevant market announcement continue to apply and have not materially changed. The company confirms that the form and context in which the Competent Person’s findings are presented have not been materially modified from the original market announcement. A previous announcement was made on the 21/08/12 regarding the superseded historical resource at Porvenir, which is the subject of re-estimation. The company is not in possession of any new information or data relating to historical estimates that materially impacts on the reliability of the estimates or the company’s ability to verify the historical estimates as mineral resources, in accordance with the JORC Code. The supporting information provided in the initial market announcement of 21/08/12 continues to apply and has not materially changed.
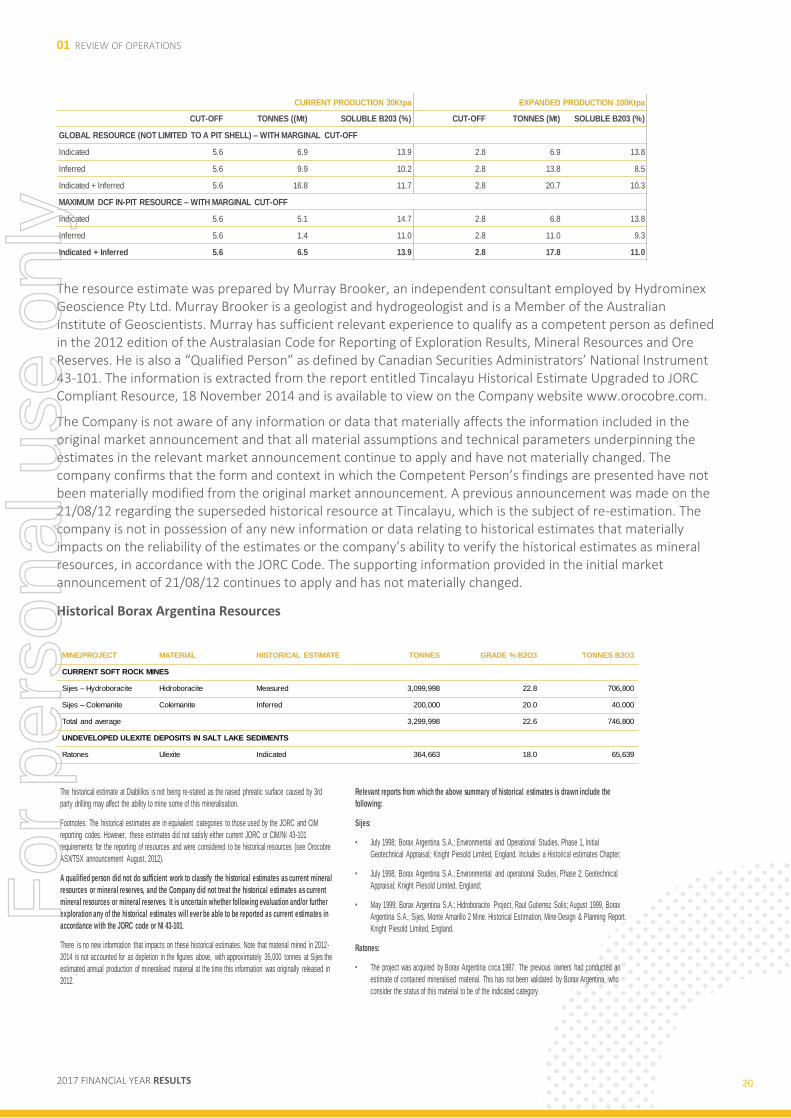
Tincalayu Resource Estimate Summary An Indicated and Inferred resource of 6.5 million tonnes at 13.9% B2O3 at a marginal cut-off of 5.6% B2O3, which increases to 17.8 million tons of 11.0 % B2O3, at a marginal cut-off grade of 2.8 % B2O3.
CLASSIFICATION CUT-OFF GRADE TONNES GRADE% B2O3 TONNES B2O3
Measured 9% 4,907,877 14.5 710,672
Indicated 9% 1,942,433 16.0 310,517
Measured & Indicated 9% 6,850,000 14.9 1,020,000
CLASSIFICATION CUT-OFF GRADE TONNES GRADE% B2O3 TONNES B2O3
Measured 16% 1,474,341 20.0 295,117
Indicated 16% 804,595 21.0 168,776
Measured & Indicated* 16% 2,278,937 20.4 463,992
For
per
sona
l use
onl
y
01 REVIEW OF OPERATIONS
2017 FINANCIAL YEAR RESULTS 20
The resource estimate was prepared by Murray Brooker, an independent consultant employed by Hydrominex Geoscience Pty Ltd. Murray Brooker is a geologist and hydrogeologist and is a Member of the Australian Institute of Geoscientists. Murray has sufficient relevant experience to qualify as a competent person as defined in the 2012 edition of the Australasian Code for Reporting of Exploration Results, Mineral Resources and Ore Reserves. He is also a “Qualified Person” as defined by Canadian Securities Administrators’ National Instrument 43-101. The information is extracted from the report entitled Tincalayu Historical Estimate Upgraded to JORC Compliant Resource, 18 November 2014 and is available to view on the Company website www.orocobre.com.
The Company is not aware of any information or data that materially affects the information included in the original market announcement and that all material assumptions and technical parameters underpinning the estimates in the relevant market announcement continue to apply and have not materially changed. The company confirms that the form and context in which the Competent Person’s findings are presented have not been materially modified from the original market announcement. A previous announcement was made on the 21/08/12 regarding the superseded historical resource at Tincalayu, which is the subject of re-estimation. The company is not in possession of any new information or data relating to historical estimates that materially impacts on the reliability of the estimates or the company’s ability to verify the historical estimates as mineral resources, in accordance with the JORC Code. The supporting information provided in the initial market announcement of 21/08/12 continues to apply and has not materially changed.
Historical Borax Argentina Resources
CURRENT PRODUCTION 30Ktpa EXPANDED PRODUCTION 100Ktpa
CUT-OFF TONNES ((Mt) SOLUBLE B203 (%) CUT-OFF TONNES (Mt) SOLUBLE B203 (%)
GLOBAL RESOURCE (NOT LIMITED TO A PIT SHELL) – WITH MARGINAL CUT-OFF
Indicated 5.6 6.9 13.9 2.8 6.9 13.8
Inferred 5.6 9.9 10.2 2.8 13.8 8.5
Indicated + Inferred 5.6 16.8 11.7 2.8 20.7 10.3
MAXIMUM DCF IN-PIT RESOURCE – WITH MARGINAL CUT-OFF
Indicated 5.6 5.1 14.7 2.8 6.8 13.8
Inferred 5.6 1.4 11.0 2.8 11.0 9.3
Indicated + Inferred 5.6 6.5 13.9 2.8 17.8 11.0
MINE/PROJECT MATERIAL HISTORICAL ESTIMATE TONNES GRADE % B2O3 TONNES B2O3
CURRENT SOFT ROCK MINES
Sijes – Hydroboracite Hidroboracite Measured 3,099,998 22.8 706,800
Sijes – Colemanite Colemanite Inferred 200,000 20.0 40,000
Total and average 3,299,998 22.6 746,800
UNDEVELOPED ULEXITE DEPOSITS IN SALT LAKE SEDIMENTS
Ratones Ulexite Indicated 364,663 18.0 65,639
The historical estimate at Diablillos is not being re-stated as the raised phreatic surface caused by 3rd
party drilling may affect the ability to mine some of this mineralisation.
Footnotes: The historical estimates are in equivalent categories to those used by the JORC and CIM
reporting codes. However, these estimates did not satisfy either current JORC or CIM/NI 43-101
requirements for the reporting of resources and were considered to be historical resources (see Orocobre
ASX/TSX announcement August, 2012).
A qualified person did not do sufficient work to classify the historical estimates as current mineral
resources or mineral reserves, and the Company did not treat the historical estimates as current
mineral resources or mineral reserves. It is uncertain whether following evaluation and/or further
exploration any of the historical estimates will ever be able to be reported as current estimates in
accordance with the JORC code or NI 43-101.
There is no new information that impacts on these historical estimates. Note that material mined in 2012-
2014 is not accounted for as depletion in the figures above, with approximately 35,000 tonnes at Sijes the
estimated annual production of mineralised material at the time this information was originally released in
2012.
Relevant reports from which the above summary of historical estimates is drawn include the
following:
Sijes:
• July 1998; Borax Argentina S.A.; Environmental and Operational Studies, Phase 1, Initial
Geotechnical Appraisal; Knight Piesold Limited, England. Includes a Historical estimates Chapter;
• July 1998; Borax Argentina S.A.; Environmental and operational Studies, Phase 2; Geotechnical
Appraisal; Knight Piesold Limited, England;
• May 1999; Borax Argentina S.A.; Hidroboracite Project, Raul Gutierrez Solis; August 1999, Borax
Argentina S.A.; Sijes, Monte Amarillo 2 Mine. Historical Estimation, Mine Design & Planning Report.
Knight Piesold Limited, England.
Ratones:
• The project was acquired by Borax Argentina circa 1987. The previous owners had conducted an
estimate of contained mineralised material. This has not been validated by Borax Argentina, who
consider the status of this material to be of the indicated category.
For
per
sona
l use
onl
y
01 REVIEW OF OPERATIONS
2017 FINANCIAL YEAR RESULTS 21
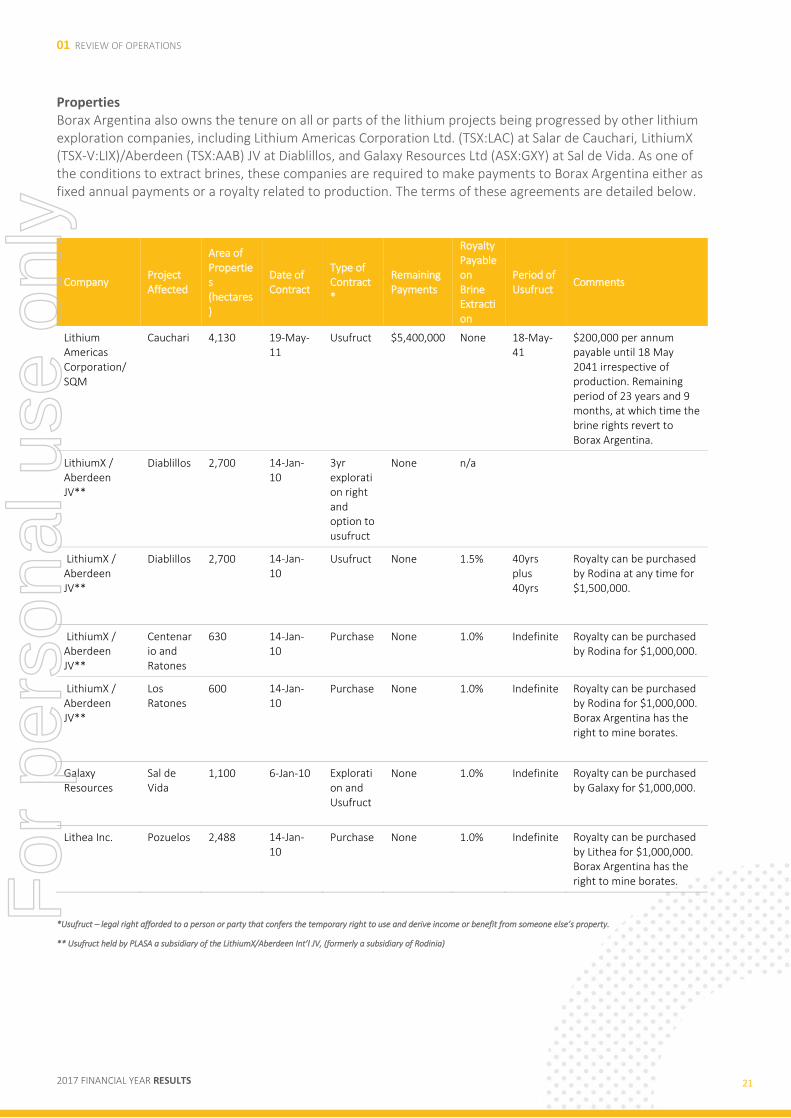
Properties Borax Argentina also owns the tenure on all or parts of the lithium projects being progressed by other lithium exploration companies, including Lithium Americas Corporation Ltd. (TSX:LAC) at Salar de Cauchari, LithiumX (TSX-V:LIX)/Aberdeen (TSX:AAB) JV at Diablillos, and Galaxy Resources Ltd (ASX:GXY) at Sal de Vida. As one of the conditions to extract brines, these companies are required to make payments to Borax Argentina either as fixed annual payments or a royalty related to production. The terms of these agreements are detailed below.
Company Project Affected
Area of Properties (hectares)
Date of Contract
Type of Contract*
Remaining Payments
Royalty Payable on Brine Extraction
Period of Usufruct
Comments
Lithium Americas Corporation/ SQM
Cauchari 4,130 19-May-11
Usufruct $5,400,000 None 18-May-41
$200,000 per annum payable until 18 May 2041 irrespective of production. Remaining period of 23 years and 9 months, at which time the brine rights revert to Borax Argentina.
LithiumX / Aberdeen JV**
Diablillos 2,700 14-Jan-10
3yr exploration right and option to usufruct
None n/a
LithiumX / Aberdeen JV**
Diablillos 2,700 14-Jan-10
Usufruct None 1.5% 40yrs plus 40yrs
Royalty can be purchased by Rodina at any time for $1,500,000.
LithiumX / Aberdeen JV**
Centenario and Ratones
630 14-Jan-10
Purchase None 1.0% Indefinite Royalty can be purchased by Rodina for $1,000,000.
LithiumX / Aberdeen JV**
Los Ratones
600 14-Jan-10
Purchase None 1.0% Indefinite Royalty can be purchased by Rodina for $1,000,000. Borax Argentina has the right to mine borates.
Galaxy Resources
Sal de Vida
1,100 6-Jan-10 Exploration and Usufruct
None 1.0% Indefinite Royalty can be purchased by Galaxy for $1,000,000.
Lithea Inc. Pozuelos 2,488 14-Jan-10
Purchase None 1.0% Indefinite Royalty can be purchased by Lithea for $1,000,000. Borax Argentina has the right to mine borates.
*Usufruct – legal right afforded to a person or party that confers the temporary right to use and derive income or benefit from someone else’s property.
** Usufruct held by PLASA a subsidiary of the LithiumX/Aberdeen Int’l JV, (formerly a subsidiary of Rodinia)
For
per
sona
l use
onl
y
02 DIRECTORS’ REPORT
2017 FINANCIAL YEAR RESULTS 22
Directors’ Report The Company’s directors have significant public company management experience, together with a strong background in mineral exploration, project development, operations management, financial markets, accounting and finance. Their experience covers many resource sectors within Australia and internationally. The names and qualifications of the Directors in office during or since the financial year are summarized below:
Robert Hubbard BA (Hons), FCA, MAICD
Non-Executive Chairman Robert was appointed a Director in November 2012 and appointed Chairman in July 2016. Robert was a partner at PricewaterhouseCoopers for over 20 years until 2013. During his time as a PwC partner, he served as auditor and adviser for some of Australia’s largest resource companies with activities throughout Australia, Papua New Guinea, West Africa and South America.
Robert is a non-executive Director of Bendigo and Adelaide Bank Limited, Primary Health Care Limited and Chairman of Central Petroleum Limited. Robert is currently a member of the Remuneration.
Directorships held in other ASX listed companies in the last three years:
Bendigo and Adelaide Bank Ltd (Apr 2013 - Present) Central Petroleum Limited (Dec 2013 - Present) Primary Health Care Limited (December 2014 – Present)
Richard P. Seville BSc (Hons) Mining Geology, MEngSc Rock Engineering, MAusIMM, ARSM Managing Director and Chief Executive Officer Richard joined the Board of Orocobre as Managing Director in 2007, when it was an unlisted Argentinian explorer, chaired by Neil Stuart. Neil and Richard took Orocobre through to listing on the ASX in December 2007.
Richard is a mining geologist and geotechnical engineer and has over 30 years’ experience in exploration, development and production, and over 20 years in the corporate field as a Director involved in resource development funding.
Richard has managed Orocobre’s growth from an explorer in Argentina to become a successful producer of lithium carbonate at the Olaroz project and he was instrumental in negotiating the Toyota Tsusho Joint Venture in 2010.
He is a graduate of Imperial College London and James Cook University in North Queensland and holds a Bachelor of Science Degree with Honours in Mining and Geology and a Master of Engineering Science. Richard is also a director of Leyshon Resources, a small ASX listed company.
Directorships held in other listed companies in the last three years:
Leyshon Resources Ltd (delisted 2017) Elementos Limited (Nov 2013 – Oct 2015) Advantage Lithium (Feb 2017 – present)
For
per
sona
l use
onl
y
02 DIRECTORS’ REPORT
2017 FINANCIAL YEAR RESULTS 23
John W. Gibson BSc Geology, MSc Geology Non-Executive Director John currently works with Tudor, Pickering, Holt & Company, as a Senior Advisor. From 2010 to 2015, he served as the President and Chief Executive Officer of Tervita Corporation and continued service as a director of Tervita until December of 2016. John previously served as Chief Executive Officer of an enterprise software solutions company, Paradigm Geophysical, and has held senior positions with the Halliburton Group of Companies, more recently as President of Halliburton’s Energy Services Group.
John is a director of I-Pulse, Inc. He assists on the Energy Advisory Board of the University of Houston, the Global Energy Advisory Board of the University of Southern California, the Bureau of Economic Geology Visiting Committee at the University of Texas, and chairs the Board of Trustees of Houston Baptist University. John formerly sat on the Board of Directors of Parker Drilling and the American Association of Petroleum Geologists Advisory Council. He holds a Bachelor of Science from Auburn University and a Master of Science from University of Houston.
John is the Chairman of the Audit Committee.
Directorships held in other ASX listed companies in the last three years: Nil
Courtney Pratt
Non-Executive Director/Independent Director Courtney was appointed a Director in March 2010. Courtney has enjoyed a 40-year career at the helm of some of Canada’s top industrial businesses, particularly in the energy, minerals, and mining sectors. From 2004 to 2006, he was President and CEO of Stelco, a major Canadian steel producer, guiding it through a court supervised restructuring, and then served as Stelco’s Chairman until the company’s sale to the US Steel Corporation in 2007. Earlier, Courtney served as the President and CEO of Toronto Hydro, North America’s largest municipally owned electricity distributor. He also served as President and subsequently as Chairman of Noranda Inc., a global diversified natural resource company headquartered in Toronto. In this capacity he served as a Director of Noranda Minerals Inc., Falconbridge Ltd., Battle Mountain Gold Company, Noranda Forest Inc., (Chairman), Norcen Energy Resources Limited and Canadian Hunter Exploration Limited. Courtney served as Chairman and Chief Executive Officer of the Toronto Region Research Alliance to March 2010. He is also a board member of MD Financial Holdings and Chairman of CMA Holdings, the physician services arm of the Canadian Medical Association. Courtney was awarded the Order of Canada in January 1999.
Courtney is currently Chairman of the Remuneration Committee.
Directorships held in other ASX listed companies in the last three years: Nil
For
per
sona
l use
onl
y
02 DIRECTORS’ REPORT
2017 FINANCIAL YEAR RESULTS 24
Fernando Oris de Roa MPA
Non-Executive Director Fernando was appointed a Director in June 2010. Fernando is a highly successful business leader with a history of developing and operating large enterprises within Argentina and has a reputation for upholding integrity and social responsibility in his business practices. He began his career in 1970 with large trading company Continental Grain, working in the USA, Spain, Switzerland, Brazil and Argentina eventually rising through the ranks to be responsible for all of Latin America. As Chief Executive of S.A. San Miguel, Fernando was widely credited with turning the company into the largest and most profitable lemon products company in the world. The process of restructuring included listing S.A. San Miguel on the Buenos Aires Stock Exchange in 1997.
Fernando was Chief Executive and significant shareholder of Avex S.A. from 2004 to 2012. He has also held the role of Director of Patagonia Gold Ltd. He holds a Masters of Public Administration from The Kennedy School of Government at Harvard University.
During 2015, Fernando led the turnaround of the largest fruit exporter in Argentina, Expofrut S.A. (apples, pears and grapes) implementing a new business model and redesigning the organization accordingly.
Fernando is a member of the Audit Committee.
Directorships held in other ASX listed companies in the last three years: Nil
Federico Nicholson LLB
Non-Executive Director Federico was appointed Director in September 2010.
Federico has been a member of the Board of Ledesma, a diversified Argentine agro-industrial producer since 1991, also serving as Executive Director until June 2014.
He is currently Chairman of CEADS (Consejo Empresario Argentino para el Desarrollo Sustentable), an Argentinian local division of WBCSD (World Business Council for Sustainable Development), and president of La Payana S.A.
Additional positions held throughout his career include President of Argentine North Regional Center and President of Chacra Experimental Agricola Santa Rosa for 19 years respectively, Vice President of the Argentine Pulp and Paper Association, Deputy Secretary of the Food Industries Association, and Vice President of the Argentine Corn Starch and Syrups Chamber, Vice President of the Argentine Industrial Union (UIA) for fourteen consecutive years (1999-2013), and President of the National Industrial Movement.
Federico has been a Board member of various sports organisations, including Mar del Plata Golf Club among others, where he was the president from 2002 to 2009.
Since graduating from the University of Buenos Aires with a Law qualification, Federico has continued his association with the institution. Federico is also a member of the Company’s Remuneration Committee.
Federico is a member of the Remuneration Committee.
Directorships held in other ASX listed companies in the last three years: Nil
For
per
sona
l use
onl
y

02 DIRECTORS’ REPORT
2017 FINANCIAL YEAR RESULTS 25
Leanne Heywood BBUS MBA CPA AICD Non-Executive Director Leanne was appointed a director in September 2016. Leanne is an executive and leader with over 25 years corporate experience in the mining sector, including 10 years with Rio Tinto. Her experience includes strategic marketing, business finance and compliance and she has led organisational restructures, disposals and acquisitions.
Additionally, she has had significant experience in complex cross-cultural negotiations and international customer and stakeholder relationship management (including governments, communities and investment partners). Leanne holds a Bachelor of Business (Accounting) from Charles Sturt University and an MBA from the Melbourne Business School, University of Melbourne. She is a member of the Australian Institute of Company Director’s, CPA Australia.
Leanne is a senior marketing executive with Inenco Industrial Services and is member of the NSW Council for Women’s Economic Opportunity.
Leanne is a member of the Audit Committee.
Directorships held in other ASX listed companies in the last three years: Nil
Company Secretaries
Neil Kaplan BAcc, CA
Chief Financial Officer and Joint Company Secretary Neil was appointed Chief Financial Officer on 7 January 2013 and Company Secretary on 1 July 2013. Neil is a Chartered Accountant and brings a wealth of knowledge to the Company with over 20 years of experience in managerial and finance positions obtained on four different continents.
Neil’s experience in the resources sector was achieved working in executive financial roles for Glencore International and formerly TSX listed company Coalcorp Mining, both based in Colombia. Neil holds a Bachelor of Accountancy degree from the University of the Witwatersrand in South Africa and is a member of both the Institute of Chartered Accountants in Australia (ICAA) and South African Institute of Chartered Accountants (SAICA).
Rick Anthon BA LLB FAIM MAICD
Corporate Development Manager, General Counsel and Joint Company Secretary Rick joined Orocobre in 2015. Rick is a lawyer with over 30 years’ experience in both corporate and commercial
law practicing exclusively in the resource sector. He has worked both as a director and adviser to numerous
For
per
sona
l use
onl
y
02 DIRECTORS’ REPORT
2017 FINANCIAL YEAR RESULTS 26
resource companies and has extensive project planning, acquisition and development, capital raising and
corporate governance skills.
Dividends No dividend has been proposed or paid since the start of the year.
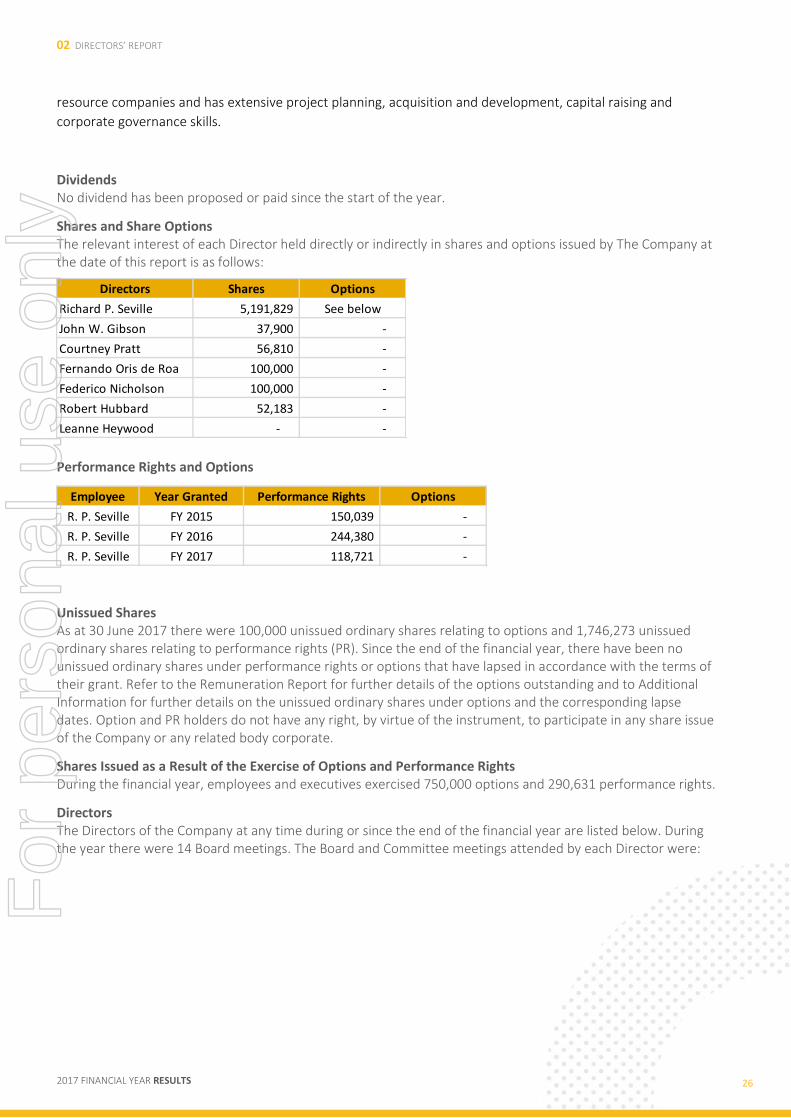
Shares and Share Options The relevant interest of each Director held directly or indirectly in shares and options issued by The Company at the date of this report is as follows:
Performance Rights and Options
Unissued Shares As at 30 June 2017 there were 100,000 unissued ordinary shares relating to options and 1,746,273 unissued ordinary shares relating to performance rights (PR). Since the end of the financial year, there have been no unissued ordinary shares under performance rights or options that have lapsed in accordance with the terms of their grant. Refer to the Remuneration Report for further details of the options outstanding and to Additional Information for further details on the unissued ordinary shares under options and the corresponding lapse dates. Option and PR holders do not have any right, by virtue of the instrument, to participate in any share issue of the Company or any related body corporate.
Shares Issued as a Result of the Exercise of Options and Performance Rights During the financial year, employees and executives exercised 750,000 options and 290,631 performance rights.
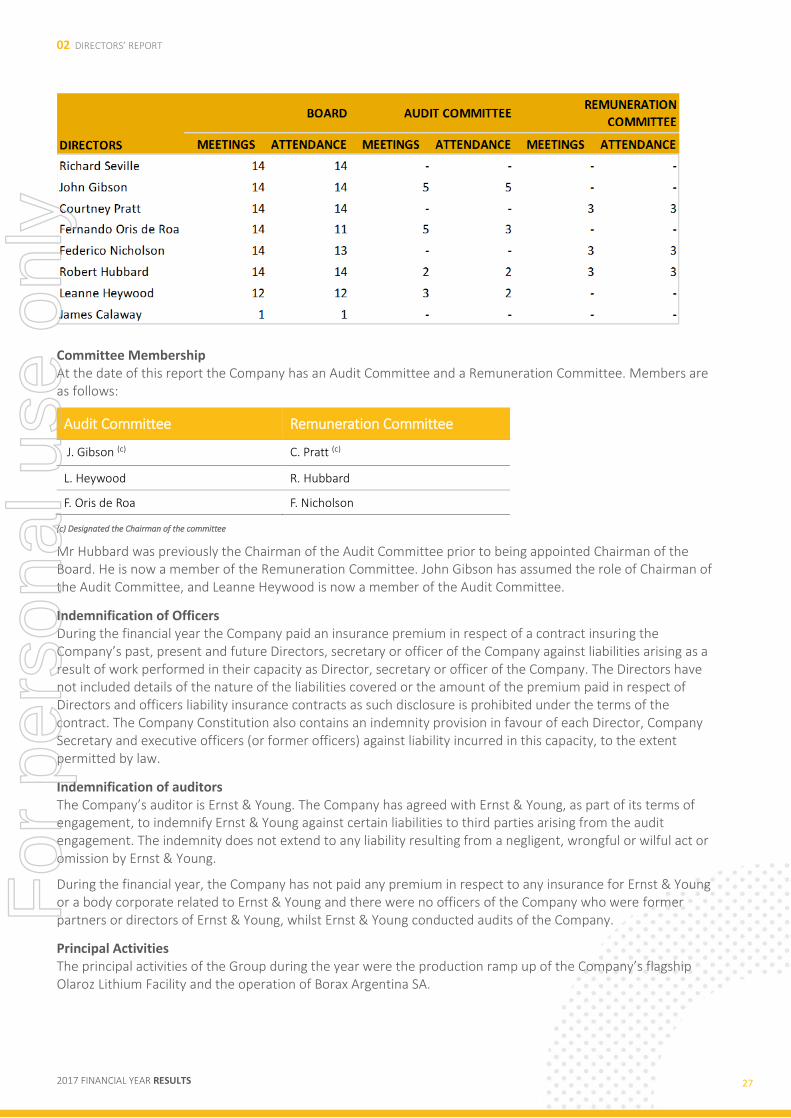
Directors The Directors of the Company at any time during or since the end of the financial year are listed below. During the year there were 14 Board meetings. The Board and Committee meetings attended by each Director were:
Directors Shares Options
Richard P. Seville 5,191,829 See below
John W. Gibson 37,900 -
Courtney Pratt 56,810 -
Fernando Oris de Roa 100,000 -
Federico Nicholson 100,000 -
Robert Hubbard 52,183 -
Leanne Heywood - -
Employee Year Granted Performance Rights Options
R. P. Seville FY 2015 150,039 -
R. P. Seville FY 2016 244,380 -
R. P. Seville FY 2017 118,721 -
For
per
sona
l use
onl
y
02 DIRECTORS’ REPORT
2017 FINANCIAL YEAR RESULTS 27
Committee Membership At the date of this report the Company has an Audit Committee and a Remuneration Committee. Members are as follows:
Audit Committee Remuneration Committee
J. Gibson (c) C. Pratt (c)
L. Heywood R. Hubbard
F. Oris de Roa F. Nicholson
(c) Designated the Chairman of the committee
Mr Hubbard was previously the Chairman of the Audit Committee prior to being appointed Chairman of the Board. He is now a member of the Remuneration Committee. John Gibson has assumed the role of Chairman of the Audit Committee, and Leanne Heywood is now a member of the Audit Committee.
Indemnification of Officers During the financial year the Company paid an insurance premium in respect of a contract insuring the Company’s past, present and future Directors, secretary or officer of the Company against liabilities arising as a result of work performed in their capacity as Director, secretary or officer of the Company. The Directors have not included details of the nature of the liabilities covered or the amount of the premium paid in respect of Directors and officers liability insurance contracts as such disclosure is prohibited under the terms of the contract. The Company Constitution also contains an indemnity provision in favour of each Director, Company Secretary and executive officers (or former officers) against liability incurred in this capacity, to the extent permitted by law. Indemnification of auditors The Company’s auditor is Ernst & Young. The Company has agreed with Ernst & Young, as part of its terms of engagement, to indemnify Ernst & Young against certain liabilities to third parties arising from the audit engagement. The indemnity does not extend to any liability resulting from a negligent, wrongful or wilful act or omission by Ernst & Young.
During the financial year, the Company has not paid any premium in respect to any insurance for Ernst & Young or a body corporate related to Ernst & Young and there were no officers of the Company who were former partners or directors of Ernst & Young, whilst Ernst & Young conducted audits of the Company.
Principal Activities The principal activities of the Group during the year were the production ramp up of the Company’s flagship Olaroz Lithium Facility and the operation of Borax Argentina SA.
For
per
sona
l use
onl
y
02 DIRECTORS’ REPORT
2017 FINANCIAL YEAR RESULTS 28
Operating and Financial Review The Group’s profit/(loss) for the year, after applicable share of net losses of joint venture, income tax and non-controlling interests was US $19,438,572 (2016:(US $21,892,443)). Group exploration and evaluation expenditure for the year totalled US $454,339 (2016: US $248,077). The Olaroz Joint Venture is operated through SDJ SA a 91.5% owned subsidiary of SDJ PTE, a Singaporean company that both Orocobre (72.68%) and TTC (27.32%) are shareholders in directly and indirectly respectively. The effective Olaroz Lithium Facility equity interest is Orocobre 66.5%, TTC 25.0% and Jujuy Energia y Minera Sociedad del Estado (JEMSE) 8.5%. A diagram of the joint venture is contained in the Review of Operations. Since the creation of the joint venture between the Company and TTC, the Company has recognised its interest in the joint venture as an equity accounted investment. Under the equity method of accounting, Orocobre’s interest in the joint venture is recognised on the balance sheet at fair value. This carrying amount is then adjusted for subsequent equity investments, the Company’s share of profit or loss of the joint venture and any dividends received. As a result, capital expenditure by the joint venture and draw downs on the project financing facility will not be recognised directly in the Group’s financial statements. However, financial statements of the joint venture SDJ PTE have been included in note 15 of the Group’s consolidated statements.
The Parent entity changed its functional currency from Australian dollars (AUD) to United States dollars (USD) in the 2017 financial year. These changes reduced the impact of movements in exchange rates on reported results and provide shareholders with a more accurate reflection of the Group’s and its Joint Venture’s underlying performance, given a large majority of its revenues are generated in USD.
Financial Position The net assets of the Orocobre group increased to US $218,019,941 (2016: US $189,426,989) during the year to 30 June 2017, including cash balances of US $51,631,577 (2016: US $35,835,332). The main reasons for the increase in net assets is due to the total comprehensive income for the year of US$19,415,506 and net cash increase of US$16,541,970. Significant Changes in the State of Affairs Other than matters mentioned in this report, there were no significant changes in the state of affairs of the Company during the financial year.
Significant Events after Balance Sheet Date There were no significant events after Balance Sheet Date.
Likely Developments and Expected Results Refer to the Operating and Financial Review for information on likely developments and future prospects of the Group.
Risk Management Orocobre’s business faces certain risks that could affect the success of the strategies and the outlook for future financial years. These include, but are not limited to, the ongoing development of good operating practice, optimisation of plant performance and the associated production ramp up and production of product within the required specification at the Olaroz Lithium Facility and the timing thereof; the achievement of the design production rate for lithium carbonate, the expected brine grade and the expected operating costs and recoveries at the Olaroz Lithium Facility and the comparison of such costs to expected global operating costs, the ongoing working relationship between Orocobre and the Province of Jujuy (JEMSE), TTC and Mizuho Bank and the meeting of relevant banking covenants in respect to the operation of the Olaroz Lithium Facility. With respect to Borax Argentina the risks associated with the business are the weaknesses in the Company’s traditional markets and strong competition from other producers in these markets, challenges in developing new markets, and the implementation of unit cost reduction measures, local inflation and production. Other risks include Argentina sovereign risk both at a national and provincial level, changes in government regulations, policies or legislation, fluctuations or decreases in product prices and currency, the impact of inflation on local costs, the ongoing impact of devaluation of the AR$, risks associated with weather patterns and the impact on
For
per
sona
l use
onl
y
02 DIRECTORS’ REPORT
2017 FINANCIAL YEAR RESULTS 29
production rate. Readers are cautioned that the foregoing list is not exhaustive of all factors and assumptions which may have been used. Please also refer to the Caution Regarding Forward Looking Information statement.
The Company has in place risk management policies and systems to mitigate these risks wherever possible, including monitoring ongoing exploration results, monthly review of operational results for SDJ and Borax Argentina SA and continued discussions with JV partners and the government of Argentina. Within its operations in Argentina, the Company has instituted ISO 31000, Risk Management, to act comprehensively on all its areas of activity.
Environmental Regulation and Performance The Company has operations in two provinces in Argentina, Jujuy and Salta. In Salta there are Provincial and National environmental regulations: Provincial Constitution (art. 30, 81, 82 y 83), Environmental Protection Provincial Law No. 7070 and Provincial Decree No 3097/00 and 1587/03 among others, Law No. 7017 of Waters Code of Salta Province and its regulatory decree, Provincial Law No 7141 of the Mining Procedure Code, National Constitution (art 41 and 124 among others), General National Environmental Law No. 25.675 and National Law 1919 and 24.585. The applicable authority in Salta is the Mining Secretary of the Province of Salta and the Environmental Secretary of the Province of Salta.
In Jujuy there are both provincial and national environmental regulations: Provincial Constitution (art.22), Water Code of Jujuy, Law 3820 Wildlife Reserve of Fauna & Flora, Law 6002 Dangerous Residues Regulation, Decree 5772-P-2010, Provincial Environmental Law No. 5063, National Constitution (art 41), General National Environmental Law No. 25.675, National Law 24.585 and National Law 24.051 Dangerous Residues Regulation.
The applicable authority in Jujuy is the Provincial Department of Mining and Energy Resources (Dirección Provincial de Mineria y Recursos Energeticos) and the Provincial Department of Environmental Quality (Dirección Provincial de Calidad Ambiental).
There have been no reportable environmental events under the regulations in Jujuy or Salta due to the Company’s activities.
Within its’ operations in Argentina, the Company has instituted ISO 31000, Risk Management. This complements ISO 9001, Quality Assurance, ISO 14001 Environmental Management and OHSAS 18001 Occupational Health and Safety Management System which had already been implemented in FY2012. Borax Argentina is already accredited under ISO 9001.
Non-audit Services The Group’s auditor, Ernst & Young, did not undertake any non-audit services for Orocobre Limited during the current or prior year.
Auditor Independence A copy of the auditor’s independence declaration as required under section 307C of the Corporations Act 2001 is contained within this report.
Corporate Governance Statements The Company’s Corporate Governance Statement is available to view publicly on the Company’s website at www.orocobre.com.
For
per
sona
l use
onl
y
03 REMUNERATION REPORT
2017 FINANCIAL YEAR RESULTS 30
Remuneration Report - Chairman’s Letter Dear Shareholder,
We are writing this letter to provide introductory comments to this year's report. Needless to say, we were very pleased with the 99% yes vote for last year's report. We hope that this year's report will elicit equally strong support for our remuneration philosophy, plans and practices.
We continue with a philosophy that our Key Management Personnel (KMP's) and our Non-Executive Directors should receive total remuneration at approximately the median level for similar sized companies in comparable businesses.
We have had some important changes to the board of directors in the past year. James Calaway resigned as non-executive Chairman in July of 2016. Robert Hubbard was appointed to that role on the same date as Mr. Calaway's resignation. Leanne Heywood joined our board as a Non-Executive Director in September, 2016. There were no changes to our KMP group.
During the year, Mercer Consulting was appointed as remuneration consultant to our board, replacing Crichton and Associates. On the basis of their review of KMP remuneration, the COO, CFO and GC received increases in fixed remuneration of 20%, 4% and 2% respectively, to bring their fixed remuneration in line with our philosophy. The remaining KMP's did not receive an increase in TFR. We have also awarded short-term incentive (“STI”) payments to each of the KMP's in recognition of their achievements with respect to specific objectives. Details are provided in the report.
There have been no changes to Non-Executive Director compensation this financial year. We continue to be committed to communicating KMP and Non-Executive Director remuneration arrangements in a simple, clear and transparent manner. We consider the question and answer format to be particularly effective in this respect.
We once again assure you that the responsibility for governance and remuneration rests solely with the board, supported by the Remuneration committee. The objectives of this governance approach continue to ensure that the practices and processes of the company are sound and are driven by our guiding principles to deliver a world class, low cost industrial minerals and chemicals company for the benefit of our shareholders and other stakeholders.
The 2017 Remuneration Report follows this letter. This report forms part of the Directors' Report and has been audited in accordance with Section 308(C) of the Corporations Act 2001. In addition to the statutory requirements, sections summarizing remuneration for the year ended June 30, 2017 and anticipated changes for FY 2018 have been included where appropriate. Specifically for FY 18 we will further move our incentive plans to greater alignment with increases in shareholder value through the LTI programme with a corresponding reduction in the allocation to STI cash payments.
The board continues to be strongly committed to remuneration philosophy, policies and practices that are fair, competitive, effective and responsible and to their transparent and clear communication. We will continue to work diligently to ensure that these standards are met.
Courtney Pratt Non-Executive Director Chairman, Remuneration Committee/Independent Director
For
per
sona
l use
onl
y
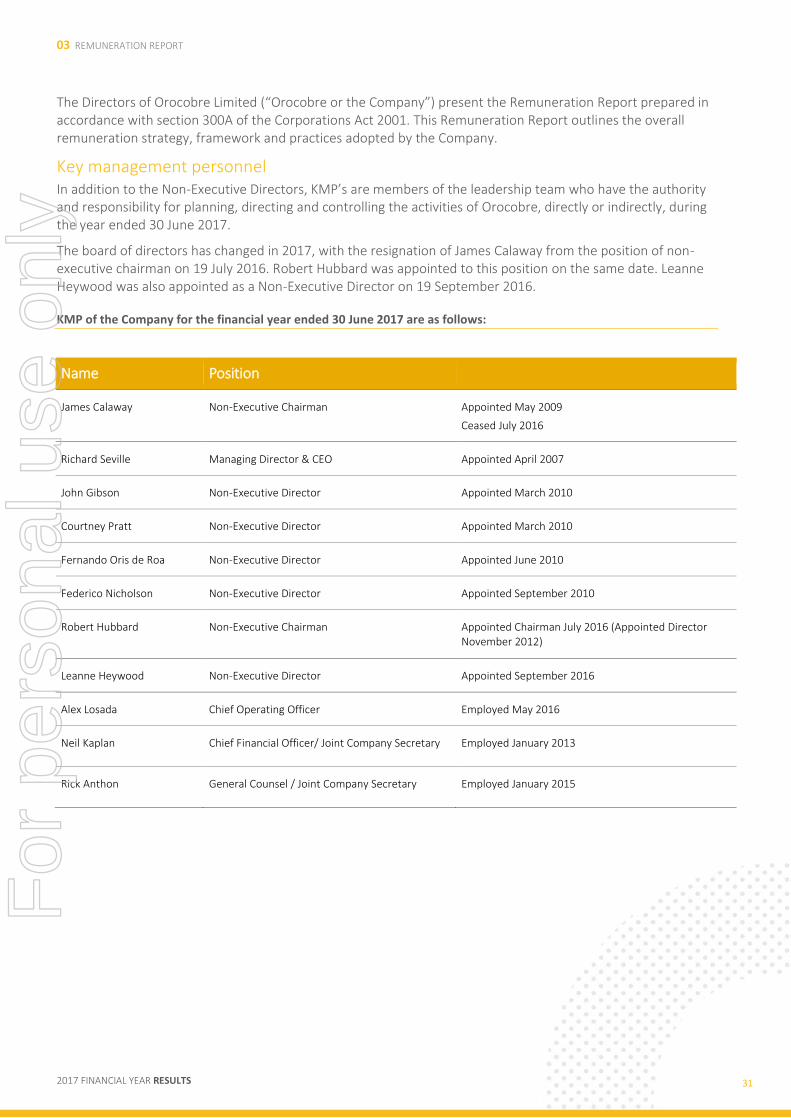
03 REMUNERATION REPORT
2017 FINANCIAL YEAR RESULTS 31
The Directors of Orocobre Limited (“Orocobre or the Company”) present the Remuneration Report prepared in accordance with section 300A of the Corporations Act 2001. This Remuneration Report outlines the overall remuneration strategy, framework and practices adopted by the Company.
Key management personnel In addition to the Non-Executive Directors, KMP’s are members of the leadership team who have the authority and responsibility for planning, directing and controlling the activities of Orocobre, directly or indirectly, during the year ended 30 June 2017.
The board of directors has changed in 2017, with the resignation of James Calaway from the position of non-executive chairman on 19 July 2016. Robert Hubbard was appointed to this position on the same date. Leanne Heywood was also appointed as a Non-Executive Director on 19 September 2016.
KMP of the Company for the financial year ended 30 June 2017 are as follows:
Name Position
James Calaway Non-Executive Chairman Appointed May 2009
Ceased July 2016
Richard Seville Managing Director & CEO Appointed April 2007
John Gibson Non-Executive Director Appointed March 2010
Courtney Pratt Non-Executive Director Appointed March 2010
Fernando Oris de Roa Non-Executive Director Appointed June 2010
Federico Nicholson Non-Executive Director Appointed September 2010
Robert Hubbard Non-Executive Chairman Appointed Chairman July 2016 (Appointed Director November 2012)
Leanne Heywood Non-Executive Director Appointed September 2016
Alex Losada Chief Operating Officer Employed May 2016
Neil Kaplan Chief Financial Officer/ Joint Company Secretary Employed January 2013
Rick Anthon General Counsel / Joint Company Secretary Employed January 2015
For
per
sona
l use
onl
y
03 REMUNERATION REPORT
2017 FINANCIAL YEAR RESULTS 32
Structure and format of this report: Remuneration information for executive KMP is reported in US Dollars (consistent with the remainder of the report). Although the contractual arrangements are in Australian Dollars the Group’s presentation currency is US Dollars.
This Remuneration Report follows a “question and answer” format. This provides a mechanism by which the Company can answer questions which have been asked previously by shareholders and other stakeholders.
Orocobre’s Remuneration Report is divided into the following sections:
a. Remuneration overview b. Role of the Remuneration Committee c. Most recent AGM Remuneration Report voting d. Non-Executive Director Remuneration e. Managing Director and Other executive KMP remuneration f. Relationship of incentives to Orocobre’s Operating and Financial Performance g. Service Agreements h. Details of Remuneration i. Share-Based Compensation Issues to the Non-Executive Directors and Executive KMP
A. Remuneration Overview At Orocobre, remuneration for the KMP is determined by reviewing what is paid for similar roles in Australia and internationally for a company that has operations in South America in order to provide a holistic view of Orocobre’s market for executive’s talent. The Company’s remuneration philosophy is articulated in Orocobre’ s Corporate Governance Charter Section D - Remuneration Committee Charter which provides that the Remuneration Committee will in accordance with clause D4 (a) of this Charter, ensure that the remuneration policies:
1. Motivate Directors and Management to pursue the long-term growth and success of the Company within an appropriate control framework; and
2. Demonstrate a clear relationship between key executive performance and remuneration.
Under clause D3 (b) paragraph (1) and (3) the Charter also states that:
1. Management should be remunerated at an appropriate balance of fixed remuneration and performance based remuneration; and
2. Any performance based remuneration should be clearly linked to specific performance targets which are aligned to the Company’s short and long-term performance objectives.
The Remuneration Committee has once again undertaken a detailed evaluation of its remuneration practices to ensure it remains contemporary and meets the objectives set out above. The Committee engaged the services of Mercer Consulting (Australia) Pty Ltd (Mercer) during the year ended 30 June 2017. Their engagement was limited to a remuneration benchmark assessment of the Board and four (4) executive KMP and a review of the 2016 Remuneration Report and consideration of the contemporary relevance of the Orocobre STI and LTI plans.
A summary of the outcomes of such advice is as follows:
1. Increases to specific KMP’s were approved as detailed in this report.
2. Non-executive Director fees were not increased.
For
per
sona
l use
onl
y
03 REMUNERATION REPORT
2017 FINANCIAL YEAR RESULTS 33
Orocobre endeavours to adopt a fair and equitable approach to all remuneration decisions, mindful of the complexities of retaining and motivating an experienced team operating across diverse geographies, significantly different time zones and in a complex operating environment.
In implementing this philosophy, Orocobre needs to consider many variables, including:
1. the remuneration paid by the Company’s peers (by reference to industry, market capitalisation and relevant geographic location);
2. the Company’s performance over the relevant period;
3. how to link remuneration to successful implementation of the Company’s strategy, including the annual targets which need to be achieved to implement that strategy;
4. internal relativities and differentiation of pay based on performance;
5. the demands placed on certain executives to work considerable periods of time overseas and outside normal working hours;
6. the size, scale, location and complexity of the operations of the Company; and
7. market developments and changes in remuneration practices.
For
per
sona
l use
onl
y

03 REMUNERATION REPORT
2017 FINANCIAL YEAR RESULTS 34
B. Role of the Remuneration Committee In accordance with best practice, the Remuneration Committee is comprised of Non-Executive Directors of which a majority are independent. It is chaired by an Independent Non-Executive Director other than the Chairman. The membership of the committee is comprised of Mr Courtney Pratt – Committee Chair, Mr Robert Hubbard and Mr Federico Nicholson as detailed in the Directors’ Report. Since James Calaway’s departure on 19 July 2016, Robert Hubbard has been appointed to the Remuneration Committee. The Remuneration Committee’s role and interaction with the Board, internal and external advisors, is further illustrated below:
Remuneration Committee Charter
The Board Reviews, applies judgment and, as appropriate, approves the Remuneration Committee’s recommendations
The Remuneration Committee The Remuneration Committee operates under the delegated authority of the Board. The Remuneration Committee is able to source internal resources and to obtain independent professional advice it considers necessary to enable it to make recommendations to the Board on the following:
Remuneration policy, strategy, quantum and mix of remuneration for executive KMP Remuneration policy and quantum for Non-Executive Directors People and talent management, policies and practices Superannuation arrangements Performance target setting and measurement for executive KMP Design and approval of employee and executive short and long-term incentive programs
External Consultants Internal Resources
For each annual remuneration review cycle, the Remuneration Committee considers whether to appoint a remuneration consultant and, if so, their scope of work. The Remuneration Consultant table below provides details with respect to the remuneration consultant who provided remuneration recommendations and other remuneration related advice in relation to the remuneration outcomes set out in this Remuneration Report. During the year a new remuneration consultant Mercer Consulting (Australia) Pty Ltd was appointed in place of Crichton & Associates Pty Ltd (Crichton).
The following table provides information regarding some of the remuneration advice and policies followed during the financial year.
For
per
sona
l use
onl
y
03 REMUNERATION REPORT
2017 FINANCIAL YEAR RESULTS 35
Remuneration Consultant
Question Response
Did a remuneration consultant provide a remuneration recommendation in relation to any of the KMP for the financial year?
Yes, Mercer provided remuneration recommendations and remuneration related advice to the Remuneration Committee, including in relation to: the benchmarking against the Company’s peers and the maximum aggregate fee pool for Non-Executive Directors.
The Remuneration Consultant has advised that there was no undue influence from any Committee Member or executive KMP on any of their work during the year (Mercer Consulting (Australia) Pty Ltd is an Australian proprietary company experienced in Board and Executive remuneration).
What was the remuneration consultant paid by the Company for remuneration related services?
Mercer was paid a total of US$25,637 for remuneration consulting services.
Did the remuneration consultant provide any other advice to the Company?
Mercer was paid a total of US$5,881 for reporting advice.
What arrangements did the Company make to ensure that the making of the remuneration recommendation would be free from undue influence by the KMP?
The Company made the following arrangements:
The recommendations are solely made by the Remuneration Committee with limited liaison between Mercer and the CEO.
The Company has implemented a procedure requiring the Remuneration Committee to have direct contact with Mercer for procuring advice relating to KMP remuneration. The procedure contained a process whereby the Remuneration Committee is responsible for the engagement, formally and in writing, of any remuneration consultants, the provision of information to the remuneration consultant, and the direct communication of remuneration recommendations, in writing.
The remuneration consultant agreed to adhere to the protocol procedures and was required to advise the Remuneration Committee whether or not it had been subjected to undue influence.
Is the Board satisfied that the remuneration recommendation was free from any such undue influence? What are the reasons for the Board being satisfied?
Yes, the Board is satisfied. The reasons are as follows:
The protocol with respect to the procurement of remuneration related advice was adhered to, including with respect to engagement of the remuneration consultant, the provision of information to the remuneration consultant and the communication of remuneration recommendations.
The Remuneration Committee consulted on several occasions with the remuneration consultant in the absence of the executive KMP. There were no concerns raised by the remuneration consultant with respect to any undue influence being exerted by the executive KMP.
The Remuneration Committee did not observe any evidence that undue influence had been applied.
For
per
sona
l use
onl
y
03 REMUNERATION REPORT
2017 FINANCIAL YEAR RESULTS 36
C. Most recent AGM Remuneration Report voting At the most recent Annual General Meeting held on 23 November 2016, 99.05% of votes cast at the meeting were in favour of the adoption of the Remuneration Report.
D. Non-Executive Director Remuneration
Objective The objective is to set remuneration at a level which attracts and retains Non-Executive Directors of the requisite expertise and experience at a cost acceptable to shareholders.
Structure The maximum aggregate remuneration of Non-Executive Directors is determined by the shareholders at a general meeting. The current aggregate fee pool is A$600,000 (US $461,500) which was established and approved at the 2012 AGM. A resolution will be put to the 2017 AGM to increase the pool to A$650,000 (US $500,000)
There have been no changes to the Non-Executive Directors and the total fees paid are within the current aggregate fee pool as detailed above. Fees to Non-Executive Directors retain a conservative bias and continue to be positioned between the 25th percentile level and median of all companies identified in the peer benchmarking exercise.
In addition to his Non- Executive Director remuneration the former Chairman was paid a fee per annum for the performance of special functional duties additional to the normal scope of a Non-Executive Chairman. No such fees are paid to the current Chairman.
From 1 March 2017 Fernando Oris de Roa, a director, was given an expanded role encompassing specific tasks in Argentina as advised by the CEO. For such role, he will be paid US$48,000 per annum.
Other Non-Executive Directors are paid a base fee only. No separate Committee fees are paid.
Non-Executive Directors do not participate in any short or long-term incentive schemes of the Company.
On appointment to the Board, all Non-Executive Directors enter into a service agreement with the Company in the form of a letter of appointment which details remuneration arrangements.
For
per
sona
l use
onl
y
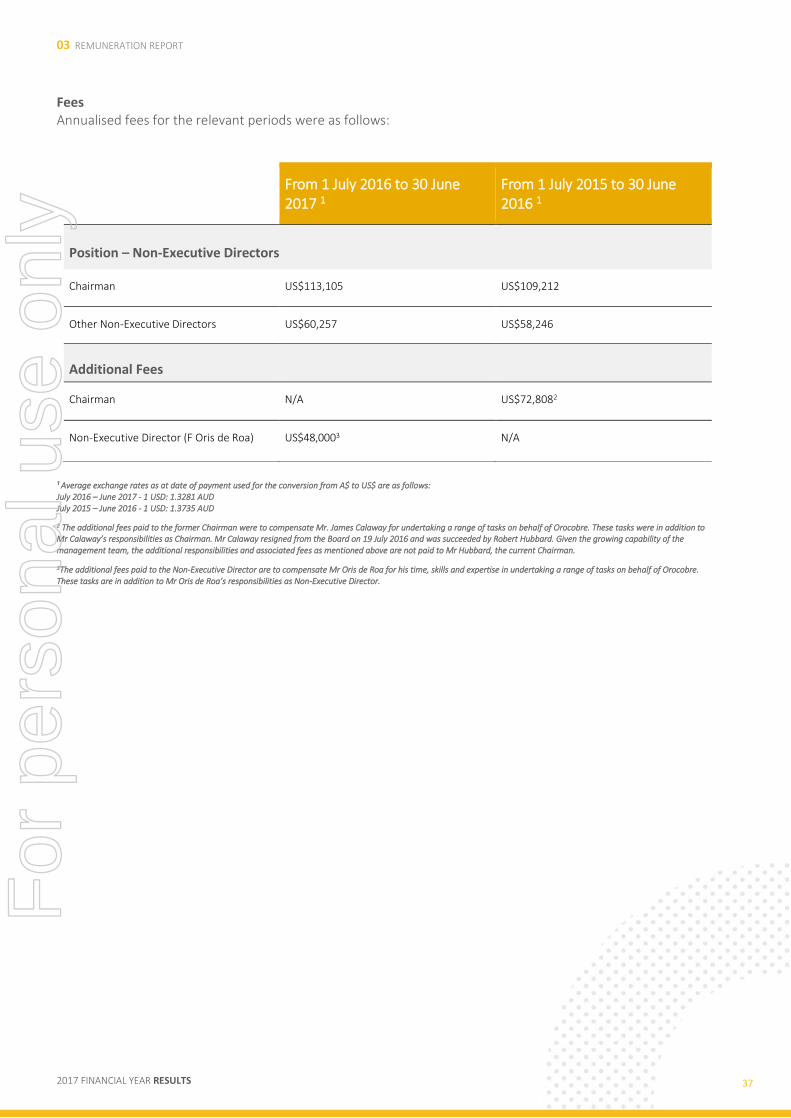
03 REMUNERATION REPORT
2017 FINANCIAL YEAR RESULTS 37
Fees Annualised fees for the relevant periods were as follows:
From 1 July 2016 to 30 June 2017 1
From 1 July 2015 to 30 June 2016 1
Position – Non-Executive Directors
Chairman US$113,105 US$109,212
Other Non-Executive Directors US$60,257 US$58,246
Additional Fees
Chairman N/A US$72,8082
Non-Executive Director (F Oris de Roa) US$48,0003 N/A
¹ Average exchange rates as at date of payment used for the conversion from A$ to US$ are as follows: July 2016 – June 2017 - 1 USD: 1.3281 AUD July 2015 – June 2016 - 1 USD: 1.3735 AUD
2 The additional fees paid to the former Chairman were to compensate Mr. James Calaway for undertaking a range of tasks on behalf of Orocobre. These tasks were in addition to Mr Calaway’s responsibilities as Chairman. Mr Calaway resigned from the Board on 19 July 2016 and was succeeded by Robert Hubbard. Given the growing capability of the management team, the additional responsibilities and associated fees as mentioned above are not paid to Mr Hubbard, the current Chairman.
3The additional fees paid to the Non-Executive Director are to compensate Mr Oris de Roa for his time, skills and expertise in undertaking a range of tasks on behalf of Orocobre. These tasks are in addition to Mr Oris de Roa’s responsibilities as Non-Executive Director.
For
per
sona
l use
onl
y
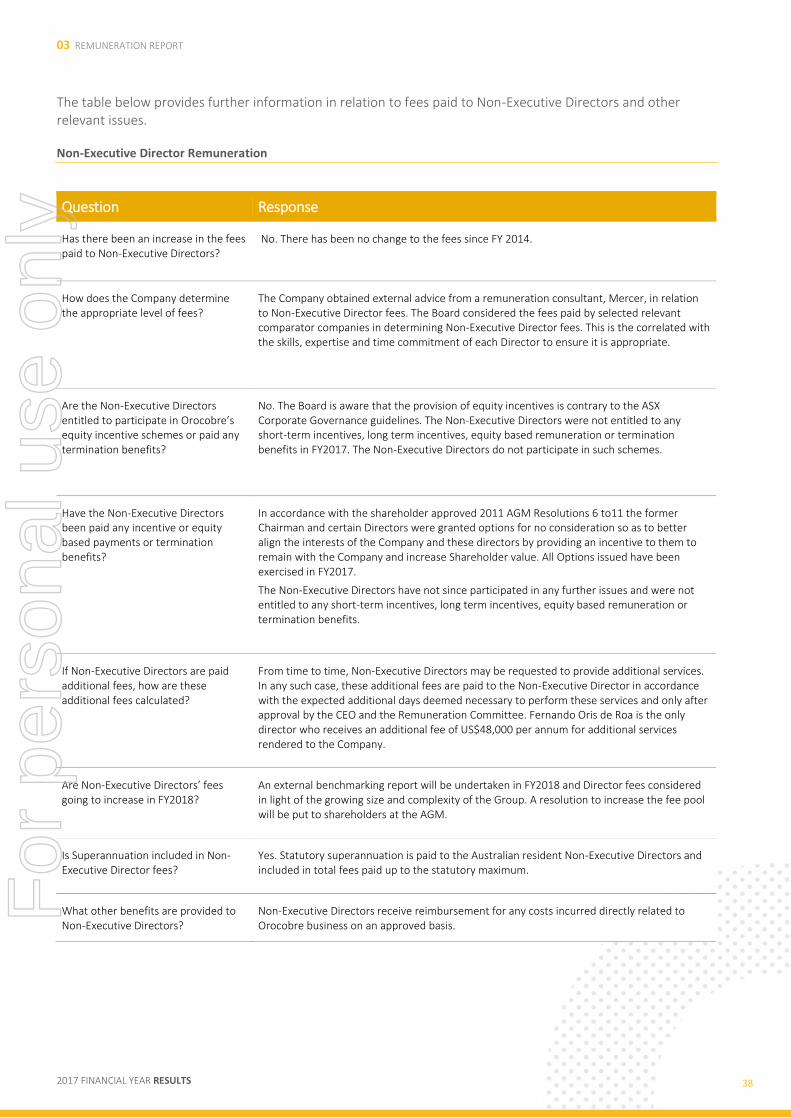
03 REMUNERATION REPORT
2017 FINANCIAL YEAR RESULTS 38
The table below provides further information in relation to fees paid to Non-Executive Directors and other relevant issues.
Non-Executive Director Remuneration
Question Response
Has there been an increase in the fees paid to Non-Executive Directors?
No. There has been no change to the fees since FY 2014.
How does the Company determine the appropriate level of fees?
The Company obtained external advice from a remuneration consultant, Mercer, in relation to Non-Executive Director fees. The Board considered the fees paid by selected relevant comparator companies in determining Non-Executive Director fees. This is the correlated with the skills, expertise and time commitment of each Director to ensure it is appropriate.
Are the Non-Executive Directors entitled to participate in Orocobre’s equity incentive schemes or paid any termination benefits?
No. The Board is aware that the provision of equity incentives is contrary to the ASX Corporate Governance guidelines. The Non-Executive Directors were not entitled to any short-term incentives, long term incentives, equity based remuneration or termination benefits in FY2017. The Non-Executive Directors do not participate in such schemes.
Have the Non-Executive Directors been paid any incentive or equity based payments or termination benefits?
In accordance with the shareholder approved 2011 AGM Resolutions 6 to11 the former Chairman and certain Directors were granted options for no consideration so as to better align the interests of the Company and these directors by providing an incentive to them to remain with the Company and increase Shareholder value. All Options issued have been exercised in FY2017.
The Non-Executive Directors have not since participated in any further issues and were not entitled to any short-term incentives, long term incentives, equity based remuneration or termination benefits.
If Non-Executive Directors are paid additional fees, how are these additional fees calculated?
From time to time, Non-Executive Directors may be requested to provide additional services. In any such case, these additional fees are paid to the Non-Executive Director in accordance with the expected additional days deemed necessary to perform these services and only after approval by the CEO and the Remuneration Committee. Fernando Oris de Roa is the only director who receives an additional fee of US$48,000 per annum for additional services rendered to the Company.
Are Non-Executive Directors’ fees going to increase in FY2018?
An external benchmarking report will be undertaken in FY2018 and Director fees considered in light of the growing size and complexity of the Group. A resolution to increase the fee pool will be put to shareholders at the AGM.
Is Superannuation included in Non-Executive Director fees?
Yes. Statutory superannuation is paid to the Australian resident Non-Executive Directors and included in total fees paid up to the statutory maximum.
What other benefits are provided to Non-Executive Directors?
Non-Executive Directors receive reimbursement for any costs incurred directly related to Orocobre business on an approved basis.
For
per
sona
l use
onl
y
03 REMUNERATION REPORT
2017 FINANCIAL YEAR RESULTS 39
Minimum shareholding guidelines The Board has no approved minimum shareholding guidelines for Non-Executive Directors at the date of this Report. However, generally Non-Executive Directors have appropriate shareholdings and the Board will continue to review investor expectations in relation to this matter.
E. Managing Director and Other Executive KMP Remuneration
Objective As indicated in the following table regarding KMP remuneration objectives, Orocobre’s objective in structuring its remuneration for executive KMP is to cultivate a performance based culture where competitive remuneration, benefits and rewards are aligned with Orocobre’s objectives and where merit forms the basis of performance based pay and promotion. In addition, Orocobre seeks to attract, engage and retain high-calibre employees to meet the Company’s current and future business needs.
Structure Remuneration consists of the following key elements:
1. Fixed Remuneration (FR);
2. Short Term Incentive (STI); and
3. Long Term Incentive (LTI).
The amount and relative proportion of Fixed Remuneration (which includes superannuation contributions), STI and LTI is established for each executive following consideration by the Remuneration Committee of market levels of remuneration for comparable executive roles and the internal relativities between executive roles.
For the annual remuneration review which resulted in the outcomes detailed in this remuneration report, the Remuneration Committee received expert advice from Mercer as its independent external remuneration consultant.
For
per
sona
l use
onl
y
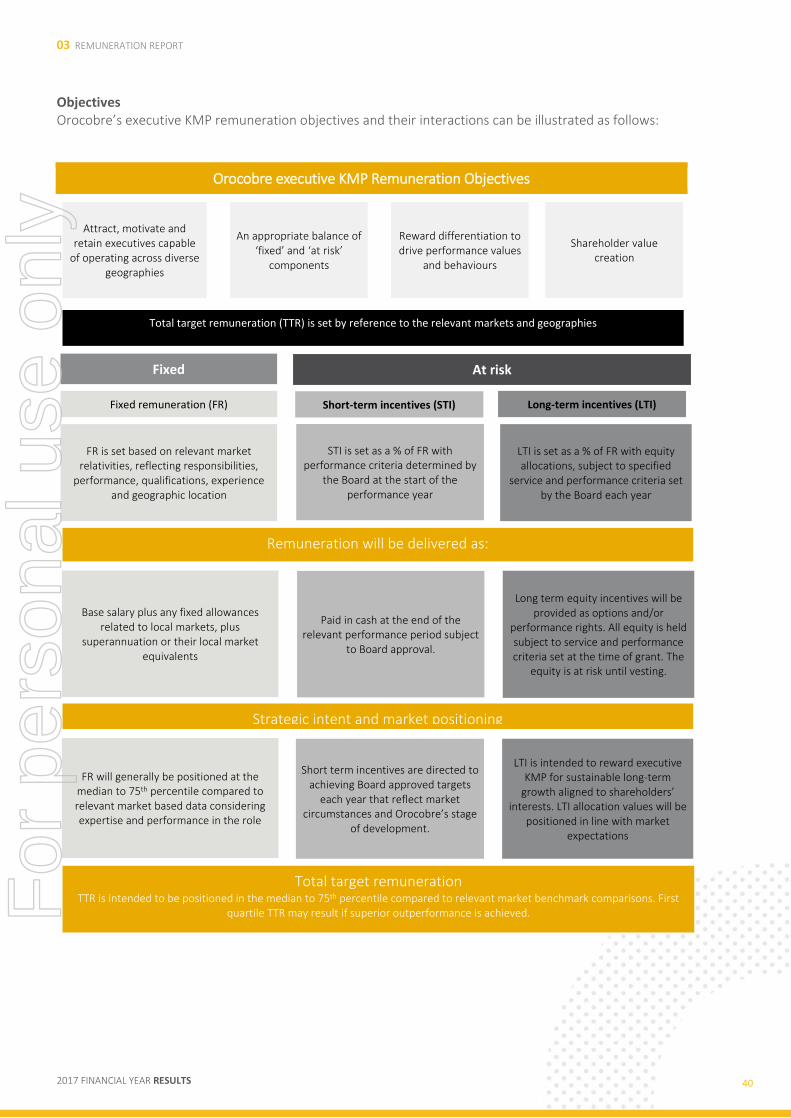
03 REMUNERATION REPORT
2017 FINANCIAL YEAR RESULTS 40
Objectives Orocobre’s executive KMP remuneration objectives and their interactions can be illustrated as follows:
Orocobre executive KMP Remuneration Objectives
Attract, motivate and retain executives capable
of operating across diverse geographies
An appropriate balance of ‘fixed’ and ‘at risk’
components
Reward differentiation to drive performance values
and behaviours
Shareholder value creation
Total target remuneration (TTR) is set by reference to the relevant markets and geographies
Fixed remuneration (FR)
FR is set based on relevant market relativities, reflecting responsibilities,
performance, qualifications, experience and geographic location
Base salary plus any fixed allowances related to local markets, plus
superannuation or their local market equivalents
Remuneration will be delivered as:
At risk
Short-term incentives (STI) Long-term incentives (LTI)
Paid in cash at the end of the relevant performance period subject
to Board approval.
Long term equity incentives will be provided as options and/or
performance rights. All equity is held subject to service and performance criteria set at the time of grant. The
equity is at risk until vesting.
Strategic intent and market positioning
Short term incentives are directed to achieving Board approved targets
each year that reflect market circumstances and Orocobre’s stage
of development.
Total target remuneration TTR is intended to be positioned in the median to 75th percentile compared to relevant market benchmark comparisons. First
quartile TTR may result if superior outperformance is achieved.
Fixed
STI is set as a % of FR with performance criteria determined by
the Board at the start of the performance year
LTI is set as a % of FR with equity allocations, subject to specified
service and performance criteria set by the Board each year
FR will generally be positioned at the median to 75th percentile compared to relevant market based data considering expertise and performance in the role
LTI is intended to reward executive KMP for sustainable long-term
growth aligned to shareholders’ interests. LTI allocation values will be
positioned in line with market expectations
For
per
sona
l use
onl
y

03 REMUNERATION REPORT
2017 FINANCIAL YEAR RESULTS 41
Remuneration Mix As set out in the remuneration objectives above Orocobre intends to provide an appropriate mix of remuneration components balanced between fixed and ‘at risk’ components. The broad remuneration composition for Orocobre executive KMP in FY2017 and proposed for FY2018 can be illustrated as follows:
Current Remuneration Mix – FY2017
Position FR STI LTI
CEO / Managing Director 39% 32% 29%
Other Executives
Chief Financial Officer Chief Operating Officer General Counsel
•
•
• General Manager of Operations
• General Counsel
52%
52%
52%
17%
17%
17%
31%
31%
31%
Proposed Remuneration Mix – FY2018 In 2017 the Remuneration Committee commenced a review of the balance of STI and LTI to appropriately motivate its KMPs and align their interests more closely with shareholders. This review considered the opportunities available to Orocobre, the state of the lithium market, the retention benefits of LTI plans and was supported by comparative benchmarking by Mercer. Overall the Non-Executive Directors believe shareholders would benefit from greater alignment between KMP reward and growth in shareholder value and hence greater balance to the LTI component. Orocobre will advise shareholders when this review is completed and its implications for KMP incentive structures.
An explanation of the individual elements of executive KMP remuneration is as follows:
Fixed Remuneration (FR) At Orocobre, the purpose of Fixed Remuneration is to provide a base level of remuneration which is market competitive and appropriate. Fixed Remuneration is inclusive of superannuation.
Fixed Remuneration is reviewed annually. Any adjustments to the Fixed Remuneration for the CEO and executive KMP must be approved by the Board which considers the recommendations of the Remuneration Committee.
Changes in Fixed Remuneration for executive KMP during the year The executive KMP received the following increase in their Total Fixed Remuneration to reflect the growth and increasing complexity of the Company. Based on Mercer’s independent external remuneration benchmark assessment, the fixed remuneration was adjusted as follows. No fixed remuneration increase was provided to the CEO.
For
per
sona
l use
onl
y
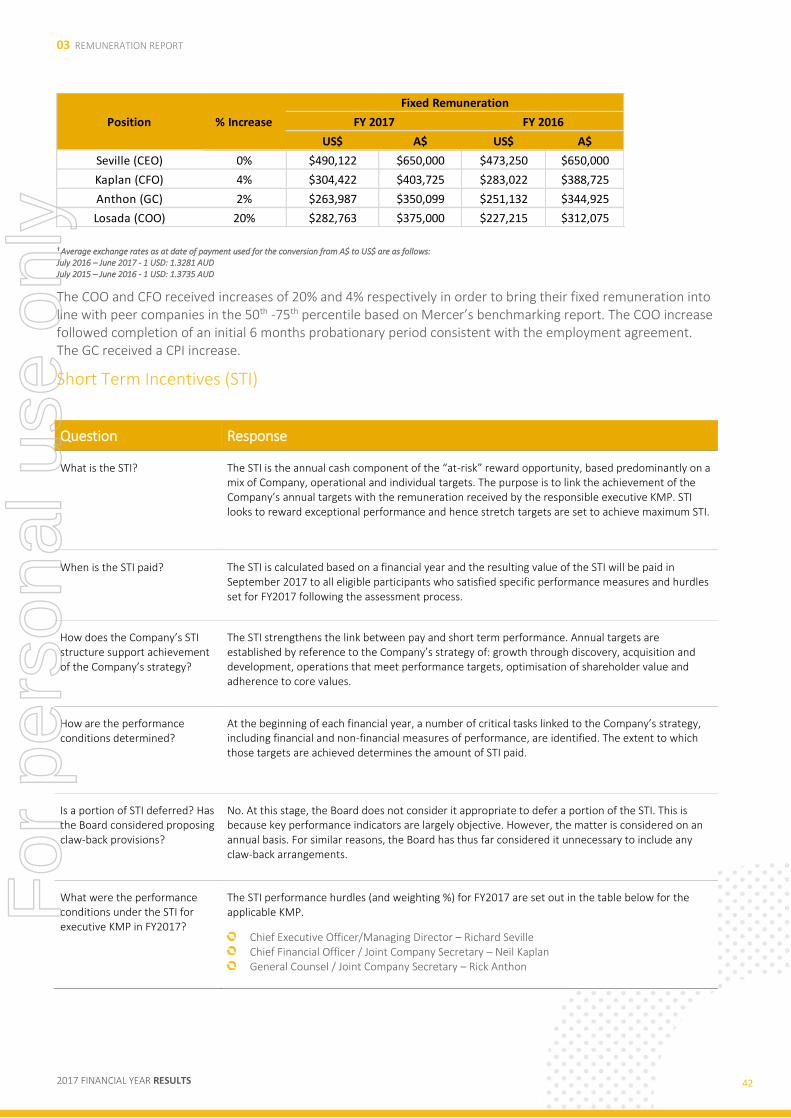
03 REMUNERATION REPORT
2017 FINANCIAL YEAR RESULTS 42
¹ Average exchange rates as at date of payment used for the conversion from A$ to US$ are as follows: July 2016 – June 2017 - 1 USD: 1.3281 AUD July 2015 – June 2016 - 1 USD: 1.3735 AUD
The COO and CFO received increases of 20% and 4% respectively in order to bring their fixed remuneration into line with peer companies in the 50th -75th percentile based on Mercer’s benchmarking report. The COO increase followed completion of an initial 6 months probationary period consistent with the employment agreement. The GC received a CPI increase.
Short Term Incentives (STI)
Question Response
What is the STI? The STI is the annual cash component of the “at-risk” reward opportunity, based predominantly on a mix of Company, operational and individual targets. The purpose is to link the achievement of the Company’s annual targets with the remuneration received by the responsible executive KMP. STI looks to reward exceptional performance and hence stretch targets are set to achieve maximum STI.
When is the STI paid? The STI is calculated based on a financial year and the resulting value of the STI will be paid in September 2017 to all eligible participants who satisfied specific performance measures and hurdles set for FY2017 following the assessment process.
How does the Company’s STI structure support achievement of the Company’s strategy?
The STI strengthens the link between pay and short term performance. Annual targets are established by reference to the Company’s strategy of: growth through discovery, acquisition and development, operations that meet performance targets, optimisation of shareholder value and adherence to core values.
How are the performance conditions determined?
At the beginning of each financial year, a number of critical tasks linked to the Company’s strategy, including financial and non-financial measures of performance, are identified. The extent to which those targets are achieved determines the amount of STI paid.
Is a portion of STI deferred? Has the Board considered proposing claw-back provisions?
No. At this stage, the Board does not consider it appropriate to defer a portion of the STI. This is because key performance indicators are largely objective. However, the matter is considered on an annual basis. For similar reasons, the Board has thus far considered it unnecessary to include any claw-back arrangements.
What were the performance conditions under the STI for executive KMP in FY2017?
The STI performance hurdles (and weighting %) for FY2017 are set out in the table below for the applicable KMP.
Chief Executive Officer/Managing Director – Richard Seville Chief Financial Officer / Joint Company Secretary – Neil Kaplan General Counsel / Joint Company Secretary – Rick Anthon
US$ A$ US$ A$
Seville (CEO) 0% $490,122 $650,000 $473,250 $650,000
Kaplan (CFO) 4% $304,422 $403,725 $283,022 $388,725
Anthon (GC) 2% $263,987 $350,099 $251,132 $344,925
Losada (COO) 20% $282,763 $375,000 $227,215 $312,075
% IncreasePosition
Fixed Remuneration
FY 2016FY 2017
For
per
sona
l use
onl
y
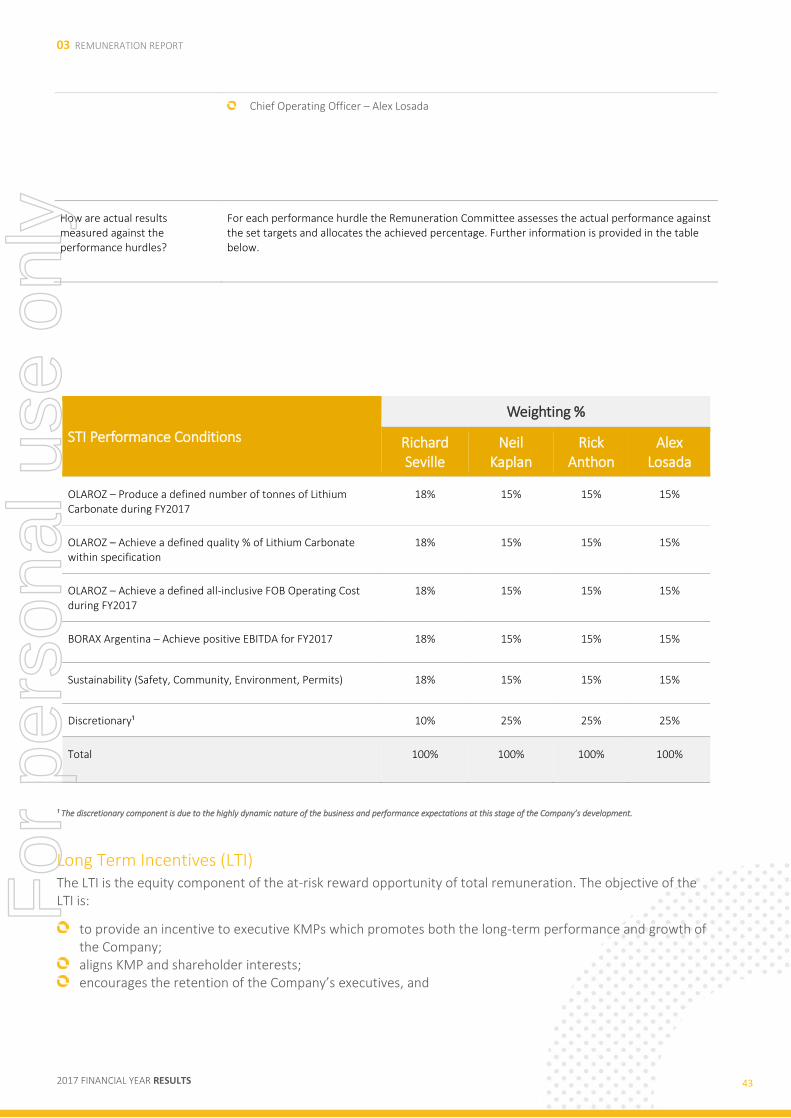
03 REMUNERATION REPORT
2017 FINANCIAL YEAR RESULTS 43
Chief Operating Officer – Alex Losada
How are actual results measured against the performance hurdles?
For each performance hurdle the Remuneration Committee assesses the actual performance against the set targets and allocates the achieved percentage. Further information is provided in the table below.
STI Performance Conditions
Weighting %
Richard Seville
Neil Kaplan
Rick Anthon
Alex Losada
OLAROZ – Produce a defined number of tonnes of Lithium Carbonate during FY2017
18% 15% 15% 15%
OLAROZ – Achieve a defined quality % of Lithium Carbonate within specification
18% 15% 15% 15%
OLAROZ – Achieve a defined all-inclusive FOB Operating Cost during FY2017
18% 15% 15% 15%
BORAX Argentina – Achieve positive EBITDA for FY2017 18% 15% 15% 15%
Sustainability (Safety, Community, Environment, Permits) 18% 15% 15% 15%
Discretionary¹ 10% 25% 25% 25%
Total 100% 100% 100% 100%
¹ The discretionary component is due to the highly dynamic nature of the business and performance expectations at this stage of the Company’s development.
Long Term Incentives (LTI) The LTI is the equity component of the at-risk reward opportunity of total remuneration. The objective of the LTI is:
to provide an incentive to executive KMPs which promotes both the long-term performance and growth of the Company;
aligns KMP and shareholder interests; encourages the retention of the Company’s executives, and
For
per
sona
l use
onl
y

03 REMUNERATION REPORT
2017 FINANCIAL YEAR RESULTS 44
the attraction of new executives and/or officers to the group.
For FY2017, the Company provided the LTI to executive KMPs through the Performance Rights and Option Plan (PROP). This plan was approved by shareholders at the 2012 Annual General Meeting. The Managing Director’s LTI grant was approved at a General Meeting of shareholders held on 23rd November 2016.
The remuneration table in section H provide details of LTI grants to executive KMPs. The tables also detail the vesting periods and lapses under the PROP. The following table summarises the key features of the LTI issued to the executive KMPs for the year ended 30 June 2017.
Performance Rights and Option Plan
Question Response
What is the PROP? Introduced in November 2012, the PROP is a contemporary equity incentive plan which allows the Company to provide either Performance Rights or Options to eligible and invited employees, subject to the terms of the plan. PROP is supported by the Orocobre Employee Share Scheme Trust which has been established to facilitate and manage the issue or acquisition of shares on the settlement of vested Rights or Options, if any.
How does the PROP align the interests of shareholders and executives?
The PROP links rewards for executives to the Company’s strategy which drives the creation of long term shareholder wealth – the greater the performance of the Company, the greater the return to the executives; and vesting of shares only occurs with the successful completion of performance requirements and time-based conditions as determined by the Board.
How does the PROP support the retention of executives?
An objective of offering equity incentives under the PROP is to assist in the reward, retention and motivation of eligible and invited key executives. If an executive resigns they would forfeit the benefit of those unvested rewards unless the Board determines otherwise. There is a 3 year vesting period.
What are the principal terms of the issue made under the PROP in 2016?
Under the PROP in 2017 the KMP’s were invited to apply for Performance Rights.
The rights were granted on 23rd November 2016. The vesting date for the performance rights is the later of 31 August 2019 or date of release of the company’s financial results for the 2018/2019 financial year.
Vesting of the 2017 Performance Rights are subject to the matrix of outcomes as set out in section F – Long Term Incentives. The shares acquired on vesting of Performance Rights, if any, will be at no cost to the KMP’s as long as they meet the conditions. F
or p
erso
nal u
se o
nly
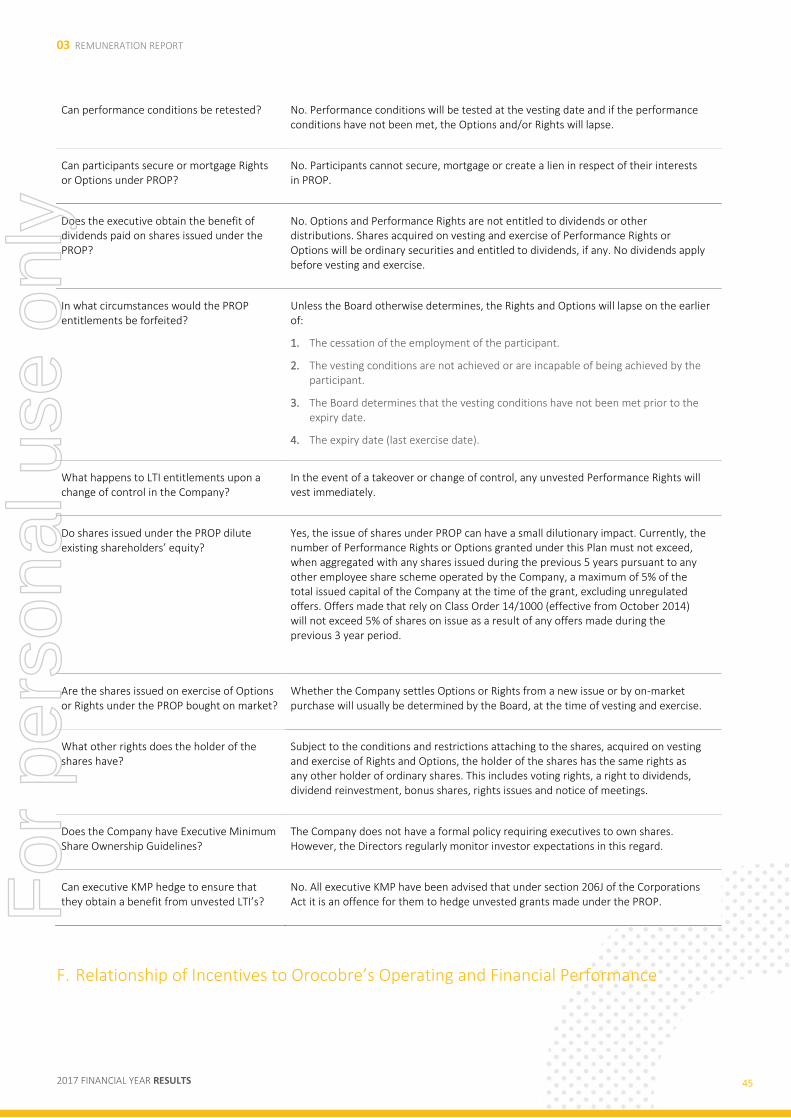
03 REMUNERATION REPORT
2017 FINANCIAL YEAR RESULTS 45
Can performance conditions be retested? No. Performance conditions will be tested at the vesting date and if the performance conditions have not been met, the Options and/or Rights will lapse.
Can participants secure or mortgage Rights or Options under PROP?
No. Participants cannot secure, mortgage or create a lien in respect of their interests in PROP.
Does the executive obtain the benefit of dividends paid on shares issued under the PROP?
No. Options and Performance Rights are not entitled to dividends or other distributions. Shares acquired on vesting and exercise of Performance Rights or Options will be ordinary securities and entitled to dividends, if any. No dividends apply before vesting and exercise.
In what circumstances would the PROP entitlements be forfeited?
Unless the Board otherwise determines, the Rights and Options will lapse on the earlier of:
1. The cessation of the employment of the participant.
2. The vesting conditions are not achieved or are incapable of being achieved by the participant.
3. The Board determines that the vesting conditions have not been met prior to the expiry date.
4. The expiry date (last exercise date).
What happens to LTI entitlements upon a change of control in the Company?
In the event of a takeover or change of control, any unvested Performance Rights will vest immediately.
Do shares issued under the PROP dilute existing shareholders’ equity?
Yes, the issue of shares under PROP can have a small dilutionary impact. Currently, the number of Performance Rights or Options granted under this Plan must not exceed, when aggregated with any shares issued during the previous 5 years pursuant to any other employee share scheme operated by the Company, a maximum of 5% of the total issued capital of the Company at the time of the grant, excluding unregulated offers. Offers made that rely on Class Order 14/1000 (effective from October 2014) will not exceed 5% of shares on issue as a result of any offers made during the previous 3 year period.
Are the shares issued on exercise of Options or Rights under the PROP bought on market?
Whether the Company settles Options or Rights from a new issue or by on-market purchase will usually be determined by the Board, at the time of vesting and exercise.
What other rights does the holder of the shares have?
Subject to the conditions and restrictions attaching to the shares, acquired on vesting and exercise of Rights and Options, the holder of the shares has the same rights as any other holder of ordinary shares. This includes voting rights, a right to dividends, dividend reinvestment, bonus shares, rights issues and notice of meetings.
Does the Company have Executive Minimum Share Ownership Guidelines?
The Company does not have a formal policy requiring executives to own shares. However, the Directors regularly monitor investor expectations in this regard.
Can executive KMP hedge to ensure that they obtain a benefit from unvested LTI’s?
No. All executive KMP have been advised that under section 206J of the Corporations Act it is an offence for them to hedge unvested grants made under the PROP.
F. Relationship of Incentives to Orocobre’s Operating and Financial Performance
For
per
sona
l use
onl
y
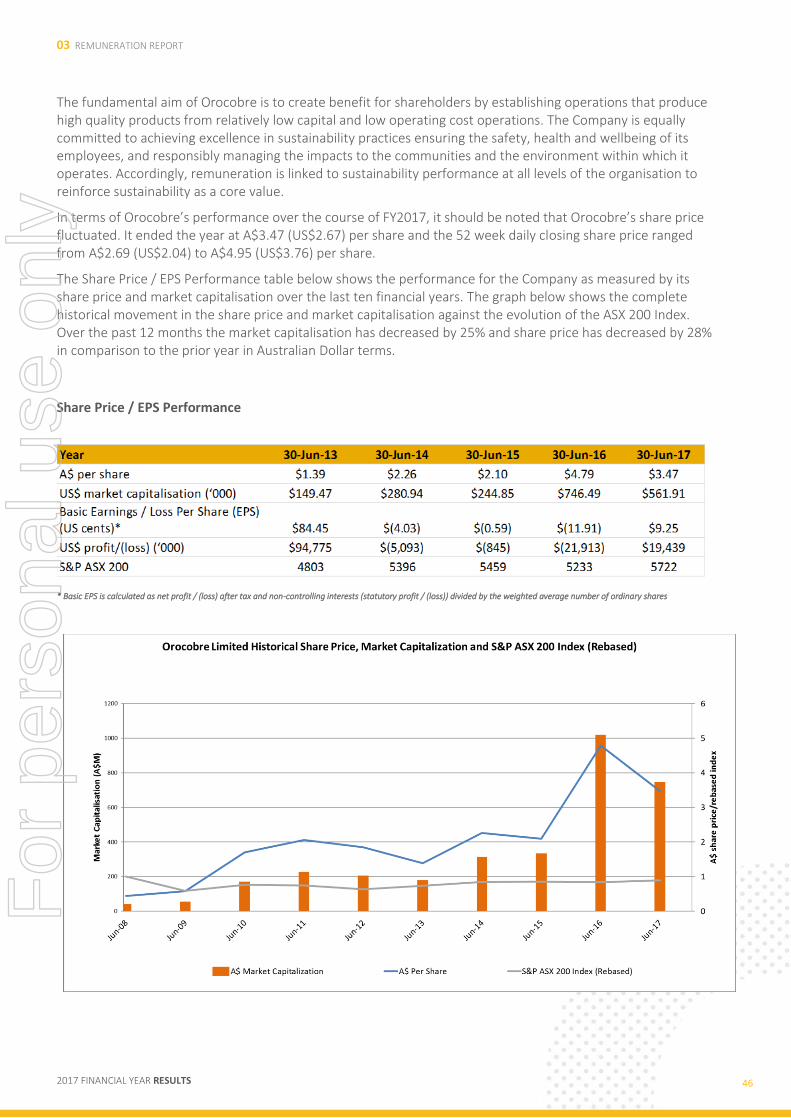
03 REMUNERATION REPORT
2017 FINANCIAL YEAR RESULTS 46
The fundamental aim of Orocobre is to create benefit for shareholders by establishing operations that produce high quality products from relatively low capital and low operating cost operations. The Company is equally committed to achieving excellence in sustainability practices ensuring the safety, health and wellbeing of its employees, and responsibly managing the impacts to the communities and the environment within which it operates. Accordingly, remuneration is linked to sustainability performance at all levels of the organisation to reinforce sustainability as a core value.
In terms of Orocobre’s performance over the course of FY2017, it should be noted that Orocobre’s share price fluctuated. It ended the year at A$3.47 (US$2.67) per share and the 52 week daily closing share price ranged from A$2.69 (US$2.04) to A$4.95 (US$3.76) per share.
The Share Price / EPS Performance table below shows the performance for the Company as measured by its share price and market capitalisation over the last ten financial years. The graph below shows the complete historical movement in the share price and market capitalisation against the evolution of the ASX 200 Index. Over the past 12 months the market capitalisation has decreased by 25% and share price has decreased by 28% in comparison to the prior year in Australian Dollar terms.
Share Price / EPS Performance
* Basic EPS is calculated as net profit / (loss) after tax and non-controlling interests (statutory profit / (loss)) divided by the weighted average number of ordinary shares
For
per
sona
l use
onl
y
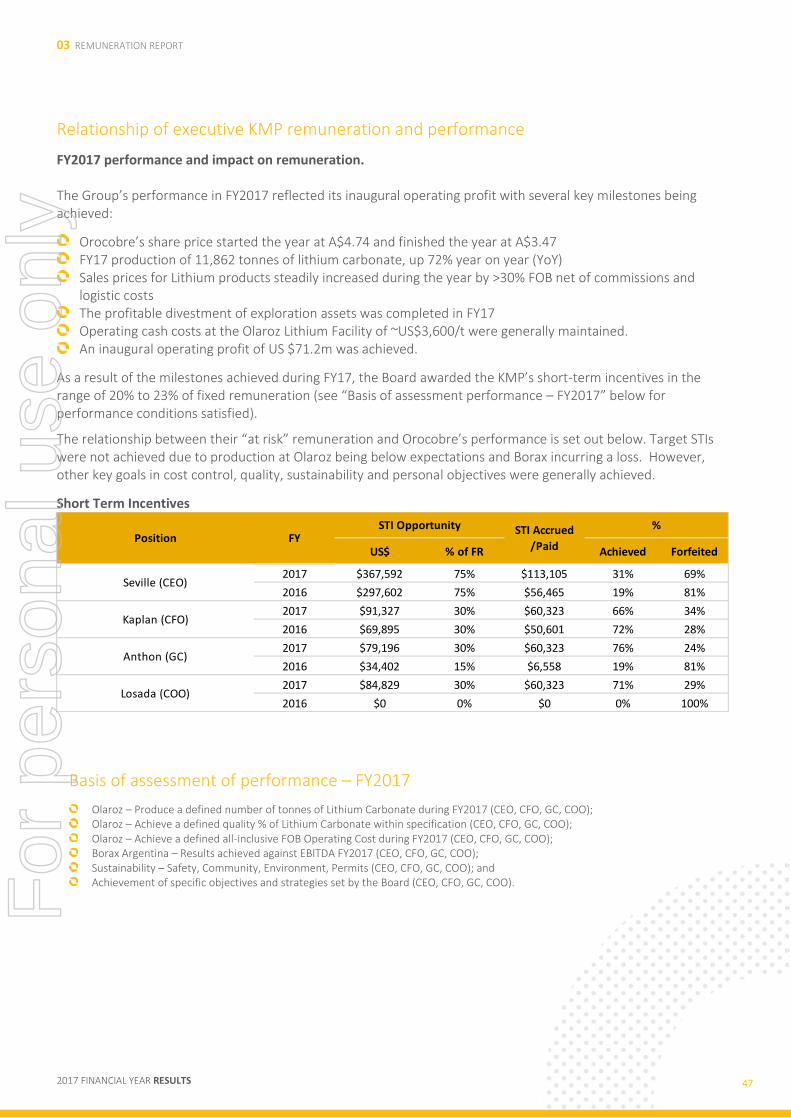
03 REMUNERATION REPORT
2017 FINANCIAL YEAR RESULTS 47
Relationship of executive KMP remuneration and performance
FY2017 performance and impact on remuneration. The Group’s performance in FY2017 reflected its inaugural operating profit with several key milestones being achieved:
Orocobre’s share price started the year at A$4.74 and finished the year at A$3.47 FY17 production of 11,862 tonnes of lithium carbonate, up 72% year on year (YoY) Sales prices for Lithium products steadily increased during the year by >30% FOB net of commissions and
logistic costs The profitable divestment of exploration assets was completed in FY17 Operating cash costs at the Olaroz Lithium Facility of ~US$3,600/t were generally maintained. An inaugural operating profit of US $71.2m was achieved.
As a result of the milestones achieved during FY17, the Board awarded the KMP’s short-term incentives in the range of 20% to 23% of fixed remuneration (see “Basis of assessment performance – FY2017” below for performance conditions satisfied).
The relationship between their “at risk” remuneration and Orocobre’s performance is set out below. Target STIs were not achieved due to production at Olaroz being below expectations and Borax incurring a loss. However, other key goals in cost control, quality, sustainability and personal objectives were generally achieved.
Short Term Incentives
Basis of assessment of performance – FY2017
Olaroz – Produce a defined number of tonnes of Lithium Carbonate during FY2017 (CEO, CFO, GC, COO); Olaroz – Achieve a defined quality % of Lithium Carbonate within specification (CEO, CFO, GC, COO); Olaroz – Achieve a defined all-inclusive FOB Operating Cost during FY2017 (CEO, CFO, GC, COO); Borax Argentina – Results achieved against EBITDA FY2017 (CEO, CFO, GC, COO); Sustainability – Safety, Community, Environment, Permits (CEO, CFO, GC, COO); and Achievement of specific objectives and strategies set by the Board (CEO, CFO, GC, COO).
US$ % of FR Achieved Forfeited
2017 $367,592 75% $113,105 31% 69%
2016 $297,602 75% $56,465 19% 81%
2017 $91,327 30% $60,323 66% 34%
2016 $69,895 30% $50,601 72% 28%
2017 $79,196 30% $60,323 76% 24%
2016 $34,402 15% $6,558 19% 81%
2017 $84,829 30% $60,323 71% 29%
2016 $0 0% $0 0% 100%Losada (COO)
Anthon (GC)
Kaplan (CFO)
Seville (CEO)
STI OpportunityPosition FY
STI Accrued
/Paid
%
For
per
sona
l use
onl
y
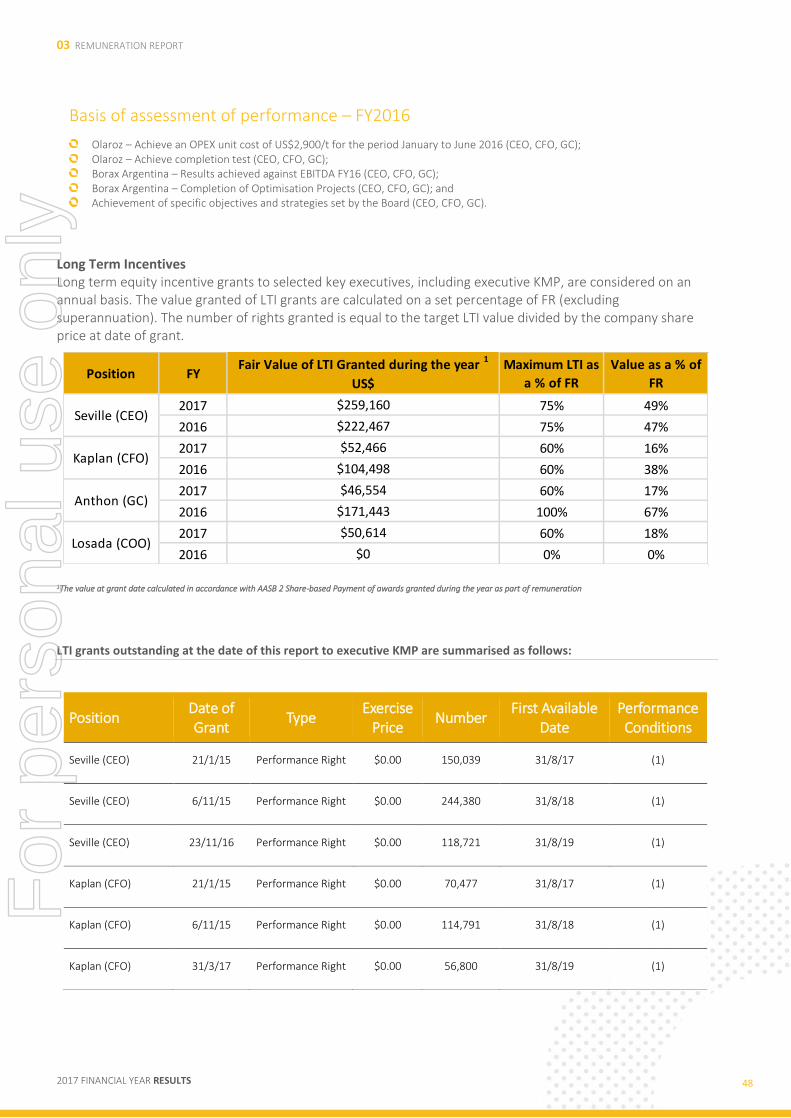
03 REMUNERATION REPORT
2017 FINANCIAL YEAR RESULTS 48
Basis of assessment of performance – FY2016
Olaroz – Achieve an OPEX unit cost of US$2,900/t for the period January to June 2016 (CEO, CFO, GC); Olaroz – Achieve completion test (CEO, CFO, GC); Borax Argentina – Results achieved against EBITDA FY16 (CEO, CFO, GC); Borax Argentina – Completion of Optimisation Projects (CEO, CFO, GC); and Achievement of specific objectives and strategies set by the Board (CEO, CFO, GC).
Long Term Incentives Long term equity incentive grants to selected key executives, including executive KMP, are considered on an annual basis. The value granted of LTI grants are calculated on a set percentage of FR (excluding superannuation). The number of rights granted is equal to the target LTI value divided by the company share price at date of grant.
1The value at grant date calculated in accordance with AASB 2 Share-based Payment of awards granted during the year as part of remuneration
LTI grants outstanding at the date of this report to executive KMP are summarised as follows:
Position Date of Grant
Type Exercise
Price Number
First Available Date
Performance Conditions
Seville (CEO) 21/1/15 Performance Right $0.00 150,039 31/8/17 (1)
Seville (CEO) 6/11/15 Performance Right $0.00 244,380 31/8/18 (1)
Seville (CEO) 23/11/16 Performance Right $0.00 118,721 31/8/19 (1)
Kaplan (CFO) 21/1/15 Performance Right $0.00 70,477 31/8/17 (1)
Kaplan (CFO) 6/11/15 Performance Right $0.00 114,791 31/8/18 (1)
Kaplan (CFO) 31/3/17 Performance Right $0.00 56,800 31/8/19 (1)
2017 75% 49%
2016 75% 47%
2017 60% 16%
2016 60% 38%
2017 60% 17%
2016 100% 67%
2017 60% 18%
2016 0% 0%Losada (COO)
Anthon (GC)
Kaplan (CFO)$52,466
$222,467
$259,160
US$
Seville (CEO)
$0
$50,614
$171,443
$46,554
$104,498
Value as a % of
FR
Maximum LTI as
a % of FRFYPosition
Fair Value of LTI Granted during the year 1
For
per
sona
l use
onl
y

03 REMUNERATION REPORT
2017 FINANCIAL YEAR RESULTS 49
Anthon (GC) 21/1/15 Performance Right $0.00 69,376 31/8/17 (1)
Anthon (GC) 6/11/15 Performance Right $0.00 188,330 31/8/18 (1)
Anthon (GC) 31/3/17 Performance Right $0.00 50,400 31/8/19 (1)
Losada (COO) 31/3/17 Performance Right $0.00 54,795 31/8/19 (1)
The performance conditions applicable to each grant are summarised as follows:
TSR Hurdle: Absolute (50% of LTI Grant) TSR performance over the Measurement Period and subject to meeting the following compound annual rate thresholds.
Greater than 12.5% return per annum 100% Vesting
Greater than 10.0% return per annum 75% Vesting
At least 7.5% return per annum 50% Vesting
Less than 7.5% return per annum 0% Vesting
Interpolated vesting on a straight line where the return per annum is between 7.5% and 12.5%.
TSR Hurdle: Relative (50% of LTI Grant) TSR performance over the Measurement Period relative to the constituent companies of the ASX300 Resources Index subject to the following thresholds.
Greater than 75th percentile 100% Vesting
Equal to or greater than 50th percentile 50% Vesting
Less than 50th percentile 0% Vesting
Interpolated vesting on a straight line between the 50th and 75th percentile.
LTI and Company performance
During the financial year the following LTI grants vested:
For
per
sona
l use
onl
y

03 REMUNERATION REPORT
2017 FINANCIAL YEAR RESULTS 50
At the date of this report no other LTI grants have yet vested. All grants remain subject to demanding service and performance conditions set down and which are in-line with contemporary market standards.
Achievement against the targets set will be independently assessed at the first available date to determine the vesting percentages, if any.
G. Service Agreements Remuneration and other key terms of employment for the CEO and other executive KMP are formalised in a service agreement. The table below provides a high-level overview of conditions relating to the term of the contract, the notice period to terminate and the termination benefit.
Name and Title Term of Agreement
Notice Period by Either Party
Termination Benefit
Richard Seville, CEO/Managing Director Open 6 months 12 months fixed remuneration
Neil Kaplan, Chief Financial Officer Open 6 months 6 months fixed remuneration
Alex Losada, Chief Operating Officer Open 6 months 6 months fixed remuneration
Rick Anthon, General Counsel Open 6 months 6 months fixed remuneration
Terms of agreement and associated benefits were agreed at the time the executive KMP commenced with Orocobre or upon promotion. Termination Benefits are voided and no incentives are eligible to vest when termination arises due to breach of agreement, serious misconduct, criminal offence or negligence.
Position ASX Code Expiry DateExercise /
Lapse DateExercise Price
Number of
Performance
Rights
Status
OREAS 30-Sep-16 18-Oct-16 $0.00 80,329 Exercised
OREAS 30-Sep-16 18-Oct-16 $0.00 80,329 Lapsed
OREAS 30-Sep-16 18-Oct-16 $0.00 98,540 Exercised
OREAS 30-Sep-16 18-Oct-16 $0.00 98,540 Lapsed
Seville (CEO)
Kaplan (CFO)
For
per
sona
l use
onl
y
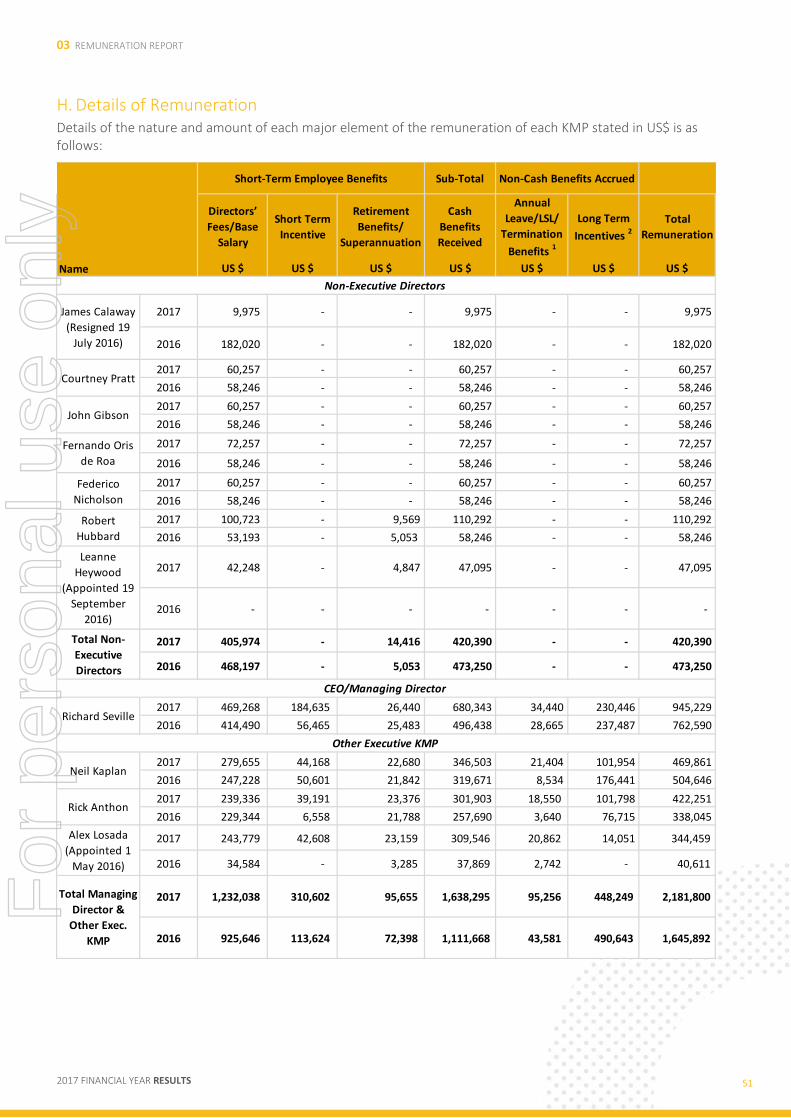
03 REMUNERATION REPORT
2017 FINANCIAL YEAR RESULTS 51
H. Details of Remuneration Details of the nature and amount of each major element of the remuneration of each KMP stated in US$ is as follows:
Sub-Total
Directors’
Fees/Base
Salary
Short Term
Incentive
Retirement
Benefits/
Superannuation
Cash
Benefits
Received
Annual
Leave/LSL/
Termination
Benefits 1
Long Term
Incentives 2
Total
Remuneration
US $ US $ US $ US $ US $ US $ US $
2017 9,975 - - 9,975 - - 9,975
2016 182,020 - - 182,020 - - 182,020
2017 60,257 - - 60,257 - - 60,257
2016 58,246 - - 58,246 - - 58,246
2017 60,257 - - 60,257 - - 60,257
2016 58,246 - - 58,246 - - 58,246
2017 72,257 - - 72,257 - - 72,257
2016 58,246 - - 58,246 - - 58,246
2017 60,257 - - 60,257 - - 60,257
2016 58,246 - - 58,246 - - 58,246
2017 100,723 - 9,569 110,292 - - 110,292
2016 53,193 - 5,053 58,246 - - 58,246
2017 42,248 - 4,847 47,095 - - 47,095
2016 - - - - - - -
2017 405,974 - 14,416 420,390 - - 420,390
2016 468,197 - 5,053 473,250 - - 473,250
2017 469,268 184,635 26,440 680,343 34,440 230,446 945,229
2016 414,490 56,465 25,483 496,438 28,665 237,487 762,590
2017 279,655 44,168 22,680 346,503 21,404 101,954 469,861
2016 247,228 50,601 21,842 319,671 8,534 176,441 504,646
2017 239,336 39,191 23,376 301,903 18,550 101,798 422,251
2016 229,344 6,558 21,788 257,690 3,640 76,715 338,045
2017 243,779 42,608 23,159 309,546 20,862 14,051 344,459
2016 34,584 - 3,285 37,869 2,742 - 40,611
2017 1,232,038 310,602 95,655 1,638,295 95,256 448,249 2,181,800
2016 925,646 113,624 72,398 1,111,668 43,581 490,643 1,645,892
Total Managing
Director &
Other Exec.
KMP
Alex Losada
(Appointed 1
May 2016)
John Gibson
CEO/Managing Director
Other Executive KMP
Neil Kaplan
Robert
Hubbard
Federico
Nicholson
Fernando Oris
de Roa
Rick Anthon
Non-Cash Benefits Accrued
Name
Non-Executive Directors
Short-Term Employee Benefits
Courtney Pratt
James Calaway
(Resigned 19
July 2016)
Leanne
Heywood
(Appointed 19
September
2016)
Richard Seville
Total Non-
Executive
Directors
For
per
sona
l use
onl
y
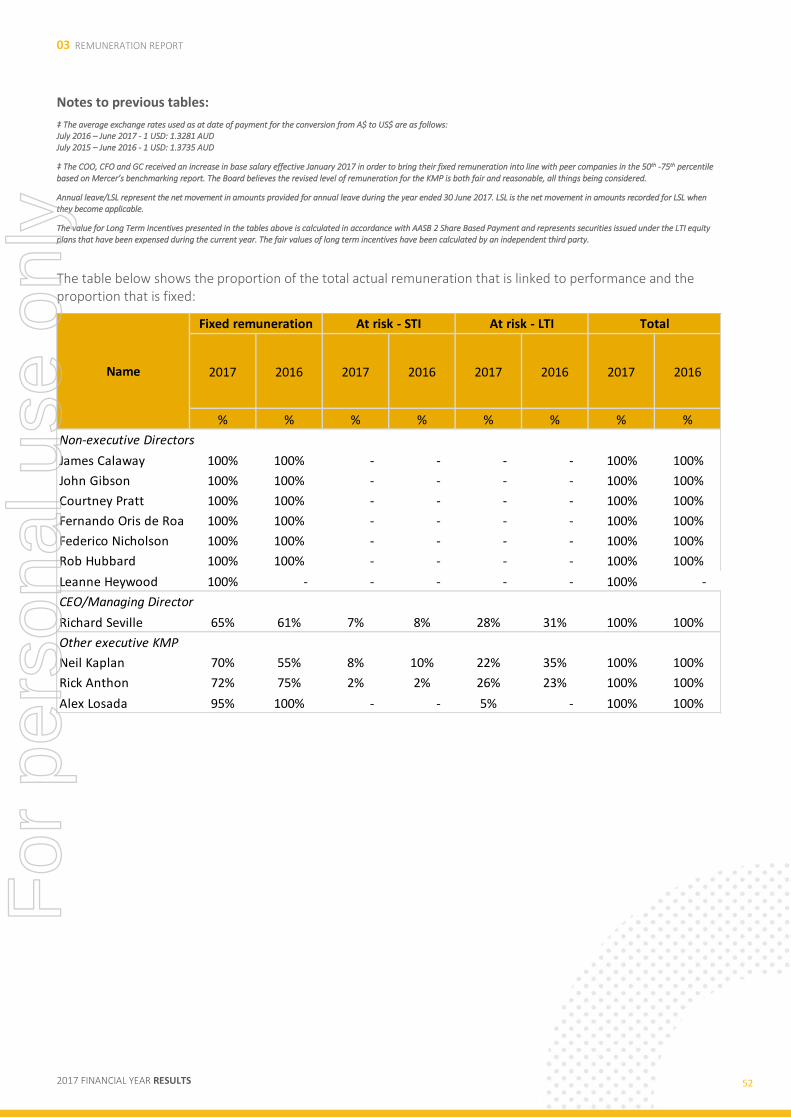
03 REMUNERATION REPORT
2017 FINANCIAL YEAR RESULTS 52
Notes to previous tables:
‡ The average exchange rates used as at date of payment for the conversion from A$ to US$ are as follows: July 2016 – June 2017 - 1 USD: 1.3281 AUD July 2015 – June 2016 - 1 USD: 1.3735 AUD
‡ The COO, CFO and GC received an increase in base salary effective January 2017 in order to bring their fixed remuneration into line with peer companies in the 50th -75th percentile
based on Mercer’s benchmarking report. The Board believes the revised level of remuneration for the KMP is both fair and reasonable, all things being considered.
Annual leave/LSL represent the net movement in amounts provided for annual leave during the year ended 30 June 2017. LSL is the net movement in amounts recorded for LSL when they become applicable.
The value for Long Term Incentives presented in the tables above is calculated in accordance with AASB 2 Share Based Payment and represents securities issued under the LTI equity plans that have been expensed during the current year. The fair values of long term incentives have been calculated by an independent third party.
The table below shows the proportion of the total actual remuneration that is linked to performance and the proportion that is fixed:
2017 2016 2017 2016 2017 2016 2017 2016
% % % % % % % %
James Calaway 100% 100% - - - - 100% 100%
John Gibson 100% 100% - - - - 100% 100%
Courtney Pratt 100% 100% - - - - 100% 100%
Fernando Oris de Roa 100% 100% - - - - 100% 100%
Federico Nicholson 100% 100% - - - - 100% 100%
Rob Hubbard 100% 100% - - - - 100% 100%
Leanne Heywood 100% - - - - - 100% -
Richard Seville 65% 61% 7% 8% 28% 31% 100% 100%
Neil Kaplan 70% 55% 8% 10% 22% 35% 100% 100%
Rick Anthon 72% 75% 2% 2% 26% 23% 100% 100%
Alex Losada 95% 100% - - 5% - 100% 100%
Non-executive Directors
CEO/Managing Director
Other executive KMP
Name
Fixed remuneration At risk - STI At risk - LTI Total
For
per
sona
l use
onl
y
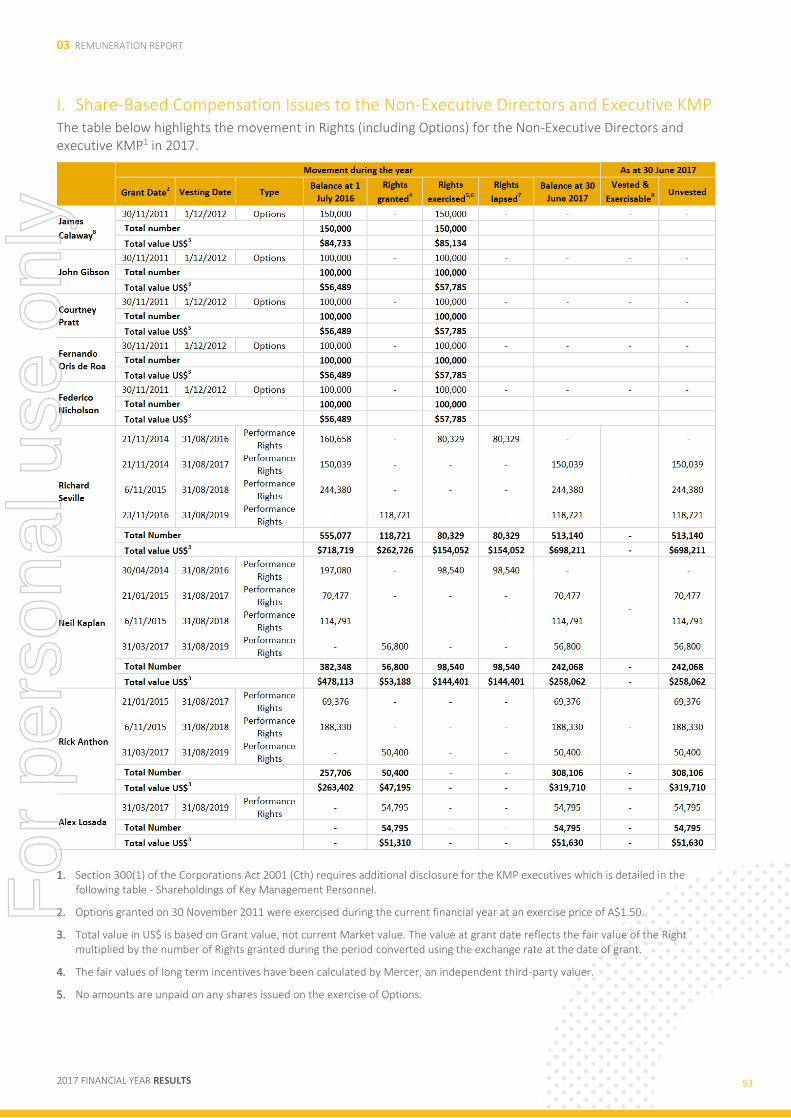
03 REMUNERATION REPORT
2017 FINANCIAL YEAR RESULTS 53
I. Share-Based Compensation Issues to the Non-Executive Directors and Executive KMP The table below highlights the movement in Rights (including Options) for the Non-Executive Directors and executive KMP1 in 2017.
1. Section 300(1) of the Corporations Act 2001 (Cth) requires additional disclosure for the KMP executives which is detailed in the following table - Shareholdings of Key Management Personnel.
2. Options granted on 30 November 2011 were exercised during the current financial year at an exercise price of A$1.50.
3. Total value in US$ is based on Grant value, not current Market value. The value at grant date reflects the fair value of the Right multiplied by the number of Rights granted during the period converted using the exchange rate at the date of grant.
4. The fair values of long term incentives have been calculated by Mercer, an independent third-party valuer.
5. No amounts are unpaid on any shares issued on the exercise of Options.
For
per
sona
l use
onl
y
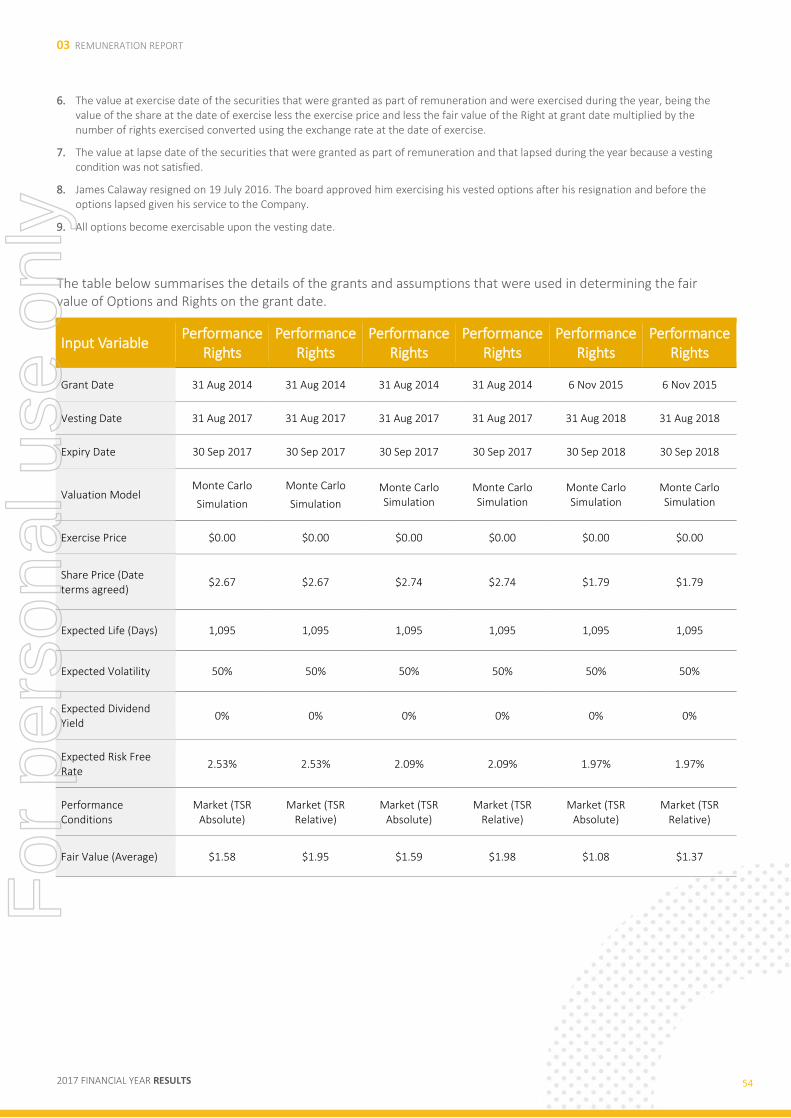
03 REMUNERATION REPORT
2017 FINANCIAL YEAR RESULTS 54
6. The value at exercise date of the securities that were granted as part of remuneration and were exercised during the year, being the value of the share at the date of exercise less the exercise price and less the fair value of the Right at grant date multiplied by the number of rights exercised converted using the exchange rate at the date of exercise.
7. The value at lapse date of the securities that were granted as part of remuneration and that lapsed during the year because a vesting condition was not satisfied.
8. James Calaway resigned on 19 July 2016. The board approved him exercising his vested options after his resignation and before the options lapsed given his service to the Company.
9. All options become exercisable upon the vesting date.
The table below summarises the details of the grants and assumptions that were used in determining the fair value of Options and Rights on the grant date.
Input Variable Performance
Rights Performance
Rights Performance
Rights Performance
Rights Performance
Rights Performance
Rights
Grant Date 31 Aug 2014 31 Aug 2014 31 Aug 2014 31 Aug 2014 6 Nov 2015 6 Nov 2015
Vesting Date 31 Aug 2017 31 Aug 2017 31 Aug 2017 31 Aug 2017 31 Aug 2018 31 Aug 2018
Expiry Date 30 Sep 2017 30 Sep 2017 30 Sep 2017 30 Sep 2017 30 Sep 2018 30 Sep 2018
Valuation Model Monte Carlo
Simulation
Monte Carlo
Simulation
Monte Carlo Simulation
Monte Carlo Simulation
Monte Carlo Simulation
Monte Carlo Simulation
Exercise Price $0.00 $0.00 $0.00 $0.00 $0.00 $0.00
Share Price (Date terms agreed)
$2.67 $2.67 $2.74 $2.74 $1.79 $1.79
Expected Life (Days) 1,095 1,095 1,095 1,095 1,095 1,095
Expected Volatility 50% 50% 50% 50% 50% 50%
Expected Dividend Yield
0% 0% 0% 0% 0% 0%
Expected Risk Free Rate
2.53% 2.53% 2.09% 2.09% 1.97% 1.97%
Performance Conditions
Market (TSR Absolute)
Market (TSR Relative)
Market (TSR Absolute)
Market (TSR Relative)
Market (TSR Absolute)
Market (TSR Relative)
Fair Value (Average) $1.58 $1.95 $1.59 $1.98 $1.08 $1.37
For
per
sona
l use
onl
y
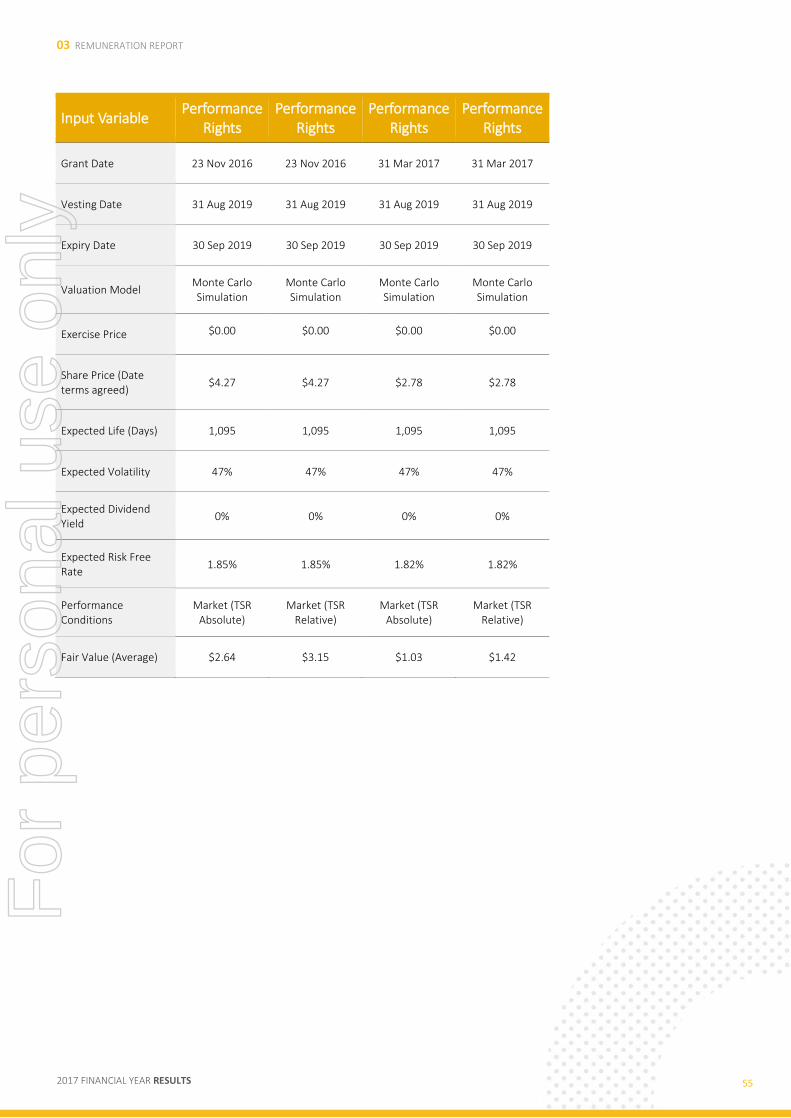
03 REMUNERATION REPORT
2017 FINANCIAL YEAR RESULTS 55
Input Variable Performance
Rights Performance
Rights Performance
Rights Performance
Rights
Grant Date 23 Nov 2016 23 Nov 2016 31 Mar 2017 31 Mar 2017
Vesting Date 31 Aug 2019 31 Aug 2019 31 Aug 2019 31 Aug 2019
Expiry Date 30 Sep 2019 30 Sep 2019 30 Sep 2019 30 Sep 2019
Valuation Model Monte Carlo Simulation
Monte Carlo Simulation
Monte Carlo Simulation
Monte Carlo Simulation
Exercise Price $0.00 $0.00 $0.00 $0.00
Share Price (Date terms agreed)
$4.27 $4.27 $2.78 $2.78
Expected Life (Days) 1,095 1,095 1,095 1,095
Expected Volatility 47% 47% 47% 47%
Expected Dividend Yield
0% 0% 0% 0%
Expected Risk Free Rate
1.85% 1.85% 1.82% 1.82%
Performance Conditions
Market (TSR Absolute)
Market (TSR Relative)
Market (TSR Absolute)
Market (TSR Relative)
Fair Value (Average) $2.64 $3.15 $1.03 $1.42
For
per
sona
l use
onl
y
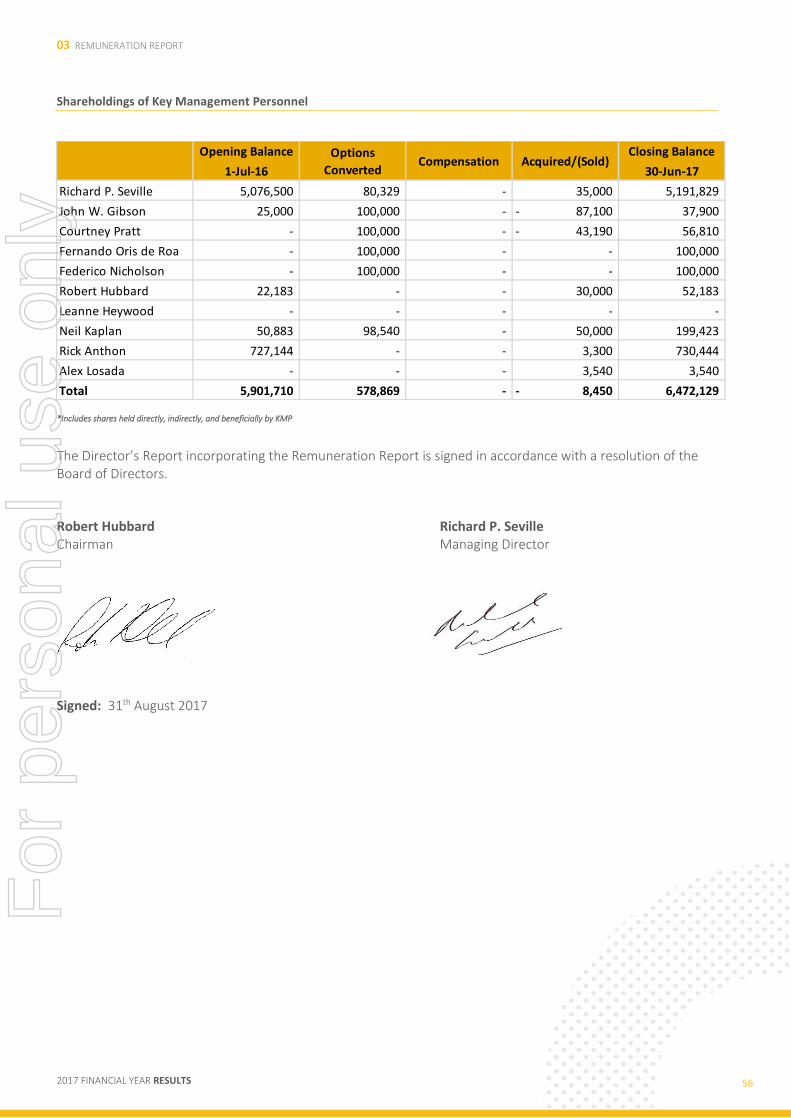
03 REMUNERATION REPORT
2017 FINANCIAL YEAR RESULTS 56
Shareholdings of Key Management Personnel
*Includes shares held directly, indirectly, and beneficially by KMP
The Director’s Report incorporating the Remuneration Report is signed in accordance with a resolution of the Board of Directors.
Robert Hubbard Richard P. Seville Chairman Managing Director
Signed: 31th August 2017
Opening Balance Closing Balance
1-Jul-16 30-Jun-17
Richard P. Seville 5,076,500 80,329 - 35,000 5,191,829
John W. Gibson 25,000 100,000 - 87,100- 37,900
Courtney Pratt - 100,000 - 43,190- 56,810
Fernando Oris de Roa - 100,000 - - 100,000
Federico Nicholson - 100,000 - - 100,000
Robert Hubbard 22,183 - - 30,000 52,183
Leanne Heywood - - - - -
Neil Kaplan 50,883 98,540 - 50,000 199,423
Rick Anthon 727,144 - - 3,300 730,444
Alex Losada - - - 3,540 3,540
Total 5,901,710 578,869 - 8,450- 6,472,129
Options
ConvertedCompensation Acquired/(Sold)
For
per
sona
l use
onl
y
03 REMUNERATION REPORT
2017 FINANCIAL YEAR RESULTS 57
For
per
sona
l use
onl
y
04 FINANCIAL STATEMENTS
2017 FINANCIAL YEAR RESULTS 58
30 June 2017
FOR THE FINANCIAL YEAR ENDED
CONSOLIDATED FINANCIAL STATEMENTS
ABN 31 112 589 910
OROCOBRE LIMITED
For
per
sona
l use
onl
y
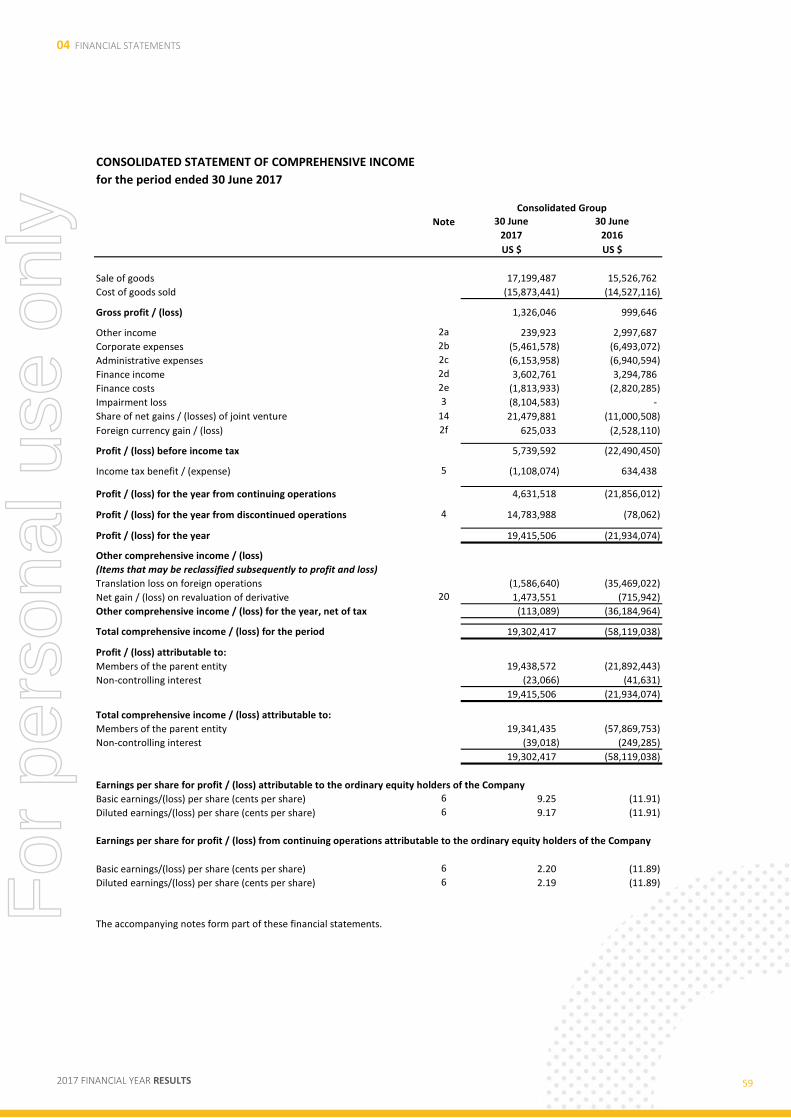
04 FINANCIAL STATEMENTS
2017 FINANCIAL YEAR RESULTS 59
CONSOLIDATED STATEMENT OF COMPREHENSIVE INCOME
for the period ended 30 June 2017
Note 30 June 30 June
2017 2016
US $ US $
Sale of goods 17,199,487 15,526,762
Cost of goods sold (15,873,441) (14,527,116)
Gross profit / (loss) 1,326,046 999,646
Other income 2a 239,923 2,997,687
Corporate expenses 2b (5,461,578) (6,493,072)
Administrative expenses 2c (6,153,958) (6,940,594)
Finance income 2d 3,602,761 3,294,786
Finance costs 2e (1,813,933) (2,820,285)
Impairment loss 3 (8,104,583) -
Share of net gains / (losses) of joint venture 14 21,479,881 (11,000,508)
Foreign currency gain / (loss) 2f 625,033 (2,528,110)
Profit / (loss) before income tax 5,739,592 (22,490,450)
Income tax benefit / (expense) 5 (1,108,074) 634,438
Profit / (loss) for the year from continuing operations 4,631,518 (21,856,012)
Profit / (loss) for the year from discontinued operations 4 14,783,988 (78,062)
Profit / (loss) for the year 19,415,506 (21,934,074)
Other comprehensive income / (loss)
(Items that may be reclassified subsequently to profit and loss)
Translation loss on foreign operations (1,586,640) (35,469,022)
Net gain / (loss) on revaluation of derivative 20 1,473,551 (715,942)
Other comprehensive income / (loss) for the year, net of tax (113,089) (36,184,964)
Total comprehensive income / (loss) for the period 19,302,417 (58,119,038)
Profit / (loss) attributable to:
Members of the parent entity 19,438,572 (21,892,443)
Non-controlling interest (23,066) (41,631)
19,415,506 (21,934,074)
Total comprehensive income / (loss) attributable to:
Members of the parent entity 19,341,435 (57,869,753)
Non-controlling interest (39,018) (249,285)
19,302,417 (58,119,038)
Earnings per share for profit / (loss) attributable to the ordinary equity holders of the Company
Basic earnings/(loss) per share (cents per share) 6 9.25 (11.91)
Diluted earnings/(loss) per share (cents per share) 6 9.17 (11.91)
Basic earnings/(loss) per share (cents per share) 6 2.20 (11.89)
Diluted earnings/(loss) per share (cents per share) 6 2.19 (11.89)
The accompanying notes form part of these financial statements.
Consolidated Group
Earnings per share for profit / (loss) from continuing operations attributable to the ordinary equity holders of the Company
For
per
sona
l use
onl
y
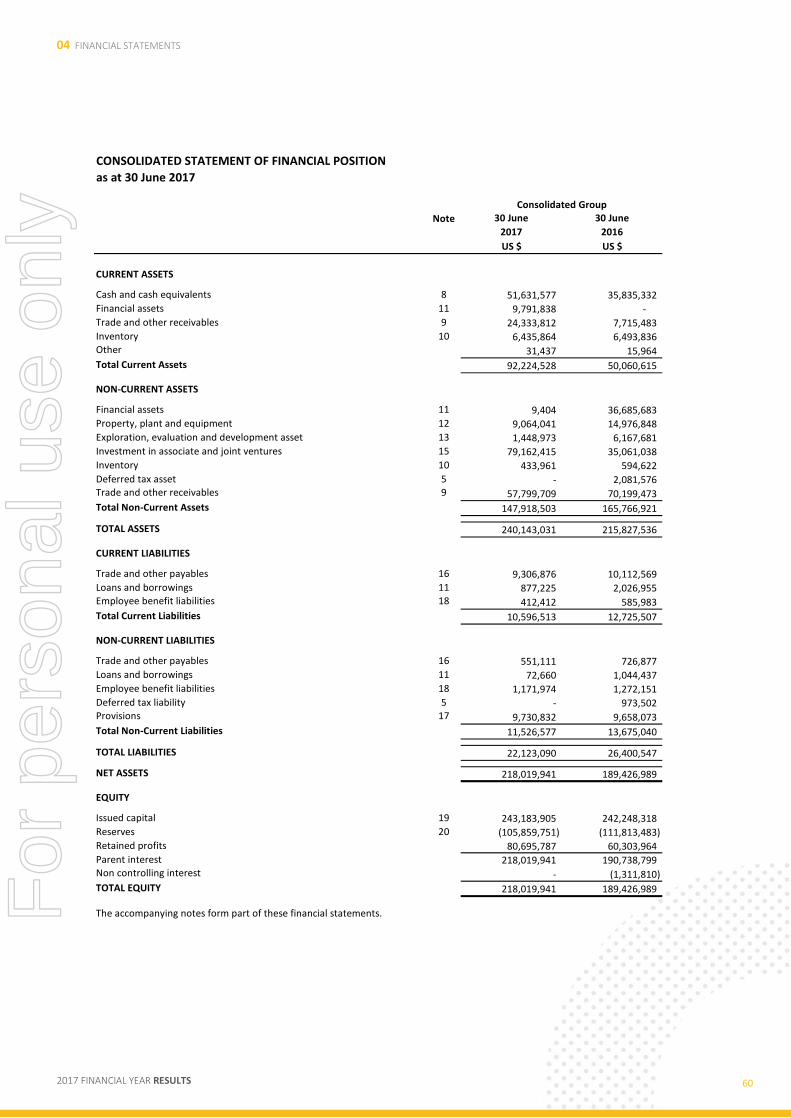
04 FINANCIAL STATEMENTS
2017 FINANCIAL YEAR RESULTS 60
CONSOLIDATED STATEMENT OF FINANCIAL POSITION
as at 30 June 2017
Note 30 June 30 June
2017 2016
US $ US $
CURRENT ASSETS
Cash and cash equivalents 8 51,631,577 35,835,332 Financial assets 11 9,791,838 - Trade and other receivables 9 24,333,812 7,715,483 Inventory 10 6,435,864 6,493,836 Other 31,437 15,964
Total Current Assets 92,224,528 50,060,615
NON-CURRENT ASSETS
Financial assets 11 9,404 36,685,683 Property, plant and equipment 12 9,064,041 14,976,848 Exploration, evaluation and development asset 13 1,448,973 6,167,681 Investment in associate and joint ventures 15 79,162,415 35,061,038 Inventory 10 433,961 594,622 Deferred tax asset 5 - 2,081,576 Trade and other receivables 9 57,799,709 70,199,473
Total Non-Current Assets 147,918,503 165,766,921
TOTAL ASSETS 240,143,031 215,827,536
CURRENT LIABILITIES
Trade and other payables 16 9,306,876 10,112,569 Loans and borrowings 11 877,225 2,026,955 Employee benefit liabilities 18 412,412 585,983
Total Current Liabilities 10,596,513 12,725,507
NON-CURRENT LIABILITIES
Trade and other payables 16 551,111 726,877 Loans and borrowings 11 72,660 1,044,437 Employee benefit liabilities 18 1,171,974 1,272,151 Deferred tax liability 5 - 973,502 Provisions 17 9,730,832 9,658,073
Total Non-Current Liabilities 11,526,577 13,675,040
TOTAL LIABILITIES 22,123,090 26,400,547
NET ASSETS 218,019,941 189,426,989
EQUITY
Issued capital 19 243,183,905 242,248,318 Reserves 20 (105,859,751) (111,813,483) Retained profits 80,695,787 60,303,964 Parent interest 218,019,941 190,738,799 Non controlling interest - (1,311,810)
TOTAL EQUITY 218,019,941 189,426,989
The accompanying notes form part of these financial statements.
Consolidated Group
For
per
sona
l use
onl
y
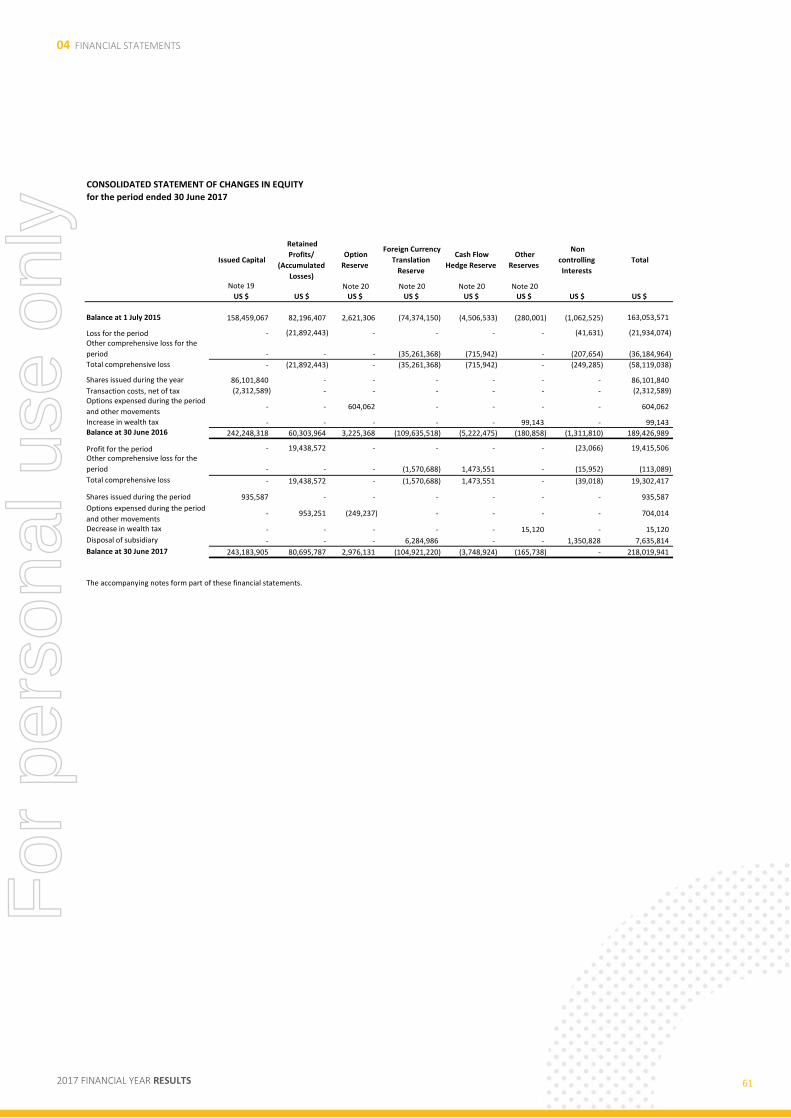
04 FINANCIAL STATEMENTS
2017 FINANCIAL YEAR RESULTS 61
CONSOLIDATED STATEMENT OF CHANGES IN EQUITY
for the period ended 30 June 2017
Issued Capital
Retained
Profits/
(Accumulated
Losses)
Option
Reserve
Foreign Currency
Translation
Reserve
Cash Flow
Hedge Reserve
Other
Reserves
Non
controlling
Interests
Total
Note 19 Note 20 Note 20 Note 20 Note 20 US $ US $ US $ US $ US $ US $ US $ US $
Balance at 1 July 2015 158,459,067 82,196,407 2,621,306 (74,374,150) (4,506,533) (280,001) (1,062,525) 163,053,571
- (21,892,443) - - - - (41,631) (21,934,074)
- - - (35,261,368) (715,942) - (207,654) (36,184,964)
- (21,892,443) - (35,261,368) (715,942) - (249,285) (58,119,038)
86,101,840 - - - - - - 86,101,840
(2,312,589) - - - - - - (2,312,589)
- - 604,062 - - - - 604,062
Increase in wealth tax - - - - - 99,143 - 99,143 Balance at 30 June 2016 242,248,318 60,303,964 3,225,368 (109,635,518) (5,222,475) (180,858) (1,311,810) 189,426,989
- 19,438,572 - - - - (23,066) 19,415,506
- - - (1,570,688) 1,473,551 - (15,952) (113,089)
- 19,438,572 - (1,570,688) 1,473,551 - (39,018) 19,302,417
935,587 - - - - - - 935,587
- 953,251 (249,237) - - - - 704,014
Decrease in wealth tax - - - - - 15,120 - 15,120
Disposal of subsidiary - - - 6,284,986 - - 1,350,828 7,635,814
Balance at 30 June 2017 243,183,905 80,695,787 2,976,131 (104,921,220) (3,748,924) (165,738) - 218,019,941
The accompanying notes form part of these financial statements.
Options expensed during the period
and other movements
Transaction costs, net of tax
Options expensed during the period
and other movements
Profit for the periodOther comprehensive loss for the
period
Total comprehensive loss
Shares issued during the period
Loss for the periodOther comprehensive loss for the
period
Total comprehensive loss
Shares issued during the year
For
per
sona
l use
onl
y
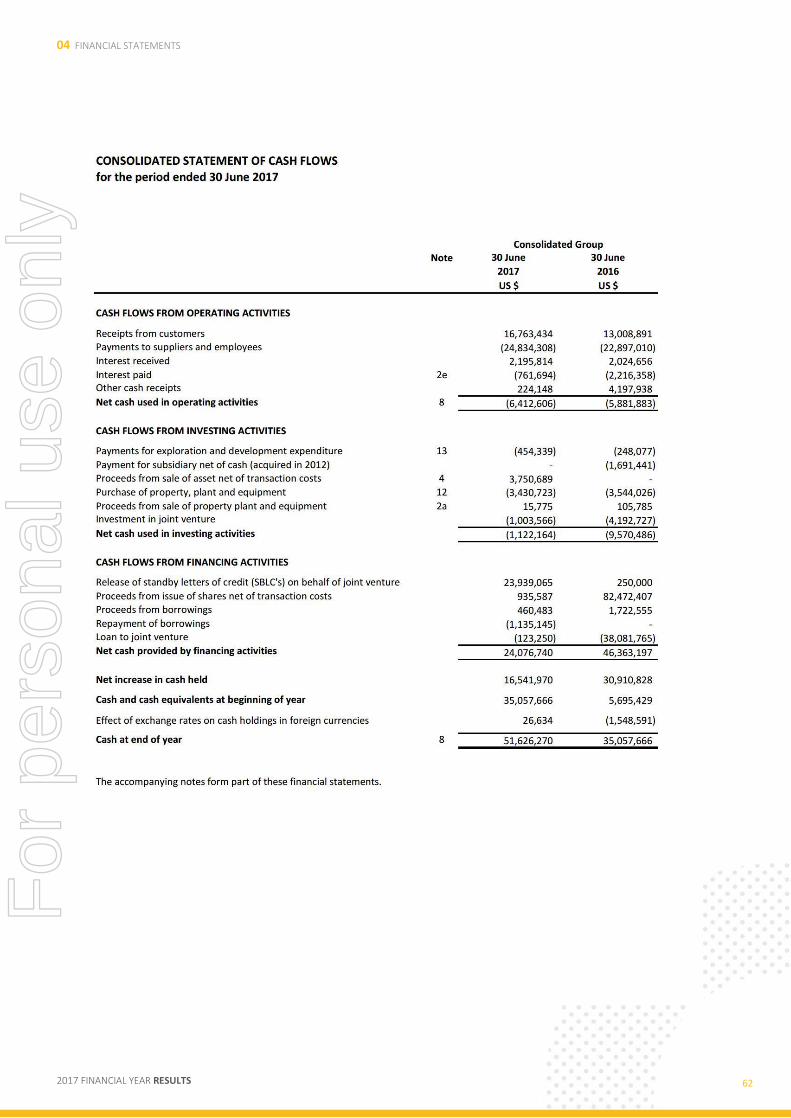
04 FINANCIAL STATEMENTS
2017 FINANCIAL YEAR RESULTS 62
For
per
sona
l use
onl
y
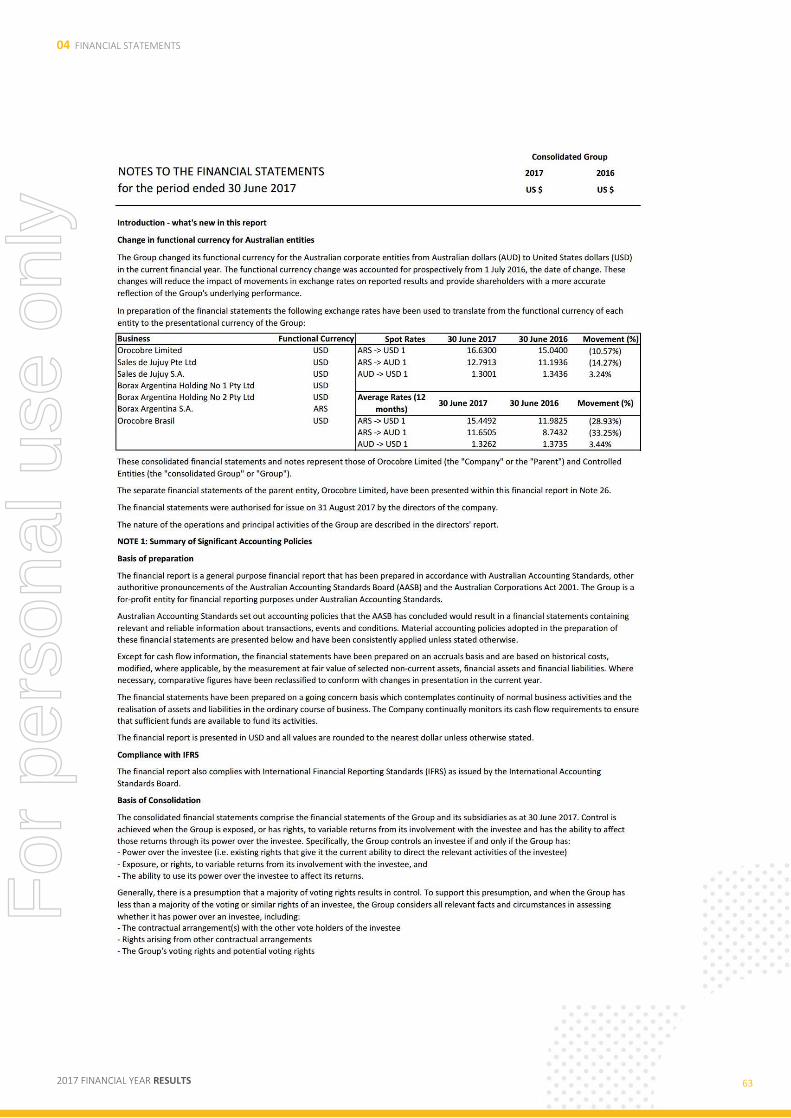
04 FINANCIAL STATEMENTS
2017 FINANCIAL YEAR RESULTS 63
For
per
sona
l use
onl
y
04 FINANCIAL STATEMENTS
2017 FINANCIAL YEAR RESULTS 64
NOTES TO THE FINANCIAL STATEMENTS
for the period ended 30 June 2017
NOTE 1: Summary of Significant Accounting Policies (continued)
Taxes
Where goodwill has been allocated to a cash-generating unit and part of the operation within that unit is disposed of, the goodwill
associated with the disposed operation is included in the carrying amount of the operation when determining the gain or loss on disposal.
Goodwill disposed in these circumstances is measured based on the relative values of the disposed operation and the portion of the cash-
generating unit retained.
After initial recognition, goodwill is measured at cost less any accumulated impairment losses. For the purpose of impairment testing,
goodwill acquired in a business combination is, from the acquisition date, allocated to each of the Group’s cash-generating units that are
expected to benefit from the combination, irrespective of whether other assets or liabilities of the acquiree are assigned to those units.
Goodwill is initially measured at cost, being the excess of the aggregate of the consideration transferred and the amount recognised for non-
controlling interests, and any previous interest held, over the net identifiable assets acquired and liabilities assumed. If the fair value of the
net assets acquired is in excess of the aggregate consideration transferred, the Group re-assesses whether it has correctly identified all of the
assets acquired and all of the liabilities assumed and reviews the procedures used to measure the amounts to be recognised at the
acquisition date. If the re-assessment still results in an excess of the fair value of net assets acquired over the aggregate consideration
transferred, then the gain is recognised in profit or loss.
Any contingent consideration to be transferred by the acquirer will be recognised at fair value at the acquisition date. Contingent
consideration classified as an asset or liability that is a financial instrument and within the scope of AASB 139 Financial Instruments:
Recognition and Measurement , is measured at fair value with changes in fair value recognised either in either profit or loss or as a change to
other comprehensive income. If the contingent consideration is not within the scope of AASB 139, it is measured in accordance with the
appropriate Australian Accounting Standard. Contingent consideration that is classified as equity is not remeasured and subsequent
settlement is accounted for within equity.
If the business combination is achieved in stages, the previously held equity interest is remeasured at its acquisition date fair value and any
resulting gain or loss is recognised in profit or loss.
When the Group acquires a business, it assesses the financial assets and liabilities assumed for appropriate classification and designation in
accordance with the contractual terms, economic circumstances and pertinent conditions as at the acquisition date. This includes the
separation of embedded derivatives in host contracts by the acquiree.
A change in the ownership interest of a subsidiary, without a loss of control, is accounted for as an equity transaction. If the Group loses
control over a subsidiary, it derecognises the related assets (including goodwill), liabilities, non-controlling interest and other components of
equity while any resultant gain or loss is recognised in profit or loss. Any investment retained is recognised at fair value.
Profit or loss and each component of other comprehensive income (OCI) are attributed to the equity holders of the parent of the Group and
to the non-controlling interests, even if this results in the non-controlling interests having a deficit balance. When necessary, adjustments
are made to the financial statements of subsidiaries to bring their accounting policies into line with the Group's accounting policies. All intra-
Group assets and liabilities, equity, income, expenses and cash flows relating to transactions between members of the Group are eliminated
in full on consolidation.
The Group re-assesses whether or not it controls an investee if facts and circumstances indicate that there are changes to one or more of the
three elements of control. Consolidation of a subsidiary begins when the Group obtains control over the subsidiary and ceases when the
Group loses control of the subsidiary. Assets, liabilities, income and expenses of a subsidiary acquired or disposed of during the year are
included in the consolidated financial statements from the date the Group gains control until the date the Group ceases to control the
subsidiary.
Business combinations and goodwill
Current income tax assets and liabilities for the current period are measured at the amount expected to be recovered from or paid to the
taxation authorities. The tax rates and tax laws used to compute the amount are those that are enacted or substantively enacted, at the
reporting date in the countries where the Group operates and generates taxable income.
Business combinations are accounted for using the acquisition method. The cost of an acquisition is measured as the aggregate of the
consideration transferred, measured at acquisition date fair value and the amount of any non-controlling interest in the acquiree. For each
business combination, the Group elects whether to measure the non-controlling interest in the acquiree at fair value or at the proportionate
share of the acquiree’s identifiable net assets. Acquisition related costs are expensed as incurred and included in administrative expenses.
Current income tax relating to items recognised directly in equity is recognised in equity and not in the statement of comprehensive income.
Management periodically evaluates positions taken in the tax returns with respect to situations in which applicable tax regulations are
subject to interpretation and establishes provisions where appropriate.
Current income tax
Deferred tax
Deferred tax is provided using the liability method on temporary differences between the tax bases of assets and liabilities and their carrying
amounts for financial reporting purposes at the reporting date.
For
per
sona
l use
onl
y
04 FINANCIAL STATEMENTS
2017 FINANCIAL YEAR RESULTS 65
NOTES TO THE FINANCIAL STATEMENTS
for the period ended 30 June 2017
NOTE 1: Summary of Significant Accounting Policies (continued)
Tax consolidation legislation
Deferred tax relating to items recognised outside profit or loss is recognised outside profit or loss. Deferred tax items are recognised in
correlation to the underlying transaction either in other comprehensive income or directly in equity.
Deferred tax assets and liabilities are measured at the tax rates that are expected to apply in the year when the asset is realised or the
liability is settled, based on tax rates (and tax laws) that have been enacted or substantively enacted at the reporting date.
- In respect of taxable temporary differences associated with investments in subsidiaries, associates and interests in joint ventures, when
the timing of the reversal of the temporary differences can be controlled and it is probable that the temporary differences will not reverse in
the foreseeable future.
- When the deferred income tax liability arises from the initial recognition of goodwill or of an asset or liability in a transaction that is not a
business combination and that, at the time of the transaction, affects neither the accounting profit nor taxable profit or loss.
Cash flows are included in the statement of cash flows on a gross basis and the GST component of cash flows arising from investing or
financing activities, which is recoverable from, or payable to, the taxation authority is classified as part of operating cash flows.
The net amount of GST recoverable from, or payable to, the taxation authority is included as part of receivables or payables in the statement
of financial position. Commitments and contingencies are disclosed net of the amount of GST (or VAT) recoverable from, or payable to, the
taxation authority.
- In respect of deductible temporary differences associated with investments in subsidiaries, associates and interests in joint ventures,
deferred tax assets are recognised only to the extent that it is probable that the temporary differences will reverse in the foreseeable future
and taxable profit will be available against which the temporary differences can be utilised.
- When the deferred tax asset relating to the deductible temporary difference arises from the initial recognition of an asset or liability in a
transaction that is not a business combination and, at the time of the transaction, affects neither the accounting profit nor taxable profit or
loss.
Deferred tax assets are recognised for all deductible temporary differences, the carry forward of unused tax credits and any unused tax
losses. Deferred tax assets are recognised to the extent that it is probable that taxable profit will be available against which the deductible
temporary differences, and the carry forward of unused tax credits and unused tax losses can be utilised, except:
- When receivables and payables are stated with the amount of GST included.
- When the GST incurred on a sale or a purchase of assets or services is not payable to or recoverable from the taxation authority, in which
case the GST is recognised as part of the revenue or the expense item or as part of the cost of acquisition of the asset, as applicable
Revenues, expenses and assets are recognised net of the amount of GST (or overseas, Value-Added Tax (VAT)), except:
Any difference between the amounts assumed and amounts receivable or payable under the tax funding agreement are recognised as
contribution to (or distribution from) wholly-owned tax consolidated entities.
Assets or liabilities arising under tax funding agreements with the tax consolidated entities are recognised as amounts receivable from or
payable to other entities in the Group.
In addition to its own current and deferred tax amounts, Orocobre Limited also recognises the current tax liabilities (or assets) and the
deferred tax assets arising from unused tax losses and unused tax credits assumed from controlled entities in the tax consolidated Group.
The head entity, Orocobre Limited and the controlled entities in the tax consolidated Group continue to account for their own current and
deferred tax amounts. The Group has applied the Group allocation approach in determining the appropriate amount of current taxes and
deferred taxes to allocate to members of the tax consolidated Group.
Orocobre Limited and its wholly-owned Australian controlled entities implemented the tax consolidation legislation as of 1 July 2005.
Tax benefits acquired as part of a business combination, but not satisfying the criteria for separate recognition at that date, are recognised
subsequently if new information about facts and circumstances change. The adjustment is either treated as a reduction to goodwill (as long
as it does not exceed goodwill) if it was incurred during the measurement period or recognised in profit or loss.
Deferred tax assets and deferred tax liabilities are offset if a legally enforceable right exists to set off current tax assets against current
income tax liabilities and the deferred taxes relate to the same taxable entity and the same taxation authority.
Goods and Services Tax (GST)
The carrying amount of deferred tax assets is reviewed at each reporting date and reduced to the extent that it is no longer probable that
sufficient taxable profit will be available to allow all or part of the deferred tax asset to be utilised. Unrecognised deferred tax assets are
reassessed at each reporting date and are recognised to the extent that it has become probable that future taxable profits will allow the
deferred tax asset to be recovered.
Deferred income tax liabilities are recognised for all taxable temporary differences except:
For
per
sona
l use
onl
y
04 FINANCIAL STATEMENTS
2017 FINANCIAL YEAR RESULTS 66
NOTES TO THE FINANCIAL STATEMENTS
for the period ended 30 June 2017
NOTE 1: Summary of Significant Accounting Policies (continued)
Discontinued Operations
- Represents a separate major line of business or geographical area of operations,
- Is part of a single co-ordinated plan to dispose of a separate major line of business or geographical area of operations, or
- Is a subsidiary acquired exclusively with a view to resale
1. Accrued interest expenses during the construction period which are directly attributable to the acquisition, construction or production
of qualifying assets, which are those that require a substantial period prior to being ready for use. The interest rate used is that related to
the project’s specific financing or, should this not exist, the average financing rate of the investor company.
Raw materials, supplies and materials are recorded at the lower of acquisition cost or market value. Acquisition cost is calculated according
to the average price method.
Commercial discounts, rebates obtained, and other similar entries are deducted in the determination of the acquisition price.
The valuation of obsolete, impaired or slow-moving products relates to their net estimated, net realisable value.
Inventories
Discontinued operations are excluded from the results of continuing operations and are presented as a single amount as profit or loss after
tax from discontinued operations in the statement of comprehensive income. Additional disclosures are provided in Note 4. All other notes
to the financial statements include amounts for continuing operations, unless indicated otherwise.
The Company states inventories for the lower of cost and net realisable value. The cost price of finished products and products in progress
includes the direct cost of materials and, when applicable, labor costs, indirect costs incurred to transform raw materials into finished
products, and general expenses incurred in carrying inventories to their current location and conditions. The method used to determine the
cost of inventories is weighted average cost.
The Company conducts an evaluation of the net realisable value of inventories at the end of each year, recording an estimate with a charge
to income when these are overstated. When a situation arises whereby the circumstances, which previously caused the rebate to cease to
exist, or when there is clear evidence of an increase in the net realisable value due to a change in the economic circumstances or prices of
main raw materials, the estimate made previously is modified.
The net realisable value represents the estimate of the sales price, less all finishing estimated costs and costs which will be incurred in
commercialisation, sales, and distribution processes.
A disposal group qualifies as discontinued operation if it is a component of an entity that either has been disposed of, or is classified as held
for sale, and:
In addition to the price paid for the acquisition of tangible property, plant and equipment, the Company has considered the following
concepts as part of the acquisition cost, as applicable:
Gains or losses which are generated from the sale or disposal of property, plant and equipment are recognised as income (or loss) in the
period, and calculated as the difference between the asset’s sales value and its net carrying value.
Depreciation of property, plant and equipment
Property, plant and equipment are depreciated through the straight-line distribution of cost over the estimated technical useful life of the
asset which is the period in which the Company expects to use the asset. When components of one item of property, plant and equipment
have different useful lives, they are recorded as separate assets. Useful lives are reviewed on an annual basis.
The replacement of full assets, which increase the asset’s useful life or its economic capacity, are recorded as a higher value of property,
plant and equipment with the related derecognition of replaced or renewed elements.
Extension, modernisation or improvement costs that represent an increase in productivity, ability or efficiency or an extension of the useful
lives of property, plant and equipment are capitalised as a higher cost of the related assets. All the remaining maintenance, preservation and
repair expenses are charged to expense as incurred.
2. The future costs that the Group will have to experience, related to the closure of its facilities at the end of their useful life, are included
at the present value of disbursements expected to be required to settle the obligation.
Property, Plant and Equipment
The present value of the expected cost for the decommissioning of an asset after its use is included in the cost of the respective asset if the
recognition criteria for a provision are met. Refer to critical accounting estimates and judgements (Note 1) and provisions (Note 17) for
further information about the recognised decommissioning provision.
Costs derived from daily maintenance of property, plant and equipment are recognised when incurred.
Tangible property, plant and equipment assets are stated at acquisition cost, net of the related accumulated depreciation, amortisation and
impairment losses that they might have experienced.
For
per
sona
l use
onl
y
04 FINANCIAL STATEMENTS
2017 FINANCIAL YEAR RESULTS 67
NOTES TO THE FINANCIAL STATEMENTS
for the period ended 30 June 2017
NOTE 1: Summary of Significant Accounting Policies (continued)
An associate is an entity over which the Group has significant influence. Significant influence is the power to participate in the financial and
operating policy decisions of the investee, but is not control or joint control over those policies.
Exploration and evaluation expenditures incurred are capitalised in respect of each identifiable area of interest. These costs are only
capitalised to the extent that they are expected to be recovered through the successful development of the area or where activities in the
area have not yet reached a stage that permits reasonable assessment of the existence of economically recoverable reserves.
A joint venture is a type of joint arrangement whereby the parties that have joint control of the arrangement have rights to the net assets of
the joint venture. Joint control is the contractually agreed sharing of control of an arrangement, which exists only when decisions about the
relevant activities require unanimous consent of the parties sharing control.
The considerations made in determining significant influence or joint control are similar to those necessary to determine control over
subsidiaries.
An item of property, plant and equipment and any significant part initially recognised is derecognised upon disposal or when no future
economic benefits are expected from its use or disposal. Any gain or loss arising on derecognition of the asset (calculated as the difference
between the net disposal proceeds and the carrying amount of the asset) is included in the statement of comprehensive income when the
asset is derecognised.
- Buildings: 20 to 30 years
- Plant and equipment: 5 to 10 years
The Group’s investments in its joint venture and associates are accounted for using the equity method.
After application of the equity method, the Group determines whether it is necessary to recognise an impairment loss on its investment in its
associate or joint venture. At each reporting date, the Group determines whether there is objective evidence that the investment in the
associate or joint venture is impaired. If there is such evidence, the Group calculates the amount of impairment as the difference between
the recoverable amount of the associate or joint venture and its carrying value, then recognises the loss as ‘Share of profit of an associate or
joint venture’ in the statement of comprehensive income.
The Group uses the units of production basis when depreciating specific assets which results in a depreciation charge proportional to the
depletion of the anticipated remaining life of mine production. Each item's economic life, which is assessed annually, has due regard to both
its physical life limitations and to present assessments of economically recoverable reserves of the mine property at which it is located.
When production commences, the accumulated costs for the relevant area of interest are amortised over the life of the area according to
the rate of depletion of the economically recoverable reserves using a units of production method.
The financial statements of the joint venture or associate are prepared for the same reporting period as the Group. When necessary,
adjustments are made to bring the accounting policies in line with those of the Group.
The aggregate of the Group’s share of profit or loss of an associate or joint venture is shown on the face of the statement of comprehensive
income outside operating profit and represents profit or loss after tax and non-controlling interests in the subsidiaries of the associate or
joint venture.
The statement of comprehensive income reflects the Group’s share of the results of operations of the associate or joint venture. Any change
in other comprehensive income of those investees is presented as part of the Group's other comprehensive income. In addition, when there
has been a change recognised directly in the equity of the associate or joint venture, the Group recognises its share of any changes, when
applicable, in the statement of changes in equity. Unrealised gains and losses resulting from transactions between the Group and the
associate or joint venture are eliminated to the extent of the interest in the associate or joint venture.
Under the equity method, the investment in a joint venture or an associate is initially recognised at cost. The carrying amount of the
investment is adjusted to recognise changes in the Group’s share of net assets of the joint venture or associate since the acquisition date.
Goodwill relating to the joint venture or associate is included in the carrying amount of the investment and is neither amortised nor
individually tested for impairment.
Investment in associates and joint ventures
A regular review is undertaken of each area of interest to determine the appropriateness of continuing to capitalise costs in relation to that
area of interest. If, after expenditure is capitalised, information becomes available suggesting that the recovery of expenditure is unlikely,
the amount capitalised is written off in profit or loss in the period when the new information becomes available.
The residual values, useful lives and methods of depreciation of property, plant and equipment are reviewed at each financial year end and
adjusted prospectively, if appropriate.
Exploration & Evaluation Expenditure
The useful lives used for the depreciation and amortisation of assets included in property, plant and equipment are presented below.
Accumulated costs in relation to an abandoned area are written off in full against profit in the year in which the decision to abandon the
area is made.
For
per
sona
l use
onl
y
04 FINANCIAL STATEMENTS
2017 FINANCIAL YEAR RESULTS 68
NOTES TO THE FINANCIAL STATEMENTS
for the period ended 30 June 2017
NOTE 1: Summary of Significant Accounting Policies (continued)
Transactions with non-controlling interests
A liability is current when:
Financial assets are classified, at initial recognition, as financial assets at fair value through profit or loss, loans and receivables, held-to-
maturity investments, available-for-sale financial assets, or as derivatives designated as hedging instruments in an effective hedge, as
appropriate.
A financial instrument is any contract that gives rise to a financial asset of one entity and a financial liability or equity instrument of another
entity.
Initial recognition and measurement
Subsequent measurement
Financial assets at fair value through profit or loss include financial assets held for trading and financial assets designated upon initial
recognition at fair value through profit or loss. Financial assets are classified as held for trading if they are acquired for the purpose of selling
or repurchasing in the near term. Derivatives, including separated embedded derivatives are also classified as held for trading unless they
are designated as effective hedging instruments as defined by AASB 139.
- It is expected to be settled in the Group's normal operating cycle
- There is no unconditional right to defer the settlement of the liability for at least twelve months after the reporting period.
- It is held primarily for the purpose of trading
The Group classifies all other liabilities as non-current.
Deferred tax assets and liabilities are classified as non-current assets and liabilities.
Financial Instruments - initial recognition and subsequent measurement
- It is due to be settled within twelve months after the reporting period, or
Current versus Non-Current classification
i) Financial assets
Derivatives embedded in host contracts are accounted for as separate derivatives and recorded at fair value if their economic characteristics
and risks are not closely related to those of the host contracts and the host contracts are not held for trading or designated at fair value
though profit or loss. These embedded derivatives are measured at fair value with changes in fair value recognised in profit and loss. Re-
assessment only occurs if there is either a change in the terms of the contract that significantly modifies the cash flows that would otherwise
be required or a reclassification of a financial asset out of the fair value through profit or loss.
The Group has not designated any financial assets at fair value through profit or loss. Financial assets at fair value through profit or loss are
carried in the statement of financial position at fair value with net changes in fair value presented as finance costs (negative net changes in
fair value) or finance income (positive net changes in fair value) in the statement of comprehensive income.
Financial assets at fair value through profit or loss
The subsequent measurement of financial assets depends on their classification as described below:
Purchases or sales of financial assets that require delivery of assets within a time frame established by regulation or convention in the
market place (regular way trades) are recognised on the trade date, i.e., the date that the Group commits to purchase or sell the asset.
All financial assets are recognised initially at fair value plus, in the case of financial assets not subsequently measured at fair value through
profit or loss, transaction costs that are attributable to the acquisition of the financial asset.
- Cash or cash equivalent unless restricted from being exchanged or used to settle a liability for at least twelve months after the reporting
period.
- Expected to be realised within twelve months after the reporting period, or
- Held primarily for the purpose of trading
- Expected to be realised or intended to sold or consumed in the Group's normal operating cycle
The Group presents assets and liabilities in statement of financial position based on current/non-current classification. An asset as current
when it is:
Non-controlling interests are recorded in the consolidated statement of financial position within equity separate from equity attributable to
the owners of the Parent.
Upon loss of joint control over the associate or joint venture, the Group measures and recognises any retained investment at its fair value.
Any difference between the carrying amount of the associate or joint venture upon loss of joint control and the fair value of the retained
investment and proceeds from disposal is recognised in profit or loss.
The Group classifies all other assets as non-current.
For
per
sona
l use
onl
y
04 FINANCIAL STATEMENTS
2017 FINANCIAL YEAR RESULTS 69
NOTES TO THE FINANCIAL STATEMENTS
for the period ended 30 June 2017
NOTE 1: Summary of Significant Accounting Policies (continued)
ii) Impairment of financial assets
Derecognition
- The rights to receive cash flows from the asset have expired; or
Non-derivative financial assets with fixed or determinable payments and fixed maturities are classified as held to maturity when the Group
has the positive intention and ability to hold them to maturity. After initial measurement, held to maturity investments are measured at
amortised cost using the EIR, less impairment. Amortised cost is calculated by taking into account any discount or premium on acquisition
and fees or costs that are an integral part of the EIR. The EIR amortisation is included as finance income in the statement of comprehensive
income. The losses arising from impairment are recognised in the statement of comprehensive income in finance costs.
Financial assets carried at amortised cost
Available for sale (AFS) financial investments
For AFS financial investments, the Group assesses at each reporting date whether there is objective evidence that an investment or a Group
of investments is impaired.
The carrying amount of the asset is reduced through the use of an allowance account and the loss is recognised in the statement of
comprehensive income. Interest income (recorded as finance income on the statement of comprehensive income) continues to be accrued
on the reduced carrying amount and is accrued using the rate of interest used to discount the future cash flows for the purpose of measuring
the impairment loss. Loans together with the associated allowance, are written off when there is no realistic prospect of future recovery and
all collateral has been realised or has been transferred to the Group. If, in a subsequent year, the amount of the estimated impairment loss
increases or decreases because of an event occurring after the impairment was recognised, the previously recognised impairment loss is
increased or reduced by adjusting the allowance account. If a write-off is later recovered, the recovery is credited to finance costs in the
statement of comprehensive income.
The amount of any impairment loss identified is measured as the difference between the asset’s carrying amount and the present value of
estimated future cash flows (excluding future expected credit losses that have not yet been incurred). The present value of the estimated
future cash flows is discounted at the financial asset’s original EIR.
For financial assets carried at amortised cost, the Group first assesses whether impairment exists individually for financial assets that are
individually significant, or collectively for financial assets that are not individually significant. If the Group determines that no objective
evidence of impairment exists for an individually assessed financial asset, whether significant or not, it includes the asset in a Group of
financial assets with similar credit risk characteristics and collectively assesses them for impairment. Assets that are individually assessed for
impairment and for which an impairment loss is, or continues to be, recognised are not included in a collective assessment of impairment.
The Group assesses, at each reporting date, whether there is objective evidence that a financial asset or a Group of financial assets is
impaired. An impairment exists if one or more events that has occurred since the initial recognition of the asset (an incurred ‘loss event’) has
an impact on the estimated future cash flows of the financial asset or the Group of financial assets that can be reliably estimated. Evidence
of impairment may include indications that the debtors or a Group of debtors is experiencing significant financial difficulty, default or
delinquency in interest or principal payments, the probability that they will enter bankruptcy or other financial reorganisation and
observable data indicating that there is a measurable decrease in the estimated future cash flows, such as changes in arrears or economic
conditions that correlate with defaults.
Continuing involvement that takes the form of a guarantee over the transferred asset is measured at the lower of the original carrying
amount of the asset and the maximum amount of consideration that the Group could be required to pay.
When the Group has transferred its rights to receive cash flows from an asset or has entered into a passthrough arrangement, it evaluates if
and to what extent it has retained the risks and rewards of ownership. When it has neither transferred nor retained substantially all of the
risks and rewards of the asset, nor transferred control of the asset, the Group continues to recognise the transferred asset to the extent of
the Group’s continuing involvement. In that case, the Group also recognises an associated liability. The transferred asset and the associated
liability are measured on a basis that reflects the rights and obligations that the Group has retained.
- The Group has transferred its rights to receive cash flows from the asset or has assumed an obligation to pay the received cash flows in full
without material delay to a third party under a ”pass-through” arrangement; and either (a) the Group has transferred substantially all the
risks and rewards of the asset, or (b) the Group has neither transferred nor retained substantially all the risks and rewards of the asset, but
has transferred control of the asset.
Held-to-maturity investments
A financial asset (or, where applicable, a part of a financial asset or part of a Group of similar financial assets) is primarily de-recognised (i.e.
removed from the Group's consolidated statement of financial position) when:
Loans and receivables are non-derivative financial assets with fixed or determinable payments that are not quoted in an active market. After
initial measurement, such financial assets are subsequently measured at amortised cost using the effective interest rate (EIR) method, less
impairment. Amortised cost is calculated by taking into account any discount or premium on acquisition and fees or costs that are an
integral part of the EIR. The EIR amortisation is included in finance income in the statement of comprehensive income. The losses arising
from impairment are recognised in the statement of comprehensive income in finance costs for loans and cost of sales for receivables.
Loans and receivables
For
per
sona
l use
onl
y
04 FINANCIAL STATEMENTS
2017 FINANCIAL YEAR RESULTS 70
NOTES TO THE FINANCIAL STATEMENTS
for the period ended 30 June 2017
NOTE 1: Summary of Significant Accounting Policies (continued)
In the case of debt instruments classified as AFS, the impairment is assessed based on the same criteria as financial assets carried at
amortised cost. However, the amount recorded for impairment is the cumulative loss measured as the difference between the amortised
cost and the current fair value, less any impairment loss on that investment previously recognised in the statement of comprehensive
income.
Financial guarantee contracts issued by the Group are those contracts that require a payment to be made to reimburse the holder for a loss
it incurs because the specified debtor fails to make a payment when due in accordance with the terms of a debt instrument. Financial
guarantee contracts are recognised initially as a liability at fair value, adjusted for transaction costs that are directly attributable to the
issuance of the guarantee. Subsequently, the liability is measured at the higher of the best estimate of the expenditure required to settle the
present obligation at the reporting date and the amount recognised less cumulative amortisation.
Amortised cost is calculated by taking into account any discount or premium on acquisition and fees or costs that are an integral part of the
EIR. The EIR amortisation is included in finance costs in the statement of comprehensive income.
Financial liabilities at fair value through profit or loss include financial liabilities held for trading and financial liabilities designated upon initial
recognition as at fair value through profit or loss. Financial liabilities are classified as held for trading if they are incurred for the purpose of
repurchasing in the near term. This category includes derivative financial instruments entered into by the Group that are not designated as
hedging instruments in hedge relationships as defined by AASB 139. Separated embedded derivatives are also classified as held for trading
unless they are designated as effective hedging instruments.
The Group’s financial liabilities include trade and other payables, loans and borrowings, including bank overdrafts, financial guarantee
contracts, and derivative financial instruments.
Financial liabilities are classified, at initial recognition, as financial liabilities at fair value through profit or loss, loans and borrowings,
payables, or as derivatives designated as hedging instruments in an effective hedge, as appropriate. All financial liabilities are recognised
initially at fair value and, in the case of loans and borrowings and payables, net of directly attributable transaction costs.
iii) Financial liabilities
Initial recognition and measurement
Subsequent measurement
The measurement of financial liabilities depends on their classification, described as follows:
Financial liabilities at fair value through profit or loss
After initial recognition, interest bearing loans and borrowings are subsequently measured at amortised cost using the EIR method. Gains
and losses are recognised in profit or loss when the liabilities are derecognised as well as through the EIR amortisation process.
Financial guarantee contracts
Financial liabilities designated upon initial recognition at fair value through profit or loss are designated at the initial date of recognition, and
only if the criteria in AASB 139 are satisfied. The Group has not designated any financial liability as at fair value through profit or loss.
Gains or losses on liabilities held for trading are recognised in the statement of comprehensive income.
Future interest income continues to be accrued based on the reduced carrying amount of the asset, using the rate of interest used to
discount the future cash flows for the purpose of measuring the impairment loss. The interest income is recorded as part of finance income.
If, in a subsequent year, the fair value of a debt instrument increases and the increase can be objectively related to an event occurring after
the impairment loss was recognised in the statement of comprehensive income, the impairment loss is reversed through the statement of
comprehensive income.
The determination of what is "significant" or "prolonged" requires judgement. In making this judgement, the Group evaluates, among other
factors, the duration or extent to which the fair value of an investment is less than its cost.
In the case of equity investments classified as AFS, objective evidence would include a significant or prolonged decline in the fair value of the
investment below its cost. ”Significant” is evaluated against the original cost of the investment and ”prolonged” against the period in which
the fair value has been below its original cost. When there is evidence of impairment, the cumulative loss – measured as the difference
between the acquisition cost and the current fair value, less any impairment loss on that investment previously recognised in the statement
of comprehensive income – is removed from other comprehensive income and recognised in the statement of comprehensive income.
Impairment losses on equity investments are not reversed through the statement of comprehensive income; increases in their fair value
after impairment are recognised directly in other comprehensive income.
Derecognition
A financial liability is derecognised when the obligation under the liability is discharged or cancelled, or expires. When an existing financial
liability is replaced by another from the same lender on substantially different terms, or the terms of an existing liability are substantially
modified, such an exchange or modification is treated as the derecognition of the original liability and the recognition of a new liability. The
difference in the respective carrying amounts is recognised in the statement of comprehensive income.
Loans and borrowings
For
per
sona
l use
onl
y
04 FINANCIAL STATEMENTS
2017 FINANCIAL YEAR RESULTS 71
NOTES TO THE FINANCIAL STATEMENTS
for the period ended 30 June 2017
NOTE 1: Summary of Significant Accounting Policies (continued)
Initial recognition and subsequent measurement
For the purpose of hedge accounting, hedges are classified as:
The fair value of an asset or a liability is measured using the assumptions that market participants would use when pricing the asset or
liability, assuming that market participants act in their economic best interest.
The principal or the most advantageous market must be accessible by the Group.
- In the absence of a principal market, in the most advantageous market for the asset or liability.
- In the principal market for the asset or liability, or
Fair value is the price that would be received to sell an asset or paid to transfer a liability in an orderly transaction between market
participants at the measurement date. The fair value measurement is based on the presumption that the transaction to sell the asset or
transfer the liability takes place either:
The Group measures certain financial instruments, such as derivatives, at fair value at each reporting date.
At the inception of a hedge relationship, the Group formally designates and documents the hedge relationship to which it wishes to apply
hedge accounting and the risk management objective and strategy for undertaking the hedge. The documentation includes identification of
the hedging instrument, the hedged item or transaction, the nature of the risk being hedged and how the entity will assess the effectiveness
of changes in the hedging instrument's fair value in offsetting the exposure to changes in the hedged item's fair value or cash flows
attributable to the hedged risk. Such hedges are expected to be highly effective in achieving offsetting changes in fair value or cash flows and
are assessed on an ongoing basis to determine that they actually have been highly effective throughout the financial reporting periods for
which they were designated.
- Hedges of a net investment in a foreign operation.
Fair Value Measurement
- Cash flow hedges: when hedging the exposure to variability in cash flows that is either attributable to a particular risk associated with a
recognised asset or liability or a highly probable forecast transaction or the foreign currency risk in an unrecognised firm commitment
- Fair value hedges: when hedging the exposure to changes in the fair value of a recognised asset or liability or an unrecognised firm
commitment
Any gains or losses arising from changes in the fair value of derivatives are taken directly to profit or loss, except for the effective portion of
cash flow hedges, which is recognised in other comprehensive income and later reclassified to profit or loss when the hedge item affects
profit or loss.
The Group uses derivative financial instruments, such as interest rate swaps, to hedge its interest rate risks. Such derivative financial
instruments are initially recognised at fair value on the date on which a derivative contract is entered into and are subsequently re-
measured at fair value. Derivatives are carried as financial assets when the fair value is positive and as financial liabilities when the fair value
is negative.
Hedges that meet the strict criteria for hedge accounting are accounted for as described below:
Cash flow hedges
Financial assets and financial liabilities are offset and the net amount is reported in the consolidated statement of financial position if there
is a currently enforceable legal right to offset the recognised amounts and there is an intention to settle on a net basis, to realise the assets
and settle the liabilities simultaneously.
If the hedging instrument expires or is sold, terminated or exercised without replacement or rollover (as part of the hedging strategy), or if its
designation as a hedge is revoked, or when the hedge no longer meets the criteria for hedge accounting, any cumulative gain or loss
previously recognised in other comprehensive income remains separately in equity until the forecast transaction occurs or the foreign
currency firm commitment is met.
In the current period and prior periods, the Group had no direct derivative financial instrument, but recorded its share of the joint venture's
cash flow hedge revaluation through other comprehensive income.
Amounts recognised as other comprehensive income are transferred to profit or loss when the hedged transaction affects profit or loss, such
as when the hedged financial income or financial expense is recognised. When the hedged item is the cost of a non-financial asset or non-
financial liability, the amounts recognised as other comprehensive income are transferred to the initial carrying amount of the non-financial
asset or liability.
The Group uses interest rate swaps as hedges of its exposure to interest rate risk in forecast transactions. The ineffective portion relating to
interest rate swap contracts is recognised in finance costs.
The effective portion of the gain or loss on the hedging instrument is recognised in other comprehensive income in the cash flow hedge
reserve, while any ineffective portion is recognised immediately in profit or loss in the statement of comprehensive income as other
operating expenses.
iv) Offsetting of financial instruments
Derivative financial instruments and hedge accounting
For
per
sona
l use
onl
y
04 FINANCIAL STATEMENTS
2017 FINANCIAL YEAR RESULTS 72
NOTES TO THE FINANCIAL STATEMENTS
for the period ended 30 June 2017
NOTE 1: Summary of Significant Accounting Policies (continued)
Cash and Cash Equivalents
Issued Capital
For the purpose of the consolidated statement of cash flows, cash and cash equivalents consist of cash and short-term deposits as defined
above, net of outstanding bank overdrafts as they are considered an integral part of the Group's cash management.
Cash and short-term deposits in the statement of financial position comprise cash at banks and on hand and short-term deposits with a
maturity of three months or less, which are subject to an insignificant risk of changes in value.
The Group uses valuation techniques that are appropriate in the circumstances and for which sufficient data are available to measure fair
value, maximising the use of relevant observable inputs and minimising the use of unobservable inputs.
A fair value measurement of a non-financial asset takes into account a market participant's ability to generate economic benefits by using
the asset in its highest and best use or by selling it to another market participant that would use the asset in its highest and best use.
- Level 1 — Quoted (unadjusted) market prices in active markets for identical assets or liabilities
- Level 2 — Valuation techniques for which the lowest level input that is significant to the fair value measurement is directly or indirectly
observable
For assets excluding goodwill, an assessment is made at each reporting date to determine whether there is an indication that previously
recognised impairment losses no longer exist or have decreased. If such indication exists, the Group estimates the asset’s or CGU’s
recoverable amount. A previously recognised impairment loss is reversed only if there has been a change in the assumptions used to
determine the asset’s recoverable amount since the last impairment loss was recognised. The reversal is limited so that the carrying amount
of the asset does not exceed its recoverable amount, nor exceed the carrying amount that would have been determined, net of
depreciation, had no impairment loss been recognised for the asset in prior years. Such reversal is recognised in the statement of
comprehensive income unless the asset is carried at a revalued amount, in which case, the reversal is treated as a revaluation increase.
Impairment of Non-Financial Assets
All assets and liabilities for which fair value is measured or disclosed in the financial statements are categorised within the fair value
hierarchy, described as follows, based on the lowest level input that is significant to the fair value measurement as a whole:
For assets and liabilities that are recognised in the financial statements at fair value on a recurring basis, the Group determines whether
transfers have occurred between levels in the hierarchy by re-assessing categorisation (based on the lowest level input that is significant to
the fair value measurement as a whole) at the end of each reporting period.
- Level 3 — Valuation techniques for which the lowest level input that is significant to the fair value measurement is unobservable
Ordinary shares are classified as equity. Transaction costs arising on the issue of ordinary shares are recognised in equity as a reduction of
the share proceeds received.
Impairment losses of continuing operations, including impairment on inventories, are recognised in the statement of comprehensive income
in expense categories consistent with the function of the impaired asset.
The Group bases its impairment calculation on budgets and forecast calculations, which are prepared separately for each of the Group’s
CGUs to which the individual assets are allocated.
In assessing value in use, the estimated future cash flows are discounted to their present value using a post-tax discount rate that reflects
current market assessments of the time value of money and the risks specific to the asset. In determining fair value less costs of disposal,
recent market transactions are taken into account. If no such transactions can be identified, an appropriate valuation model is used. These
calculations are corroborated by valuation multiples, quoted share prices for publicly traded companies or other available fair value
indicators.
The Group assesses, at each reporting date, whether there is an indication that an asset may be impaired. If any indication exists, or when
annual impairment testing for an asset is required, the Group estimates the asset’s recoverable amount. An asset’s recoverable amount is
the higher of an asset’s or cash-generating unit’s (CGU) fair value less costs of disposal and its value in use. Recoverable amount is
determined for an individual asset, unless the asset does not generate cash inflows that are largely independent of those from other assets
or Groups of assets in which case the asset is allocated to its appropriate CGU. When the carrying amount of an asset or CGU exceeds its
recoverable amount, the asset or CGU is considered impaired and is written down to its recoverable amount.
For the purpose of fair value disclosures, the Group has determined classes of assets and liabilities on the basis of the nature, characteristics
and risks of the asset or liability and the level of the fair value hierarchy as explained above.
At each reporting date, movements in the values of assets and liabilities which are required to be re-measured or re-assessed as per the
Group’s accounting policies are analysed by the audit committee.
For
per
sona
l use
onl
y
04 FINANCIAL STATEMENTS
2017 FINANCIAL YEAR RESULTS 73
NOTES TO THE FINANCIAL STATEMENTS
for the period ended 30 June 2017
NOTE 1: Summary of Significant Accounting Policies (continued)
Revenue and Other Income
Interest income
Provisions
Environmental protection, rehabilitation and closure costs
Employee benefits
Share Based Payments - Equity-settled transactions
Sale of goods
Revenue from the sale of goods is recognised when the significant risk and rewards of ownership shifts from seller to buyer as dictated by
the Incoterms specified in the sales contract. Revenue from the sale of goods is measured at the fair value of the consideration received or
receivable, net of returns and allowances, trade discounts, and volume rates.
Revenue is recognised to the extent that it is probable that the economic benefits will flow to the Group and the revenue can be reliably
measured, regardless of when the payment is being made. Revenue is measured at the fair value of the consideration received or receivable,
taking into account contractually defined terms of payment and excluding goods and services tax (GST). The specific recognition criteria
described below must also be met before revenue is recognised.
Provisions are recognised when the Group has a present obligation (legal or constructive) as a result of a past event, it is probable that an
outflow of resources embodying economic benefits will be required to settle the obligation and a reliable estimate can be made of the
amount of the obligation. When the Group expects some or all of a provision to be reimbursed, for example, under an insurance contract,
the reimbursement is recognised as a separate asset, but only when the reimbursement is virtually certain. The expense relating to a
provision is presented in the statement of comprehensive income net of any reimbursement.
For all financial instruments measured at amortised cost and interest-bearing financial assets, interest income or expense is recorded using
the effective interest rate (EIR). EIR is the rate that exactly discounts the estimated future cash payments or receipts over the expected life of
the financial instrument or a shorter period, where appropriate, to the net carrying amount of the financial asset or liability. Interest income
is included in finance income in the statement of comprehensive income.
Provision is made for close down, restoration and environmental rehabilitation costs (which include the dismantling and demolition of
infrastructure, removal of residual materials and remediation of disturbed areas) in the financial period when the related environmental
disturbance occurs, based on the estimated future costs using information available at the statement of financial position date. The
provision is discounted using a current market-based pre-tax discount rate that reflects the time value of money and risk specific to the
liability. The unwinding of the discount is included in interest expense. At the time of establishing the provision, a corresponding asset is
capitalised, where it gives rise to a future benefit, and depreciated over future production from the operations to which it relates. The
provision is reviewed on an annual basis for changes to obligations, legislation or discount rates that impact estimated costs or lives of
operations. The cost of the related asset is adjusted for changes in the provision resulting from changes in the estimated cash flows or
discount rate and the adjusted cost of the asset is depreciated prospectively.
Wages, salaries, annual leave and sick leave
Liabilities for wages and salaries, including non-monetary benefits, annual leave and accumulating sick leave expected to be settled within
12 months of the reporting date are recognised in respect of employees' services up to the reporting date. They are measured at the
amounts expected to be paid when the liabilities are settled. Based on past experience, the Group does not expect the full amount of annual
leave classified as current liabilities to be settled within th next 12 months. However, these amounts must be classified as current liabilities
since the Group does not have an unconditional right to defer the settlement of these amounts. Expenses for non-accumulating sick leave
are recognised when the leave is taken and are measured at the rates paid or payable.
The dilutive effect of outstanding options is reflected as additional share dilution in the computation of diluted earnings per share (further
details are given in Note 6).
When the terms of an equity-settled award are modified, the minimum expense recognised is the expense had the terms not been modified,
if the original terms of the award are met. An additional expense is recognised for any modification that increases the total fair value of the
share-based payment transaction, or is otherwise beneficial to the employee as measured at the date of modification.
No expense is recognised for awards that do not ultimately vest, except for equity-settled transactions for which vesting is conditional upon
a market or non-vesting condition. These are treated as vesting irrespective of whether or not the market or non-vesting condition is
satisfied, provided that all other performance and/or service conditions are satisfied.
The cost of equity-settled transactions is determined by the fair value at the date when the grant is made using an appropriate valuation
model. That cost is recognised, together with a corresponding increase in other capital reserves in equity, over the period in which the
performance and/or service conditions are fulfilled in employee benefits expense (Note 2b). The cumulative expense recognised for equity-
settled transactions at each reporting date until the vesting date reflects the extent to which the vesting period has expired and the Group’s
best estimate of the number of equity instruments that will ultimately vest. The statement of comprehensive income expense or credit for a
period represents the movement in cumulative expense recognised as at the beginning and end of that period and is recognised in employee
benefits expense (Note 2b).
For
per
sona
l use
onl
y
04 FINANCIAL STATEMENTS
2017 FINANCIAL YEAR RESULTS 74
NOTES TO THE FINANCIAL STATEMENTS
for the period ended 30 June 2017
NOTE 1: Summary of Significant Accounting Policies (continued)
Group as a lessee
Earnings per Share (EPS)
Foreign Currency Translation
Finance leases are capitalised at the commencement of the lease at the inception date fair value of the leased property or, if lower, at the
present value of the minimum lease payments. Lease payments are apportioned between finance charges and reduction of the lease liability
so as to achieve a constant rate of interest on the remaining balance of the liability. Finance charges are recognised in finance costs in the
statement of comprehensive income.
Transactions and balances
A lease is classified at the inception date as a finance lease or an operating lease. A lease that transfers substantially all the risks and rewards
incidental to ownership to the Group is classified as a finance lease. An operating lease is a lease other than a finance lease.
The determination of whether an arrangement is, or contains, a lease is based on the substance of the arrangement at the inception of the
lease. The arrangement is, or contains, a lease if fulfilment of the arrangement is dependent on the use of a specific asset or assets, even if
that right is not explicitly specified in an arrangement.
Borrowing Costs
Differences arising on settlement or translation of monetary items are recognised in profit or loss with the exception of monetary items that
are designated as part of the Group’s net investment of a foreign operation. These are recognised in other comprehensive income until the
net investment is disposed of, at which time, the cumulative amount is reclassified to profit or loss. Tax charges and credits attributable to
exchange differences on those monetary items are also recorded in other comprehensive income.
Group as a lessor
Leases in which the Group does not transfer substantially all the risks and benefits of ownership of an asset are classified as operating leases.
Initial direct costs incurred in negotiating an operating lease are added to the carrying amount of the leased asset and recognised over the
lease term on the same basis as rental income. Contingent rents are recognised as revenue in the period in which they are earned.
Leases
Long service leave
Basic earnings per share amounts are calculated by dividing the net profit for the year attributable to ordinary equity holders of the Parent
by the weighted average number of ordinary shares outstanding during the year.
Borrowing costs directly attributable to the acquisition, construction or production of an asset that necessarily takes a substantial period of
time to get ready for its intended use or sale are capitalised as part of the cost of the asset. All other borrowing costs are expensed in the
period in which they occur. Borrowing costs consist of interest and other costs that an entity incurs in connection with the borrowing of
funds.
Diluted earnings per share amounts are calculated by dividing the net profit attributable to ordinary equity holders of the Parent by the
weighted average number of ordinary shares outstanding during the year plus the weighted average number of ordinary shares that would
be issued on conversion of all the dilutive potential ordinary shares into ordinary shares.
The Group recognises a liability for long service leave measured as the present value of expected future payments to be made in respect of
services provided by employees up to the reporting date using the projected unit credit method. Consideration is given to expected future
wage and salary levels, experience of employee departures, and periods of service. Expected future payments are discounted using market
yields at the reporting date on the applicable corporate bond with terms to maturity and currencies that match, as closely as possible, the
estimated future cash outflows.
Monetary assets and liabilities denominated in foreign currencies are translated at the functional currency spot rates of exchange at the
reporting date.
Transactions in foreign currencies are initially recorded by the Group’s entities at their respective functional currency spot rates at the date
the transaction first qualifies for recognition.
The Group’s consolidated financial statements are presented in US dollars, which is the Parent’s presentation currency. For each entity, the
Group determines the functional currency and items included in the financial statements of each entity are measured using that functional
currency. The Group uses the direct method of consolidation and on disposal of a foreign operation, the gain or loss that is reclassified to
profit or loss reflects the amount that arises from using this method.
A leased asset is depreciated over the useful life of the asset. However, if there is no reasonable certainty that the Group will obtain
ownership by the end of the lease term, the asset is depreciated over the shorter of the estimated useful life of the asset and the lease term.
Operating lease payments are recognised as an operating expense in the statement of comprehensive income on a straight-line basis over
the lease term.
For
per
sona
l use
onl
y

04 FINANCIAL STATEMENTS
2017 FINANCIAL YEAR RESULTS 75
NOTES TO THE FINANCIAL STATEMENTS
for the period ended 30 June 2017
NOTE 1: Summary of Significant Accounting Policies (continued)
Critical Accounting Estimates and Judgements
Comparative Figures and Financial Period
Any goodwill arising on the acquisition of a foreign operation and any fair value adjustments to the carrying amounts of assets and liabilities
arising on the acquisition are treated as assets and liabilities of the foreign operation and translated at the spot rate of exchange at the
reporting date.
On consolidation, the assets and liabilities of foreign operations are translated into US dollars at the rate of exchange prevailing at the
reporting date and their statements of profit or loss are translated at the average exchange rate for each month of the financial year. The
exchange differences arising on translation for consolidation purposes are recognised in other comprehensive income. On disposal of a
foreign operation, the component of other comprehensive income relating to that particular foreign operation is recognised in profit or loss.
Non-monetary items that are measured in terms of historical cost in a foreign currency are translated using the exchange rates at the dates
of the initial transactions. Non-monetary items measured at fair value in a foreign currency are translated using the exchange rates at the
date when the fair value is determined. The gain or loss arising on translation of non-monetary items measured at fair value is treated in line
with the recognition of gain or loss on change in fair value of the item (i.e., translation differences on items whose fair value gain or loss is
recognised in other comprehensive income or profit or loss are also recognised in other comprehensive income or profit or loss,
respectively).
Group companies
Exploration, evaluation and development expenditures
The accounting policies adopted are consistent with those of the previous financial year. New accounting standards effective during the year
had no impact on the Group.
When required by Accounting Standards, comparative figures have been adjusted to conform to changes in presentation for the current
financial year.
The Group has recognised a provision for rehabilitation obligations associated with Borax Argentina S.A.'s operations. In determining the
present value of the provision, assumptions and estimates are made in relation to discount rates, the expected cost to dismantle and
remove the plant from the site and the expected timing of those costs. The carrying amount of the provision as at 30 June 2017 was US
$9,552,600 (2016: US $9,458,020).
The Group measures the cost of equity-settled transactions with employees by reference to the fair value of the equity instruments at the
date at which they are granted. Estimating fair value for share-based payment transactions requires determination of the most appropriate
valuation model, which is dependent on the terms and conditions of the grant. This estimate also requires determination of the most
appropriate inputs to the valuation model including the expected life of the share option, volatility and dividend yield and making
assumptions about them. The assumptions and models used for estimating fair value for share-based payment transactions are disclosed in
Note 23.
Carrying value of non-current assets subject to impairment testing
The Group considers annually whether there has been any indicators of impairment and then tests whether non-current assets, including
investments in joint ventures and property, plant and equipment, have suffered any impairment, in accordance with the accounting policy
stated in Note 1. The recoverable amounts of cash-generating units have been determined based on value in use calculations or fair value
less costs to sell. These calculations require the use of assumptions. Refer to Notes 12 and 15 for more details on the carrying amounts of
non-current assets subject to impairment testing.
The Group makes estimates and judgements in applying the accounting policies.
The preparation of the Group’s consolidated financial statements requires management to make judgements, estimates and assumptions
that affect the reported amounts of revenues, expenses, assets and liabilities, and the accompanying disclosures, and the disclosure of
contingent liabilities. Uncertainty about these assumptions and estimates could result in outcomes that require a material adjustment to the
carrying amount of assets or liabilities affected in future periods.
Accounting Standards and Interpretations issued but not yet effective
Australian Accounting Standards and Interpretations that have recently been issued or amended but are not yet effective and have not been
adopted by the Group for the annual reporting period ended 30 June 2017, outlined as follows:
Exploration, evaluation and development expenditures incurred are capitalised in respect of each identifiable area of interest. Such costs are
written off when the amounts are not expected to be recovered through the successful development of the area, or through sale. The
assessment of whether successful development will occur, or the amount to be recovered in a sales transaction, involves the use of
judgements and estimates.
Share-based payments
Provision for rehabilitation
New and amended standards and interpretations
For
per
sona
l use
onl
y
04 FINANCIAL STATEMENTS
2017 FINANCIAL YEAR RESULTS 76
NOTES TO THE FINANCIAL STATEMENTS
for the period ended 30 June 2017
NOTE 1: Summary of Significant Accounting Policies (continued)
(b) a partial gain or loss to be recognised when a transaction involves assets that do not constitute a business, even if these assets are
housed in a subsidiary.
(a) a full gain or loss to be recognised when a transaction involves a business (whether it is housed in a subsidiary or not); and
AASB 2014-10 amends AASB 10 Consolidated Financial Statements and AASB 128 Investments in Associates and Joint Ventures to address an
inconsistency between the requirements in AASB 10 and those in AASB 128 (August 2011), in dealing with the sale or contribution of assets
between an investor and its associate or joint venture. The amendments require:
Hedge Accounting
AASB 9 introduces a new expected-loss impairment model that will require more timely recognition of expected credit losses. Specifically,
the new Standard requires entities to account for expected credit losses from when financial instruments are first recognised and to
recognise full lifetime expected losses on a more timely basis.
AASB 9 also removes the volatility in profit or loss that was caused by changes in the credit risk of liabilities elected to be measured at fair
value. This change in accounting means that gains or losses attributable to changes in the entity's own credit risk would be recognised in OCI.
These amounts recognised in OCI are not recycled to profit or loss if the liability is ever repurchased at a discount.
The Group does not believe that there will be a material financial impact to either the statement of comprehensive income or the statement
of financial position once this accounting standard is adopted. The new standard introduces expanded disclosure requirements and changes
in presentation. These are expected to change the nature and extent of the Group’s disclosures about its financial instruments particularly in
the year of the adoption of the new standard.
Amendments to AASB 9 (December 2009 & 2010 editions and AASB 2013-9) issued December 2013 included the new hedge accounting
requirements, including changes to hedge effectiveness testing, treatment of hedging costs, risk components that can be hedged and
disclosures.
Financial assets
Changes introduced by AASB 9 in respect of financial liabilities are limited to the measurement of liabilities designated at fair value through
profit or loss (FVPL) using the fair value option. The Group does not carry any financial liabiities designated at FVPL.
c. Financial assets can be designated and measured at fair value through profit or loss at initial recognition if doing so eliminates or
significantly reduces a measurement or recognition inconsistency that would arise from measuring assets or liabilities, or recognising the
gains and losses on them, on different bases.
b. Allows an irrevocable election on initial recognition to present gains and losses on investments in equity instruments that are not held for
trading in other comprehensive income. Dividends in respect of these investments that are a return on investment can be recognised in
profit or loss and there is no impairment or recycling on disposal of the instrument.
a. Financial assets that are debt instruments will be classified based on (1) the objective of the entity's business model for managing the
financial assets; (2) the characteristics of the contractual cash flows.
AASB 9 includes requirements for a simpler approach for classification and measurement of financial assets compared with the requirements
of AASB 139. There are also some changes made in relation to financial liabilities. While the Group has yet to undertake a detailed
assessment of the classification and measurement of financial assets, equity instruments currently classified as available-for-sale (AFS)
financial assets would appear to satisfy the conditions for classification as at fair value through other comprehensive income (FVOCI) and
hence there will be no change to the accounting for these assets. The Group does not expect any significant impact from adopting these
changes when they become applicable.
- AASB 9 Financial Instruments (Application date of standard 1 January 2018; Application date of Group 1 July 2018)
The main changes are described below.
Financial liabilities
Impairment
Management is currently assessing the effects of applying the new standard. At this stage, the Group is not able to estimate the effect of the
new rules on the Group’s financial statements. The Group will make more detailed assessments of the effect over the next twelve months.
AASB 15 Revenue from Contracts with Customers replaces the existing revenue recognition standards AASB 111 Construction Contracts ,
AASB 118 Revenue and related Interpretations (AASB Interpretation 13 Customer Loyalty Programmes , AASB Interpretation 15 Agreements
for the Construction of Real Estate , AASB Interpretation 18 Transfers of Assets from Customers and SIC-31 Revenue—Barter Transactions
Involving Advertising Services and Interpretation 1042 Subscriber Aquisition Costs in the Telecommunications Industry). AASB 15
incorporates the requirements of IFRS 15 Revenue from Contracts with Customers issued by the International Accounting Standards Board
(IASB) and developed jointly with the US Financial Accounting Standards Board (FASB).
- AASB 15 Revenue from Contracts with Customers (Application date of standard 1 January 2018; Application date of Group 1 July 2018)
- AASB 2014-10 Amendments to Australian Accounting Standards - Sale or Contribution of Assets between an Investor and its associate or
Joint Venture (Application date of standard 1 January 2018; Application date of Group 1 July 2018)
For
per
sona
l use
onl
y
04 FINANCIAL STATEMENTS
2017 FINANCIAL YEAR RESULTS 77
NOTES TO THE FINANCIAL STATEMENTS 2017 2016
for the period ended 30 June 2017 US $ US $
Consolidated Group
NOTE 1: Summary of Significant Accounting Policies (continued)
Lessor accounting
NOTE 2: Result for the Period
Property rental agreements 224,148 202,703 Recovery from Joint Venture - 1,059,742 Income from bonds sold - 1,599,063 Export credit income - 30,394 Net gain on disposal of property, plant and equipment 15,775 105,785 Total other income 239,923 2,997,687
2b) Corporate expenses
Employee benefit expenses (2,588,320) (1,957,195) Legal and consulting fees (1) (551,709) (2,384,182) Share-based payment expense (602,489) (746,892) Other costs (1,719,060) (1,404,803) Total corporate expenses (5,461,578) (6,493,072)
Corporate expenditure relates to Brisbane Corporate
2a) Other income
(1) Legal and consulting fees includes US $nil (2016: US$1,656,236) of Rio Tinto Minerals (RTM) legal costs for the financial period.
The Group does not believe that there will be a material financial impact to either the statement of comprehensive income or the statement
of financial position once this accounting standard is adopted. There are no cash settled share-based payment transactions within the
Group.
There are no other standards that are not issued, not yet effective and that are expected to have a material impact on the entity in the
current or future reporting periods and on foreseeable future transactions.
The Group has not yet assessed the impact of AASB 2014-10, and it has not yet decided whether to adopt AASB 2014-10 early.
AASB 2015-10 defers the mandatory effective date (application date) of AASB 2014-10 so that the amendments are required to be applied
for annual reporting periods beginning on or after 1 January 2018 instead of 1 January 2016. IASB has deferred the effective date
indefinitely.
AASB 2014-10 also makes an editorial correction to AASB 10.
- Lessees are required to recognise assets and liabilities for all leases with a term of more than 12 months, unless the underlying asset is of
low value.
- The effects of vesting and non-vesting conditions on the measurement of cash-settled share-based payments
Lessee accounting
- AASB 16 also requires enhanced disclosures to be provided by lessors that will improve information disclosed about a lessor's risk
exposure, particularly to residual value risk.
- Assets and liabilities arising from a lease are initially measured on a present value basis. The measurement includes non-cancellable lease
payments (including inflation-linked payments), and also includes payments to be made in optional periods if the lessee is reasonably
certain to exercise an option to extend the lease, or not to exercise an option to terminate the lease.
- AASB 2 (Amendments) Classification and Measurement of Share-based Payment Transactions (Amendments to IFRS 2) (Application date of
standard 1 January 2018; Application date of Group 1 July 2018)
This standard amends to AASB 2 Share-based Payment , clarifying how to account for certain types of share-based payment transactions. The
amendments provide the requirements on the accounting for:
- Share-based payment transactions with a net settlement feature for withholding tax obligations
- A modification to the terms and conditions of a share-based payment that changes the classification of the transaction from cash-settled
to equity-settled.
- AASB 16 Leases (Application date of standard 1 January 2019; Application date of Group 1 July 2019)
The new standard will be effective for annual periods beginning on or after 1 January 2019. Early application is permitted, provided the new
revenue standard, AASB 15 Revenue from Contracts with Customers, has been applied, or is applied at the same date as AASB 16. The
standard will affect primarily the accounting for the Group’s contracts. As at the reporting date, the Group has non-cancellable contract
commitments of US $39,284,413 (see Note 22). However, the Group has not yet determined to what extent these commitments will result in
the recognition of an asset and a liability for future payments and how this will affect the Group’s profit and classification of cash flows.
Some of the commitments may be covered by the exception for short-term and low-value leases and some commitments may relate to
arrangements that will not qualify as leases under AASB 16. At this stage, the Group does not intend to adopt AASB 16 before its effective
date.
- AASB 16 contains disclosure requirements for lessees.
- AASB 16 substantially carries forward the lessor accounting requirements in AASB 117. Accordingly, a lessor continues to classify its
leases as operating leases or finance leases, and to account for those two types of leases differently.
For
per
sona
l use
onl
y
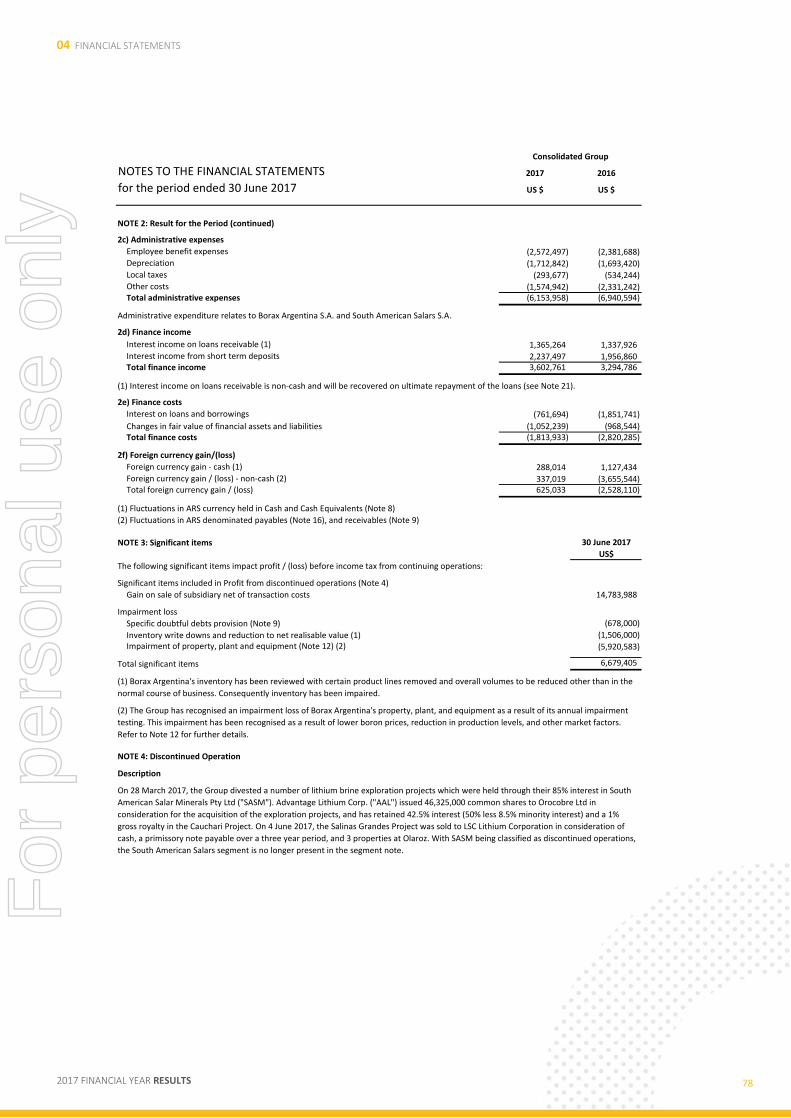
04 FINANCIAL STATEMENTS
2017 FINANCIAL YEAR RESULTS 78
NOTES TO THE FINANCIAL STATEMENTS 2017 2016
for the period ended 30 June 2017 US $ US $
Consolidated Group
NOTE 2: Result for the Period (continued)
2c) Administrative expenses
Employee benefit expenses (2,572,497) (2,381,688) Depreciation (1,712,842) (1,693,420) Local taxes (293,677) (534,244) Other costs (1,574,942) (2,331,242) Total administrative expenses (6,153,958) (6,940,594)
Administrative expenditure relates to Borax Argentina S.A. and South American Salars S.A.
2d) Finance income
Interest income on loans receivable (1) 1,365,264 1,337,926 Interest income from short term deposits 2,237,497 1,956,860 Total finance income 3,602,761 3,294,786
Interest on loans and borrowings (761,694) (1,851,741)
Changes in fair value of financial assets and liabilities (1,052,239) (968,544) Total finance costs (1,813,933) (2,820,285)
2f) Foreign currency gain/(loss)
Foreign currency gain - cash (1) 288,014 1,127,434 Foreign currency gain / (loss) - non-cash (2) 337,019 (3,655,544) Total foreign currency gain / (loss) 625,033 (2,528,110)
30 June 2017
US$
Significant items included in Profit from discontinued operations (Note 4)
Gain on sale of subsidiary net of transaction costs 14,783,988
Impairment loss
Specific doubtful debts provision (Note 9) (678,000)
Inventory write downs and reduction to net realisable value (1) (1,506,000) Impairment of property, plant and equipment (Note 12) (2) (5,920,583)
Total significant items 6,679,405
Description
2e) Finance costs
(1) Interest income on loans receivable is non-cash and will be recovered on ultimate repayment of the loans (see Note 21).
(2) Fluctuations in ARS denominated payables (Note 16), and receivables (Note 9)
(1) Fluctuations in ARS currency held in Cash and Cash Equivalents (Note 8)
NOTE 4: Discontinued Operation
The following significant items impact profit / (loss) before income tax from continuing operations:
NOTE 3: Significant items
(1) Borax Argentina's inventory has been reviewed with certain product lines removed and overall volumes to be reduced other than in the
normal course of business. Consequently inventory has been impaired.
(2) The Group has recognised an impairment loss of Borax Argentina's property, plant, and equipment as a result of its annual impairment
testing. This impairment has been recognised as a result of lower boron prices, reduction in production levels, and other market factors.
Refer to Note 12 for further details.
On 28 March 2017, the Group divested a number of lithium brine exploration projects which were held through their 85% interest in South
American Salar Minerals Pty Ltd ("SASM"). Advantage Lithium Corp. ("AAL") issued 46,325,000 common shares to Orocobre Ltd in
consideration for the acquisition of the exploration projects, and has retained 42.5% interest (50% less 8.5% minority interest) and a 1%
gross royalty in the Cauchari Project. On 4 June 2017, the Salinas Grandes Project was sold to LSC Lithium Corporation in consideration of
cash, a primissory note payable over a three year period, and 3 properties at Olaroz. With SASM being classified as discontinued operations,
the South American Salars segment is no longer present in the segment note.
For
per
sona
l use
onl
y
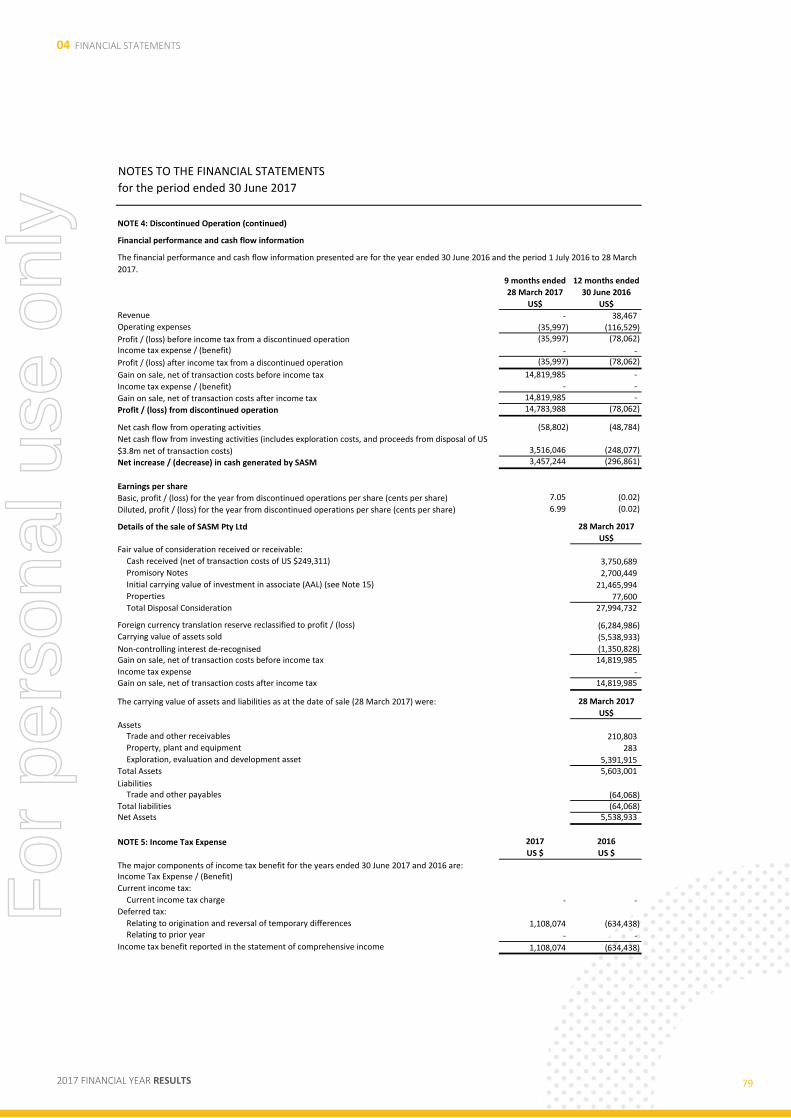
04 FINANCIAL STATEMENTS
2017 FINANCIAL YEAR RESULTS 79
NOTES TO THE FINANCIAL STATEMENTS
for the period ended 30 June 2017
NOTE 4: Discontinued Operation (continued)
9 months ended 12 months ended
28 March 2017 30 June 2016
US$ US$Revenue - 38,467 Operating expenses (35,997) (116,529)
Profit / (loss) before income tax from a discontinued operation (35,997) (78,062)
Income tax expense / (benefit) - -
Profit / (loss) after income tax from a discontinued operation (35,997) (78,062)
Gain on sale, net of transaction costs before income tax 14,819,985 -
Income tax expense / (benefit) - -
Gain on sale, net of transaction costs after income tax 14,819,985 -
Profit / (loss) from discontinued operation 14,783,988 (78,062)
Net cash flow from operating activities (58,802) (48,784)
3,516,046 (248,077)
Net increase / (decrease) in cash generated by SASM 3,457,244 (296,861)
Earnings per share
Basic, profit / (loss) for the year from discontinued operations per share (cents per share) 7.05 (0.02)
Diluted, profit / (loss) for the year from discontinued operations per share (cents per share) 6.99 (0.02)
28 March 2017
US$Fair value of consideration received or receivable:
Cash received (net of transaction costs of US $249,311) 3,750,689 Promisory Notes 2,700,449 Initial carrying value of investment in associate (AAL) (see Note 15) 21,465,994 Properties 77,600 Total Disposal Consideration 27,994,732
Foreign currency translation reserve reclassified to profit / (loss) (6,284,986) Carrying value of assets sold (5,538,933)
Non-controlling interest de-recognised (1,350,828) Gain on sale, net of transaction costs before income tax 14,819,985
Income tax expense - Gain on sale, net of transaction costs after income tax 14,819,985
The carrying value of assets and liabilities as at the date of sale (28 March 2017) were: 28 March 2017
US$
AssetsTrade and other receivables 210,803 Property, plant and equipment 283 Exploration, evaluation and development asset 5,391,915
Total Assets 5,603,001
LiabilitiesTrade and other payables (64,068)
Total liabilities (64,068) Net Assets 5,538,933
NOTE 5: Income Tax Expense 2017 2016
US $ US $
Income Tax Expense / (Benefit)
Current income tax:
Current income tax charge - - Deferred tax:
Relating to origination and reversal of temporary differences 1,108,074 (634,438) Relating to prior year - -
Income tax benefit reported in the statement of comprehensive income 1,108,074 (634,438)
Financial performance and cash flow information
The financial performance and cash flow information presented are for the year ended 30 June 2016 and the period 1 July 2016 to 28 March
2017.
Net cash flow from investing activities (includes exploration costs, and proceeds from disposal of US
$3.8m net of transaction costs)
Details of the sale of SASM Pty Ltd
The major components of income tax benefit for the years ended 30 June 2017 and 2016 are:
For
per
sona
l use
onl
y

04 FINANCIAL STATEMENTS
2017 FINANCIAL YEAR RESULTS 80
NOTES TO THE FINANCIAL STATEMENTS 2017 2016
for the period ended 30 June 2017 US $ US $
Consolidated Group
NOTE 5: Income Tax Expense (continued)
Gain/(Loss) from continuing operations before income tax expense 5,739,592 (22,490,450) Profit/(loss) before tax from a discontinued operation 14,783,988 (78,062) Accounting profit / (loss) before income tax 20,523,580 (22,568,512)
Tax expenses / (benefit) at Australian tax rate of 30% (2016: 30%) 6,157,074 (6,770,554)
Tax effect of amounts which are not deductible / (taxable) in calculating taxable income: - Share based payments 133,949 147,442 - Other 361,227 253,556 - Share of (profit) / loss of joint venture (7,517,958) 3,850,178 Gain on sale of subsidiary net of transaction costs (4,399,863) - Derecognition of deferred tax balances current year 6,885,821 2,550,730 Differences in tax rates (foreign subsidiaries) (674,913) (698,745) Foreign exchange 162,737 32,955 Income tax benefit 1,108,074 (634,438)
Deferred tax
Deferred tax relates to the following:Deferred tax assets
Payable and accruals - 70,018 Employee benefits - 367,302 Inventory - 11,894 Other debtors - 23,849 Interest - 764,658 Tax losses - 843,855 Share issue costs (Equity) 890,986 1,310,106 Set off of deferred tax liabilities pursuant to set off provisions (890,986) (1,310,106)
- 2,081,576
Deferred tax liabilities
Property, Plant and Equipment - (620,013) Receivables - (353,489)
- (973,502)
Movements:
Opening Balance 1,108,074 910,621 Foreign exchange impact - (436,985) Derecognition of deferred tax assets (1) (1,108,074) - Credited / (charged) to the statement of comprehensive income - 634,438 Closing Balance - 1,108,074
NOTE 6: Earnings Per Share
Profit attributable to ordinary equity holders of the parent:
Continuing operations 4,631,518 (21,856,012)
Discontinued operations 14,783,988 (78,062)Profit/(Loss) for the financial year 19,415,506 (21,934,074) Exclude non-controlling interest 23,066 41,631
Net Profit/(Loss) used in the calculation of basic and dilutive EPS 19,438,572 (21,892,443)
(1) The recovery of the deferred tax asset previously recognised for the Borax Argentina S.A. operation for US $5,977,716 was deemed
unlikely, as there are insufficient estimated future taxable profits against which it could be utilised. As a result, it was derecognised.
A reconciliation between tax expense and the product of accounting profit multiplied by Australia's domestic tax rate for the years ended 30
June 2017 and 2016 is as follows:
The Group has tax losses which arose in Australia of US$22,874,904 (2016: US$17,605,617) that are available indefinitely for offsetting
against future taxable profits of the companies in which the losses arose.
Diluted earnings per share amounts are calculated by dividing the net profit attributable to ordinary equity holders of the Parent by the
weighted average number of ordinary shares outstanding during the year plus the weighted average number of ordinary shares that would
be issued on conversion of all the dilutive potential ordinary shares into ordinary shares.
The following reflects the income and share data used in the basic and diluted earnings per share computations:
Basic earnings per share amounts are calculated by dividing the net profit for the year attributable to ordinary equity holders of the Parent
by the weighted average number of ordinary shares outstanding during the year.
For
per
sona
l use
onl
y
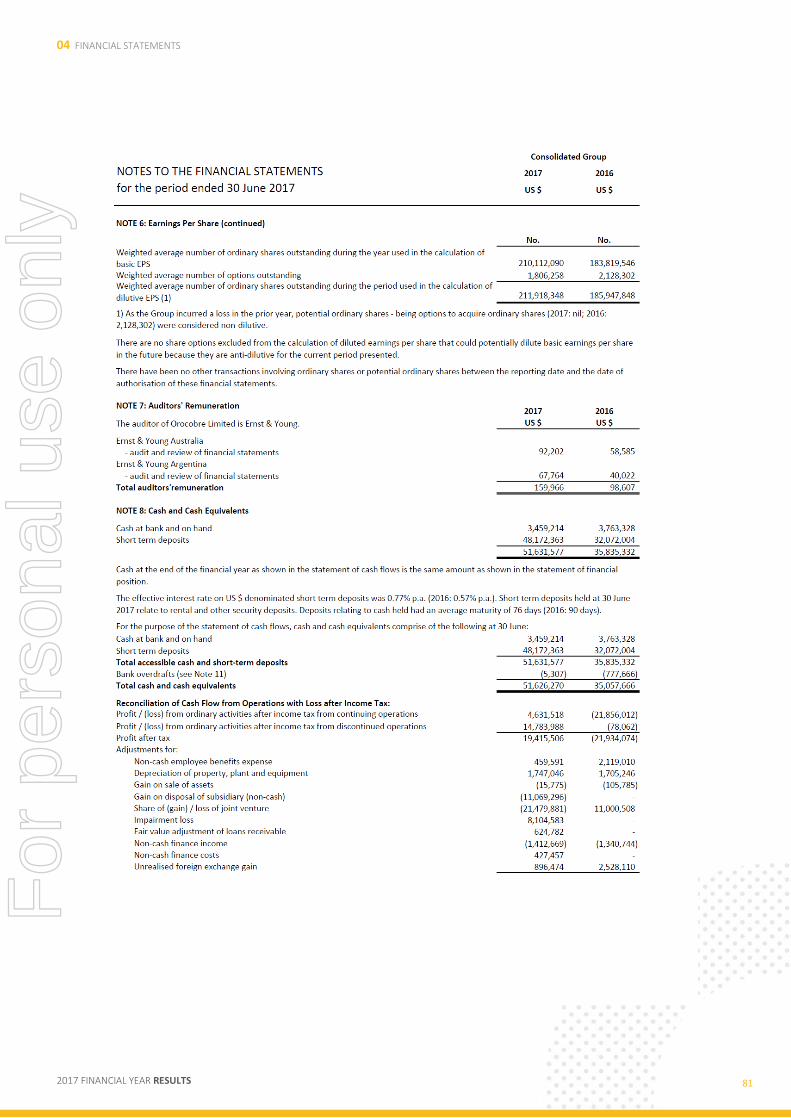
04 FINANCIAL STATEMENTS
2017 FINANCIAL YEAR RESULTS 81
For
per
sona
l use
onl
y
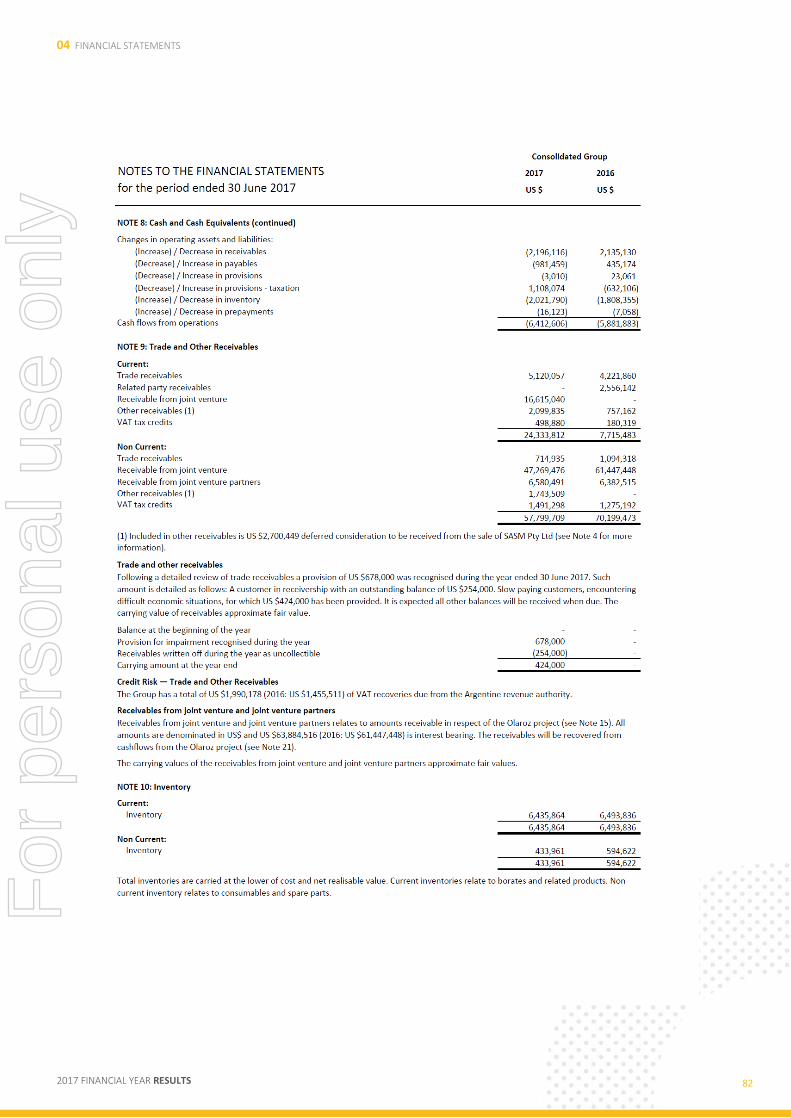
04 FINANCIAL STATEMENTS
2017 FINANCIAL YEAR RESULTS 82
For
per
sona
l use
onl
y
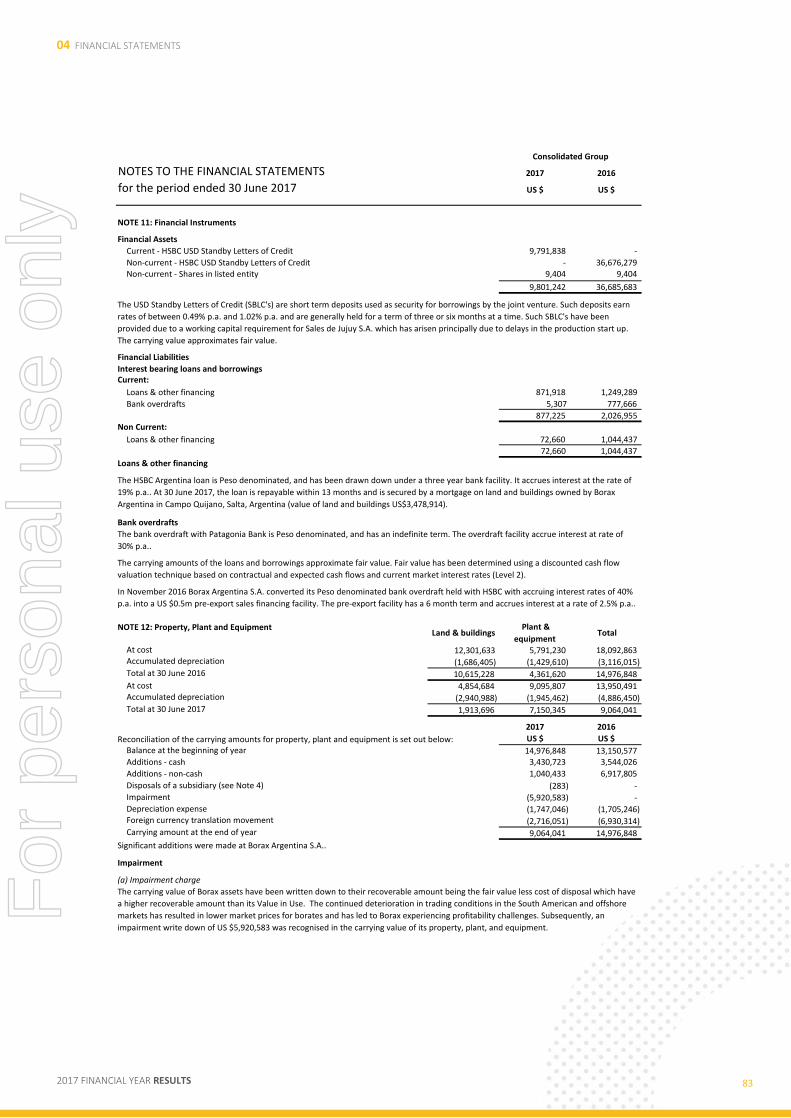
04 FINANCIAL STATEMENTS
2017 FINANCIAL YEAR RESULTS 83
NOTES TO THE FINANCIAL STATEMENTS 2017 2016
for the period ended 30 June 2017 US $ US $
Consolidated Group
NOTE 11: Financial Instruments
Financial Assets
Current - HSBC USD Standby Letters of Credit 9,791,838 -
Non-current - HSBC USD Standby Letters of Credit - 36,676,279 Non-current - Shares in listed entity 9,404 9,404
9,801,242 36,685,683
Financial Liabilities
Interest bearing loans and borrowingsCurrent:
Loans & other financing 871,918 1,249,289
Bank overdrafts 5,307 777,666
877,225 2,026,955 Non Current:
Loans & other financing 72,660 1,044,437
72,660 1,044,437
Loans & other financing
Bank overdrafts
NOTE 12: Property, Plant and EquipmentLand & buildings
Plant &
equipment Total
At cost 12,301,633 5,791,230 18,092,863 Accumulated depreciation (1,686,405) (1,429,610) (3,116,015) Total at 30 June 2016 10,615,228 4,361,620 14,976,848
At cost 4,854,684 9,095,807 13,950,491 Accumulated depreciation (2,940,988) (1,945,462) (4,886,450) Total at 30 June 2017 1,913,696 7,150,345 9,064,041
2017 2016
Reconciliation of the carrying amounts for property, plant and equipment is set out below: US $ US $
Balance at the beginning of year 14,976,848 13,150,577 Additions - cash 3,430,723 3,544,026
Additions - non-cash 1,040,433 6,917,805
Disposals of a subsidiary (see Note 4) (283) - Impairment (5,920,583) - Depreciation expense (1,747,046) (1,705,246) Foreign currency translation movement (2,716,051) (6,930,314) Carrying amount at the end of year 9,064,041 14,976,848
Significant additions were made at Borax Argentina S.A..
Impairment
In November 2016 Borax Argentina S.A. converted its Peso denominated bank overdraft held with HSBC with accruing interest rates of 40%
p.a. into a US $0.5m pre-export sales financing facility. The pre-export facility has a 6 month term and accrues interest at a rate of 2.5% p.a..
(a) Impairment charge
The carrying value of Borax assets have been written down to their recoverable amount being the fair value less cost of disposal which have
a higher recoverable amount than its Value in Use. The continued deterioration in trading conditions in the South American and offshore
markets has resulted in lower market prices for borates and has led to Borax experiencing profitability challenges. Subsequently, an
impairment write down of US $5,920,583 was recognised in the carrying value of its property, plant, and equipment.
The bank overdraft with Patagonia Bank is Peso denominated, and has an indefinite term. The overdraft facility accrue interest at rate of
30% p.a..
The carrying amounts of the loans and borrowings approximate fair value. Fair value has been determined using a discounted cash flow
valuation technique based on contractual and expected cash flows and current market interest rates (Level 2).
The USD Standby Letters of Credit (SBLC's) are short term deposits used as security for borrowings by the joint venture. Such deposits earn
rates of between 0.49% p.a. and 1.02% p.a. and are generally held for a term of three or six months at a time. Such SBLC's have been
provided due to a working capital requirement for Sales de Jujuy S.A. which has arisen principally due to delays in the production start up.
The carrying value approximates fair value.
The HSBC Argentina loan is Peso denominated, and has been drawn down under a three year bank facility. It accrues interest at the rate of
19% p.a.. At 30 June 2017, the loan is repayable within 13 months and is secured by a mortgage on land and buildings owned by Borax
Argentina in Campo Quijano, Salta, Argentina (value of land and buildings US$3,478,914).
For
per
sona
l use
onl
y

04 FINANCIAL STATEMENTS
2017 FINANCIAL YEAR RESULTS 84
NOTES TO THE FINANCIAL STATEMENTS
for the period ended 30 June 2017
NOTE 12: Property, Plant and Equipment (continued)
2017 2016
US $ US $
Trade and other receivables 8,508,933 8,727,014
Inventories 6,869,825 7,088,458
Plant and Equipment 9,064,041 14,976,848
Net deferred tax asset - 1,108,074
Accounts payable (8,993,407) (8,293,828)
Rehabilitation provision (9,552,600) (9,458,020)
Net carrying value 5,896,792 14,148,546
(b) Key assumptions used for fair value less cost of disposal
(c) Sensitivities
NOTE 13: Exploration, Evaluation and Development Asset
Exploration and evaluation phase - at cost 1,448,973 6,167,681
Opening balance - at cost 6,167,681 8,571,652 Capitalised exploration expenditure 454,339 248,077
Addition - non-cash 77,600 - Decrease on disposal of subsidiary (see Note 4) (5,391,915) - Foreign currency translation movement 141,268 (2,652,048) Carrying amount at the end of year 1,448,973 6,167,681
NOTE 14: Information Relating to Subsidiaries
The consolidated financial statements of the Group include:
Name
South American Salar Minerals Pty Ltd - 85.00
- 85.00
Borax Argentina Holding No 1 Pty Ltd 100.00 100.00
Borax Argentina Holding No 2 Pty Ltd 100.00 100.00
Borax Argentina S.A. 100.00 100.00
100.00 100.00 La Frontera S.A. 85.00 -
Joint venture in which the Group is a venturer
NOTE 15: Investment in Associate and Joint Venture
Investment in Joint Venture 57,686,421 35,061,038
Investment in Associates (1) 21,475,994 -
79,162,415 35,061,038
In applying the fair value less cost of disposal, the recoverability of the carrying value of Borax was assessed using market based valuation
techniques (Level 3 in the fair value hierarchy) such as discontinued cash flow analysis based on management’s best estimate of the risk
adjusted future earnings performance over its remaining mine lives based on current reserves and its expansion opportunity at Tincalayu.
The estimated recoverable amount from these calculations has been cross checked to external market data and views.
The material assumptions in the discounted cash flow model to which the Borax operation is most sensitive to are sales tonnes, selling price,
cost assumptions and the discount rate used (10.5% post tax in the current period). Any adverse significant movement in these assumptions
would result in further write downs to the value of Borax’s property, plant, and equipment and/or inventories.
Orocobre Brasil Representacoes E Assessoria Comercial LTDA
Country of incorporation & principal
place of business % equity interest held by the Group
The Group has a 72.68% interest in Sales de Jujuy Pte Ltd. The country of incorporation is Singapore and the principal place of business is
Singapore. Sales de Jujuy Pte Ltd owns 91.5% of Sales de Jujuy S.A., the owner and operator of the Olaroz lithium project.
This impairment charge has been included within the impairment loss line item in the statement of comprehensive income. Carrying value of
Borax segment (after eliminating intercompanies) at 30 June 2017 (and 30 June 2016) post impairment write down is as follows:
Recoverability of the carrying amount of exploration assets is dependent on the successful exploration and development of projects or
alternatively through the sale of the areas of interest.
South American Salar S.A. (wholly owned subsidiary of South
American Salar Minerals Pty Ltd)
Exploration, evaluation and development expenditure carried forward in respect of areas of interest are:
Movement in exploration and evaluation asset:
Australia
Brazil
Australia
Argentina
Australia
Argentina
Argentina
For
per
sona
l use
onl
y
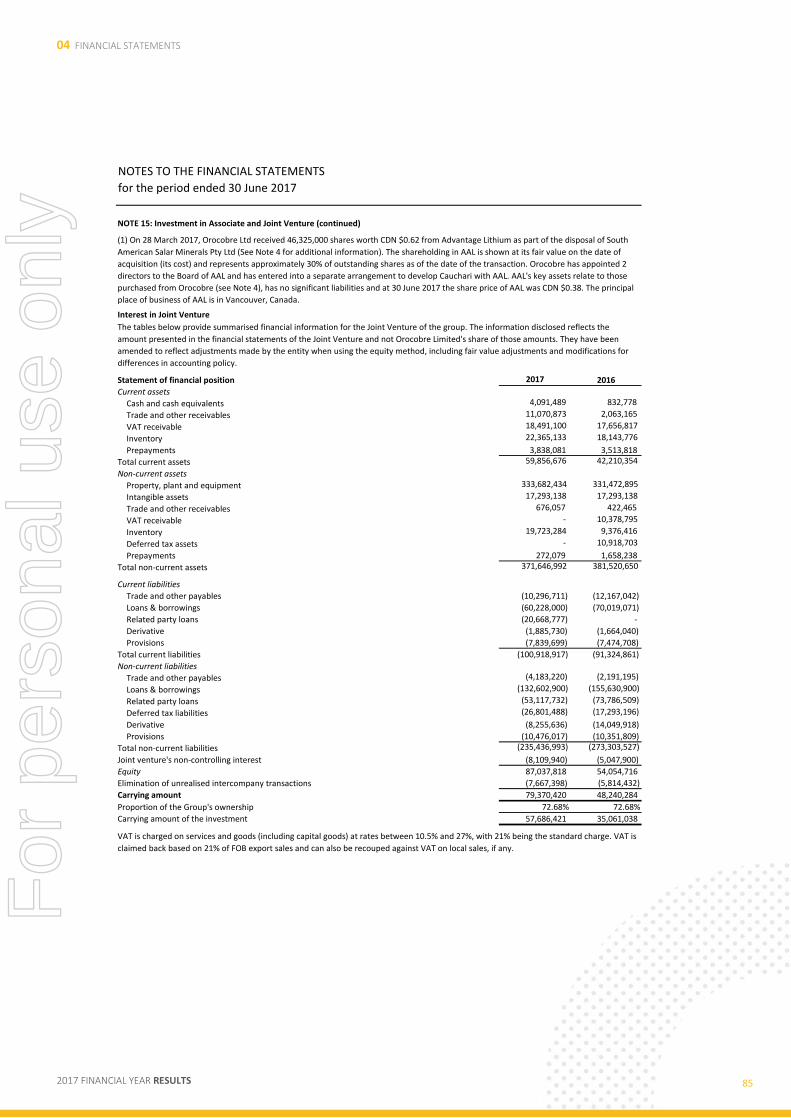
04 FINANCIAL STATEMENTS
2017 FINANCIAL YEAR RESULTS 85
NOTES TO THE FINANCIAL STATEMENTS
for the period ended 30 June 2017
NOTE 15: Investment in Associate and Joint Venture (continued)
Interest in Joint Venture
Statement of financial position 2017 2016
Current assets
Cash and cash equivalents 4,091,489 832,778
Trade and other receivables 11,070,873 2,063,165
VAT receivable 18,491,100 17,656,817
Inventory 22,365,133 18,143,776
Prepayments 3,838,081 3,513,818
Total current assets 59,856,676 42,210,354
Non-current assets
Property, plant and equipment 333,682,434 331,472,895
Intangible assets 17,293,138 17,293,138
Trade and other receivables 676,057 422,465
VAT receivable - 10,378,795
Inventory 19,723,284 9,376,416
Deferred tax assets - 10,918,703
Prepayments 272,079 1,658,238
Total non-current assets 371,646,992 381,520,650
Current liabilities
Trade and other payables (10,296,711) (12,167,042)
Loans & borrowings (60,228,000) (70,019,071)
Related party loans (20,668,777) -
Derivative (1,885,730) (1,664,040)
Provisions (7,839,699) (7,474,708)
Total current liabilities (100,918,917) (91,324,861)
Non-current liabilities
Trade and other payables (4,183,220) (2,191,195)
Loans & borrowings (132,602,900) (155,630,900)
Related party loans (53,117,732) (73,786,509)
Deferred tax liabilities (26,801,488) (17,293,196)
Derivative (8,255,636) (14,049,918)
Provisions (10,476,017) (10,351,809)
Total non-current liabilities (235,436,993) (273,303,527)
Joint venture's non-controlling interest (8,109,940) (5,047,900)
Equity 87,037,818 54,054,716
Elimination of unrealised intercompany transactions (7,667,398) (5,814,432)
Carrying amount 79,370,420 48,240,284
Proportion of the Group's ownership 72.68% 72.68%
Carrying amount of the investment 57,686,421 35,061,038
VAT is charged on services and goods (including capital goods) at rates between 10.5% and 27%, with 21% being the standard charge. VAT is
claimed back based on 21% of FOB export sales and can also be recouped against VAT on local sales, if any.
(1) On 28 March 2017, Orocobre Ltd received 46,325,000 shares worth CDN $0.62 from Advantage Lithium as part of the disposal of South
American Salar Minerals Pty Ltd (See Note 4 for additional information). The shareholding in AAL is shown at its fair value on the date of
acquisition (its cost) and represents approximately 30% of outstanding shares as of the date of the transaction. Orocobre has appointed 2
directors to the Board of AAL and has entered into a separate arrangement to develop Cauchari with AAL. AAL's key assets relate to those
purchased from Orocobre (see Note 4), has no significant liabilities and at 30 June 2017 the share price of AAL was CDN $0.38. The principal
place of business of AAL is in Vancouver, Canada.
The tables below provide summarised financial information for the Joint Venture of the group. The information disclosed reflects the
amount presented in the financial statements of the Joint Venture and not Orocobre Limited's share of those amounts. They have been
amended to reflect adjustments made by the entity when using the equity method, including fair value adjustments and modifications for
differences in accounting policy.
For
per
sona
l use
onl
y
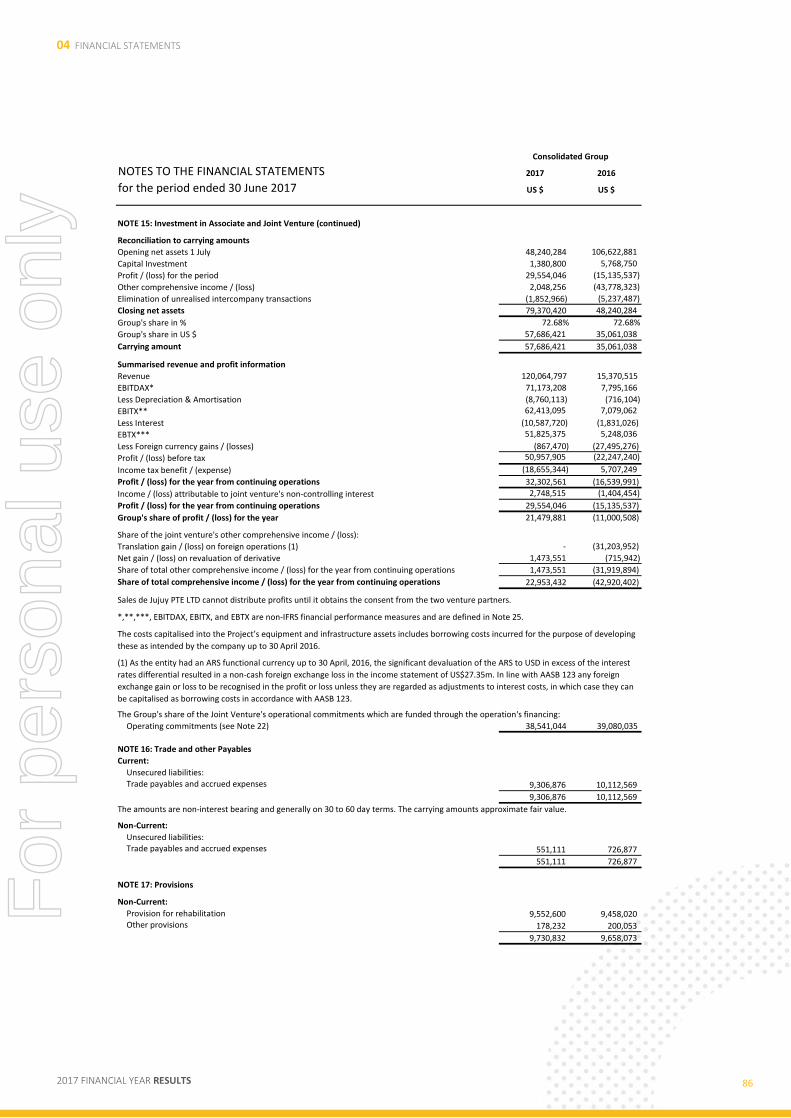
04 FINANCIAL STATEMENTS
2017 FINANCIAL YEAR RESULTS 86
NOTES TO THE FINANCIAL STATEMENTS 2017 2016
for the period ended 30 June 2017 US $ US $
Consolidated Group
NOTE 15: Investment in Associate and Joint Venture (continued)
Reconciliation to carrying amounts
Opening net assets 1 July 48,240,284 106,622,881
Capital Investment 1,380,800 5,768,750
Profit / (loss) for the period 29,554,046 (15,135,537)
Other comprehensive income / (loss) 2,048,256 (43,778,323)
Elimination of unrealised intercompany transactions (1,852,966) (5,237,487)
Closing net assets 79,370,420 48,240,284
Group's share in % 72.68% 72.68%
Group's share in US $ 57,686,421 35,061,038
Carrying amount 57,686,421 35,061,038
Summarised revenue and profit information
Revenue 120,064,797 15,370,515
EBITDAX* 71,173,208 7,795,166
Less Depreciation & Amortisation (8,760,113) (716,104)
EBITX** 62,413,095 7,079,062
Less Interest (10,587,720) (1,831,026)
EBTX*** 51,825,375 5,248,036
Less Foreign currency gains / (losses) (867,470) (27,495,276)
Profit / (loss) before tax 50,957,905 (22,247,240)
Income tax benefit / (expense) (18,655,344) 5,707,249
Profit / (loss) for the year from continuing operations 32,302,561 (16,539,991)
Income / (loss) attributable to joint venture's non-controlling interest 2,748,515 (1,404,454)
Profit / (loss) for the year from continuing operations 29,554,046 (15,135,537)
Group's share of profit / (loss) for the year 21,479,881 (11,000,508)
Share of the joint venture's other comprehensive income / (loss):
Translation gain / (loss) on foreign operations (1) - (31,203,952)
Net gain / (loss) on revaluation of derivative 1,473,551 (715,942)
Share of total other comprehensive income / (loss) for the year from continuing operations 1,473,551 (31,919,894)
Share of total comprehensive income / (loss) for the year from continuing operations 22,953,432 (42,920,402)
Operating commitments (see Note 22) 38,541,044 39,080,035
NOTE 16: Trade and other Payables
Current:
Unsecured liabilities:Trade payables and accrued expenses 9,306,876 10,112,569
9,306,876 10,112,569
Non-Current:
Unsecured liabilities:Trade payables and accrued expenses 551,111 726,877
551,111 726,877
NOTE 17: Provisions
Non-Current:
Provision for rehabilitation 9,552,600 9,458,020 Other provisions 178,232 200,053
9,730,832 9,658,073
(1) As the entity had an ARS functional currency up to 30 April, 2016, the significant devaluation of the ARS to USD in excess of the interest
rates differential resulted in a non-cash foreign exchange loss in the income statement of US$27.35m. In line with AASB 123 any foreign
exchange gain or loss to be recognised in the profit or loss unless they are regarded as adjustments to interest costs, in which case they can
be capitalised as borrowing costs in accordance with AASB 123.
The Group's share of the Joint Venture's operational commitments which are funded through the operation's financing:
Sales de Jujuy PTE LTD cannot distribute profits until it obtains the consent from the two venture partners.
*,**,***, EBITDAX, EBITX, and EBTX are non-IFRS financial performance measures and are defined in Note 25.
The amounts are non-interest bearing and generally on 30 to 60 day terms. The carrying amounts approximate fair value.
The costs capitalised into the Project’s equipment and infrastructure assets includes borrowing costs incurred for the purpose of developing
these as intended by the company up to 30 April 2016.
For
per
sona
l use
onl
y
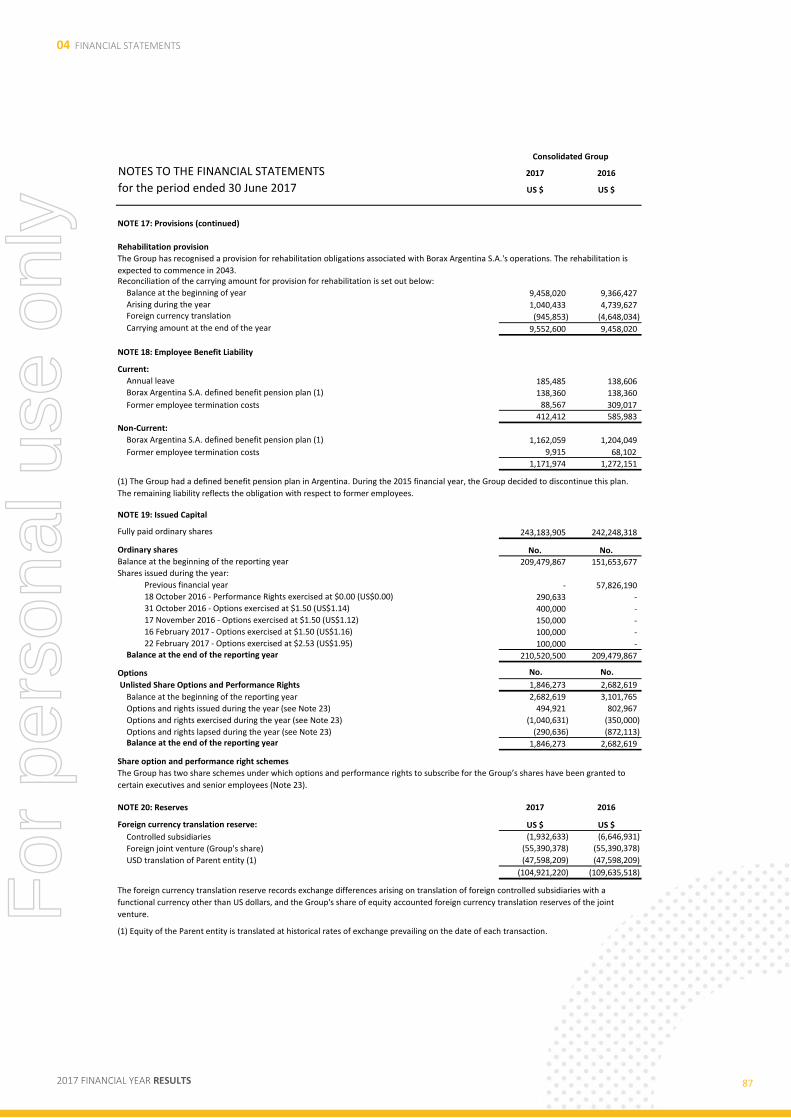
04 FINANCIAL STATEMENTS
2017 FINANCIAL YEAR RESULTS 87
NOTES TO THE FINANCIAL STATEMENTS 2017 2016
for the period ended 30 June 2017 US $ US $
Consolidated Group
NOTE 17: Provisions (continued)
Rehabilitation provision
Reconciliation of the carrying amount for provision for rehabilitation is set out below:
Balance at the beginning of year 9,458,020 9,366,427 Arising during the year 1,040,433 4,739,627 Foreign currency translation (945,853) (4,648,034) Carrying amount at the end of the year 9,552,600 9,458,020
NOTE 18: Employee Benefit Liability
Current:
Annual leave 185,485 138,606 Borax Argentina S.A. defined benefit pension plan (1) 138,360 138,360
Former employee termination costs 88,567 309,017
412,412 585,983
Non-Current:
Borax Argentina S.A. defined benefit pension plan (1) 1,162,059 1,204,049
Former employee termination costs 9,915 68,102
1,171,974 1,272,151
NOTE 19: Issued Capital
Fully paid ordinary shares 243,183,905 242,248,318
Ordinary shares No. No.Balance at the beginning of the reporting year 209,479,867 151,653,677 Shares issued during the year:
Previous financial year - 57,826,190 18 October 2016 - Performance Rights exercised at $0.00 (US$0.00) 290,633 - 31 October 2016 - Options exercised at $1.50 (US$1.14) 400,000 - 17 November 2016 - Options exercised at $1.50 (US$1.12) 150,000 - 16 February 2017 - Options exercised at $1.50 (US$1.16) 100,000 - 22 February 2017 - Options exercised at $2.53 (US$1.95) 100,000 -
Balance at the end of the reporting year 210,520,500 209,479,867
Options No. No.
Unlisted Share Options and Performance Rights 1,846,273 2,682,619
Balance at the beginning of the reporting year 2,682,619 3,101,765
Options and rights issued during the year (see Note 23) 494,921 802,967
Options and rights exercised during the year (see Note 23) (1,040,631) (350,000)
Options and rights lapsed during the year (see Note 23) (290,636) (872,113) Balance at the end of the reporting year 1,846,273 2,682,619
Share option and performance right schemes
NOTE 20: Reserves 2017 2016
Foreign currency translation reserve: US $ US $
Controlled subsidiaries (1,932,633) (6,646,931)
Foreign joint venture (Group's share) (55,390,378) (55,390,378)
USD translation of Parent entity (1) (47,598,209) (47,598,209)
(104,921,220) (109,635,518)
(1) Equity of the Parent entity is translated at historical rates of exchange prevailing on the date of each transaction.
The Group has two share schemes under which options and performance rights to subscribe for the Group’s shares have been granted to
certain executives and senior employees (Note 23).
(1) The Group had a defined benefit pension plan in Argentina. During the 2015 financial year, the Group decided to discontinue this plan.
The remaining liability reflects the obligation with respect to former employees.
The Group has recognised a provision for rehabilitation obligations associated with Borax Argentina S.A.'s operations. The rehabilitation is
expected to commence in 2043.
The foreign currency translation reserve records exchange differences arising on translation of foreign controlled subsidiaries with a
functional currency other than US dollars, and the Group's share of equity accounted foreign currency translation reserves of the joint
venture.For
per
sona
l use
onl
y
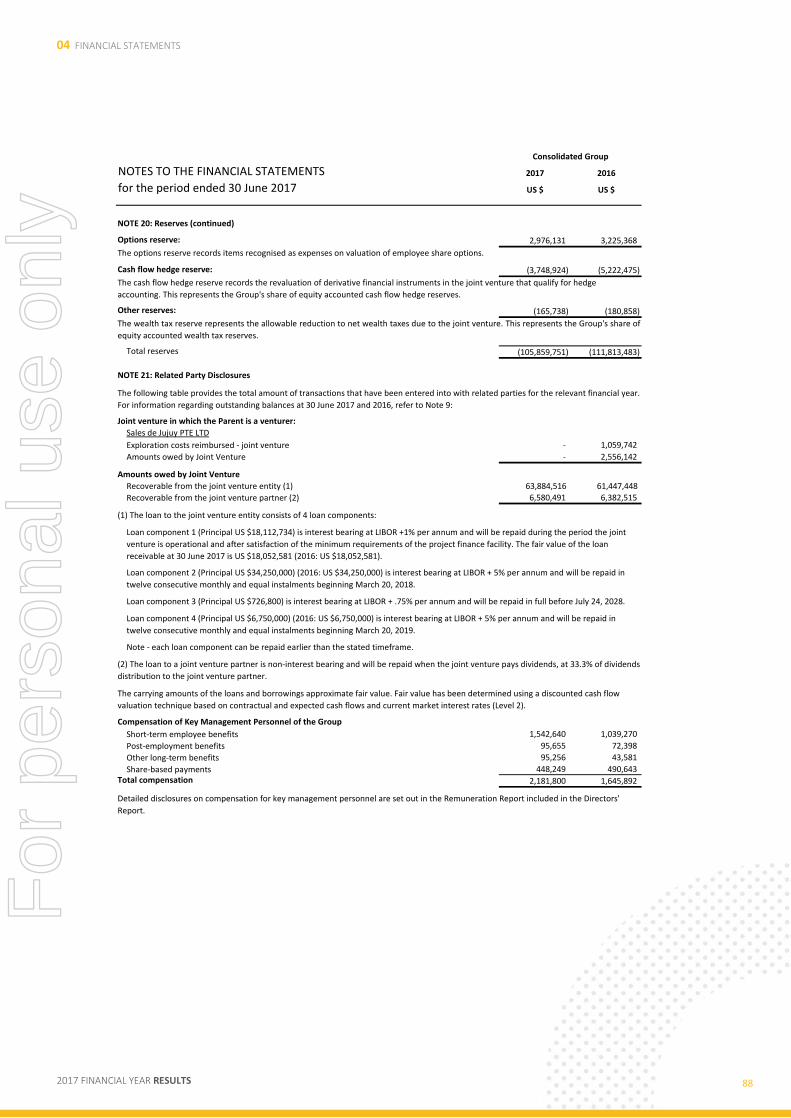
04 FINANCIAL STATEMENTS
2017 FINANCIAL YEAR RESULTS 88
NOTES TO THE FINANCIAL STATEMENTS 2017 2016
for the period ended 30 June 2017 US $ US $
Consolidated Group
NOTE 20: Reserves (continued)
Options reserve: 2,976,131 3,225,368
Cash flow hedge reserve: (3,748,924) (5,222,475)
Other reserves: (165,738) (180,858)
Total reserves (105,859,751) (111,813,483)
NOTE 21: Related Party Disclosures
Joint venture in which the Parent is a venturer:
Sales de Jujuy PTE LTD
Exploration costs reimbursed - joint venture - 1,059,742
Amounts owed by Joint Venture - 2,556,142
Amounts owed by Joint Venture
Recoverable from the joint venture entity (1) 63,884,516 61,447,448
Recoverable from the joint venture partner (2) 6,580,491 6,382,515
Note - each loan component can be repaid earlier than the stated timeframe.
Compensation of Key Management Personnel of the Group
Short-term employee benefits 1,542,640 1,039,270
Post-employment benefits 95,655 72,398
Other long-term benefits 95,256 43,581
Share-based payments 448,249 490,643 Total compensation 2,181,800 1,645,892
The wealth tax reserve represents the allowable reduction to net wealth taxes due to the joint venture. This represents the Group's share of
equity accounted wealth tax reserves.
The options reserve records items recognised as expenses on valuation of employee share options.
Loan component 1 (Principal US $18,112,734) is interest bearing at LIBOR +1% per annum and will be repaid during the period the joint
venture is operational and after satisfaction of the minimum requirements of the project finance facility. The fair value of the loan
receivable at 30 June 2017 is US $18,052,581 (2016: US $18,052,581).
Loan component 4 (Principal US $6,750,000) (2016: US $6,750,000) is interest bearing at LIBOR + 5% per annum and will be repaid in
twelve consecutive monthly and equal instalments beginning March 20, 2019.
(1) The loan to the joint venture entity consists of 4 loan components:
Loan component 3 (Principal US $726,800) is interest bearing at LIBOR + .75% per annum and will be repaid in full before July 24, 2028.
Detailed disclosures on compensation for key management personnel are set out in the Remuneration Report included in the Directors'
Report.
(2) The loan to a joint venture partner is non-interest bearing and will be repaid when the joint venture pays dividends, at 33.3% of dividends
distribution to the joint venture partner.
Loan component 2 (Principal US $34,250,000) (2016: US $34,250,000) is interest bearing at LIBOR + 5% per annum and will be repaid in
twelve consecutive monthly and equal instalments beginning March 20, 2018.
The following table provides the total amount of transactions that have been entered into with related parties for the relevant financial year.
For information regarding outstanding balances at 30 June 2017 and 2016, refer to Note 9:
The cash flow hedge reserve records the revaluation of derivative financial instruments in the joint venture that qualify for hedge
accounting. This represents the Group's share of equity accounted cash flow hedge reserves.
The carrying amounts of the loans and borrowings approximate fair value. Fair value has been determined using a discounted cash flow
valuation technique based on contractual and expected cash flows and current market interest rates (Level 2).
For
per
sona
l use
onl
y
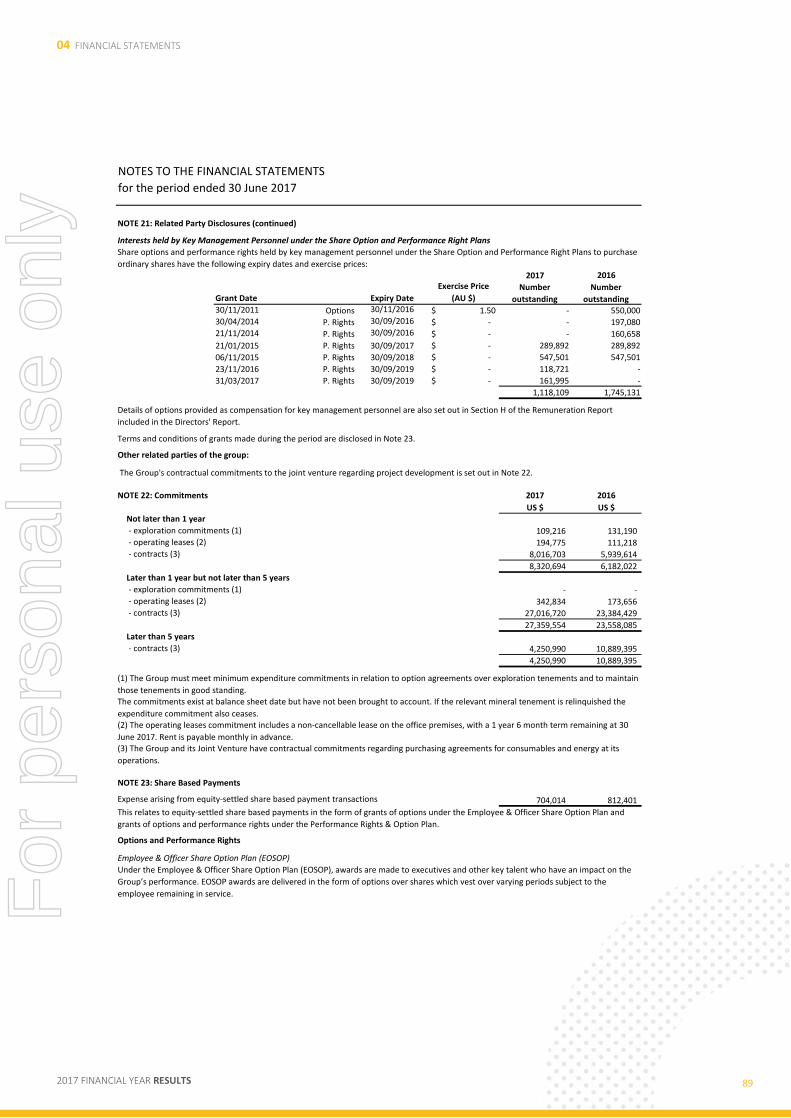
04 FINANCIAL STATEMENTS
2017 FINANCIAL YEAR RESULTS 89
NOTES TO THE FINANCIAL STATEMENTS
for the period ended 30 June 2017
NOTE 21: Related Party Disclosures (continued)
Interests held by Key Management Personnel under the Share Option and Performance Right Plans
2017 2016
Grant DateNumber
outstanding
Number
outstanding30/11/2011 Options 30/11/2016 $ 1.50 - 550,000 30/04/2014 P. Rights 30/09/2016 $ - - 197,080 21/11/2014 P. Rights 30/09/2016 $ - - 160,658
21/01/2015 P. Rights 30/09/2017 $ - 289,892 289,892
06/11/2015 P. Rights 30/09/2018 $ - 547,501 547,501
23/11/2016 P. Rights 30/09/2019 $ - 118,721 -
31/03/2017 P. Rights 30/09/2019 $ - 161,995 -
1,118,109 1,745,131
Other related parties of the group:
NOTE 22: Commitments 2017 2016
US $ US $Not later than 1 year
- exploration commitments (1) 109,216 131,190 - operating leases (2) 194,775 111,218 - contracts (3) 8,016,703 5,939,614
8,320,694 6,182,022
Later than 1 year but not later than 5 years
- exploration commitments (1) - - - operating leases (2) 342,834 173,656 - contracts (3) 27,016,720 23,384,429
27,359,554 23,558,085 Later than 5 years
- contracts (3) 4,250,990 10,889,395
4,250,990 10,889,395
NOTE 23: Share Based Payments
Expense arising from equity-settled share based payment transactions 704,014 812,401
Options and Performance Rights
Employee & Officer Share Option Plan (EOSOP)
(3) The Group and its Joint Venture have contractual commitments regarding purchasing agreements for consumables and energy at its
operations.
The commitments exist at balance sheet date but have not been brought to account. If the relevant mineral tenement is relinquished the
expenditure commitment also ceases.(2) The operating leases commitment includes a non-cancellable lease on the office premises, with a 1 year 6 month term remaining at 30
June 2017. Rent is payable monthly in advance.
(1) The Group must meet minimum expenditure commitments in relation to option agreements over exploration tenements and to maintain
those tenements in good standing.
This relates to equity-settled share based payments in the form of grants of options under the Employee & Officer Share Option Plan and
grants of options and performance rights under the Performance Rights & Option Plan.
Under the Employee & Officer Share Option Plan (EOSOP), awards are made to executives and other key talent who have an impact on the
Group’s performance. EOSOP awards are delivered in the form of options over shares which vest over varying periods subject to the
employee remaining in service.
The Group's contractual commitments to the joint venture regarding project development is set out in Note 22.
Exercise Price
(AU $)Expiry Date
Terms and conditions of grants made during the period are disclosed in Note 23.
Details of options provided as compensation for key management personnel are also set out in Section H of the Remuneration Report
included in the Directors' Report.
Share options and performance rights held by key management personnel under the Share Option and Performance Right Plans to purchase
ordinary shares have the following expiry dates and exercise prices:
For
per
sona
l use
onl
y
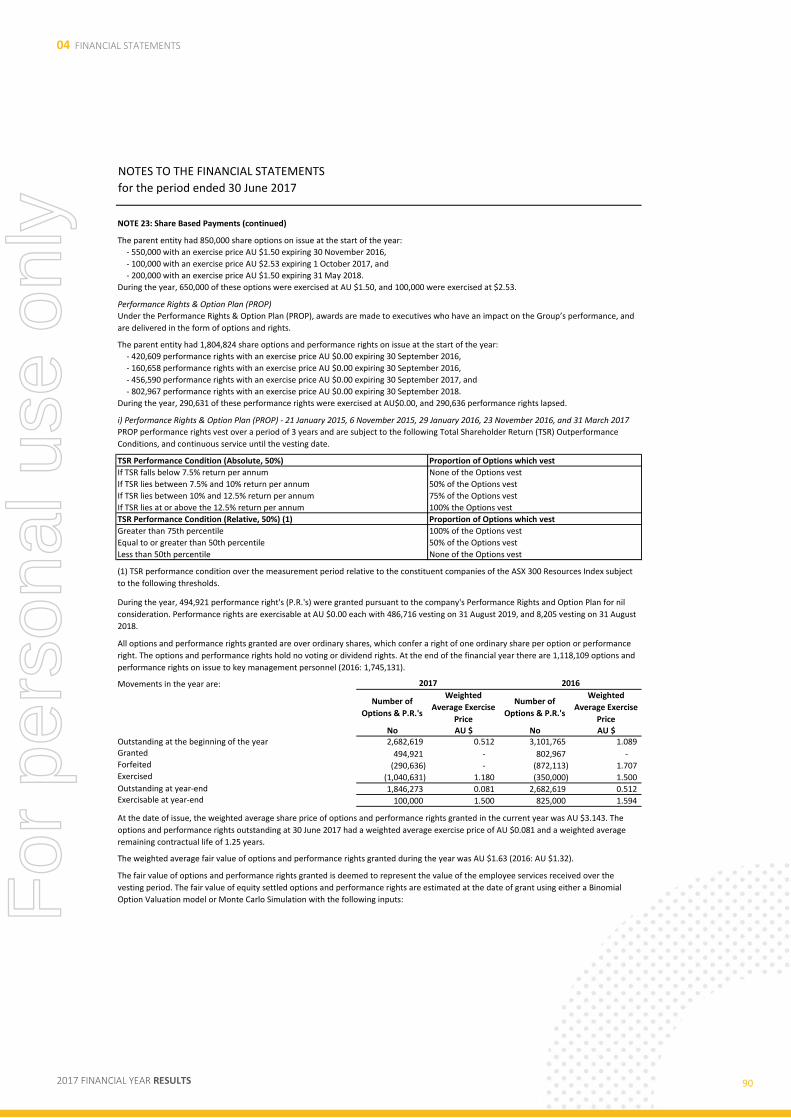
04 FINANCIAL STATEMENTS
2017 FINANCIAL YEAR RESULTS 90
NOTES TO THE FINANCIAL STATEMENTS
for the period ended 30 June 2017
NOTE 23: Share Based Payments (continued)
- 550,000 with an exercise price AU $1.50 expiring 30 November 2016,
- 100,000 with an exercise price AU $2.53 expiring 1 October 2017, and
- 200,000 with an exercise price AU $1.50 expiring 31 May 2018.
Performance Rights & Option Plan (PROP)
- 420,609 performance rights with an exercise price AU $0.00 expiring 30 September 2016,
- 160,658 performance rights with an exercise price AU $0.00 expiring 30 September 2016,
- 456,590 performance rights with an exercise price AU $0.00 expiring 30 September 2017, and
- 802,967 performance rights with an exercise price AU $0.00 expiring 30 September 2018.
TSR Performance Condition (Absolute, 50%) Proportion of Options which vest
If TSR falls below 7.5% return per annum None of the Options vest
If TSR lies between 7.5% and 10% return per annum 50% of the Options vest
If TSR lies between 10% and 12.5% return per annum 75% of the Options vest
If TSR lies at or above the 12.5% return per annum 100% the Options vest
TSR Performance Condition (Relative, 50%) (1) Proportion of Options which vest
Greater than 75th percentile 100% of the Options vest
Equal to or greater than 50th percentile 50% of the Options vest
Less than 50th percentile None of the Options vest
Movements in the year are:
Number of
Options & P.R.'s
Weighted
Average Exercise
Price
Number of
Options & P.R.'s
Weighted
Average Exercise
PriceNo AU $ No AU $
Outstanding at the beginning of the year 2,682,619 0.512 3,101,765 1.089 Granted 494,921 - 802,967 - Forfeited (290,636) - (872,113) 1.707 Exercised (1,040,631) 1.180 (350,000) 1.500 Outstanding at year-end 1,846,273 0.081 2,682,619 0.512 Exercisable at year-end 100,000 1.500 825,000 1.594
All options and performance rights granted are over ordinary shares, which confer a right of one ordinary share per option or performance
right. The options and performance rights hold no voting or dividend rights. At the end of the financial year there are 1,118,109 options and
performance rights on issue to key management personnel (2016: 1,745,131).
During the year, 650,000 of these options were exercised at AU $1.50, and 100,000 were exercised at $2.53.
PROP performance rights vest over a period of 3 years and are subject to the following Total Shareholder Return (TSR) Outperformance
Conditions, and continuous service until the vesting date.
The parent entity had 1,804,824 share options and performance rights on issue at the start of the year:
Under the Performance Rights & Option Plan (PROP), awards are made to executives who have an impact on the Group’s performance, and
are delivered in the form of options and rights.
2016
During the year, 290,631 of these performance rights were exercised at AU$0.00, and 290,636 performance rights lapsed.
2017
During the year, 494,921 performance right's (P.R.'s) were granted pursuant to the company's Performance Rights and Option Plan for nil
consideration. Performance rights are exercisable at AU $0.00 each with 486,716 vesting on 31 August 2019, and 8,205 vesting on 31 August
2018.
i) Performance Rights & Option Plan (PROP) - 21 January 2015, 6 November 2015, 29 January 2016, 23 November 2016, and 31 March 2017
The parent entity had 850,000 share options on issue at the start of the year:
The fair value of options and performance rights granted is deemed to represent the value of the employee services received over the
vesting period. The fair value of equity settled options and performance rights are estimated at the date of grant using either a Binomial
Option Valuation model or Monte Carlo Simulation with the following inputs:
The weighted average fair value of options and performance rights granted during the year was AU $1.63 (2016: AU $1.32).
At the date of issue, the weighted average share price of options and performance rights granted in the current year was AU $3.143. The
options and performance rights outstanding at 30 June 2017 had a weighted average exercise price of AU $0.081 and a weighted average
remaining contractual life of 1.25 years.
(1) TSR performance condition over the measurement period relative to the constituent companies of the ASX 300 Resources Index subject
to the following thresholds.
For
per
sona
l use
onl
y

04 FINANCIAL STATEMENTS
2017 FINANCIAL YEAR RESULTS 91
NOTES TO THE FINANCIAL STATEMENTS
for the period ended 30 June 2017
NOTE 23: Share Based Payments (continued)
Year of Issue 2014 - PROP 2014 - PROP 2014 - PROP 2014 - PROP 2015 - PROP 2015 - PROP
Grant date 21/01/2015 21/01/2015 21/11/2014 21/11/2014 6/11/2015 6/11/2015
Number Issued 153,272 153,279 75,019 75,020 316,348 316,350
Fair value at grant date
(AU $) 1.98$ 1.59$ 1.95$ 1.58$ 1.08$ 1.37$
Share price (AU $) 2.74$ 2.74$ 2.67$ 2.67$ 1.79$ 1.79$
Exercise price (AU $) -$ -$ -$ -$ -$ -$
Expected volatility 50.00% 50% 50% 50% 50.00% 50.00%
Option life 3 years 3 years 3 years 3 years 3 years 3 years
Expected dividends nil nil nil nil nil nil
Risk-free interest rate 2.09% 2.09% 2.53% 2.53% 1.97% 1.97%
Year of Issue 2015 - PROP 2015 - PROP 2016 - PROP 2016 - PROP 2016 - PROP 2016 - PROP
Grant date 29/01/2016 29/01/2016 23/11/2016 23/11/2016 31/03/2017 31/03/2017
Number Issued 85,132 85,137 59,361 59,360 184,548 184,548
Fair value at grant date
(AU $) 1.48$ 1.89$ 3.15$ 2.64$ 1.42$ 1.03$
Share price (AU $) 2.50$ 2.50$ 4.27$ 4.27$ 2.78$ 2.78$
Exercise price (AU $) -$ -$ -$ -$ -$ -$
Expected volatility 50.00% 50.00% 47.00% 47.00% 47.00% 47.00%
Option life 3 years 3 years 3 years 3 years 3 years 3 years
Expected dividends nil nil nil nil nil nil
Risk-free interest rate 1.88% 1.88% 1.85% 1.85% 1.82% 1.82%
NOTE 24: Financial Risk Management
(a) Financial Risk Management
The main purpose of these financial instruments is to provide finance for Group operations.
Risk Management Policies
Financial Risks
Equity price risk
Interest Rate Risk
The main risks the Group is exposed to through its financial instruments are interest rate risk, foreign currency risk, credit risk and liquidity
risk. There is a minor exposure to price risk through the financial assets. These risks are managed through monitoring of forecast cashflows,
interest rates, economic conditions and ensuring adequate funds are available.
Historical volatility has been the basis for determining expected share price volatility as it is assumed that this is indicative of future
movements.
The Group’s financial instruments comprise deposits with banks, financial assets, amounts receivable and payable, and interest bearing
liabilities.
The Board of Directors has overall responsibility for the establishment and oversight of the Group's risk management framework.
Management is responsible for developing and monitoring the risk management policies and reports to the Board.
Key management of the Group meet on a regular basis to analyse exposure and to evaluate treasury management strategies in the context
of the most recent economic conditions and forecasts.
This risk is managed through the use of variable rate term deposits.
The Group's exposure to interest rate risk, which is the risk that a financial instrument's value will fluctuate as a result of reasonably possible
changes in market interest rates arises in relation to the Group's bank balances.
At the reporting date, the exposure to listed equity securities at fair value was $9,404. An increase or decrease of 10% on the ASX market
index could have an impact of approximately $940 on the profit attributable to the Group, depending on whether the variance is significant
or prolonged.
The Group’s listed equity securities are susceptible to market price risk arising from uncertainties about future values of the investment
securities.
For
per
sona
l use
onl
y
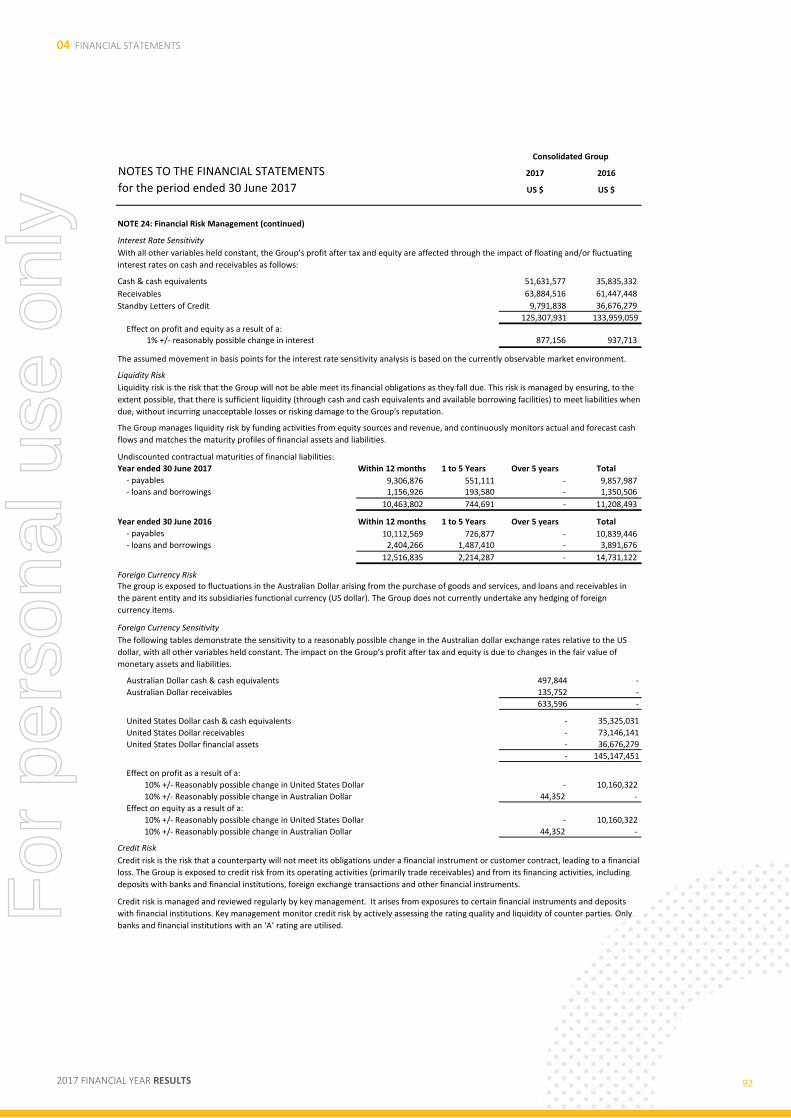
04 FINANCIAL STATEMENTS
2017 FINANCIAL YEAR RESULTS 92
NOTES TO THE FINANCIAL STATEMENTS 2017 2016
for the period ended 30 June 2017 US $ US $
Consolidated Group
NOTE 24: Financial Risk Management (continued)
Interest Rate Sensitivity
Cash & cash equivalents 51,631,577 35,835,332
Receivables 63,884,516 61,447,448
Standby Letters of Credit 9,791,838 36,676,279
125,307,931 133,959,059 Effect on profit and equity as a result of a:
1% +/- reasonably possible change in interest 877,156 937,713
Liquidity Risk
Undiscounted contractual maturities of financial liabilities:
Year ended 30 June 2017 Within 12 months 1 to 5 Years Over 5 years Total
- payables 9,306,876 551,111 - 9,857,987 - loans and borrowings 1,156,926 193,580 - 1,350,506
10,463,802 744,691 - 11,208,493
Year ended 30 June 2016 Within 12 months 1 to 5 Years Over 5 years Total
- payables 10,112,569 726,877 - 10,839,446 - loans and borrowings 2,404,266 1,487,410 - 3,891,676
12,516,835 2,214,287 - 14,731,122
Foreign Currency Risk
Foreign Currency Sensitivity
Australian Dollar cash & cash equivalents 497,844 -
Australian Dollar receivables 135,752 -
633,596 -
United States Dollar cash & cash equivalents - 35,325,031
United States Dollar receivables - 73,146,141
United States Dollar financial assets - 36,676,279
- 145,147,451
Effect on profit as a result of a:
10% +/- Reasonably possible change in United States Dollar - 10,160,322
10% +/- Reasonably possible change in Australian Dollar 44,352 -
Effect on equity as a result of a:
10% +/- Reasonably possible change in United States Dollar - 10,160,322
10% +/- Reasonably possible change in Australian Dollar 44,352 -
Credit Risk
The assumed movement in basis points for the interest rate sensitivity analysis is based on the currently observable market environment.
With all other variables held constant, the Group’s profit after tax and equity are affected through the impact of floating and/or fluctuating
interest rates on cash and receivables as follows:
The group is exposed to fluctuations in the Australian Dollar arising from the purchase of goods and services, and loans and receivables in
the parent entity and its subsidiaries functional currency (US dollar). The Group does not currently undertake any hedging of foreign
currency items.
The following tables demonstrate the sensitivity to a reasonably possible change in the Australian dollar exchange rates relative to the US
dollar, with all other variables held constant. The impact on the Group’s profit after tax and equity is due to changes in the fair value of
monetary assets and liabilities.
Credit risk is managed and reviewed regularly by key management. It arises from exposures to certain financial instruments and deposits
with financial institutions. Key management monitor credit risk by actively assessing the rating quality and liquidity of counter parties. Only
banks and financial institutions with an ‘A’ rating are utilised.
Credit risk is the risk that a counterparty will not meet its obligations under a financial instrument or customer contract, leading to a financial
loss. The Group is exposed to credit risk from its operating activities (primarily trade receivables) and from its financing activities, including
deposits with banks and financial institutions, foreign exchange transactions and other financial instruments.
The Group manages liquidity risk by funding activities from equity sources and revenue, and continuously monitors actual and forecast cash
flows and matches the maturity profiles of financial assets and liabilities.
Liquidity risk is the risk that the Group will not be able meet its financial obligations as they fall due. This risk is managed by ensuring, to the
extent possible, that there is sufficient liquidity (through cash and cash equivalents and available borrowing facilities) to meet liabilities when
due, without incurring unacceptable losses or risking damage to the Group's reputation.
For
per
sona
l use
onl
y
04 FINANCIAL STATEMENTS
2017 FINANCIAL YEAR RESULTS 93
NOTES TO THE FINANCIAL STATEMENTS 2017 2016
for the period ended 30 June 2017 US $ US $
Consolidated Group
NOTE 24: Financial Risk Management (continued)
Commodity Price Risk
Trading Commodity Price SensitivityThe following table shows the effect of price changes in boron chemicals at 30 June 2017.
Effect on profit as a result of a:
10% +/- Reasonably possible change in Boron chemicals 332,804 274,421
Capital management
Trade and other payables (Note 16) 9,857,987 10,839,446
Loans and borrowings (Note 11) 949,885 3,071,392
Less: cash and short-term deposits (Note 8) (51,631,577) (35,835,332)
Net cash (40,823,705) (21,924,494)
Equity 218,019,941 190,738,799
Capital and net cash 177,196,236 168,814,305
Gearing ratio -23% -13%
(b) Fair Values
(c) Financial Assets
The prices of lithium chemicals have fluctuated widely in recent years and are affected by factors beyond the control of the Group including,
but not limited to, the relationship between global supply and demand for lithium chemicals which may be affected by, but not limited to,
development and commercial acceptance of lithium based applications and technologies and/or the introduction of new technologies that
may not be based on lithium, forward selling by producers, the cost of production, new mine developments and mine closures, advances in
various production technologies for such minerals and general global economic conditions. The prices of lithium and other commodities can
also be affected by the outlook for inflation, interest rates, currency exchange rates and supply and demand issues. Also, major lithium
producers may attempt to sell lithium products at artificially low prices in order to drive new entrants out of the market. These factors may
have an adverse effect on the Group's production, development and exploration activities, as well as its ability to fund its future activities. All
sales contracts are agreed in USD or USD equivalent prices and forward contracts are agreed for periods of 3-12 months.
The Group does not have any material credit risk exposure to any single receivable or Group of receivables under financial instruments
entered into by the Group, other than bank balances and short term deposits (Note 8), VAT tax credits, receivables from joint venture (Note
9), and SBLC's (Note 11).
The maximum exposure to credit risk, excluding the value of any collateral or other security, at balance date to recognised financial assets, is
the carrying amount, net of any provisions for impairment of those assets, as disclosed in the statement of financial position and notes to the
financial statements.
The aggregate values and carrying amounts of financial assets and liabilities are disclosed in the statement of financial position and notes to
the financial statements. Fair values are materially in line with carrying values. The shares in listed entities comprise listed investments for
which a Level 1 fair value hierarchy has been applied (quoted price in an active market).
No financial assets or liabilities are readily traded on organised markets in a standardised form, other than shares in listed entities.
The Group’s financial instruments consist mainly of deposits with banks, local money market instruments, short-term investments, accounts
receivable and payable, loans to and from subsidiaries, and joint ventures.
The Group is also affected by the market forces and market price cycles of boron chemical and mineral products. In relation to boron
chemical and mineral products the market price is determined largely by the market supply and demand balance which is influenced heavily
by the rate of GDP growth. There are two significant manufacturers of boron chemicals and minerals in the global market so the supply side
is relatively consolidated. Boron chemical and mineral products are used in applications such as ceramic and glass manufacture, insulation
and fertiliser manufacture. Although there is a cyclic profile in these markets they are considered steady growth markets linked strongly to
urbanisation and food production so volatility is not considered high. In terms of inputs, the major input is ore mined from the company's
own assets so input cost risk is managed through control of costs such as diesel fuel, labour and gas via forward contracts. All sales contracts
are typically agreed in USD or USD equivalent prices and forward contracts are agreed for periods of 3-12 months.
No changes were made in the objectives, policies or processes for managing capital during the years ended 30 June 2017 and 2016. The
change in the gearing ratio in the current year reflects the increase in cash as a result of the release of SBLC's during the year.
The Group manages its capital structure and makes adjustments to it in light of changes in economic conditions. To maintain or adjust the
capital structure, the Group may return capital to shareholders or issue new shares.
The Group’s prospects and share price will be influenced by the price obtained from time to time for the commodities that it produces and
those that it targets in its exploration programs, namely lithium chemicals, boron chemical and mineral products and, to a lesser extent,
other minerals.
The primary objective of the Group’s capital management is to ensure that it maintains a strong credit rating and healthy capital ratios to
support its business and maximise the shareholder’s value.
Capital includes equity attributable to the equity holders of the Parent.
For
per
sona
l use
onl
y

04 FINANCIAL STATEMENTS
2017 FINANCIAL YEAR RESULTS 94
NOTES TO THE FINANCIAL STATEMENTS 2017 2016
for the period ended 30 June 2017 US $ US $
Consolidated Group
NOTE 24: Financial Risk Management (continued)
Note
Financial assets
Cash and cash equivalents 8 51,631,577 35,835,332
Financial assets at amortised cost (loans and receivables):
– current trade and other receivables 9 24,333,812 7,715,483
– non-current trade and other receivables 9 57,799,709 70,199,473
– current standby letters of credit 11 9,791,838 -
– non-current standby letters of credit 11 - 36,676,279
Shares in listed entities at fair value (available for sale financial asset):
– listed investments 11 9,404 9,404
Total financial assets 143,566,340 150,435,971
Financial liabilities
Financial liabilities at amortised cost:
– current trade and other payables 16 9,306,876 10,112,569
– non-current trade and other payables 16 551,111 726,877
– current loans and borrowings 11 877,225 2,026,955
– non-current loans and borrowings 11 72,660 1,044,437
Total financial liabilities 10,807,872 13,910,838
NOTE 25: Segment Reporting
Segment Information
Year ended 30 June 2017 Corporate Olaroz project Borax Argentina Eliminations Total EntityUS$ US$ US$ US$ US$
Revenue and other income - 79,843,090 17,439,410 (79,843,090) 17,439,410
EBITDAIX* (6,674,797) 48,197,178 (1,651,097) (48,177,602) (8,306,318)
Less Depreciation & Amortisation (30,407) (5,825,475) (1,712,842) 5,825,475 (1,743,249)
EBITIX** (6,705,204) 42,371,703 (3,363,939) (42,352,127) (10,049,567)
Less Interest 4,373,546 (7,040,833) (1,180,329) 5,636,444 1,788,828
EBTIX*** (2,331,658) 35,330,870 (4,544,268) (36,715,683) (8,260,739)
Less Impairment - - (8,104,583) - (8,104,583)
Add Foreign currency gains / (losses) 232,434 - 472,301 (79,702) 625,033
Add share of profit of joint venture - 21,479,881 - - 21,479,881
Segment profit / (loss) before tax (2,099,224) 21,479,881 (12,176,550) (1,464,515) 5,739,592
The Group has three reportable segments, being Corporate, the Olaroz project and Borax. During the financial year, the segment South
American Salars was disposed of (see Note 4 for further information).
In determining operating segments, the Group has had regard to the information and reports the chief operating decision maker uses to
make strategic decisions regarding resources. The Chief Executive Officer (CEO) is considered to be the chief operating decision maker and is
empowered by the Board of Directors to allocate resources and assess the performance of the Group. The CEO assesses and reviews the
business using the operating segments below. Segment performance is evaluated based on the performance criteria parameters agreed for
each segment. These include, but are not limited to: financial performance, exploration activity, mine yield, production volumes and cost
controls.
The following tables present revenue and profit information about the Group's operating segments for the year ended 30 June 2017 and
2016 respectively.
Transfer prices between operating segments are on an arm's length basis in a manner similar to transactions with third parties.
Inter-segment interest of $5,636,444 is eliminated on consolidation.
The Group operates primarily in Argentina in the mining industry. The Group's primary focus is on exploration for and development of
lithium and potash deposits. The Group also includes the operations of Borax.
The totals for each category of financial instruments, measured in accordance with AASB 139 as detailed in the accounting policies to these
financial statements, are as follows:
For
per
sona
l use
onl
y
04 FINANCIAL STATEMENTS
2017 FINANCIAL YEAR RESULTS 95
NOTES TO THE FINANCIAL STATEMENTS
for the period ended 30 June 2017
NOTE 25: Segment Reporting (continued)
Year ended 30 June 2016 Orocobre Ltd Olaroz project Borax Eliminations Total EntityUS$ US$ US$ US$ US$
Revenue and other income - 10,221,392 18,903,919 (10,600,862) 18,524,449
EBITDAIX* (6,683,370) 5,329,745 (773,799) (5,623,156) (7,750,580)
Less Depreciation & Amortisation (11,826) (476,209) (1,673,927) 476,209 (1,685,753)
EBITIX** (6,695,196) 4,853,536 (2,447,726) (5,146,947) (9,436,333)
Less Interest 3,412,850 (1,217,632) (1,318,453) (402,264) 474,501
EBTIX*** (3,282,346) 3,635,904 (3,766,179) (5,549,211) (8,961,832)
Less Impairment - - - - -
Less Foreign currency gains / (losses) (58,720) - (2,456,768) (12,622) (2,528,110)
Less share of loss of joint venture - (11,000,508) - - (11,000,508)
Segment profit / (loss) before tax (3,341,066) (11,000,508) (6,222,947) (1,925,929) (22,490,450)
*EBITDAIX - Segment earnings before Interest, taxes, depreciation, amortisation, impairment, and foreign currency gains / (losses)
**EBITIX - Segment earnings before Interest, taxes, impairment, and foreign currency gains / (losses)
***EBTIX - Segment earnings before taxes, impairment, and foreign currency gains / (losses)
As at 30 June 2017 Corporate Olaroz project Borax Eliminations Total Entity
US$ US$ US$ US$ US$
ASSETS
Segment assets 188,269,182 57,686,421 31,165,497 (36,978,069) 240,143,031
LIABILITIES
Segment liabilities 1,250,309 432,607 57,405,955 (36,965,781) 22,123,090
OTHER DISCLOSURES
Investment in a JV (Note 15) - 57,686,421 - - 57,686,421
Investment in an associate (Note 15) 21,475,994 - - - 21,475,994
Capital Expenditure (Note 12 & Note 13) - (454,339) (3,430,723) - (3,885,062)
As at 30 June 2016 Corporate Olaroz project
South American
Salars Borax Eliminations Total Entity
US$ US$ US$ US$ US$ US$
ASSETS
Segment assets 177,741,574 35,061,038 4,749,316 43,130,465 (44,854,857) 215,827,536
LIABILITIES
Segment liabilities 808,388 433,005 11,670,222 54,638,991 (41,150,059) 26,400,547
OTHER DISCLOSURES
Investment in a JV (Note
15) - 35,061,038 - - - 35,061,038
Capital Expenditure
(Note 12 & Note 13) - - (248,077) (3,544,026) - (3,792,103)
Segment accounting policies
Reconciliation of profit 2017 2016
Segment profit before tax 5,739,592 (22,490,450) Group profit before tax 5,739,592 (22,490,450)
Reconciliation of assets
Segment operating assets 312,121,318 306,585,778 Inter-segment loans (eliminations) (60,020,622) (66,664,129) Inter-segment investments (eliminations) (11,957,665) (24,094,113) Group operating assets 240,143,031 215,827,536
The following tables present segment assets and liabilities of the Group's operating segments as at 30 June 2017 and 2016:
Inter-segment interest of $1,925,929 is eliminated on consolidation.
(1) The segment South American Salars was discontinued during the current financial year. See note 4 for more information.
Segment accounting policies are consistent with those adopted in the annual financial statements of the Group.
For
per
sona
l use
onl
y
04 FINANCIAL STATEMENTS
2017 FINANCIAL YEAR RESULTS 96
NOTES TO THE FINANCIAL STATEMENTS 2017 2016
for the period ended 30 June 2017 US $ US $
Consolidated Group
NOTE 25: Segment Reporting (continued)
Reconciliation of liabilities
Segment operating liabilities 82,143,712 93,064,676 Inter-segment loans (eliminations) (60,020,622) (66,664,129) Group operating liabilities 22,123,090 26,400,547
Geographic Information
Revenues from external customers
Australia - - Argentina 17,439,410 18,524,449 Total revenue 17,439,410 18,524,449
Segment Assets
Australia 188,269,182 177,741,574 Argentina 51,873,849 38,085,962 Total assets 240,143,031 215,827,536
Segment Liabilities
Australia 1,250,309 808,388 Argentina 20,872,781 25,592,159 Total liabilities 22,123,090 26,400,547
NOTE 26: Parent Entity Information
Current assets 87,130,026 45,125,733 Non-current assets 213,854,214 244,327,443
Total assets 300,984,240 289,453,176 Current liabilities 1,250,309 808,388 Non-current liabilities 432,607 433,005
Total liabilities 1,682,916 1,241,393 Contributed equity 243,183,905 242,248,318 Reserves (44,622,078) (44,372,841) Accumulated profits/(losses) 100,739,497 90,336,306
Total equity 299,301,324 288,211,783 Profit/(loss) for the year 10,403,191 (2,824,744)
Total comprehensive profit/(loss) for the year 10,403,191 (2,824,744)
NOTE 27: Company Details
The registered office and principal place of business is: Level 1, 349 Coronation Drive, Milton, Queensland 4064, Australia.
Orocobre Limited had no contingent liabilities at year end. As set out in Note 22 the Company has an operating lease commitment for US
$177,511 (2016: US $284,874).
The following information relates to the parent entity, Orocobre Limited at 30 June 2017. This information has been prepared in accordance
with Accounting Standards using consistent accounting policies as presented in Note 1. The information is extracted from the books and
records of the parent.
The revenue information above is based on the locations of the origin of the sale.
For
per
sona
l use
onl
y
04 FINANCIAL STATEMENTS
2017 FINANCIAL YEAR RESULTS 97
OROCOBRE LIMITED ABN 31 112 589 910 DIRECTORS’ DECLARATION
OROCOBRE LIMITED ABN 31 112 589 910 DIRECTORS’ DECLARATION
In accordance with a resolution of the directors of Orocobre Limited, I state that:
1. In the opinion of the Directors:
a) the financial statements and notes of Orocobre Limited for the financial year ended 30 June 2017 are in accordance with the Corporations Act 2001, including:
i. giving a true and fair view of the consolidated entity’s financial position as at 30 June 2017 and of its performance for the year ended on that date; and
ii. complying with Accounting Standards and the Corporations Regulations 2001;
b) the financial statements and notes also comply with International Financial Reporting Standards as disclosed in Note 1; and
c) there are reasonable grounds to believe that the Company will be able to pay its debts as and when they become due and payable.
2. This declaration has been made after receiving the declarations required to be made to the directors by the Chief Executive Officer and Chief Financial Officer in accordance with section 295A of the Corporations Act 2001 for the financial year ended 30 June 2017.
Robert Hubbard R P Seville Chairman Managing Director Dated this: 31st day of August 2017
For
per
sona
l use
onl
y
04 FINANCIAL STATEMENTS
2017 FINANCIAL YEAR RESULTS 98
For
per
sona
l use
onl
y
04 FINANCIAL STATEMENTS
2017 FINANCIAL YEAR RESULTS 99
For
per
sona
l use
onl
y
04 FINANCIAL STATEMENTS
2017 FINANCIAL YEAR RESULTS 100
For
per
sona
l use
onl
y

04 FINANCIAL STATEMENTS
2017 FINANCIAL YEAR RESULTS 101
For
per
sona
l use
onl
y
04 FINANCIAL STATEMENTS
2017 FINANCIAL YEAR RESULTS 102
For
per
sona
l use
onl
y

04 FINANCIAL STATEMENTS
2017 FINANCIAL YEAR RESULTS 103
Schedule of Tenements Project Area Tenement
Number Area
( Hectares) Orocobre Interest
Location of Tenements
Olaroz
1842-S-12 2988.17
66.5% Argentina
1274-P-2009 5972 Argentina
131-I-1986 100 Argentina
039-M-1998 98.4 Argentina
112-S-04 100 Argentina
117-A-44 100 Argentina
114-S-44 100 Argentina
40-M-1998 100 Argentina
029-M-1996 100 Argentina
126-T-44 100 Argentina
393-M-44 98.4 Argentina
112-D-44 299,94 Argentina
125-S-44 100 Argentina
319-T-2005 1473.97 Argentina
056-L-1991 300 Argentina
519-L-2006 2000 Argentina
520-L-2006 1896.52 Argentina
521-L-2006 2048 Argentina
522-L-2006 2000 Argentina
147-L-2003 1927.92 Argentina
724-L-2007 3336.19 Argentina
725-L-2007 2940.11 Argentina
726-L-2007 2889.98 Argentina
727-L-2007 3117.26 Argentina
728-L-2007 3182.35 Argentina
503-L-2006 6130 Argentina
943-R-2008 563.98 Argentina
1136-R-2009 1199.34 Argentina
1137-R-2009 1205 Argentina
For
per
sona
l use
onl
y
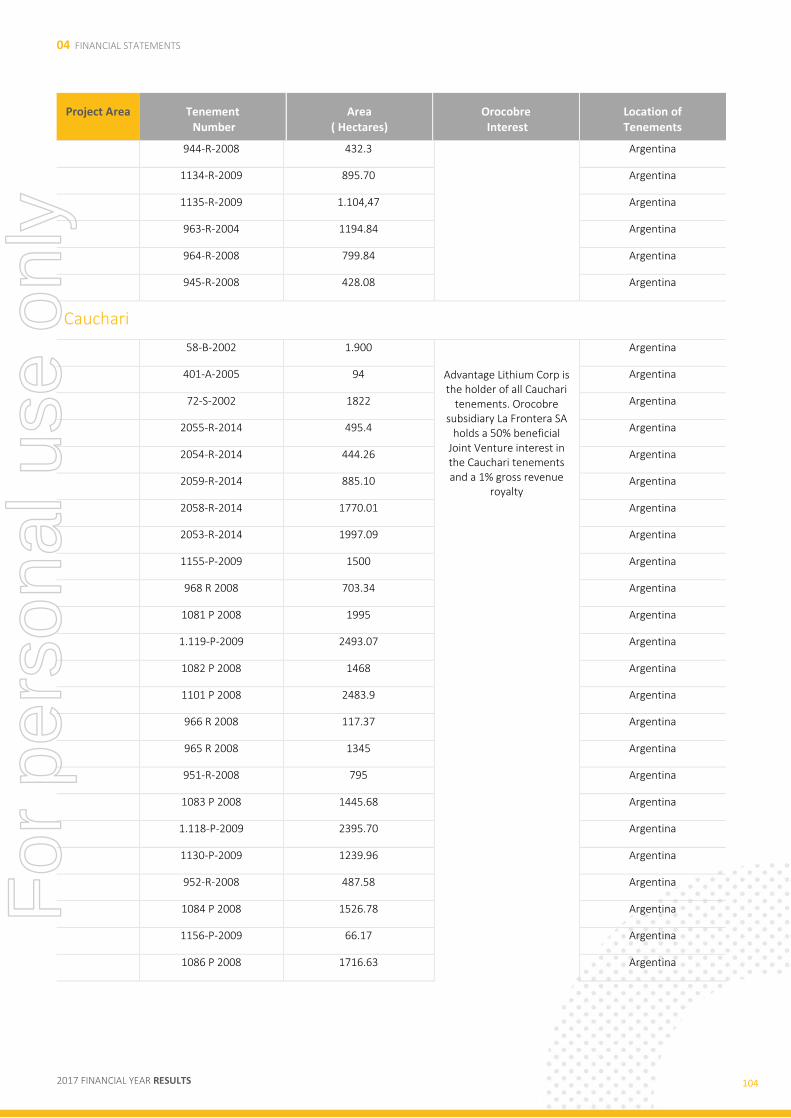
04 FINANCIAL STATEMENTS
2017 FINANCIAL YEAR RESULTS 104
Project Area Tenement Number
Area ( Hectares)
Orocobre Interest
Location of Tenements
944-R-2008 432.3 Argentina
1134-R-2009 895.70 Argentina
1135-R-2009 1.104,47 Argentina
963-R-2004 1194.84 Argentina
964-R-2008 799.84 Argentina
945-R-2008 428.08 Argentina
Cauchari
58-B-2002 1.900
Advantage Lithium Corp is the holder of all Cauchari
tenements. Orocobre subsidiary La Frontera SA
holds a 50% beneficial Joint Venture interest in the Cauchari tenements and a 1% gross revenue
royalty
Argentina
401-A-2005 94 Argentina
72-S-2002 1822 Argentina
2055-R-2014 495.4 Argentina
2054-R-2014 444.26 Argentina
2059-R-2014 885.10 Argentina
2058-R-2014 1770.01 Argentina
2053-R-2014 1997.09 Argentina
1155-P-2009 1500 Argentina
968 R 2008 703.34 Argentina
1081 P 2008 1995 Argentina
1.119-P-2009 2493.07 Argentina
1082 P 2008 1468 Argentina
1101 P 2008 2483.9 Argentina
966 R 2008 117.37 Argentina
965 R 2008 1345 Argentina
951-R-2008 795 Argentina
1083 P 2008 1445.68 Argentina
1.118-P-2009 2395.70 Argentina
1130-P-2009 1239.96 Argentina
952-R-2008 487.58 Argentina
1084 P 2008 1526.78 Argentina
1156-P-2009 66.17 Argentina
1086 P 2008 1716.63 Argentina
For
per
sona
l use
onl
y
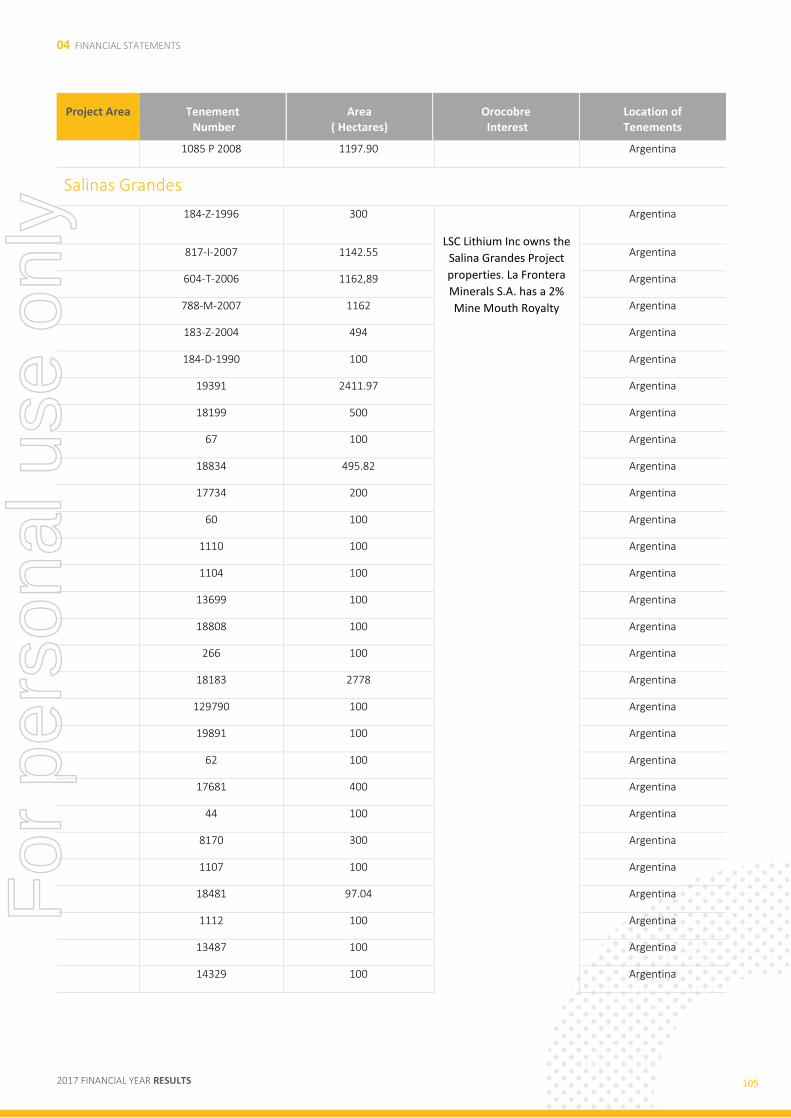
04 FINANCIAL STATEMENTS
2017 FINANCIAL YEAR RESULTS 105
Project Area Tenement Number
Area ( Hectares)
Orocobre Interest
Location of Tenements
1085 P 2008 1197.90 Argentina
Salinas Grandes
184-Z-1996 300
LSC Lithium Inc owns the
Salina Grandes Project
properties. La Frontera
Minerals S.A. has a 2%
Mine Mouth Royalty
Argentina
817-I-2007 1142.55 Argentina
604-T-2006 1162,89 Argentina
788-M-2007 1162 Argentina
183-Z-2004 494 Argentina
184-D-1990 100 Argentina
19391 2411.97 Argentina
18199 500 Argentina
67 100 Argentina
18834 495.82 Argentina
17734 200 Argentina
60 100 Argentina
1110 100 Argentina
1104 100 Argentina
13699 100 Argentina
18808 100 Argentina
266 100 Argentina
18183 2778 Argentina
129790 100 Argentina
19891 100 Argentina
62 100 Argentina
17681 400 Argentina
44 100 Argentina
8170 300 Argentina
1107 100 Argentina
18481 97.04 Argentina
1112 100 Argentina
13487 100 Argentina
14329 100 Argentina
For
per
sona
l use
onl
y

04 FINANCIAL STATEMENTS
2017 FINANCIAL YEAR RESULTS 106
Project Area Tenement Number
Area ( Hectares)
Orocobre Interest
Location of Tenements
57 100 Argentina
68 100 Argentina
17538 95.43 Argentina
14589 100 Argentina
18924 300 Argentina
18925 99.94 Argentina
19206 869 Argentina
11577 100 Argentina
11578 100 Argentina
11579 100 Argentina
11580 100 Argentina
1111 100 Argentina
18833 270 Argentina
17321 186 Argentina
53 100 Argentina
19742 2490.07 Argentina
19744 2499.97 Argentina
19766 1000 Argentina
48 100 Argentina
203 100 Argentina
204 100 Argentina
54 100 Argentina
63 100 Argentina
50 100 Argentina
1105 100 Argentina
65 100 Argentina
70 100 Argentina
206 100 Argentina
86 300 Argentina
17744 500 Argentina
18533 97.03 Argentina
17580 100 Argentina
For
per
sona
l use
onl
y
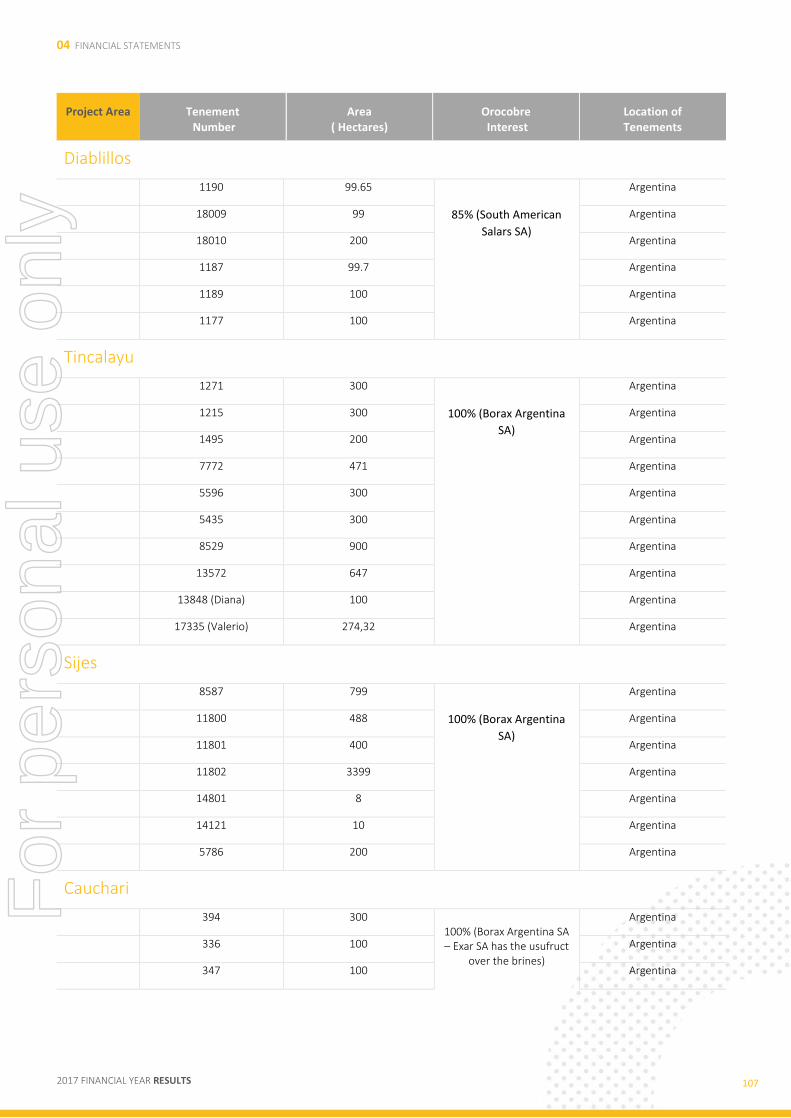
04 FINANCIAL STATEMENTS
2017 FINANCIAL YEAR RESULTS 107
Project Area Tenement Number
Area ( Hectares)
Orocobre Interest
Location of Tenements
Diablillos
1190 99.65
85% (South American
Salars SA)
Argentina
18009 99 Argentina
18010 200 Argentina
1187 99.7 Argentina
1189 100 Argentina
1177 100 Argentina
Tincalayu
1271 300
100% (Borax Argentina
SA)
Argentina
1215 300 Argentina
1495 200 Argentina
7772 471 Argentina
5596 300 Argentina
5435 300 Argentina
8529 900 Argentina
13572 647 Argentina
13848 (Diana) 100 Argentina
17335 (Valerio) 274,32 Argentina
Sijes
8587 799
100% (Borax Argentina
SA)
Argentina
11800 488 Argentina
11801 400 Argentina
11802 3399 Argentina
14801 8 Argentina
14121 10 Argentina
5786 200 Argentina
Cauchari
394 300
100% (Borax Argentina SA – Exar SA has the usufruct
over the brines)
Argentina
336 100 Argentina
347 100 Argentina
For
per
sona
l use
onl
y
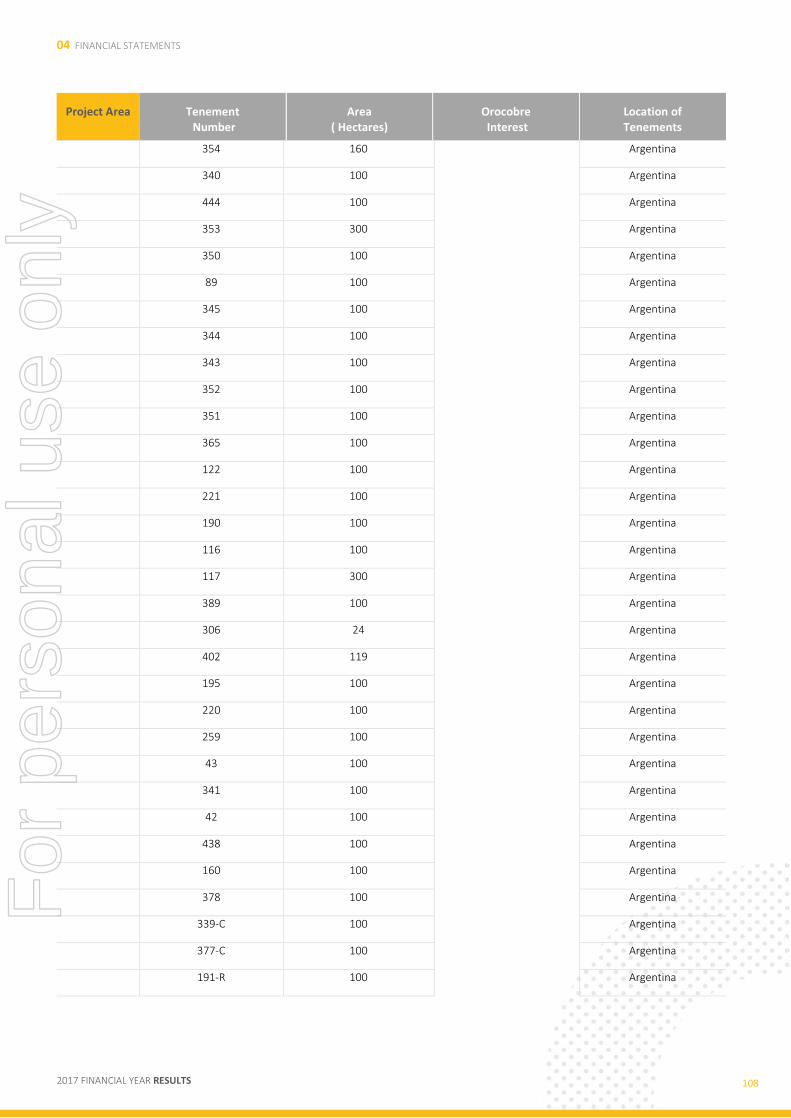
04 FINANCIAL STATEMENTS
2017 FINANCIAL YEAR RESULTS 108
Project Area Tenement Number
Area ( Hectares)
Orocobre Interest
Location of Tenements
354 160 Argentina
340 100 Argentina
444 100 Argentina
353 300 Argentina
350 100 Argentina
89 100 Argentina
345 100 Argentina
344 100 Argentina
343 100 Argentina
352 100 Argentina
351 100 Argentina
365 100 Argentina
122 100 Argentina
221 100 Argentina
190 100 Argentina
116 100 Argentina
117 300 Argentina
389 100 Argentina
306 24 Argentina
402 119 Argentina
195 100 Argentina
220 100 Argentina
259 100 Argentina
43 100 Argentina
341 100 Argentina
42 100 Argentina
438 100 Argentina
160 100 Argentina
378 100 Argentina
339-C 100 Argentina
377-C 100 Argentina
191-R 100 Argentina
For
per
sona
l use
onl
y

04 FINANCIAL STATEMENTS
2017 FINANCIAL YEAR RESULTS 109
Project Area Tenement Number
Area ( Hectares)
Orocobre Interest
Location of Tenements
Diablillos Diablillos Group – File No. 11.691
1175 100
100% Borax Argentina SA(Potasio y Litio de Argentina S.A. has an
usufruct on the brines)
Argentina
1176 100 Argentina
1164 100 Argentina
1172 100 Argentina
1165 100 Argentina
1166 100 Argentina
Argentina
1179 100 Argentina
1180 200 Argentina
1182 100 Argentina
1195 100 Argentina
1206 100 Argentina
1168 100 Argentina
1163 100 Argentina
1167 100 Argentina
1170 100 Argentina
1174 100 Argentina
1171 100 Argentina
7021 100 Argentina
1181 100 Argentina
12653 200 Argentina
1173 100 Argentina
1169 100 Argentina
1178 100 Argentina
12652 200 Argentina
For
per
sona
l use
onl
y
04 FINANCIAL STATEMENTS
2017 FINANCIAL YEAR RESULTS 110
Technical Information, Competent Persons’ and Qualified Persons’ Statements
The resource model and brine resource estimate on the Salar de Olaroz was undertaken by John Houston, an independent consultant employed by John Houston Consulting who is a Chartered Geologist and a Fellow of the Geological Society of London. John Houston has sufficient relevant experience to qualify as a competent person as defined in the 2004 edition of the Australasian Code for Reporting of Exploration Results, Mineral Resources and Ore Reserves. He is also a “Qualified Person” as defined by Canadian Securities Administrators’ National Instrument 43-101.
The Feasibility Study on the Olaroz project was prepared by John Houston and Michael Gunn an independent consultant employed by Gunn Metals, together with Sinclair Knight Merz and the Orocobre technical group. Mr. Houston and Mr. Gunn prepared the technical report entitled “Technical Report – Salar de Olaroz Lithium-Potash Project, Argentina” dated May 13, 2011 (the “Olaroz Report”) under NI 43-101 in respect of the Feasibility Study, and each of Messrs. Houston and Gunn was a Qualified Person under NI 43-101, and independent of the company, at the date such report was prepared. Mr Gunn is a Member of the Australian Institute of Mining and Metallurgy and is consulting mineral processing engineer with approximately forty years’ experience.
The information relating to the Olaroz project is extracted from the report entitled “NI 43-101 “Technical Report – Salar de Olaroz Lithium-Potash Project, Argentina”, dated 13 May 2011 and can be viewed at www.orocobre.com. Apart from the defined exploration target detailed in this announcement, the Company is not aware of any information or data that materially affects the information included in the original market announcement. All material assumptions and technical parameters underpinning the estimates in the relevant market announcement continue to apply and have not materially changed. The Company confirms that the form and context in which the Competent Person’s findings are presented have not been materially modified from the original market announcement.
This information in regard to the Olaroz Project with the exception of the information pertaining to the defined exploration target was prepared and first disclosed under the JORC Code 2004. It has not been updated since to comply with the JORC Code 2012 on the basis that the information has not materially changed since it was last reported.
The resource estimate in regard to the defined exploration target at Olaroz was prepared by Murray Brooker, an independent consultant employed by Hydrominex Geoscience Pty Ltd. Murray Brooker is a geologist and hydrogeologist and is a Member of the Australian Institute of Geoscientists. Murray has sufficient relevant experience to qualify as a competent person as defined in the 2004 edition of the Australasian Code for Reporting of Exploration Results, Mineral Resources and Ore Reserves. He is also a “Qualified Person” as defined by Canadian Securities Administrators’ National Instrument 43-101. The exploration target is between 1.6 and 7.5 million tonnes of lithium carbonate equivalent between 197m and 323m depth. The basin is potentially 600m deep and additional targets to the north and the south of the exploration target area. It must be stressed that an exploration target is not a mineral resource. The potential quantity and grade of the exploration target is conceptual in nature, and there has been insufficient exploration to define a Mineral Resource in the volume where the Exploration Target is outlined. It is uncertain if further exploration drilling will result in the determination of a Mineral Resource in this volume.
The technical information relating to Cauchari has been prepared by Murray Brooker in conjunction. Murray Brooker, an independent consultant employed by Hydrominex Geoscience Pty Ltd is a geologist and hydrogeologist and a Member of the Australian Institute of Geoscientists. Murray has sufficient relevant experience to qualify as a competent person as defined in the 2004 edition of the Australasian Code for Reporting of Exploration Results, Mineral Resources and Ore Reserves. He is also a “Qualified Person” as defined by Canadian Securities Administrators’ National Instrument 43-101.
For
per
sona
l use
onl
y
04 FINANCIAL STATEMENTS
2017 FINANCIAL YEAR RESULTS 111
The resource information in relation to Cauchari is extracted from the report entitled NI43-101 Technical Report on the Cauchari Project dated 30 April 2010. The report is available to view on the Company website www.orocobre.com.
This information in regard to Cauchari was prepared and first disclosed under the JORC Code 2004. It has not been updated since to comply with the JORC Code 2012 on the basis that the information has not materially changed since it was last reported.
The information in this report that relates to resources at the Borax Argentina Tincalayu site has been prepared by Mr Murray Brooker. Murray Brooker, an independent consultant employed by Hydrominex Geoscience Pty Ltd is a geologist and hydrogeologist and is a Member of the Australian Institute of Geoscientists. Murray has sufficient relevant experience to qualify as a competent person as defined in the 2004 edition of the Australasian Code for Reporting of Exploration Results, Mineral Resources and Ore Reserves. He is also a “Qualified Person” as defined by Canadian Securities Administrators’ National Instrument 43-101. The information is extracted from the announcement titled Tincalayu Upgraded to JORC Compliant Resource, dated 18 November 2014 and the NI-43-101 Report titled “Technical Report on the Tincalayu Borax Mine”, dated December 31st 2014, both available to view on the Company website www.orocobre.com.
The Company confirms that it is not aware of any new information or data that materially affects the information included in the references above and that all material assumptions and technical parameters underpinning the resource estimates continue to apply and have not materially changed. The Company also confirms that the form and context in which the Competent Person’s findings are presented have not been materially modified. The Company also confirms that the form and context in which the Competent Person’s findings are presented have not been materially modified.
An announcement was made on the 21 August 2012 regarding the superseded historical resource at Tincalayu. The Company is not in possession of any new information or data relating to historical estimates that materially impacts on the reliability of the estimates or the company’s ability to verify the historical estimates as mineral resources, in accordance with the JORC Code. The supporting information provided in the initial market announcement on 21 August 2012 continues to apply and has not materially changed.
Additional information relating to the Company’s projects is available on the Company’s website.
Caution Regarding Forward Looking Information This report contains “forward-looking information” within the meaning of applicable securities legislation. Forward-looking information may include, but is not limited to, the results of the Olaroz feasibility study, the estimation and realisation of mineral resources at the Company’s projects, the viability, recoverability and processing of such resources, costs and timing of development of the Olaroz project, the forecasts relating to the lithium, potash and borate markets including market price whether stated or implied, demand and other information and trends relating to any market tax, royalty and duty rates., timing and receipt of approvals for the Company’s projects, consents and permits under applicable legislation, adequacy of financial resources, the meeting of banking covenants contained in project finance documentation for the Olaroz project, production and other milestones for the Olaroz project, the Olaroz project’s future financial and operating performance including production, rates of return, operating costs, capital costs and cash flows, potential operating synergies between the Company’s projects and the Olaroz project, other matters related to the development of the Olaroz and Cauchari, the performance of the relocated borax plant, including without limitation the plant’s estimated production rate, financial data, the estimates of mineral resources or mineralisation grade at the Tincalayu mine, the economic viability of such mineral resources or mineralisation, mine life and operating costs at the Tincalayu mine, the projected production rates associated with the borax plant.
Forward-looking information is subject to known and unknown risks, uncertainties and other factors that may cause actual results to be materially different from those expressed or implied by such forward-looking information, including but not limited to the risk that further funding may be required, but unavailable, for the
For
per
sona
l use
onl
y
04 FINANCIAL STATEMENTS
2017 FINANCIAL YEAR RESULTS 112
ongoing development of the Company’s projects; the possibility that required concessions may not be obtained, or may be obtained only on terms and conditions that are materially worse than anticipated; changes in government regulations, policies or legislation; fluctuations or decreases in commodity prices; the possibility that required permits or approvals may not be obtained; uncertainty in the estimation, economic viability, recoverability and processing of mineral resources; fluctuations or decreases in commodity prices general risks associated with the feasibility of the Company’s projects; risks associated with construction and development of the Olaroz project; unexpected capital or operating cost increases; risks associated with weather patterns and impact on production rate and the uncertainty of meeting anticipated program milestones at the Company’s projects; general risks associated with the operation of the borax plant; a decrease in the price for borax resulting from, among other things, decreased demand for borax or an increased supply of borax or substitutes.
The Company believes that the assumptions and expectations reflected in such forward-looking information are reasonable. Assumptions have been made regarding, among other things: the Company’s ability to carry on its exploration and development activities, the timely receipt of required approvals, the prices of lithium potash and borates, the ability of the Company to operate in a safe, efficient and effective manner and the ability of the Company to obtain financing as and when required and on reasonable terms. Readers are cautioned that the foregoing list is not exhaustive of all factors and assumptions which may have been used.
There can be no assurance that forward-looking information will prove to be accurate, as actual results and future events could differ materially from those anticipated in such information. Accordingly, readers should not place undue reliance on forward-looking information. The Company does not undertake to update any forward-looking information, except in accordance with applicable securities laws.
For
per
sona
l use
onl
y