Embed Size (px)
Citation preview
1
Orthopaedic Section of the APTA Grant Program
Final Report Form
Date: October 31, 2010
Name of Investigators: Biely SA, Silfies SP, Smith SS
Name of Grant: Validation of Clinical Observation of Aberrant Movement Patterns in Patients with Mechanical Low Back Pain
Award Period: __May 11, 2008_ to _August 31, 2010_ (Initial award date is the date that the award was made to your
institution)
The final report is due no later than 60 days after the end of the award date.
1. Briefly summarize major accomplishments of this project (2-4 pages) 2. Provide a one-paragraph summary of results or abstract suitable for posting on the Orthopaedic Section website.
(see attached) 3. Attach a list of your publications published or accepted during the past year, or currently being written. Send
reprints when available. List presentations made and abstracts accepted for presentation based on this work. Indicate with an asterisk (*) those publications supported by Orthopaedic Section funding. (see attached)
4. Provide a budget, using the original approved budget. Indicate total funds spent to date per major categories. If
there was > 25% deviation (greater or less spent) of use of funds for any of the budget category, please BRIEFLY indicate the rationale. (see attached)
5. Budget: please send out a final print-out from your institution indicating monies spent per major categories.
_________10/31/2010_____________ Your Signature Date Return to:
Tara Fredrickson, Executive Associate Orthopaedic Section, APTA, Inc.
2920 East Avenue South, Suite 200 LaCrosse, WI 54601-7202
2
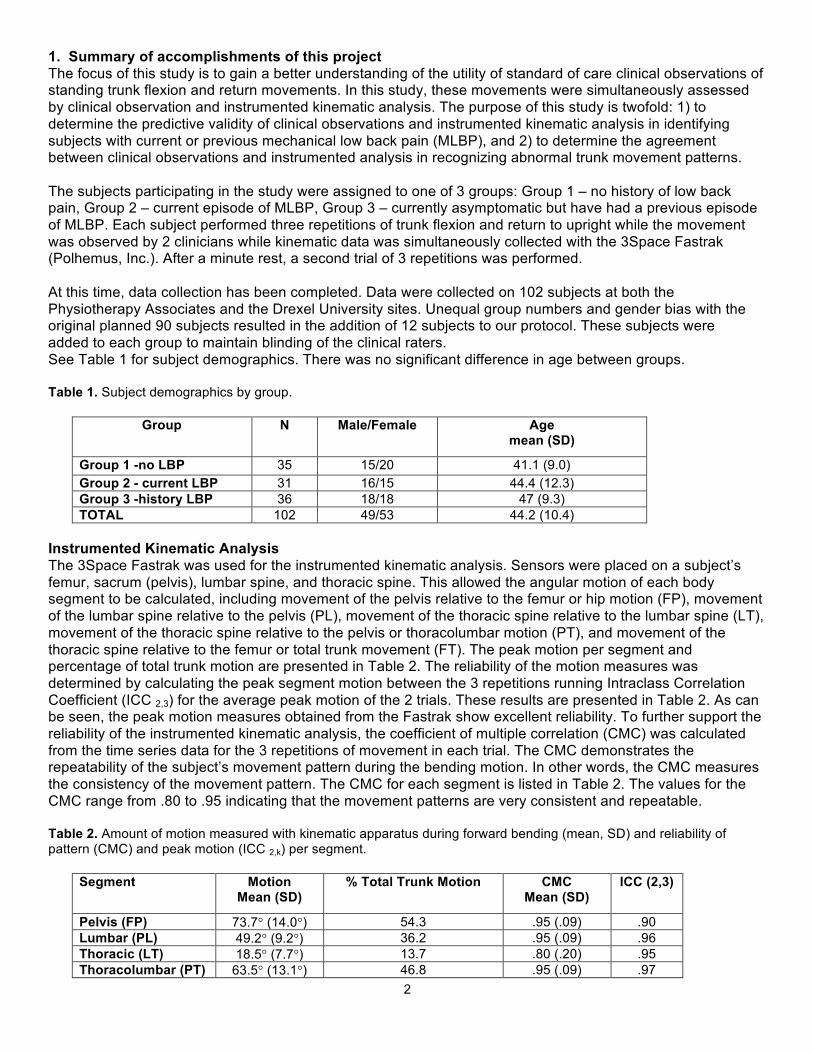
1. Summary of accomplishments of this project The focus of this study is to gain a better understanding of the utility of standard of care clinical observations of standing trunk flexion and return movements. In this study, these movements were simultaneously assessed by clinical observation and instrumented kinematic analysis. The purpose of this study is twofold: 1) to determine the predictive validity of clinical observations and instrumented kinematic analysis in identifying subjects with current or previous mechanical low back pain (MLBP), and 2) to determine the agreement between clinical observations and instrumented analysis in recognizing abnormal trunk movement patterns. The subjects participating in the study were assigned to one of 3 groups: Group 1 – no history of low back pain, Group 2 – current episode of MLBP, Group 3 – currently asymptomatic but have had a previous episode of MLBP. Each subject performed three repetitions of trunk flexion and return to upright while the movement was observed by 2 clinicians while kinematic data was simultaneously collected with the 3Space Fastrak (Polhemus, Inc.). After a minute rest, a second trial of 3 repetitions was performed. At this time, data collection has been completed. Data were collected on 102 subjects at both the Physiotherapy Associates and the Drexel University sites. Unequal group numbers and gender bias with the original planned 90 subjects resulted in the addition of 12 subjects to our protocol. These subjects were added to each group to maintain blinding of the clinical raters. See Table 1 for subject demographics. There was no significant difference in age between groups. Table 1. Subject demographics by group.
Group N Male/Female Age mean (SD)
Group 1 -no LBP 35 15/20 41.1 (9.0) Group 2 - current LBP 31 16/15 44.4 (12.3) Group 3 -history LBP 36 18/18 47 (9.3) TOTAL 102 49/53 44.2 (10.4)
Instrumented Kinematic Analysis The 3Space Fastrak was used for the instrumented kinematic analysis. Sensors were placed on a subject’s femur, sacrum (pelvis), lumbar spine, and thoracic spine. This allowed the angular motion of each body segment to be calculated, including movement of the pelvis relative to the femur or hip motion (FP), movement of the lumbar spine relative to the pelvis (PL), movement of the thoracic spine relative to the lumbar spine (LT), movement of the thoracic spine relative to the pelvis or thoracolumbar motion (PT), and movement of the thoracic spine relative to the femur or total trunk movement (FT). The peak motion per segment and percentage of total trunk motion are presented in Table 2. The reliability of the motion measures was determined by calculating the peak segment motion between the 3 repetitions running Intraclass Correlation Coefficient (ICC 2,3) for the average peak motion of the 2 trials. These results are presented in Table 2. As can be seen, the peak motion measures obtained from the Fastrak show excellent reliability. To further support the reliability of the instrumented kinematic analysis, the coefficient of multiple correlation (CMC) was calculated from the time series data for the 3 repetitions of movement in each trial. The CMC demonstrates the repeatability of the subject’s movement pattern during the bending motion. In other words, the CMC measures the consistency of the movement pattern. The CMC for each segment is listed in Table 2. The values for the CMC range from .80 to .95 indicating that the movement patterns are very consistent and repeatable. Table 2. Amount of motion measured with kinematic apparatus during forward bending (mean, SD) and reliability of pattern (CMC) and peak motion (ICC 2,k) per segment.
Segment Motion Mean (SD)
% Total Trunk Motion CMC Mean (SD)
ICC (2,3)
Pelvis (FP) 73.7° (14.0°) 54.3 .95 (.09) .90 Lumbar (PL) 49.2° (9.2°) 36.2 .95 (.09) .96 Thoracic (LT) 18.5° (7.7°) 13.7 .80 (.20) .95 Thoracolumbar (PT) 63.5° (13.1°) 46.8 .95 (.09) .97
3
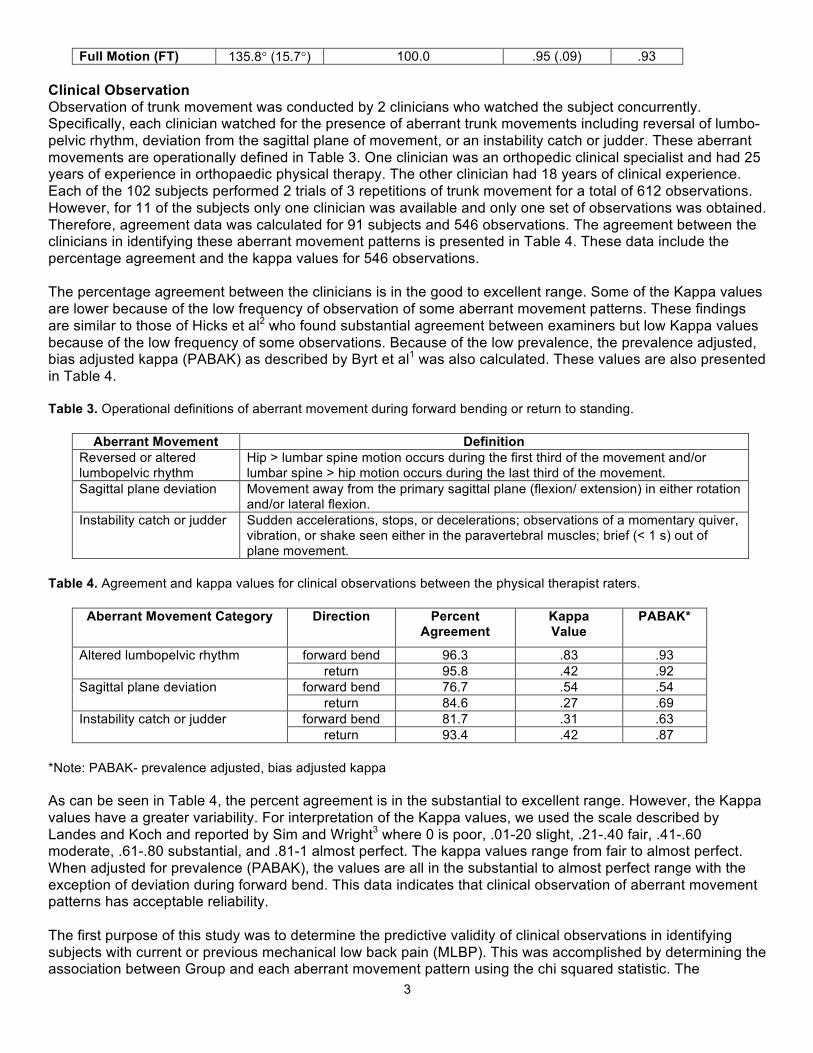
Full Motion (FT) 135.8° (15.7°) 100.0 .95 (.09) .93 Clinical Observation Observation of trunk movement was conducted by 2 clinicians who watched the subject concurrently. Specifically, each clinician watched for the presence of aberrant trunk movements including reversal of lumbo-pelvic rhythm, deviation from the sagittal plane of movement, or an instability catch or judder. These aberrant movements are operationally defined in Table 3. One clinician was an orthopedic clinical specialist and had 25 years of experience in orthopaedic physical therapy. The other clinician had 18 years of clinical experience. Each of the 102 subjects performed 2 trials of 3 repetitions of trunk movement for a total of 612 observations. However, for 11 of the subjects only one clinician was available and only one set of observations was obtained. Therefore, agreement data was calculated for 91 subjects and 546 observations. The agreement between the clinicians in identifying these aberrant movement patterns is presented in Table 4. These data include the percentage agreement and the kappa values for 546 observations. The percentage agreement between the clinicians is in the good to excellent range. Some of the Kappa values are lower because of the low frequency of observation of some aberrant movement patterns. These findings are similar to those of Hicks et al2 who found substantial agreement between examiners but low Kappa values because of the low frequency of some observations. Because of the low prevalence, the prevalence adjusted, bias adjusted kappa (PABAK) as described by Byrt et al1 was also calculated. These values are also presented in Table 4. Table 3. Operational definitions of aberrant movement during forward bending or return to standing.
Aberrant Movement Definition Reversed or altered lumbopelvic rhythm
Hip > lumbar spine motion occurs during the first third of the movement and/or lumbar spine > hip motion occurs during the last third of the movement.
Sagittal plane deviation Movement away from the primary sagittal plane (flexion/ extension) in either rotation and/or lateral flexion.
Instability catch or judder Sudden accelerations, stops, or decelerations; observations of a momentary quiver, vibration, or shake seen either in the paravertebral muscles; brief (< 1 s) out of plane movement.
Table 4. Agreement and kappa values for clinical observations between the physical therapist raters.
Aberrant Movement Category Direction Percent
Agreement Kappa Value
PABAK*
Altered lumbopelvic rhythm forward bend 96.3 .83 .93 return 95.8 .42 .92
Sagittal plane deviation forward bend 76.7 .54 .54 return 84.6 .27 .69
Instability catch or judder forward bend 81.7 .31 .63 return 93.4 .42 .87
*Note: PABAK- prevalence adjusted, bias adjusted kappa As can be seen in Table 4, the percent agreement is in the substantial to excellent range. However, the Kappa values have a greater variability. For interpretation of the Kappa values, we used the scale described by Landes and Koch and reported by Sim and Wright3 where 0 is poor, .01-20 slight, .21-.40 fair, .41-.60 moderate, .61-.80 substantial, and .81-1 almost perfect. The kappa values range from fair to almost perfect. When adjusted for prevalence (PABAK), the values are all in the substantial to almost perfect range with the exception of deviation during forward bend. This data indicates that clinical observation of aberrant movement patterns has acceptable reliability. The first purpose of this study was to determine the predictive validity of clinical observations in identifying subjects with current or previous mechanical low back pain (MLBP). This was accomplished by determining the association between Group and each aberrant movement pattern using the chi squared statistic. The
4
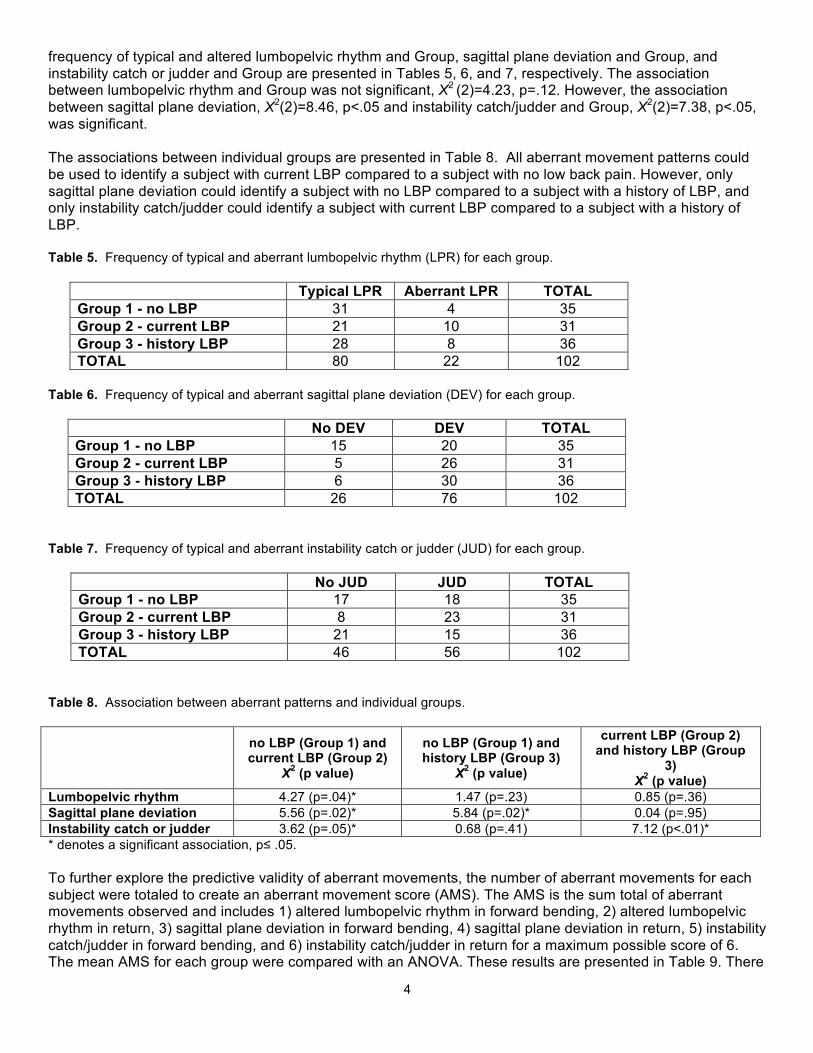
frequency of typical and altered lumbopelvic rhythm and Group, sagittal plane deviation and Group, and instability catch or judder and Group are presented in Tables 5, 6, and 7, respectively. The association between lumbopelvic rhythm and Group was not significant, Χ2 (2)=4.23, p=.12. However, the association between sagittal plane deviation, Χ2(2)=8.46, p<.05 and instability catch/judder and Group, Χ2(2)=7.38, p<.05, was significant. The associations between individual groups are presented in Table 8. All aberrant movement patterns could be used to identify a subject with current LBP compared to a subject with no low back pain. However, only sagittal plane deviation could identify a subject with no LBP compared to a subject with a history of LBP, and only instability catch/judder could identify a subject with current LBP compared to a subject with a history of LBP. Table 5. Frequency of typical and aberrant lumbopelvic rhythm (LPR) for each group.
Typical LPR Aberrant LPR TOTAL Group 1 - no LBP 31 4 35 Group 2 - current LBP 21 10 31 Group 3 - history LBP 28 8 36 TOTAL 80 22 102
Table 6. Frequency of typical and aberrant sagittal plane deviation (DEV) for each group.
No DEV DEV TOTAL Group 1 - no LBP 15 20 35 Group 2 - current LBP 5 26 31 Group 3 - history LBP 6 30 36 TOTAL 26 76 102
Table 7. Frequency of typical and aberrant instability catch or judder (JUD) for each group.
No JUD JUD TOTAL Group 1 - no LBP 17 18 35 Group 2 - current LBP 8 23 31 Group 3 - history LBP 21 15 36 TOTAL 46 56 102
Table 8. Association between aberrant patterns and individual groups. no LBP (Group 1) and
current LBP (Group 2) X2 (p value)
no LBP (Group 1) and history LBP (Group 3)
X2 (p value)
current LBP (Group 2) and history LBP (Group
3) X2 (p value)
Lumbopelvic rhythm 4.27 (p=.04)* 1.47 (p=.23) 0.85 (p=.36) Sagittal plane deviation 5.56 (p=.02)* 5.84 (p=.02)* 0.04 (p=.95) Instability catch or judder 3.62 (p=.05)* 0.68 (p=.41) 7.12 (p<.01)* * denotes a significant association, p≤ .05. To further explore the predictive validity of aberrant movements, the number of aberrant movements for each subject were totaled to create an aberrant movement score (AMS). The AMS is the sum total of aberrant movements observed and includes 1) altered lumbopelvic rhythm in forward bending, 2) altered lumbopelvic rhythm in return, 3) sagittal plane deviation in forward bending, 4) sagittal plane deviation in return, 5) instability catch/judder in forward bending, and 6) instability catch/judder in return for a maximum possible score of 6. The mean AMS for each group were compared with an ANOVA. These results are presented in Table 9. There
5
was a significant difference in AMS between the Groups, F(2)=15.1, p<.01. Post hoc analysis showed a significant difference between the current LBP group (Group 2) and both the no LBP group (Group 1) and the history of LBP group (Group 3). However, no significant difference existed between the no LBP group (Group 1) and the history of LBP group (Group 3). Table 9. Mean (standard deviation) of the aberrant movement score (AMS) for each group.
AMS Group 1 - no LBP 1.4 (1.0) Group 2 - current LBP 3.0 (1.4) Group 3 - history LBP 1.9 (1.1) TOTAL 2.1 (1.3)
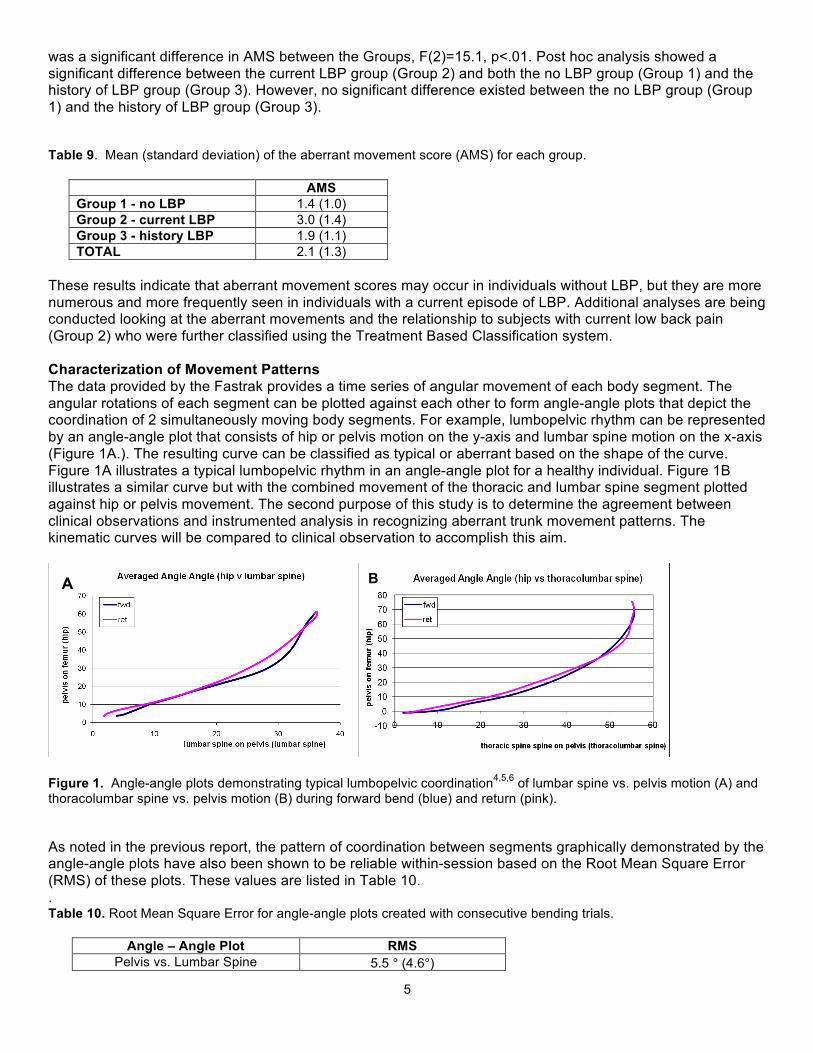
These results indicate that aberrant movement scores may occur in individuals without LBP, but they are more numerous and more frequently seen in individuals with a current episode of LBP. Additional analyses are being conducted looking at the aberrant movements and the relationship to subjects with current low back pain (Group 2) who were further classified using the Treatment Based Classification system. Characterization of Movement Patterns The data provided by the Fastrak provides a time series of angular movement of each body segment. The angular rotations of each segment can be plotted against each other to form angle-angle plots that depict the coordination of 2 simultaneously moving body segments. For example, lumbopelvic rhythm can be represented by an angle-angle plot that consists of hip or pelvis motion on the y-axis and lumbar spine motion on the x-axis (Figure 1A.). The resulting curve can be classified as typical or aberrant based on the shape of the curve. Figure 1A illustrates a typical lumbopelvic rhythm in an angle-angle plot for a healthy individual. Figure 1B illustrates a similar curve but with the combined movement of the thoracic and lumbar spine segment plotted against hip or pelvis movement. The second purpose of this study is to determine the agreement between clinical observations and instrumented analysis in recognizing aberrant trunk movement patterns. The kinematic curves will be compared to clinical observation to accomplish this aim.
Figure 1. Angle-angle plots demonstrating typical lumbopelvic coordination4,5,6 of lumbar spine vs. pelvis motion (A) and thoracolumbar spine vs. pelvis motion (B) during forward bend (blue) and return (pink). As noted in the previous report, the pattern of coordination between segments graphically demonstrated by the angle-angle plots have also been shown to be reliable within-session based on the Root Mean Square Error (RMS) of these plots. These values are listed in Table 10. . Table 10. Root Mean Square Error for angle-angle plots created with consecutive bending trials.
Angle – Angle Plot RMS Pelvis vs. Lumbar Spine 5.5 ° (4.6°)
A B
6
Lumbar vs. Thoracic Spine 3.7° (3.5°) Pelvis vs. Thoracolumbar Spine 6.1° (5.9°)
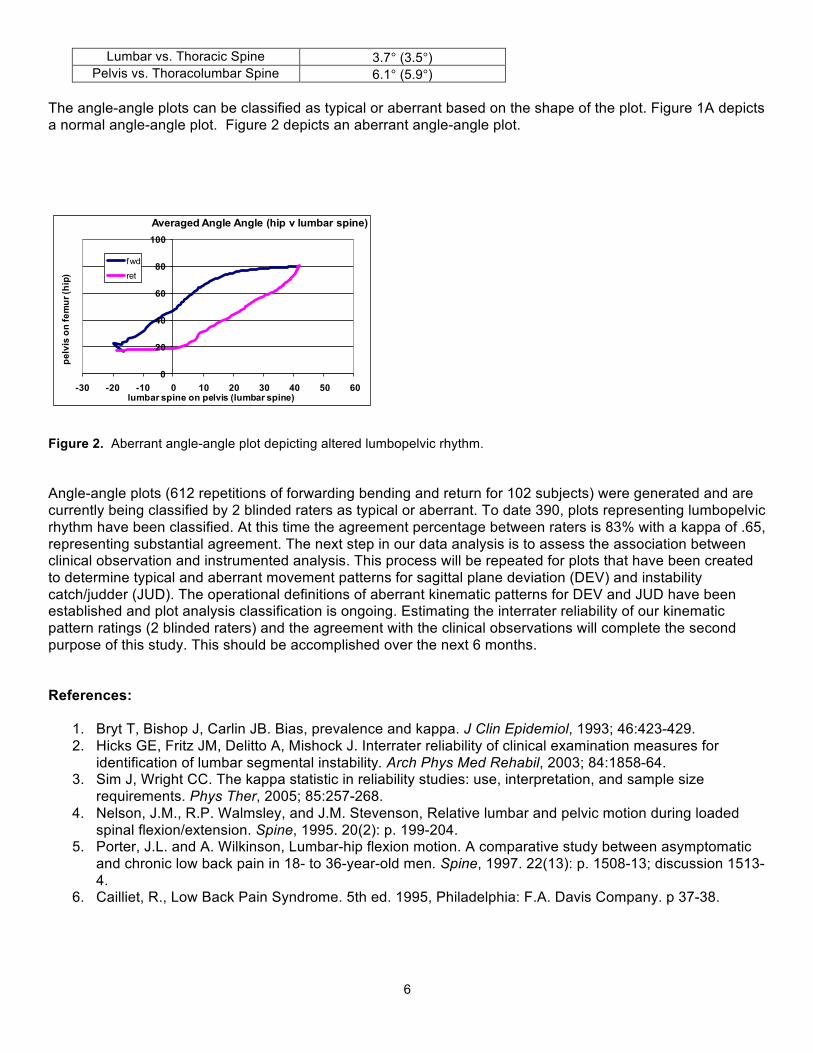
The angle-angle plots can be classified as typical or aberrant based on the shape of the plot. Figure 1A depicts a normal angle-angle plot. Figure 2 depicts an aberrant angle-angle plot. Figure 2. Aberrant angle-angle plot depicting altered lumbopelvic rhythm. Angle-angle plots (612 repetitions of forwarding bending and return for 102 subjects) were generated and are currently being classified by 2 blinded raters as typical or aberrant. To date 390, plots representing lumbopelvic rhythm have been classified. At this time the agreement percentage between raters is 83% with a kappa of .65, representing substantial agreement. The next step in our data analysis is to assess the association between clinical observation and instrumented analysis. This process will be repeated for plots that have been created to determine typical and aberrant movement patterns for sagittal plane deviation (DEV) and instability catch/judder (JUD). The operational definitions of aberrant kinematic patterns for DEV and JUD have been established and plot analysis classification is ongoing. Estimating the interrater reliability of our kinematic pattern ratings (2 blinded raters) and the agreement with the clinical observations will complete the second purpose of this study. This should be accomplished over the next 6 months. References:
1. Bryt T, Bishop J, Carlin JB. Bias, prevalence and kappa. J Clin Epidemiol, 1993; 46:423-429. 2. Hicks GE, Fritz JM, Delitto A, Mishock J. Interrater reliability of clinical examination measures for
identification of lumbar segmental instability. Arch Phys Med Rehabil, 2003; 84:1858-64. 3. Sim J, Wright CC. The kappa statistic in reliability studies: use, interpretation, and sample size
requirements. Phys Ther, 2005; 85:257-268. 4. Nelson, J.M., R.P. Walmsley, and J.M. Stevenson, Relative lumbar and pelvic motion during loaded
spinal flexion/extension. Spine, 1995. 20(2): p. 199-204. 5. Porter, J.L. and A. Wilkinson, Lumbar-hip flexion motion. A comparative study between asymptomatic
and chronic low back pain in 18- to 36-year-old men. Spine, 1997. 22(13): p. 1508-13; discussion 1513-4.
6. Cailliet, R., Low Back Pain Syndrome. 5th ed. 1995, Philadelphia: F.A. Davis Company. p 37-38.
0
20
40
60
80
100
-30 -20 -10 0 10 20 30 40 50 60
pelv
is o
n fe
mur
(hip
)
lumbar spine on pelvis (lumbar spine)
Averaged Angle Angle (hip v lumbar spine)
fwd
ret
7
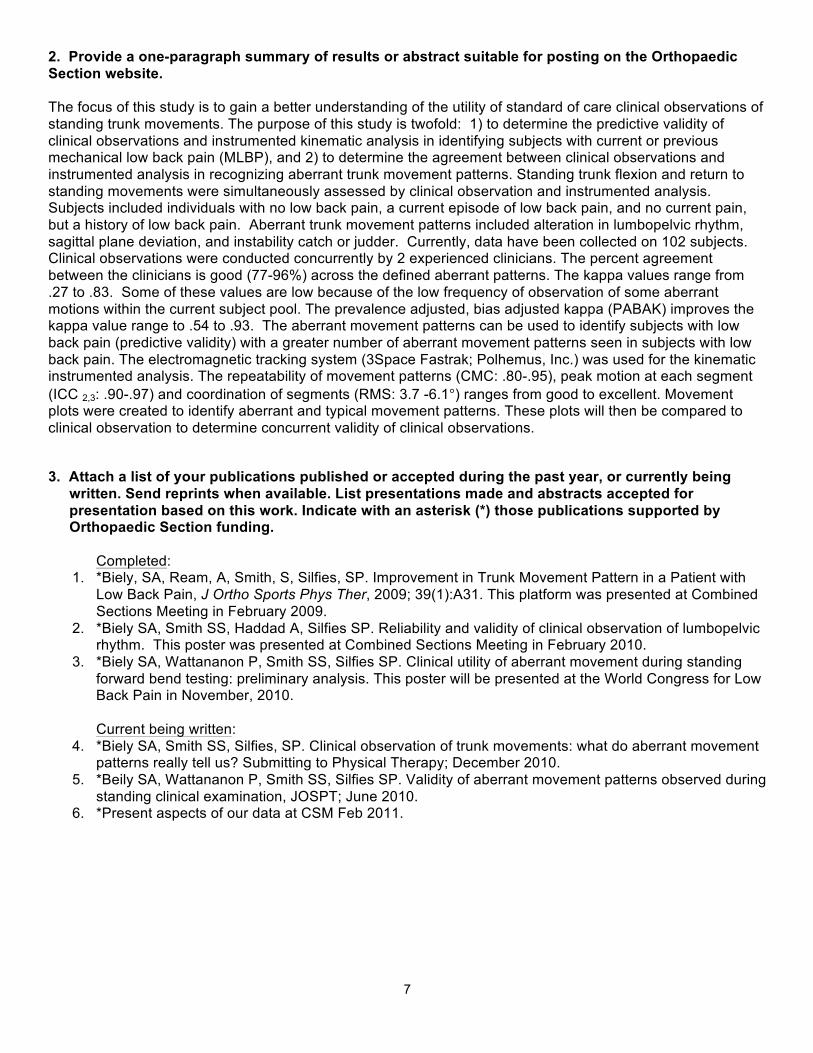
2. Provide a one-paragraph summary of results or abstract suitable for posting on the Orthopaedic Section website. The focus of this study is to gain a better understanding of the utility of standard of care clinical observations of standing trunk movements. The purpose of this study is twofold: 1) to determine the predictive validity of clinical observations and instrumented kinematic analysis in identifying subjects with current or previous mechanical low back pain (MLBP), and 2) to determine the agreement between clinical observations and instrumented analysis in recognizing aberrant trunk movement patterns. Standing trunk flexion and return to standing movements were simultaneously assessed by clinical observation and instrumented analysis. Subjects included individuals with no low back pain, a current episode of low back pain, and no current pain, but a history of low back pain. Aberrant trunk movement patterns included alteration in lumbopelvic rhythm, sagittal plane deviation, and instability catch or judder. Currently, data have been collected on 102 subjects. Clinical observations were conducted concurrently by 2 experienced clinicians. The percent agreement between the clinicians is good (77-96%) across the defined aberrant patterns. The kappa values range from .27 to .83. Some of these values are low because of the low frequency of observation of some aberrant motions within the current subject pool. The prevalence adjusted, bias adjusted kappa (PABAK) improves the kappa value range to .54 to .93. The aberrant movement patterns can be used to identify subjects with low back pain (predictive validity) with a greater number of aberrant movement patterns seen in subjects with low back pain. The electromagnetic tracking system (3Space Fastrak; Polhemus, Inc.) was used for the kinematic instrumented analysis. The repeatability of movement patterns (CMC: .80-.95), peak motion at each segment (ICC 2,3: .90-.97) and coordination of segments (RMS: 3.7 -6.1°) ranges from good to excellent. Movement plots were created to identify aberrant and typical movement patterns. These plots will then be compared to clinical observation to determine concurrent validity of clinical observations. 3. Attach a list of your publications published or accepted during the past year, or currently being
written. Send reprints when available. List presentations made and abstracts accepted for presentation based on this work. Indicate with an asterisk (*) those publications supported by Orthopaedic Section funding.
Completed:
1. *Biely, SA, Ream, A, Smith, S, Silfies, SP. Improvement in Trunk Movement Pattern in a Patient with Low Back Pain, J Ortho Sports Phys Ther, 2009; 39(1):A31. This platform was presented at Combined Sections Meeting in February 2009.
2. *Biely SA, Smith SS, Haddad A, Silfies SP. Reliability and validity of clinical observation of lumbopelvic rhythm. This poster was presented at Combined Sections Meeting in February 2010.
3. *Biely SA, Wattananon P, Smith SS, Silfies SP. Clinical utility of aberrant movement during standing forward bend testing: preliminary analysis. This poster will be presented at the World Congress for Low Back Pain in November, 2010. Current being written:
4. *Biely SA, Smith SS, Silfies, SP. Clinical observation of trunk movements: what do aberrant movement patterns really tell us? Submitting to Physical Therapy; December 2010.
5. *Beily SA, Wattananon P, Smith SS, Silfies SP. Validity of aberrant movement patterns observed during standing clinical examination, JOSPT; June 2010.
6. *Present aspects of our data at CSM Feb 2011.
8
4. Budget Report Below is the final budget spreadsheet as completed in granting agency format with expenditures from June 1, 2008 through to the no-cost extension of date of August 31, 2010. DREXEL UNIVERSITY TITLE: Validation of Clinical Observation of Aberrant Movement Patterns in Patients with Mechanical LBP SPONSOR: Orthopedic Section, APTA Internal Performance Period (15 months):
Contact Co-PI: Sheri P. Silf ies
June 1, 2008 to August 31, 2009; No-cost Extension September 1, 2009- August 31, 2010
PROPOSAL BUDGET: Yearly % Increase in Salaries 5% Fringe Benefit Rate 26.8% 8.9% part time Indirect Cost (IC) Rate 0.0%
Year
01(12m) Year 02
(3m) Total
(as budgeted)
(Expenses)
Remaining
Co-PI (Scott Biely ): 0 0 0 0
0
Contact Co-PI (Sheri Silfies ) 2,068 1,661 3,729 3725.92 3.08 Co-PI (Susan Smith ) 776 615 1,391 1387.86 3.14 Subtotal 2,844 2,276 5,120 5113.78 6.22 F/T Benefits @ 26.8% 762 610 1,372 1477.85 -105.85 Part Time Staff support 0 0 0 0 0 P/T Benefits @ 8.9% 0 0 0 0 0 Research Assistants (Salary): 0 Haddad & Wattananon 9,440 2,360 11,800 6874.00 4926.00 Total Personnel 13,046 5,246 18,292* 13,465.63 4826.37
Consultants #1 (clinical data manager) 0 0
*Transfer from Personnel line to Consultants 4425.00 -4425.00
Consultant #2 (clinical observations) 0 0
**Partial Transfer from Renumberation 980.00 -980.00
Other Expenses 0 0 0 84.26 -84.26 Telephone/Communications 0 0 0 0 0 Travel (Domestic) 737 0 737 694.88 42.12 Travel (Foreign) 0 0 0 0 0 Renumberation (Subjects/Clinicians) 3,240 810 4,050** 3400.00 650.00 Purchased Services 0 0 0 0 0 Subcontract < $25K 0 0 0 0 0 Equipment < $5K + Lab Supplies 1,296 0 1,296 1285.40 10.60 Modified Total Direct Cost (MTDC) 18,319 6,056 24,375 24335.17 39.83 Indirect @ 0% 0 0 0 0 0 Research Assistants Tuition: 0 0 0 0 0 Equipment > $5K 0 0 0 0 0
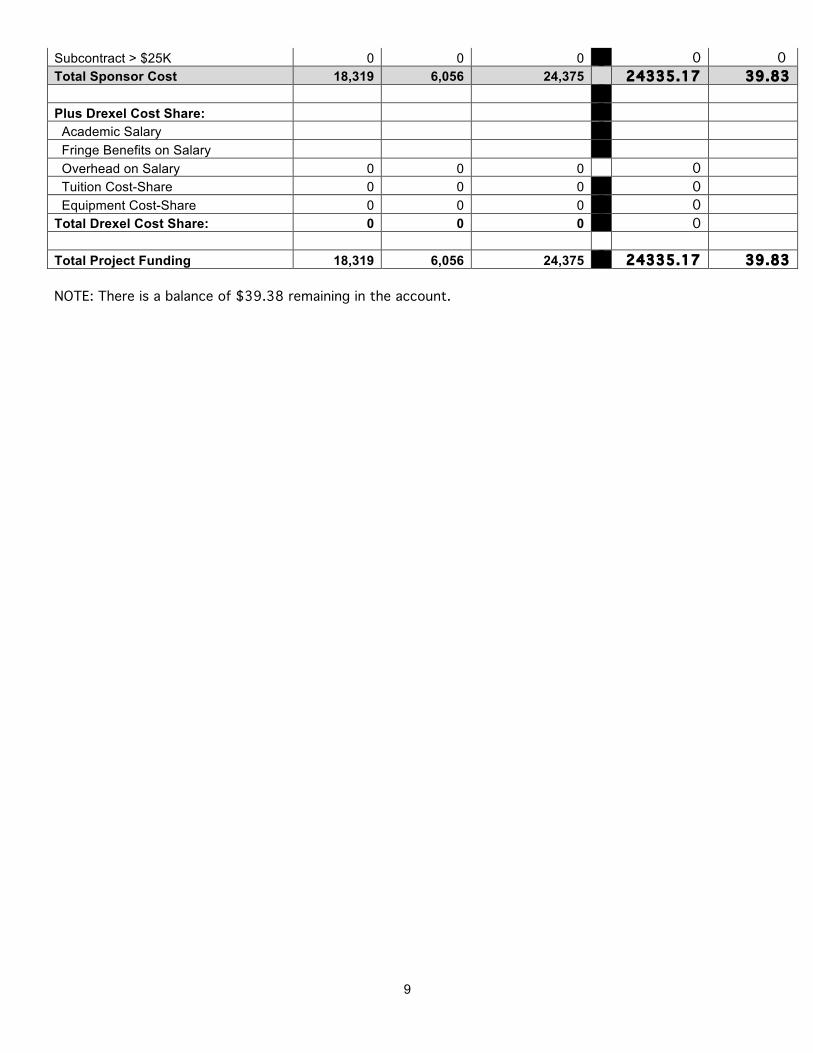
9
Subcontract > $25K 0 0 0 0 0 Total Sponsor Cost 18,319 6,056 24,375 24335.17 39.83 Plus Drexel Cost Share: Academic Salary Fringe Benefits on Salary Overhead on Salary 0 0 0 0 Tuition Cost-Share 0 0 0 0 Equipment Cost-Share 0 0 0 0 Total Drexel Cost Share: 0 0 0 0 Total Project Funding 18,319 6,056 24,375 24335.17 39.83 NOTE: There is a balance of $39.38 remaining in the account.