Embed Size (px)
Citation preview

BOŚ S.A. Group 1H 2016

2
Framework Development Strategy for years 2016 – 2020
*Values before bank tax
ROE
Net Profit
C/I
ca. 0.7%
more than 7%
more than PLN 140 m
ca. 51%
ROA
Bank’s profitability above market average
Bank as an efficient channel for transfers of funds for environmental investment projects and sustainable development in Poland
Bank’s business targets for 2020*
Bank’s main strategic goals
The Bank has developed a Framework Strategy for years 2016-2020, while maintaining consistency with the Rehabilitaion Programme in terms of objectives, directions and planned objectives.
The main goal of BOŚ SA for the years 2016-2020 is an increase of the Bank’s profitability to a level higher than the average profitability in the banking sector.

PU\Warsaw\Bos\C20120377

4
The issue of new shares
Shareholder after the issue of series U As at 12.07.2016
On April 27, 2016 the Extraordinary General Meeting passed a resolution to: increase the share capital through the issue of series U shares in a private placement of depriving existing shareholders pre-emptive rights of all shares of series U, dematerialization and application for admission and introduction of series U shares and rights the series U shares to trading on the regulated market operated by the Warsaw Stock Exchange and amendments to the Statute of the Bank.
The issue of new shares was successful. The value of the issue of new shares amounted to PLN 400 m. The capital increase enables the Bank to further organic growth and the generation of funds for the
implementation of the mission in terms of finance green investments and sustainable development.
On July 12, 2016 The court registered the increase of the share capital of the Bank by PLN 400 m.
52,41%
9,54%
6,80%
31,25%
The National Fund for Environmental Protection and Water Management (NFEP&WM)Fund of Polish Enterprises of a Closed-End Fund of Non-Public AssetsDirector General of State Forest Management AuthorityOthers

Key financial data of BOŚ S.A. Group
5
2Q, after three quarters in a row with net loss, ended with a positive net result.
The first effects of corrective actions of the Bank's Strategy for years 2016-2020 are easily recognizable.
14,01%
12,70% 12,71%12,10% 12,28% 12,37%
10,58%9,58% 9,65%
9,13% 9,12% 9,24%
31.03.2015 30.06.2015 30.09.2015 31.12.2015 31.03.2016 30.06.2016
Group BOŚ CAR and Tier1
CAR Tier1
14,3 14,316,0 17,5
31.12.2015 30.06.2016
Group loans and deposits (bn PLN)
Loans Deposits
20,922,1
31.12.2015 30.06.2016
Group assets (bn PLN)
27,7%
29,6%
32,2%33,10% 33,9% 33,5%
31.03.2015 30.06.2015 30.09.2015 31.12.2015 31.03.2016 30.06.2016
Eco-loans in total loans balance
BOŚ S.A. Group (thou PLN) IV 2015 IQ 2016 IIQ 2016
Change
IIQ 2016 vs.
IVQ 2015
Change
IIQ 2016 vs.
IQ 2016
Net interest income 73 677 70 677 67 716 -8,1% -4,2%
Net commission & fee income 27 373 26 607 28 808 5,2% 8,3%
Net operating income 140 231 115 205 121 681 -13,2% 5,6%
Gross profit/loss (54 084) (12 656) (626) x x
Net profit/loss (46 373) (12 916) 1 170 x x

95 93 92 90
2014 2015 1Q 2016 1H 2016
Headquarters
11 Corporate canters 90 Branch offices
Dom Maklerski Banku Ochrony Środowiska S.A.
BOS Finance AB
BOŚ Eko Profit S.A
100%
100%
100%
100%
BOŚ Invest Management Sp. z o.o.
MS Wind Sp. z o.o.
100%
BOŚ Nieruchomości
Sp. z o.o. (in liquidation)
BOŚ Capital Sp. z o.o.
100%
100%
BOŚ Ekosystem sp. z o.o.
Bank Ochrony Środowiska S.A.
100%
6
1840 1 775 1 796 1 758
31.12.2014 31.12.2015 30.06.2015 30.06.2016
Key information about BOŚ S.A. Group BOŚ S.A. Group Structure
Number of branches Number of FTEs

226
255235
264
2014 2015 1H 2015 1H 2016
119124
120
128
2014 2015 1H 2015 1H 2016
232246
236254
2014 2015 1H 2015 1H 2016
239251 242
260
2014 2015 1H 2015 1H 2016
+18 thou.
+18 thou. +29 thou.
7
+8 thou.
Customers of the Bank
Number of customers using electronic channels
Retail customers Number of accounts*
* Including savings accounts
Source: Bank, numbers in thousands
Number of customers

1 036
935 464466
71,6%
88,3%
83,5% 81,2%
50%
60%
70%
80%
90%
100%
0
200
400
600
800
1 000
1 200
2014 2015 1H 2015 1H 2016
Total income C/I (right axis)
1 548
1 469
1 520
1 443
4,3%
-3,4%
0,3%
-1,6%
-4%
-2%
0%
2%
4%
6%
1 380
1 400
1 420
1 440
1 460
1 480
1 500
1 520
1 540
1 560
2014 2015 1H 2015 1H 2016
Capital ROE (right axis)
19,7
20,9
19,9
21,10,3%
-0,3%
0,0%-0,1%
-0,5%
0,0%
0,5%
1,0%
1,5%
18
19
20
21
22
2014 2015 1H 2015 1H 2016
Total assets ROA (right axis)
289261
121 138
1,5% 1,3%
1,2%1,3%
0,0%
1,0%
2,0%
0
50
100
150
200
250
300
350
2014 2015 1H 2015 1H 2016
Net interest income Net interest margin (right axis)
8
Ratios of BOŚ S.A. Group
Net interest margin vs net interest income (m PLN) ROA vs total assets (bn PLN)
ROE vs capital (m PLN) C/I vs total income (m PLN)

120,9138,4
1H 2015 1H 2016
55,4 55,4
1H 2015 1H 20169
Net commission & fee income (m PLN) Net interest income (m PLN)
Financial results of BOŚ S.A. Group for 1H 2016
The increase in net interest income by 14.5%.
Lower administrative costs by 3.0%, ie. PLN 5.9 m.
Redemption of own Eurobonds in the amount of EUR 250 m (fixed
interest rate of 6%) in May 2016. The buyout will significantly reduce the funding costs of the Bank and will have a positive impact on the results of the next quarters.
thou PLN
Net interest income 138 393 120 856 14,5%
Net commission & fee income 55 415 55 362 0,1%
Dividend income 5 174 5 137 0,7%
Net operating income 20 809 -543 x
Result on investment securities 4 392 10 376 -57,7%
Net income on hedge accounting 1 128 1 386 -18,6%
Foreign exchange result 11 575 35 127 -67,0%
Operating profit 236 886 227 701 4,0%
General administrative expenses -192 017 -197 887 -3,0%
Net impairment loses -57 794 -35 836 61,3%
Gross profit/loss -13 282 3 369 x
Net profit/loss -11 746 2 650 x
1H 2015
Change
1Q 2016 vs.
1Q 2015
1H 2016Item

109 119 115 122
1Q 2015 2Q 2015 1Q 2016 2Q 2016
499 533486
2013 2014 2015
+13 m
10
55%
24%
21%
61%23%
16%
55%24%
21%
Result on banking activities of BOŚ S.A. Group (m PLN) in 2013-2015
Result on banking activities of BOŚ S.A. Group (m PLN)
Result on banking activities of BOŚ S.A. Group
51%
24%
25%
Net interest income Net fee and commission income Others

11
Structure of the balance sheet as at 30.06.2016:
Balance sheet of BOŚ S.A. Group
19 672 19 57219 884 19 776
20 922
22 069
21 147
Total assets (m PLN)
72,6%
1,8%
12,7%
5,3%7,6%
LiabilitiesAmounts due to customers
Liabilities under banking securitiesissued
Amounts due to other banks
Other liabilities
Equity
66%
25%
2%
3%
4%
Assets Loans and advances to
customers
Securities
Cash and deposits with theCentral Bank
Deposits with other banks,
loans and advances toother banks
Cash and other assets
Loans and advances to customers 13 206 963 14 343 558 14 287 684 -0,4% 8,2%
Derivative financial instruments 4 993 558 5 000 538 5 054 491 1,1% 1,2%
Cash and deposits with the Central Bank 440 799 614 897 801 248 30,3% 81,8%
Deposits with other banks, loans and
advances to other banks517 609 158 720 249 971 57,5% -51,7%
Other assets 725 194 804 059 753 483 -6,3% 3,9%
Total assets 19 884 123 20 921 772 21 146 877 1,1% 6,4%
Amounts due to customers 14 433 785 15 968 163 17 527 312 9,8% 21,4%
Amounts due to other banks 365 078 216 409 158 014 -27,0% -56,7%
Liabilities under banking securities
issued2 519 632 2 318 189 1 041 147 -55,1% -58,7%
Other liabilities 1 045 389 950 455 977 059 2,8% -6,5%
Total equity 1 520 239 1 468 556 1 443 345 -1,7% -5,1%
Total liabilities 19 884 123 20 921 772 21 146 877 1,1% 6,4%
Credits / Deposits 91,5% 89,8% 81,5% -8,3 p.p. -10,0 p.p.
31.12.2015 30.06.16
Change
30.06.2016
vs.
31.12.2015
Change
31.06.2016
vs.
30.06.2015
Item 30.06.2015

Liabilities per division
Subordinated debt (0.6 bn PLN)
Corporate and public finance (5.2 bn PLN)
BOŚ S.A. Group
Public finance (0.9 bn PLN)
Retail clients (10.8 bn PLN)
Loans from financial institutions and ecolological funds (1.5 bn PLN)
Funds intended for lending, eco funds and other clients (0.1 bn PLN)
Corporate customers (4.3 bn PLN)
Amounts due to customers (17.5 bn PLN)
Debt securities issued (1.0 bn PLN)
Customers Division Category
Loans and advances from international financial institutions (1.4 bn PLN)
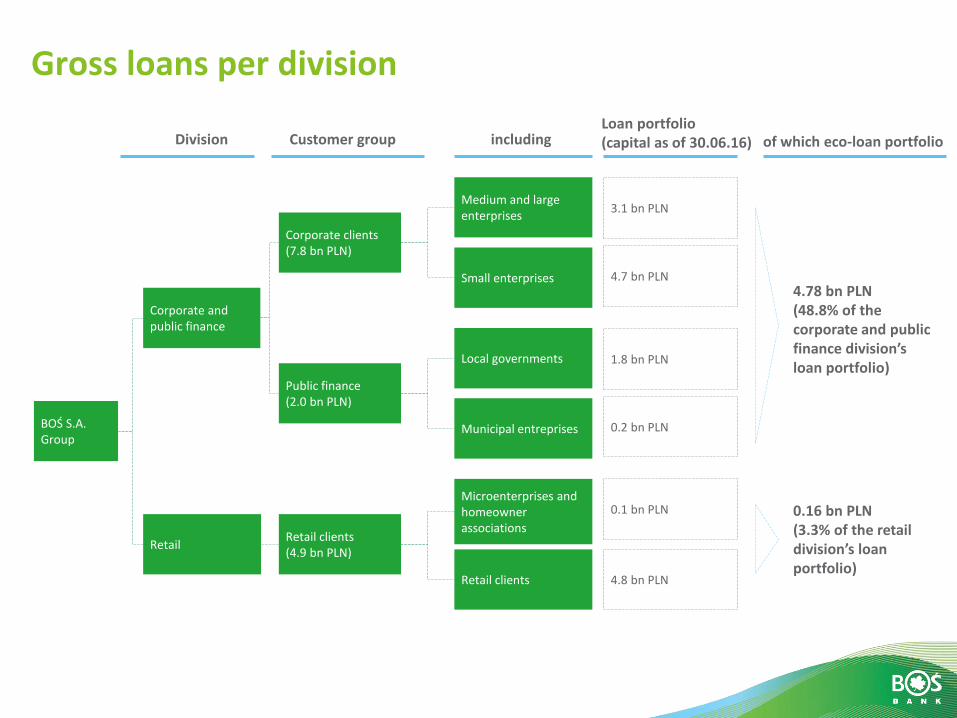
Gross loans per division
including Division of which eco-loan portfolio Loan portfolio (capital as of 30.06.16)
Corporate and public finance
Medium and large enterprises
Small enterprises
Microenterprises and homeowner associations
Retail clients
BOŚ S.A. Group
Local governments
Municipal entreprises
Retail
3.1 bn PLN
4.7 bn PLN
0.1 bn PLN
4.8 bn PLN
1.8 bn PLN
0.2 bn PLN
4.78 bn PLN (48.8% of the corporate and public finance division’s loan portfolio)
0.16 bn PLN (3.3% of the retail division’s loan portfolio)
Public finance (2.0 bn PLN)
Retail clients (4.9 bn PLN)
Corporate clients (7.8 bn PLN)
Customer group

4,04,9 4,9
1H 2015 2015 1H 2016
Constant increase of eco-loans share in total loans. Bank is focused on financing projects in the following areas: energy efficiency and renewable
energy sources.
+23%
14
Eco-loans
Balance of eco-loans (bn PLN)
3%14%
83%
Retail
Public finance
Corporate
31.12.2015 30.06.2016
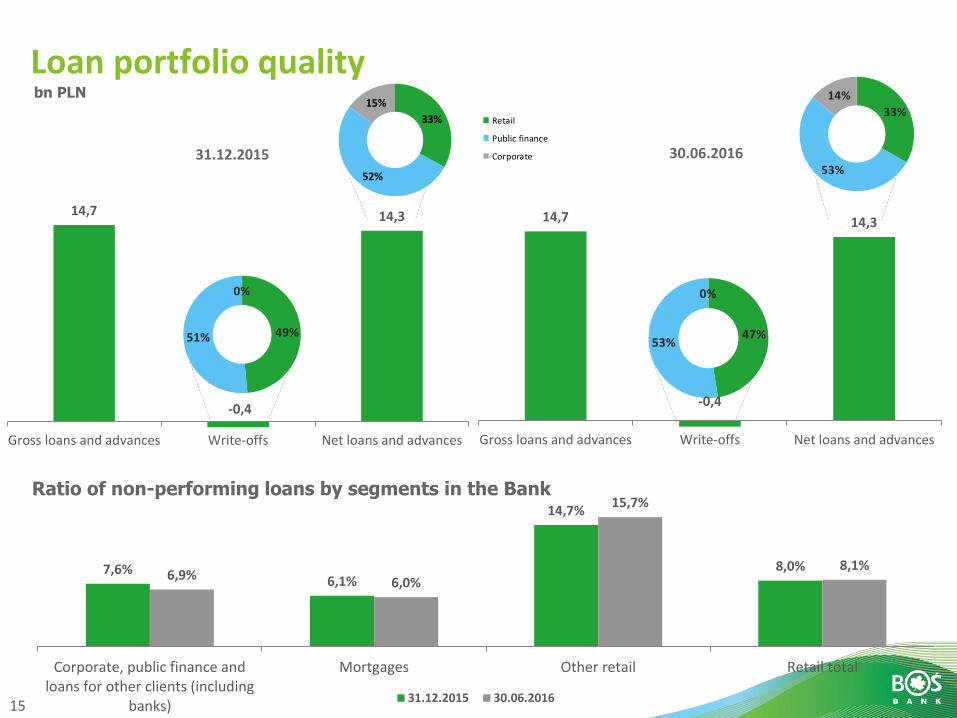
15
49%51%
0%
33%
53%
14%
47%53%
0%
Loan portfolio quality
Ratio of non-performing loans by segments in the Bank
bn PLN
33%
52%
15%
Retail
Public finance
Corporate
14,7
-0,4
14,3
Gross loans and advances Write-offs Net loans and advances
14,7
-0,4
14,3
Gross loans and advances Write-offs Net loans and advances
7,6% 6,1%
14,7%
8,0% 6,9%
6,0%
15,7%
8,1%
Corporate, public finance andloans for other clients (including
banks)
Mortgages Other retail Retail total
31.12.2015 30.06.2016

3,60%
3,89%
4,29%
2,0%
2,5%
3,0%
3,5%
4,0%
4,5%
I H 2015 2015 I H 2016
83,4 83,8
86,4
75,0
77,0
79,0
81,0
83,0
85,0
87,0
I H 2015 2015 I H 2016
16
+3,0 tys.
+0,69%
Brokerage – DM BOŚ
Market shares (transactions during trading session)
Number of accounts (in thou)
Source: DM BOŚ
Source:The Warsaw Stock Exchange
Steady increase in the number of accounts resulting in a steady increase in the customer base.
On the stock market of the WSE, which is the dominant area of activity, DM BOŚ is steadily improving its market position.

Important events for BOŚ S.A. Group in 1H 2016
The Bank has developed a Framework Strategy for BOŚ activities for the years 2016-2020, while maintaining consistency with the Rehabilitaion Programme in terms of objectives, directions and planned to achieve the objectives.
The balance of eco loans on June 30 2016 amounted to PLN 4.9 bn, which accounted for 33.5% of the balance of total loans in the Bank (at the end of 2015 the share was 33.1%).
BOŚ supported the campaign "Millions of Poles" - the draft prepared by experts from the
comparison of financial Comperia.pl, Institute for Market Research and Social Sciences and the Association of Polish Banks.
Five initiatives of the Bank and the Foundation BOŚ of 2015 were in the report prepared by the Responsible Business Forum. Highlighted good practices included: Bank's participation in the Program Polish Guarantee of Origin Energy, BOŚ EKObiegaton, #BrudnoTu, as well as two long-standing practices: the campaign "Bet on the Sun" and "Environmental Report", which presents the environmental activities of the Bank.
Strengthening the position on the WSE market - increase the share of DM BOS to the level of 4.29% in the first half of 2016, which represents an increase in market share of over 19% y / y.
Maintaining the leading position in the futures market and the second largest market NewConnect in terms of the size of turnover.
The role of offering the issuance of shares of BOŚ SA, i2 Development, Qubic Games, Tower Investments and iFun4all. The total value of bids was carried out PLN 450.4 m.
17

A number of 1st places for deposits, credits and BOŚ accounts in rankings prepared, among others, by TaxCare, TotalMoney.pl, the Banker, and the Republic of Expander.
Team of economists from BOŚ took first place in the competition organized by „Gazeta Giełdy Parkiet" (category:the best forecast of macroeconomic indicators and the market after the first quarter of 2016).
Bank among TOP 5 banks where you can buy mutual funds.
Special Award of the Warsaw Stock Exchange and the title of Broker of the Year 2015 - in addition DM BOS received the award for the largest number of companies listed on the main stock market in 2015, including the largest number of companies that have passed the NewConnect market, the largest share in the session trading in shares on the NewConnect market ( excluding market maker transactions) in 2015. and the biggest increase in the number of subscribers to data from the Power Exchange.
Statuette Platinum Megawatt 2015 - TGE prize for the most active on the gas market among brokerage houses in 2015.
„Golden Turnover” Statuette in 2015 - the award granted by IRGiT for contribution to the launch of Clearing and Settlement.
BOSSAFX the most appreciated forex platform assessed by the readers of Gazeta Giełdy Parkiet.
Financial Order by Home & Market for application bossaMobile+ in the category of an Investment Product.
Award from „Gazeta Finansowa” - Title Financial Brand of the Year in the category of Brokerage for maintaining for years the leading position in the investment market and deploy innovative products to facilitate investment.
18
Awards for BOŚ S.A. Group in 1H 2016

Appendices

20
Macroeconomic background 1/2
GDP, consumption and investment dynamics Inflation
Employment and wages dynamics Unemployment rate
-10
-5
0
5
10
15
20
25
30
-2
-1
0
1
2
3
4
5
6 GDP consumption investment (r ight axis)% YoY % YoY
-2
0
2
4
6
CPI core inflation
% YoY
-10
-5
0
5
10
-6
-4
-2
0
2
4
6
employment nominal wage (right axis) real wage (r ight axis)
% YoY % YoY
-400
-300
-200
-100
0
100
200
300
400
500
8
9
10
11
12
13
14
15
16
annual change in number of unemployed unemployment rate
% K YoY

21
Macroeconomic background 2/2
Deposits dynamics Loans dynamics
PLN exchange rate Interest rates
0
5
10
15
20
25
30
0
5
10
15
20
25
30
deposits deposi ts od individuals deposits of inst itutions
% YoY % YoY
-10
0
10
20
30
40
50
60
70
-10
0
10
20
30
40
50
loans consumer loans institut ional loans mortgages
% YoY % YoY
1
3
5
7
NBP reference rate WIBOR 3M 5y bond y ield
%
2,0
2,5
3,0
3,5
4,0
4,5
3,5
4,0
4,5
5,0
PLN/EUR PLN/USD (right axis) PLN/CHF (right axis)
PLN

22
Financial results of BOŚ S.A. Group thou PLN 1H 2016 1H 2015 Change
Interest income and similar income 347 489 325 622 6,7%
Interest expense and similar charges -209 096 -204 766 2,1%
Net interest income 138 393 120 856 14,5%
Fee and commission income 70 888 70 467 0,6%
Fee and commission expense -15 473 -15 105 2,4%
Net commission & fee income 55 415 55 362 0,1%
Dividend income 5 174 5 137 0,7%
Net trading income 20 809 -543 x
Result on investment securities 4 392 10 376 -57,7%
Result on hedge accounting 1 128 1 386 -18,6%
Foreign exchange result 11 575 35 127 -67,0%
Other operating income 5 571 17 787 -68,7%
Other operating expenses -5 928 -8 396 -29,4%
Net impairment loses -57 794 -35 836 61,3%
General administrative expenses -192 017 -197 887 -3,0%
Operating profit -13 282 3 369 x
Gross profit/loss -13 282 3 369 x
Income tax charge 1 536 -719 x
Net profit/loss -11 746 2 650 x

23
Financial results of BOŚ S.A. thou PLN 1H 2016 1H 2015 Change
Interest income and similar income 346 923 324 074 7,1%
Interest expense and similar charges -211 495 -205 714 2,8%
Net interest income 135 428 118 360 14,4%
Fee and commission income 42 288 44 504 -5,0%
Fee and commission expense -6 135 -6 161 -0,4%
Net commission & fee income 36 153 38 343 -5,7%
Dividend income 13 082 13 622 -4,0%
Net trading income 10 338 -3 123 x
Result on investment securities 641 10 079 -93,6%
Result on hedge accounting 1 128 1 386 -18,6%
Foreign exchange result 11 305 34 652 -67,4%
Other operating income 2 168 3 780 -42,6%
Other operating expenses -5 313 -6 673 -20,4%
Net impairment loses -57 794 -35 836 61,3%
General administrative expenses -155 758 -161 402 -3,5%
Operating profit -8 622 13 188 x
Gross profit -8 622 13 188 x
Income tax charge 2 223 -862 x
Net profit -6 399 12 326 x

24
Consolidated statement of financial position thou PLN 30.06.2016 31.12.2015 Change
Cash and deposits with the Central Bank 801 248 614 897 30,3%
Deposits with other banks, loans and advances to other
banks249 971 158 720 57,5%
Held-for-trading securities 143 887 107 182 34,2%
Derivative financial instruments 180 119 206 949 -13,0%
Hedging derivatives - 11 557 x
Loans and advances to customers 14 287 684 14 343 558 -0,4%
Investment securities 5 054 491 5 000 538 1,1%
- available for sale 4 128 485 4 072 490 1,4%
-held-to-maturity 926 006 928 048 -0,2%
Intangible assets 136 545 147 610 -7,5%
Property, plant and equipment 87 722 89 411 -1,9%
Income tax assets 51 702 49 683 4,1%
Other assets 153 508 191 667 -19,9%
Total assets 21 146 877 20 921 772 1,1%
Amounts due to the Central Bank and other banks 158014 216409 -27,0%
Derivative financial instruments 190 631 152 291 25,2%
Hedging derivatives 51 496 37 621 36,9%
Deposits from customers 17 527 312 15 968 163 9,8%
Liabilities under banking securities issued 1 041 147 2 318 189 -55,1%
Subordinated debt 600 769 599 961 0,1%
Provisions 9 140 19 261 -52,5%
Income tax liabilities - 397 x
Other liabilities 125 023 140 924 -11,3%
Equity 1 443 345 1 468 556 -1,7%
Total equity and liabilities 21 146 877 20 921 772 1,1%

Disclaimer Neither this document nor any information contained herein may be distributed in the United States, Canada, Japan or Australia.
This document is not an offer for the sale of any securities in the United States. The securities of Bank Ochrony Środowiska S.A. (“Company”) have not been and
will not be registered under the United States Securities Act of 1933, as amended (the “Securities Act”) or any state regulations and may not be offered or sold in the United States or to US Persons (as defined in Regulation S issued under the Securities Act of 1933) absent registration or an exemption from registration under the Securities Act, or in a transaction not subject to the registration requirements of the Securities Act or any state regulations.
Neither this document nor any copy of it may be transferred to or transmitted in the United States, Canada, Japan or Australia Canada or distributed or redistributed in Japan, United States or Australia or to any resident thereof. This document does not constitute or form part of any offer to sell or issue, or an invitation to make an offer to purchase any securities, nor shall it or any part of it or the fact of its distribution form the basis of, or be relied on or referred to in connection with, any contract.
This document is directed only at persons who are (a) outside the United Kingdom or (b) persons who have professional experience in matters relating to investments falling within the definition of investment professionals in Article 19(5) of the Financial Services and Markets Act 2000 (Financial Promotion) Order 2005 (the “Order”) or (c) high net worth entities, and other persons to whom it may lawfully be communicated, falling within Article 49(2)(a) to (d) of the Order (all such persons together being referred to as “Relevant Persons”). The securities referred to in this document shall be made available only to the indicated persons and any invitation, offer or obligation to subscribe for, purchase or otherwise acquire such securities mill only be made available to or placed by the relevant persons. None other than a relevant person may rely on or refer to this document or any part hereof.
This document is merely a promotional instrument and should not, in any circumstances, be relied upon in making decisions as to investments in the Company’ securities.
This document is not to be distributed, directly or indirectly, in the United States of America or in other jurisdictions where public distribution of the information contained herein could be subject to restrictions or be prohibited by law. This document does not constitute an offer to sell or an invitation to subscribe for or acquire any securities.
This document may include forward-looking statements which means any statements using such words as “will,” “would,” “should,” “expect,” “intend,” “estimate,” “anticipate,” “project,” “future,” “potential,” “believe,” “seek,” “plan,” “aim,” “objective,” “goal,” “strategy,” “target,” “continue” and similar expressions or their negatives.
These forward-looking statements are subject to known and unknown risks, uncertainties and assumptions and other factors that could cause the Company's actual results of operations, performance or growth, to differ materially from those expressed in, or suggested by, these forward-looking statements. The Company has no obligation to update publicly or revise publicly any forward-looking statements contained herein, whether as a result of new information, future events, changed circumstances or any other reason after the date of this document.
Contact for Investors E-mail: [email protected] Website: www.bosbank.pl/en/investor-relations/ BOŚ Bank S.A. Investor Relations Team 32, Żelazna Str. 00-832 Warszawa