Embed Size (px)
Citation preview

Oscillatory dynamics of vasoconstriction and
vasodilation identified by time-localised phase
coherence
L W Sheppard1, V Vuksanovic2, P V E McClintock1
and A Stefanovska1
1Department of Physics, Lancaster University, Lancaster, LA1 4YB, UK
E-mail: [email protected]
2Institute of Biophysics, Faculty of Medicine, University of Belgrade, Serbia
Abstract.
We apply wavelet-based time-localised phase coherence to investigate the relationship
between blood flow and skin temperature, and between blood flow and instantaneous
heart rate (IHR), during vasoconstriction and vasodilation provoked by local cooling
or heating of the skin. A temperature-controlled metal plate (≈ 10 cm2) placed on
the volar side of the left arm was used to provide the heating and cooling. Beneath
the plate, the blood flow was measured by laser Doppler flowmetry and the adjacent
skin temperature by a thermistor. Two 1-hour data sets were collected from each of 10
subjects. In each case a 30-min basal recording was followed by a step change in plate
temperature, to either 24 ◦C or 42 ◦C. The IHR was derived from simultaneously
recorded ECG. We confirm the changes in the energy and frequency of blood flow
oscillations during cooling and heating reported earlier. That is: during cooling, there
was a significant decrease in the average frequency of myogenic blood flow oscillations
(p < 0.05) and the myogenic spectral peak became more prominent; and during
heating, there was a significant (p < 0.05) general increase in spectral energy, associated
with vasodilation, except in the myogenic interval. We also show that significant
(p < 0.05) phase coherence exists between blood flow and IHR in the respiratory and
myogenic frequency intervals. Cooling did not affect this phase coherence in any of the
frequency intervals, whereas heating enhanced the phase coherence in the respiratory
and myogenic intervals. This can be explained by the reduction in vascular resistance
produced by heating, a process where myogenic mechanisms play a key role. Weak
phase coherence between temperature and blood flow was observed for unperturbed
skin, but it increased in all frequency intervals as a result of heating. It was not
significantly affected by cooling. We conclude that the mechanisms of vasodilation
and vasoconstriction, in response to temperature change, are oscillatory in nature and
are independent of central sources of variability.
PACS numbers: 02.50.Tt, 05.45.Tp, 05.10.Gg, 92.20.jm, 87.19.Hh, 05.45.Xt
Submitted to: Phys. Med. Biol.
Published in Phys. Med. Biol. 56, 3583-3601 (2011).

Oscillatory dynamics of vasoconstriction and vasodilation 2
1. Introduction
Thermal regulation in humans is achieved primarily by adjustment of blood flow
through the skin circulation. The peripheral circulation serves as the body’s first
line of the defence in the face of environmental temperature change. The second line
of defence includes central neurophysiological mechanisms responsible for regulation
of core temperature. These two basic control mechanisms are not independent but
influence each other. It has been found that the complex mechanisms of blood flow
and skin temperature regulation interact in a nonlinear way, with hysteresis and rate
dependence (Kitney 1975, Vuksanovic et al. 2008), suggesting that thermoregulation
could usefully be studied from the point of view of the associated timescale of
fluctuations. In their early work on changes in digit blood flow, Burton and Taylor
(1940) attributed spontaneous frequency components below 0.1 Hz to thermal vasomotor
control. However, the exact frequencies were not precisely established. To our
knowledge, the only studies taking explicit account of the oscillatory processes that
occur in both blood flow and temperature and their interactions are those by Geyer
et al. (2004), Kitney (1980), Shusterman et al. (1997); and Bandrivskyy et al. (2004).
The latter investigated changes in the oscillatory processes following a temperature
perturbation. It yielded interesting preliminary data but suffered from two major
disadvantages: first the stimulus temperature (reduced by ice-bags partially insulated
from the skin with fabric) was not well-controlled, and secondly the temperature could
only be reduced. In the present work a precisely-controlled thermal perturbation could
be applied to a well-defined area of skin, thus ensuring that any oscillatory variability in
either blood flow or recorded temperature signals is physiological in origin rather than
driven by variations in the stimulus.
We applied the Morlet wavelet transform to study blood flow oscillations while the
skin surface temperature was being regulated at a value associated with either maximal
vasodilation or maximal vasoconstriction. However, much of the variability in skin blood
flow can be attributed to central mechanisms such as the cardiac pulse pressure wave.
To distinguish between the local and central influences, we determined the wavelet phase
coherence between the instantaneous heart rate (IHR) and the local blood flow. The
IHR was determined from an electrocardiogram (ECG).
The aim of this study was to explore rhythmical fluctuations present in blood flow
time series during local perturbations of skin temperature. We sought answers to two
main questions: (i) which oscillatory processes are involved in vasoconstriction and
vasodilation resulting from thermal perturbations; and (ii) which of the oscillations in
blood flow are of central origin and which of them are generated locally?

Oscillatory dynamics of vasoconstriction and vasodilation 3
2. Background
2.1. Cardiovascular oscillations
Cardiovascular system (CVS) dynamics can be modelled as a set of coupled nonlinear
oscillators with time-varying frequencies, and subject to fluctuations (see for example
Stefanovska and Bracic (1999), Jamsek et al. (2004), Veber et al. (2004), Smelyanskiy
et al. (2005), Humeau et al. (2010)). Central oscillators integrate central neural
mechanisms (Camm et al. 1996), whereas local/peripheral oscillators reflect the activity
of vascular smooth muscle, sympathetic activity and, as recently demonstrated (Kvandal
et al. 2006, 2003, Stefanovska et al. 1999), vascular endothelial activity. Thus
several different vascular and neurophysiological processes at different levels combine to
create the highly complex oscillatory patterns seen in CVS time series. Six different
oscillatory components have been identified in skin blood flow (Stefanovska 2007),
each corresponding to a different physiological process: (I) cardiac (0.6-2.0 Hz); (II)
respiratory (0.145-0.6); (III) myogenic (0.145-0.052); (IV) neurogenic (0.021-0.052); (V)
NO-dependent endothelial activity (0.0095-0.021) and (VI) NO-independent endothelial
activity (0.005-0.0095 Hz). The activity above 0.145 Hz obviously originates from
centrally driven processes, whereas processes with frequency below 0.145 Hz are expected
to be of local origin (Bernjak et al. 2008, Stefanovska and Bracic 1999).
2.2. Mechanisms of local vasodilation and vasoconstriction
Vasoconstriction and vasodilation imply respectively the narrowing or widening of blood
vessels, processes that are conventionally envisaged to occur smoothly and steadily, and
monotonically in response to a given stimulus. Up to now the associated mechanisms
have been investigated within this conceptual framework. It is known that vascular
smooth muscle maintains an intrinsic tone (associated with vessel’s radius) at body
temperature (Pawlowski and Morgan 1992). The initial tone defines the extent of a
stretch response, which can occur as a reaction to perturbation by a change in either flow
or pressure (Folkow 1964). The vascular tonus throughout the body is also maintained
at an appropriate level for thermoregulation via either global or local sympathetic
mechanisms (Alvarez et al. 2006, Kellogg 2006). The global sympathetic vasodilation
response to heating is dependent on cholinergic active vasodilator nerves, and the
response to cooling on noradrenergic vasoconstrictor nerves. Different mechanisms are
involved in the response to local temperature changes. The local vasodilatory response to
heating is biphasic (Minson et al. 2001), with an initial neural component due to sensory
afferent nerves, and a slower endothelium-dependent response involving the release of
NO and other vasodilatory factors (Kellogg et al. 1999, Medow et al. 2008). There is also
a biphasic response to local cooling, but the initial response of afferent sensory neurons
acts locally on the noradrenergic vasoconstrictor nerves of the sympathetic system to
initiate vasoconstriction, followed by a subsequent endothelial response to reduced NO
(Hodges et al. 2006, Kellogg 2006). This homeostatic response also depends on the rate

Oscillatory dynamics of vasoconstriction and vasodilation 4
of cooling (Yamazaki et al. 2006), the temperature to which the skin is cooled (Johnson
et al. 2005), and the duration of exposure (Nuzzaci et al. 1999). Rho Kinase has been
shown to promote vasoconstriction during both phases of the response to local cooling
(Thompson-Torgerson et al. 2007). Endothelium-mediated vasoactive substances are
also known to act as cofactors (Kellogg 2006), and each of them may modulate the
response of vascular tone to the others (Huang et al. 2000). The contribution made
by the various biochemical pathways involved depends on the age of the subject. The
endothelial response to increased flow, sensed as shear stress once arteriolar vasodilation
begins, may also be important.
During local heating and cooling, receptors on both endothelial and smooth muscle
cells respond to temperature changes to produce an appropriate redistribution of
vascular resistance. Downstream of the arterioles and independently of the endothelium,
venous basal tone may respond to temperature increases with constriction and vice versa
(Simonet et al. 2000) to help regulate the systemic blood flow.
2.3. Oscillations in skin temperature
Although vasodilation and vasoconstriction are thus understood in terms of steady
states, it has been known for over 70 years that, in reality, the control mechanism
involves oscillations (Burton and Taylor 1940), mainly with energies below 0.1 Hz.
Spontaneous oscillatory activity of skin temperature variability below 0.1 Hz was found
to be correlated with oscillations in blood flow, but the frequencies were not precisely
resolved (Hafner et al. 2007, Shusterman et al. 1997).
Skin temperature oscillations have been particularly observed during temperature
provocation. Entrained oscillations in skin blood flow in the fingers have also been
demonstrated when periodic thermal stimuli (periods of 20 and 80 s) are applied to
the contralateral hand (Kitney 1974, 1975). These responses could indicate global
thermoregulatory activity coordinated by the sympathetic nervous system rather than
the local thermoregulatory response. Because skin heating causes vasodilation, it
increases average blood flow. It may have an effect on blood flow variability in all
frequency intervals. Geyer et al. (2004) found an increase in the proportion of signal
energy in the endothelial related interval and a relative decrease in the myogenic interval.
2.4. Oscillations in instantaneous heart rate
The heart drives blood flow through the body, and changes in heart rate affect blood
pressure and local perfusion. The heart rate is known to oscillate in time with respiration
(well-known as respiratory sinus arrhythmia, or RSA) (Camm et al. 1996). Frequency
analysis reveals a spectral peak at around 0.1 Hz which may be associated with so-called
Mayer waves in systemic blood pressure (Eckberg 2010) and skin blood flow variability
in the myogenic interval. Low frequency variability in IHR is found to occur in the same
spectral intervals as those identified in blood flow (Kvandal et al. 2006, Shiogai et al.
2010, Stefanovska 2007) using the Morlet wavelet transform.

Oscillatory dynamics of vasoconstriction and vasodilation 5
3. Mathematical and experimental methods
3.1. The Morlet wavelet transform and wavelet phase coherence
In order to capture the time variability of the basic (characteristic) oscillation
frequencies in blood perfusion signals, the Morlet wavelet transform was applied to data
(Stefanovska and Bracic 1999, Stefanovska et al. 1999) recorded as described below. The
transform is obtained by convolving the signal with the Morlet wavelet, a complex plane
wave of centre frequency f0 multiplied by a Gaussian envelope of unit width. A family
of similar wavelets is generated at a range of scale values, σ, separated by percentage
increments appropriate to the frequency resolution of the wavelet. The wavelets are
normalised by spectral energy:
ψ (σ, t) =1
σ12
e−i2πf0t
σ e−t2
2σ2 , (1)
where t is time. The frequencies of the wavelets are inversely proportional to their scales.
The lowest frequency component that can reliably be detected depends on f0 and the
length of the available time-series. The wavelet transform of a time-series x(t) can be
written as
W (σ, t) =∫ ∞
−∞ψ (σ, (t− τ))x(τ)dτ. (2)
where the integration is taken over the dummy variable τ . W (σ, t) is the convolution
of the complex wavelet with the time-series at each scale, giving a matrix of complex
values that define an absolute amplitude and relative phase at each point in time for
each frequency component; note that, in practice, the operation is discretised in both
time and frequency. In the frequency domain the wavelet acts as a filter with a Gaussian
profile, centred at f0/σ, with a width inversely proportional to the scale. The phase of
the wavelet transform at each point in time is equivalent to the Hilbert phase of the
filtered signal.
The wavelet defined in (1) is truncated where the magnitude of the envelope is
sufficiently small. Where its edges overhang the edges of the signal, the reliability of
the calculated W (f, t) is reduced, so the wavelet transform is also cut to remove values
which are too close to the edge. This factor limits the lowest frequency that can reliably
be identified in the transform.
Where two noisy signals with different spectra include power at the same frequency
the question arises as to whether the oscillations are due to related or unrelated causes.
The method of phase coherence enables us to determine whether the oscillations detected
are significantly correlated over time. For a given frequency component, the phases (ϕ1
and ϕ2) are determined at each point in time and the phase difference between the two
signals is then calculated. If each phase difference is considered as a unit phasor, the
amplitude of the mean phasor is the phase coherence
Π (σ) =1
n
∣∣∣∣∣n∑
t=1
ei(ϕ1(σ,t)−ϕ2(σ,t))
∣∣∣∣∣. (3)

Oscillatory dynamics of vasoconstriction and vasodilation 6
The definition is equivalent to that used by Bandrivskyy et al. (2004). The magnitude of
the phase coherence thus expresses the tendency of the phase difference between signals
to remain fixed over time (e.g. to remain at 0 or some other fixed phase delay). The
more similar the various phase difference values are, the greater the size of the total (or
mean) phasor. If no particular phase difference is preferred, the total phasor will be
small, like a random walk in the complex plane.
However, even unrelated signals will have a finite phase coherence over a finite
period of time. That of two uncorrelated signals is expected to fall off as n−1/2, where
n is the number of independent samples of the phase difference as it varies in time. The
wavelet phase increases monotonically, defined within −π < ϕ ≤ +π. The wavelet
transform phase grows at a rate equivalent to an instantaneous frequency for that
component. If phase growth between two different signal transform components of the
same frequency was purely linear (no variability), then all samples are equivalent and
any (possibly arbitrary) phase difference between the time-series would be preserved
throughout the signal, making the phase coherence trivially equal to unity. In fact the
growth of phase for each frequency component is nonlinear for all physiological processes,
and it is this nonlinear growth of phase that enables independent measurements of the
phase difference between two phase time-series. The longer the autocorrelation time of
each signal, the less independent can be the values of the phase difference time-series,
and thus the higher the phase coherence of even unrelated signals. The latter tends
to increase towards unity for the lowest frequencies in the wavelet transform, as the
corresponding number of cycles in the time-series decreases.
To estimate a distribution of phase coherence functions for unrelated signals, and
thus gauge the significance of the phase coherence at each frequency, we use the method
of surrogates. Where several bivariate data sets are available, we calculate the wavelet
phase coherence of every possible mismatched pair of signals, which by construction are
unrelated. The actual value of phase coherence obtained at each frequency can then be
compared with the mean, plus one and plus two standard deviations of this surrogate
distribution. Furthermore, the distribution of actual phase coherence values for each
bivariate data set can be compared under different temperature conditions.
3.2. Wavelet spectral normalisation
The interpretation and comparison of wavelet transform plots and wavelet amplitude and
energy spectra is not possible without understanding the scale-dependent normalisation
of a wavelet, associated with the variable width of the frequency increment of which
each value is representative. Normalisation must be appropriate to the area in time-
frequency space represented by each calculated value of the transform, and the graphical
presentation of these values must be appropriate to allow comparison of the spectral
features at different frequencies.
For the wavelet normalisation given in Eq. (1), we calculate the wavelet energy

Oscillatory dynamics of vasoconstriction and vasodilation 7
terms as
E =∑t
∑σ
W (σ, t)W ⋆ (σ, t) (f (σn−1)− f (σn+1)) /2. (4)
where the asterisk denotes complex conjugate.
3.3. Data recording and analysis
Subjects 10 healthy subjects (7 males and 3 females; mean age (30.8±3.0) years)
participated in the study. They each lay supine on a bed in a well-ventilated room
at 20.5 ± 1.0◦C and relaxed for 20 minutes prior to the measurements. A basal
measurement of 30 minutes length was made with the (inert) temperature control plate
in situ, followed by a 30 minute recording in which the temperature of the plate was
controlled at 24.0 ± 0.1◦C. After 20 minutes resting with the thermal control plate
removed, it was replaced for a second basal recording of 30 minutes, followed by a 30
minute recording in which the control surface was instead heated to 42.0± 0.1◦C. The
basal recordings minimised problems of reproducibility (Roustit et al. 2010) associated
with the replacement of the sensor after the resting period. Temperature values were
chosen to produce a maximal response (Kellogg 2006), but the stimulus was applied
over a small area to avoid provoking central thermoregulatory mechanisms (verified by
the simultaneous control measurements).
All participants gave their informed consent in writing. The investigation
conformed with the principles outlined in the Declaration of Helsinki and was approved
by the Local Ethics Committee.
Data recording procedure Skin temperature was locally perturbed by contact with a
copper plate. The dimensions of the plate were 32×38mm (≈ 10 cm2 area). The weight
was 1.5N. Thus the excess pressure was 1.2 kPa (less than 10% of blood pressure). As
shown in figure 1, the plate was placed on the volar aspect of the lower arm, with a
small aperture (≈ 8 mm2) in the centre to accommodate the laser-Doppler flowmetry
probe. A temperature probe was placed under the plate with its thermally insulated
surface in contact with the plate and its conductive surface in contact with the skin.
Peltier elements linked to the plate and to the temperature controller (Temperature
Controller, MTTC-1410, Melcor Corp., Trenton NJ, USA) brought the temperature
of the plate to within 0.1 ◦C of the target temperature within a few seconds. The
temperature sensor (Thermilinear, YSI Inc., Yellow Springs OH, USA) and associated
signal conditioning unit (Cardiosignals, Jozef Stefan Institute, Ljubljana, Slovenia)
enabled skin temperature to be recorded with a resolution of 0.0003 ◦C between 20 and
40 ◦C, using 22-bit A/D conversion scaled to ±5 V. A second identical set of blood flow
and temperature sensors was placed ≈ 10 centimetres lower down on the same arm to
provide simultaneous control measurements on unstimulated skin. In every case an area
of skin free from large vessels was selected. The distance between the LDF probe and
corresponding temperature sensor was minimized at both locations (≈ 1 centimetre).
Oscillatory dynamics of vasoconstriction and vasodilation 8
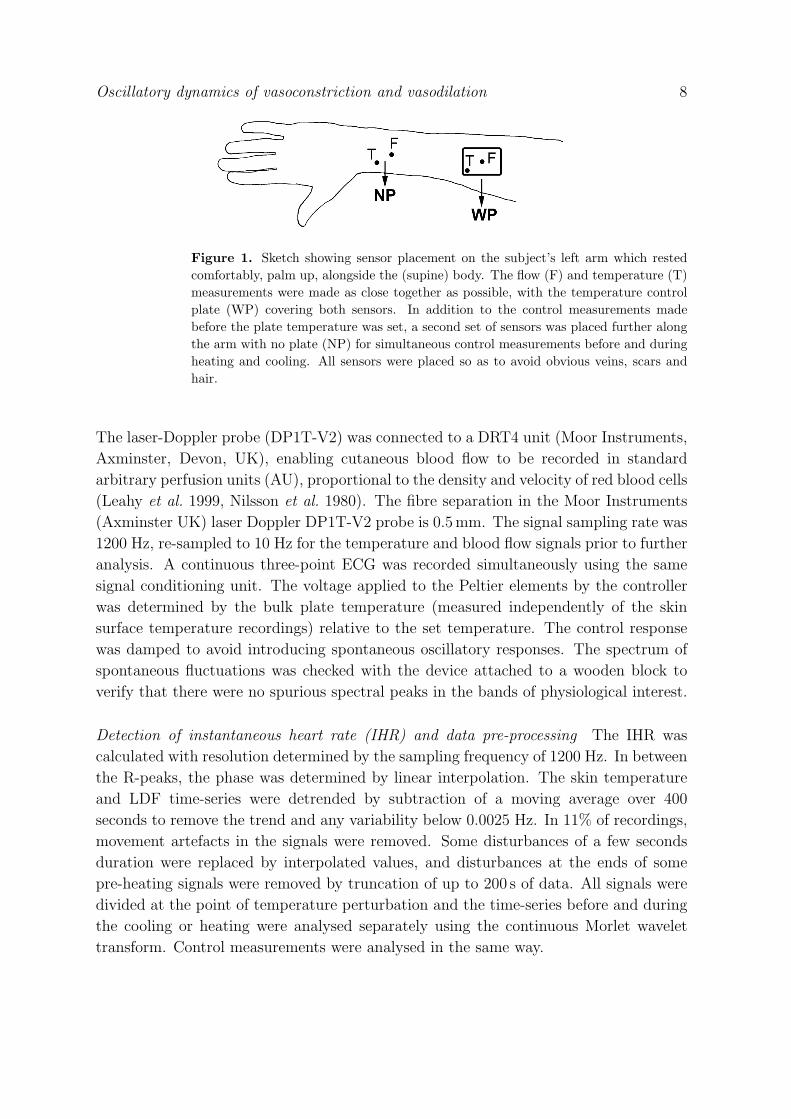
Figure 1. Sketch showing sensor placement on the subject’s left arm which rested
comfortably, palm up, alongside the (supine) body. The flow (F) and temperature (T)
measurements were made as close together as possible, with the temperature control
plate (WP) covering both sensors. In addition to the control measurements made
before the plate temperature was set, a second set of sensors was placed further along
the arm with no plate (NP) for simultaneous control measurements before and during
heating and cooling. All sensors were placed so as to avoid obvious veins, scars and
hair.
The laser-Doppler probe (DP1T-V2) was connected to a DRT4 unit (Moor Instruments,
Axminster, Devon, UK), enabling cutaneous blood flow to be recorded in standard
arbitrary perfusion units (AU), proportional to the density and velocity of red blood cells
(Leahy et al. 1999, Nilsson et al. 1980). The fibre separation in the Moor Instruments
(Axminster UK) laser Doppler DP1T-V2 probe is 0.5mm. The signal sampling rate was
1200 Hz, re-sampled to 10 Hz for the temperature and blood flow signals prior to further
analysis. A continuous three-point ECG was recorded simultaneously using the same
signal conditioning unit. The voltage applied to the Peltier elements by the controller
was determined by the bulk plate temperature (measured independently of the skin
surface temperature recordings) relative to the set temperature. The control response
was damped to avoid introducing spontaneous oscillatory responses. The spectrum of
spontaneous fluctuations was checked with the device attached to a wooden block to
verify that there were no spurious spectral peaks in the bands of physiological interest.
Detection of instantaneous heart rate (IHR) and data pre-processing The IHR was
calculated with resolution determined by the sampling frequency of 1200 Hz. In between
the R-peaks, the phase was determined by linear interpolation. The skin temperature
and LDF time-series were detrended by subtraction of a moving average over 400
seconds to remove the trend and any variability below 0.0025 Hz. In 11% of recordings,
movement artefacts in the signals were removed. Some disturbances of a few seconds
duration were replaced by interpolated values, and disturbances at the ends of some
pre-heating signals were removed by truncation of up to 200 s of data. All signals were
divided at the point of temperature perturbation and the time-series before and during
the cooling or heating were analysed separately using the continuous Morlet wavelet
transform. Control measurements were analysed in the same way.

Oscillatory dynamics of vasoconstriction and vasodilation 9
Estimation of wavelet spectral energy A Morlet mother wavelet with f0 = 1 was
generated, with a family of wavelets re-scaled by successive increments of 5%. The
highest frequency wavelet was at 2.5 Hz to include the cardiac oscillations and the lowest
at 0.0025 Hz, limited by the length of the signal. Represented in the time domain, the
wavelets were truncated at the point where the size of the Gaussian wavelet envelope
dropped below 0.001. Transform values were removed where the size of the wavelet
envelope overhanging the edge of the time-series was more than 10 percent of its peak
value. The wavelet energy spectrum was determined and then integrated over each of
the six frequency bands using the appropriate frequency increment.
Estimation of wavelet phase coherence The phase coherence was determined from the
phase values of blood flow and temperature, and blood flow and IHR; in each case the
phase was calculated by use of the wavelet transform. A distribution of spurious phase
coherence functions was generated by mismatching either blood flow and temperature,
or blood flow and IHR, wavelet phase series from the different subjects. A mean phase
coherence level more than two standard deviations above the mean of a group from the
surrogate distribution was deemed to indicate a non-spurious relationship between the
signals at that frequency for that subject. Additionally, The distribution of actual phase
coherence values at each frequency for all subjects was compared with the surrogate
distribution using the Kolmogorov-Smirnov rank sum test.
Statistical tests By use of a paired Wilcoxon signed rank test, changes in the
distribution of wavelet energy spectra during the temperature perturbation were tested
against a null hypothesis: viz that the median change for all subjects in energy in a
given band, or in terms of total spectral energy, was zero. To compare phase coherence
values before and after a perturbation, a paired Wilcoxon signed rank test was used
to determine whether the median difference in phase coherence values for each subject
measured before and during the perturbation was significant. The Kolmogorov-Smirnov
rank sum test was also applied to check for significant changes in the distributions of
energy or phase coherence values.
4. Results
Representative examples of skin blood flow and skin temperature measurements are
shown in figure 2, accompanied by wavelet transforms of the blood flow signal during
local skin cooling (a) and heating (b). The well-known initial vasodilation biphasic
response to heating (Minson et al. 2001) shown in the middle graph of figure 2(b) is not
directly related to the oscillatory behaviour on which we focus, so the first 300 seconds
of the response to heating was excised prior to further analysis.
Group results for skin blood flow and temperature, and corresponding total spectral
energies of the wavelet transform of both signals, are presented as median values and
box plots in figure 3, with the corresponding statistical analyses in table 1. As can be

Oscillatory dynamics of vasoconstriction and vasodilation 10
Figure 2. Blood flow wavelet transforms, raw flow signal and recorded skin
temperature under the temperature regulation plate over 30 minutes of measurements
without temperature perturbation, followed by 30 minutes with the plate temperature
set (a) to 24 ◦C and (b) to 42 ◦C.
seen, the mean values and the total energy of variability in blood flow and temperature
were different from person to person.
The mean IHR was 0.97±0.13 Hz and 0.97±0.07 Hz before cooling and and heating
respectively, and underwent no significant changes during the course of the protocol.
Unpaired (a) (b) (c) (d) (e) (f) (g) (h)
p (NP)
p (WP)
0.9748
0.3129
0.9748
0.9748
0.6751
0.0012
0.9748
0.0310
0.0310
0.0000
0.3129
0.0002
0.6751
0.0000
0.1108
0.1108
Paired (a) (b) (c) (d) (e) (f) (g) (h)
p (NP)
p (WP)
0.4553
0.9900
0.3562
0.4475
0.0010
0.0000
0.8743
0.0098
0.0066
0.0000
0.1194
0.0115
0.1233
0.0000
0.0325
0.7762
Table 1. Statistical analyses of the data shown in figure 3. The p values from unpaired
and paired tests are given for each panel of the figure, both for no plate (NP) and with
the plate (WP). Values below p = 0.05 are italicised to indicate their significance.
There is no difference in the results of the two tests except for cases (c) and (h) which
suggest that there might perhaps be some collateral effect (Kitney 1974, 1975).

Oscillatory dynamics of vasoconstriction and vasodilation 11
0
5
10
15
20
25
30
Coo
ling
Time−average flow (AU)
(a)
NP WP
0.5
1
1.5
2
2.5
Total spectral energy in flow (AU2)
(b)x103
NP WP
28
30
32
34
36
38
40
Time−average temperature (oC)
(c)
NP WP
0.01
0.02
0.03
0.04
Total spectral energy in temperature (oC2)
(d)
NP WP
0
50
100
150
200
Hea
ting
(e)
NP WP
1
2
3
4 (f)x104
NP WP
28
30
32
34
36
38
40
(g)
NP WP0
0.01
0.02
0.03
0.04
0.05
0.06
0.07
0.08
(h)
NP WP
Figure 3. Boxplots for measurements made away from the temperature control plate
(NP), and under the temperature control plate (WP), before (grey), and after (white)
the temperature of the plate is set. Top row, for cooling: (a) average flow; (b) total
wavelet energy of variability in flow between 0.005 and 2 Hz; (c) average temperature;
and (d) total wavelet energy of variability in temperature for all six intervals between
0.005 and 2 Hz. Bottom row, for heating: (e) average flow; (f) total wavelet energy
of variability in flow between 0.005 and 2 Hz; (g) average temperature; and (h) total
wavelet energy of variability in temperature for all six intervals between 0.005 and 2
Hz.
Cooling The cooled plate resulted in a significant mean skin temperature change from
31.7±1.5 to 29.1±0.8 ◦C (p < 0.01). During cooling, one subject underwent a temporary
vasodilation response. When this subject was excluded from the analysis a significant
drop in mean flow from 16.3±7.0 to 12.6±5.3 AU was observed. The total energy in the
flow spectrum does not change significantly with cooling (p > 0.05), but does change
significantly with heating (p < 0.05). Figures 3(b) and 3(f) show the different responses
of spectral energy in flow to cooling and heating. The total energy of variability in
temperature was different from person to person. The set of temperature recordings
made under the plate before cooling had lower variability than simultaneous control
measurements, but when cooling began the signal energy in all intervals increased to
levels comparable with the control measurements (Figure 3 d).
Heating The heated plate resulted in a significant rise in mean skin temperature from
31.1± 1.5 to 38.2± 0.6 ◦C and a significant mean blood flow increase from 19.1± 14.1
to 152.3 ± 46.0 AU, indicating pronounced vasodilation as expected. The total energy
in the flow spectrum changes significantly with heating (p < 0.05).

Oscillatory dynamics of vasoconstriction and vasodilation 12
0.01 0.1 10
0.02
0.04
0.06
0.08N
orm
alis
ed s
pect
ral e
nerg
y
Frequency (Hz)
a)
before coolingduring cooling
0.01 0.1 10
0.02
0.04
0.06
0.08
Nor
mal
ised
spe
ctra
l ene
rgy
Frequency (Hz)
b)
before heatingduring heating
0.01 0.1 10
0.02
0.04
0.06
0.08
Nor
mal
ised
spe
ctra
l ene
rgy
Frequency (Hz)
c)
before coolingduring cooling
0.01 0.1 10
0.02
0.04
0.06
0.08
Nor
mal
ised
spe
ctra
l ene
rgy
Frequency (Hz)
d)
before heatingduring heating
Figure 4. (a) Normalised wavelet energy spectra of blood flow before and during
cooling, and (b) before and during heating. (c) Normalised wavelet energy spectra of
skin temperature, recorded under the temperature regulation plate before and during
cooling, and (d) before and during heating. In each case, the vertical dashed lines
indicate the boundaries of frequency intervals I – VI.
4.1. Myogenic frequency decreases with cooling
The most significant change in the frequencies of the maxima in energy spectra compared
to the control measurements during either cooling or heating was a decrease in the
frequency of the spectral peak in band III as a result of cooling, associated with
myogenic activity as shown in figure 2(a). This is in agreement with the earlier report
by Bandrivskyy et al. (2004). The decrease is also apparent in the wavelet transform
spectra obtained by averaging the data from all subjects, as shown in figure 4(a). The
median myogenic frequencies before and during cooling were 0.084 Hz and 0.060 Hz,
respectively. The distributions of frequency values obtained were significantly different
(p < 0.05). Note that during cooling the myogenic peak falls on the boundary between
the myogenic and neurogenic frequency bands, and becomes much more sharply defined.
4.2. Spectral energy changes in heating and cooling
Cooling The energy found at the myogenic peak was higher in all ten subjects during
cooling. The normalised spectral energy within the myogenic frequency band increased

Oscillatory dynamics of vasoconstriction and vasodilation 13
500
1000
1500
2000
Wav
elet
ene
rgy
(AU2 )
Frequency intervalVI V IV III II
a)
1
2
3
4
x103
I
0.1
0.2
0.3
0.4
0.5
0.6
0.7
Nor
mal
ised
ene
rgy
Frequency intervalVI V IV III II
b)
before
during
Figure 5. (a) Boxplots of absolute wavelet energy of blood flow variability in each
frequency interval before heating and with heating. The cardiac interval is shown
separately to accommodate the high energies after heating. (b) Boxplots showing
wavelet energy of blood flow variability in each frequency interval before heating and
with heating, normalised by the total energy in five of the six intervals, excluding the
cardiac frequency interval. Significant changes (p < 0.05) are indicated by a star.
during cooling and this was statistically significant when compared with the data
obtained from the control site either before or during cooling (p < 0.05). At the same
time the normalised spectral energy within the cardiac interval decreased. The spectral
peak associated with oscillations in the endothelial interval VI became more pronounced
as shown in figure 4(a), but the associated change in energy was not statistically
significant.
Heating There is an overall increase in the total spectral energy of blood flow during
heating, together with a significant absolute increase (p < 0.05) in all six intervals except
the myogenic one (figure 5(a)). The most pronounced increase in energy is that of the
cardiac component, on account of the reduced resistance caused by vasodilation. This
trivially results in a reduction of the proportion of total signal energy attributable to
each of the other intervals. Excluding the cardiac interval, and normalizing instead by
the total energy in intervals II to VI, we find a significant reduction in the proportion of
signal energy in the myogenic interval (III), and a significant increase in the proportion
found in the endothelial intervals V and VI as shown in figure 5(b). These results apply

Oscillatory dynamics of vasoconstriction and vasodilation 14
0.01 0.1 10
0.1
0.2
0.3
0.4
0.5
0.6
Frequency [Hz]
Pha
se c
oher
ence
b)before heatingsurrogate meanmean + std.mean + two std.
0.01 0.1 10
0.1
0.2
0.3
0.4
0.5
0.6
Frequency [Hz]
Pha
se c
oher
ence
a)before heatingsurrogate meanmean + std.mean + two std.
Figure 6. a) Wavelet phase coherence of skin temperature and blood flow variability
data compared with the distribution of spurious phase coherence values. For each
subject, the actual phase coherence was calculated and so were the mean and standard
deviation of mismatch surrogate phase coherence values. The averages over all subjects
(actual, surrogate mean and surrogate standard deviation) are plotted here. b) Wavelet
phase coherence of IHR and blood flow variability data compared with the distribution
of spurious phase coherence values. For each subject, the actual phase coherence was
calculated and so was the mean and standard deviation of mismatch surrogate phase
coherence values. The average over all subjects (actual, surrogate mean and surrogate
standard deviation) are plotted here. In each case, the vertical dashed lines indicate
the boundaries of frequency intervals I – VI.
to all three comparisons: normalised energies during heating compared to either values
under the plate, or on the control site, before or during heating.
4.3. Temperature oscillations
Cooling Analyses of temperature oscillations for heating and cooling are shown in figure
4(c). During cooling a statistically significant increase in absolute values occurred in
intervals V (p < 0.0005) and VI (p < 0.05). When the data are normalised the increase
becomes less pronounced (p = 0.05 and p = 0.7 respectively).
Heating During heating, a pronounced peak appears in interval VI as shown in figure
4(d), but the increase is not statistically significant.
4.4. Phase coherence of blood flow and skin temperature
We calculated the wavelet phase coherence between skin temperature and the laser
Doppler signal, before and during heating and cooling, both for the temperature-
perturbed site and for the control site. It is interesting to note that statistically
significant phase coherence (more than two standard deviations above the values
obtained from mismatched surrogates) exists in the interval 0.052 – 2.0 Hz in the

Oscillatory dynamics of vasoconstriction and vasodilation 15
temperature-unperturbed state. This result was obtained from signals measured
beneath the plate as well as from signals measured on the control site. The mean
(for all subjects) phase coherence obtained from signals recorded under the plate before
heating is shown in figure 6(a). We comment that the phase coherence found under the
plate when the Peltier elements were inactive was generally slightly higher than that for
the control site.
Cooling When a paired Wilcoxon signed rank test was applied to compare the phase
coherence values obtained during cooling, and the pre-cooling distributions, significant
differences (p < 0.05) were obtained in localised frequency ranges within intervals I,
III, V and VI, as shown by the shading and stars in figure 7(a). In interval III the
coherence decreased, probably on account of the decreased myogenic frequency, whereas
in intervals I, V and VI the coherence increased.
Heating As can be seen from 7(b), a marked increase of phase coherence occurred
on heating. Applying a paired Wilcoxon signed rank test showed that there was a
statistically significant (p < 0.05) increase in all intervals as indicated by the shading
and stars. This significance arises for all three comparisons of phase coherence: (i)
between the heated place before and during heating; (ii) between the heated place and
the control site before heating; and (iii) between the heated place during heating and
the control site.
4.5. Phase coherence of blood flow and IHR
We evaluated the phase coherence between blood flow and IHR in three different ways,
by comparing values obtained with: (i) blood flow from beneath the plate with the
Peltier elements switched off; (ii) from the simultaneously recorded blood flow on the
control site; and (iii) from the simultaneously recorded blood flow on the control site
when the Peltier elements were active. The mean (for all subjects) pre-heating phase
coherences of IHR and blood flow under the plate are shown in figure 6(b). This figure
represents the basal state, which remained unchanged at the control site during cooling,
before heating and during heating. We observe clear peaks in phase coherence at the
respiratory and myogenic frequencies, well above the two-standard-deviation significance
threshold of the surrogate distribution.
Cooling The phase coherence between IHR and blood flow under the plate decreased
in the myogenic interval during cooling, as shown by the shading and stars in figure
figure 7(c). This was on account of the decreased frequency of myogenic oscillations, as
seen in the blood flow and discussed above.
Heating During heating the phase coherence was found to increase in the respiratory
and myogenic bands as shown by the shading and stars in figure 7(d).

Oscillatory dynamics of vasoconstriction and vasodilation 16
0.01 0.1 10
0.1
0.2
0.3
0.4
0.5
0.6
a)
Frequency [Hz]
Pha
se c
oher
ence
before coolingduring cooling
0.01 0.1 10
0.1
0.2
0.3
0.4
0.5
0.6
b)
Frequency [Hz]
Pha
se c
oher
ence
before heatingduring heating
0.01 0.1 10
0.1
0.2
0.3
0.4
0.5
0.6
Frequency [Hz]
Pha
se c
oher
ence
c)before coolingduring cooling
0.01 0.1 10
0.1
0.2
0.3
0.4
0.5
0.6
Frequency [Hz]
Pha
se c
oher
ence
d)
before heatingduring heating
Figure 7. (a) Mean wavelet phase coherence of variability in temperature and blood
flow before and during cooling, and (b) before and during heating. (c) Mean wavelet
phase coherence of variability in IHR and blood flow before and during cooling, and
(d) before and during heating. In each case, shading and stars are used to indicate
parameter ranges where the differences were statistically significant (p < 0.05). In each
case, the vertical dashed lines indicate the boundaries of frequency intervals I – VI.
5. Discussion
Local heating or cooling of the skin results in local vasodilation or vasoconstriction
of the vasculature. The results presented above provide detailed insight into the
associated myogenic oscillatory activity and show that it is central to both processes: in
vasoconstriction there is increased myogenic activity, involving increased amplitude of
oscillations, decreased frequency, and decreased average vessel radius. In vasodilation,
myogenic activity is dramatically decreased. This reduction is associated with increased
vessel average radius, decreased resistance, and greatly increased average blood flow.
In addition, the endothelial oscillatory components both increase significantly. The
phase coherence between blood flow and temperature changes with the state of
vasoconstriction or vasodilation, and increases to a marked extent on heating probably
on account of the increased blood flow. It is evident that the static (i.e. tonus) and
dynamic (oscillatory) levels of myogenic activity increase and decrease in unison, as

Oscillatory dynamics of vasoconstriction and vasodilation 17
Figure 8. Diagrammatic representation of processes that occur during (a)
vasoconstriction and (b) vasodilation. In vasoconstriction, (a) the actin and myosin
filaments 1 in the band of smooth muscle around the vessel draw together more closely,
reducing the vessel’s average radius and resulting in increased myogenic oscillations, a
decreased myogenic frequency, and a slightly decreased blood flow. In the vasodilated
state (b) the actin and myosin filaments 1 are more separated, corresponding to smaller
tonus and larger vessel radius. In addition to the smooth muscles 1 being more relaxed,
the amplitude of myogenic oscillations decreases as demonstrated by the results of the
present study. At the same time, the vasodilation results in a huge increase in cardiac
oscillations as shown in figure 5 and the flow 2 is increased fivefold as shown in figure
2. The vasodilated and vasoconstricted states are also affected by the activity of
endothelial cells 3 and sensed by sympathetic nerve fibres 4 connected to the outer
walls of the vessels.
summarized in figure 8.
5.1. Physiological sources of variability
The physiological sources of variability can be traced back further. The variations in
skin blood flow and IHR are found to have significant phase coherence in the myogenic
and respiratory frequency intervals. Increased local compliance results in increased
phase coherence during heating (an increased ‘signal to noise ratio’) but endothelial and
neurogenic processes that are independent of IHR remain independent when their local
amplitude increases. Similarly, despite the pronounced spectral changes in blood flow
during cooling, in particular in interval III, the phase coherence between blood flow and
IHR did not change.
We suggest that the oscillatory reactivity of vascular endothelium and smooth
muscle to the thermal stimuli is associated with the regulation of local vascular
resistance, depending on the intensity and direction of temperature change. These
oscillatory changes are not associated with increased coupling to the central oscillations
of the heart. Rather, they are local oscillatory responses to the thermal perturbation.
5.2. Vascular responses to cooling and heating
Earlier work on sequential heating and cooling of the skin (Vuksanovic et al. 2008),
involving gradual, step-wise, plate-temperature changes within the range 24–42 ◦C, led
to the observation of hysteresis, as shown in figure 9(b). This suggested that different

Oscillatory dynamics of vasoconstriction and vasodilation 18
Figure 9. Segments of blood flow wavelet transforms during (a) cooling and (c)
heating are compared with segments from the control measurements in each case.
The spectral characteristics seen here represent the extremal states of vasodilation and
vasoconstriction. (b) The hysteresis curve of skin blood flow and temperature resulting
from sequentially heating and cooling the skin.
mechanisms were at work during heating and cooling. Thus, different possible levels
of blood flow could coexist at the same temperature. In the present study we have
concentrated on the extremal responses to heating and cooling shown by the time-
frequency wavelet transforms in figures 9(a) and (c) respectively.
There are at least two possible explanations for the immediate drop in frequency of
the myogenic oscillation in skin blood flow on cooling. Either the reduced perfusion slows
the metabolic activity in the smooth muscle fibres, slowing their rate of spontaneous
oscillation, or the reduced frequency of oscillation is a homeostatic response to cooling
which tends to increase the effective vascular resistance and reduces blood flow. The
reduced frequency and increased amplitude of the myogenic oscillations is similar to
the changes that occur during reduced pressure. A reduced contractile rate is believed
to be associated with a reduced stretch response of the smooth muscle cells (Folkow
1964), as observed in rat (Achakri et al. 1995) and rabbit (Oude Vrielink et al. 1990)
myogenic oscillations when the tissue is exposed to reduced pressure in vitro. Morris et
al. (1996) find increased finger capillary pressure, i.e. reduced precapillary resistance,
associated with vasodilation mediated by endothelial nitric oxide synthase, and one
vasoconstriction mechanism is reduced nitric oxide synthase activity (Hodges et al.
2006, Yamazaki et al. 2006). During vasodilation the capillary pressure is relatively
high, and correspondingly higher precapillary pressure and arteriolar stretch may
produce myogenic reflex oscillations at relatively higher frequency. Conversely, during
vasoconstriction, relatively low capillary and precapillary pressure may result in lower-

Oscillatory dynamics of vasoconstriction and vasodilation 19
frequency myogenic oscillations.
The change in the relative proportions of blood flow spectral energy in each band
during heating, the reduced proportion of the signal energy at 0.1 Hz, and the increased
proportion at the cardiac frequency suggest that, when the smooth muscle fibres are fully
extended, their individual oscillations are depressed. The measured changes in spectra
are consistent with those found by Geyer et al. (2004), who examined frequencies down
to 0.008 Hz (interval V). We find that activity increases in both the NO-dependent (V)
and NO-independent (VI) endothelial spectral intervals.
5.3. Dynamical relationship between the oscillations in skin blood flow and temperature
Variability in skin surface temperature is a consequence of variations in the balance
between heat supply (from metabolic processes, via the blood) and heat loss (via
conduction and, usually, evaporation). Calculation of the wavelet phase coherence of
the variabilities in temperature and blood flow for control measurements apparently
demonstrates a relationship between them (figure 6), but it is clear that only a
proportion of the measured variability in skin temperature is associated with variability
in blood flow. This proportion increases significantly when the skin is heated.
The fact that significant phase coherence was not always found in the lowest
frequency intervals may be due to the control unit damping low frequency oscillations,
or to the small number of cycles at low frequencies limiting our statistical ability to
distinguish real from spurious phase relationships. We note that the thermometry was
of sufficiently high resolution to identify cardiac and respiratory phase coherence despite
the small amplitude of oscillation and the consequent difficulty of detection discussed
by Podtaev et al. (2008).
Slow oscillations in skin temperature at about 0.003 Hz (Nuzzaci et al. 1999), were
observed in some signals both before and after temperature change, but these oscillations
are at the lower limit that can reliably be probed using the wavelet transform on signals
of only 30 min duration, and hence below the lowest frequency interval examined here.
6. Conclusion
We have investigated the dynamical aspects of vasoconstriction and vasodilation by use
of wavelet and wavelet-phase-coherence analyses in conjunction with a temperature-
controlled metal plate. In doing so, we have found that vasoconstriction and vasodilation
do not just involve changes in the average radii of vessels, as in the traditional picture,
but have strong oscillatory components. The dominant frequency is near 0.1Hz,
corresponding to myogenic processes. Cooling produces vasoconstriction, decreased
myogenic frequency and increased amplitude on account of the myogenic oscillations
becoming more synchronized. The decrease in frequency is probably on account of the
vessels being more contracted on average, slowing the vasomotion. Heating produces
vasodilation, the tonus decreases, and the myogenic oscillation becomes vanishingly

REFERENCES 20
small. These changes relax the vessel and enlarge its average radius, thus decreasing
vascular resistance and increasing the relative contributions of all the other oscillatory
processes. It is clear that the conventional picture of vascular temperature regulation
in terms of quasistatic, monotonic, changes in vessel radii and averaged flows cannot be
expected to provide an adequate understanding of human temperature control. It must
clearly be supplemented by explicit consideration of the oscillatory dynamics.
One advantage of studying vascular activity under thermal perturbation, as
described above, is that the differences between the oscillatory dynamics of
vasoconstriction and vasodilation can then be illuminated by wavelet analysis. This
approach has clearly distinguished between locally and centrally generated oscillations,
and it has enabled us to explore the interaction between skin blood flow and temperature.
Such studies of the dynamics of vascular contraction/dilation are contributing to our
understanding of the characteristic features of vascular thermoregulation, in particular
the oscillatory nature of endothelial and myogenic activity. They also represent a
possible basis for the non-invasive monitoring of endothelial and myogenic function.
In particular, measurements of the changes in local oscillatory processes during thermal
challenge could enable a more precise evaluation of microvascular health. For example,
under a protocol of cooling and heating, it may be possible to quantify, not just
vasoconstriction and vasodilation, but also the specific changes in compliance (amplitude
of cardiac oscillation), local myogenic activity and so on.
The endothelial vasodilator response has already been shown to decrease with age.
It is also known to be impaired in coronary artery disease, heart failure, diabetes
mellitus, hypertension and hypercholesterolemia, as well as in smokers. We may
therefore expect that non-invasive measurements under thermal challenge, especially
heating, combined with analyses of the kind described in this paper, may in future prove
useful for the early diagnosis of a range of pathological conditions and for quantifying
the efficacy of treatments that are being prescribed.
Acknowledgements
We are grateful to Dwain Eckberg for a critical reading of an earlier version of the
manuscript and for many very valuable suggestions. We would like to thank Stephen
Holt of the Lancaster University Department of Physics’ Workshop for his assistance,
and the volunteers who contributed to the study. The research was supported by a
Royal Society International Short Visit Grant, the Wellcome Trust, the EPSRC, and
the EC FP6 project BRACCIA Contract No. 517133 NEST.
References
Achakri H, Stergiopulos N, Hoogerwerf N, Hayoz D, Brunner H R and Meister J J
1995 Intraluminal pressure modulates the magnitude and the frequency of induced
vasomotion in rat arteries J. Vasc. Res. 32 237–246

REFERENCES 21
Alvarez G E, Zhao K, Kosiba W A and Johnson J M 2006 Relative roles of local and
reflex components in cutaneous vasoconstriction during skin cooling in humans J.
Appl. Physiol. 100 2083–2088
Bandrivskyy A, Bernjak A, McClintock P and Stefanovska A 2004 Wavelet phase
coherence analysis: Application to skin temperature and blood flow Cardiovascular
Engineering 4 89–93
Bernjak A, Clarkson P B M, McClintock P V E and Stefanovska A 2008 Low-frequency
blood flow oscillations in congestive heart failure and after β1-blockade treatment
Microvasc. Res. 76 224–232
Burton A C and Taylor R M A 1940 A study of the adjustment of periferal vascular
tone to the requirements of the regulation of body temperature Am. J.— Physiol.
129 565–577
Camm A J, Malik M, Bigger J T and et al 1996 Heart rate variability – Standards of
measurement, physiological interpretation, and clinical use Circulation 93 1043–1065
Eckberg D L 2010 Point: Counterpoint: Respiratory sinus arrhythmia is due to a central
mechanism vs. respiratory sinus arrhythmia is due to the baroreflex mechanism J.
Appl. Physiol. 106 1740–1742
Folkow B 1964 Description of myogenic hypothesis Circ. Res. 15 279–287
Geyer M J, Jan Y K, Brienza D M and Boninger M L 2004 Using wavelet analysis to
characteriza the thermoregulatory mechanisms of sacral skin blood flow J. Rehabil.
Res. Dev. 41 797–805
Hafner H M, Brauer K, Eichner M, Koch I, Heinle H, Rocken M and Strolin A 2007
Wavelet analysis of skin perfusion in healthy volunteers Microcirculation 14 137–144
Hodges G J, Zhao K, Kosiba W A and Johnson J M 2006 The involvement of nitric
oxide in the cutaneous vasoconstrictor response to local cooling in humans J. Physiol.-
London 574 849–857
Huang A, Sun D and Koller A 2000 Shear stress-induced release of prostaglandin H-2
in arterioles of hypertensive rats Hypertension 35 925–930
Humeau A, Buard B, Mahe G, Chapeau-Blondeau F, Rousseau D and Abraham P 2010
Multifractal analysis of heart rate variability and laser Doppler flowmetry fluctuations:
comparison of results from different numerical methods Phys. Med. Biol. 55 6279–
6297
Jamsek J, Stefanovska A and McClintock P V E 2004 Nonlinear cardio-respiratory
interactions resolved by time-phase bispectral analysis Phys. Med. Biol. 49 4407–4425
Johnson J M, Yen T C, Zhao K and Kosiba W A 2005 Sympathetic, sensory, and
nonneuronal contributions to the cutaneous vasoconstrictor response to local cooling
Am. J. Physiol.-Heart Circul. Physiol. 288 H1573–H1579
Kellogg D L 2006 In vivo mechanisms of cutaneous vasodilation and vasoconstriction in
humans during thermoregulatory challenges. J. Appl. Physiol. 100 1709–1718

REFERENCES 22
Kellogg D L, Liu Y, Kosiba I F and O’Donnell D 1999 Role of nitric oxide in the vascular
effects of local warming of the skin in humans J. Appl. Physiol. 86 1185–1190
Kitney R I 1974 Analysis and simulation of human thermoregulatory control-system
Medical & Biol. Engin. 12 57–65
Kitney R I 1975 An analysis of the nonlinear behaviour of the human thermal vasomotor
control system J. Theor. Biol. 52 231–248
Kitney R I 1980 An analysis of the thermoregulatory influences on heart-rate variability
in R I Kitney and O Rompelman, eds., The Study of Heart Rate Variability (Oxford:
Clarendon Press) 81–106
Kvandal P, Landsverk S A, Bernjak A, Stefanovska A, Kvernmo H D and Kirkebøen
K A 2006 Low frequency oscillations of the laser Doppler perfusion signal in human
skin Microvasc. Res. 72 120–127
Kvandal P, Stefanovska A, Veber M, Kvernmo H D and Kirkebøen K A 2003 Regulation
of human cutaneous circulation evaluated by laser Doppler flowmetry, iontophoresis,
and spectral analysis: importance of nitric oxide and prostaglandines Microvasc. Res.
65 160–171
Leahy M J, de Mul F F, Nilsson G E and Maniewski R 1999 Principles and practice of
the laser-Doppler perfusion technique Technol. Health Care 7 143–62
Medow M S, Glover J L and Stewart J M 2008 Nitric oxide and prostaglandin inhibition
during acetylcholine-mediated cutaneous vasodilation in humans Microcirculation 15
569–579
Minson C T, Berry L T and Joyner M J 2001 Nitric oxide and neurally mediated
regulation of skin blood flow during local heating J. Appl. Physiol. 91 1619–1626
Nilsson G E, Tenland T and Oberg P L 1980 Evaluation of a laser Doppler flowmeter
for measurement of tissue blood flow IEEE Trans. Biomed. Eng. 27 597–604
Nuzzaci G, Evangelisti A, Righi D, Giannico G and Nuzzaci I 1999 Is there any
relationship between cold-induced vasodilatation and vasomotion? Microvasc. Res.
57 1–7
Oude Vrielink H H, Slaaf D W, Tangelder G J, Weijmer-Van Velzen S and Reneman
R S 1990 Analysis of vasomotion waveform changes during pressure reduction and
adenosine application Am. J. Physiol. 258 H29–37
Pawlowski J and Morgan K 1992 Mechanisms of intrinsic tone in ferret vascular smooth-
muscle J. Physiol.-London 448 121–132
Podtaev S, Morozov M and Frick P 2008 Wavelet-based correlations of skin temperature
and blood flow oscillations Cardiovasc. Eng. 8 185–189
Roustit M, Blaise S, Millet C and Cracowski J L 2010 Reproducibility and
methodological issues of skin post-occlusive and thermal hyperemia assessed by single-
point laser Doppler flowmetry Microvasc. Res. 79 102–108
Shiogai Y, Stefanovska A and McClintock P V E 2010 Nonlinear dynamics of
cardiovascular ageing Phys. Rep. 488 51–110

REFERENCES 23
Shusterman V, Anderson K P and Barnea O 1997 Spontaneous skin temperature
oscillations in normal human subjects Am. J. Physiol.: Regulatory Integrative Comp.
Physiol. 273 R1173–R1181
Simonet S, Bonhomme E, Fabiani J N and Verbeuren T 2000 Temperature-dependent
basal tone in isolated human saphenous veins: implication of TP-receptors Fundam.
Clin. Pharmacol. 14 461–467
Smelyanskiy V N, Luchinsky D G, Stefanovska A and McClintock P V E 2005 Inference
of a nonlinear stochastic model of the cardiorespiratory interaction Phys. Rev. Lett.
94 098101
Stefanovska A 2007 Coupled oscillators: Complex but not complicated cardiovascular
and brain interactions IEEE Eng. Med. Bio. Magazine 26 25–29
Stefanovska A and Bracic M 1999 Physics of the human cardiovascular system
Contemporary Phys. 40 31–55
Stefanovska A, Bracic M and Kvernmo H D 1999 Wavelet analysis of oscillations in the
peripheral blood circulation measured by laser Doppler technique IEEE Trans. Bio.
Med. Eng. 46 1230–1239
Thompson-Torgerson C S, Holowatz L A, Flavahan N A and Kenney W L 2007 Cold-
induced cutaneous vasoconstriction is mediated by Rho kinase in vivo in human skin
Am. J. Physiol.: Heart. Circ. Physiol. 292 H1700–H1705
Veber M, Bandrivskyy A, Clarkson P B M, McClintock P V E and Stefanovska A
2004 Wavelet analysis of blood flow dynamics: effect on the individual oscillatory
components of iontophoresis with pharmacologically neutral electrolytes Phys. Med.
Biol. 49 N111–N117
Vuksanovic V, Sheppard L W and Stefanovska A 2008 Nonlinear relationship between
level of blood flow and skin temperature for different dynamics of temperature change
Biophys. J. 94 L78–L80
Yamazaki F, Sone R, Zhao K, Alvarez G E, Kosiba W A and Johnson J M 2006 Rate
dependency and role of nitric oxide in the vascular response to direct cooling in human
skin J. Appl. Physiol. 100 42–50