Embed Size (px)
Citation preview
Oscillatory Neuronal Synchronization in Primary Visual Cortex as aCorrelate of Stimulus Selection
Pascal Fries,1* Jan-Hinrich Schroder,2* Pieter R. Roelfsema,3 Wolf Singer,2 and Andreas K. Engel4
1F. C. Donders Centre for Cognitive Neuroimaging, 6525 EK Nijmegen, The Netherlands, 2Max-Planck-Institute for BrainResearch, 60528 Frankfurt, Germany, 3Academic Medical Center, Department of Visual System Analysis/Medical Physics,1105 AZ Amsterdam, The Netherlands, and 4Research Center Julich GmbH, Institute for Medicine, Cellular NeurobiologyGroup, 52425 Julich, Germany
Spike and local field potential activity were recorded simulta-neously from multiple sites in primary visual cortex of strabis-mic cats, while monocular stimulation alternated with dichopticstimulation, inducing interocular rivalry. During interocular ri-valry, there is competition between the two nonfusible stimulipresented to the two eyes, and only one stimulus is selected atany time. We biased this competition in three different ways: (1)we exploited the condition that in strabismic cats there is oftenone dominant eye that is selected for most of the time. (2) Wepresented the two stimuli with a temporal offset, which biasescompetition in favor of the newly appearing stimulus. (3) Wepresented the two stimuli with highly different contrasts, whichbiases competition in favor of the stimulus with higher contrast.
Whenever competition was biased in favor of the stimulusactivating the recorded neurons, gamma-frequency synchroni-zation of the respective responses was enhanced, and viceversa. Firing rates showed some differences between stimula-tion conditions. However, when present, these changes wereinversely related to a competitive advantage of the respectivestimulus. We hypothesize that enhanced gamma-frequencysynchronization in primary visual cortex is a correlate of stim-ulus selection. Synchronization is likely to be translated intofiring rate changes at later processing stages.
Key words: synchronization; oscillation; gamma; strabismus;competition; rivalry; selection
When two or more stimuli are simultaneously presented in thevisual field, they often compete for the control of visual aware-ness, and only one is selected at any time (Levelt, 1965; Wolfe,1986; Blake, 1989; Desimone and Duncan, 1995). Interocularrivalry is a particularly clear case of stimulus competition and itsresolution through stimulus selection. During interocular rivalry,two highly dissimilar stimuli are presented to the two eyes. Invisual cortex, where signals from the eyes are combined, therepresentations of these stimuli cannot be integrated. Instead theycompete with each other, and in subjects with normal visualfunction, selection alternates between them (Blake, 1989).
When searching for neuronal correlates of stimulus selectionduring rivalry one needs to analyze responses that are unambig-uously associated with stimuli presented to one of the eyes (Logo-thetis and Schall, 1989; Leopold and Logothetis, 1996; Brownand Norcia, 1997; Fries et al., 1997; Sheinberg and Logothetis,1997; Polonsky et al., 2000; Tong and Engel, 2001). One strategyis to record neurons selective for particular features (Logothetisand Schall, 1989; Leopold and Logothetis, 1996; Sheinberg andLogothetis, 1997). An alternative strategy is to record fromstrabismic animals. This offers several advantages: (1) Most cells
in early visual cortex are monocular (Hubel and Wiesel, 1965),permitting unambiguous association with the stimulus of therespective eye. (2) Strabismic animals always experience intero-cular rivalry and not figural rivalry (Holopigian et al., 1988). (3)In strabismic subjects, one eye often develops perceptual domi-nance (Enoksson, 1968; von Noorden, 1990). The dominant eyestimulus benefits from a permanent competitive advantage andsuppresses the nondominant eye stimulus. This can be exploitedin the present context. Eye dominance can be determined onceand then used to predict the outcome of stimulus competitionwhen stimulus selection is not directly assessed (Fries et al., 1997,2001c).
For these reasons, we examined neuronal correlates of stimulusselection in cats that had been made strabismic at 3 weeks of age.We presented the awake cats with monocular and dichopticstimulation conditions, assessed stimulus selection by measuringeye movements, manipulated stimulus competition by varyingstimulus contrast or timing (Levelt, 1965; Wolfe, 1984; Logoth-etis and Schall, 1990; Sheinberg and Logothetis, 1997), and re-corded multiunit and field potential responses simultaneouslyfrom up to 34 cortical sites. In particular, we set out to test thehypothesis that neuronal synchronization correlates with stimulusselection (Eckhorn et al., 1988; Gray et al., 1989; Crick and Koch,1990; Engel et al., 1997; Fries et al., 1997, 2001a,b; Lumer, 1998;Tononi et al., 1998; Srinivasan et al., 1999). Synchronization canincrease the impact of neuronal firing on postsynaptic neurons(Alonso et al., 1996; Azouz and Gray, 2000) and thus could serveas a mechanism of stimulus selection. We had earlier demon-strated that synchronization in primary and secondary visualcortex correlates with stimulus selection (Fries et al., 1997). In thepresent study, we extend these findings by reporting data from
Received May 29, 2001; revised Jan. 30, 2002; accepted Feb. 7, 2002.This research was supported by the Max-Planck-Gesellschaft, by the Heisenberg
Program of the Deutsche Forschungsgemeinschaft Grants EN 203/4–1/4–2, and bythe Minna-James-Heineman Foundation. We thank P. Konig for participation in theinitial experiments, K.-P. Hoffmann for helpful advice, J. H. Reynolds for commentson this manuscript, M. Stephan for support in software development, and C.Selignow for technical assistance.
*P.F. and J.-H.S. contributed equally to this workCorrespondence should be addressed to Pascal Fries, F. C. Donders Centre for
Cognitive Neuroimaging, Adelbertusplein 1, 6525 EK Nijmegen, The Netherlands.E-mail: [email protected] © 2002 Society for Neuroscience 0270-6474/02/223739-16$15.00/0
The Journal of Neuroscience, May 1, 2002, 22(9):3739–3754
experiments in which stimulus selection was biased by a variety ofdifferent procedures. In particular, we combined paradigms forstimulus selection that use strabismic eye dominance with newparadigms that are independent of strabismic eye dominance.
MATERIALS AND METHODSInduction of strabismus. All experimental procedures were in accordancewith the German Law for the Protection of Experimental Animals andconformed with National Institutes of Health and Society for Neuro-science regulations. In 14 cats, we induced convergent and in four catsdivergent strabismus at the age of 3 weeks. Convergent (esotropic)strabismus was induced by transecting the tendon of the lateral rectusmuscle of the right eye, whereas divergent (exotropic) strabismus wasproduced by transecting the tendon of the medial rectus muscle of the lefteye. The surgery was performed under combined ketamine (10 mg/kg,i.m.) and xylazine (2 mg/kg, i.m.) anesthesia.
Measurement of visual acuity. Convergent strabismus frequently leadsto amblyopia, an impairment of vision caused by abnormal developmentof cortical functions (Levi and Klein, 1985; von Noorden, 1990). Becauseamblyopia is associated with the suppression of signals conveyed by theamblyopic eye, we tested the esotropic cats for amblyopia by measuringmonocular visual acuity at the age of 4–5 months, when visual acuity hasreached stable adult levels (Freeman and Marg, 1975; Mitchell et al.,1976). The animals were mildly food deprived (�10% weight loss) andtrained to discriminate between square wave gratings of varying spatialfrequency and equiluminant gray (Teller acuity cards; contrast 82–84%;luminance, 25 cd/m 2) on a modified jumping stand (Mitchell et al., 1976;Roelfsema et al., 1994; Fries et al., 1997). Jumps to the grating wererewarded. The cats were tested through the normal and the squinting eyeon alternate days, the respective other eye being occluded by an opaquecontact lens during testing. Each eye was tested on at least three differentdays, and a test session was continued until the cat stopped jumpingspontaneously. The spatial frequencies of the cards were continuouslyadjusted to the performance of the animal, ranged from 0.21 to 14.2cycles/° and were separated by 0.5 octave steps. After an incorrectresponse, the spatial frequency was reduced by one step. After a correctresponse it was increased by one step with a probability of 33%. For eacheye, a minimum of 180 jumps were obtained. The resulting psychometricfunctions were fitted with a logistic function P(x) � 0.5 � 0.5(1 �(x/a)b) �1, where P denotes performance (50% is chance level), x thespatial frequency, a the spatial frequency at which the animal performedat the 75% level (this was taken as the discrimination threshold), and bthe slope. For the discrimination thresholds of the two eyes, 95% confi-dence intervals were calculated using a Monte Carlo simulation (Press etal., 1992). Animals were considered to be amblyopic if the discriminationthresholds of the two eyes differed by at least one octave and if the 95%confidence intervals for the respective discrimination thresholds werenonoverlapping. In 13 of the 14 esotropic cats, monocular visual acuityfor the two eyes could be determined. Four of the 13 successfully testedcats (31%) had developed amblyopia, as determined by a significantreduction in the visual acuity of one eye. In the remaining nine animals,grating acuities did not differ significantly for the two eyes. For this study,we selected a total of eight cats: three of the esotropic cats that wereidentified by testing as nonamblyopic, as well as one esotropic cat thathad refused to perform the jumping stand test and four exotropic cats.The latter were not tested for visual acuity because exotropic cats usuallydo not develop amblyopia (Ikeda and Tremain, 1979; Jacobson andIkeda, 1979; Mower and Duffy, 1983; Mitchell et al., 1984; von Noorden,1990).
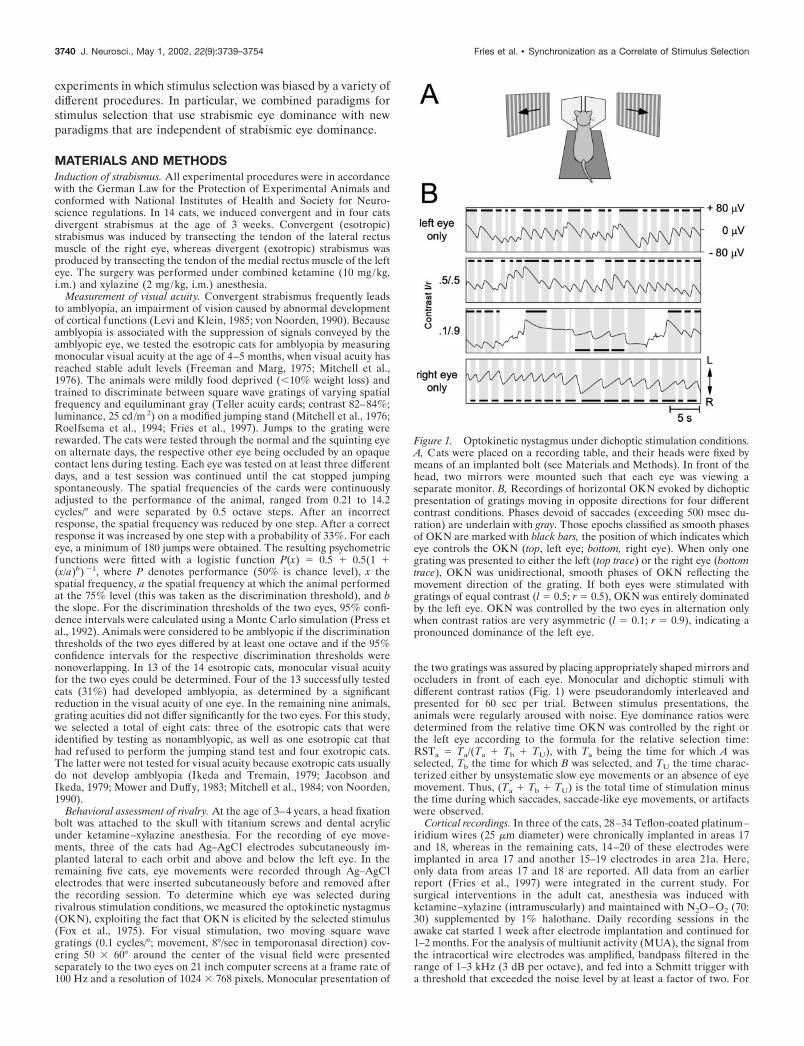
Behavioral assessment of rivalry. At the age of 3–4 years, a head fixationbolt was attached to the skull with titanium screws and dental acrylicunder ketamine–xylazine anesthesia. For the recording of eye move-ments, three of the cats had Ag–AgCl electrodes subcutaneously im-planted lateral to each orbit and above and below the left eye. In theremaining five cats, eye movements were recorded through Ag–AgClelectrodes that were inserted subcutaneously before and removed afterthe recording session. To determine which eye was selected duringrivalrous stimulation conditions, we measured the optokinetic nystagmus(OKN), exploiting the fact that OKN is elicited by the selected stimulus(Fox et al., 1975). For visual stimulation, two moving square wavegratings (0.1 cycles/°; movement, 8°/sec in temporonasal direction) cov-ering 50 � 60° around the center of the visual field were presentedseparately to the two eyes on 21 inch computer screens at a frame rate of100 Hz and a resolution of 1024 � 768 pixels. Monocular presentation of
the two gratings was assured by placing appropriately shaped mirrors andoccluders in front of each eye. Monocular and dichoptic stimuli withdifferent contrast ratios (Fig. 1) were pseudorandomly interleaved andpresented for 60 sec per trial. Between stimulus presentations, theanimals were regularly aroused with noise. Eye dominance ratios weredetermined from the relative time OKN was controlled by the right orthe left eye according to the formula for the relative selection time:RSTa � Ta/(Ta � Tb � TU), with Ta being the time for which A wasselected, Tb the time for which B was selected, and TU the time charac-terized either by unsystematic slow eye movements or an absence of eyemovement. Thus, (Ta � Tb � TU) is the total time of stimulation minusthe time during which saccades, saccade-like eye movements, or artifactswere observed.
Cortical recordings. In three of the cats, 28–34 Teflon-coated platinum–iridium wires (25 �m diameter) were chronically implanted in areas 17and 18, whereas in the remaining cats, 14–20 of these electrodes wereimplanted in area 17 and another 15–19 electrodes in area 21a. Here,only data from areas 17 and 18 are reported. All data from an earlierreport (Fries et al., 1997) were integrated in the current study. Forsurgical interventions in the adult cat, anesthesia was induced withketamine–xylazine (intramuscularly) and maintained with N2O–O2 (70:30) supplemented by 1% halothane. Daily recording sessions in theawake cat started 1 week after electrode implantation and continued for1–2 months. For the analysis of multiunit activity (MUA), the signal fromthe intracortical wire electrodes was amplified, bandpass filtered in therange of 1–3 kHz (3 dB per octave), and fed into a Schmitt trigger witha threshold that exceeded the noise level by at least a factor of two. For
Figure 1. Optokinetic nystagmus under dichoptic stimulation conditions.A, Cats were placed on a recording table, and their heads were fixed bymeans of an implanted bolt (see Materials and Methods). In front of thehead, two mirrors were mounted such that each eye was viewing aseparate monitor. B, Recordings of horizontal OKN evoked by dichopticpresentation of gratings moving in opposite directions for four differentcontrast conditions. Phases devoid of saccades (exceeding 500 msec du-ration) are underlain with gray. Those epochs classified as smooth phasesof OKN are marked with black bars, the position of which indicates whicheye controls the OKN (top, left eye; bottom, right eye). When only onegrating was presented to either the left (top trace) or the right eye (bottomtrace), OKN was unidirectional, smooth phases of OKN reflecting themovement direction of the grating. If both eyes were stimulated withgratings of equal contrast (l � 0.5; r � 0.5), OKN was entirely dominatedby the left eye. OKN was controlled by the two eyes in alternation onlywhen contrast ratios are very asymmetric (l � 0.1; r � 0.9), indicating apronounced dominance of the left eye.
3740 J. Neurosci., May 1, 2002, 22(9):3739–3754 Fries et al. • Synchronization as a Correlate of Stimulus Selection
the analysis of local field potentials (LFP), the signal from the recordingelectrodes was bandpass filtered between 1 and 100 Hz. Both the outputpulses of the Schmitt triggers as well as the LFP signals were digitized ata temporal resolution of 1 msec.
Visual stimulation. Responses were elicited by moving gratings with thesame parameters as those used for OKN measurements, except that nowtheir orientation was changed in steps of 45° to obtain joint responsesfrom as many pairs of recording sites as possible, and direction of motionwas reversed every 1.5 sec to prevent eye movements (see below).Individual trials lasted for 9 sec (stimulus onset after 3 sec), and aparticular stimulation condition was repeated at least 40 times andinterleaved in a pseudorandom sequence with other conditions. Thestimuli were presented for only 6 sec to prevent switches in perceptualselection during the correlation measurements. The previous OKN mea-surements had revealed that the dominant eye was consistently selectedat the beginning of stimulation, the first switches in perceptual selectionoccurring only after tens of seconds. The same holds for human subjectsin which, even with small asymmetries in eye dominance, it is also thedominant eye that initiates nystagmus after stimulus onset (Enoksson,1968).
The stimuli were presented either monocularly or binocularly. Most ofthe neurons in primary visual cortex of strabismic cats are monocular(Hubel and Wiesel, 1965), and we call the stimulus presented to the eyethat actually activates the cells the “activating” stimulus (and the respec-tive eye the “activating” eye), whereas the stimulus presented to the
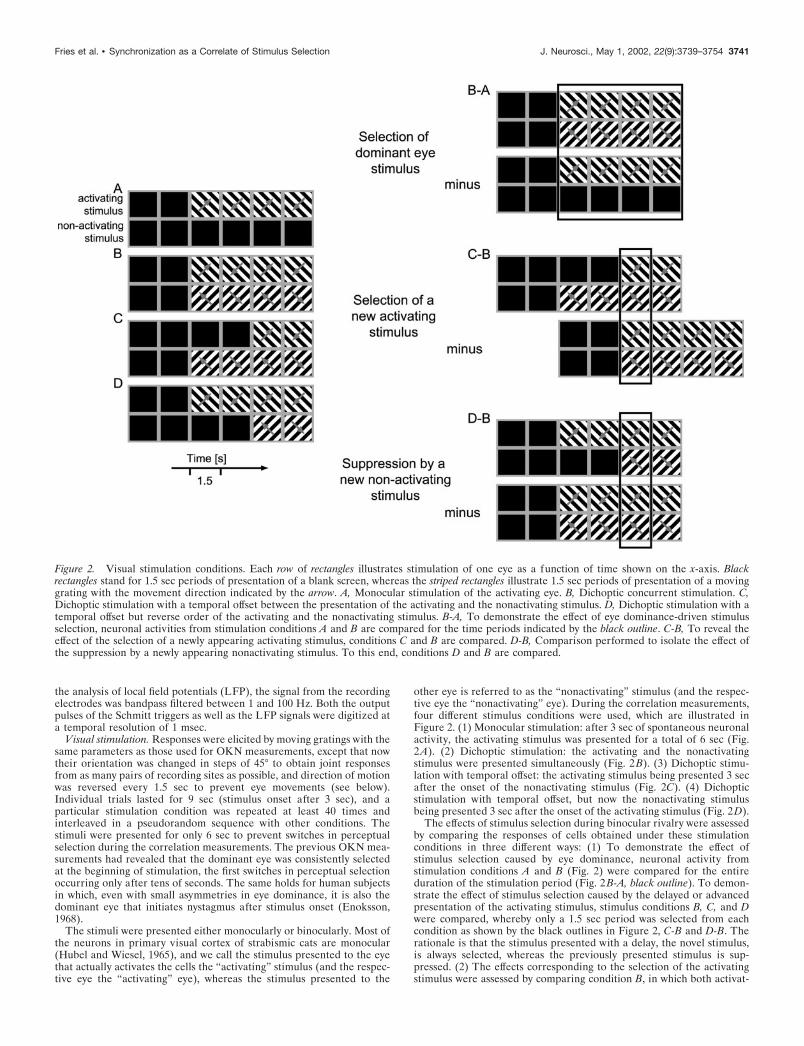
other eye is referred to as the “nonactivating” stimulus (and the respec-tive eye the “nonactivating” eye). During the correlation measurements,four different stimulus conditions were used, which are illustrated inFigure 2. (1) Monocular stimulation: after 3 sec of spontaneous neuronalactivity, the activating stimulus was presented for a total of 6 sec (Fig.2 A). (2) Dichoptic stimulation: the activating and the nonactivatingstimulus were presented simultaneously (Fig. 2 B). (3) Dichoptic stimu-lation with temporal offset: the activating stimulus being presented 3 secafter the onset of the nonactivating stimulus (Fig. 2C). (4) Dichopticstimulation with temporal offset, but now the nonactivating stimulusbeing presented 3 sec after the onset of the activating stimulus (Fig. 2 D).
The effects of stimulus selection during binocular rivalry were assessedby comparing the responses of cells obtained under these stimulationconditions in three different ways: (1) To demonstrate the effect ofstimulus selection caused by eye dominance, neuronal activity fromstimulation conditions A and B (Fig. 2) were compared for the entireduration of the stimulation period (Fig. 2 B-A, black outline). To demon-strate the effect of stimulus selection caused by the delayed or advancedpresentation of the activating stimulus, stimulus conditions B, C, and Dwere compared, whereby only a 1.5 sec period was selected from eachcondition as shown by the black outlines in Figure 2, C-B and D-B. Therationale is that the stimulus presented with a delay, the novel stimulus,is always selected, whereas the previously presented stimulus is sup-pressed. (2) The effects corresponding to the selection of the activatingstimulus were assessed by comparing condition B, in which both activat-
Figure 2. Visual stimulation conditions. Each row of rectangles illustrates stimulation of one eye as a function of time shown on the x-axis. Blackrectangles stand for 1.5 sec periods of presentation of a blank screen, whereas the striped rectangles illustrate 1.5 sec periods of presentation of a movinggrating with the movement direction indicated by the arrow. A, Monocular stimulation of the activating eye. B, Dichoptic concurrent stimulation. C,Dichoptic stimulation with a temporal offset between the presentation of the activating and the nonactivating stimulus. D, Dichoptic stimulation with atemporal offset but reverse order of the activating and the nonactivating stimulus. B-A, To demonstrate the effect of eye dominance-driven stimulusselection, neuronal activities from stimulation conditions A and B are compared for the time periods indicated by the black outline. C-B, To reveal theeffect of the selection of a newly appearing activating stimulus, conditions C and B are compared. D-B, Comparison performed to isolate the effect ofthe suppression by a newly appearing nonactivating stimulus. To this end, conditions D and B are compared.
Fries et al. • Synchronization as a Correlate of Stimulus Selection J. Neurosci., May 1, 2002, 22(9):3739–3754 3741
ing and nonactivating stimuli were presented simultaneously, with con-dition C where the activating stimulus was delayed. The respective epochis highlighted by the black outline in Figure 2C-B. (3) To determine theeffect of suppression of the activating stimulus by the newly appearingnonactivating stimulus, condition B was compared with condition D, inwhich the nonactivating stimulus was delayed. The respective epoch ishighlighted by the black outline in Figure 2 D-B. The effects associatedwith selection and suppression of the activating stimulus, caused bytemporal offset, were similar irrespective of whether the activating stim-ulus was presented to the dominant or the nondominant eye. We there-fore pooled the results from sessions in which the activating stimulus waspresented to the dominant and the nondominant eye, respectively.
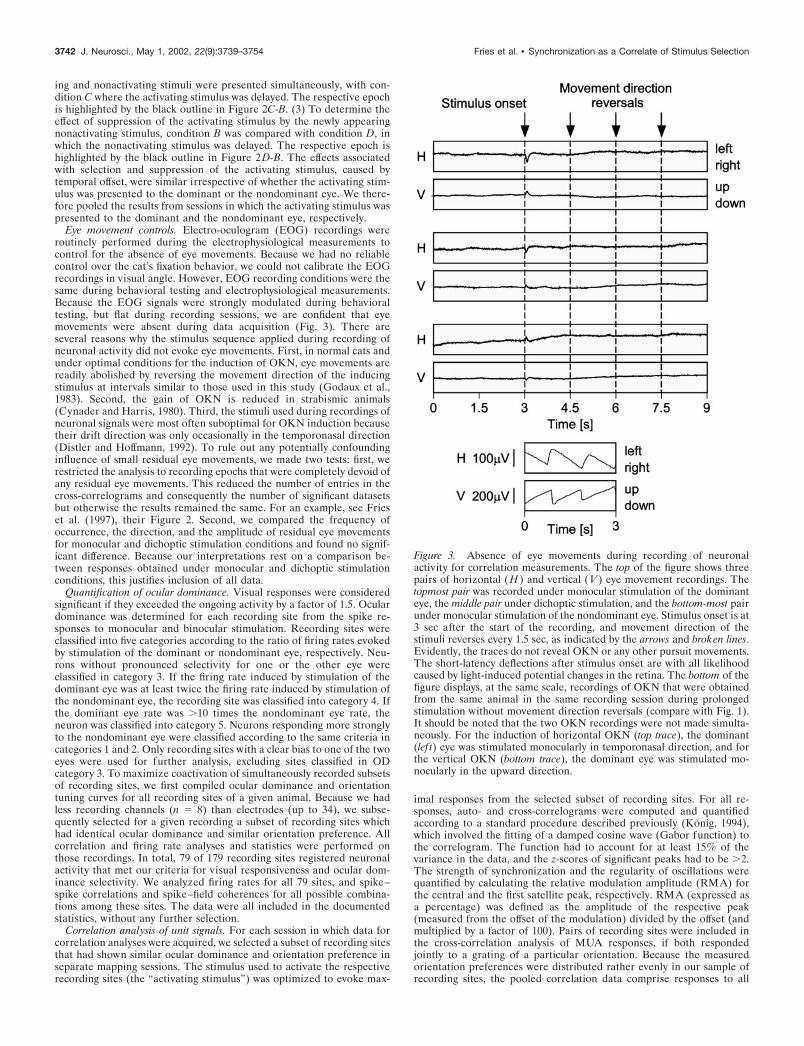
Eye movement controls. Electro-oculogram (EOG) recordings wereroutinely performed during the electrophysiological measurements tocontrol for the absence of eye movements. Because we had no reliablecontrol over the cat’s fixation behavior, we could not calibrate the EOGrecordings in visual angle. However, EOG recording conditions were thesame during behavioral testing and electrophysiological measurements.Because the EOG signals were strongly modulated during behavioraltesting, but flat during recording sessions, we are confident that eyemovements were absent during data acquisition (Fig. 3). There areseveral reasons why the stimulus sequence applied during recording ofneuronal activity did not evoke eye movements. First, in normal cats andunder optimal conditions for the induction of OKN, eye movements arereadily abolished by reversing the movement direction of the inducingstimulus at intervals similar to those used in this study (Godaux et al.,1983). Second, the gain of OKN is reduced in strabismic animals(Cynader and Harris, 1980). Third, the stimuli used during recordings ofneuronal signals were most often suboptimal for OKN induction becausetheir drift direction was only occasionally in the temporonasal direction(Distler and Hoffmann, 1992). To rule out any potentially confoundinginfluence of small residual eye movements, we made two tests: first, werestricted the analysis to recording epochs that were completely devoid ofany residual eye movements. This reduced the number of entries in thecross-correlograms and consequently the number of significant datasetsbut otherwise the results remained the same. For an example, see Frieset al. (1997), their Figure 2. Second, we compared the frequency ofoccurrence, the direction, and the amplitude of residual eye movementsfor monocular and dichoptic stimulation conditions and found no signif-icant difference. Because our interpretations rest on a comparison be-tween responses obtained under monocular and dichoptic stimulationconditions, this justifies inclusion of all data.
Quantification of ocular dominance. Visual responses were consideredsignificant if they exceeded the ongoing activity by a factor of 1.5. Oculardominance was determined for each recording site from the spike re-sponses to monocular and binocular stimulation. Recording sites wereclassified into five categories according to the ratio of firing rates evokedby stimulation of the dominant or nondominant eye, respectively. Neu-rons without pronounced selectivity for one or the other eye wereclassified in category 3. If the firing rate induced by stimulation of thedominant eye was at least twice the firing rate induced by stimulation ofthe nondominant eye, the recording site was classified into category 4. Ifthe dominant eye rate was �10 times the nondominant eye rate, theneuron was classified into category 5. Neurons responding more stronglyto the nondominant eye were classified according to the same criteria incategories 1 and 2. Only recording sites with a clear bias to one of the twoeyes were used for further analysis, excluding sites classified in ODcategory 3. To maximize coactivation of simultaneously recorded subsetsof recording sites, we first compiled ocular dominance and orientationtuning curves for all recording sites of a given animal. Because we hadless recording channels (n � 8) than electrodes (up to 34), we subse-quently selected for a given recording a subset of recording sites whichhad identical ocular dominance and similar orientation preference. Allcorrelation and firing rate analyses and statistics were performed onthose recordings. In total, 79 of 179 recording sites registered neuronalactivity that met our criteria for visual responsiveness and ocular dom-inance selectivity. We analyzed firing rates for all 79 sites, and spike–spike correlations and spike–field coherences for all possible combina-tions among these sites. The data were all included in the documentedstatistics, without any further selection.
Correlation analysis of unit signals. For each session in which data forcorrelation analyses were acquired, we selected a subset of recording sitesthat had shown similar ocular dominance and orientation preference inseparate mapping sessions. The stimulus used to activate the respectiverecording sites (the “activating stimulus”) was optimized to evoke max-
imal responses from the selected subset of recording sites. For all re-sponses, auto- and cross-correlograms were computed and quantifiedaccording to a standard procedure described previously (Konig, 1994),which involved the fitting of a damped cosine wave (Gabor function) tothe correlogram. The function had to account for at least 15% of thevariance in the data, and the z-scores of significant peaks had to be �2.The strength of synchronization and the regularity of oscillations werequantified by calculating the relative modulation amplitude (RMA) forthe central and the first satellite peak, respectively. RMA (expressed asa percentage) was defined as the amplitude of the respective peak(measured from the offset of the modulation) divided by the offset (andmultiplied by a factor of 100). Pairs of recording sites were included inthe cross-correlation analysis of MUA responses, if both respondedjointly to a grating of a particular orientation. Because the measuredorientation preferences were distributed rather evenly in our sample ofrecording sites, the pooled correlation data comprise responses to all
Figure 3. Absence of eye movements during recording of neuronalactivity for correlation measurements. The top of the figure shows threepairs of horizontal ( H ) and vertical ( V ) eye movement recordings. Thetopmost pair was recorded under monocular stimulation of the dominanteye, the middle pair under dichoptic stimulation, and the bottom-most pairunder monocular stimulation of the nondominant eye. Stimulus onset is at3 sec after the start of the recording, and movement direction of thestimuli reverses every 1.5 sec, as indicated by the arrows and broken lines.Evidently, the traces do not reveal OKN or any other pursuit movements.The short-latency deflections after stimulus onset are with all likelihoodcaused by light-induced potential changes in the retina. The bottom of thefigure displays, at the same scale, recordings of OKN that were obtainedfrom the same animal in the same recording session during prolongedstimulation without movement direction reversals (compare with Fig. 1).It should be noted that the two OKN recordings were not made simulta-neously. For the induction of horizontal OKN (top trace), the dominant(lef t) eye was stimulated monocularly in temporonasal direction, and forthe vertical OKN (bottom trace), the dominant eye was stimulated mo-nocularly in the upward direction.
3742 J. Neurosci., May 1, 2002, 22(9):3739–3754 Fries et al. • Synchronization as a Correlate of Stimulus Selection
possible orientations and drift directions. To avoid contamination of thecorrelograms by transient responses to stimulus onset, we selected fordata analysis either the response epoch between the first and second, orthe epoch between the second and third reversal of stimulus motion,depending on where the product of the firing rates was larger (compareFig. 2). Furthermore, we discarded the first 100 msec after stimulusmovement reversals to avoid response transients. For the analysis of theeffects of stimulus selection caused by temporal stimulus offset, we onlyused the first 1.5 sec period after the onset of the second stimulus to besure to analyze data from an epoch during which the newly appearingstimulus was selected and the already present one suppressed.
Analysis of LFP signals. LFP signals were analyzed by calculation ofspike-triggered averages (STAs). To this end, LFPs were averaged withina window of �128 msec centered on each trigger spike (Fries et al., 1997,2001b). Response epochs were selected for analysis as described above.To obtain a measure of synchronization between spikes and LFP that is
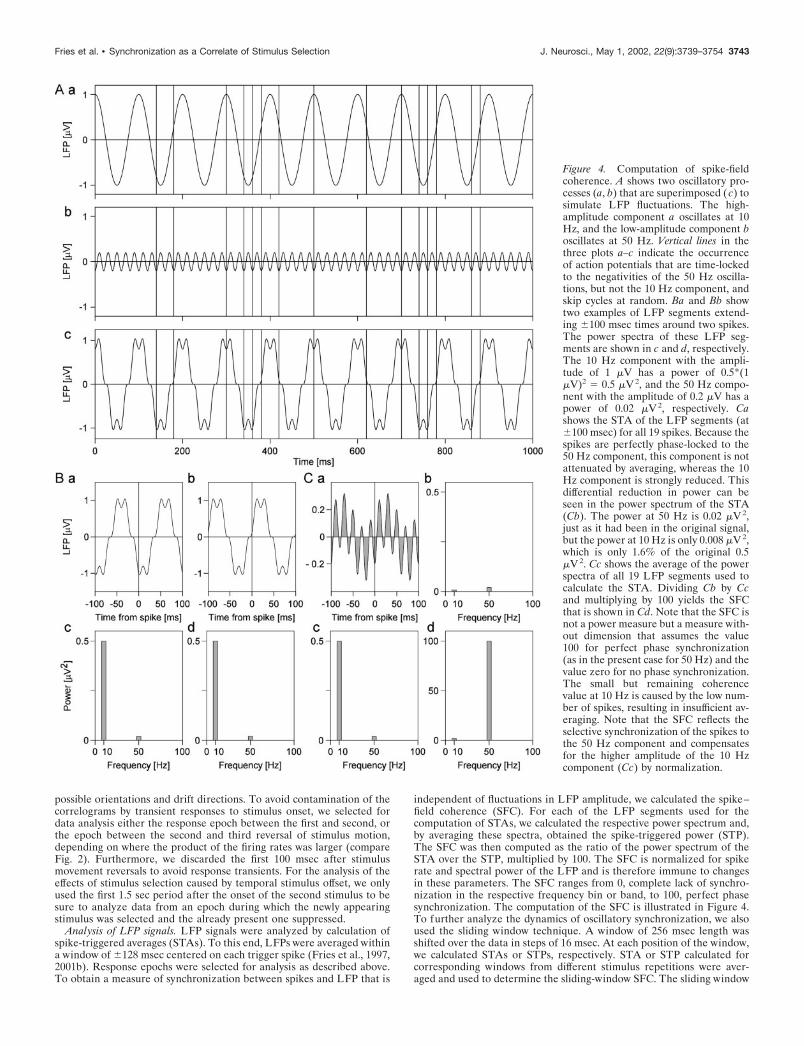
independent of fluctuations in LFP amplitude, we calculated the spike–field coherence (SFC). For each of the LFP segments used for thecomputation of STAs, we calculated the respective power spectrum and,by averaging these spectra, obtained the spike-triggered power (STP).The SFC was then computed as the ratio of the power spectrum of theSTA over the STP, multiplied by 100. The SFC is normalized for spikerate and spectral power of the LFP and is therefore immune to changesin these parameters. The SFC ranges from 0, complete lack of synchro-nization in the respective frequency bin or band, to 100, perfect phasesynchronization. The computation of the SFC is illustrated in Figure 4.To further analyze the dynamics of oscillatory synchronization, we alsoused the sliding window technique. A window of 256 msec length wasshifted over the data in steps of 16 msec. At each position of the window,we calculated STAs or STPs, respectively. STA or STP calculated forcorresponding windows from different stimulus repetitions were aver-aged and used to determine the sliding-window SFC. The sliding window
Figure 4. Computation of spike-fieldcoherence. A shows two oscillatory pro-cesses (a, b) that are superimposed ( c) tosimulate LFP fluctuations. The high-amplitude component a oscillates at 10Hz, and the low-amplitude component boscillates at 50 Hz. Vertical lines in thethree plots a–c indicate the occurrenceof action potentials that are time-lockedto the negativities of the 50 Hz oscilla-tions, but not the 10 Hz component, andskip cycles at random. Ba and Bb showtwo examples of LFP segments extend-ing �100 msec times around two spikes.The power spectra of these LFP seg-ments are shown in c and d, respectively.The 10 Hz component with the ampli-tude of 1 �V has a power of 0.5*(1�V)2 � 0.5 �V 2, and the 50 Hz compo-nent with the amplitude of 0.2 �V has apower of 0.02 �V 2, respectively. Cashows the STA of the LFP segments (at�100 msec) for all 19 spikes. Because thespikes are perfectly phase-locked to the50 Hz component, this component is notattenuated by averaging, whereas the 10Hz component is strongly reduced. Thisdifferential reduction in power can beseen in the power spectrum of the STA(Cb). The power at 50 Hz is 0.02 �V 2,just as it had been in the original signal,but the power at 10 Hz is only 0.008 �V 2,which is only 1.6% of the original 0.5�V 2. Cc shows the average of the powerspectra of all 19 LFP segments used tocalculate the STA. Dividing Cb by Ccand multiplying by 100 yields the SFCthat is shown in Cd. Note that the SFC isnot a power measure but a measure with-out dimension that assumes the value100 for perfect phase synchronization(as in the present case for 50 Hz) and thevalue zero for no phase synchronization.The small but remaining coherencevalue at 10 Hz is caused by the low num-ber of spikes, resulting in insufficient av-eraging. Note that the SFC reflects theselective synchronization of the spikes tothe 50 Hz component and compensatesfor the higher amplitude of the 10 Hzcomponent (Cc) by normalization.
Fries et al. • Synchronization as a Correlate of Stimulus Selection J. Neurosci., May 1, 2002, 22(9):3739–3754 3743
analysis was done for the entire trial, including a 3 sec period beforestimulus onset and times around stimulus onset and movement reversals.
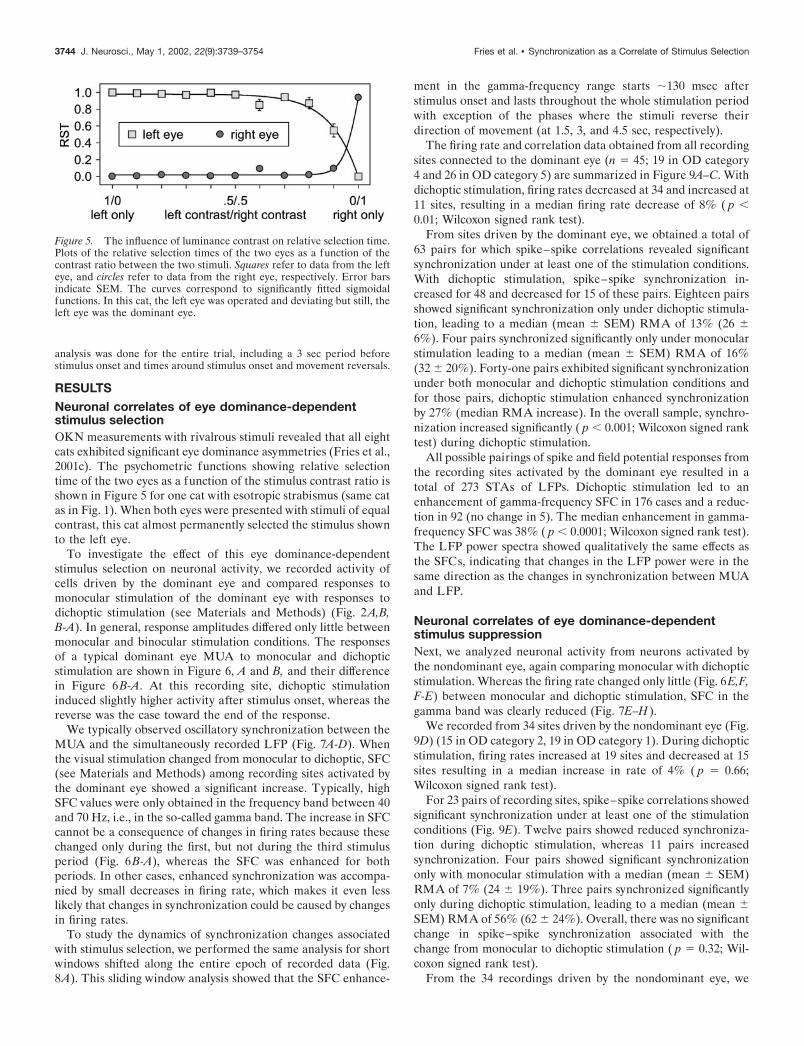
RESULTSNeuronal correlates of eye dominance-dependentstimulus selectionOKN measurements with rivalrous stimuli revealed that all eightcats exhibited significant eye dominance asymmetries (Fries et al.,2001c). The psychometric functions showing relative selectiontime of the two eyes as a function of the stimulus contrast ratio isshown in Figure 5 for one cat with esotropic strabismus (same catas in Fig. 1). When both eyes were presented with stimuli of equalcontrast, this cat almost permanently selected the stimulus shownto the left eye.
To investigate the effect of this eye dominance-dependentstimulus selection on neuronal activity, we recorded activity ofcells driven by the dominant eye and compared responses tomonocular stimulation of the dominant eye with responses todichoptic stimulation (see Materials and Methods) (Fig. 2A,B,B-A). In general, response amplitudes differed only little betweenmonocular and binocular stimulation conditions. The responsesof a typical dominant eye MUA to monocular and dichopticstimulation are shown in Figure 6, A and B, and their differencein Figure 6B-A. At this recording site, dichoptic stimulationinduced slightly higher activity after stimulus onset, whereas thereverse was the case toward the end of the response.
We typically observed oscillatory synchronization between theMUA and the simultaneously recorded LFP (Fig. 7A-D). Whenthe visual stimulation changed from monocular to dichoptic, SFC(see Materials and Methods) among recording sites activated bythe dominant eye showed a significant increase. Typically, highSFC values were only obtained in the frequency band between 40and 70 Hz, i.e., in the so-called gamma band. The increase in SFCcannot be a consequence of changes in firing rates because thesechanged only during the first, but not during the third stimulusperiod (Fig. 6B-A), whereas the SFC was enhanced for bothperiods. In other cases, enhanced synchronization was accompa-nied by small decreases in firing rate, which makes it even lesslikely that changes in synchronization could be caused by changesin firing rates.
To study the dynamics of synchronization changes associatedwith stimulus selection, we performed the same analysis for shortwindows shifted along the entire epoch of recorded data (Fig.8A). This sliding window analysis showed that the SFC enhance-
ment in the gamma-frequency range starts �130 msec afterstimulus onset and lasts throughout the whole stimulation periodwith exception of the phases where the stimuli reverse theirdirection of movement (at 1.5, 3, and 4.5 sec, respectively).
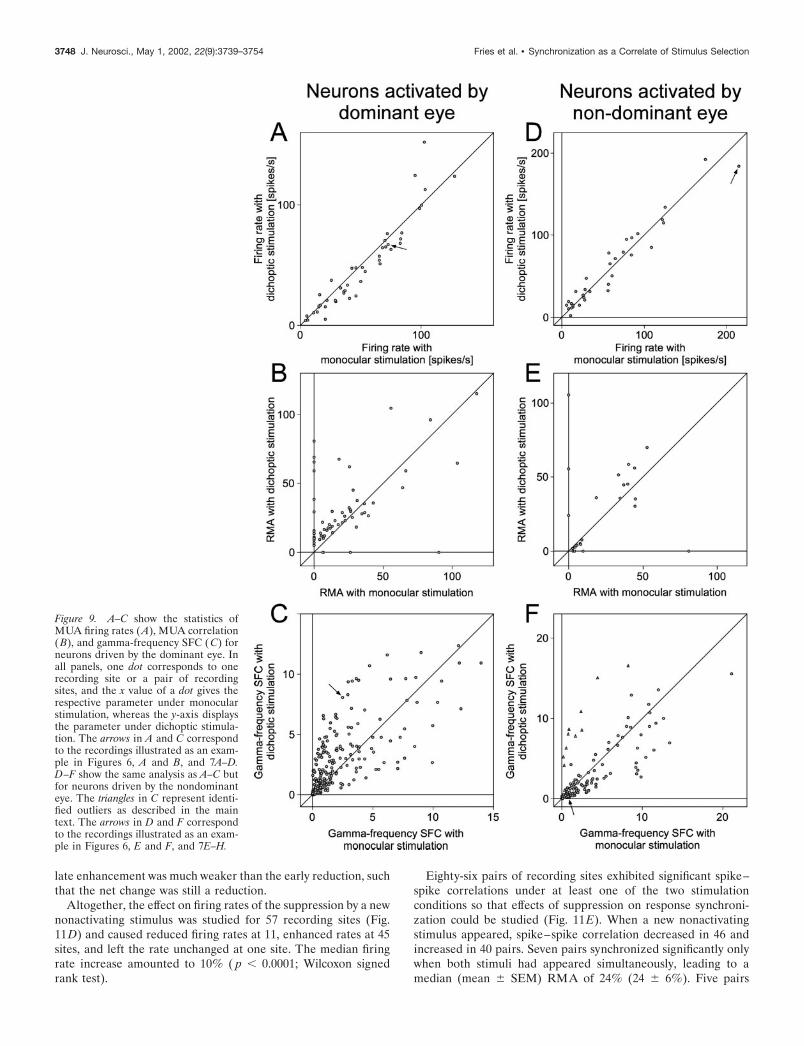
The firing rate and correlation data obtained from all recordingsites connected to the dominant eye (n � 45; 19 in OD category4 and 26 in OD category 5) are summarized in Figure 9A–C. Withdichoptic stimulation, firing rates decreased at 34 and increased at11 sites, resulting in a median firing rate decrease of 8% ( p �0.01; Wilcoxon signed rank test).
From sites driven by the dominant eye, we obtained a total of63 pairs for which spike–spike correlations revealed significantsynchronization under at least one of the stimulation conditions.With dichoptic stimulation, spike–spike synchronization in-creased for 48 and decreased for 15 of these pairs. Eighteen pairsshowed significant synchronization only under dichoptic stimula-tion, leading to a median (mean � SEM) RMA of 13% (26 �6%). Four pairs synchronized significantly only under monocularstimulation leading to a median (mean � SEM) RMA of 16%(32 � 20%). Forty-one pairs exhibited significant synchronizationunder both monocular and dichoptic stimulation conditions andfor those pairs, dichoptic stimulation enhanced synchronizationby 27% (median RMA increase). In the overall sample, synchro-nization increased significantly ( p � 0.001; Wilcoxon signed ranktest) during dichoptic stimulation.
All possible pairings of spike and field potential responses fromthe recording sites activated by the dominant eye resulted in atotal of 273 STAs of LFPs. Dichoptic stimulation led to anenhancement of gamma-frequency SFC in 176 cases and a reduc-tion in 92 (no change in 5). The median enhancement in gamma-frequency SFC was 38% ( p � 0.0001; Wilcoxon signed rank test).The LFP power spectra showed qualitatively the same effects asthe SFCs, indicating that changes in the LFP power were in thesame direction as the changes in synchronization between MUAand LFP.
Neuronal correlates of eye dominance-dependentstimulus suppressionNext, we analyzed neuronal activity from neurons activated bythe nondominant eye, again comparing monocular with dichopticstimulation. Whereas the firing rate changed only little (Fig. 6E,F,F-E) between monocular and dichoptic stimulation, SFC in thegamma band was clearly reduced (Fig. 7E–H).
We recorded from 34 sites driven by the nondominant eye (Fig.9D) (15 in OD category 2, 19 in OD category 1). During dichopticstimulation, firing rates increased at 19 sites and decreased at 15sites resulting in a median increase in rate of 4% ( p � 0.66;Wilcoxon signed rank test).
For 23 pairs of recording sites, spike–spike correlations showedsignificant synchronization under at least one of the stimulationconditions (Fig. 9E). Twelve pairs showed reduced synchroniza-tion during dichoptic stimulation, whereas 11 pairs increasedsynchronization. Four pairs showed significant synchronizationonly with monocular stimulation with a median (mean � SEM)RMA of 7% (24 � 19%). Three pairs synchronized significantlyonly during dichoptic stimulation, leading to a median (mean �SEM) RMA of 56% (62 � 24%). Overall, there was no significantchange in spike–spike synchronization associated with thechange from monocular to dichoptic stimulation ( p � 0.32; Wil-coxon signed rank test).
From the 34 recordings driven by the nondominant eye, we
Figure 5. The influence of luminance contrast on relative selection time.Plots of the relative selection times of the two eyes as a function of thecontrast ratio between the two stimuli. Squares refer to data from the lefteye, and circles refer to data from the right eye, respectively. Error barsindicate SEM. The curves correspond to significantly fitted sigmoidalfunctions. In this cat, the left eye was operated and deviating but still, theleft eye was the dominant eye.
3744 J. Neurosci., May 1, 2002, 22(9):3739–3754 Fries et al. • Synchronization as a Correlate of Stimulus Selection
obtained 151 STAs of LFPs. During dichoptic stimulation,gamma-frequency SFC was reduced in 80 and enhanced in 71cases, amounting to a median reduction of the SFC in the gamma-frequency range of 4% ( p � 0.05; Wilcoxon signed rank test). Inthe respective scatter plot (Fig. 9F), there was an obvious cluster
of outliers (triangles). All these outliers came from STAs thatwere computed using spikes of two recording sites. When theseSTAs were excluded, the statistics showed a highly significantmedian reduction in gamma-frequency SFC of 15% ( p � 0.0001;Wilcoxon signed rank test) for dichoptic stimulation.
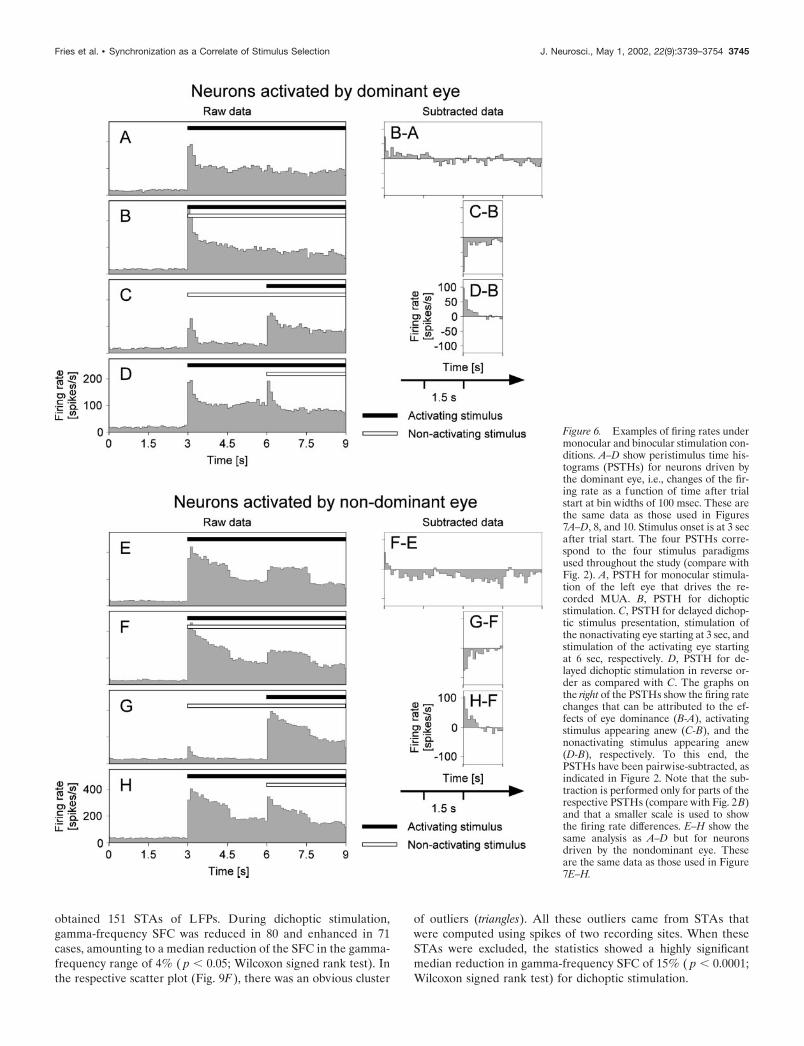
Figure 6. Examples of firing rates undermonocular and binocular stimulation con-ditions. A–D show peristimulus time his-tograms (PSTHs) for neurons driven bythe dominant eye, i.e., changes of the fir-ing rate as a function of time after trialstart at bin widths of 100 msec. These arethe same data as those used in Figures7A–D, 8, and 10. Stimulus onset is at 3 secafter trial start. The four PSTHs corre-spond to the four stimulus paradigmsused throughout the study (compare withFig. 2). A, PSTH for monocular stimula-tion of the left eye that drives the re-corded MUA. B, PSTH for dichopticstimulation. C, PSTH for delayed dichop-tic stimulus presentation, stimulation ofthe nonactivating eye starting at 3 sec, andstimulation of the activating eye startingat 6 sec, respectively. D, PSTH for de-layed dichoptic stimulation in reverse or-der as compared with C. The graphs onthe right of the PSTHs show the firing ratechanges that can be attributed to the ef-fects of eye dominance (B-A), activatingstimulus appearing anew (C-B), and thenonactivating stimulus appearing anew(D-B), respectively. To this end, thePSTHs have been pairwise-subtracted, asindicated in Figure 2. Note that the sub-traction is performed only for parts of therespective PSTHs (compare with Fig. 2B)and that a smaller scale is used to showthe firing rate differences. E–H show thesame analysis as A–D but for neuronsdriven by the nondominant eye. Theseare the same data as those used in Figure7E–H.
Fries et al. • Synchronization as a Correlate of Stimulus Selection J. Neurosci., May 1, 2002, 22(9):3739–3754 3745
Neuronal correlates of the selection of a new stimulusWhen rivalrous stimuli are presented with temporal offset, thenewly appearing stimulus benefits from a competitive advantageand is selected, irrespective of eye dominance (Wolfe, 1984;Sheinberg and Logothetis, 1997). To study the neuronal corre-lates of the selection of a new stimulus, we compared neuronalactivity for two conditions: in the first condition, the activatingstimulus of the recorded neurons appeared simultaneously withthe competing nonactivating stimulus (Fig. 2B). In the secondcondition, the nonactivating stimulus of the neurons had been onfor 3 sec before the activating stimulus appeared (Fig. 2C). Thus,in the latter condition, the activating stimulus had a competitiveadvantage and should have been selected.
Comparison of these two conditions as illustrated in Figure2C-B revealed that, in most cases, the firing rate was slightly lowerwhen the activating stimulus was the new stimulus. An examplefor this effect is illustrated in Figure 6C-B. In contrast to the firingrate, SFC in the gamma-band was clearly enhanced for responsesevoked by the novel, temporally offset stimulus when comparedwith responses to simultaneously presented stimuli (Fig. 10A–D).As demonstrated by sliding window analysis (Fig. 8B, right col-umn), this enhancing effect starts �300 msec after the onset of theactivating stimulus.
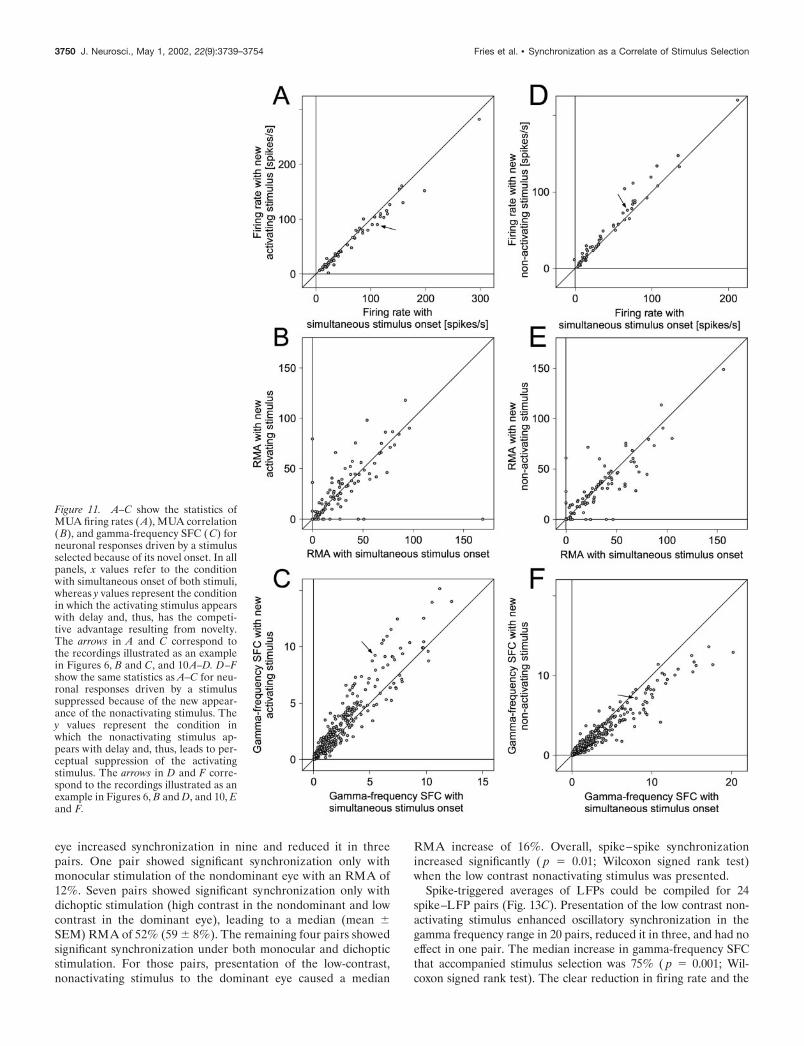
The effect of the selection of a newly appearing stimulus onfiring rate was evaluated for a total of 57 recording sites (Fig.11A). Forty-four recording sites showed reduced firing rates whenthe activating stimulus had newly appeared, 12 increased theirfiring rate, and one did not change. The median firing ratereduction amounted to 7% ( p � 0.0001; Wilcoxon signed ranktest).
From these recording sites, 92 pairs gave significant spike–spike correlations under at least one of the compared conditions(Fig. 11B). The new stimulus induced increased synchronizationin 41 and decreased synchronization in 51 pairs. In three cases,synchronization was only significant when the activating stimulusof the neurons was new, leading to a median (mean � SEM)RMA of 36% (41 � 21%). Eleven pairs showed significantsynchronization only when the activating stimulus appeared si-multaneously with the nonactivating stimulus, resulting in a me-dian (mean � SEM) RMA of 17% (36 � 15%). The remaining 78pairs that showed significant synchronization under both condi-tions showed a median RMA increase of 1% ( p � 0.95; Wilcoxonsigned rank test). Overall, there was no significant influence ofstimulus novelty on spike–spike synchronization ( p � 0.95; Wil-coxon signed rank test).
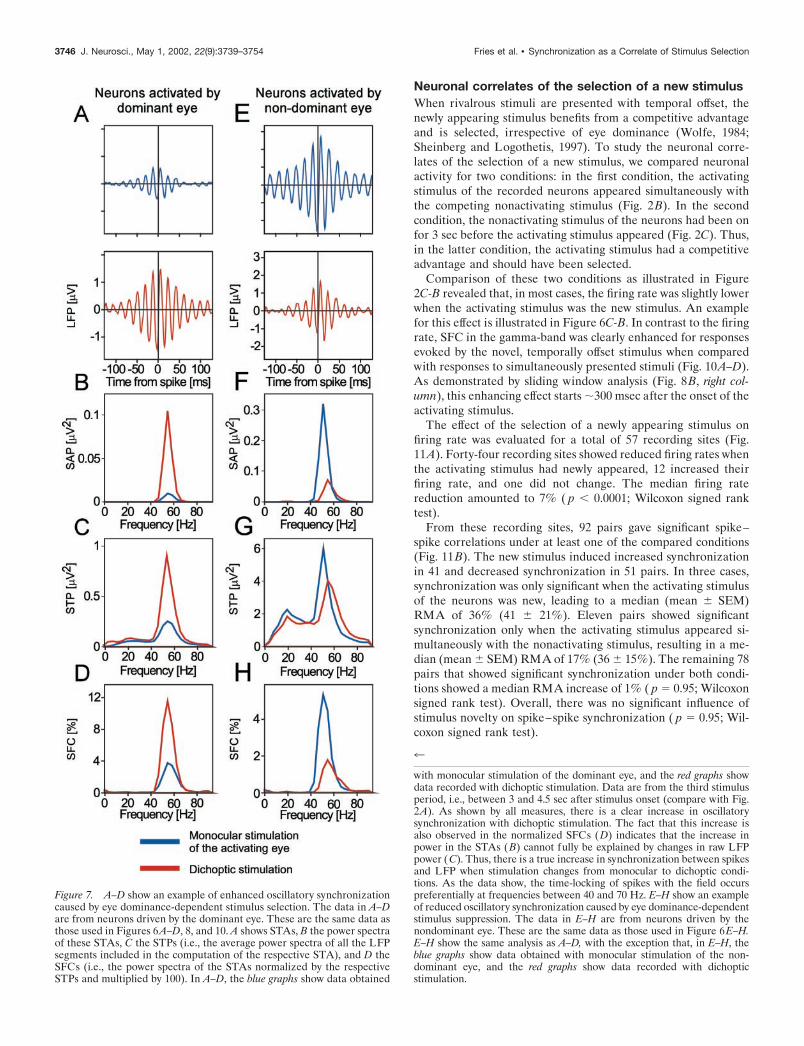
Figure 7. A–D show an example of enhanced oscillatory synchronizationcaused by eye dominance-dependent stimulus selection. The data in A–Dare from neurons driven by the dominant eye. These are the same data asthose used in Figures 6A–D, 8, and 10. A shows STAs, B the power spectraof these STAs, C the STPs (i.e., the average power spectra of all the LFPsegments included in the computation of the respective STA), and D theSFCs (i.e., the power spectra of the STAs normalized by the respectiveSTPs and multiplied by 100). In A–D, the blue graphs show data obtained
4
with monocular stimulation of the dominant eye, and the red graphs showdata recorded with dichoptic stimulation. Data are from the third stimulusperiod, i.e., between 3 and 4.5 sec after stimulus onset (compare with Fig.2A). As shown by all measures, there is a clear increase in oscillatorysynchronization with dichoptic stimulation. The fact that this increase isalso observed in the normalized SFCs (D) indicates that the increase inpower in the STAs (B) cannot fully be explained by changes in raw LFPpower (C). Thus, there is a true increase in synchronization between spikesand LFP when stimulation changes from monocular to dichoptic condi-tions. As the data show, the time-locking of spikes with the field occurspreferentially at frequencies between 40 and 70 Hz. E–H show an exampleof reduced oscillatory synchronization caused by eye dominance-dependentstimulus suppression. The data in E–H are from neurons driven by thenondominant eye. These are the same data as those used in Figure 6E–H.E–H show the same analysis as A–D, with the exception that, in E–H, theblue graphs show data obtained with monocular stimulation of the non-dominant eye, and the red graphs show data recorded with dichopticstimulation.
3746 J. Neurosci., May 1, 2002, 22(9):3739–3754 Fries et al. • Synchronization as a Correlate of Stimulus Selection
Pairing all simultaneously recorded spike and LFP recordingsyielded 479 STAs (Fig. 11C). When the activating stimulus wasnew, gamma-frequency SFC was enhanced in 308, reduced in 163and unchanged in eight pairs. The median enhancement ingamma-frequency SFC was 22% ( p � 0.0001; Wilcoxon signedrank test).
Neuronal correlates of the suppression by anew stimulusThe novel onset of a rivalrous stimulus leads to the selection ofthis stimulus and at the same time to the suppression of thealready present competing stimulus. To investigate this stimulussuppression, we compared two conditions: in both conditions, weanalyzed the period between 3 and 4.5 sec after the onset of theactivating stimulus. In the first condition, the nonactivating stim-ulus was presented together with the activating stimulus. In thesecond condition, the nonactivating stimulus appeared 3 sec after
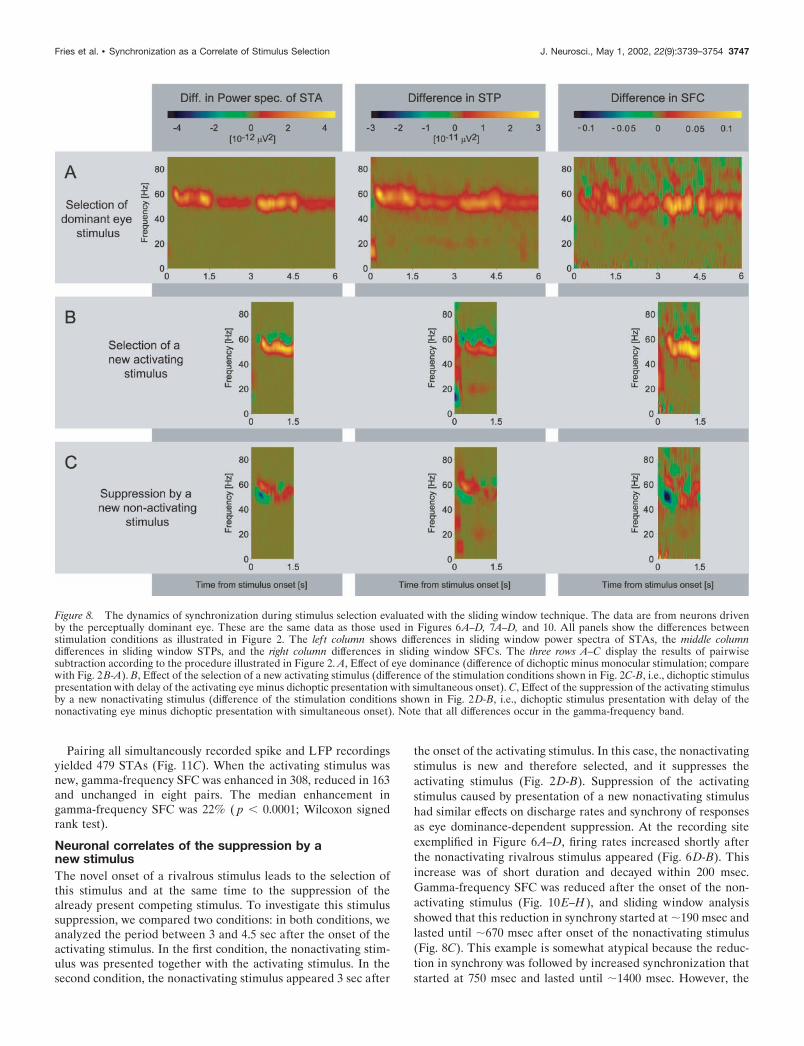
the onset of the activating stimulus. In this case, the nonactivatingstimulus is new and therefore selected, and it suppresses theactivating stimulus (Fig. 2D-B). Suppression of the activatingstimulus caused by presentation of a new nonactivating stimulushad similar effects on discharge rates and synchrony of responsesas eye dominance-dependent suppression. At the recording siteexemplified in Figure 6A–D, firing rates increased shortly afterthe nonactivating rivalrous stimulus appeared (Fig. 6D-B). Thisincrease was of short duration and decayed within 200 msec.Gamma-frequency SFC was reduced after the onset of the non-activating stimulus (Fig. 10E–H), and sliding window analysisshowed that this reduction in synchrony started at �190 msec andlasted until �670 msec after onset of the nonactivating stimulus(Fig. 8C). This example is somewhat atypical because the reduc-tion in synchrony was followed by increased synchronization thatstarted at 750 msec and lasted until �1400 msec. However, the
Figure 8. The dynamics of synchronization during stimulus selection evaluated with the sliding window technique. The data are from neurons drivenby the perceptually dominant eye. These are the same data as those used in Figures 6A–D, 7A–D, and 10. All panels show the differences betweenstimulation conditions as illustrated in Figure 2. The lef t column shows differences in sliding window power spectra of STAs, the middle columndifferences in sliding window STPs, and the right column differences in sliding window SFCs. The three rows A–C display the results of pairwisesubtraction according to the procedure illustrated in Figure 2. A, Effect of eye dominance (difference of dichoptic minus monocular stimulation; comparewith Fig. 2 B-A). B, Effect of the selection of a new activating stimulus (difference of the stimulation conditions shown in Fig. 2C-B, i.e., dichoptic stimuluspresentation with delay of the activating eye minus dichoptic presentation with simultaneous onset). C, Effect of the suppression of the activating stimulusby a new nonactivating stimulus (difference of the stimulation conditions shown in Fig. 2D-B, i.e., dichoptic stimulus presentation with delay of thenonactivating eye minus dichoptic presentation with simultaneous onset). Note that all differences occur in the gamma-frequency band.
Fries et al. • Synchronization as a Correlate of Stimulus Selection J. Neurosci., May 1, 2002, 22(9):3739–3754 3747
late enhancement was much weaker than the early reduction, suchthat the net change was still a reduction.
Altogether, the effect on firing rates of the suppression by a newnonactivating stimulus was studied for 57 recording sites (Fig.11D) and caused reduced firing rates at 11, enhanced rates at 45sites, and left the rate unchanged at one site. The median firingrate increase amounted to 10% ( p � 0.0001; Wilcoxon signedrank test).
Eighty-six pairs of recording sites exhibited significant spike–spike correlations under at least one of the two stimulationconditions so that effects of suppression on response synchroni-zation could be studied (Fig. 11E). When a new nonactivatingstimulus appeared, spike–spike correlation decreased in 46 andincreased in 40 pairs. Seven pairs synchronized significantly onlywhen both stimuli had appeared simultaneously, leading to amedian (mean � SEM) RMA of 24% (24 � 6%). Five pairs
Figure 9. A–C show the statistics ofMUA firing rates (A), MUA correlation(B), and gamma-frequency SFC (C) forneurons driven by the dominant eye. Inall panels, one dot corresponds to onerecording site or a pair of recordingsites, and the x value of a dot gives therespective parameter under monocularstimulation, whereas the y-axis displaysthe parameter under dichoptic stimula-tion. The arrows in A and C correspondto the recordings illustrated as an exam-ple in Figures 6, A and B, and 7A–D.D–F show the same analysis as A–C butfor neurons driven by the nondominanteye. The triangles in C represent identi-fied outliers as described in the maintext. The arrows in D and F correspondto the recordings illustrated as an exam-ple in Figures 6, E and F, and 7E–H.
3748 J. Neurosci., May 1, 2002, 22(9):3739–3754 Fries et al. • Synchronization as a Correlate of Stimulus Selection
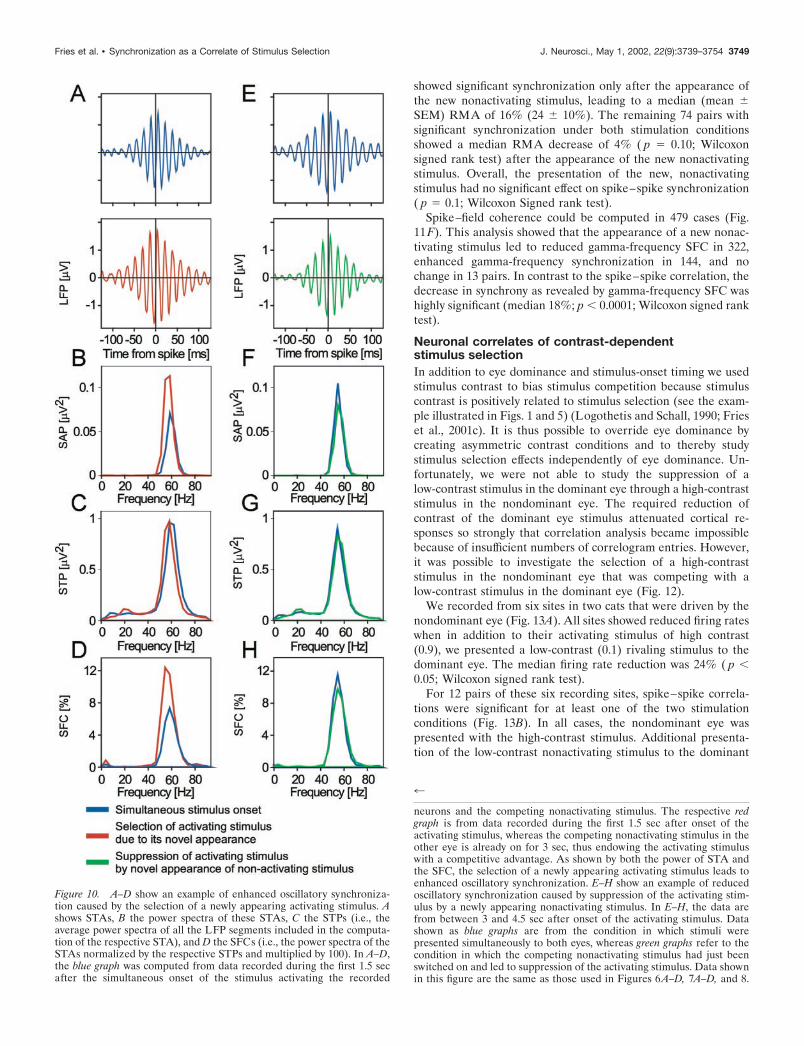
showed significant synchronization only after the appearance ofthe new nonactivating stimulus, leading to a median (mean �SEM) RMA of 16% (24 � 10%). The remaining 74 pairs withsignificant synchronization under both stimulation conditionsshowed a median RMA decrease of 4% ( p � 0.10; Wilcoxonsigned rank test) after the appearance of the new nonactivatingstimulus. Overall, the presentation of the new, nonactivatingstimulus had no significant effect on spike–spike synchronization( p � 0.1; Wilcoxon Signed rank test).
Spike–field coherence could be computed in 479 cases (Fig.11F). This analysis showed that the appearance of a new nonac-tivating stimulus led to reduced gamma-frequency SFC in 322,enhanced gamma-frequency synchronization in 144, and nochange in 13 pairs. In contrast to the spike–spike correlation, thedecrease in synchrony as revealed by gamma-frequency SFC washighly significant (median 18%; p � 0.0001; Wilcoxon signed ranktest).
Neuronal correlates of contrast-dependentstimulus selectionIn addition to eye dominance and stimulus-onset timing we usedstimulus contrast to bias stimulus competition because stimuluscontrast is positively related to stimulus selection (see the exam-ple illustrated in Figs. 1 and 5) (Logothetis and Schall, 1990; Frieset al., 2001c). It is thus possible to override eye dominance bycreating asymmetric contrast conditions and to thereby studystimulus selection effects independently of eye dominance. Un-fortunately, we were not able to study the suppression of alow-contrast stimulus in the dominant eye through a high-contraststimulus in the nondominant eye. The required reduction ofcontrast of the dominant eye stimulus attenuated cortical re-sponses so strongly that correlation analysis became impossiblebecause of insufficient numbers of correlogram entries. However,it was possible to investigate the selection of a high-contraststimulus in the nondominant eye that was competing with alow-contrast stimulus in the dominant eye (Fig. 12).
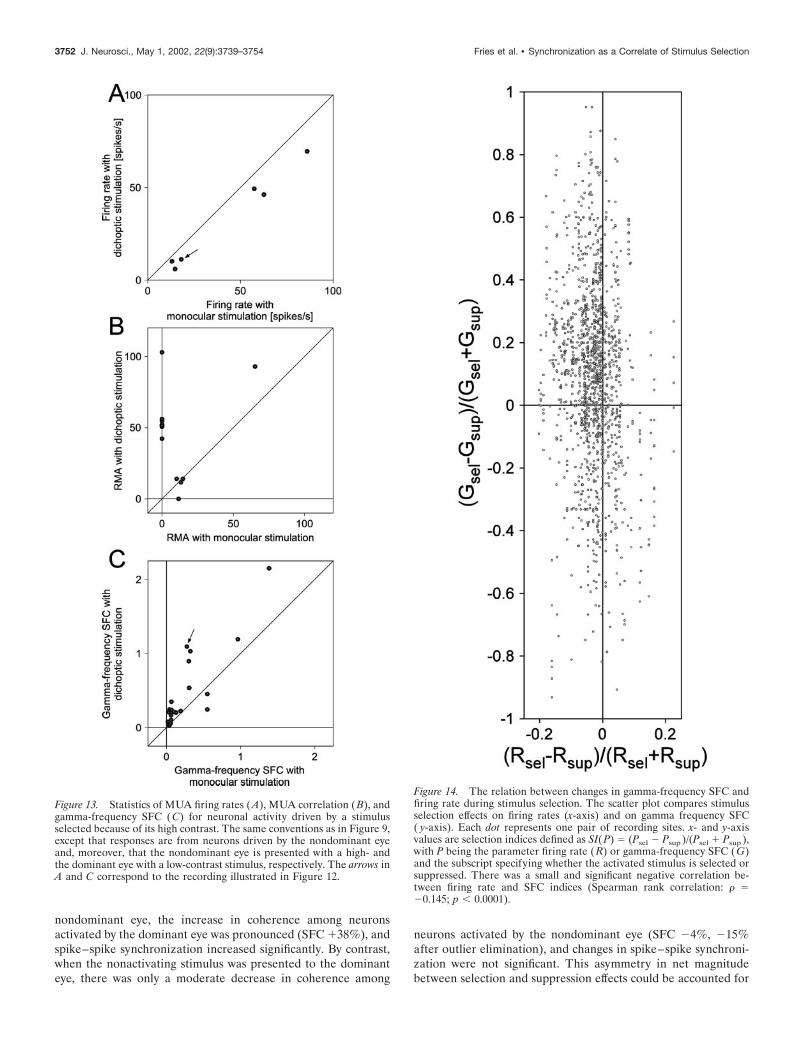
We recorded from six sites in two cats that were driven by thenondominant eye (Fig. 13A). All sites showed reduced firing rateswhen in addition to their activating stimulus of high contrast(0.9), we presented a low-contrast (0.1) rivaling stimulus to thedominant eye. The median firing rate reduction was 24% ( p �0.05; Wilcoxon signed rank test).
For 12 pairs of these six recording sites, spike–spike correla-tions were significant for at least one of the two stimulationconditions (Fig. 13B). In all cases, the nondominant eye waspresented with the high-contrast stimulus. Additional presenta-tion of the low-contrast nonactivating stimulus to the dominant
4
neurons and the competing nonactivating stimulus. The respective redgraph is from data recorded during the first 1.5 sec after onset of theactivating stimulus, whereas the competing nonactivating stimulus in theother eye is already on for 3 sec, thus endowing the activating stimuluswith a competitive advantage. As shown by both the power of STA andthe SFC, the selection of a newly appearing activating stimulus leads toenhanced oscillatory synchronization. E–H show an example of reducedoscillatory synchronization caused by suppression of the activating stim-ulus by a newly appearing nonactivating stimulus. In E–H, the data arefrom between 3 and 4.5 sec after onset of the activating stimulus. Datashown as blue graphs are from the condition in which stimuli werepresented simultaneously to both eyes, whereas green graphs refer to thecondition in which the competing nonactivating stimulus had just beenswitched on and led to suppression of the activating stimulus. Data shownin this figure are the same as those used in Figures 6A–D, 7A–D, and 8.
Figure 10. A–D show an example of enhanced oscillatory synchroniza-tion caused by the selection of a newly appearing activating stimulus. Ashows STAs, B the power spectra of these STAs, C the STPs (i.e., theaverage power spectra of all the LFP segments included in the computa-tion of the respective STA), and D the SFCs (i.e., the power spectra of theSTAs normalized by the respective STPs and multiplied by 100). In A–D,the blue graph was computed from data recorded during the first 1.5 secafter the simultaneous onset of the stimulus activating the recorded
Fries et al. • Synchronization as a Correlate of Stimulus Selection J. Neurosci., May 1, 2002, 22(9):3739–3754 3749
eye increased synchronization in nine and reduced it in threepairs. One pair showed significant synchronization only withmonocular stimulation of the nondominant eye with an RMA of12%. Seven pairs showed significant synchronization only withdichoptic stimulation (high contrast in the nondominant and lowcontrast in the dominant eye), leading to a median (mean �SEM) RMA of 52% (59 � 8%). The remaining four pairs showedsignificant synchronization under both monocular and dichopticstimulation. For those pairs, presentation of the low-contrast,nonactivating stimulus to the dominant eye caused a median
RMA increase of 16%. Overall, spike–spike synchronizationincreased significantly ( p � 0.01; Wilcoxon signed rank test)when the low contrast nonactivating stimulus was presented.
Spike-triggered averages of LFPs could be compiled for 24spike–LFP pairs (Fig. 13C). Presentation of the low contrast non-activating stimulus enhanced oscillatory synchronization in thegamma frequency range in 20 pairs, reduced it in three, and had noeffect in one pair. The median increase in gamma-frequency SFCthat accompanied stimulus selection was 75% ( p � 0.001; Wil-coxon signed rank test). The clear reduction in firing rate and the
Figure 11. A–C show the statistics ofMUA firing rates (A), MUA correlation(B), and gamma-frequency SFC (C) forneuronal responses driven by a stimulusselected because of its novel onset. In allpanels, x values refer to the conditionwith simultaneous onset of both stimuli,whereas y values represent the conditionin which the activating stimulus appearswith delay and, thus, has the competi-tive advantage resulting from novelty.The arrows in A and C correspond tothe recordings illustrated as an examplein Figures 6, B and C, and 10A–D. D–Fshow the same statistics as A–C for neu-ronal responses driven by a stimulussuppressed because of the new appear-ance of the nonactivating stimulus. They values represent the condition inwhich the nonactivating stimulus ap-pears with delay and, thus, leads to per-ceptual suppression of the activatingstimulus. The arrows in D and F corre-spond to the recordings illustrated as anexample in Figures 6, B and D, and 10, Eand F.
3750 J. Neurosci., May 1, 2002, 22(9):3739–3754 Fries et al. • Synchronization as a Correlate of Stimulus Selection
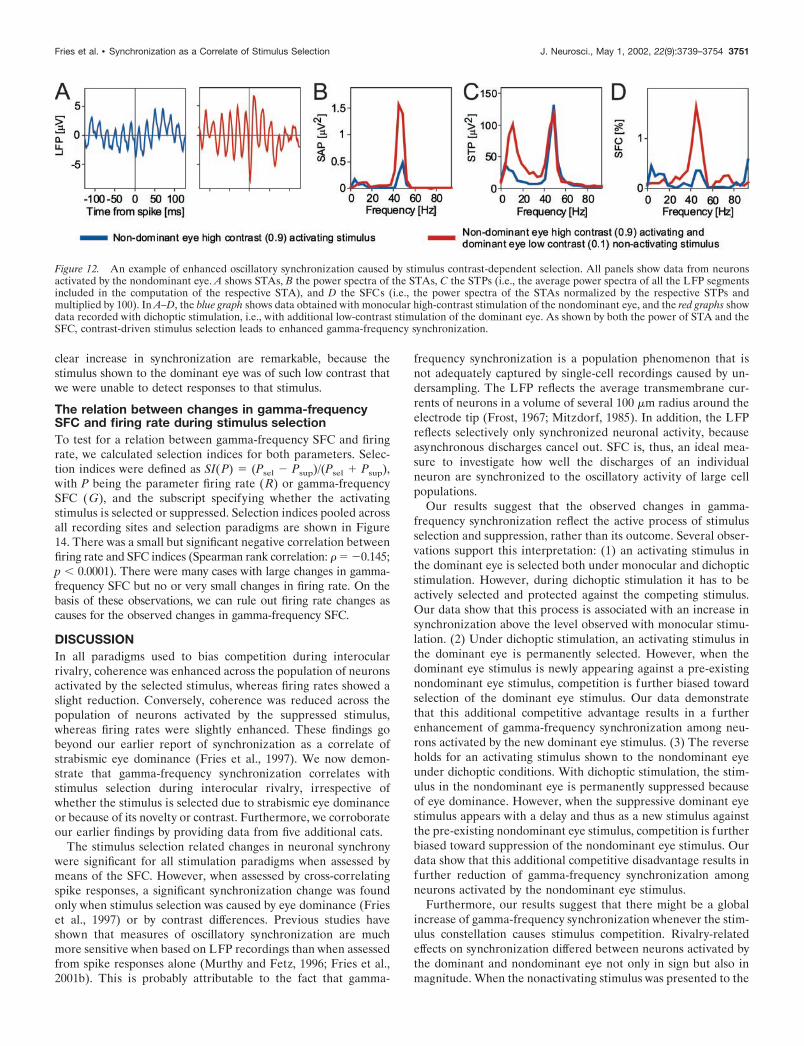
clear increase in synchronization are remarkable, because thestimulus shown to the dominant eye was of such low contrast thatwe were unable to detect responses to that stimulus.
The relation between changes in gamma-frequencySFC and firing rate during stimulus selectionTo test for a relation between gamma-frequency SFC and firingrate, we calculated selection indices for both parameters. Selec-tion indices were defined as SI(P) � (Psel � Psup)/(Psel � Psup),with P being the parameter firing rate (R) or gamma-frequencySFC (G), and the subscript specifying whether the activatingstimulus is selected or suppressed. Selection indices pooled acrossall recording sites and selection paradigms are shown in Figure14. There was a small but significant negative correlation betweenfiring rate and SFC indices (Spearman rank correlation: � � �0.145;p � 0.0001). There were many cases with large changes in gamma-frequency SFC but no or very small changes in firing rate. On thebasis of these observations, we can rule out firing rate changes ascauses for the observed changes in gamma-frequency SFC.
DISCUSSIONIn all paradigms used to bias competition during interocularrivalry, coherence was enhanced across the population of neuronsactivated by the selected stimulus, whereas firing rates showed aslight reduction. Conversely, coherence was reduced across thepopulation of neurons activated by the suppressed stimulus,whereas firing rates were slightly enhanced. These findings gobeyond our earlier report of synchronization as a correlate ofstrabismic eye dominance (Fries et al., 1997). We now demon-strate that gamma-frequency synchronization correlates withstimulus selection during interocular rivalry, irrespective ofwhether the stimulus is selected due to strabismic eye dominanceor because of its novelty or contrast. Furthermore, we corroborateour earlier findings by providing data from five additional cats.
The stimulus selection related changes in neuronal synchronywere significant for all stimulation paradigms when assessed bymeans of the SFC. However, when assessed by cross-correlatingspike responses, a significant synchronization change was foundonly when stimulus selection was caused by eye dominance (Frieset al., 1997) or by contrast differences. Previous studies haveshown that measures of oscillatory synchronization are muchmore sensitive when based on LFP recordings than when assessedfrom spike responses alone (Murthy and Fetz, 1996; Fries et al.,2001b). This is probably attributable to the fact that gamma-
frequency synchronization is a population phenomenon that isnot adequately captured by single-cell recordings caused by un-dersampling. The LFP reflects the average transmembrane cur-rents of neurons in a volume of several 100 �m radius around theelectrode tip (Frost, 1967; Mitzdorf, 1985). In addition, the LFPreflects selectively only synchronized neuronal activity, becauseasynchronous discharges cancel out. SFC is, thus, an ideal mea-sure to investigate how well the discharges of an individualneuron are synchronized to the oscillatory activity of large cellpopulations.
Our results suggest that the observed changes in gamma-frequency synchronization reflect the active process of stimulusselection and suppression, rather than its outcome. Several obser-vations support this interpretation: (1) an activating stimulus inthe dominant eye is selected both under monocular and dichopticstimulation. However, during dichoptic stimulation it has to beactively selected and protected against the competing stimulus.Our data show that this process is associated with an increase insynchronization above the level observed with monocular stimu-lation. (2) Under dichoptic stimulation, an activating stimulus inthe dominant eye is permanently selected. However, when thedominant eye stimulus is newly appearing against a pre-existingnondominant eye stimulus, competition is further biased towardselection of the dominant eye stimulus. Our data demonstratethat this additional competitive advantage results in a furtherenhancement of gamma-frequency synchronization among neu-rons activated by the new dominant eye stimulus. (3) The reverseholds for an activating stimulus shown to the nondominant eyeunder dichoptic conditions. With dichoptic stimulation, the stim-ulus in the nondominant eye is permanently suppressed becauseof eye dominance. However, when the suppressive dominant eyestimulus appears with a delay and thus as a new stimulus againstthe pre-existing nondominant eye stimulus, competition is furtherbiased toward suppression of the nondominant eye stimulus. Ourdata show that this additional competitive disadvantage results infurther reduction of gamma-frequency synchronization amongneurons activated by the nondominant eye stimulus.
Furthermore, our results suggest that there might be a globalincrease of gamma-frequency synchronization whenever the stim-ulus constellation causes stimulus competition. Rivalry-relatedeffects on synchronization differed between neurons activated bythe dominant and nondominant eye not only in sign but also inmagnitude. When the nonactivating stimulus was presented to the
Figure 12. An example of enhanced oscillatory synchronization caused by stimulus contrast-dependent selection. All panels show data from neuronsactivated by the nondominant eye. A shows STAs, B the power spectra of the STAs, C the STPs (i.e., the average power spectra of all the LFP segmentsincluded in the computation of the respective STA), and D the SFCs (i.e., the power spectra of the STAs normalized by the respective STPs andmultiplied by 100). In A–D, the blue graph shows data obtained with monocular high-contrast stimulation of the nondominant eye, and the red graphs showdata recorded with dichoptic stimulation, i.e., with additional low-contrast stimulation of the dominant eye. As shown by both the power of STA and theSFC, contrast-driven stimulus selection leads to enhanced gamma-frequency synchronization.
Fries et al. • Synchronization as a Correlate of Stimulus Selection J. Neurosci., May 1, 2002, 22(9):3739–3754 3751
nondominant eye, the increase in coherence among neuronsactivated by the dominant eye was pronounced (SFC �38%), andspike–spike synchronization increased significantly. By contrast,when the nonactivating stimulus was presented to the dominanteye, there was only a moderate decrease in coherence among
neurons activated by the nondominant eye (SFC �4%, �15%after outlier elimination), and changes in spike–spike synchroni-zation were not significant. This asymmetry in net magnitudebetween selection and suppression effects could be accounted for
Figure 13. Statistics of MUA firing rates (A), MUA correlation ( B), andgamma-frequency SFC (C) for neuronal activity driven by a stimulusselected because of its high contrast. The same conventions as in Figure 9,except that responses are from neurons driven by the nondominant eyeand, moreover, that the nondominant eye is presented with a high- andthe dominant eye with a low-contrast stimulus, respectively. The arrows inA and C correspond to the recording illustrated in Figure 12.
Figure 14. The relation between changes in gamma-frequency SFC andfiring rate during stimulus selection. The scatter plot compares stimulusselection effects on firing rates (x-axis) and on gamma frequency SFC( y-axis). Each dot represents one pair of recording sites. x- and y-axisvalues are selection indices defined as SI(P) � (Psel � Psup )/(Psel � Psup ),with P being the parameter firing rate ( R) or gamma-frequency SFC (G)and the subscript specifying whether the activated stimulus is selected orsuppressed. There was a small and significant negative correlation be-tween firing rate and SFC indices (Spearman rank correlation: � ��0.145; p � 0.0001).
3752 J. Neurosci., May 1, 2002, 22(9):3739–3754 Fries et al. • Synchronization as a Correlate of Stimulus Selection
if one assumes that the exposure to rivalrous stimuli per seenhances gamma-frequency synchronization. For neurons acti-vated by the dominant eye, competition results in selection of theactivating stimulus and the competition related increase in syn-chronization adds to the selection related increase. However, forneurons activated by the nondominant eye, competition results insuppression of the activating stimulus and the competition relatedincrease in synchronization counteracts the suppression relateddecrease.
In the experiments in which we exploited eye dominance tobias stimulus selection, there could have been an interaction withthe effects of the surgical induction of strabismus, if the operatedeye had always been the nondominant eye. However, in two cats,the deviating eye was dominant. In these cats, one of whichprovided the data for Figures 1, 5–8, and 10, the covariancebetween gamma-frequency synchronization and perceptual stim-ulus selection was the same as in the other cats, ruling out directsurgical effects as a cause for our observations.
Another confounding variable might be changes in firing rate.Modifications of synchronization might be side effects of changesin discharge rate. However, this is unlikely, because spike-fieldcoherence is normalized not only for changes in LFP power butalso for the firing rate (Fig. 4). Furthermore, we tested for arelation between selection related changes in firing rate andgamma-frequency SFC and found only a small negative correla-tion (Fig. 14). This analysis revealed many cases in which gamma-frequency SFC changed in the absence of firing rate changes,ruling out firing rate as a cause of SFC changes.
Changes in synchronization could also have resulted fromchanges in the composition of neurons contributing to the multi-unit activity that we used for computation of the SFC. Althoughwe cannot completely rule out changes in multiunit compositionwith changing stimulation conditions, we feel confident that thiscannot account for the observed changes in synchronization,because there was only a very weak correlation between indices offiring rate change and SFC change (Fig. 14). Furthermore, di-choptic stimulation often led to enhanced firing rates in the first1.5 sec but not during later response epochs. In contrast, synchro-nization of responses to the selected stimulus was elevatedthroughout the entire response (compare Figs. 6 and 8). More-over, in the paradigm where selection was biased by delayedstimulus onset, firing rates were lower during the epoch afterdelayed presentation of the activating stimulus than in the epochafter simultaneous presentation of both stimuli. Synchrony, incontrast, was higher for responses to the temporally offset acti-vating stimulus than for responses to simultaneously presentedstimuli (Figs. 6, 8). Further evidence for the independence offiring rates and synchrony comes from the comparison of theprecise dynamics of changes in firing rates and synchronization.For all paradigms of stimulus selection, differences in firing ratewere maximal right after stimulus onset, whereas the effect ofstimulus selection on synchronization occurred much later (com-pare Figs. 6, 8). Finally, when a high-contrast stimulus shown tothe nondominant eye was selected because it was in competitionwith a low-contrast stimulus in the dominant eye, responses to theselected high-contrast stimulus showed strongly increasedgamma-frequency synchronization despite the fact that there wasno measurable cortical spike response to the competing low-contrast stimulus (when shown monocularly) that could poten-tially have changed the multiunit composition. Thus, changes infiring rate or multiunit composition are highly unlikely to accountfor the changes in synchronization.
An earlier study on interocular competition used stimulationparadigms similar to some of those examined here (Sengpiel andBlakemore, 1994) but arrived at different results and conclusions.The animals in Sengpiel’s study were anesthetized and paralyzedand not examined behaviorally before the experiments. We re-peated our measurements under general anesthesia in two of ouranimals with implanted electrodes and recorded from the sameelectrodes as in the awake condition. The effects were now verysimilar to those described by Sengpiel and Blakemore (1994),suggesting anesthesia as the main reason for the discrepancy.
We hypothesize that the enhanced gamma-frequency synchro-nization of the selected responses enhances the impact of theresponses on target neurons at higher processing levels andthereby leads to perceptual dominance (Engel et al., 1997; Frieset al., 1997, 2001b). The gamma-frequency oscillations were �50Hz, corresponding to a cycle length of 20 msec. Spikes aretherefore synchronized within one half cycle of �10 msec dura-tion. Spikes synchronized with such precision have been shown tobe more effective in evoking postsynaptic action potentials thantemporally dispersed spikes (Alonso et al., 1996; Azouz and Gray,2000). Thus, stimulus selection-related changes in synchroniza-tion at one processing level are probably translated into corre-sponding firing rate changes at the next level. This possibility issupported by studies in the monkey which have demonstrated thatrivalry related changes in firing rate increase as one proceedsalong the cortical processing hierarchy (Logothetis and Schall,1989; Leopold and Logothetis, 1996; Sheinberg and Logothetis,1997).
REFERENCESAlonso JM, Usrey WM, Reid RC (1996) Precisely correlated firing in
cells of the lateral geniculate nucleus. Nature 383:815–819.Azouz R, Gray CM (2000) Dynamic spike threshold reveals a mecha-
nism for synaptic coincidence detection in cortical neurons in vivo. ProcNatl Acad Sci USA 97:8110–8115.
Blake R (1989) A neural theory of binocular rivalry. Psychol Rev96:145–167.
Brown RJ, Norcia AM (1997) A method for investigating binocularrivalry in real-time with the steady-state VEP. Vision Res37:2401–2408.
Crick F, Koch C (1990) Towards a neurobiological theory of conscious-ness. Semin Neurosci 2:263–275.
Cynader M, Harris L (1980) Eye movement in strabismic cats. Nature286:64–65.
Desimone R, Duncan J (1995) Neural mechanisms of selective visualattention. Annu Rev Neurosci 18:193–222.
Distler C, Hoffmann KP (1992) Early development of the subcorticaland cortical pathway involved in optokinetic nystagmus: the cat as amodel for man? Behav Brain Res 49:69–75.
Eckhorn R, Bauer R, Jordan W, Brosch M, Kruse W, Munk M, ReitboeckHJ (1988) Coherent oscillations: a mechanism of feature linking in thevisual cortex? Multiple electrode and correlation analyses in the cat.Biol Cybern 60:121–130.
Engel AK, Roelfsema PR, Fries P, Brecht M, Singer W (1997) Role ofthe temporal domain for response selection and perceptual binding.Cereb Cortex 7:571–582.
Enoksson P (1968) Studies in optokinetic binocular rivalry with a newdevice. Acta Ophthalmol (Copenh) 46:71–74.
Fox R, Todd S, Bettinger LA (1975) Optokinetic nystagmus as an ob-jective indicator of binocular rivalry. Vision Res 15:849–853.
Freeman DN, Marg E (1975) Visual acuity development coincides withthe sensitive period in kittens. Nature 254:614–615.
Fries P, Roelfsema PR, Engel AK, Konig P, Singer W (1997) Synchro-nization of oscillatory responses in visual cortex correlates with per-ception in interocular rivalry. Proc Natl Acad Sci USA 94:12699–12704.
Fries P, Neuenschwander S, Engel AK, Goebel R, Singer W (2001a)Rapid feature selective neuronal synchronization through correlatedlatency shifting. Nat Neurosci 4:194–200.
Fries P, Reynolds JH, Rorie AE, Desimone R (2001b) Modulation ofoscillatory neuronal synchronization by selective visual attention. Sci-ence 291:1560–1563.
Fries P, Schroder J, Singer W, Engel AK (2001c) Conditions of percep-tual selection and suppression during interocular rivalry in strabismicand normal cats. Vision Res 41:771–783.
Fries et al. • Synchronization as a Correlate of Stimulus Selection J. Neurosci., May 1, 2002, 22(9):3739–3754 3753
Frost Jr JD (1967) Comparison of intracellular potentials and ECoGactivity in isolated cerebral cortex. Electroencephalogr Clin Neuro-physiol 23:89–90.
Godaux E, Gobert C, Halleux J (1983) Vestibuloocular reflex, optoki-netic response, and their interactions in the alert cat. Exp Neurol80:42–54.
Gray CM, Konig P, Engel AK, Singer W (1989) Oscillatory responses incat visual cortex exhibit inter-columnar synchronization which reflectsglobal stimulus properties. Nature 338:334–337.
Holopigian K, Blake R, Greenwald MJ (1988) Clinical suppression andamblyopia. Invest Ophthalmol Vis Sci 29:444–451.
Hubel DH, Wiesel TN (1965) Binocular interaction in striate cortex ofkittens reared with artificial squint. J Neurophysiol 28:1041–1059.
Ikeda H, Tremain KE (1979) Amblyopia occurs in retinal ganglion cellsin cats reared with convergent squint without alternating fixation. ExpBrain Res 35:559–582.
Jacobson SG, Ikeda H (1979) Behavioural studies of spatial vision in catsreared with convergent squint: is amblyopia due to arrest of develop-ment? Exp Brain Res 34:11–26.
Konig P (1994) A method for the quantification of synchrony and oscil-latory properties of neuronal activity. J Neurosci Methods 54:31–37.
Leopold DA, Logothetis NK (1996) Activity changes in early visualcortex reflect monkeys’ percepts during binocular rivalry. Nature379:549–553.
Levelt WJM (1965) On binocular rivalry. Assen: Royal Van Gorcum.Levi DM, Klein SA (1985) Vernier acuity, crowding and amblyopia.
Vision Res 25:979–991.Logothetis NK, Schall JD (1989) Neuronal correlates of subjective vi-
sual perception. Science 245:761–763.Logothetis NK, Schall JD (1990) Binocular motion rivalry in macaque
monkeys: eye dominance and tracking eye movements. Vision Res30:1409–1419.
Lumer ED (1998) A neural model of binocular integration and rivalrybased on the coordination of action-potential timing in primary visualcortex. Cereb Cortex 8:553–561.
Mitchell DE, Giffin F, Wilkinson F, Anderson P, Smith ML (1976)Visual resolution in young kittens. Vision Res 16:363–366.
Mitchell DE, Ruck M, Kaye MG, Kirby S (1984) Immediate and long-term effects on visual acuity of surgically induced strabismus in kittens.Exp Brain Res 55:420–430.
Mitzdorf U (1985) Current source-density method and application in catcerebral cortex: investigation of evoked potentials and EEG phenom-ena. Physiol Rev 65:37–100.
Mower GD, Duffy FH (1983) Animal models of strabismic amblyopia:comparative behavioral studies. Behav Brain Res 7:239–251.
Murthy VN, Fetz EE (1996) Synchronization of neurons during localfield potential oscillations in sensorimotor cortex of awake monkeys.J Neurophysiol 76:3968–3982.
Polonsky A, Blake R, Braun J, Heeger DJ (2000) Neuronal activity inhuman primary visual cortex correlates with perception during binoc-ular rivalry. Nat Neurosci 3:1153–1159.
Press WH, Flannery BP, Teukolsky SA, Vetterling WT (1992) Numer-ical recipes in C. Cambridge: Cambridge University Press.
Roelfsema PR, Konig P, Engel AK, Sireteanu R, Singer W (1994)Reduced synchronization in the visual cortex of cats with strabismicamblyopia. Eur J Neurosci 6:1645–1655.
Sengpiel F, Blakemore C (1994) Interocular control of neuronal respon-siveness in cat visual cortex. Nature 368:847–850.
Sheinberg DL, Logothetis NK (1997) The role of temporal cortical areasin perceptual organization. Proc Natl Acad Sci USA 94:3408–3413.
Srinivasan R, Russell DP, Edelman GM, Tononi G (1999) Increasedsynchronization of neuromagnetic responses during conscious percep-tion. J Neurosci 19:5435–5448.
Tong F, Engel SA (2001) Interocular rivalry revealed in the humancortical blind-spot representation. Nature 411:195–199.
Tononi G, Srinivasan R, Russell DP, Edelman GM (1998) Investigatingneural correlates of conscious perception by frequency-tagged neuro-magnetic responses. Proc Natl Acad Sci USA 95:3198–3203.
von Noorden GK (1990) Theory and management of strabismus. St.Louis, MO: C. V. Mosby.
Wolfe JM (1984) Reversing ocular dominance and suppression in asingle flash. Vision Res 24:471–478.
Wolfe JM (1986) Stereopsis and binocular rivalry. Psychol Rev 93:269–282.
3754 J. Neurosci., May 1, 2002, 22(9):3739–3754 Fries et al. • Synchronization as a Correlate of Stimulus Selection