Embed Size (px)
Citation preview
OSK Holdings Berhad
26th Annual
General MeetingFinancial Results & Position
Year ended 31 December 201519 April 2016
Option 3 of Title Slide.
You may use this or any one of the
following title slides at your discretion.
Please remove this text box when using
the template.

2
Disclaimer• This presentation/document (“presentation”) has been prepared by OSK Holdings
Berhad and its subsidiaries (“OSK Group”). All information contained in this presentation
is published for reference only. Expressions of opinion, forecasts or intentions contained
herein are subject to change without notice and should not be taken as advice or
obligations of the OSK Group. The information in this presentation may differ or be
contrary to the opinions or recommendations expressed by other business areas of the
OSK Group as a result of using different assumptions and criteria.
• The information contained herein is obtained in good faith from sources believed to be
reliable. This document does not purport to contain all of the information that may be
required to evaluate and should not be relied on in connection with any potential
transaction. Neither the OSK Group nor any of its affiliates makes any representation or
warranty, express or implied, as to the accuracy or completeness of the information
contained in this presentation and any liability therefore (including in respect of direct,
indirect or consequential loss or damage) is expressly disclaimed.
• All rights are hereby reserved. The contents of this presentation are confidential and
accordingly may not be reproduced or copied to any unauthorized persons or
incorporated into another document or other materials without the prior written consent
of the OSK Group.
3
Table of Contents
Page no.
• Financial Performance Highlights
• Financial Position Highlights
• Dividends declared/proposed
4
10
13

Financial Performance Highlights
Divider Title (Arial Bold, 36pt)
Option 2 of Divider Slide.
You may use this or any one
of the following title slides at
your discretion.
Please remove this text box
when using the template.

5
Financial Performance Highlights
RM million 2015 2014 ChangeChange
(%)
Revenue 761 60 701 1,168
Profit Before Tax 605 216 389 180
Share of Profits 122 177 (55) (31)
Profit After Tax (PAT) 570 204 366 179
Profit After Tax & Non-controlling
interests562 204 358 175
Earnings per share 49.81 sen 21.29 sen 28.52 sen 134
Returns on Equity 17% 8%
Net Assets per share RM2.96 RM2.85 RM0.11 4
6
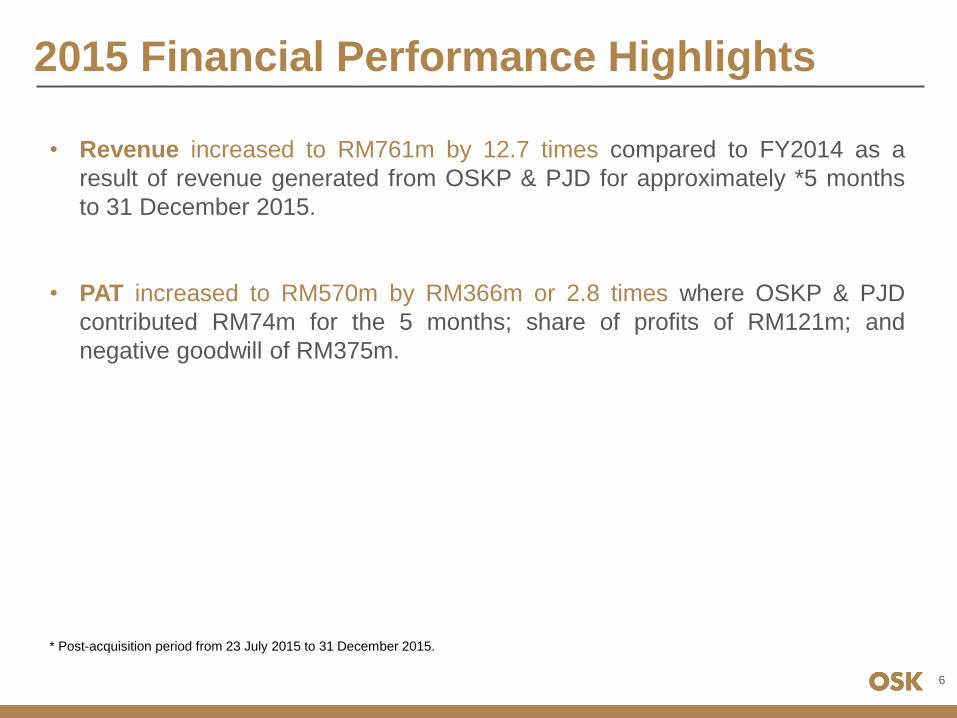
2015 Financial Performance Highlights
• Revenue increased to RM761m by 12.7 times compared to FY2014 as a
result of revenue generated from OSKP & PJD for approximately *5 months
to 31 December 2015.
• PAT increased to RM570m by RM366m or 2.8 times where OSKP & PJD
contributed RM74m for the 5 months; share of profits of RM121m; and
negative goodwill of RM375m.
* Post-acquisition period from 23 July 2015 to 31 December 2015.

7
Revenue by Business Segments
Property Development
& Investment, RM540m , 71%
Construction, RM12m , 2%
Hospitality,
RM54m , 7%
Industries,
RM114m , 15%
Capital Financing,
RM39m , 5%
Investment Holdings, RM2m , 0%
RM17m
RM540m
RM43m
RM39m RM2m RM12m
RM114m
RM54m
2014 2015
Hospitality
Industries
Construction
Investment Holdings
Capital Financing
Property Development &
Investment
RM60m
RM761m
12.7 times

8
PAT by Business Segments
RM20m RM68m RM12m
RM11m
RM172m
RM472m
RM5m RM7m RM7m
2014 2015
Hospitality
Industries
Construction
Investment Holdings
Capital Financing
Property Develoment &Investment
179%
RM570m
RM204m
Property Develoment & Investment, RM68m , 12%
Construction,
RM5m , 1%
Hospitality, RM7m , 1%
Industries,
RM7m , 1%
Capital Financing,
RM11m , 2%
Investment Holdings,
RM472m , 83%
# Share of RHB’s profits for FY2015 contributed RM126million (FY2014: RM177million).
#
#
#

9
PAT by Business Segments
* Including gain on disposal of investment bank subsidiaries of RM858 million.
*
*
*
*

Financial Position Highlights
Divider Title (Arial Bold, 36pt)
Option 2 of Divider Slide.
You may use this or any one
of the following title slides at
your discretion.
Please remove this text box
when using the template.

11
Financial Position Highlights
RM million 2015 2014 IncreaseIncrease
(%)
Total Assets 7,691 3,117 4,574 147
Shareholders’ Funds 4,094 2,708 1,386 51
Cash and Cash Equivalents 452 56 396 707
Net Debts 1,743 322 1,421 441
Net Gearing Ratio 0.43 times 0.12 times
Borrowings 2,198 378 1,820 481
Interest Coverage Ratio* 16.5 times 16.8 times
* The interest coverage ratio did not include the
interest expense capitalized under property
development costs.

12
2015 Financial Position Highlights
• Total Assets increased to RM7.69b by RM4.57b or 147% as a result of
consolidation of OSKP & PJD & rights issue in RHBC.
• Total Liabilities increased to RM3.38b by RM2.97b or 8 times mainly due to
consolidation of OSKP & PJD (RM1.96b); and issuance of Medium Term Notes
for the acquisitions of OSKP & PJD (RM0.75b) as well as additional Term Loan
for RHB’s rights issue (RM0.24b).
• Shareholders’ Funds increased to RM4.09b by RM1.39b or 51% after
accounting for the dividend payments of RM225m in FY2015.

Dividends declared/proposed
Divider Title (Arial Bold, 36pt)
Option 2 of Divider Slide.
You may use this or any one
of the following title slides at
your discretion.
Please remove this text box
when using the template.

14
Dividends declared/proposed
Single-tier dividends 2015 2014 2015 2014
Dividend per share Total amount
Sen RM’000
Dividend declared / proposed:
Special – 4 August 2015 15.0 - 142,644 -
Interim – 12 November 2015 2.5 2.5 34,620 23,774
Final *2.5 5.0 *34,620 47,551
20.0 7.5 211,884 71,325
* Entitlement date : 21 April 2016
Payment date : 11 May 2016

Thank You