Embed Size (px)
Citation preview
COST ANDPERFORMANCE
REPORT
Pump and Treat, In Situ Chemical Oxidation, andSoil Vapor Extraction
at the Union Chemical Company Superfund Site,South Hope, Maine
December 2001
U.S. Environmental Protection AgencyOffice of Solid Waste and Emergency ResponseTechnology Innovation Office
Union Chemical Company
U.S. Environmental Protection Agency December 2001Office of Solid Waste and Emergency ResponseTechnology Innovation Office 1
SITE INFORMATION
IDENTIFYING INFORMATION
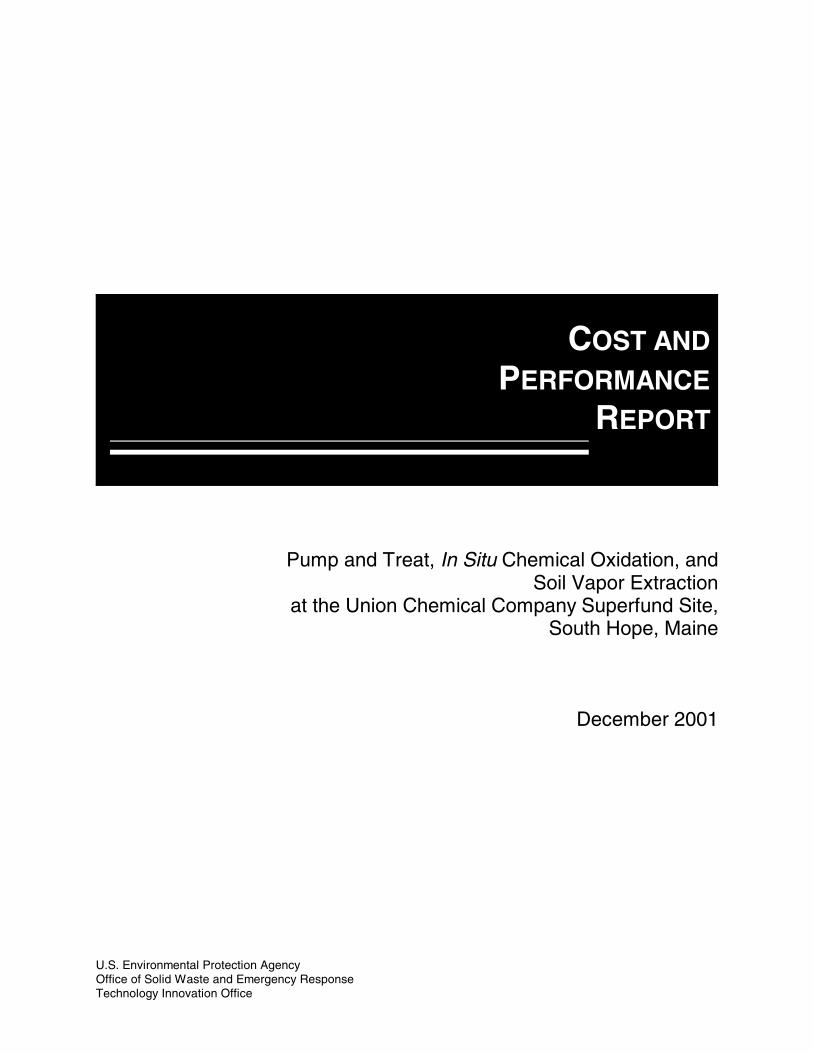
Site Name: Union Chemical Company Superfund Site
Location: South Hope, Maine
CERCLIS #: MED042143883
ROD Date: December 1990
ESD Date: April 1994
TREATMENT APPLICATION
Type of Action: Remedial
Period of Operation: January 1996 - Ongoing (data available through October 2000)
Quantity of Groundwater Treated: 8,352,867 gallons (January 1996 through December 1999)
Quantity of Soil Treated: 48,000 cubic yards
BACKGROUND
Historical Activity that Generated Contamination at the Site: Chemical manufacturing, solventrecovery, and hazardous waste treatment
Waste Management Practice That Contributed to Contamination: Leaking storage drums, spills, useof a septic tank and a leachfield for disposal of process wastewater
Facility Operations [5,6,7]:
C The 12.5-acre Union Chemical Company (UCC) Superfund Site is located in a rural area of Maineapproximately seven miles west of Rockport and 32 miles east of Augusta. The site is bounded on theeast and southeast by Quiggle Brook, on the north by Route 17, and on the southwest and west bywoodland. The eastern boundary of the site includes a floodplain and wetland area.
C UCC operated from 1967 to 1986 as a producer and distributor of solvent for the removal of furniturefinishes. Operations were expanded in 1969 to include solvent reclamation and recycling services;these services subsequently developed into UCC’s primary business.
C In 1979, the Maine Department of Environmental Protection (MEDEP) discovered that groundwater atthe site was contaminated with volatile organic compounds (VOCs). Waste treatment operations atthe site were discontinued in 1984, at which time MEDEP and EPA removed from the site all drumsand liquid storage tanks (2,000 drums and 30 liquid storage tanks containing over 10,000 gallons ofliquid waste and sludge), as well as some contaminated soil.
C The UCC site was added to the National Priorities List (NPL) in October 1989.
Union Chemical Company
U.S. Environmental Protection Agency December 2001Office of Solid Waste and Emergency ResponseTechnology Innovation Office 2
C From 1988 through 1990, a Remedial Investigation (RI) and Feasibility Study (FS) were performed toassess the source, nature, and extent of contaminated groundwater and soil. The RI/FS showed thaton-site groundwater and soils and off-site surface water (Quiggle Brook) had been contaminated withVOCs, but that contaminants had not migrated across Quiggle Brook.
Regulatory Context [5,6]:
C A Record of Decision (ROD) was issued for the site in December 1990 and included groundwaterremediation, as well as remediation of contaminated on-site soil, debris, sludge, and facilities.
C An Explanation of Significant Differences (ESD) was issued in April 1994 to change the treatmenttechnology for contaminated soils and to expand the groundwater extraction system into the sourcearea.
Remedy Selection: The selected groundwater remedy is vacuum-enhanced groundwater extraction, on-site groundwater treatment, and on-site discharge of treated groundwater into Quiggle Brook. The originalsoil remedy was excavation and on-site low temperature aeration of the source area soils. In April 1994,the soil remedy was changed to soil vapor extraction (SVE) for more aggressive cleanup. Because soilexcavation is not required with SVE, this remedy also allowed the groundwater extraction system to beexpanded into the source area.
SITE LOGISTICS/CONTACTS
Site Lead: PRP
Oversight: EPA
Remedial Project Manager:Terry Connelly*U.S. EPA Region 11 Congress Street, Suite 1100Boston, MA 02114-2023(617) 918-1373 (phone)(617) 565-3660 (FAX)[email protected]
State Contact:Rebecca HewettMEDEP17 State House StationAugusta, ME 04333(207) 287-2651 (phone)(207) 287-7826 (FAX)[email protected]
PRP-Group:Randy SmithUnion Chemical TrustAmerican Environmental ConsultantsP.O. Box 310Mont Vernon, NH 03057(603) 673-0004 (phone)(603) 672-0004 (FAX)[email protected]
Daily Operations Contractor:Tim PacIT Corporation (formerly Fluor Daniel GTI, Inc.)100 River Ridge DriveNorwood, MA 02062(781) 769-7600 (phone)(781) 769-7992 (FAX)[email protected]
*Indicates primary contact
Union Chemical Company
U.S. Environmental Protection Agency December 2001Office of Solid Waste and Emergency ResponseTechnology Innovation Office 3
MATRIX DESCRIPTION
MATRIX IDENTIFICATION
Type of Matrix Processed Through the Treatment System: Groundwater
CONTAMINANT CHARACTERIZATION [2,5,7,10]
Primary Contaminant Groups: Halogenated and non-halogenated volatile organic compounds (VOCs)
C During the remedial investigation (RI), VOCs and N,N-dimethylformamide (DMF), a semi-volatileorganic compound, were detected in the shallow and bedrock aquifers at the site. Metals, primarilyiron and manganese, have also been detected in the groundwater. Contaminated soil at the site wasdetermined to be a source for groundwater contamination.
C During the RI, the VOCs most frequently detected in the groundwater included (in decreasing order offrequency) 1,1-DCA, TCE, 1,1-DCE, and 1,1,1-TCA. The maximum initial concentrations of thesecontaminants (in ug/L) were 12,000 (1,1-DCA); 84,000 (TCE); 2,700 (1,1-DCE); and 73,000 (1,1,1-TCA).
C A maximum N,N-DMF concentration of 29,000 ug/L was observed in the groundwater in April 1996 (inWell B-12S).
C Two contaminated groundwater plumes are present in the area between the UCC facility and QuiggleBrook. The more northerly plume resulted from the migration of chemical constituents from an oldleach field on the site, while the source of the more southerly plume is believed to be a former drumstorage area south of the plant buildings, where a storage tank had reportedly leaked. Information isnot available about the initial size of the two plumes.
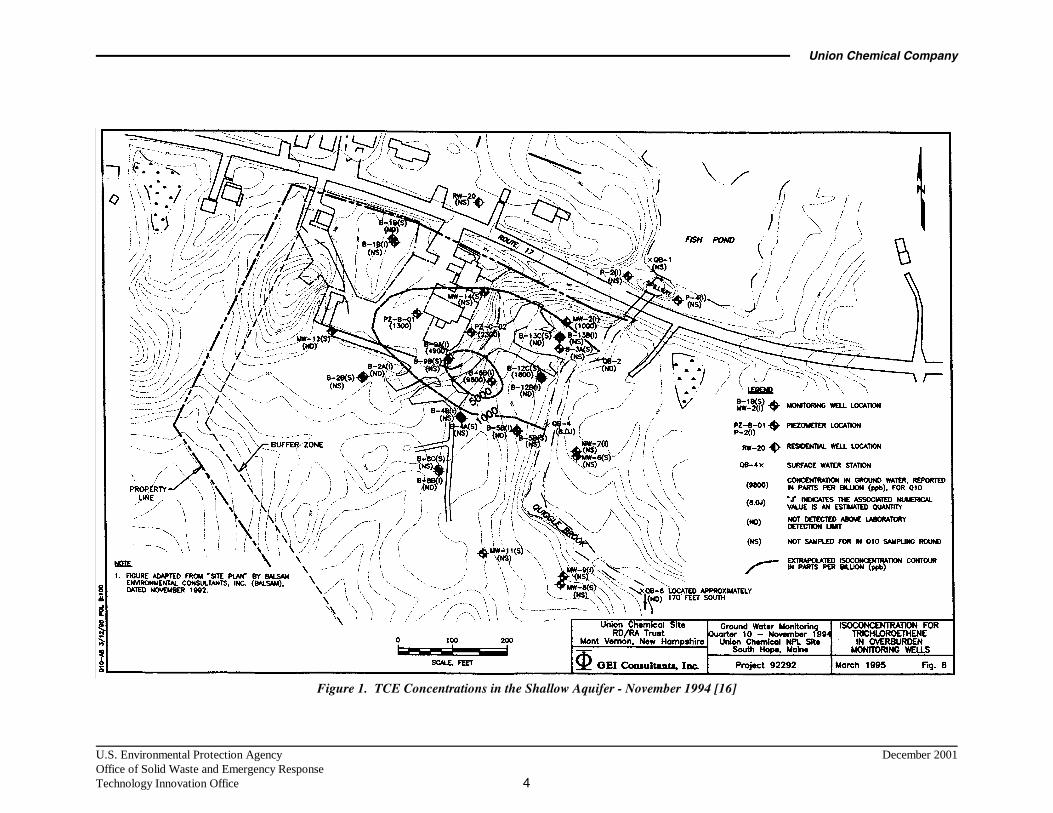
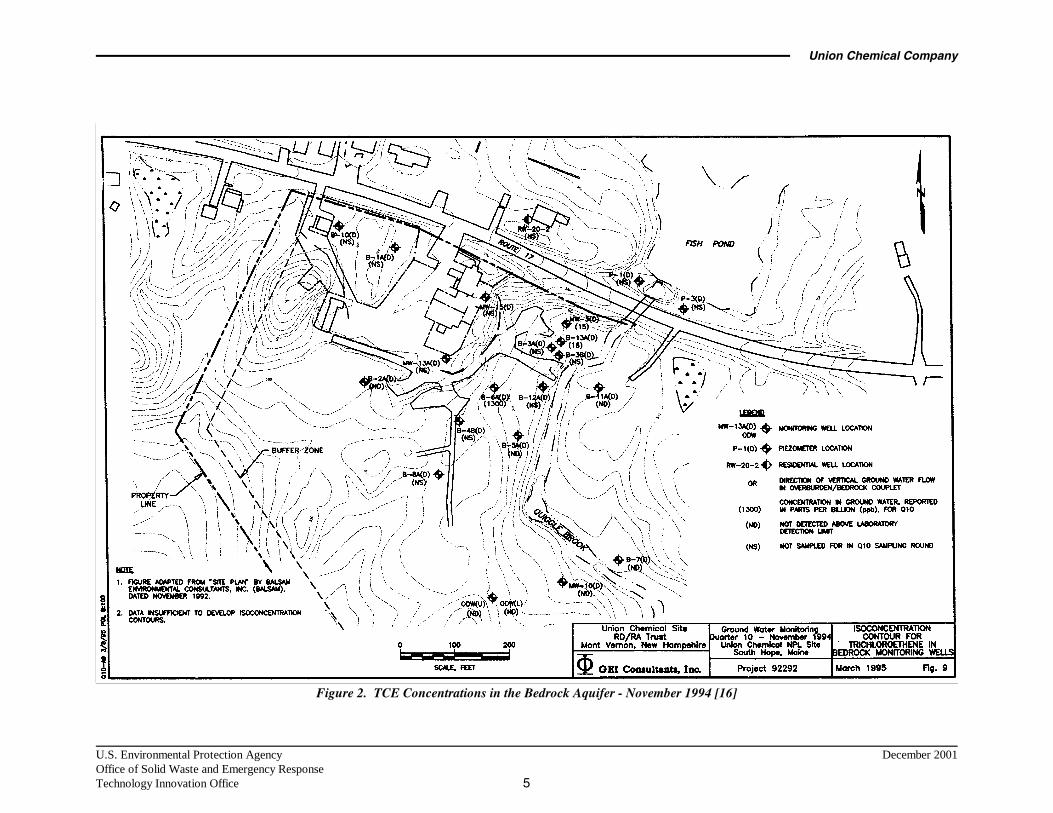
C Figures 1 and 2 show TCE concentrations observed during a sampling episode conducted inNovember 1994 (prior to the beginning of remediation at the site) in the shallow and bedrock aquifers,respectively. As shown in these figures, TCE concentrations were as high as 9,800 ug/L in theshallow aquifer (overburden wells) and 1,300 ug/L in the bedrock aquifer. Isoconcentration contourswere not available for the bedrock aquifer.
MATRIX CHARACTERISTICS AFFECTING TREATMENT COSTS OR PERFORMANCE
Hydrogeology [2,5]:
Two aquifer systems have been identified beneath the site - a shallow aquifer and a bedrock aquifer. Theshallow aquifer flows easterly and discharges into Quiggle Brook. The shallow aquifer consists of poorlygraded sands and silts and extends downward from 5 to 10 ft bgs to a depth of 20 feet bgs in thenorthwest corner of the site and to a depth of 70 to 80 feet bgs under the main plant buildings and nearQuiggle Brook. The bedrock aquifer also flows easterly and likely discharges into Quiggle Brook. Thebedrock aquifer consists of highly fractured bedrock and extends downward below the shallow aquifer to adepth of 165 feet bgs or more. Table 1 presents technical aquifer information.
Table 1. Technical Aquifer Information [2,5]
Unit NameThickness
(ft)Conductivity
(ft/day)
Average LinearVelocity(ft/year) Flow Direction
Shallow 20 - 80 Not provided <20 EastBedrock 85 - 165 Not provided <20 East
Union Chemical Company
U.S. Environmental Protection Agency December 2001Office of Solid Waste and Emergency ResponseTechnology Innovation Office 4
Figure 1. TCE Concentrations in the Shallow Aquifer - November 1994 [16]
Union Chemical Company
U.S. Environmental Protection Agency December 2001Office of Solid Waste and Emergency ResponseTechnology Innovation Office 5
Figure 2. TCE Concentrations in the Bedrock Aquifer - November 1994 [16]
Union Chemical Company
U.S. Environmental Protection Agency December 2001Office of Solid Waste and Emergency ResponseTechnology Innovation Office 6
TREATMENT SYSTEM DESCRIPTION
PRIMARY TREATMENT TECHNOLOGY [7]
• Pump and treat (P&T) with metals removal (oxidation, pH adjustment, flocculation, and clarification),filtration, organics removal (air stripping and UV/oxidation), and granular activated carbon (GAC)
• Soil vapor extraction (SVE) enhanced with hot air injection
• In situ chemical oxidation (sodium permanganate and potassium permanganate addition)
SUPPLEMENTAL TREATMENT TECHNOLOGY [7]
Thermal oxidation of vapors from the various water treatment units and the SVE unit
SYSTEM DESCRIPTION AND OPERATION
System Description [7,11,12,13]:
The three technologies that are being used to treat soil and groundwater at the Union Chemical Companysite (pump and treat, soil vapor extraction, and in situ chemical oxidation) are described below. The pumpand treat system is being used to remove contaminants and to draw down the water table to increase thesize of the vadose zone being treated by SVE.
Pump and Treat System
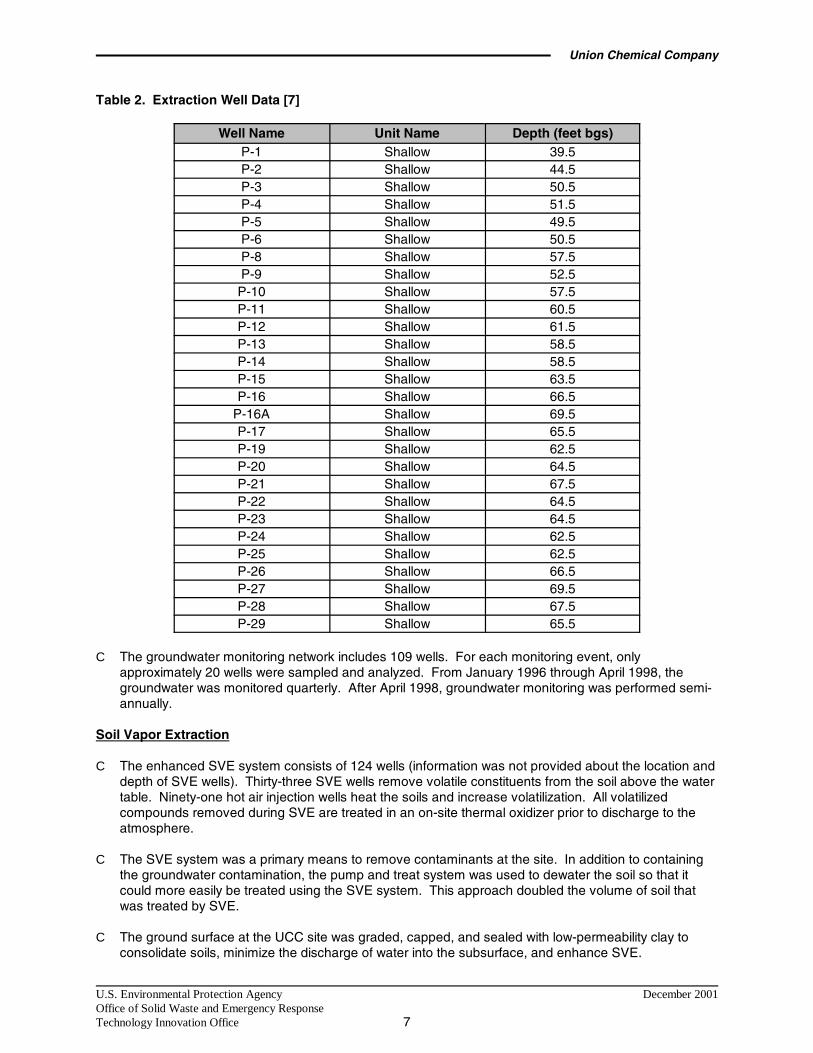
C The groundwater extraction system consists of 28 wells, all screened in the shallow aquifer. Table 2presents technical extraction well data.
C The above-ground treatment system includes a metals removal system (MRS). The MRS usesoxidation, pH adjustment, flocculation, clarification, and filtration processes to remove mainly iron andmanganese from the water. Extracted groundwater is pumped to an equalization tank, wherecompressed air is injected into the tank to oxidize the inorganic compounds in the water. Potassiumpermanganate (KMnO4) and sodium hydroxide (NaOH) convert the soluble metals into insolublesuspended salts. The KMnO4 is added to enhance the oxidation of the inorganic compounds in thewater stream and the NaOH is added to adjust the pH range to optimize the precipitation of the targetmetals. A polymer solution then groups the particulate inorganics into “flocs”. The flocs settle out ofthe water stream as the water flows through an inclined plate clarifier. The pH of the water isreadjusted back to the neutral range after clarification. A multi-media filter system removes residualinorganic floc. Sludge is periodically pumped from the MRS, dewatered in a filter press, and disposedof as nonhazardous waste.
C Organics are removed from the water by air stripping, UV/oxidation, and activated carbon adsorption.The metal tray-type air stripper volatilizes VOCs. The VOC-laden air is destroyed by thermal oxidation.The UV/oxidation system reduces large-chain chemicals to carbon dioxide and water by mixinghydrogen peroxide with the water and then subjecting the water to an intense stream of ultravioletlight. Two granulated activated carbon filters remove residual organic compounds from the waterthrough adsorption.
C The treated water is either discharged via gravity to Quiggle Brook or used for alternate purposesinside the treatment complex, such as wash down.
Union Chemical Company
U.S. Environmental Protection Agency December 2001Office of Solid Waste and Emergency ResponseTechnology Innovation Office 7
Table 2. Extraction Well Data [7]
Well Name Unit Name Depth (feet bgs)P-1 Shallow 39.5P-2 Shallow 44.5P-3 Shallow 50.5P-4 Shallow 51.5P-5 Shallow 49.5P-6 Shallow 50.5P-8 Shallow 57.5P-9 Shallow 52.5P-10 Shallow 57.5P-11 Shallow 60.5P-12 Shallow 61.5P-13 Shallow 58.5P-14 Shallow 58.5P-15 Shallow 63.5P-16 Shallow 66.5
P-16A Shallow 69.5P-17 Shallow 65.5P-19 Shallow 62.5P-20 Shallow 64.5P-21 Shallow 67.5P-22 Shallow 64.5P-23 Shallow 64.5P-24 Shallow 62.5P-25 Shallow 62.5P-26 Shallow 66.5P-27 Shallow 69.5P-28 Shallow 67.5P-29 Shallow 65.5
C The groundwater monitoring network includes 109 wells. For each monitoring event, onlyapproximately 20 wells were sampled and analyzed. From January 1996 through April 1998, thegroundwater was monitored quarterly. After April 1998, groundwater monitoring was performed semi-annually.
Soil Vapor Extraction
C The enhanced SVE system consists of 124 wells (information was not provided about the location anddepth of SVE wells). Thirty-three SVE wells remove volatile constituents from the soil above the watertable. Ninety-one hot air injection wells heat the soils and increase volatilization. All volatilizedcompounds removed during SVE are treated in an on-site thermal oxidizer prior to discharge to theatmosphere.
C The SVE system was a primary means to remove contaminants at the site. In addition to containingthe groundwater contamination, the pump and treat system was used to dewater the soil so that itcould more easily be treated using the SVE system. This approach doubled the volume of soil thatwas treated by SVE.
C The ground surface at the UCC site was graded, capped, and sealed with low-permeability clay toconsolidate soils, minimize the discharge of water into the subsurface, and enhance SVE.
Union Chemical Company
U.S. Environmental Protection Agency December 2001Office of Solid Waste and Emergency ResponseTechnology Innovation Office 8
In Situ Chemical Oxidation
C In October 1997 and June 1998, pilot-scale tests of in situ chemical oxidation using permanganateaddition were performed at the site. Based on the results of those tests, in 1999 and 2000, in situchemical oxidation was used on a full-scale basis to treat groundwater at the site, using the PermOX-ITSM process.
C In situ chemical oxidation at the Union Chemical Company site included injection of potassiumpermanganate in a two percent solution and sodium permanganate in a 20 to 40 percent solution.The solutions were injected into the subsurface using existing extraction and monitoring wells. Detailsof each injection are described under system operation.
System Operation [3,7,8,9,11,12,13,14,17,18]:
System operation for the three technologies that are being used to treat soil and groundwater at the UCCsite (pump and treat, soil vapor extraction, and in situ chemical oxidation) is described below.
Pump and Treat
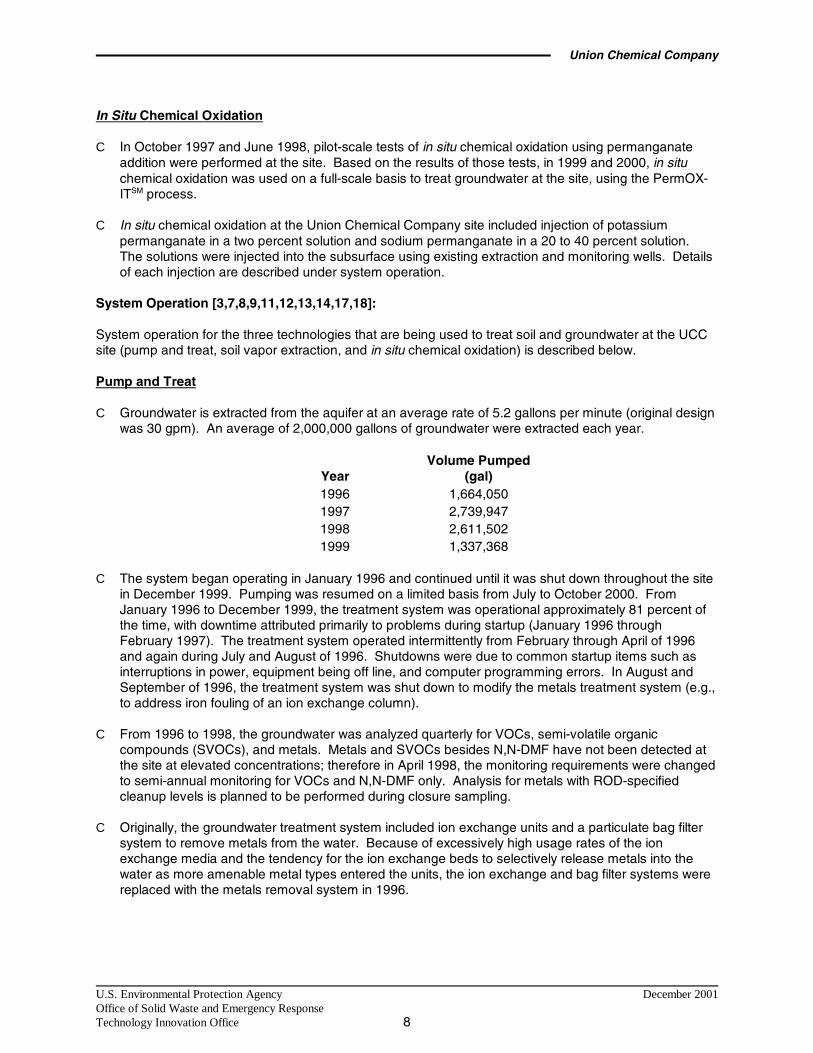
C Groundwater is extracted from the aquifer at an average rate of 5.2 gallons per minute (original designwas 30 gpm). An average of 2,000,000 gallons of groundwater were extracted each year.
YearVolume Pumped
(gal)1996 1,664,0501997 2,739,9471998 2,611,5021999 1,337,368
C The system began operating in January 1996 and continued until it was shut down throughout the sitein December 1999. Pumping was resumed on a limited basis from July to October 2000. FromJanuary 1996 to December 1999, the treatment system was operational approximately 81 percent ofthe time, with downtime attributed primarily to problems during startup (January 1996 throughFebruary 1997). The treatment system operated intermittently from February through April of 1996and again during July and August of 1996. Shutdowns were due to common startup items such asinterruptions in power, equipment being off line, and computer programming errors. In August andSeptember of 1996, the treatment system was shut down to modify the metals treatment system (e.g.,to address iron fouling of an ion exchange column).
C From 1996 to 1998, the groundwater was analyzed quarterly for VOCs, semi-volatile organiccompounds (SVOCs), and metals. Metals and SVOCs besides N,N-DMF have not been detected atthe site at elevated concentrations; therefore in April 1998, the monitoring requirements were changedto semi-annual monitoring for VOCs and N,N-DMF only. Analysis for metals with ROD-specifiedcleanup levels is planned to be performed during closure sampling.
C Originally, the groundwater treatment system included ion exchange units and a particulate bag filtersystem to remove metals from the water. Because of excessively high usage rates of the ionexchange media and the tendency for the ion exchange beds to selectively release metals into thewater as more amenable metal types entered the units, the ion exchange and bag filter systems werereplaced with the metals removal system in 1996.
Union Chemical Company
U.S. Environmental Protection Agency December 2001Office of Solid Waste and Emergency ResponseTechnology Innovation Office 9
Soil Vapor Extraction
C 48,000 cubic yards of soil have been treated by soil vapor extraction at the site.
C SVE was operated at the site since 1996 without any modifications. The air flow rate and vacuumused by the SVE system were not provided.
In Situ Chemical Oxidation
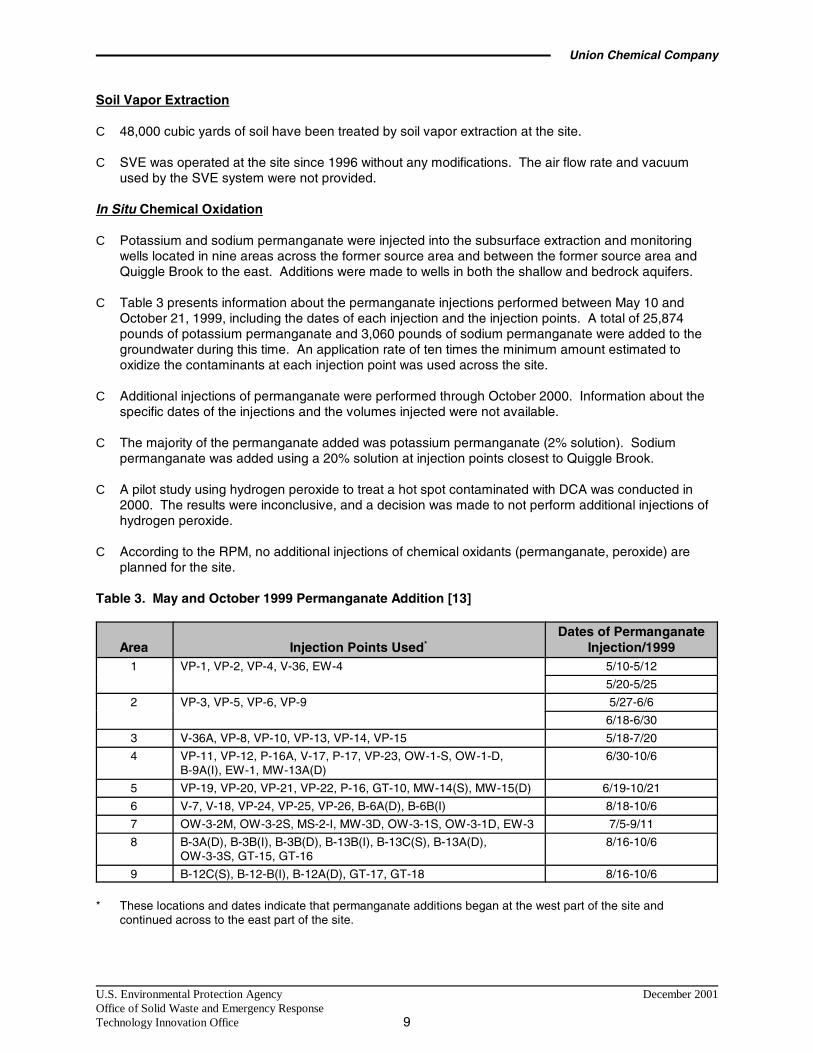
C Potassium and sodium permanganate were injected into the subsurface extraction and monitoringwells located in nine areas across the former source area and between the former source area andQuiggle Brook to the east. Additions were made to wells in both the shallow and bedrock aquifers.
C Table 3 presents information about the permanganate injections performed between May 10 andOctober 21, 1999, including the dates of each injection and the injection points. A total of 25,874pounds of potassium permanganate and 3,060 pounds of sodium permanganate were added to thegroundwater during this time. An application rate of ten times the minimum amount estimated tooxidize the contaminants at each injection point was used across the site.
C Additional injections of permanganate were performed through October 2000. Information about thespecific dates of the injections and the volumes injected were not available.
C The majority of the permanganate added was potassium permanganate (2% solution). Sodiumpermanganate was added using a 20% solution at injection points closest to Quiggle Brook.
C A pilot study using hydrogen peroxide to treat a hot spot contaminated with DCA was conducted in2000. The results were inconclusive, and a decision was made to not perform additional injections ofhydrogen peroxide.
C According to the RPM, no additional injections of chemical oxidants (permanganate, peroxide) areplanned for the site.
Table 3. May and October 1999 Permanganate Addition [13]
Area Injection Points Used*Dates of Permanganate
Injection/19991 VP-1, VP-2, VP-4, V-36, EW-4 5/10-5/12
5/20-5/25
2 VP-3, VP-5, VP-6, VP-9 5/27-6/6
6/18-6/30
3 V-36A, VP-8, VP-10, VP-13, VP-14, VP-15 5/18-7/20
4 VP-11, VP-12, P-16A, V-17, P-17, VP-23, OW-1-S, OW-1-D,B-9A(I), EW-1, MW-13A(D)
6/30-10/6
5 VP-19, VP-20, VP-21, VP-22, P-16, GT-10, MW-14(S), MW-15(D) 6/19-10/21
6 V-7, V-18, VP-24, VP-25, VP-26, B-6A(D), B-6B(I) 8/18-10/6
7 OW-3-2M, OW-3-2S, MS-2-I, MW-3D, OW-3-1S, OW-3-1D, EW-3 7/5-9/11
8 B-3A(D), B-3B(I), B-3B(D), B-13B(I), B-13C(S), B-13A(D),OW-3-3S, GT-15, GT-16
8/16-10/6
9 B-12C(S), B-12-B(I), B-12A(D), GT-17, GT-18 8/16-10/6
* These locations and dates indicate that permanganate additions began at the west part of the site andcontinued across to the east part of the site.
Union Chemical Company
U.S. Environmental Protection Agency December 2001Office of Solid Waste and Emergency ResponseTechnology Innovation Office 10
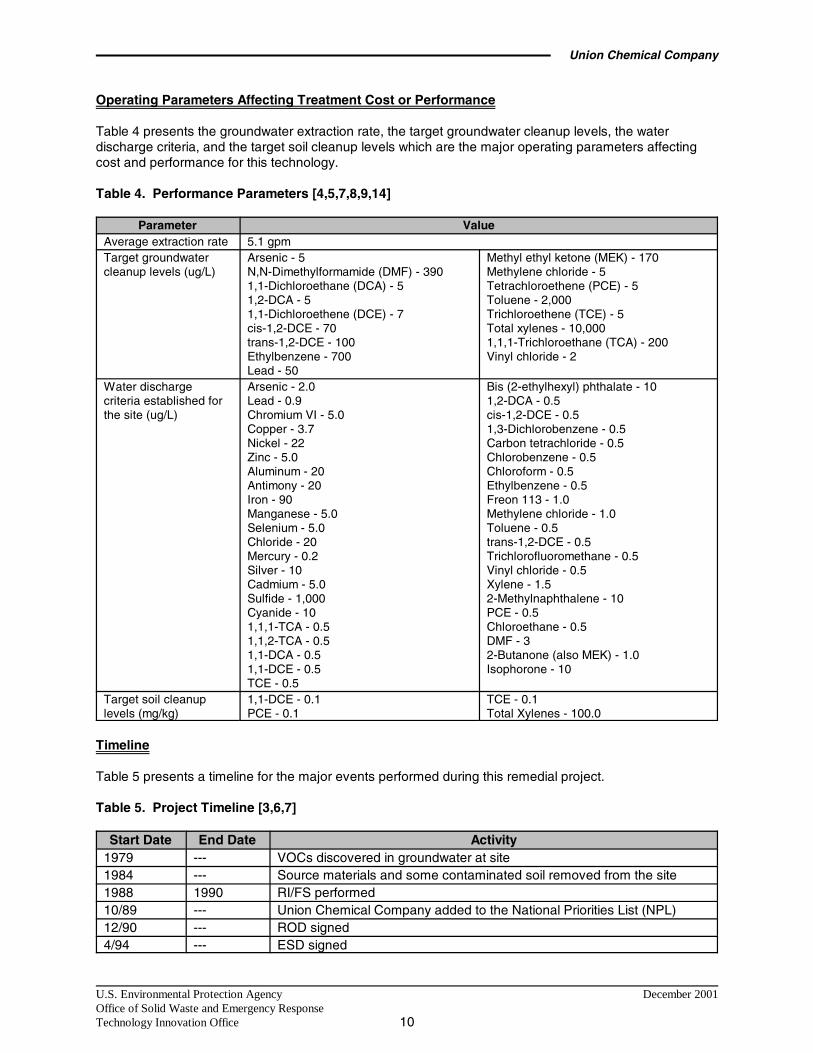
Operating Parameters Affecting Treatment Cost or Performance
Table 4 presents the groundwater extraction rate, the target groundwater cleanup levels, the waterdischarge criteria, and the target soil cleanup levels which are the major operating parameters affectingcost and performance for this technology.
Table 4. Performance Parameters [4,5,7,8,9,14]
Parameter ValueAverage extraction rate 5.1 gpmTarget groundwatercleanup levels (ug/L)
Arsenic - 5N,N-Dimethylformamide (DMF) - 3901,1-Dichloroethane (DCA) - 51,2-DCA - 51,1-Dichloroethene (DCE) - 7cis-1,2-DCE - 70trans-1,2-DCE - 100Ethylbenzene - 700Lead - 50
Methyl ethyl ketone (MEK) - 170Methylene chloride - 5Tetrachloroethene (PCE) - 5Toluene - 2,000Trichloroethene (TCE) - 5Total xylenes - 10,0001,1,1-Trichloroethane (TCA) - 200Vinyl chloride - 2
Water dischargecriteria established forthe site (ug/L)
Arsenic - 2.0Lead - 0.9Chromium VI - 5.0Copper - 3.7Nickel - 22Zinc - 5.0Aluminum - 20Antimony - 20Iron - 90Manganese - 5.0Selenium - 5.0Chloride - 20Mercury - 0.2Silver - 10Cadmium - 5.0Sulfide - 1,000Cyanide - 101,1,1-TCA - 0.51,1,2-TCA - 0.51,1-DCA - 0.51,1-DCE - 0.5TCE - 0.5
Bis (2-ethylhexyl) phthalate - 101,2-DCA - 0.5cis-1,2-DCE - 0.51,3-Dichlorobenzene - 0.5Carbon tetrachloride - 0.5Chlorobenzene - 0.5Chloroform - 0.5Ethylbenzene - 0.5Freon 113 - 1.0Methylene chloride - 1.0Toluene - 0.5trans-1,2-DCE - 0.5Trichlorofluoromethane - 0.5Vinyl chloride - 0.5Xylene - 1.52-Methylnaphthalene - 10PCE - 0.5Chloroethane - 0.5DMF - 32-Butanone (also MEK) - 1.0Isophorone - 10
Target soil cleanuplevels (mg/kg)
1,1-DCE - 0.1PCE - 0.1
TCE - 0.1Total Xylenes - 100.0
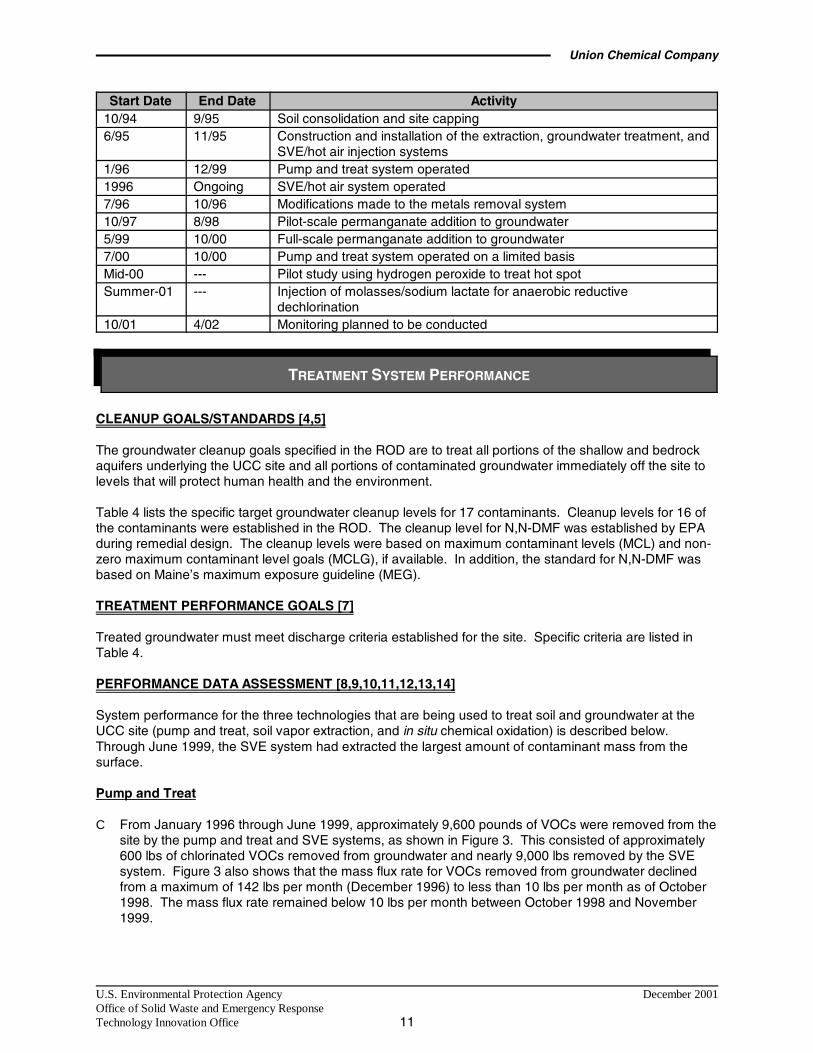
Timeline
Table 5 presents a timeline for the major events performed during this remedial project.
Table 5. Project Timeline [3,6,7]
Start Date End Date Activity1979 --- VOCs discovered in groundwater at site1984 --- Source materials and some contaminated soil removed from the site1988 1990 RI/FS performed10/89 --- Union Chemical Company added to the National Priorities List (NPL)12/90 --- ROD signed4/94 --- ESD signed
Union Chemical Company
Start Date End Date Activity
U.S. Environmental Protection Agency December 2001Office of Solid Waste and Emergency ResponseTechnology Innovation Office 11
TREATMENT SYSTEM PERFORMANCE
10/94 9/95 Soil consolidation and site capping6/95 11/95 Construction and installation of the extraction, groundwater treatment, and
SVE/hot air injection systems1/96 12/99 Pump and treat system operated1996 Ongoing SVE/hot air system operated7/96 10/96 Modifications made to the metals removal system10/97 8/98 Pilot-scale permanganate addition to groundwater5/99 10/00 Full-scale permanganate addition to groundwater7/00 10/00 Pump and treat system operated on a limited basisMid-00 --- Pilot study using hydrogen peroxide to treat hot spotSummer-01 --- Injection of molasses/sodium lactate for anaerobic reductive
dechlorination10/01 4/02 Monitoring planned to be conducted
CLEANUP GOALS/STANDARDS [4,5]
The groundwater cleanup goals specified in the ROD are to treat all portions of the shallow and bedrockaquifers underlying the UCC site and all portions of contaminated groundwater immediately off the site tolevels that will protect human health and the environment.
Table 4 lists the specific target groundwater cleanup levels for 17 contaminants. Cleanup levels for 16 ofthe contaminants were established in the ROD. The cleanup level for N,N-DMF was established by EPAduring remedial design. The cleanup levels were based on maximum contaminant levels (MCL) and non-zero maximum contaminant level goals (MCLG), if available. In addition, the standard for N,N-DMF wasbased on Maine’s maximum exposure guideline (MEG).
TREATMENT PERFORMANCE GOALS [7]
Treated groundwater must meet discharge criteria established for the site. Specific criteria are listed inTable 4.
PERFORMANCE DATA ASSESSMENT [8,9,10,11,12,13,14]
System performance for the three technologies that are being used to treat soil and groundwater at theUCC site (pump and treat, soil vapor extraction, and in situ chemical oxidation) is described below.Through June 1999, the SVE system had extracted the largest amount of contaminant mass from thesurface.
Pump and Treat
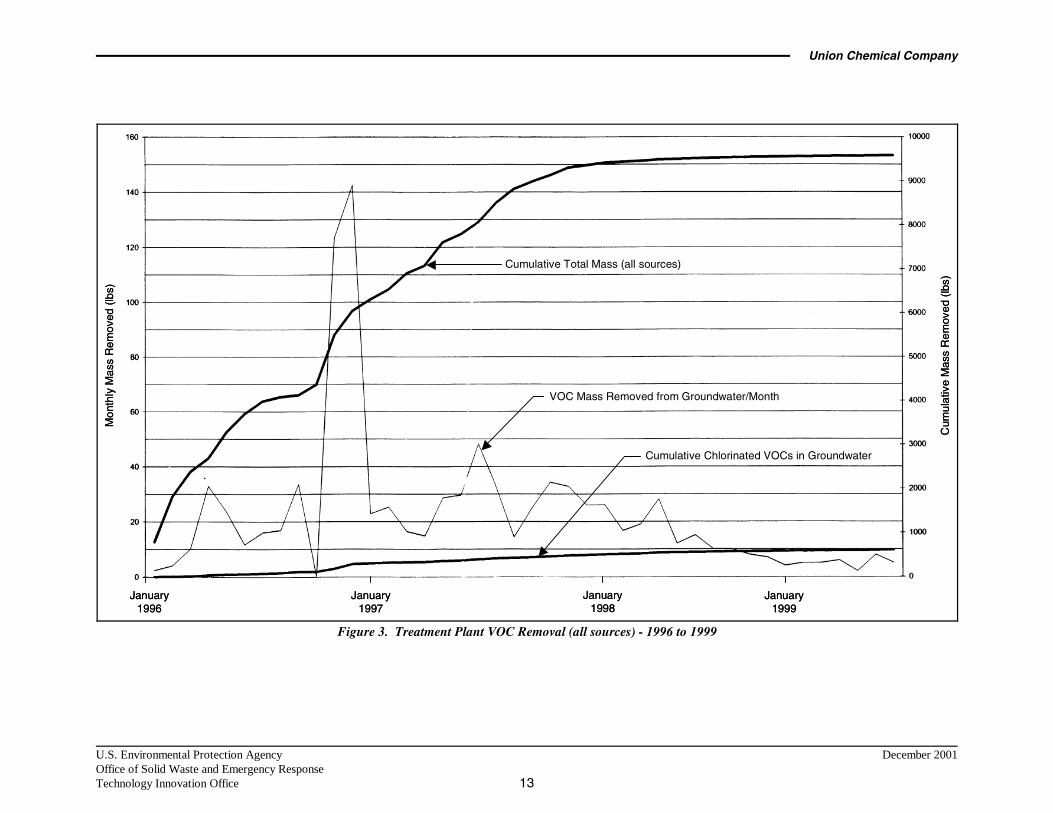
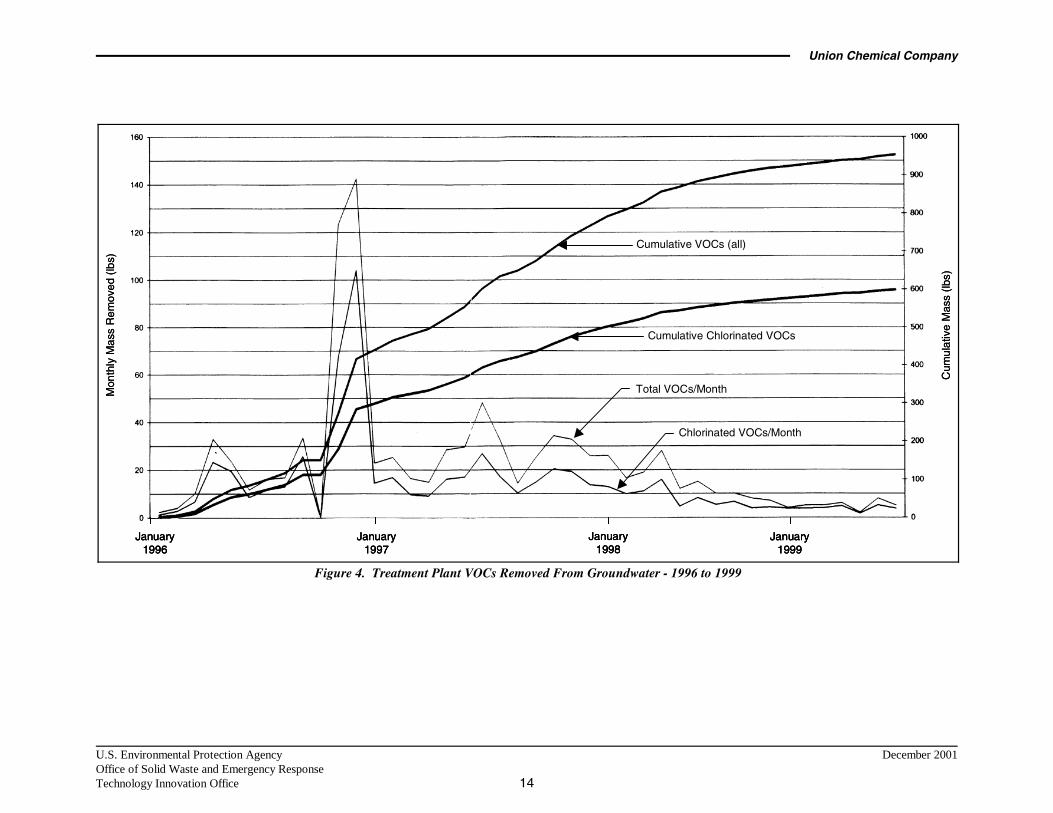
C From January 1996 through June 1999, approximately 9,600 pounds of VOCs were removed from thesite by the pump and treat and SVE systems, as shown in Figure 3. This consisted of approximately600 lbs of chlorinated VOCs removed from groundwater and nearly 9,000 lbs removed by the SVEsystem. Figure 3 also shows that the mass flux rate for VOCs removed from groundwater declinedfrom a maximum of 142 lbs per month (December 1996) to less than 10 lbs per month as of October1998. The mass flux rate remained below 10 lbs per month between October 1998 and November1999.
Union Chemical Company
U.S. Environmental Protection Agency December 2001Office of Solid Waste and Emergency ResponseTechnology Innovation Office 12
C Figure 4 shows a total of approximately 950 lbs of VOCs removed from the groundwater from January1996 to June 1999, which includes the 600 lbs of chlorinated VOCs shown on Figure 3. The 350 lbsof nonchlorinated VOCs consisted of compounds such as BTEX, ketones, and N,N-DMF.
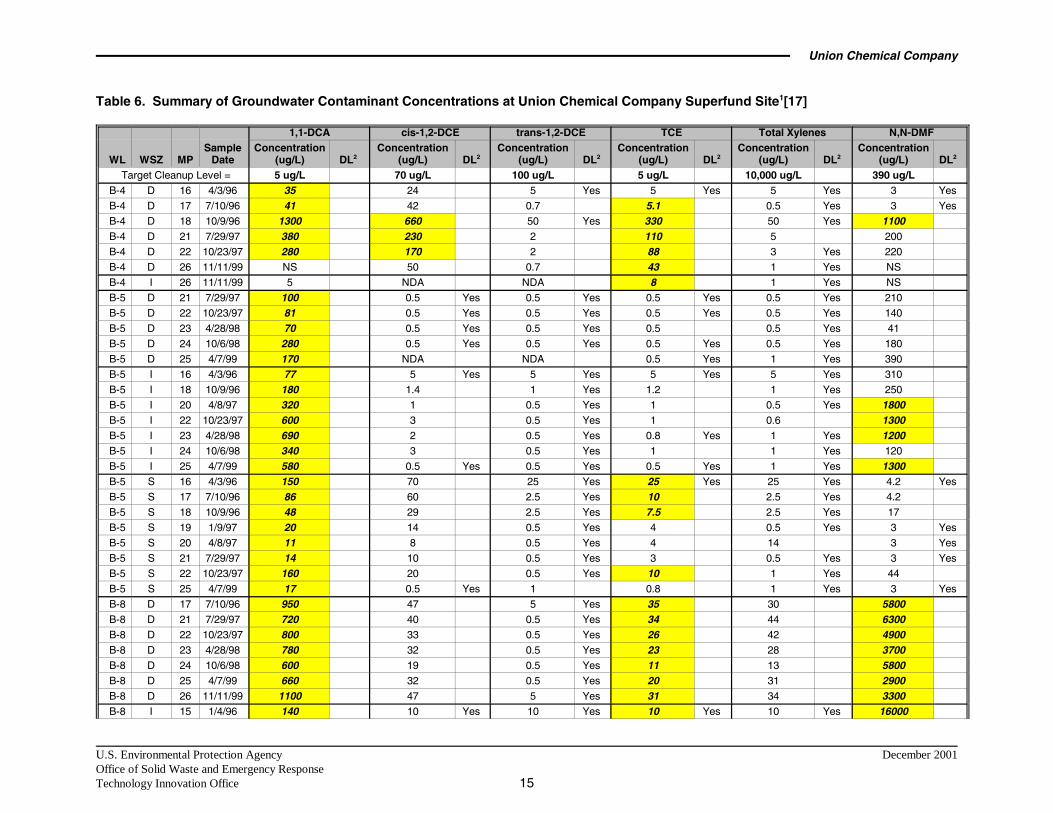
C Table 6 presents analytical results from monitoring well locations B-4, B-5, B-8, and B-12. These wellsare located downgradient of the source area and have groundwater concentrations above the cleanupgoals for one or more selected contaminants (1,1-DCA, cis-1,2-DCE, trans-1,2-DCE, TCE, totalxylenes, and N,N-DMF). Data are presented by well through November 1999.
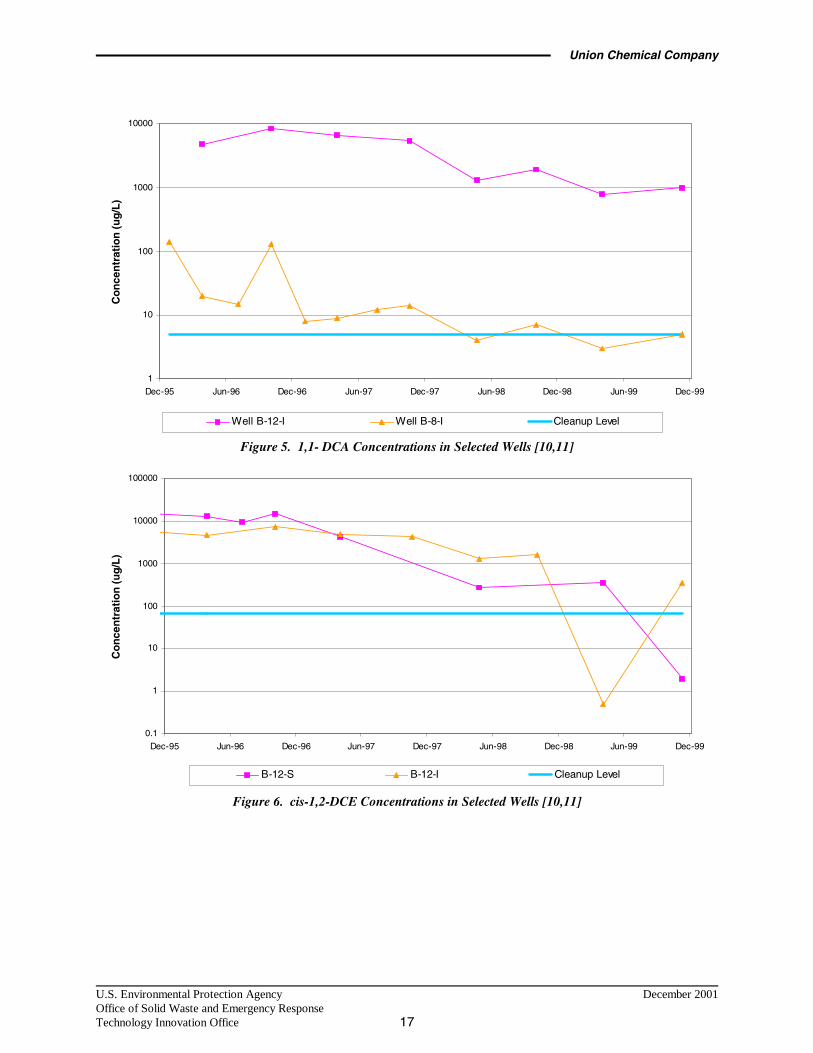
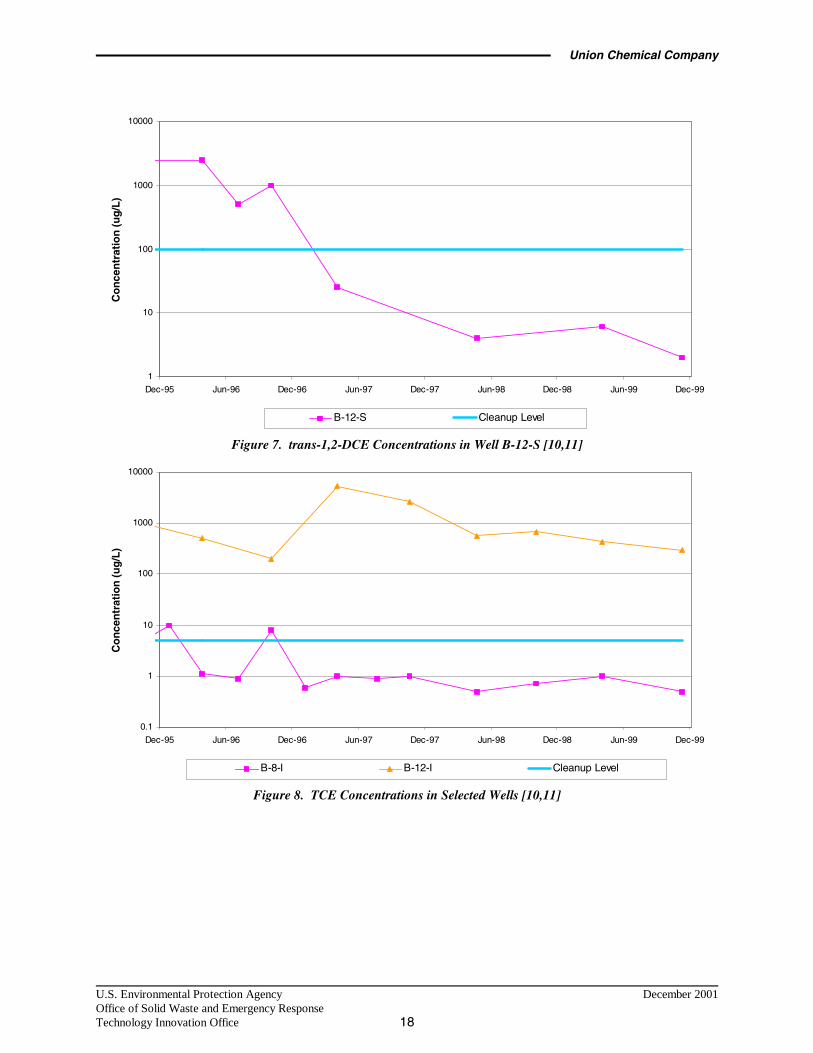
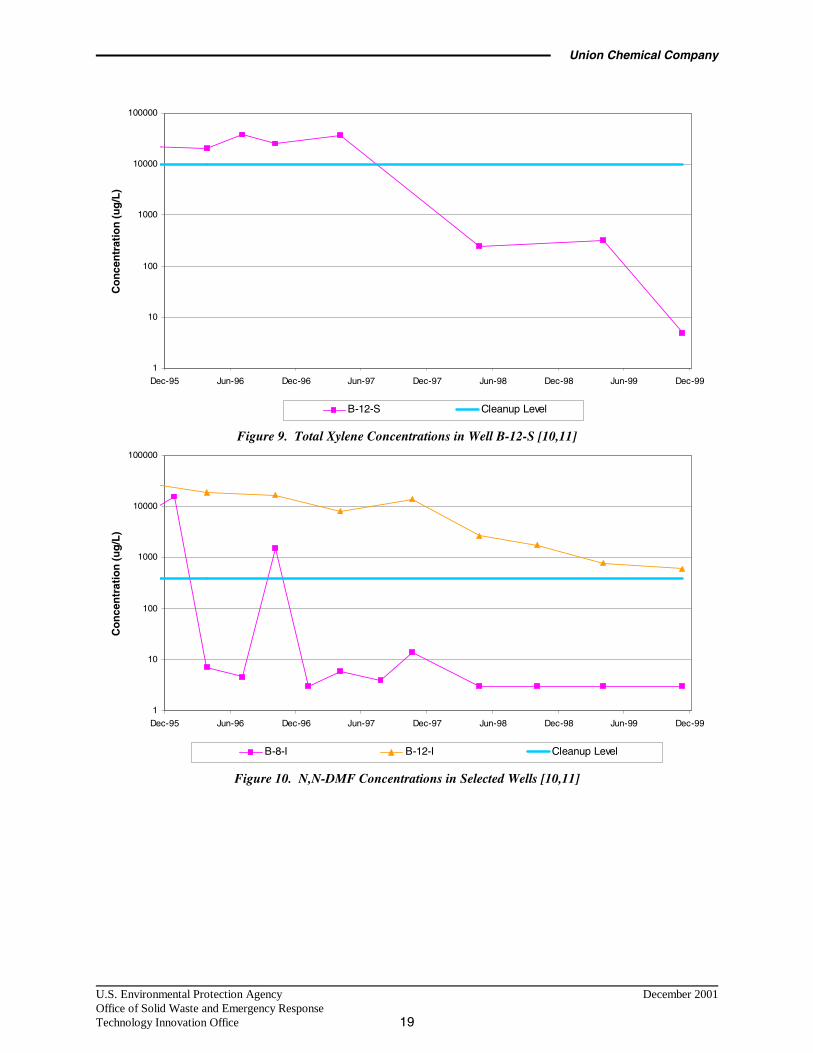
C Figures 5 through 10 show changes in time of groundwater contaminant concentrations for 1,1-DCA,cis-1,2-DCE, trans-1,2-DCE, TCE, total xylenes, and N,N-DMF, respectively. For each of these sixcontaminants, data generally are presented for two selected wells: one well in which the contaminantconcentration was at or below the established cleanup level in November 1999 and the other well inwhich the contaminant concentration remained above the cleanup level in November 1999. (SeeTable 6 for information about an individual well.) Figures 5 through 10 show that, in general,contaminant concentrations in the aquifer are decreasing over time. According to the RPM,concentration variations in the wells were attributed to a variety of factors, including seasonalinfluences, laboratory variability, and effects from permanganate additions.
C Cleanup levels for trans-1,2-DCE and total xylenes were not exceeded in any of the wells sampled inNovember 1999. Therefore, contaminant concentration changes are only presented for one well inFigures 7 and 9 (the figures for trans-1,2-DCE and total xylenes, respectively).
C According to the RPM, the plume size has been reduced, however the amount of reduction has notbeen quantified.
C Groundwater contaminant concentrations in all wells monitored during the November 1999groundwater monitoring period were lower than the target cleanup levels for the following sixcontaminants: 1,2-DCA, carbon tetrachloride, chloroform, toluene, total xylenes, and trans-1,2-DCE.
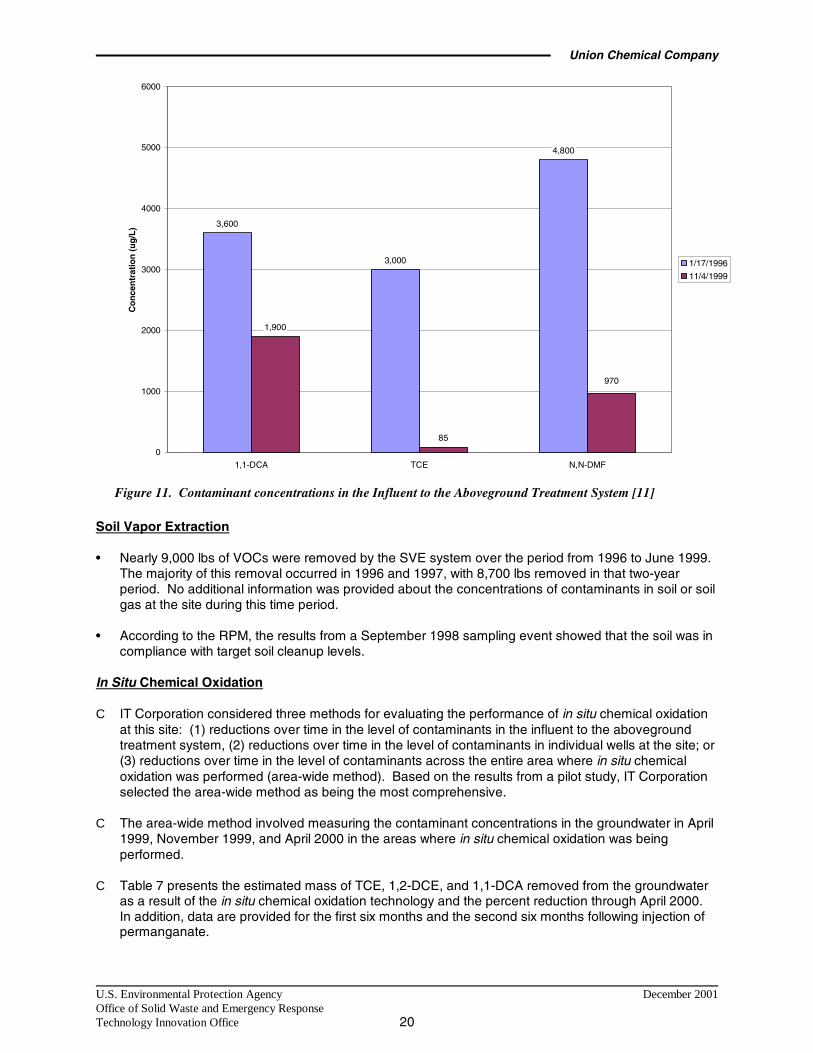
C Figure 11 shows the concentrations of 1,1-DCA, TCE, and N,N-DMF in the influent to theaboveground treatment system during January 1996 and November 1999. From January 1996 toNovember 1999, the 1,1-DCA, TCE, and N,N-DMF concentrations in the influent to the treatmentsystem decreased from 3,600 ug/L to 1,900 ug/L (1,1-DCA), from 3,000 ug/L to 85 ug/L (TCE), andfrom 4,800 ug/L to 970 ug/L (N,N-DMF).
C According to the RPM, effluent concentrations were not above the treatment system discharge criteriashown in Table 4.
C According to the RPM, in general, groundwater concentrations of ethenes are decreasing more rapidlythan the concentrations of ethanes in the groundwater. This trend can be demonstrated by comparingthe decrease in 1,1-DCA concentrations in the influent to the aboveground treatment system with thedecrease in TCE concentrations in the influent to the aboveground treatment system, as shown inFigure 11. This trend is observed primarily because the ethenes are responding more rapidly to thepermanganate additions than the ethanes.
Union Chemical Company
U.S. Environmental Protection Agency December 2001Office of Solid Waste and Emergency ResponseTechnology Innovation Office 13
Cumulative Chlorinated VOCs in Groundwater
VOC Mass Removed from Groundwater/Month
Cumulative Total Mass (all sources)
Mon
thly
Mas
sR
emov
ed(lb
s)
Cum
ulat
ive
Mas
sR
emov
ed(lb
s)
January1996
January1999
January1997
January1998
Cumulative Chlorinated VOCs in Groundwater
VOC Mass Removed from Groundwater/Month
Cumulative Total Mass (all sources)
Mon
thly
Mas
sR
emov
ed(lb
s)
Cum
ulat
ive
Mas
sR
emov
ed(lb
s)
January1996
January1999
January1997
January1998
Figure 3. Treatment Plant VOC Removal (all sources) - 1996 to 1999
Union Chemical Company
U.S. Environmental Protection Agency December 2001Office of Solid Waste and Emergency ResponseTechnology Innovation Office 14
Mon
thly
Mas
sR
emov
ed(lb
s)
Chlorinated VOCs/Month
Total VOCs/Month
Cumulative Chlorinated VOCs
Cum
ulat
ive
Mas
s(lb
s)
Cumulative VOCs (all)
January1996
January1999
January1997
January1998
Mon
thly
Mas
sR
emov
ed(lb
s)
Chlorinated VOCs/Month
Total VOCs/Month
Cumulative Chlorinated VOCs
Cum
ulat
ive
Mas
s(lb
s)
Cumulative VOCs (all)
January1996
January1999
January1997
January1998
January1996
January1999
January1997
January1998
Figure 4. Treatment Plant VOCs Removed From Groundwater - 1996 to 1999
Union Chemical Company
U.S. Environmental Protection Agency December 2001Office of Solid Waste and Emergency ResponseTechnology Innovation Office 15
Table 6. Summary of Groundwater Contaminant Concentrations at Union Chemical Company Superfund Site1[17]
WL WSZ MPSample
Date
1,1-DCA cis-1,2-DCE trans-1,2-DCE TCE Total Xylenes N,N-DMFConcentration
(ug/L) DL2Concentration
(ug/L) DL2Concentration
(ug/L) DL2Concentration
(ug/L) DL2Concentration
(ug/L) DL2Concentration
(ug/L) DL2
Target Cleanup Level = 5 ug/L 70 ug/L 100 ug/L 5 ug/L 10,000 ug/L 390 ug/LB-4 D 16 4/3/96 35 24 5 Yes 5 Yes 5 Yes 3 Yes
B-4 D 17 7/10/96 41 42 0.7 5.1 0.5 Yes 3 Yes
B-4 D 18 10/9/96 1300 660 50 Yes 330 50 Yes 1100B-4 D 21 7/29/97 380 230 2 110 5 200
B-4 D 22 10/23/97 280 170 2 88 3 Yes 220
B-4 D 26 11/11/99 NS 50 0.7 43 1 Yes NS
B-4 I 26 11/11/99 5 NDA NDA 8 1 Yes NS
B-5 D 21 7/29/97 100 0.5 Yes 0.5 Yes 0.5 Yes 0.5 Yes 210
B-5 D 22 10/23/97 81 0.5 Yes 0.5 Yes 0.5 Yes 0.5 Yes 140
B-5 D 23 4/28/98 70 0.5 Yes 0.5 Yes 0.5 0.5 Yes 41
B-5 D 24 10/6/98 280 0.5 Yes 0.5 Yes 0.5 Yes 0.5 Yes 180
B-5 D 25 4/7/99 170 NDA NDA 0.5 Yes 1 Yes 390
B-5 I 16 4/3/96 77 5 Yes 5 Yes 5 Yes 5 Yes 310
B-5 I 18 10/9/96 180 1.4 1 Yes 1.2 1 Yes 250
B-5 I 20 4/8/97 320 1 0.5 Yes 1 0.5 Yes 1800B-5 I 22 10/23/97 600 3 0.5 Yes 1 0.6 1300B-5 I 23 4/28/98 690 2 0.5 Yes 0.8 Yes 1 Yes 1200B-5 I 24 10/6/98 340 3 0.5 Yes 1 1 Yes 120
B-5 I 25 4/7/99 580 0.5 Yes 0.5 Yes 0.5 Yes 1 Yes 1300B-5 S 16 4/3/96 150 70 25 Yes 25 Yes 25 Yes 4.2 Yes
B-5 S 17 7/10/96 86 60 2.5 Yes 10 2.5 Yes 4.2
B-5 S 18 10/9/96 48 29 2.5 Yes 7.5 2.5 Yes 17
B-5 S 19 1/9/97 20 14 0.5 Yes 4 0.5 Yes 3 Yes
B-5 S 20 4/8/97 11 8 0.5 Yes 4 14 3 Yes
B-5 S 21 7/29/97 14 10 0.5 Yes 3 0.5 Yes 3 Yes
B-5 S 22 10/23/97 160 20 0.5 Yes 10 1 Yes 44
B-5 S 25 4/7/99 17 0.5 Yes 1 0.8 1 Yes 3 Yes
B-8 D 17 7/10/96 950 47 5 Yes 35 30 5800B-8 D 21 7/29/97 720 40 0.5 Yes 34 44 6300B-8 D 22 10/23/97 800 33 0.5 Yes 26 42 4900B-8 D 23 4/28/98 780 32 0.5 Yes 23 28 3700B-8 D 24 10/6/98 600 19 0.5 Yes 11 13 5800B-8 D 25 4/7/99 660 32 0.5 Yes 20 31 2900B-8 D 26 11/11/99 1100 47 5 Yes 31 34 3300B-8 I 15 1/4/96 140 10 Yes 10 Yes 10 Yes 10 Yes 16000
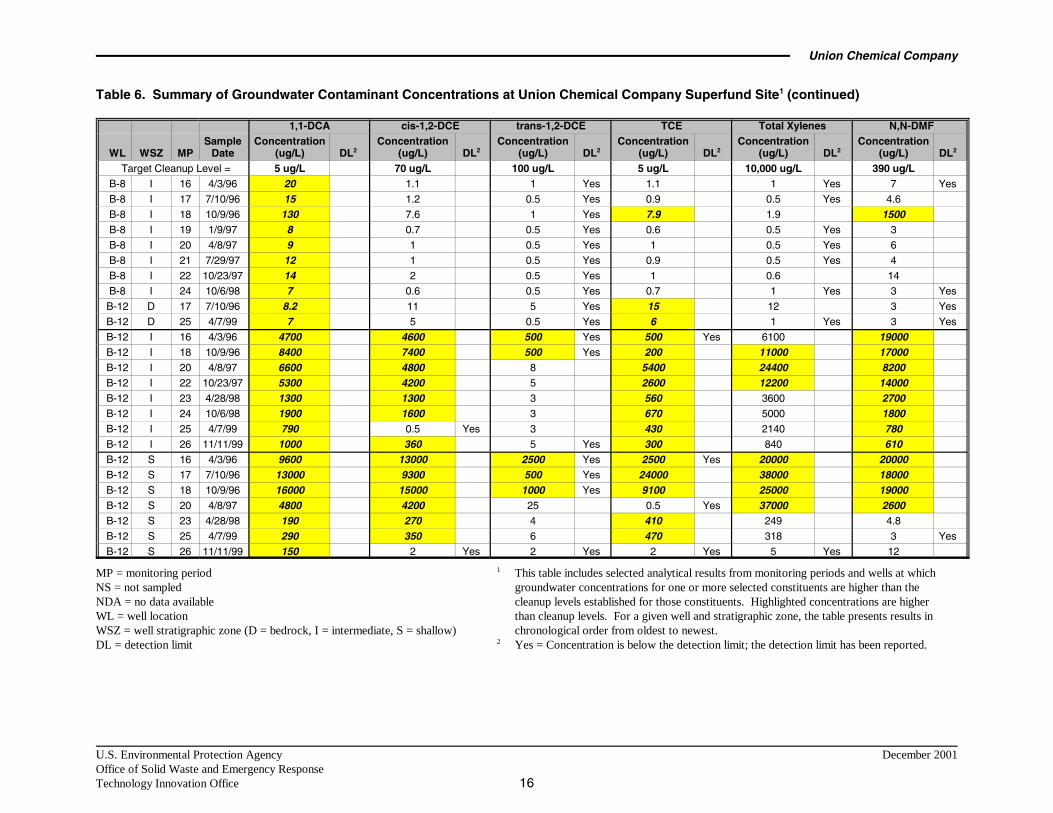
Table 6. Summary of Groundwater Contaminant Concentrations at Union Chemical Company Superfund Site1 (continued)
Union Chemical Company
WL WSZ MPSample
Date
1,1-DCA cis-1,2-DCE trans-1,2-DCE TCE Total Xylenes N,N-DMFConcentration
(ug/L) DL2Concentration
(ug/L) DL2Concentration
(ug/L) DL2Concentration
(ug/L) DL2Concentration
(ug/L) DL2Concentration
(ug/L) DL2
Target Cleanup Level = 5 ug/L 70 ug/L 100 ug/L 5 ug/L 10,000 ug/L 390 ug/L
U.S. Environmental Protection Agency December 2001Office of Solid Waste and Emergency ResponseTechnology Innovation Office 16
B-8 I 16 4/3/96 20 1.1 1 Yes 1.1 1 Yes 7 Yes
B-8 I 17 7/10/96 15 1.2 0.5 Yes 0.9 0.5 Yes 4.6
B-8 I 18 10/9/96 130 7.6 1 Yes 7.9 1.9 1500B-8 I 19 1/9/97 8 0.7 0.5 Yes 0.6 0.5 Yes 3
B-8 I 20 4/8/97 9 1 0.5 Yes 1 0.5 Yes 6
B-8 I 21 7/29/97 12 1 0.5 Yes 0.9 0.5 Yes 4
B-8 I 22 10/23/97 14 2 0.5 Yes 1 0.6 14
B-8 I 24 10/6/98 7 0.6 0.5 Yes 0.7 1 Yes 3 Yes
B-12 D 17 7/10/96 8.2 11 5 Yes 15 12 3 Yes
B-12 D 25 4/7/99 7 5 0.5 Yes 6 1 Yes 3 Yes
B-12 I 16 4/3/96 4700 4600 500 Yes 500 Yes 6100 19000B-12 I 18 10/9/96 8400 7400 500 Yes 200 11000 17000B-12 I 20 4/8/97 6600 4800 8 5400 24400 8200B-12 I 22 10/23/97 5300 4200 5 2600 12200 14000B-12 I 23 4/28/98 1300 1300 3 560 3600 2700B-12 I 24 10/6/98 1900 1600 3 670 5000 1800B-12 I 25 4/7/99 790 0.5 Yes 3 430 2140 780B-12 I 26 11/11/99 1000 360 5 Yes 300 840 610B-12 S 16 4/3/96 9600 13000 2500 Yes 2500 Yes 20000 20000B-12 S 17 7/10/96 13000 9300 500 Yes 24000 38000 18000B-12 S 18 10/9/96 16000 15000 1000 Yes 9100 25000 19000B-12 S 20 4/8/97 4800 4200 25 0.5 Yes 37000 2600B-12 S 23 4/28/98 190 270 4 410 249 4.8
B-12 S 25 4/7/99 290 350 6 470 318 3 Yes
B-12 S 26 11/11/99 150 2 Yes 2 Yes 2 Yes 5 Yes 12
MP = monitoring periodNS = not sampledNDA = no data availableWL = well locationWSZ = well stratigraphic zone (D = bedrock, I = intermediate, S = shallow)DL = detection limit
1 This table includes selected analytical results from monitoring periods and wells at whichgroundwater concentrations for one or more selected constituents are higher than thecleanup levels established for those constituents. Highlighted concentrations are higherthan cleanup levels. For a given well and stratigraphic zone, the table presents results inchronological order from oldest to newest.
2 Yes = Concentration is below the detection limit; the detection limit has been reported.
Union Chemical Company
U.S. Environmental Protection Agency December 2001Office of Solid Waste and Emergency ResponseTechnology Innovation Office 17
0.1
1
10
100
1000
10000
100000
Dec-95 Jun-96 Dec-96 Jun-97 Dec-97 Jun-98 Dec-98 Jun-99 Dec-99
Co
nce
ntr
atio
n(u
g/L
)
B-12-S B-12-I Cleanup Level
Figure 6. cis-1,2-DCE Concentrations in Selected Wells [10,11]
1
10
100
1000
10000
Dec-95 Jun-96 Dec-96 Jun-97 Dec-97 Jun-98 Dec-98 Jun-99 Dec-99
Co
nce
ntr
atio
n(u
g/L
)
Well B-12-I Well B-8-I Cleanup Level
Figure 5. 1,1- DCA Concentrations in Selected Wells [10,11]
Union Chemical Company
U.S. Environmental Protection Agency December 2001Office of Solid Waste and Emergency ResponseTechnology Innovation Office 18
0.1
1
10
100
1000
10000
Dec-95 Jun-96 Dec-96 Jun-97 Dec-97 Jun-98 Dec-98 Jun-99 Dec-99
Co
nce
ntr
atio
n(u
g/L
)
B-8-I B-12-I Cleanup Level
Figure 8. TCE Concentrations in Selected Wells [10,11]
1
10
100
1000
10000
Dec-95 Jun-96 Dec-96 Jun-97 Dec-97 Jun-98 Dec-98 Jun-99 Dec-99
Co
nce
ntr
atio
n(u
g/L
)
B-12-S Cleanup Level
Figure 7. trans-1,2-DCE Concentrations in Well B-12-S [10,11]
Union Chemical Company
U.S. Environmental Protection Agency December 2001Office of Solid Waste and Emergency ResponseTechnology Innovation Office 19
1
10
100
1000
10000
100000
Dec-95 Jun-96 Dec-96 Jun-97 Dec-97 Jun-98 Dec-98 Jun-99 Dec-99
Co
nce
ntr
atio
n(u
g/L
)
B-12-S Cleanup Level
Figure 9. Total Xylene Concentrations in Well B-12-S [10,11]
1
10
100
1000
10000
100000
Dec-95 Jun-96 Dec-96 Jun-97 Dec-97 Jun-98 Dec-98 Jun-99 Dec-99
Co
nce
ntr
atio
n(u
g/L
)
B-8-I B-12-I Cleanup Level
Figure 10. N,N-DMF Concentrations in Selected Wells [10,11]
Union Chemical Company
U.S. Environmental Protection Agency December 2001Office of Solid Waste and Emergency ResponseTechnology Innovation Office 20
4,800
3,000
3,600
85
1,900
970
0
1000
2000
3000
4000
5000
6000
1,1-DCA TCE N,N-DMF
Co
nce
ntr
atio
n(u
g/L
)
1/17/1996
11/4/1999
Figure 11. Contaminant concentrations in the Influent to the Aboveground Treatment System [11]
Soil Vapor Extraction
• Nearly 9,000 lbs of VOCs were removed by the SVE system over the period from 1996 to June 1999.The majority of this removal occurred in 1996 and 1997, with 8,700 lbs removed in that two-yearperiod. No additional information was provided about the concentrations of contaminants in soil or soilgas at the site during this time period.
• According to the RPM, the results from a September 1998 sampling event showed that the soil was incompliance with target soil cleanup levels.
In Situ Chemical Oxidation
C IT Corporation considered three methods for evaluating the performance of in situ chemical oxidationat this site: (1) reductions over time in the level of contaminants in the influent to the abovegroundtreatment system, (2) reductions over time in the level of contaminants in individual wells at the site; or(3) reductions over time in the level of contaminants across the entire area where in situ chemicaloxidation was performed (area-wide method). Based on the results from a pilot study, IT Corporationselected the area-wide method as being the most comprehensive.
C The area-wide method involved measuring the contaminant concentrations in the groundwater in April1999, November 1999, and April 2000 in the areas where in situ chemical oxidation was beingperformed.
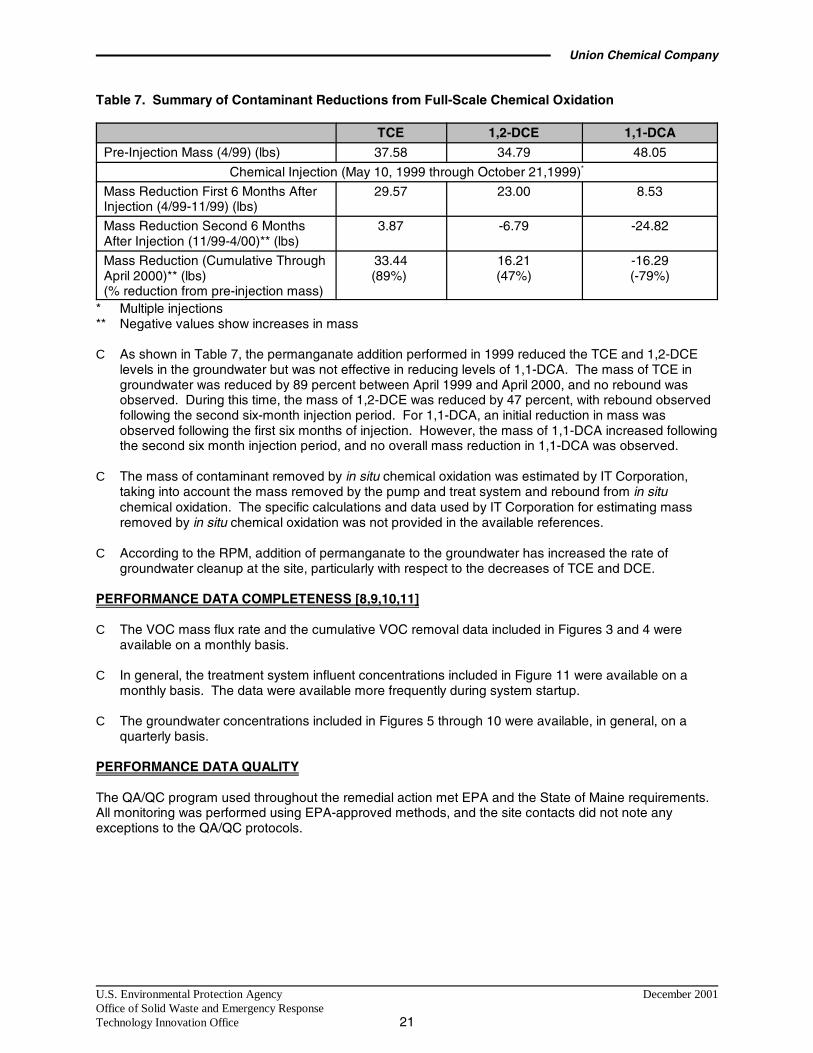
C Table 7 presents the estimated mass of TCE, 1,2-DCE, and 1,1-DCA removed from the groundwateras a result of the in situ chemical oxidation technology and the percent reduction through April 2000.In addition, data are provided for the first six months and the second six months following injection ofpermanganate.
Union Chemical Company
U.S. Environmental Protection Agency December 2001Office of Solid Waste and Emergency ResponseTechnology Innovation Office 21
Table 7. Summary of Contaminant Reductions from Full-Scale Chemical Oxidation
TCE 1,2-DCE 1,1-DCA
Pre-Injection Mass (4/99) (lbs) 37.58 34.79 48.05
Chemical Injection (May 10, 1999 through October 21,1999)*
Mass Reduction First 6 Months AfterInjection (4/99-11/99) (lbs)
29.57 23.00 8.53
Mass Reduction Second 6 MonthsAfter Injection (11/99-4/00)** (lbs)
3.87 -6.79 -24.82
Mass Reduction (Cumulative ThroughApril 2000)** (lbs)(% reduction from pre-injection mass)
33.44(89%)
16.21(47%)
-16.29(-79%)
* Multiple injections** Negative values show increases in mass
C As shown in Table 7, the permanganate addition performed in 1999 reduced the TCE and 1,2-DCElevels in the groundwater but was not effective in reducing levels of 1,1-DCA. The mass of TCE ingroundwater was reduced by 89 percent between April 1999 and April 2000, and no rebound wasobserved. During this time, the mass of 1,2-DCE was reduced by 47 percent, with rebound observedfollowing the second six-month injection period. For 1,1-DCA, an initial reduction in mass wasobserved following the first six months of injection. However, the mass of 1,1-DCA increased followingthe second six month injection period, and no overall mass reduction in 1,1-DCA was observed.
C The mass of contaminant removed by in situ chemical oxidation was estimated by IT Corporation,taking into account the mass removed by the pump and treat system and rebound from in situchemical oxidation. The specific calculations and data used by IT Corporation for estimating massremoved by in situ chemical oxidation was not provided in the available references.
C According to the RPM, addition of permanganate to the groundwater has increased the rate ofgroundwater cleanup at the site, particularly with respect to the decreases of TCE and DCE.
PERFORMANCE DATA COMPLETENESS [8,9,10,11]
C The VOC mass flux rate and the cumulative VOC removal data included in Figures 3 and 4 wereavailable on a monthly basis.
C In general, the treatment system influent concentrations included in Figure 11 were available on amonthly basis. The data were available more frequently during system startup.
C The groundwater concentrations included in Figures 5 through 10 were available, in general, on aquarterly basis.
PERFORMANCE DATA QUALITY
The QA/QC program used throughout the remedial action met EPA and the State of Maine requirements.All monitoring was performed using EPA-approved methods, and the site contacts did not note anyexceptions to the QA/QC protocols.
Union Chemical Company
U.S. Environmental Protection Agency December 2001Office of Solid Waste and Emergency ResponseTechnology Innovation Office 22
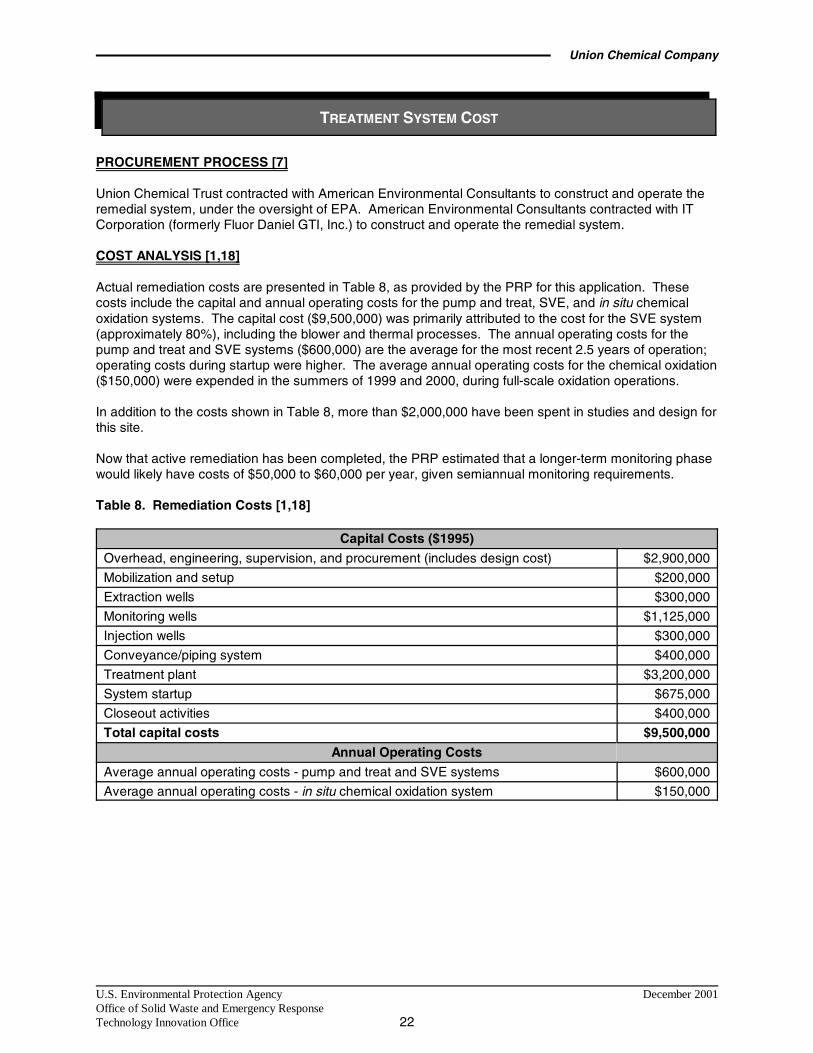
TREATMENT SYSTEM COST
PROCUREMENT PROCESS [7]
Union Chemical Trust contracted with American Environmental Consultants to construct and operate theremedial system, under the oversight of EPA. American Environmental Consultants contracted with ITCorporation (formerly Fluor Daniel GTI, Inc.) to construct and operate the remedial system.
COST ANALYSIS [1,18]
Actual remediation costs are presented in Table 8, as provided by the PRP for this application. Thesecosts include the capital and annual operating costs for the pump and treat, SVE, and in situ chemicaloxidation systems. The capital cost ($9,500,000) was primarily attributed to the cost for the SVE system(approximately 80%), including the blower and thermal processes. The annual operating costs for thepump and treat and SVE systems ($600,000) are the average for the most recent 2.5 years of operation;operating costs during startup were higher. The average annual operating costs for the chemical oxidation($150,000) were expended in the summers of 1999 and 2000, during full-scale oxidation operations.
In addition to the costs shown in Table 8, more than $2,000,000 have been spent in studies and design forthis site.
Now that active remediation has been completed, the PRP estimated that a longer-term monitoring phasewould likely have costs of $50,000 to $60,000 per year, given semiannual monitoring requirements.
Table 8. Remediation Costs [1,18]
Capital Costs ($1995)
Overhead, engineering, supervision, and procurement (includes design cost) $2,900,000
Mobilization and setup $200,000
Extraction wells $300,000
Monitoring wells $1,125,000
Injection wells $300,000
Conveyance/piping system $400,000
Treatment plant $3,200,000
System startup $675,000
Closeout activities $400,000
Total capital costs $9,500,000
Annual Operating Costs
Average annual operating costs - pump and treat and SVE systems $600,000
Average annual operating costs - in situ chemical oxidation system $150,000
Union Chemical Company
U.S. Environmental Protection Agency December 2001Office of Solid Waste and Emergency ResponseTechnology Innovation Office 23
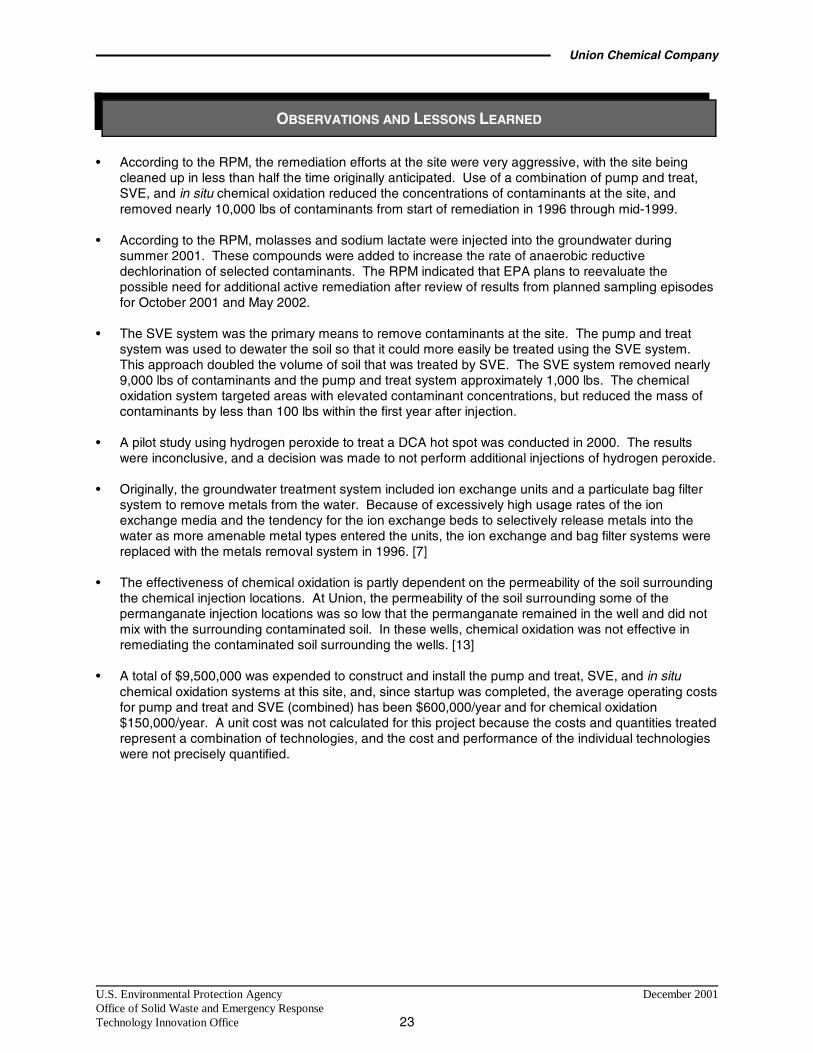
OBSERVATIONS AND LESSONS LEARNED
• According to the RPM, the remediation efforts at the site were very aggressive, with the site beingcleaned up in less than half the time originally anticipated. Use of a combination of pump and treat,SVE, and in situ chemical oxidation reduced the concentrations of contaminants at the site, andremoved nearly 10,000 lbs of contaminants from start of remediation in 1996 through mid-1999.
• According to the RPM, molasses and sodium lactate were injected into the groundwater duringsummer 2001. These compounds were added to increase the rate of anaerobic reductivedechlorination of selected contaminants. The RPM indicated that EPA plans to reevaluate thepossible need for additional active remediation after review of results from planned sampling episodesfor October 2001 and May 2002.
• The SVE system was the primary means to remove contaminants at the site. The pump and treatsystem was used to dewater the soil so that it could more easily be treated using the SVE system.This approach doubled the volume of soil that was treated by SVE. The SVE system removed nearly9,000 lbs of contaminants and the pump and treat system approximately 1,000 lbs. The chemicaloxidation system targeted areas with elevated contaminant concentrations, but reduced the mass ofcontaminants by less than 100 lbs within the first year after injection.
• A pilot study using hydrogen peroxide to treat a DCA hot spot was conducted in 2000. The resultswere inconclusive, and a decision was made to not perform additional injections of hydrogen peroxide.
• Originally, the groundwater treatment system included ion exchange units and a particulate bag filtersystem to remove metals from the water. Because of excessively high usage rates of the ionexchange media and the tendency for the ion exchange beds to selectively release metals into thewater as more amenable metal types entered the units, the ion exchange and bag filter systems werereplaced with the metals removal system in 1996. [7]
• The effectiveness of chemical oxidation is partly dependent on the permeability of the soil surroundingthe chemical injection locations. At Union, the permeability of the soil surrounding some of thepermanganate injection locations was so low that the permanganate remained in the well and did notmix with the surrounding contaminated soil. In these wells, chemical oxidation was not effective inremediating the contaminated soil surrounding the wells. [13]
• A total of $9,500,000 was expended to construct and install the pump and treat, SVE, and in situchemical oxidation systems at this site, and, since startup was completed, the average operating costsfor pump and treat and SVE (combined) has been $600,000/year and for chemical oxidation$150,000/year. A unit cost was not calculated for this project because the costs and quantities treatedrepresent a combination of technologies, and the cost and performance of the individual technologieswere not precisely quantified.
Union Chemical Company
U.S. Environmental Protection Agency December 2001Office of Solid Waste and Emergency ResponseTechnology Innovation Office 24
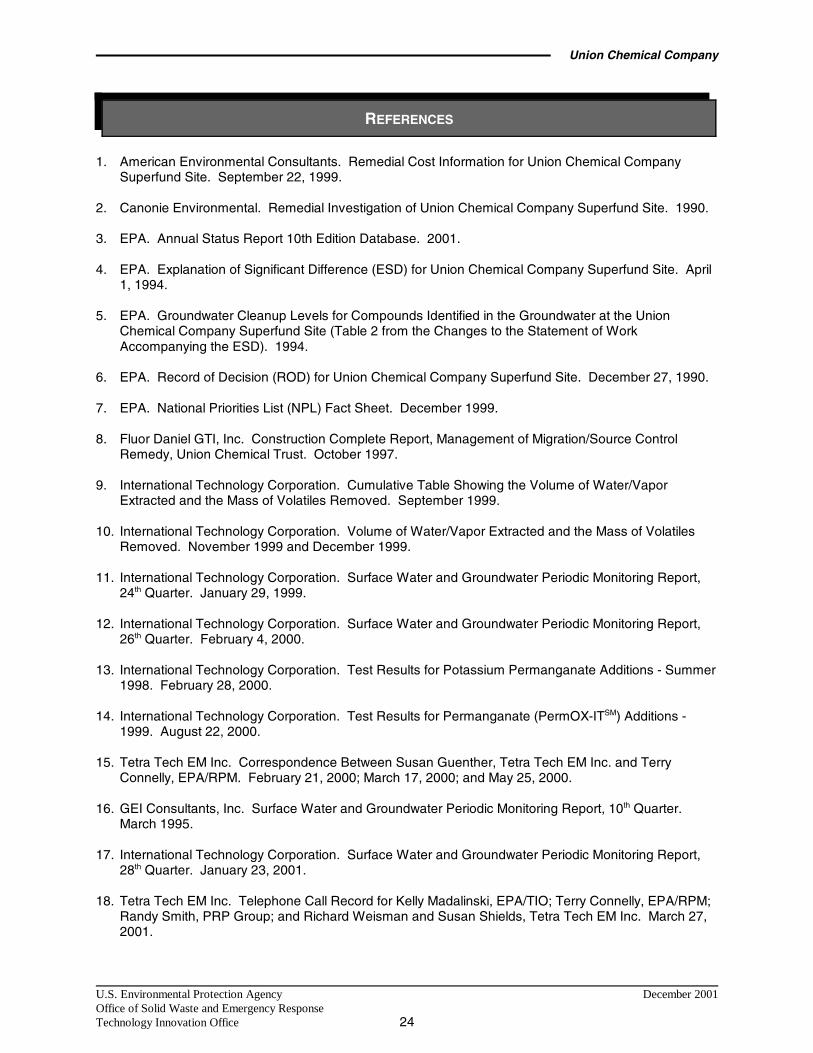
REFERENCES
1. American Environmental Consultants. Remedial Cost Information for Union Chemical CompanySuperfund Site. September 22, 1999.
2. Canonie Environmental. Remedial Investigation of Union Chemical Company Superfund Site. 1990.
3. EPA. Annual Status Report 10th Edition Database. 2001.
4. EPA. Explanation of Significant Difference (ESD) for Union Chemical Company Superfund Site. April1, 1994.
5. EPA. Groundwater Cleanup Levels for Compounds Identified in the Groundwater at the UnionChemical Company Superfund Site (Table 2 from the Changes to the Statement of WorkAccompanying the ESD). 1994.
6. EPA. Record of Decision (ROD) for Union Chemical Company Superfund Site. December 27, 1990.
7. EPA. National Priorities List (NPL) Fact Sheet. December 1999.
8. Fluor Daniel GTI, Inc. Construction Complete Report, Management of Migration/Source ControlRemedy, Union Chemical Trust. October 1997.
9. International Technology Corporation. Cumulative Table Showing the Volume of Water/VaporExtracted and the Mass of Volatiles Removed. September 1999.
10. International Technology Corporation. Volume of Water/Vapor Extracted and the Mass of VolatilesRemoved. November 1999 and December 1999.
11. International Technology Corporation. Surface Water and Groundwater Periodic Monitoring Report,24th Quarter. January 29, 1999.
12. International Technology Corporation. Surface Water and Groundwater Periodic Monitoring Report,26th Quarter. February 4, 2000.
13. International Technology Corporation. Test Results for Potassium Permanganate Additions - Summer1998. February 28, 2000.
14. International Technology Corporation. Test Results for Permanganate (PermOX-ITSM) Additions -1999. August 22, 2000.
15. Tetra Tech EM Inc. Correspondence Between Susan Guenther, Tetra Tech EM Inc. and TerryConnelly, EPA/RPM. February 21, 2000; March 17, 2000; and May 25, 2000.
16. GEI Consultants, Inc. Surface Water and Groundwater Periodic Monitoring Report, 10th Quarter.March 1995.
17. International Technology Corporation. Surface Water and Groundwater Periodic Monitoring Report,28th Quarter. January 23, 2001.
18. Tetra Tech EM Inc. Telephone Call Record for Kelly Madalinski, EPA/TIO; Terry Connelly, EPA/RPM;Randy Smith, PRP Group; and Richard Weisman and Susan Shields, Tetra Tech EM Inc. March 27,2001.
Union Chemical Company
U.S. Environmental Protection Agency December 2001Office of Solid Waste and Emergency ResponseTechnology Innovation Office 25
ADDITIONAL INFORMATION SOURCES
1. EPA. Administrative Record Index for Union Chemical Company Superfund Site (from Region ISuperfund Records). May 1, 1990.
2. EPA. Technical Review of Union Chemical Company’s Part B Application. February 7, 1984.
ANALYSIS PREPARATION
This case study was prepared for the U.S. Environmental Protection Agency’s Office of Solid Waste andEmergency Response, Technology Innovation Office. Assistance was provided by Tetra Tech EM Inc.under Contract No. 68-W-99-003.