Embed Size (px)
Citation preview
Cost of Preschool Quality & Revenue – User Guide
George Rickus, GG Weisenfeld, Richard Kasmin, Tracy Jost January 2018
1
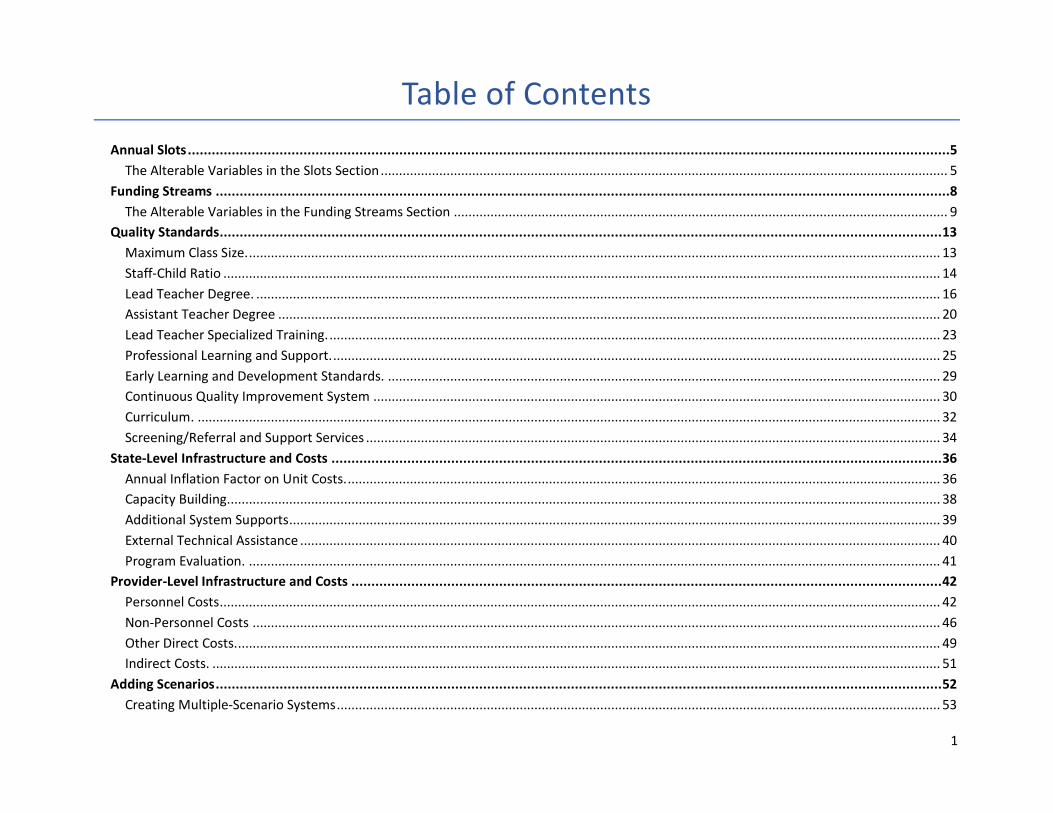
Table of Contents
Annual Slots ...............................................................................................................................................................................................5
The Alterable Variables in the Slots Section ........................................................................................................................................................... 5
Funding Streams ........................................................................................................................................................................................8
The Alterable Variables in the Funding Streams Section ....................................................................................................................................... 9
Quality Standards ..................................................................................................................................................................................... 13
Maximum Class Size. ............................................................................................................................................................................................. 13
Staff-Child Ratio .................................................................................................................................................................................................... 14
Lead Teacher Degree. ........................................................................................................................................................................................... 16
Assistant Teacher Degree ..................................................................................................................................................................................... 20
Lead Teacher Specialized Training. ....................................................................................................................................................................... 23
Professional Learning and Support. ...................................................................................................................................................................... 25
Early Learning and Development Standards. ....................................................................................................................................................... 29
Continuous Quality Improvement System ........................................................................................................................................................... 30
Curriculum. ........................................................................................................................................................................................................... 32
Screening/Referral and Support Services ............................................................................................................................................................. 34
State-Level Infrastructure and Costs ......................................................................................................................................................... 36
Annual Inflation Factor on Unit Costs. .................................................................................................................................................................. 36
Capacity Building................................................................................................................................................................................................... 38
Additional System Supports.................................................................................................................................................................................. 39
External Technical Assistance ............................................................................................................................................................................... 40
Program Evaluation. ............................................................................................................................................................................................. 41
Provider-Level Infrastructure and Costs .................................................................................................................................................... 42
Personnel Costs..................................................................................................................................................................................................... 42
Non-Personnel Costs ............................................................................................................................................................................................ 46
Other Direct Costs................................................................................................................................................................................................. 49
Indirect Costs. ....................................................................................................................................................................................................... 51
Adding Scenarios ...................................................................................................................................................................................... 52
Creating Multiple-Scenario Systems ..................................................................................................................................................................... 53
2
User Guide
There are five categories of data in which the user can alter inputs:
1. Slots
2. Funding
3. Quality Standards
4. State-Level Infrastructure and Costs
5. Provider-Level Infrastructure and Costs
Your first step is to select your state from the drop-down menu in Row 5 of Worksheet B. The CPQ&R is pre-loaded with demographic data by
state from national sources. These research-based default assumptions help you to immediately begin to see costs upon entering a slot count—
for one year or over several years.
It is also important for you to be aware of the following key to cell shading in the CPQ&R:
• Yellow-shaded cells indicate where you can input or alter data.
• Green-shaded cells identify summary costs and key metrics. These cells contain formulas that should not, in most cases, be modified by the user.
• All other white-shaded cells, and in particular any white-shaded cells containing formulas, should only be modified if the user possesses a thorough understanding of the implications of such modifications to other cells within the model. However, the CPQ&R was designed to accommodate customization by states and such changes are anticipated by more experienced users.
The following sections of this User Guide describe how to enter annual slot counts as well as other variables including quality indicators and
infrastructure level costs at both the state and provider level. To enter an annual slot count, you may begin with the HOME Page of the CPQ&R,
which provides the most intuitive way to navigate the calculator.
A depiction of the HOME Page is show below, formatted around the five categories of data:
3
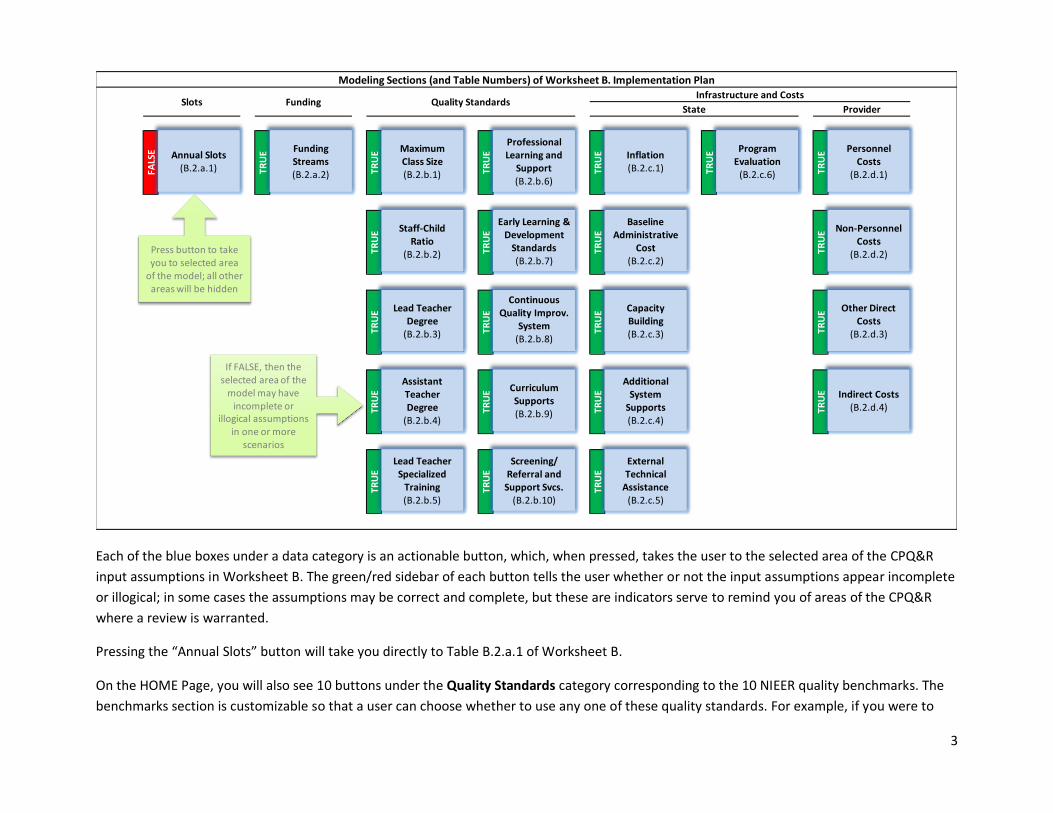
Each of the blue boxes under a data category is an actionable button, which, when pressed, takes the user to the selected area of the CPQ&R
input assumptions in Worksheet B. The green/red sidebar of each button tells the user whether or not the input assumptions appear incomplete
or illogical; in some cases the assumptions may be correct and complete, but these are indicators serve to remind you of areas of the CPQ&R
where a review is warranted.
Pressing the “Annual Slots” button will take you directly to Table B.2.a.1 of Worksheet B.
On the HOME Page, you will also see 10 buttons under the Quality Standards category corresponding to the 10 NIEER quality benchmarks. The
benchmarks section is customizable so that a user can choose whether to use any one of these quality standards. For example, if you were to
FALS
E
TRU
E
TRU
E
TRU
E
TRU
E
Modeling Sections (and Table Numbers) of Worksheet B. Implementation Plan
Slots Funding Quality StandardsInfrastructure and Costs
State Provider
TRU
E
TRU
E
TRU
E
TRU
E
TRU
ETR
UE
TRU
E
TRU
E
TRU
E
TRU
E
TRU
E
TRU
E
TRU
E
TRU
E
TRU
E
TRU
E
TRU
E
Annual Slots (B.2.a.1)
Funding Streams (B.2.a.2)
Maximum Class Size(B.2.b.1)
Staff-Child Ratio
(B.2.b.2)
Lead Teacher Degree
(B.2.b.3)
AssistantTeacher Degree
(B.2.b.4)
Lead Teacher Specialized
Training(B.2.b.5)
ProfessionalLearning and
Support(B.2.b.6)
Early Learning & Development
Standards(B.2.b.7)
ContinuousQuality Improv.
System(B.2.b.8)
CurriculumSupports(B.2.b.9)
Screening/Referral and
Support Svcs.(B.2.b.10)
Inflation(B.2.c.1)
Baseline Administrative
Cost(B.2.c.2)
CapacityBuilding(B.2.c.3)
AdditionalSystem
Supports(B.2.c.4)
ExternalTechnical
Assistance (B.2.c.5)
ProgramEvaluation
(B.2.c.6)
Personnel Costs
(B.2.d.1)
Non-PersonnelCosts
(B.2.d.2)
Other Direct Costs
(B.2.d.3)
Indirect Costs(B.2.d.4)
Press button to take you to selected area
of the model; all other areas will be hidden
If FALSE, then the selected area of the
model may have incomplete or
illogical assumptions in one or more
scenarios
4
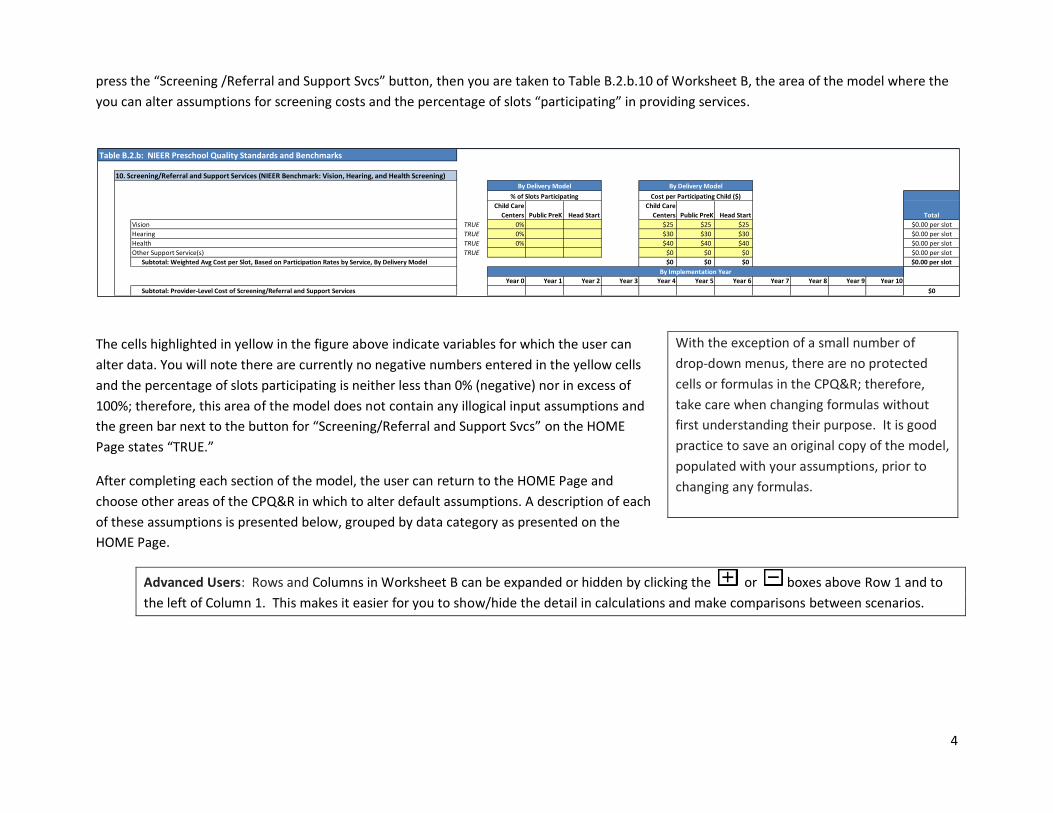
press the “Screening /Referral and Support Svcs” button, then you are taken to Table B.2.b.10 of Worksheet B, the area of the model where the
you can alter assumptions for screening costs and the percentage of slots “participating” in providing services.
The cells highlighted in yellow in the figure above indicate variables for which the user can
alter data. You will note there are currently no negative numbers entered in the yellow cells
and the percentage of slots participating is neither less than 0% (negative) nor in excess of
100%; therefore, this area of the model does not contain any illogical input assumptions and
the green bar next to the button for “Screening/Referral and Support Svcs” on the HOME
Page states “TRUE.”
After completing each section of the model, the user can return to the HOME Page and
choose other areas of the CPQ&R in which to alter default assumptions. A description of each
of these assumptions is presented below, grouped by data category as presented on the
HOME Page.
Advanced Users: Rows and Columns in Worksheet B can be expanded or hidden by clicking the or boxes above Row 1 and to
the left of Column 1. This makes it easier for you to show/hide the detail in calculations and make comparisons between scenarios.
Table B.2.b: NIEER Preschool Quality Standards and Benchmarks
10. Screening/Referral and Support Services (NIEER Benchmark: Vision, Hearing, and Health Screening)
By Delivery Model By Delivery Model
% of Slots Participating Cost per Participating Child ($)
Child Care
Centers Public PreK Head Start
Child Care
Centers Public PreK Head Start
Vision TRUE 0% $25 $25 $25 $0.00 per slot
Hearing TRUE 0% $30 $30 $30 $0.00 per slot
Health TRUE 0% $40 $40 $40 $0.00 per slot
Other Support Service(s) TRUE $0 $0 $0 $0.00 per slot
Subtotal: Weighted Avg Cost per Slot, Based on Participation Rates by Service, By Delivery Model $0 $0 $0 $0.00 per slot
By Implementation Year
Year 0 Year 1 Year 2 Year 3 Year 4 Year 5 Year 6 Year 7 Year 8 Year 9 Year 10
Subtotal: Provider-Level Cost of Screening/Referral and Support Services $0
Total
With the exception of a small number of
drop-down menus, there are no protected
cells or formulas in the CPQ&R; therefore,
take care when changing formulas without
first understanding their purpose. It is good
practice to save an original copy of the model,
populated with your assumptions, prior to
changing any formulas.
5
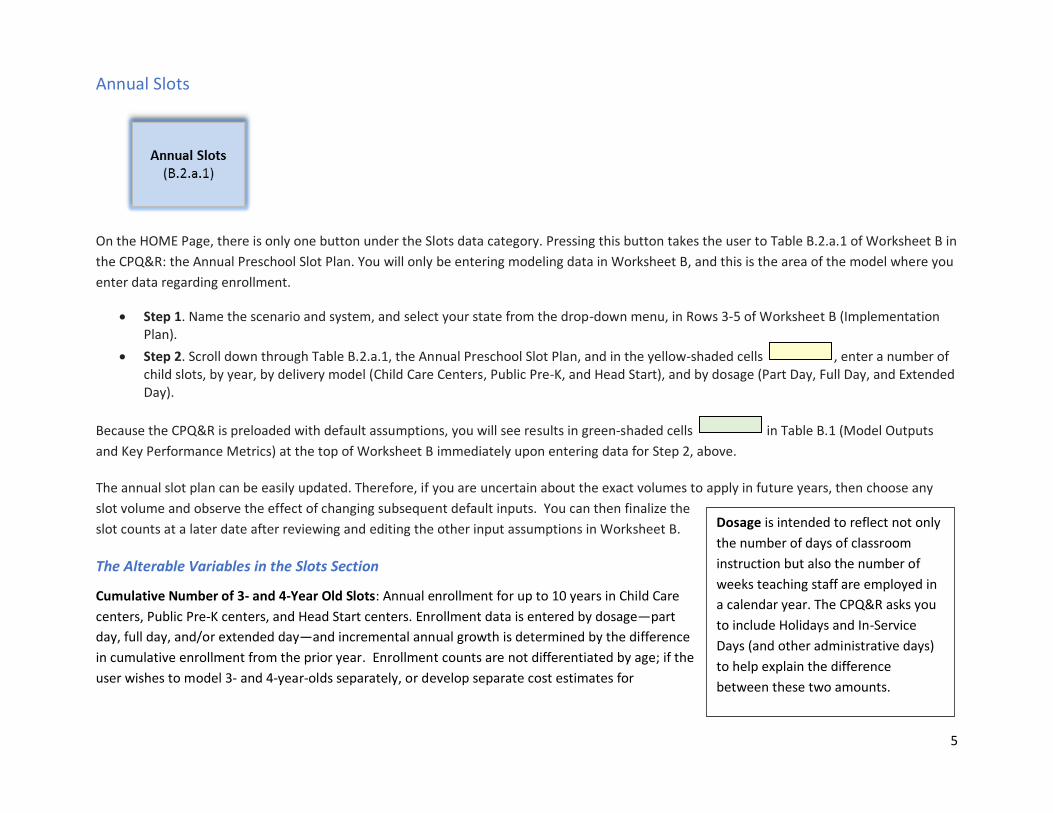
Annual Slots
On the HOME Page, there is only one button under the Slots data category. Pressing this button takes the user to Table B.2.a.1 of Worksheet B in
the CPQ&R: the Annual Preschool Slot Plan. You will only be entering modeling data in Worksheet B, and this is the area of the model where you
enter data regarding enrollment.
• Step 1. Name the scenario and system, and select your state from the drop-down menu, in Rows 3-5 of Worksheet B (Implementation Plan).
• Step 2. Scroll down through Table B.2.a.1, the Annual Preschool Slot Plan, and in the yellow-shaded cells , enter a number of child slots, by year, by delivery model (Child Care Centers, Public Pre-K, and Head Start), and by dosage (Part Day, Full Day, and Extended Day).
Because the CPQ&R is preloaded with default assumptions, you will see results in green-shaded cells in Table B.1 (Model Outputs
and Key Performance Metrics) at the top of Worksheet B immediately upon entering data for Step 2, above.
The annual slot plan can be easily updated. Therefore, if you are uncertain about the exact volumes to apply in future years, then choose any
slot volume and observe the effect of changing subsequent default inputs. You can then finalize the
slot counts at a later date after reviewing and editing the other input assumptions in Worksheet B.
The Alterable Variables in the Slots Section
Cumulative Number of 3- and 4-Year Old Slots: Annual enrollment for up to 10 years in Child Care
centers, Public Pre-K centers, and Head Start centers. Enrollment data is entered by dosage—part
day, full day, and/or extended day—and incremental annual growth is determined by the difference
in cumulative enrollment from the prior year. Enrollment counts are not differentiated by age; if the
user wishes to model 3- and 4-year-olds separately, or develop separate cost estimates for
Dosage is intended to reflect not only
the number of days of classroom
instruction but also the number of
weeks teaching staff are employed in
a calendar year. The CPQ&R asks you
to include Holidays and In-Service
Days (and other administrative days)
to help explain the difference
between these two amounts.
6
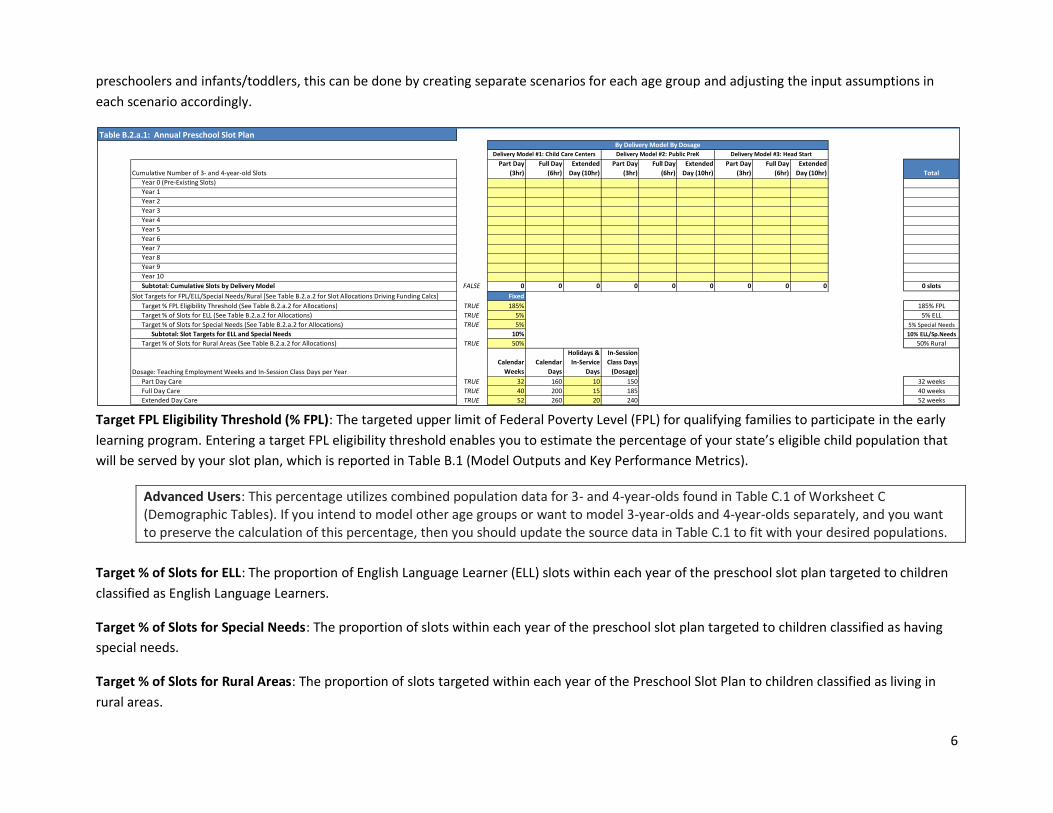
preschoolers and infants/toddlers, this can be done by creating separate scenarios for each age group and adjusting the input assumptions in
each scenario accordingly.
Target FPL Eligibility Threshold (% FPL): The targeted upper limit of Federal Poverty Level (FPL) for qualifying families to participate in the early
learning program. Entering a target FPL eligibility threshold enables you to estimate the percentage of your state’s eligible child population that
will be served by your slot plan, which is reported in Table B.1 (Model Outputs and Key Performance Metrics).
Advanced Users: This percentage utilizes combined population data for 3- and 4-year-olds found in Table C.1 of Worksheet C (Demographic Tables). If you intend to model other age groups or want to model 3-year-olds and 4-year-olds separately, and you want to preserve the calculation of this percentage, then you should update the source data in Table C.1 to fit with your desired populations.
Target % of Slots for ELL: The proportion of English Language Learner (ELL) slots within each year of the preschool slot plan targeted to children
classified as English Language Learners.
Target % of Slots for Special Needs: The proportion of slots within each year of the preschool slot plan targeted to children classified as having
special needs.
Target % of Slots for Rural Areas: The proportion of slots targeted within each year of the Preschool Slot Plan to children classified as living in
rural areas.
Table B.2.a.1: Annual Preschool Slot PlanBy Delivery Model By Dosage
Delivery Model #1: Child Care Centers Delivery Model #2: Public PreK Delivery Model #3: Head Start
Cumulative Number of 3- and 4-year-old Slots
Part Day
(3hr)
Full Day
(6hr)
Extended
Day (10hr)
Part Day
(3hr)
Full Day
(6hr)
Extended
Day (10hr)
Part Day
(3hr)
Full Day
(6hr)
Extended
Day (10hr) Total
Year 0 (Pre-Existing Slots)
Year 1
Year 2
Year 3
Year 4
Year 5
Year 6
Year 7
Year 8
Year 9
Year 10
Subtotal: Cumulative Slots by Delivery Model FALSE 0 0 0 0 0 0 0 0 0 0 slots
Slot Targets for FPL/ELL/Special Needs/Rural [See Table B.2.a.2 for Slot Allocations Driving Funding Calcs] Fixed
Target % FPL Eligibility Threshold (See Table B.2.a.2 for Allocations) TRUE 185% 185% FPL
Target % of Slots for ELL (See Table B.2.a.2 for Allocations) TRUE 5% 5% ELL
Target % of Slots for Special Needs (See Table B.2.a.2 for Allocations) TRUE 5% 5% Special Needs
Subtotal: Slot Targets for ELL and Special Needs 10% 10% ELL/Sp.Needs
Target % of Slots for Rural Areas (See Table B.2.a.2 for Allocations) TRUE 50% 50% Rural
Dosage: Teaching Employment Weeks and In-Session Class Days per Year
Calendar
Weeks
Calendar
Days
Holidays &
In-Service
Days
In-Session
Class Days
(Dosage)
Part Day Care TRUE 32 160 10 150 32 weeks
Full Day Care TRUE 40 200 15 185 40 weeks
Extended Day Care TRUE 52 260 20 240 52 weeks
7
Advanced Users: Although your unit cost assumptions in the CPQ&R should be consistent with your targets for FPL-Eligibility, ELL, Special Needs, and Rural Areas in Table B.2.a.1, these assumptions are not directly linked to any cost or funding calculations in the default version of the CPQ&R. The Funding Streams section of Worksheet B will ask you to separately establish more detailed allocation assumptions (note the distinction between ‘target’ and ‘allocation’ that will be used in calculating the available funding based on enrollment under your preschool slot plan. If you do not plan to use the CPQ&R to estimate funding, then you will not need to specify these allocations.
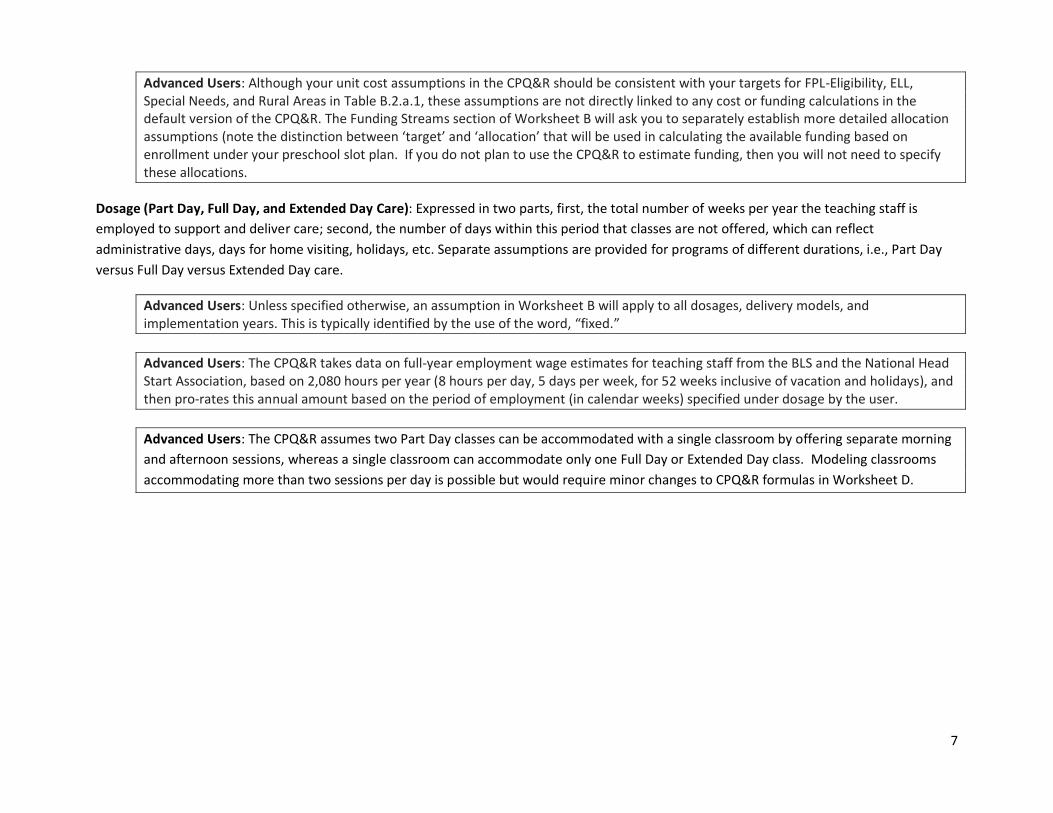
Dosage (Part Day, Full Day, and Extended Day Care): Expressed in two parts, first, the total number of weeks per year the teaching staff is
employed to support and deliver care; second, the number of days within this period that classes are not offered, which can reflect
administrative days, days for home visiting, holidays, etc. Separate assumptions are provided for programs of different durations, i.e., Part Day
versus Full Day versus Extended Day care.
Advanced Users: Unless specified otherwise, an assumption in Worksheet B will apply to all dosages, delivery models, and implementation years. This is typically identified by the use of the word, “fixed.”
Advanced Users: The CPQ&R takes data on full-year employment wage estimates for teaching staff from the BLS and the National Head Start Association, based on 2,080 hours per year (8 hours per day, 5 days per week, for 52 weeks inclusive of vacation and holidays), and then pro-rates this annual amount based on the period of employment (in calendar weeks) specified under dosage by the user.
Advanced Users: The CPQ&R assumes two Part Day classes can be accommodated with a single classroom by offering separate morning
and afternoon sessions, whereas a single classroom can accommodate only one Full Day or Extended Day class. Modeling classrooms
accommodating more than two sessions per day is possible but would require minor changes to CPQ&R formulas in Worksheet D.

8
Advanced Users: The CPQ&R assumes teaching staff are working full-time within their employment period. As a result, the exact hourly
duration of a class is less important than its program categorization—as Part Day, Full Day, or Extended Day—in generating staffing
costs.1 The default input assumptions identify these programs as 3-, 6-, and 10-hours in duration, respectively, but the CPQ&R can
accommodate different durations so long as the user understands how other assumptions may be affected adjusts them accordingly.
Advanced Users: The CPQ&R is designed to accommodate up to three delivery models and three dosages per scenario, but users can
repurpose any or all models and dosages to fit their particular situation, with the appropriate changes to the other default input
assumptions within the model.
Funding Streams
On the HOME Page, there is only one button in the Funding category. Pressing this button on the Home tab takes the user to Table B.2.a.2 of
Worksheet B: Available Funding Streams. This is the area of the model where you enter funding data. This section allows the user to compare
estimated funding with expected costs, and is designed to accommodate the disparate nature of funding sources for early learning programs.
You are not required to estimate funding to use the CPQ&R for cost estimation.
The Available Funding Streams component of the CPQ&R is organized into four sections:
1. Expanded Child Eligibility Assumptions for Funding Restrictions. This section contains a table dedicated to establishing the proportion of
children expected to meet various eligibility criteria by delivery model. In this section, you can define income eligibility thresholds and
1 A small change in the class duration, e.g. 2.5 hours per day instead of 3, is not material to the model unless it results in a change in user input assumptions for either the number of classes that can be taught within a single classroom per day or the number of teaching staff required to support each class. Extended Day care can present situations wherein the class duration exceeds normal working hours and additional staff must be rotated into the class to relieve the daytime staff.
9
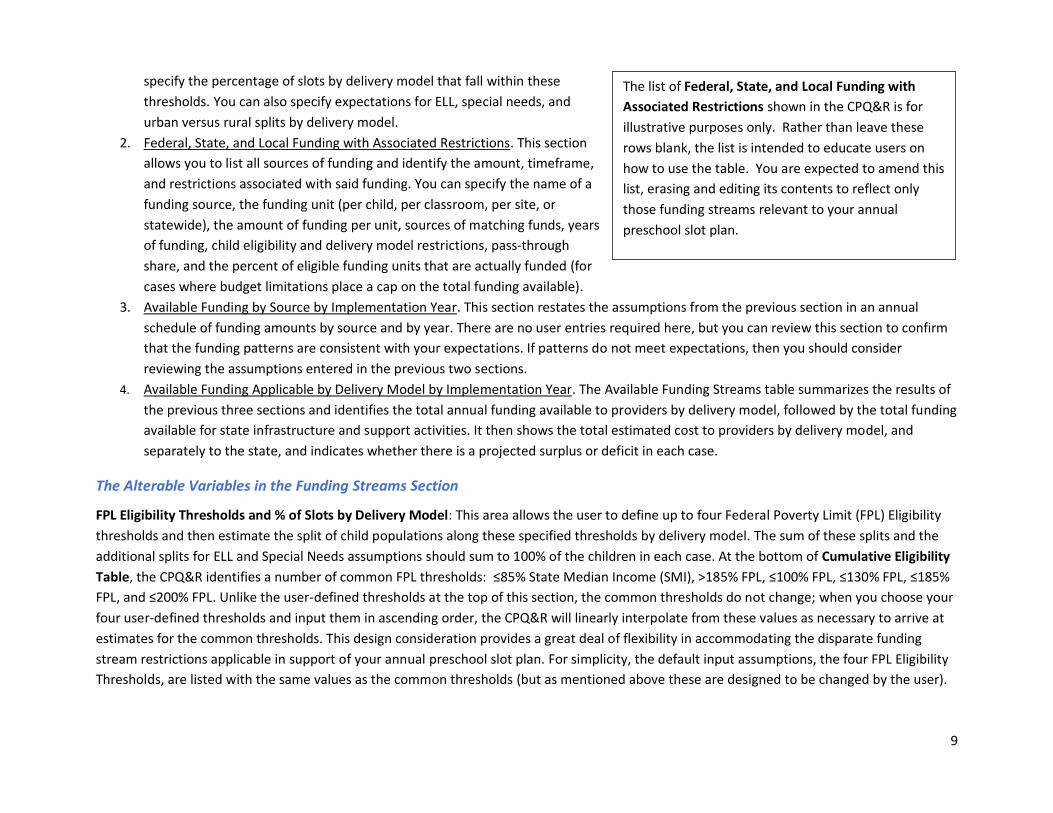
specify the percentage of slots by delivery model that fall within these
thresholds. You can also specify expectations for ELL, special needs, and
urban versus rural splits by delivery model.
2. Federal, State, and Local Funding with Associated Restrictions. This section
allows you to list all sources of funding and identify the amount, timeframe,
and restrictions associated with said funding. You can specify the name of a
funding source, the funding unit (per child, per classroom, per site, or
statewide), the amount of funding per unit, sources of matching funds, years
of funding, child eligibility and delivery model restrictions, pass-through
share, and the percent of eligible funding units that are actually funded (for
cases where budget limitations place a cap on the total funding available).
3. Available Funding by Source by Implementation Year. This section restates the assumptions from the previous section in an annual
schedule of funding amounts by source and by year. There are no user entries required here, but you can review this section to confirm
that the funding patterns are consistent with your expectations. If patterns do not meet expectations, then you should consider
reviewing the assumptions entered in the previous two sections.
4. Available Funding Applicable by Delivery Model by Implementation Year. The Available Funding Streams table summarizes the results of
the previous three sections and identifies the total annual funding available to providers by delivery model, followed by the total funding
available for state infrastructure and support activities. It then shows the total estimated cost to providers by delivery model, and
separately to the state, and indicates whether there is a projected surplus or deficit in each case.
The Alterable Variables in the Funding Streams Section
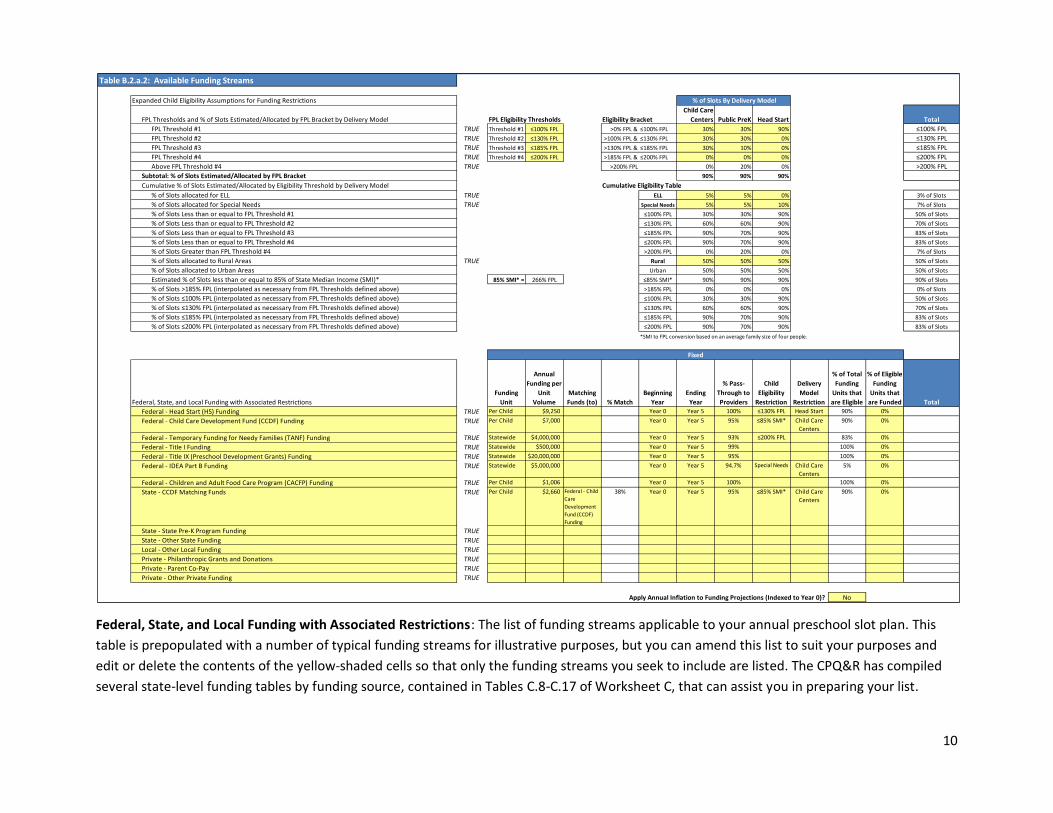
FPL Eligibility Thresholds and % of Slots by Delivery Model: This area allows the user to define up to four Federal Poverty Limit (FPL) Eligibility
thresholds and then estimate the split of child populations along these specified thresholds by delivery model. The sum of these splits and the
additional splits for ELL and Special Needs assumptions should sum to 100% of the children in each case. At the bottom of Cumulative Eligibility
Table, the CPQ&R identifies a number of common FPL thresholds: ≤85% State Median Income (SMI), >185% FPL, ≤100% FPL, ≤130% FPL, ≤185%
FPL, and ≤200% FPL. Unlike the user-defined thresholds at the top of this section, the common thresholds do not change; when you choose your
four user-defined thresholds and input them in ascending order, the CPQ&R will linearly interpolate from these values as necessary to arrive at
estimates for the common thresholds. This design consideration provides a great deal of flexibility in accommodating the disparate funding
stream restrictions applicable in support of your annual preschool slot plan. For simplicity, the default input assumptions, the four FPL Eligibility
Thresholds, are listed with the same values as the common thresholds (but as mentioned above these are designed to be changed by the user).
The list of Federal, State, and Local Funding with
Associated Restrictions shown in the CPQ&R is for
illustrative purposes only. Rather than leave these
rows blank, the list is intended to educate users on
how to use the table. You are expected to amend this
list, erasing and editing its contents to reflect only
those funding streams relevant to your annual
preschool slot plan.
10
Federal, State, and Local Funding with Associated Restrictions: The list of funding streams applicable to your annual preschool slot plan. This
table is prepopulated with a number of typical funding streams for illustrative purposes, but you can amend this list to suit your purposes and
edit or delete the contents of the yellow-shaded cells so that only the funding streams you seek to include are listed. The CPQ&R has compiled
several state-level funding tables by funding source, contained in Tables C.8-C.17 of Worksheet C, that can assist you in preparing your list.
Table B.2.a.2: Available Funding Streams
Expanded Child Eligibility Assumptions for Funding Restrictions % of Slots By Delivery Model
FPL Thresholds and % of Slots Estimated/Allocated by FPL Bracket by Delivery Model FPL Eligibility Thresholds Eligibility Bracket
Child Care
Centers Public PreK Head Start Total
FPL Threshold #1 TRUE Threshold #1 ≤100% FPL >0% FPL & ≤100% FPL 30% 30% 90% ≤100% FPL
FPL Threshold #2 TRUE Threshold #2 ≤130% FPL >100% FPL & ≤130% FPL 30% 30% 0% ≤130% FPL
FPL Threshold #3 TRUE Threshold #3 ≤185% FPL >130% FPL & ≤185% FPL 30% 10% 0% ≤185% FPL
FPL Threshold #4 TRUE Threshold #4 ≤200% FPL >185% FPL & ≤200% FPL 0% 0% 0% ≤200% FPL
Above FPL Threshold #4 TRUE >200% FPL 0% 20% 0% >200% FPL
Subtotal: % of Slots Estimated/Allocated by FPL Bracket 90% 90% 90%
Cumulative % of Slots Estimated/Allocated by Eligibility Threshold by Delivery Model Cumulative Eligibility Table
% of Slots allocated for ELL TRUE ELL 5% 5% 0% 3% of Slots
% of Slots allocated for Special Needs TRUE Special Needs 5% 5% 10% 7% of Slots
% of Slots Less than or equal to FPL Threshold #1 ≤100% FPL 30% 30% 90% 50% of Slots
% of Slots Less than or equal to FPL Threshold #2 ≤130% FPL 60% 60% 90% 70% of Slots
% of Slots Less than or equal to FPL Threshold #3 ≤185% FPL 90% 70% 90% 83% of Slots
% of Slots Less than or equal to FPL Threshold #4 ≤200% FPL 90% 70% 90% 83% of Slots
% of Slots Greater than FPL Threshold #4 >200% FPL 0% 20% 0% 7% of Slots
% of Slots allocated to Rural Areas TRUE Rural 50% 50% 50% 50% of Slots
% of Slots allocated to Urban Areas Urban 50% 50% 50% 50% of Slots
Estimated % of Slots less than or equal to 85% of State Median Income (SMI)* 85% SMI* = 266% FPL ≤85% SMI* 90% 90% 90% 90% of Slots
% of Slots >185% FPL (interpolated as necessary from FPL Thresholds defined above) >185% FPL 0% 0% 0% 0% of Slots
% of Slots ≤100% FPL (interpolated as necessary from FPL Thresholds defined above) ≤100% FPL 30% 30% 90% 50% of Slots
% of Slots ≤130% FPL (interpolated as necessary from FPL Thresholds defined above) ≤130% FPL 60% 60% 90% 70% of Slots
% of Slots ≤185% FPL (interpolated as necessary from FPL Thresholds defined above) ≤185% FPL 90% 70% 90% 83% of Slots
% of Slots ≤200% FPL (interpolated as necessary from FPL Thresholds defined above) ≤200% FPL 90% 70% 90% 83% of Slots
*SMI to FPL conversion based on an average family size of four people.
Fixed
Federal, State, and Local Funding with Associated Restrictions
Funding
Unit
Annual
Funding per
Unit
Volume
Matching
Funds (to) % Match
Beginning
Year
Ending
Year
% Pass-
Through to
Providers
Child
Eligibility
Restriction
Delivery
Model
Restriction
% of Total
Funding
Units that
are Eligible
% of Eligible
Funding
Units that
are Funded Total
Federal - Head Start (HS) Funding TRUE Per Child $9,250 Year 0 Year 5 100% ≤130% FPL Head Start 90% 0%
Federal - Child Care Development Fund (CCDF) Funding TRUE Per Child $7,000 Year 0 Year 5 95% ≤85% SMI* Child Care
Centers
90% 0%
Federal - Temporary Funding for Needy Families (TANF) Funding TRUE Statewide $4,000,000 Year 0 Year 5 93% ≤200% FPL 83% 0%
Federal - Title I Funding TRUE Statewide $500,000 Year 0 Year 5 99% 100% 0%
Federal - Title IX (Preschool Development Grants) Funding TRUE Statewide $20,000,000 Year 0 Year 5 95% 100% 0%
Federal - IDEA Part B Funding TRUE Statewide $5,000,000 Year 0 Year 5 94.7% Special Needs Child Care
Centers
5% 0%
Federal - Children and Adult Food Care Program (CACFP) Funding TRUE Per Child $1,006 Year 0 Year 5 100% 100% 0%
State - CCDF Matching Funds TRUE Per Child $2,660 Federal - Child
Care
Development
Fund (CCDF)
Funding
38% Year 0 Year 5 95% ≤85% SMI* Child Care
Centers
90% 0%
State - State Pre-K Program Funding TRUE
State - Other State Funding TRUE
Local - Other Local Funding TRUE
Private - Philanthropic Grants and Donations TRUE
Private - Parent Co-Pay TRUE
Private - Other Private Funding TRUE
Apply Annual Inflation to Funding Projections (Indexed to Year 0)? No
11
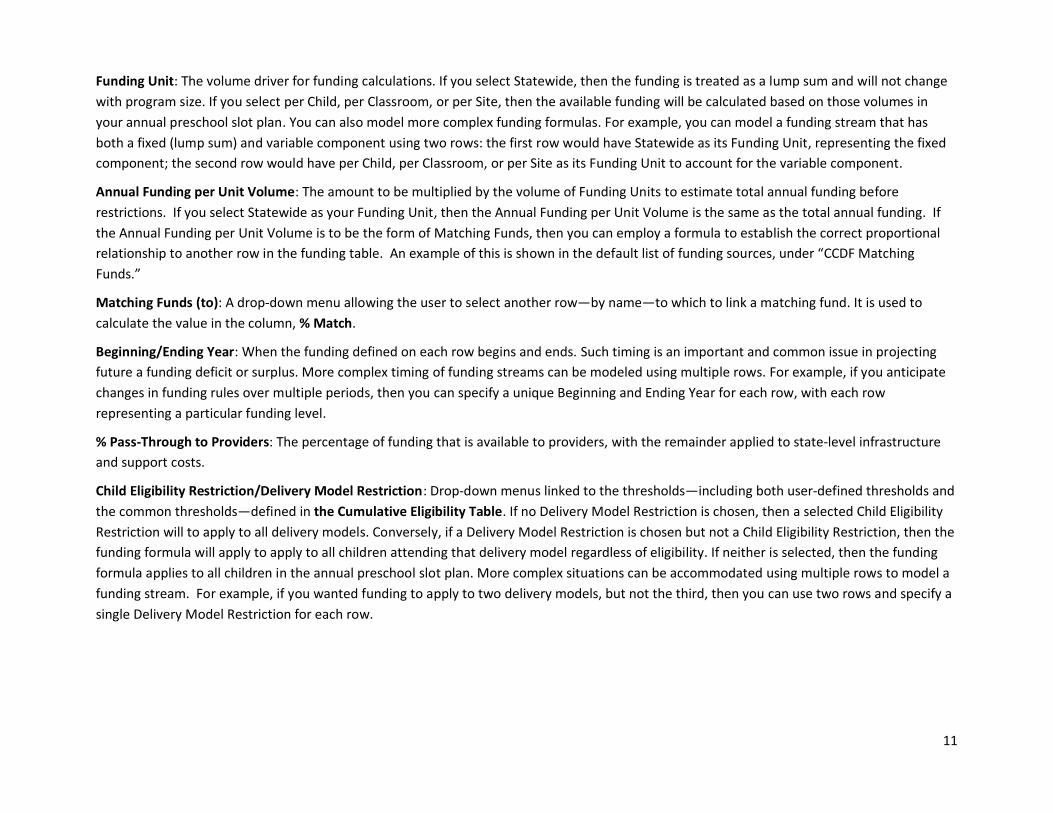
Funding Unit: The volume driver for funding calculations. If you select Statewide, then the funding is treated as a lump sum and will not change
with program size. If you select per Child, per Classroom, or per Site, then the available funding will be calculated based on those volumes in
your annual preschool slot plan. You can also model more complex funding formulas. For example, you can model a funding stream that has
both a fixed (lump sum) and variable component using two rows: the first row would have Statewide as its Funding Unit, representing the fixed
component; the second row would have per Child, per Classroom, or per Site as its Funding Unit to account for the variable component.
Annual Funding per Unit Volume: The amount to be multiplied by the volume of Funding Units to estimate total annual funding before
restrictions. If you select Statewide as your Funding Unit, then the Annual Funding per Unit Volume is the same as the total annual funding. If
the Annual Funding per Unit Volume is to be the form of Matching Funds, then you can employ a formula to establish the correct proportional
relationship to another row in the funding table. An example of this is shown in the default list of funding sources, under “CCDF Matching
Funds.”
Matching Funds (to): A drop-down menu allowing the user to select another row—by name—to which to link a matching fund. It is used to
calculate the value in the column, % Match.
Beginning/Ending Year: When the funding defined on each row begins and ends. Such timing is an important and common issue in projecting
future a funding deficit or surplus. More complex timing of funding streams can be modeled using multiple rows. For example, if you anticipate
changes in funding rules over multiple periods, then you can specify a unique Beginning and Ending Year for each row, with each row
representing a particular funding level.
% Pass-Through to Providers: The percentage of funding that is available to providers, with the remainder applied to state-level infrastructure
and support costs.
Child Eligibility Restriction/Delivery Model Restriction: Drop-down menus linked to the thresholds—including both user-defined thresholds and
the common thresholds—defined in the Cumulative Eligibility Table. If no Delivery Model Restriction is chosen, then a selected Child Eligibility
Restriction will to apply to all delivery models. Conversely, if a Delivery Model Restriction is chosen but not a Child Eligibility Restriction, then the
funding formula will apply to apply to all children attending that delivery model regardless of eligibility. If neither is selected, then the funding
formula applies to all children in the annual preschool slot plan. More complex situations can be accommodated using multiple rows to model a
funding stream. For example, if you wanted funding to apply to two delivery models, but not the third, then you can use two rows and specify a
single Delivery Model Restriction for each row.

12
% of Eligible Funding Units that are Funded: The funding rate applied to the funding
formula in cases where less than 100% of the funding can be distributed, typically
because of budget constraints existing at the source of funding. If you expect there
to be no budget constraints on funding, then enter 100% in this column for your
funding streams. You can also model situations where the funding rate is expected
to vary by Implementation Year by using multiple rows. The default values of this
column are 0% so that funding amounts are not automatically populated in the CPQ&R, based on
the illustrative list of funding streams, upon entering a slot count in Table B.2.a.1: the Annual
Preschool Slot Plan.
Apply Annual Inflation to Funding Projections: Select yes or no to apply the selected inflation rate
to future funding levels.
The CPQ&R does not present funding estimates
immediately upon entering a preschool slot count
because the default values in % of Eligible Funding
Units that are Funded are set to zero.
When you press a button on the
HOME Page for a modeling section of
the CPQ&R, you are taken to
Worksheet B and only the selected
area of the model is shown. You can
reveal all remaining sections of
Worksheet B by pressing the button
to Unhide all Sections on the HOME
Page.
13
Quality Standards
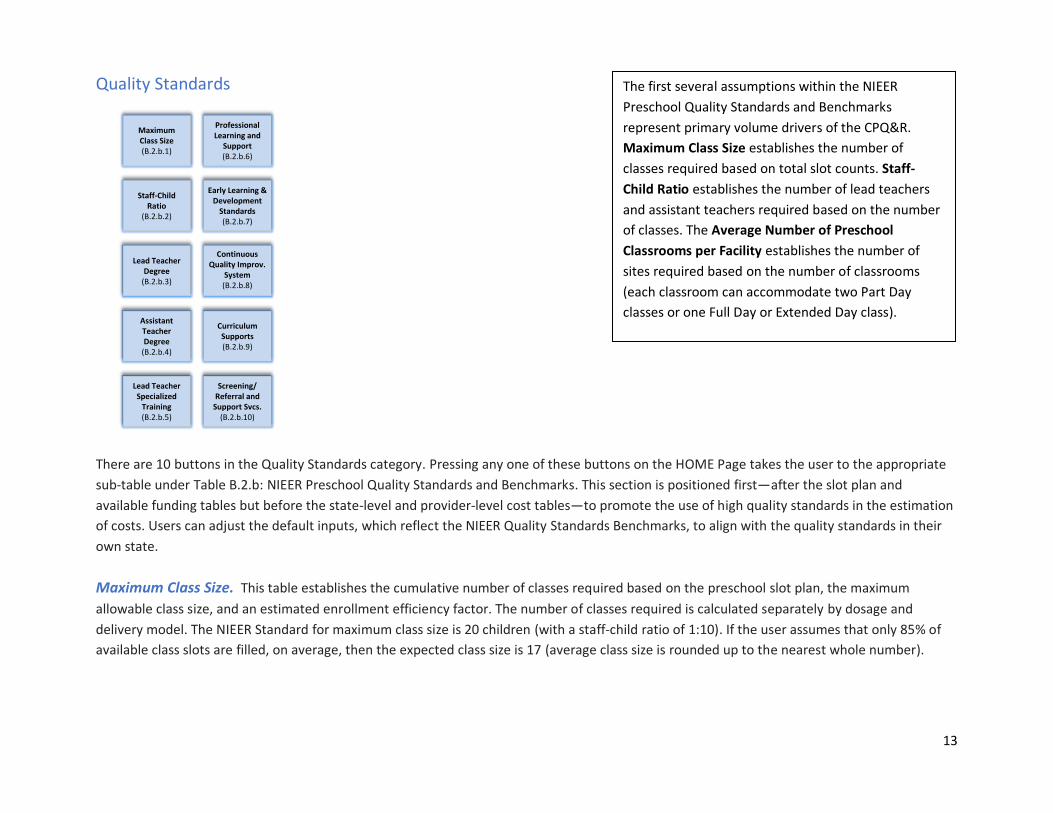
There are 10 buttons in the Quality Standards category. Pressing any one of these buttons on the HOME Page takes the user to the appropriate
sub-table under Table B.2.b: NIEER Preschool Quality Standards and Benchmarks. This section is positioned first—after the slot plan and
available funding tables but before the state-level and provider-level cost tables—to promote the use of high quality standards in the estimation
of costs. Users can adjust the default inputs, which reflect the NIEER Quality Standards Benchmarks, to align with the quality standards in their
own state.
Maximum Class Size. This table establishes the cumulative number of classes required based on the preschool slot plan, the maximum
allowable class size, and an estimated enrollment efficiency factor. The number of classes required is calculated separately by dosage and
delivery model. The NIEER Standard for maximum class size is 20 children (with a staff-child ratio of 1:10). If the user assumes that only 85% of
available class slots are filled, on average, then the expected class size is 17 (average class size is rounded up to the nearest whole number).
Maximum Class Size(B.2.b.1)
Staff-Child Ratio
(B.2.b.2)
Lead Teacher Degree
(B.2.b.3)
AssistantTeacher Degree
(B.2.b.4)
Lead Teacher Specialized
Training(B.2.b.5)
ProfessionalLearning and
Support(B.2.b.6)
Early Learning & Development
Standards(B.2.b.7)
ContinuousQuality Improv.
System(B.2.b.8)
CurriculumSupports(B.2.b.9)
Screening/Referral and
Support Svcs.(B.2.b.10)
The first several assumptions within the NIEER
Preschool Quality Standards and Benchmarks
represent primary volume drivers of the CPQ&R.
Maximum Class Size establishes the number of
classes required based on total slot counts. Staff-
Child Ratio establishes the number of lead teachers
and assistant teachers required based on the number
of classes. The Average Number of Preschool
Classrooms per Facility establishes the number of
sites required based on the number of classrooms
(each classroom can accommodate two Part Day
classes or one Full Day or Extended Day class).
14
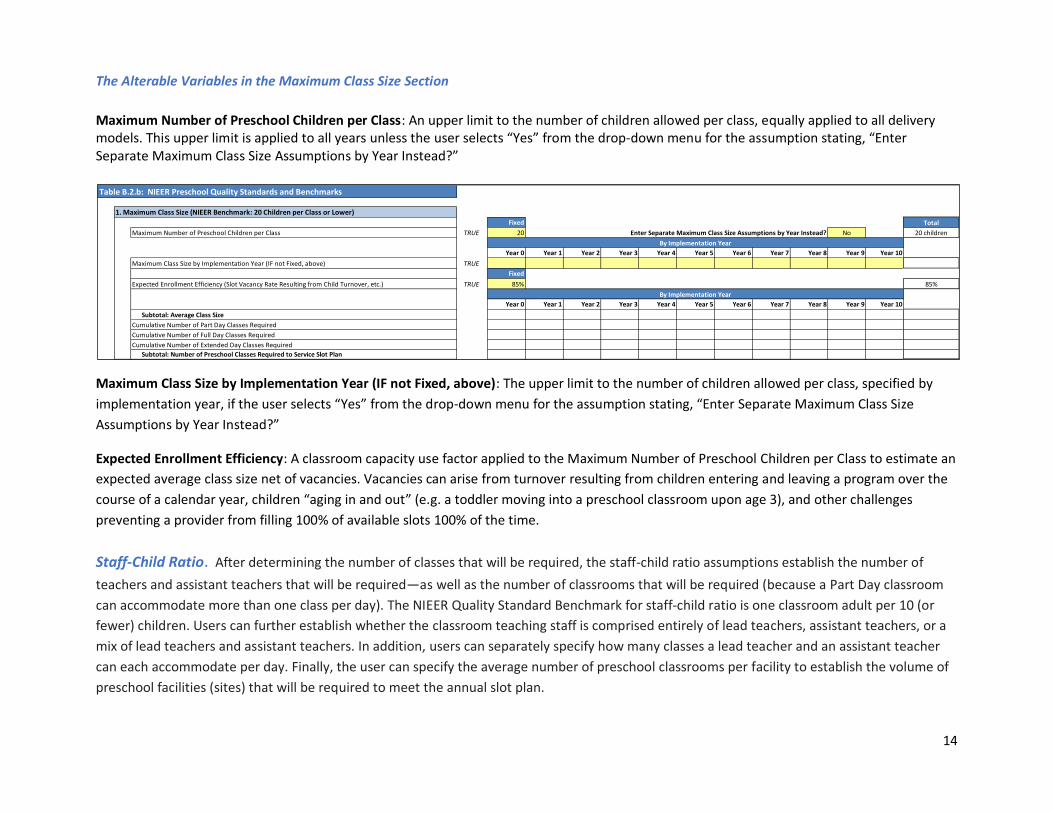
The Alterable Variables in the Maximum Class Size Section
Maximum Number of Preschool Children per Class: An upper limit to the number of children allowed per class, equally applied to all delivery models. This upper limit is applied to all years unless the user selects “Yes” from the drop-down menu for the assumption stating, “Enter Separate Maximum Class Size Assumptions by Year Instead?”
Maximum Class Size by Implementation Year (IF not Fixed, above): The upper limit to the number of children allowed per class, specified by
implementation year, if the user selects “Yes” from the drop-down menu for the assumption stating, “Enter Separate Maximum Class Size
Assumptions by Year Instead?”
Expected Enrollment Efficiency: A classroom capacity use factor applied to the Maximum Number of Preschool Children per Class to estimate an
expected average class size net of vacancies. Vacancies can arise from turnover resulting from children entering and leaving a program over the
course of a calendar year, children “aging in and out” (e.g. a toddler moving into a preschool classroom upon age 3), and other challenges
preventing a provider from filling 100% of available slots 100% of the time.
Staff-Child Ratio. After determining the number of classes that will be required, the staff-child ratio assumptions establish the number of
teachers and assistant teachers that will be required—as well as the number of classrooms that will be required (because a Part Day classroom
can accommodate more than one class per day). The NIEER Quality Standard Benchmark for staff-child ratio is one classroom adult per 10 (or
fewer) children. Users can further establish whether the classroom teaching staff is comprised entirely of lead teachers, assistant teachers, or a
mix of lead teachers and assistant teachers. In addition, users can separately specify how many classes a lead teacher and an assistant teacher
can each accommodate per day. Finally, the user can specify the average number of preschool classrooms per facility to establish the volume of
preschool facilities (sites) that will be required to meet the annual slot plan.
Table B.2.b: NIEER Preschool Quality Standards and Benchmarks
1. Maximum Class Size (NIEER Benchmark: 20 Children per Class or Lower)
Fixed Total
Maximum Number of Preschool Children per Class TRUE 20 Enter Separate Maximum Class Size Assumptions by Year Instead? No 20 children
By Implementation Year
Year 0 Year 1 Year 2 Year 3 Year 4 Year 5 Year 6 Year 7 Year 8 Year 9 Year 10
Maximum Class Size by Implementation Year (IF not Fixed, above) TRUE
Fixed
Expected Enrollment Efficiency (Slot Vacancy Rate Resulting from Child Turnover, etc.) TRUE 85% 85%
By Implementation Year
Year 0 Year 1 Year 2 Year 3 Year 4 Year 5 Year 6 Year 7 Year 8 Year 9 Year 10
Subtotal: Average Class Size
Cumulative Number of Part Day Classes Required
Cumulative Number of Full Day Classes Required
Cumulative Number of Extended Day Classes Required
Subtotal: Number of Preschool Classes Required to Service Slot Plan
15
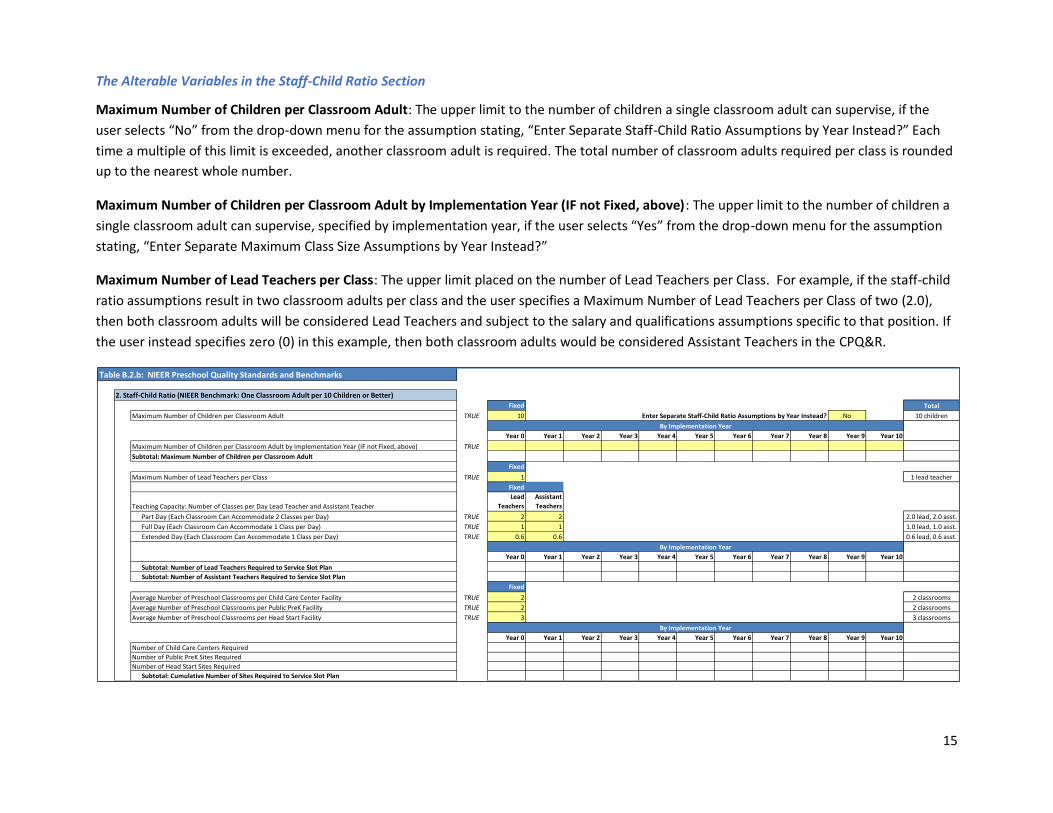
The Alterable Variables in the Staff-Child Ratio Section
Maximum Number of Children per Classroom Adult: The upper limit to the number of children a single classroom adult can supervise, if the
user selects “No” from the drop-down menu for the assumption stating, “Enter Separate Staff-Child Ratio Assumptions by Year Instead?” Each
time a multiple of this limit is exceeded, another classroom adult is required. The total number of classroom adults required per class is rounded
up to the nearest whole number.
Maximum Number of Children per Classroom Adult by Implementation Year (IF not Fixed, above): The upper limit to the number of children a
single classroom adult can supervise, specified by implementation year, if the user selects “Yes” from the drop-down menu for the assumption
stating, “Enter Separate Maximum Class Size Assumptions by Year Instead?”
Maximum Number of Lead Teachers per Class: The upper limit placed on the number of Lead Teachers per Class. For example, if the staff-child
ratio assumptions result in two classroom adults per class and the user specifies a Maximum Number of Lead Teachers per Class of two (2.0),
then both classroom adults will be considered Lead Teachers and subject to the salary and qualifications assumptions specific to that position. If
the user instead specifies zero (0) in this example, then both classroom adults would be considered Assistant Teachers in the CPQ&R.
Table B.2.b: NIEER Preschool Quality Standards and Benchmarks
2. Staff-Child Ratio (NIEER Benchmark: One Classroom Adult per 10 Children or Better)
Fixed Total
Maximum Number of Children per Classroom Adult TRUE 10 Enter Separate Staff-Child Ratio Assumptions by Year Instead? No 10 children
By Implementation Year
Year 0 Year 1 Year 2 Year 3 Year 4 Year 5 Year 6 Year 7 Year 8 Year 9 Year 10
Maximum Number of Children per Classroom Adult by Implementation Year (IF not Fixed, above) TRUE
Subtotal: Maximum Number of Children per Classroom Adult
Fixed
Maximum Number of Lead Teachers per Class TRUE 1 1 lead teacher
Fixed
Teaching Capacity: Number of Classes per Day Lead Teacher and Assistant Teacher
Lead
Teachers
Assistant
Teachers
Part Day (Each Classroom Can Accommodate 2 Classes per Day) TRUE 2 2 2.0 lead, 2.0 asst.
Full Day (Each Classroom Can Accommodate 1 Class per Day) TRUE 1 1 1.0 lead, 1.0 asst.
Extended Day (Each Classroom Can Accommodate 1 Class per Day) TRUE 0.6 0.6 0.6 lead, 0.6 asst.
By Implementation Year
Year 0 Year 1 Year 2 Year 3 Year 4 Year 5 Year 6 Year 7 Year 8 Year 9 Year 10
Subtotal: Number of Lead Teachers Required to Service Slot Plan
Subtotal: Number of Assistant Teachers Required to Service Slot Plan
Fixed
Average Number of Preschool Classrooms per Child Care Center Facility TRUE 2 2 classrooms
Average Number of Preschool Classrooms per Public PreK Facility TRUE 2 2 classrooms
Average Number of Preschool Classrooms per Head Start Facility TRUE 3 3 classrooms
By Implementation Year
Year 0 Year 1 Year 2 Year 3 Year 4 Year 5 Year 6 Year 7 Year 8 Year 9 Year 10
0 Number of Child Care Centers Required
0 Number of Public PreK Sites Required
0 Number of Head Start Sites Required
0 Subtotal: Cumulative Number of Sites Required to Service Slot Plan
16
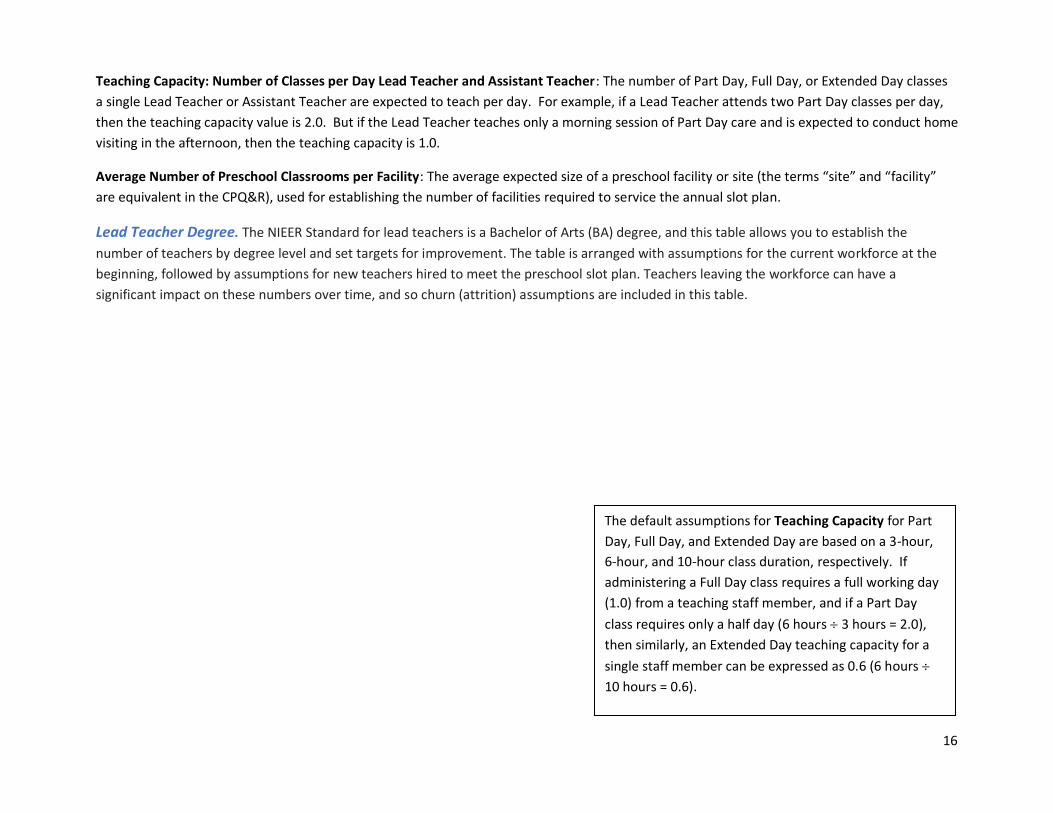
Teaching Capacity: Number of Classes per Day Lead Teacher and Assistant Teacher: The number of Part Day, Full Day, or Extended Day classes
a single Lead Teacher or Assistant Teacher are expected to teach per day. For example, if a Lead Teacher attends two Part Day classes per day,
then the teaching capacity value is 2.0. But if the Lead Teacher teaches only a morning session of Part Day care and is expected to conduct home
visiting in the afternoon, then the teaching capacity is 1.0.
Average Number of Preschool Classrooms per Facility: The average expected size of a preschool facility or site (the terms “site” and “facility”
are equivalent in the CPQ&R), used for establishing the number of facilities required to service the annual slot plan.
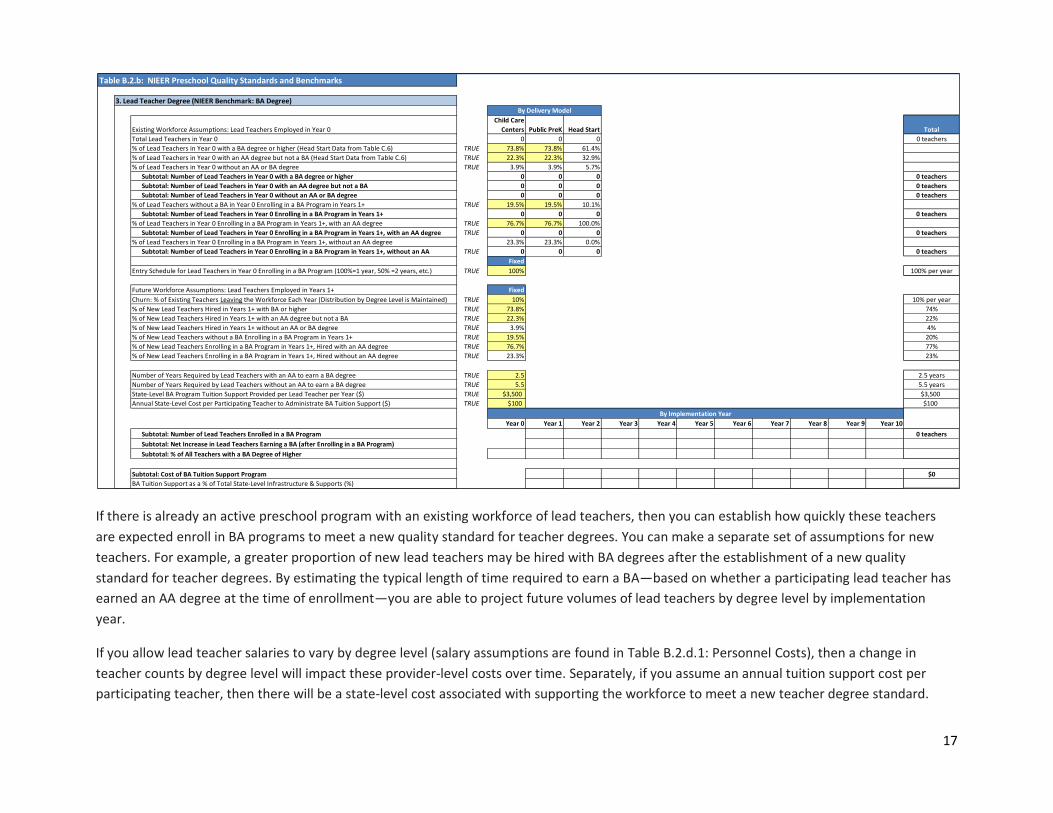
Lead Teacher Degree. The NIEER Standard for lead teachers is a Bachelor of Arts (BA) degree, and this table allows you to establish the
number of teachers by degree level and set targets for improvement. The table is arranged with assumptions for the current workforce at the
beginning, followed by assumptions for new teachers hired to meet the preschool slot plan. Teachers leaving the workforce can have a
significant impact on these numbers over time, and so churn (attrition) assumptions are included in this table.
The default assumptions for Teaching Capacity for Part
Day, Full Day, and Extended Day are based on a 3-hour,
6-hour, and 10-hour class duration, respectively. If
administering a Full Day class requires a full working day
(1.0) from a teaching staff member, and if a Part Day
class requires only a half day (6 hours 3 hours = 2.0),
then similarly, an Extended Day teaching capacity for a
single staff member can be expressed as 0.6 (6 hours
10 hours = 0.6).
17
If there is already an active preschool program with an existing workforce of lead teachers, then you can establish how quickly these teachers
are expected enroll in BA programs to meet a new quality standard for teacher degrees. You can make a separate set of assumptions for new
teachers. For example, a greater proportion of new lead teachers may be hired with BA degrees after the establishment of a new quality
standard for teacher degrees. By estimating the typical length of time required to earn a BA—based on whether a participating lead teacher has
earned an AA degree at the time of enrollment—you are able to project future volumes of lead teachers by degree level by implementation
year.
If you allow lead teacher salaries to vary by degree level (salary assumptions are found in Table B.2.d.1: Personnel Costs), then a change in
teacher counts by degree level will impact these provider-level costs over time. Separately, if you assume an annual tuition support cost per
participating teacher, then there will be a state-level cost associated with supporting the workforce to meet a new teacher degree standard.
Table B.2.b: NIEER Preschool Quality Standards and Benchmarks
3. Lead Teacher Degree (NIEER Benchmark: BA Degree)By Delivery Model
Existing Workforce Assumptions: Lead Teachers Employed in Year 0
Child Care
Centers Public PreK Head Start Total
Total Lead Teachers in Year 0 0 0 0 0 teachers
% of Lead Teachers in Year 0 with a BA degree or higher (Head Start Data from Table C.6) TRUE 73.8% 73.8% 61.4%
% of Lead Teachers in Year 0 with an AA degree but not a BA (Head Start Data from Table C.6) TRUE 22.3% 22.3% 32.9%
% of Lead Teachers in Year 0 without an AA or BA degree TRUE 3.9% 3.9% 5.7%
Subtotal: Number of Lead Teachers in Year 0 with a BA degree or higher 0 0 0 0 teachers
Subtotal: Number of Lead Teachers in Year 0 with an AA degree but not a BA 0 0 0 0 teachers
Subtotal: Number of Lead Teachers in Year 0 without an AA or BA degree 0 0 0 0 teachers
% of Lead Teachers without a BA in Year 0 Enrolling in a BA Program in Years 1+ TRUE 19.5% 19.5% 10.1%
Subtotal: Number of Lead Teachers in Year 0 Enrolling in a BA Program in Years 1+ 0 0 0 0 teachers
% of Lead Teachers in Year 0 Enrolling in a BA Program in Years 1+, with an AA degree TRUE 76.7% 76.7% 100.0%
Subtotal: Number of Lead Teachers in Year 0 Enrolling in a BA Program in Years 1+, with an AA degree TRUE 0 0 0 0 teachers
% of Lead Teachers in Year 0 Enrolling in a BA Program in Years 1+, without an AA degree 23.3% 23.3% 0.0%
Subtotal: Number of Lead Teachers in Year 0 Enrolling in a BA Program in Years 1+, without an AA TRUE 0 0 0 0 teachers
Fixed
Entry Schedule for Lead Teachers in Year 0 Enrolling in a BA Program (100%=1 year, 50% =2 years, etc.) TRUE 100% 100% per year
Future Workforce Assumptions: Lead Teachers Employed in Years 1+ Fixed
Churn: % of Existing Teachers Leaving the Workforce Each Year (Distribution by Degree Level is Maintained) TRUE 10% 10% per year
% of New Lead Teachers Hired in Years 1+ with BA or higher TRUE 73.8% 74%
% of New Lead Teachers Hired in Years 1+ with an AA degree but not a BA TRUE 22.3% 22%
% of New Lead Teachers Hired in Years 1+ without an AA or BA degree TRUE 3.9% 4%
% of New Lead Teachers without a BA Enrolling in a BA Program in Years 1+ TRUE 19.5% 20%
% of New Lead Teachers Enrolling in a BA Program in Years 1+, Hired with an AA degree TRUE 76.7% 77%
% of New Lead Teachers Enrolling in a BA Program in Years 1+, Hired without an AA degree TRUE 23.3% 23%
Number of Years Required by Lead Teachers with an AA to earn a BA degree TRUE 2.5 2.5 years
Number of Years Required by Lead Teachers without an AA to earn a BA degree TRUE 5.5 5.5 years
State-Level BA Program Tuition Support Provided per Lead Teacher per Year ($) TRUE $3,500 $3,500
Annual State-Level Cost per Participating Teacher to Administrate BA Tuition Support ($) TRUE $100 $100
By Implementation Year
Year 0 Year 1 Year 2 Year 3 Year 4 Year 5 Year 6 Year 7 Year 8 Year 9 Year 10
Subtotal: Number of Lead Teachers Enrolled in a BA Program 0 teachers
Subtotal: Net Increase in Lead Teachers Earning a BA (after Enrolling in a BA Program)
Subtotal: % of All Teachers with a BA Degree of Higher
Subtotal: Cost of BA Tuition Support Program $0
BA Tuition Support as a % of Total State-Level Infrastructure & Supports (%)
18
Advanced Users: You can repurpose the Lead Teacher Degree table to reflect any three degree levels, as long as you also review the
salary assumptions for these three levels in Table B.2.d.1, Personnel Costs, and correct as needed.
The Alterable Variables in the Lead Teacher Degree Section
% of Lead Teachers in Year 0 with a BA degree or higher (Head Start Data from Table C.6): For lead teachers serving an existing preschool
program, the percentage that currently possess a BA degree or higher. Head Start data by state is obtained from the Office of Head Start at the
U.S. Department of Health and Human Services; default assumptions for Child Care Centers and Public Pre-K reflect national Head Start statistics
and should be reviewed and edited by the user as needed.
% of Lead Teachers in Year 0 with an AA degree but not a BA (Head Start Data from Table C.6): For lead teachers serving an existing preschool
program, the percentage that currently possess an AA degree. Head Start data by state is obtained from the Office of Head Start at the U.S.
Department of Health and Human Services; default assumptions for Child Care Centers and Public Pre-K reflect national Head Start statistics and
should be reviewed and edited by the user as needed.
% of Lead Teachers without a BA in Year 0 Enrolling in a BA Program in Years 1+: For lead teachers serving an existing preschool program and
currently without a BA degree or higher, the percentage that are expected to enroll to earn a BA. Head Start data by state is obtained from the
Office of Head Start at the U.S. Department of Health and Human Services; default assumptions for Child Care Centers and Public Pre-K reflect
national Head Start statistics and should be reviewed and edited by the user as needed.
% of Lead Teachers in Year 0 Enrolling in a BA Program in Years 1+, with an AA degree: For lead teachers serving an existing preschool program
and enrolling in a BA degree program, the percentage that are expected to have already earned an AA degree. The remaining enrolled lead
teachers are assumed to lack an AA degree. Head Start data by state is obtained from the Office of Head Start at the U.S. Department of Health
and Human Services; default assumptions for Child Care Centers and Public Pre-K reflect national Head Start statistics and should be reviewed
and edited by the user as needed.
Entry Schedule for Lead Teachers in Year 0 Enrolling in a BA Program: The percentage of lead teachers enrolling in a BA degree program
expected to enroll in the first implementation year. For example, if all lead teachers without a BA degree in Year 0 enroll in Year 1, then you
should input a value of 100%. However, if a large volume of lead teacher enrollment is expected and state budget constraints require enrollment
be spread over the two years—with 50% of participating lead teachers enrolling in Year 1 and 50% in Year 2—then you should input a value of
50%. Similarly, a value of 33% would reflect three years to enroll all existing teachers, 25% would reflect four years, etc.
Churn: % of Existing Teachers Leaving the Workforce Each Year: The percentage of lead teachers leaving the workforce annually. It includes
those leaving prior to completing their degree; the individual may have received tuition support, which contributes to state-level costs, but will
19
no longer factor into the state's goal to increasing the number of lead teachers with a BA degree. A new lead teacher hired as a replacement
may or may not be hired at the same degree level; these statistics are determined by the assumptions for new lead teachers located below the
assumption for churn.
Advanced Users: Churn increases the number of new lead teachers required each year and can decrease the number of lead teachers
graduating from a state-funded BA program. The CPQ&R assumes that the population of teachers who leave the workforce is not
skewed toward the most qualified or least qualified but rather mirrors the overall incoming distribution by degree level identified by the
user.
% of New Lead Teachers Hired in Years 1+ with BA or higher: The percentage of new lead teachers hired with a BA degree or higher to replace
existing teachers (churn) or to meet expansion plans. Default assumptions reflect national Head Start statistics for lead teacher degrees and
should be reviewed and edited by the user as needed.
% of New Lead Teachers Hired in Years 1+ with an AA degree but not a BA: The percentage of new lead teachers hired with an AA degree to
replace existing teachers (churn) or to meet expansion plans. Default assumptions reflect national Head Start statistics for lead teacher degrees
and should be reviewed and edited by the user as needed.
% of New Lead Teachers without a BA Enrolling in a BA Program in Years 1+: For new lead teachers hired without a BA degree to replace
existing teachers (churn) or to meet expansion plans, the percentage that are expected to enroll to earn a BA. Default assumptions reflect
national Head Start statistics for lead teacher degrees and should be reviewed and edited by the user as needed.
% of New Lead Teachers Enrolling in a BA Program in Years 1+, Hired with an AA degree: For new lead teachers hired without a BA degree and
enrolling in a BA program, the percentage that are expected to have earned an AA degree prior to being hired. Default assumptions reflect
national Head Start statistics for lead teacher degrees and should be reviewed and edited by the user as needed.
Number of Years Required by Lead Teachers with an AA to earn a BA degree: The span of time for which participating teachers already
possessing a AA degree will receive tuition support, and the length of time before they are expected earn their BA degree and are eligible for a
higher salary (if applicable). Partial year increments, such as 5.5 years, are allowed in the CPQ&R.
Number of Years Required by Lead Teachers without an AA to earn a BA degree: The span of time for which participating teachers without an
AA degree will receive tuition support, and the length of time before they are expected earn their BA degree and are eligible for a higher salary
(if applicable). Partial year increments, such as 2.5 years, are allowed in the CPQ&R.
20
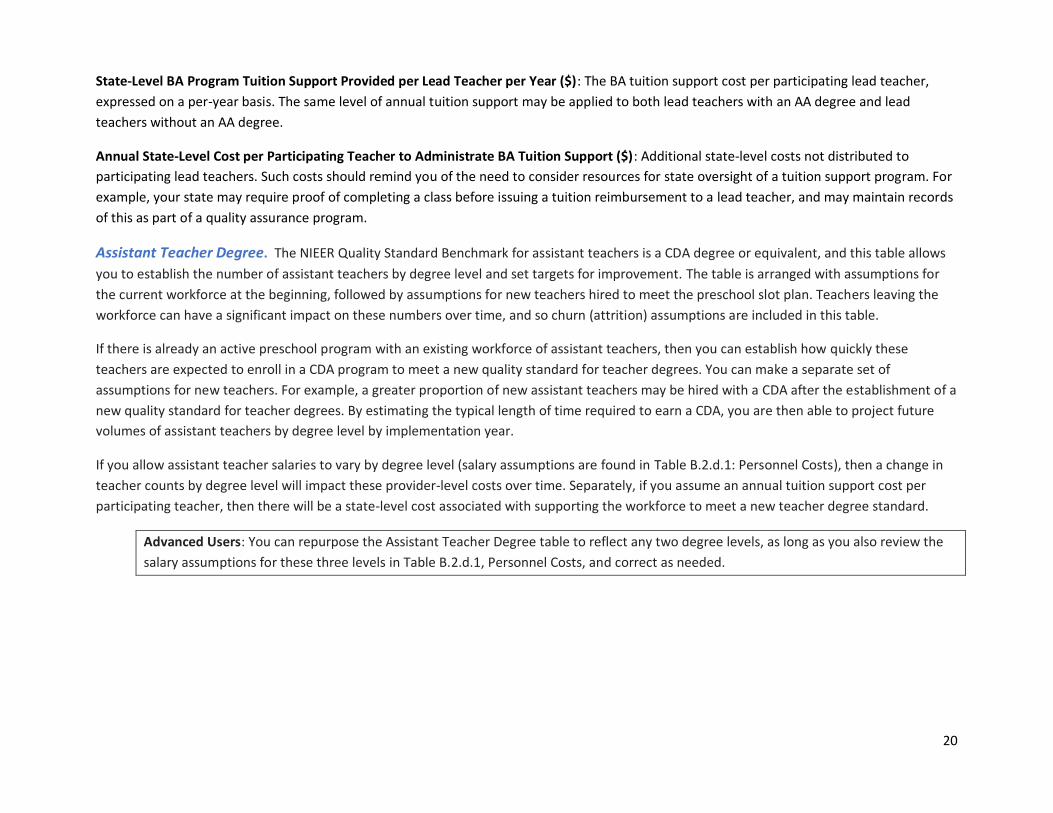
State-Level BA Program Tuition Support Provided per Lead Teacher per Year ($): The BA tuition support cost per participating lead teacher,
expressed on a per-year basis. The same level of annual tuition support may be applied to both lead teachers with an AA degree and lead
teachers without an AA degree.
Annual State-Level Cost per Participating Teacher to Administrate BA Tuition Support ($): Additional state-level costs not distributed to
participating lead teachers. Such costs should remind you of the need to consider resources for state oversight of a tuition support program. For
example, your state may require proof of completing a class before issuing a tuition reimbursement to a lead teacher, and may maintain records
of this as part of a quality assurance program.
Assistant Teacher Degree. The NIEER Quality Standard Benchmark for assistant teachers is a CDA degree or equivalent, and this table allows
you to establish the number of assistant teachers by degree level and set targets for improvement. The table is arranged with assumptions for
the current workforce at the beginning, followed by assumptions for new teachers hired to meet the preschool slot plan. Teachers leaving the
workforce can have a significant impact on these numbers over time, and so churn (attrition) assumptions are included in this table.
If there is already an active preschool program with an existing workforce of assistant teachers, then you can establish how quickly these
teachers are expected to enroll in a CDA program to meet a new quality standard for teacher degrees. You can make a separate set of
assumptions for new teachers. For example, a greater proportion of new assistant teachers may be hired with a CDA after the establishment of a
new quality standard for teacher degrees. By estimating the typical length of time required to earn a CDA, you are then able to project future
volumes of assistant teachers by degree level by implementation year.
If you allow assistant teacher salaries to vary by degree level (salary assumptions are found in Table B.2.d.1: Personnel Costs), then a change in
teacher counts by degree level will impact these provider-level costs over time. Separately, if you assume an annual tuition support cost per
participating teacher, then there will be a state-level cost associated with supporting the workforce to meet a new teacher degree standard.
Advanced Users: You can repurpose the Assistant Teacher Degree table to reflect any two degree levels, as long as you also review the
salary assumptions for these three levels in Table B.2.d.1, Personnel Costs, and correct as needed.
21
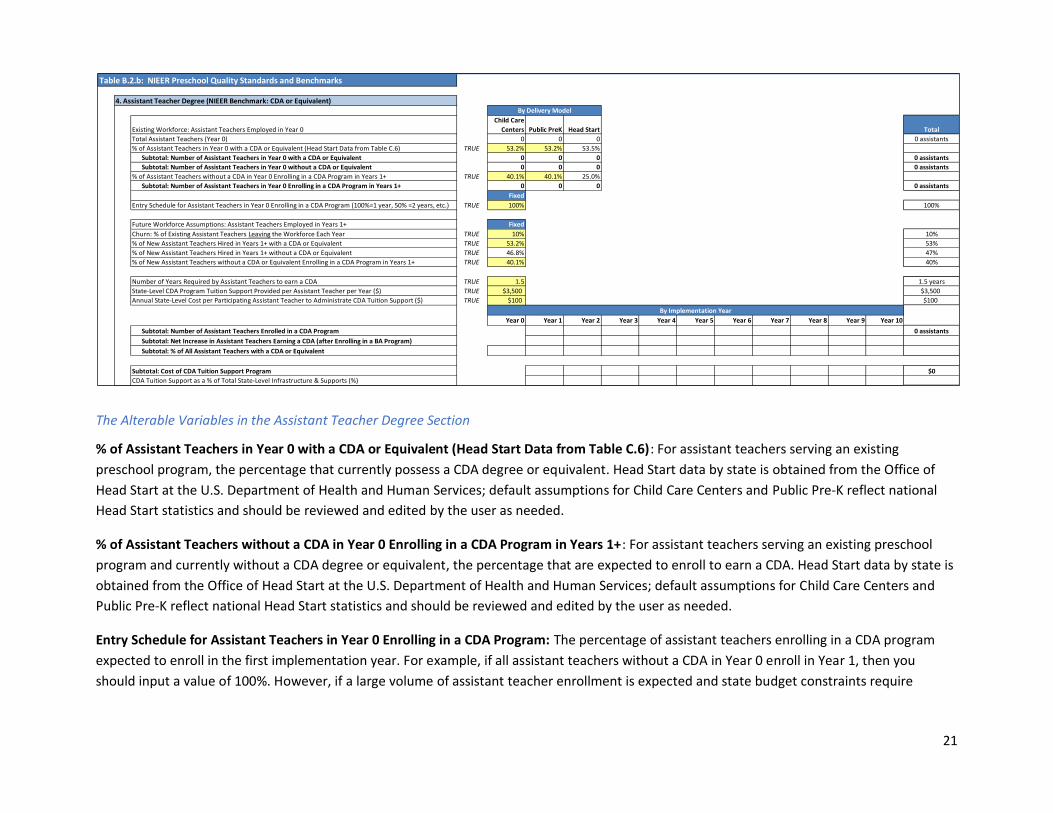
The Alterable Variables in the Assistant Teacher Degree Section
% of Assistant Teachers in Year 0 with a CDA or Equivalent (Head Start Data from Table C.6): For assistant teachers serving an existing
preschool program, the percentage that currently possess a CDA degree or equivalent. Head Start data by state is obtained from the Office of
Head Start at the U.S. Department of Health and Human Services; default assumptions for Child Care Centers and Public Pre-K reflect national
Head Start statistics and should be reviewed and edited by the user as needed.
% of Assistant Teachers without a CDA in Year 0 Enrolling in a CDA Program in Years 1+: For assistant teachers serving an existing preschool
program and currently without a CDA degree or equivalent, the percentage that are expected to enroll to earn a CDA. Head Start data by state is
obtained from the Office of Head Start at the U.S. Department of Health and Human Services; default assumptions for Child Care Centers and
Public Pre-K reflect national Head Start statistics and should be reviewed and edited by the user as needed.
Entry Schedule for Assistant Teachers in Year 0 Enrolling in a CDA Program: The percentage of assistant teachers enrolling in a CDA program
expected to enroll in the first implementation year. For example, if all assistant teachers without a CDA in Year 0 enroll in Year 1, then you
should input a value of 100%. However, if a large volume of assistant teacher enrollment is expected and state budget constraints require
Table B.2.b: NIEER Preschool Quality Standards and Benchmarks
4. Assistant Teacher Degree (NIEER Benchmark: CDA or Equivalent)By Delivery Model
Existing Workforce: Assistant Teachers Employed in Year 0
Child Care
Centers Public PreK Head Start Total
Total Assistant Teachers (Year 0) 0 0 0 0 assistants
% of Assistant Teachers in Year 0 with a CDA or Equivalent (Head Start Data from Table C.6) TRUE 53.2% 53.2% 53.5%
Subtotal: Number of Assistant Teachers in Year 0 with a CDA or Equivalent 0 0 0 0 assistants
Subtotal: Number of Assistant Teachers in Year 0 without a CDA or Equivalent 0 0 0 0 assistants
% of Assistant Teachers without a CDA in Year 0 Enrolling in a CDA Program in Years 1+ TRUE 40.1% 40.1% 25.0%
Subtotal: Number of Assistant Teachers in Year 0 Enrolling in a CDA Program in Years 1+ 0 0 0 0 assistants
Fixed
Entry Schedule for Assistant Teachers in Year 0 Enrolling in a CDA Program (100%=1 year, 50% =2 years, etc.) TRUE 100% 100%
Future Workforce Assumptions: Assistant Teachers Employed in Years 1+ Fixed
Churn: % of Existing Assistant Teachers Leaving the Workforce Each Year TRUE 10% 10%
% of New Assistant Teachers Hired in Years 1+ with a CDA or Equivalent TRUE 53.2% 53%
% of New Assistant Teachers Hired in Years 1+ without a CDA or Equivalent TRUE 46.8% 47%
% of New Assistant Teachers without a CDA or Equivalent Enrolling in a CDA Program in Years 1+ TRUE 40.1% 40%
Number of Years Required by Assistant Teachers to earn a CDA TRUE 1.5 1.5 years
State-Level CDA Program Tuition Support Provided per Assistant Teacher per Year ($) TRUE $3,500 $3,500
Annual State-Level Cost per Participating Assistant Teacher to Administrate CDA Tuition Support ($) TRUE $100 $100
By Implementation Year
Year 0 Year 1 Year 2 Year 3 Year 4 Year 5 Year 6 Year 7 Year 8 Year 9 Year 10
Subtotal: Number of Assistant Teachers Enrolled in a CDA Program 0 assistants
Subtotal: Net Increase in Assistant Teachers Earning a CDA (after Enrolling in a BA Program)
Subtotal: % of All Assistant Teachers with a CDA or Equivalent
Subtotal: Cost of CDA Tuition Support Program $0
CDA Tuition Support as a % of Total State-Level Infrastructure & Supports (%)
22
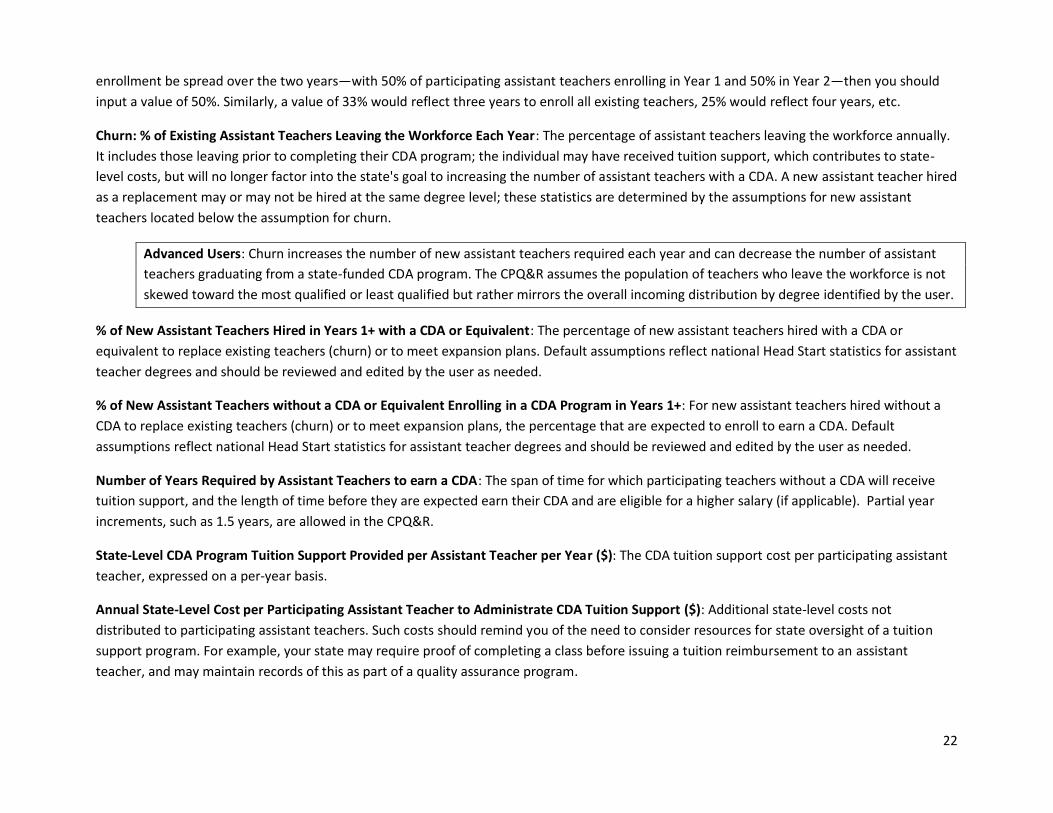
enrollment be spread over the two years—with 50% of participating assistant teachers enrolling in Year 1 and 50% in Year 2—then you should
input a value of 50%. Similarly, a value of 33% would reflect three years to enroll all existing teachers, 25% would reflect four years, etc.
Churn: % of Existing Assistant Teachers Leaving the Workforce Each Year: The percentage of assistant teachers leaving the workforce annually.
It includes those leaving prior to completing their CDA program; the individual may have received tuition support, which contributes to state-
level costs, but will no longer factor into the state's goal to increasing the number of assistant teachers with a CDA. A new assistant teacher hired
as a replacement may or may not be hired at the same degree level; these statistics are determined by the assumptions for new assistant
teachers located below the assumption for churn.
Advanced Users: Churn increases the number of new assistant teachers required each year and can decrease the number of assistant
teachers graduating from a state-funded CDA program. The CPQ&R assumes the population of teachers who leave the workforce is not
skewed toward the most qualified or least qualified but rather mirrors the overall incoming distribution by degree identified by the user.
% of New Assistant Teachers Hired in Years 1+ with a CDA or Equivalent: The percentage of new assistant teachers hired with a CDA or
equivalent to replace existing teachers (churn) or to meet expansion plans. Default assumptions reflect national Head Start statistics for assistant
teacher degrees and should be reviewed and edited by the user as needed.
% of New Assistant Teachers without a CDA or Equivalent Enrolling in a CDA Program in Years 1+: For new assistant teachers hired without a
CDA to replace existing teachers (churn) or to meet expansion plans, the percentage that are expected to enroll to earn a CDA. Default
assumptions reflect national Head Start statistics for assistant teacher degrees and should be reviewed and edited by the user as needed.
Number of Years Required by Assistant Teachers to earn a CDA: The span of time for which participating teachers without a CDA will receive
tuition support, and the length of time before they are expected earn their CDA and are eligible for a higher salary (if applicable). Partial year
increments, such as 1.5 years, are allowed in the CPQ&R.
State-Level CDA Program Tuition Support Provided per Assistant Teacher per Year ($): The CDA tuition support cost per participating assistant
teacher, expressed on a per-year basis.
Annual State-Level Cost per Participating Assistant Teacher to Administrate CDA Tuition Support ($): Additional state-level costs not
distributed to participating assistant teachers. Such costs should remind you of the need to consider resources for state oversight of a tuition
support program. For example, your state may require proof of completing a class before issuing a tuition reimbursement to an assistant
teacher, and may maintain records of this as part of a quality assurance program.
23
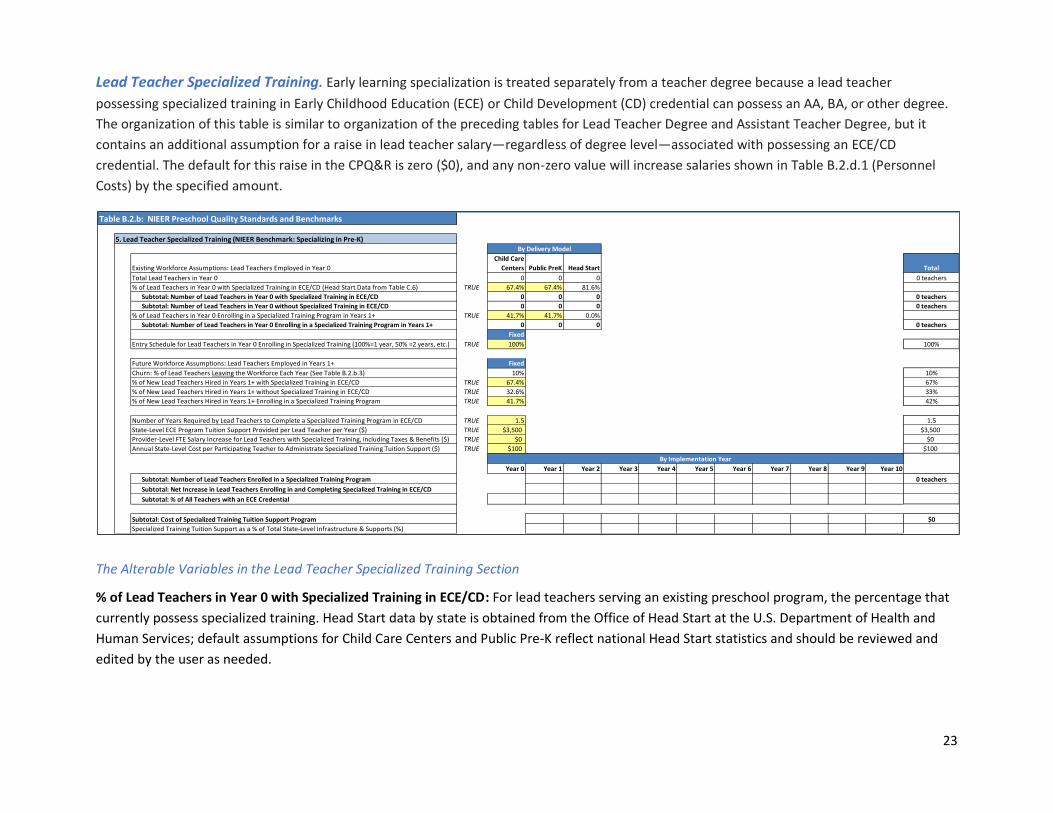
Lead Teacher Specialized Training. Early learning specialization is treated separately from a teacher degree because a lead teacher
possessing specialized training in Early Childhood Education (ECE) or Child Development (CD) credential can possess an AA, BA, or other degree.
The organization of this table is similar to organization of the preceding tables for Lead Teacher Degree and Assistant Teacher Degree, but it
contains an additional assumption for a raise in lead teacher salary—regardless of degree level—associated with possessing an ECE/CD
credential. The default for this raise in the CPQ&R is zero ($0), and any non-zero value will increase salaries shown in Table B.2.d.1 (Personnel
Costs) by the specified amount.
The Alterable Variables in the Lead Teacher Specialized Training Section
% of Lead Teachers in Year 0 with Specialized Training in ECE/CD: For lead teachers serving an existing preschool program, the percentage that
currently possess specialized training. Head Start data by state is obtained from the Office of Head Start at the U.S. Department of Health and
Human Services; default assumptions for Child Care Centers and Public Pre-K reflect national Head Start statistics and should be reviewed and
edited by the user as needed.
Table B.2.b: NIEER Preschool Quality Standards and Benchmarks
5. Lead Teacher Specialized Training (NIEER Benchmark: Specializing in Pre-K)By Delivery Model
Existing Workforce Assumptions: Lead Teachers Employed in Year 0
Child Care
Centers Public PreK Head Start Total
Total Lead Teachers in Year 0 0 0 0 0 teachers
% of Lead Teachers in Year 0 with Specialized Training in ECE/CD (Head Start Data from Table C.6) TRUE 67.4% 67.4% 81.6%
Subtotal: Number of Lead Teachers in Year 0 with Specialized Training in ECE/CD 0 0 0 0 teachers
Subtotal: Number of Lead Teachers in Year 0 without Specialized Training in ECE/CD 0 0 0 0 teachers
% of Lead Teachers in Year 0 Enrolling in a Specialized Training Program in Years 1+ TRUE 41.7% 41.7% 0.0%
Subtotal: Number of Lead Teachers in Year 0 Enrolling in a Specialized Training Program in Years 1+ 0 0 0 0 teachers
Fixed
Entry Schedule for Lead Teachers in Year 0 Enrolling in Specialized Training (100%=1 year, 50% =2 years, etc.) TRUE 100% 100%
Future Workforce Assumptions: Lead Teachers Employed in Years 1+ Fixed
Churn: % of Lead Teachers Leaving the Workforce Each Year (See Table B.2.b.3) 10% 10%
% of New Lead Teachers Hired in Years 1+ with Specialized Training in ECE/CD TRUE 67.4% 67%
% of New Lead Teachers Hired in Years 1+ without Specialized Training in ECE/CD TRUE 32.6% 33%
% of New Lead Teachers Hired in Years 1+ Enrolling in a Specialized Training Program TRUE 41.7% 42%
Number of Years Required by Lead Teachers to Complete a Specialized Training Program in ECE/CD TRUE 1.5 1.5
State-Level ECE Program Tuition Support Provided per Lead Teacher per Year ($) TRUE $3,500 $3,500
Provider-Level FTE Salary Increase for Lead Teachers with Specialized Training, including Taxes & Benefits ($) TRUE $0 $0
Annual State-Level Cost per Participating Teacher to Administrate Specialized Training Tuition Support ($) TRUE $100 $100
By Implementation Year
Year 0 Year 1 Year 2 Year 3 Year 4 Year 5 Year 6 Year 7 Year 8 Year 9 Year 10
Subtotal: Number of Lead Teachers Enrolled in a Specialized Training Program 0 teachers
Subtotal: Net Increase in Lead Teachers Enrolling in and Completing Specialized Training in ECE/CD
Subtotal: % of All Teachers with an ECE Credential
Subtotal: Cost of Specialized Training Tuition Support Program $0
Specialized Training Tuition Support as a % of Total State-Level Infrastructure & Supports (%)
24
% of Lead Teachers in Year 0 Enrolling in a Specialized Training Program in Years 1+: For lead teachers serving an existing preschool program
and currently without specialized training in ECE/CD, the percentage that are expected to enroll in such training. Head Start data by state is
obtained from the Office of Head Start at the U.S. Department of Health and Human Services; default assumptions for Child Care Centers and
Public Pre-K reflect national Head Start statistics and should be reviewed and edited by the user as needed.
Entry Schedule for Lead Teachers in Year 0 Enrolling in Specialized Training: The percentage of lead teachers enrolling in a specialized training
program expected to enroll in the first implementation year. For example, if all lead teachers without specialized training in ECE/CD in Year 0
enroll in Year 1, then you should input a value of 100%. However, if a large volume of lead teacher enrollment is expected and state budget
constraints require enrollment be spread over the two years—with 50% of participating lead teachers enrolling in Year 1 and 50% in Year 2—
then you should input a value of 50%. Similarly, a value of 33% would reflect three years to enroll all existing teachers, 25% would reflect four
years, etc.
% of New Lead Teachers Hired in Years 1+ with Specialized Training in ECE/CD: The percentage of new lead teachers hired with specialized
training in ECE/CD to replace existing teachers (churn) or to meet expansion plans. Default assumptions reflect national Head Start statistics for
lead teacher degrees and should be reviewed and edited by the user as needed.
% of New Lead Teachers Hired in Years 1+ Enrolling in a Specialized Training Program: For new lead teachers hired without specialized training
in ECE/CD to replace existing teachers (churn) or to meet expansion plans, the percentage that are expected to enroll in such training. Default
assumptions reflect national Head Start statistics for lead teacher degrees and should be reviewed and edited by the user as needed.
Number of Years Required by Lead Teachers to Complete a Specialized Training Program in ECE/CD: The span of time for which participating
teachers without specialized training will receive tuition support, and the length of time before they are expected to complete their specialized
training and are eligible for a higher salary (if applicable). Partial year increments, such as 1.5 years, are allowed in the CPQ&R.
State-Level ECE Program Tuition Support Provided per Lead Teacher per Year ($): The specialized training tuition support cost per participating
lead teacher, expressed on a per-year basis.
Provider-Level FTE Salary Increase for Lead Teachers with Specialized Training, including Taxes & Benefits ($): An annual salary increase in
dollars ($) that is applied on top of any salary factors by degree level assumed in Table B.2.d.1 (Personnel Costs) to reflect higher compensation
awarded to teachers possessing an ECE/CD credential. The default value for this salary increase in the CPQ&R is zero ($0).
Annual State-Level Cost per Participating Teacher to Administrate Specialized Training Tuition Support ($): Additional state-level costs not
distributed to participating lead teachers. Such costs should remind you of the need to consider resources for state oversight of a tuition support
25
program. For example, your state may require proof of completing a class before issuing a tuition reimbursement to a lead teacher, and may
maintain records of this as part of a quality assurance program.
Professional Learning and Support. This table allows you to enter Professional Development (PD) assumptions for lead teachers and assistant
teachers. The NIEER benchmark is 15 hours of general PD training for lead teachers and assistant teachers, individualized PD plans, and coaching.
Several of the NIEER Quality Standards Benchmarks include training and coaching support. The CPQ&R was designed to simplify the organization
of these assumptions by consolidating them within the table for Professional Learning and Support. You will see separate entries for training and
coaching assumptions for General PD (meeting the Professional Learning and Support benchmark), Early Learning and Development Standards
(ELDS), Continuous Quality Improvement Systems (CQIS), and Curriculum. Although training and coaching assumptions for ELDS, CQIS, and
Curriculum are entered by the user in this section, the resulting costs are separately attributed to each quality standard.
The Alterable Variables in the Professional Learning and Support Section
Annual PD Training Hours per Lead Teacher: The number of hours required per year from lead teachers. Separate assumptions are allowed for
General PD training (meeting the benchmark for Professional Learning and Support), and Early Learning and Development Standards (ELDS)
training, Continuous Quality Improvement System (CQIS) training, and Curriculum training.
Annual PD Training Hours per Assistant Teacher: The number of hours required per year from assistant teachers.
One-Time Training? (Enter "No" if the Standard is for a Recurring Annual Training Requirement): A drop-down menu indicating whether the
training requirement is expected to recur annually or is a one-time training event. The timing of the training is Year 1 for existing lead teachers
and assistant teachers, and the year of hiring for new lead teachers and assistant teachers.
Average Training Fees per Teaching Staff Member per Hour: The hourly fee associated with each form of training, incurred at the provider level.
26
Are Substitutes Required for Teaching Staff to Attend Training?: A drop-down menu indicating whether training is in-service and substitute
teachers are needed backfill the necessary hours. Substitute teacher costs are incurred at the provider level.
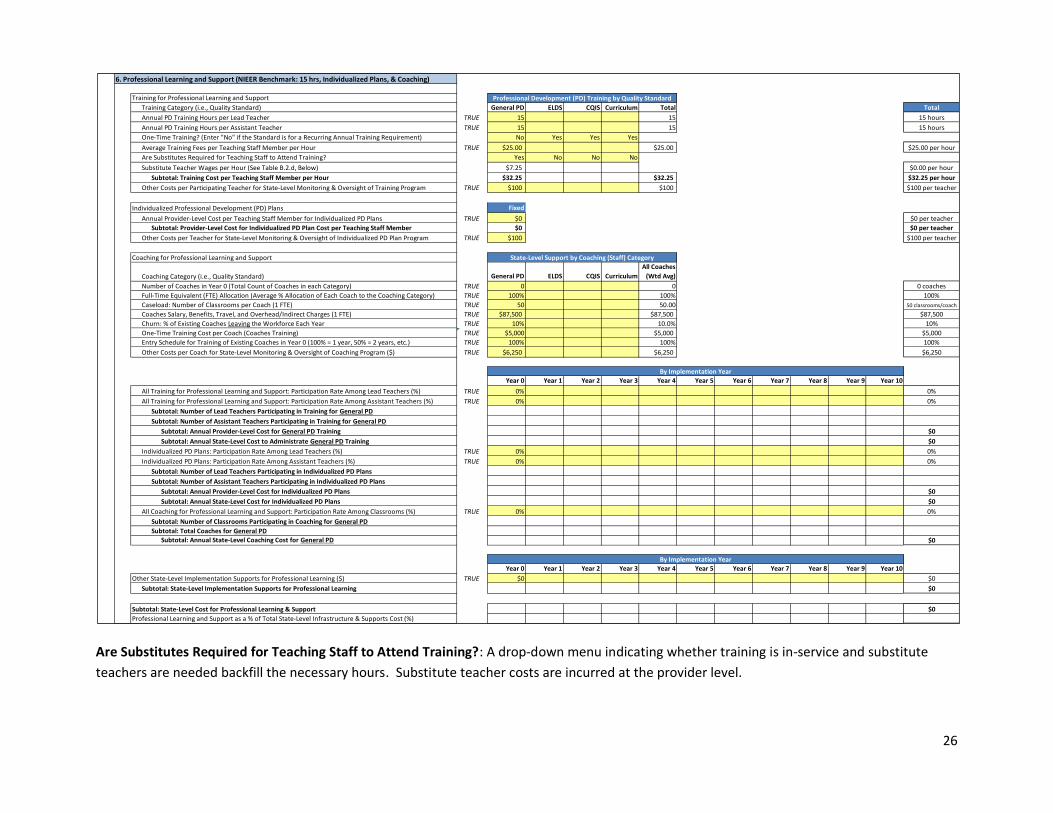
6. Professional Learning and Support (NIEER Benchmark: 15 hrs, Individualized Plans, & Coaching)
Training for Professional Learning and Support Professional Development (PD) Training by Quality Standard
Training Category (i.e., Quality Standard) General PD ELDS CQIS Curriculum Total Total
Annual PD Training Hours per Lead Teacher TRUE 15 15 15 hours
Annual PD Training Hours per Assistant Teacher TRUE 15 15 15 hours
One-Time Training? (Enter "No" if the Standard is for a Recurring Annual Training Requirement) No Yes Yes Yes
Average Training Fees per Teaching Staff Member per Hour TRUE $25.00 $25.00 $25.00 per hour
Are Substitutes Required for Teaching Staff to Attend Training? Yes No No No
Substitute Teacher Wages per Hour (See Table B.2.d, Below) $7.25 $0.00 per hour
Subtotal: Training Cost per Teaching Staff Member per Hour $32.25 $32.25 $32.25 per hour
Other Costs per Participating Teacher for State-Level Monitoring & Oversight of Training Program TRUE $100 $100 $100 per teacher
Individualized Professional Development (PD) Plans Fixed
Annual Provider-Level Cost per Teaching Staff Member for Individualized PD Plans TRUE $0 $0 per teacher
Subtotal: Provider-Level Cost for Individualized PD Plan Cost per Teaching Staff Member $0 $0 per teacher
Other Costs per Teacher for State-Level Monitoring & Oversight of Individualized PD Plan Program TRUE $100 $100 per teacher
Coaching for Professional Learning and Support State-Level Support by Coaching (Staff) Category
Coaching Category (i.e., Quality Standard) General PD ELDS CQIS Curriculum
All Coaches
(Wtd Avg)
Number of Coaches in Year 0 (Total Count of Coaches in each Category) TRUE 0 0 0 coaches
Full-Time Equivalent (FTE) Allocation (Average % Allocation of Each Coach to the Coaching Category) TRUE 100% 100% 100%
Caseload: Number of Classrooms per Coach (1 FTE) TRUE 50 50.00 50 classrooms/coach
Coaches Salary, Benefits, Travel, and Overhead/Indirect Charges (1 FTE) TRUE $87,500 $87,500 $87,500
Churn: % of Existing Coaches Leaving the Workforce Each Year TRUE 10% 10.0% 10%
One-Time Training Cost per Coach (Coaches Training) TRUE $5,000 $5,000 $5,000
Entry Schedule for Training of Existing Coaches in Year 0 (100% = 1 year, 50% = 2 years, etc.) TRUE 100% 100% 100%
Other Costs per Coach for State-Level Monitoring & Oversight of Coaching Program ($) TRUE $6,250 $6,250 $6,250
By Implementation Year
Year 0 Year 1 Year 2 Year 3 Year 4 Year 5 Year 6 Year 7 Year 8 Year 9 Year 10
All Training for Professional Learning and Support: Participation Rate Among Lead Teachers (%) TRUE 0% 0%
All Training for Professional Learning and Support: Participation Rate Among Assistant Teachers (%) TRUE 0% 0%
Subtotal: Number of Lead Teachers Participating in Training for General PD
Subtotal: Number of Assistant Teachers Participating in Training for General PD
Subtotal: Annual Provider-Level Cost for General PD Training $0
Subtotal: Annual State-Level Cost to Administrate General PD Training $0
Individualized PD Plans: Participation Rate Among Lead Teachers (%) TRUE 0% 0%
Individualized PD Plans: Participation Rate Among Assistant Teachers (%) TRUE 0% 0%
Subtotal: Number of Lead Teachers Participating in Individualized PD Plans
Subtotal: Number of Assistant Teachers Participating in Individualized PD Plans
Subtotal: Annual Provider-Level Cost for Individualized PD Plans $0
Subtotal: Annual State-Level Cost for Individualized PD Plans $0
All Coaching for Professional Learning and Support: Participation Rate Among Classrooms (%) TRUE 0% 0%
Subtotal: Number of Classrooms Participating in Coaching for General PD
Subtotal: Total Coaches for General PD
Subtotal: Annual State-Level Coaching Cost for General PD $0
By Implementation Year
Year 0 Year 1 Year 2 Year 3 Year 4 Year 5 Year 6 Year 7 Year 8 Year 9 Year 10
Other State-Level Implementation Supports for Professional Learning ($) TRUE $0 $0
Subtotal: State-Level Implementation Supports for Professional Learning $0
Subtotal: State-Level Cost for Professional Learning & Support $0
Professional Learning and Support as a % of Total State-Level Infrastructure & Supports Cost (%)
27
Other Costs per Participating Teacher for State-Level Monitoring & Oversight of Training Program: Other costs incurred at the state level,
associated with administration and oversight of each form of training, expressed on a per-teacher basis.
Annual Provider-Level Cost per Teaching Staff Member for Individualized PD Plans: Any costs expected to be incurred by the provider in
support of developing individualized PD plans, expressed on a per-teacher basis.
Other Costs per Teacher for State-Level Monitoring & Oversight of Individualized PD Plan Program: Any costs expected to be incurred at the
state level and associated with administration and oversight of individualized PD plans, expressed on a per-teacher basis.
Number of Coaches in Year 0 (Total Count of Coaches in each Category): If a coaching program currently exists as part of an existing preschool
program, then the number of coaches currently employed in each category of coaching.
Full-Time Equivalent (FTE) Allocation (Average % Allocation of Each Coach to the Coaching Category): The percent of time each coach is
allocated to coaching. 100% reflects a single full-time equivalent, or FTE. A value of 50% means that each individual coach spends half of their
available time coaching, and it would take twice as many individuals to meet a coaching load as a single FTE. You can use this allocation to model
coaches delivering more than one category of coaching; for example, you could enter 50% in General PD coaching and CQIS coaching if a single
coach is expected to split their time evenly between each category.
Caseload: Number of Classrooms per Coach (1 FTE): The number of classrooms that would be assigned to a coach who is 100% allocated to that
category of coaching. The caseload assumption is combined with the assumption for FTE allocation by coaching category to establish the
number of coaches required to satisfy the annual preschool slot plan.
Coaches Salary, Benefits, Travel, and Overhead/Indirect Charges (1 FTE): The total expense associated with each coach, which is then applied to
the number of coaches to estimate a total coaching cost before state-level monitoring & oversight of the coaching program.
Churn: % of Existing Coaches Leaving the Workforce Each Year: The percentage of coaches leaving the workforce annually. New coaches hired
to replace departing coaches or to meet an expansion plan must be trained, and all new coaches are subject to one-time training costs.
One-Time Training Cost per Coach (Coaches Training): A one-time training cost applied to existing coaches and new coaches at the time they
are hired, to develop their skills in providing quality coaching to lead teachers and assistant teachers.
Entry Schedule for Training of Existing Coaches in Year 0: The percentage of existing coaches expected to receive specialized training in the first
implementation year. For example, if all coaches existing in Year 0 are expected to receive training in Year 1, then you should input a value of
100%. However, if a large volume of coaches training is expected and state budget constraints require enrollment be spread over the two
28
years—with 50% of existing coaches receiving training on new standards in Year 1 and 50% in Year 2—then you should input a value of 50%.
Similarly, a value of 33% would reflect three years to train all existing coaches, 25% would reflect four years, etc.
Other Costs per Coach for State-Level Monitoring & Oversight of Coaching Program ($): Any costs expected to be incurred at the state level and
associated with administration and oversight of a coaching program, expressed on a per-coach basis. For example, if a coaching program is
comprised of field workers (i.e., the coaches themselves) and state-level supervisors, then the supervisors could be included as part of other
costs—unless they have already been accounted for as part of the overhead identified under Coaches Salary, Benefits, Travel, and
Overhead/Indirect Charges.
All Training for Professional Learning and Support: Participation Rate Among Lead Teachers (%): Lead teacher participation rate in all
categories of training for professional learning and support. For simplicity, the CPQ&R applies that same participation rate assumption for
General PD, ELDS, CQIS, and Curriculum Training. The actual number of lead teachers participating in each category of training is shown under
the relevant quality standard.
Advanced Users: you can easily modify the formulas to disaggregate the participation rate assumptions for lead teachers and assistant
teaches in General PD, ELDS, CQIS, and Curriculum training, and allow each category to have its own unique participation rate
assumption, by altering the contents of Table D.21 is Worksheet D: Annual Schedule Tables.
All Training for Professional Learning and Support: Participation Rate Among Assistant Teachers (%): Assistant teacher participation rate in all
categories of training for professional learning and support. For simplicity, the CPQ&R applies that same participation rate for General PD, ELDS,
CQIS, and Curriculum training. The actual number of assistant teachers participating in each category of training is shown under the relevant
quality standard.
Individualized PD Plans: Participation Rate Among Lead Teachers (%): Lead teacher participation rate in developing individualized professional
development plans.
Individualized PD Plans: Participation Rate Among Assistant Teachers (%): Assistant teacher participation rate in developing individualized
professional development plans.
All Coaching for Professional Learning and Support Participation Among Classrooms (%): Classroom participation rate in all categories of
coaching for professional learning and support. For simplicity, the CPQ&R applies that same participation rate assumption for General PD, ELDS,
CQIS, and Curriculum coaching. The actual number of classrooms participating in each category of coaching is shown under the relevant quality
standard.
29
Advanced Users: You can easily modify the formulas to disaggregate the participation rate assumptions for classrooms in General PD,
ELDS, CQIS, and Curriculum coaching, and allow each category to have its own unique participation rate assumption, by altering the
contents of Table D.23 is Worksheet D: Annual Schedule Tables.
Other State-Level Implementation Supports for Professional Learning ($): If there are other costs derived by the state associated with providing
supports for professional learning, then enter it here.
Advanced Users: In the section of the table that includes Other State-Level Implementation Supports for Professional Learning, only the
last row, “Subtotal: State-Level Implementation Supports for Professional Learning,” is used by other worksheets in the CPQ&R to
perform calculations. Therefore, you can insert additional rows in this section of the table as you see fit, as long as the correct subtotal
amount is still captured in the aforementioned subtotal row.
Early Learning and Development Standards. This table allows you to enter cost data related to the development of Early Learning and
Development Standards (ELDS) and subsequent technical assistance. The NIEER benchmark calls for Early Learning and Development Standards
that are developmentally appropriate and comprehensive, with state supports for implementation of curriculum aligned with K-3 standards
through guidance, materials, professional development, and the use of formative assessment to inform teaching. The sum of initial development
costs and technical assistance represents the implementation supports for an integrated ELDS.
In addition to development and technical assistance costs, this table presents the output from assumptions pertaining to training and coaching
lead teachers and assistant teachers for ELDS entered under Professional Learning and Support.
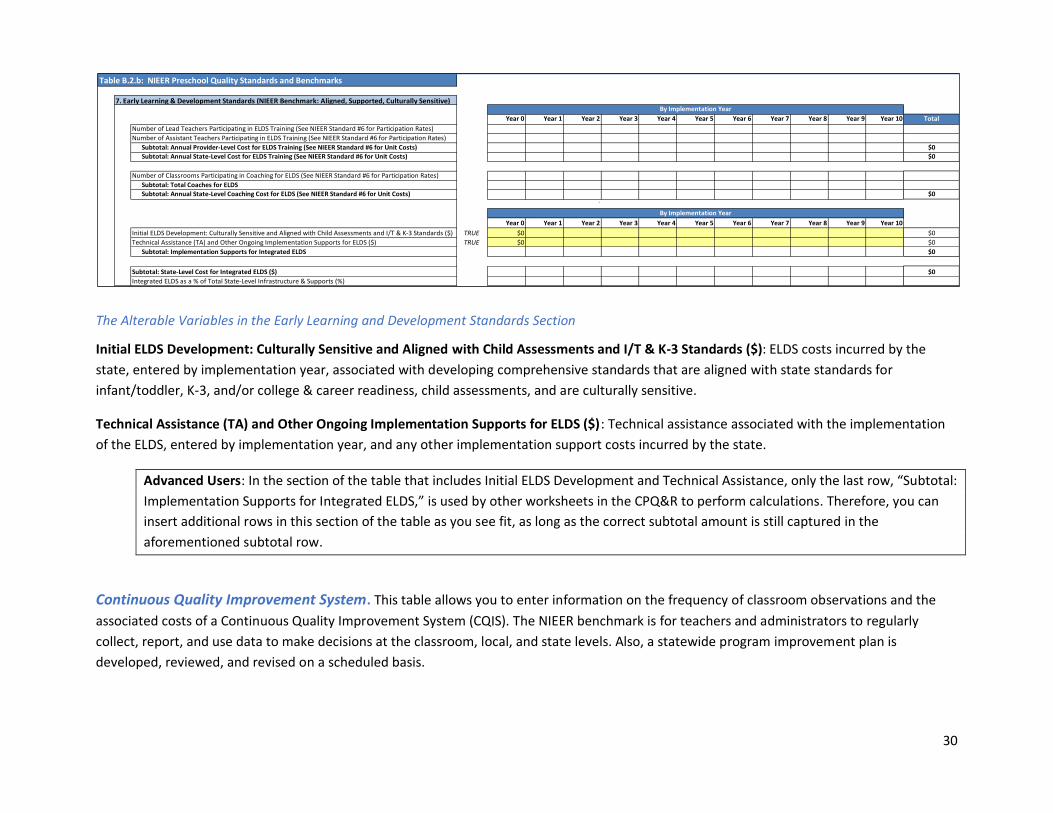
30
The Alterable Variables in the Early Learning and Development Standards Section
Initial ELDS Development: Culturally Sensitive and Aligned with Child Assessments and I/T & K-3 Standards ($): ELDS costs incurred by the
state, entered by implementation year, associated with developing comprehensive standards that are aligned with state standards for
infant/toddler, K-3, and/or college & career readiness, child assessments, and are culturally sensitive.
Technical Assistance (TA) and Other Ongoing Implementation Supports for ELDS ($): Technical assistance associated with the implementation
of the ELDS, entered by implementation year, and any other implementation support costs incurred by the state.
Advanced Users: In the section of the table that includes Initial ELDS Development and Technical Assistance, only the last row, “Subtotal:
Implementation Supports for Integrated ELDS,” is used by other worksheets in the CPQ&R to perform calculations. Therefore, you can
insert additional rows in this section of the table as you see fit, as long as the correct subtotal amount is still captured in the
aforementioned subtotal row.
Continuous Quality Improvement System. This table allows you to enter information on the frequency of classroom observations and the
associated costs of a Continuous Quality Improvement System (CQIS). The NIEER benchmark is for teachers and administrators to regularly
collect, report, and use data to make decisions at the classroom, local, and state levels. Also, a statewide program improvement plan is
developed, reviewed, and revised on a scheduled basis.
Table B.2.b: NIEER Preschool Quality Standards and Benchmarks
7. Early Learning & Development Standards (NIEER Benchmark: Aligned, Supported, Culturally Sensitive)By Implementation Year
Year 0 Year 1 Year 2 Year 3 Year 4 Year 5 Year 6 Year 7 Year 8 Year 9 Year 10 Total
Number of Lead Teachers Participating in ELDS Training (See NIEER Standard #6 for Participation Rates)
Number of Assistant Teachers Participating in ELDS Training (See NIEER Standard #6 for Participation Rates)
Subtotal: Annual Provider-Level Cost for ELDS Training (See NIEER Standard #6 for Unit Costs) $0
Subtotal: Annual State-Level Cost for ELDS Training (See NIEER Standard #6 for Unit Costs) $0
Number of Classrooms Participating in Coaching for ELDS (See NIEER Standard #6 for Participation Rates)
Subtotal: Total Coaches for ELDS
Subtotal: Annual State-Level Coaching Cost for ELDS (See NIEER Standard #6 for Unit Costs) $0
`
By Implementation Year
Year 0 Year 1 Year 2 Year 3 Year 4 Year 5 Year 6 Year 7 Year 8 Year 9 Year 10
Initial ELDS Development: Culturally Sensitive and Aligned with Child Assessments and I/T & K-3 Standards ($) TRUE $0 $0
Technical Assistance (TA) and Other Ongoing Implementation Supports for ELDS ($) TRUE $0 $0
Subtotal: Implementation Supports for Integrated ELDS $0
Subtotal: State-Level Cost for Integrated ELDS ($) $0
Integrated ELDS as a % of Total State-Level Infrastructure & Supports (%)
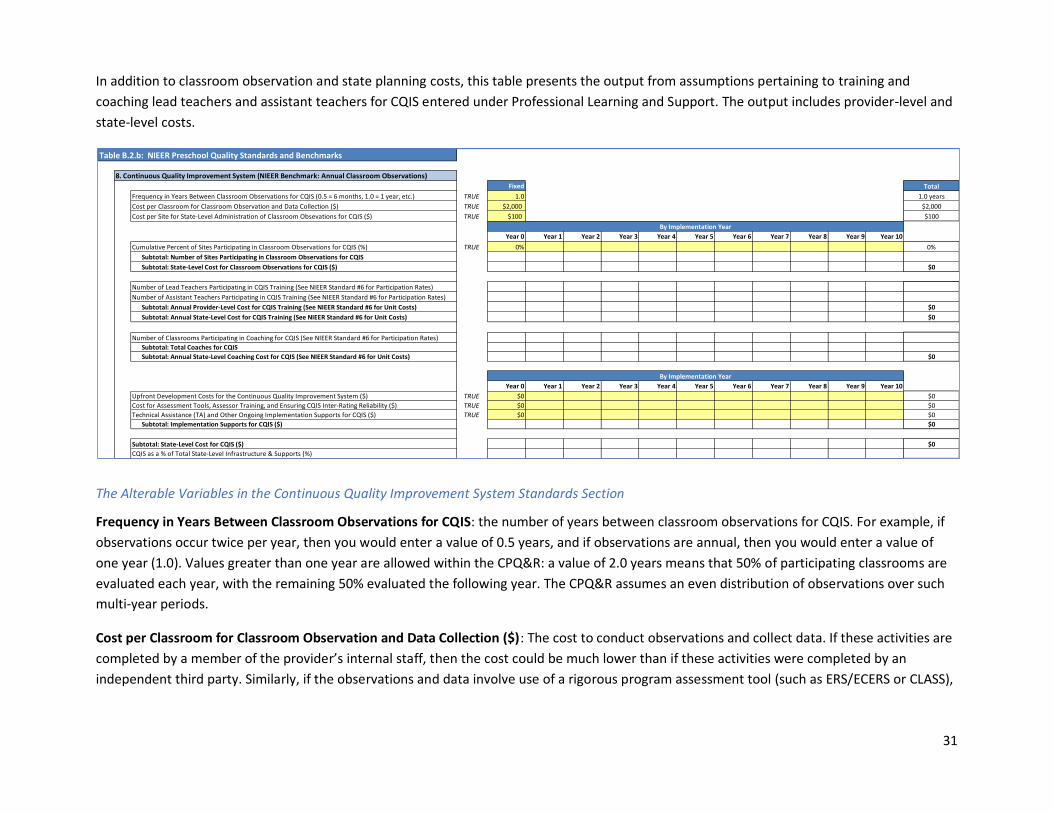
31
In addition to classroom observation and state planning costs, this table presents the output from assumptions pertaining to training and
coaching lead teachers and assistant teachers for CQIS entered under Professional Learning and Support. The output includes provider-level and
state-level costs.
The Alterable Variables in the Continuous Quality Improvement System Standards Section
Frequency in Years Between Classroom Observations for CQIS: the number of years between classroom observations for CQIS. For example, if
observations occur twice per year, then you would enter a value of 0.5 years, and if observations are annual, then you would enter a value of
one year (1.0). Values greater than one year are allowed within the CPQ&R: a value of 2.0 years means that 50% of participating classrooms are
evaluated each year, with the remaining 50% evaluated the following year. The CPQ&R assumes an even distribution of observations over such
multi-year periods.
Cost per Classroom for Classroom Observation and Data Collection ($): The cost to conduct observations and collect data. If these activities are
completed by a member of the provider’s internal staff, then the cost could be much lower than if these activities were completed by an
independent third party. Similarly, if the observations and data involve use of a rigorous program assessment tool (such as ERS/ECERS or CLASS),
Table B.2.b: NIEER Preschool Quality Standards and Benchmarks
8. Continuous Quality Improvement System (NIEER Benchmark: Annual Classroom Observations)
Fixed Total
Frequency in Years Between Classroom Observations for CQIS (0.5 = 6 months, 1.0 = 1 year, etc.) TRUE 1.0 1.0 years
Cost per Classroom for Classroom Observation and Data Collection ($) TRUE $2,000 $2,000
Cost per Site for State-Level Administration of Classroom Obsevations for CQIS ($) TRUE $100 $100
By Implementation Year
Year 0 Year 1 Year 2 Year 3 Year 4 Year 5 Year 6 Year 7 Year 8 Year 9 Year 10
Cumulative Percent of Sites Participating in Classroom Observations for CQIS (%) TRUE 0% 0%
Subtotal: Number of Sites Participating in Classroom Observations for CQIS
Subtotal: State-Level Cost for Classroom Observations for CQIS ($) $0
Number of Lead Teachers Participating in CQIS Training (See NIEER Standard #6 for Participation Rates)
Number of Assistant Teachers Participating in CQIS Training (See NIEER Standard #6 for Participation Rates)
Subtotal: Annual Provider-Level Cost for CQIS Training (See NIEER Standard #6 for Unit Costs) $0
Subtotal: Annual State-Level Cost for CQIS Training (See NIEER Standard #6 for Unit Costs) $0
Number of Classrooms Participating in Coaching for CQIS (See NIEER Standard #6 for Participation Rates)
Subtotal: Total Coaches for CQIS
Subtotal: Annual State-Level Coaching Cost for CQIS (See NIEER Standard #6 for Unit Costs) $0
By Implementation Year
Year 0 Year 1 Year 2 Year 3 Year 4 Year 5 Year 6 Year 7 Year 8 Year 9 Year 10
Upfront Development Costs for the Continuous Quality Improvement System ($) TRUE $0 $0
Cost for Assessment Tools, Assessor Training, and Ensuring CQIS Inter-Rating Reliability ($) TRUE $0 $0
Technical Assistance (TA) and Other Ongoing Implementation Supports for CQIS ($) TRUE $0 $0
Subtotal: Implementation Supports for CQIS ($) $0
Subtotal: State-Level Cost for CQIS ($) $0
CQIS as a % of Total State-Level Infrastructure & Supports (%)
32
then the cost will be higher than if a program assessment tool is not used. The default value for the cost per classroom in the CPQ&R reflects a
situation wherein an independent third party observes the class and utilizes rigorous program assessment tools to issue a CQIS rating.
Cost per Site for State-Level Administration of Classroom Observations for CQIS ($): Any costs expected to be incurred at the state level and
associated with administration and oversight of a program of classroom observations for CQIS, expressed on a per-site basis.
Cumulative Percent of Sites Participating in Classroom Observations for CQIS (%): The percentage of sites expected to participate in classroom
observations for CQIS each year. This percentage is combined with the frequency of classroom observations to establish the number of
observations expected annually under a preschool slot plan. For example, if 50% of classrooms are expected to participate in classroom
observations and the frequency between observations is two years (2.0), then 25% of classrooms would be expected to complete classroom
observations each year, with the remaining 25% completing observations the following year.
Upfront Development Costs for the Continuous Quality Improvement System ($): Initial costs incurred by the state, entered by implementation
year, associated with developing a system using data to make decisions at the classroom, local, and state level.
Cost for Assessment Tools, Assessor Training, and Ensuring CQIS Inter-Rating Reliability ($): Initial and ongoing costs for the use of assessment
tools, including the cost of the tools, training of assessors, and testing for reliably consistent assessments between assessors.
Technical Assistance (TA) and Other Ongoing Implementation Supports for CQIS ($): Ongoing cost, entered by implementation year, for
technical assistance and other any other supports—excluding upfront development costs and the cost for assessment tools, assessor training,
and ensuring inter-rating reliability—related to the implementation of a Continuous Quality Improvement System.
Advanced Users: In the section of the table that includes Upfront Development Costs and Technical Assistance, only the last row,
“Subtotal: Implementation Supports for CQIS,” is used by other worksheets in the CPQ&R to perform calculations. Therefore, you can
insert additional rows in this section of the table as you see fit, as long as the correct subtotal amount is still captured in the
aforementioned subtotal row.
Curriculum. This table allows you to enter unit information related to curriculum development and support. The NIEER benchmark calls for
support to be in place for curriculum selection and implementation. States are not required to use specific curriculum models but rather must
provide guidance for, or have a process for, approving the use of curricula as well as provide support for implementation.

33
In addition to curriculum selection and implementation costs, this table presents the output from assumptions pertaining to training and
coaching lead teachers and assistant teachers for Curriculum entered under Professional Learning and Support. The output includes provider-
level and state-level costs.
The Alterable Variables for the Curriculum Standards Section
One-Time Cost per Participating Site for Curriculum Selection Supports: A state level cost incurred as the result of a site participating in support
for curriculum selection. The CPQ&R assumes this is a one-time cost for existing and new sites participating in such support.
Cumulative Percent of Sites Participating in Curriculum Selection Supports (%): The percentage of sites, by implementation year, that have
utilized curriculum selection support in the current year and in all past years. If all sites are expected to receive such support in the first
implementation year, then you would enter a value of 100% in Year 1 and in all subsequent years of your annual slot plan. You can also model a
9. Curriculum (NIEER Benchmark: Supports for Curriculum Selection and Implementation)
Curriculum Selection Fixed Total
One-Time Cost per Participating Site for Curiculum Selection Supports TRUE $100 $100 per site
By Implementation Year
Year 0 Year 1 Year 2 Year 3 Year 4 Year 5 Year 6 Year 7 Year 8 Year 9 Year 10
Cumulative Percent of Sites Participating in Curriculum Selection Supports (%) TRUE 0% 0%
Subtotal: Cumulative Number of Sites Participating in Curriculum Selection Supports 0 sites
Subtotal: Number of Sites Receiving One-Time Curriculum Selection Supports 0 sites
Subtotal: State-Level Cost for One-Time Curriculum Selection Supports ($) $0
Curriculum Implementation Fixed
One-Time Cost per Participating Classroom for Curriculum Materials TRUE $800 $800 per classroom
By Implementation Year
Year 0 Year 1 Year 2 Year 3 Year 4 Year 5 Year 6 Year 7 Year 8 Year 9 Year 10
Cumulative Percent of Classrooms Participating in Curriculum Materials Support (%) TRUE 0% 0%
Subtotal: Cumulative Number of Classrooms Participating in Curriculum Materials Support 0 classrooms
Subtotal: Number of Classrooms Receiving One-Time Curriculum Materials 0 classrooms
Subtotal: State-Level Cost for One-Time Curriculum Materials Support ($) $0
Number of Lead Teachers Participating in Curriculum Training (See NIEER Standard #6 for Participation Rates)
Number of Assistant Teachers Participating in Curriculum Training (See NIEER Standard #6, Above)
Subtotal: Annual Provider-Level Cost for Curriculum Training (See NIEER Standard #6 for Unit Costs) $0
Subtotal: Annual State-Level Cost for Curriculum Training (See NIEER Standard #6 for Unit Costs) $0
Number of Classrooms Participating in Coaching for Curriculum (See NIEER Standard #6, Above)
Subtotal: Total Coaches for Curriculum
Subtotal: Annual State-Level Coaching Cost for Curriculum (See NIEER Standard #6 for Unit Costs) $0
By Implementation Year
Year 0 Year 1 Year 2 Year 3 Year 4 Year 5 Year 6 Year 7 Year 8 Year 9 Year 10
Upfront Development Costs to Align Curriculum with other State Standards ($) TRUE $0 $0
Technical Assistance (TA) and Other Ongoing Implementation Supports for Curriculum ($) TRUE $0 $0
Subtotal: Implementation Supports for Curriculum ($) $0
Subtotal: State-Level Cost for Curriculum ($) $0
Curriculum as a % of Total State-Level Infrastructure & Supports (%)
34
program for curriculum selection supports that is growing over time, perhaps because caseload restrictions prevent state-level staff from
administering the intended support to 100% of sites in one calendar year.
One-Time Cost per Participating Classroom for Curriculum Materials: A state level cost incurred as the result of a site receiving curriculum
materials. The CPQ&R assumes this is a one-time cost for existing and new sites participating in such support.
Cumulative Percent of Classrooms Participating in Curriculum Materials Support (%): The percentage of sites, by implementation year, that
have received curriculum materials in the current year and in all past years. If all sites are expected to receive the materials in the first
implementation year, then you would enter a value of 100% in Year 1 and in all subsequent years of your annual slot plan. You can also model a
program for curriculum materials that is growing over time.
Upfront Development Costs to Align Curriculum with other State Standards ($): Initial costs incurred by the state, entered by implementation
year, associated with aligning selected curricula with other state standards.
Technical Assistance (TA) and Other Ongoing Implementation Supports for Curriculum ($): Ongoing cost, entered by implementation year, for
technical assistance and other supports related to implementation of a statewide curriculum program.
Advanced Users: In the section of the table including Upfront Development Costs and Technical Assistance, only the last row, “Subtotal:
Implementation Supports for Curriculum,” is used by other worksheets in the CPQ&R to perform calculations. Therefore, you can insert
additional rows in this section of the table as you see fit, as long as the correct subtotal amounts is still captured in the aforementioned
subtotal row.
Screening/Referral and Support Services. This table allows you to specify the cost to the provider for offering screening and referral services
per participating child, and the percentage of children expected to participate in these services. The NIEER benchmark is to offer vision, hearing,
and health screening. Varying assumptions by delivery model allows the CPQ&R to accommodate situations wherein one delivery model
provides more screening/referral and support services than another. For example, Head Start might offer more comprehensive screening and
support services than Child Care Centers.
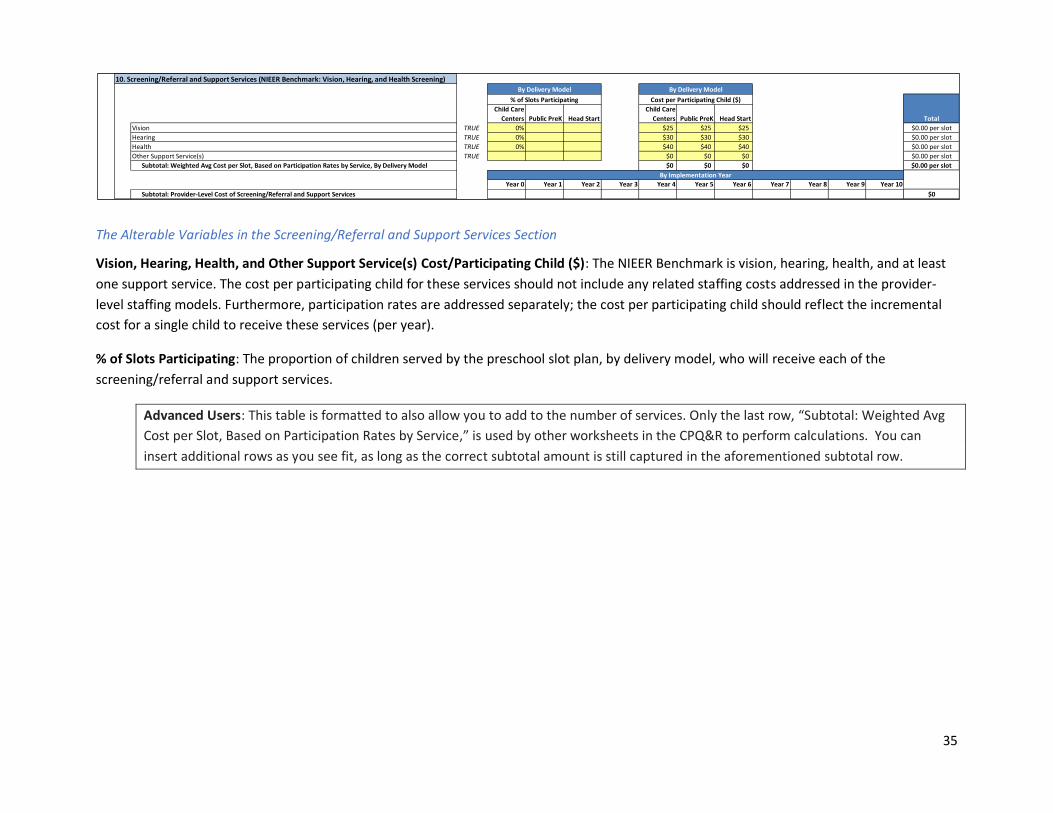
35
The Alterable Variables in the Screening/Referral and Support Services Section
Vision, Hearing, Health, and Other Support Service(s) Cost/Participating Child ($): The NIEER Benchmark is vision, hearing, health, and at least
one support service. The cost per participating child for these services should not include any related staffing costs addressed in the provider-
level staffing models. Furthermore, participation rates are addressed separately; the cost per participating child should reflect the incremental
cost for a single child to receive these services (per year).
% of Slots Participating: The proportion of children served by the preschool slot plan, by delivery model, who will receive each of the
screening/referral and support services.
Advanced Users: This table is formatted to also allow you to add to the number of services. Only the last row, “Subtotal: Weighted Avg
Cost per Slot, Based on Participation Rates by Service,” is used by other worksheets in the CPQ&R to perform calculations. You can
insert additional rows as you see fit, as long as the correct subtotal amount is still captured in the aforementioned subtotal row.
10. Screening/Referral and Support Services (NIEER Benchmark: Vision, Hearing, and Health Screening)
By Delivery Model By Delivery Model
% of Slots Participating Cost per Participating Child ($)
Child Care
Centers Public PreK Head Start
Child Care
Centers Public PreK Head Start
Vision TRUE 0% $25 $25 $25 $0.00 per slot
Hearing TRUE 0% $30 $30 $30 $0.00 per slot
Health TRUE 0% $40 $40 $40 $0.00 per slot
Other Support Service(s) TRUE $0 $0 $0 $0.00 per slot
Subtotal: Weighted Avg Cost per Slot, Based on Participation Rates by Service, By Delivery Model $0 $0 $0 $0.00 per slot
By Implementation Year
Year 0 Year 1 Year 2 Year 3 Year 4 Year 5 Year 6 Year 7 Year 8 Year 9 Year 10
Subtotal: Provider-Level Cost of Screening/Referral and Support Services $0
Total
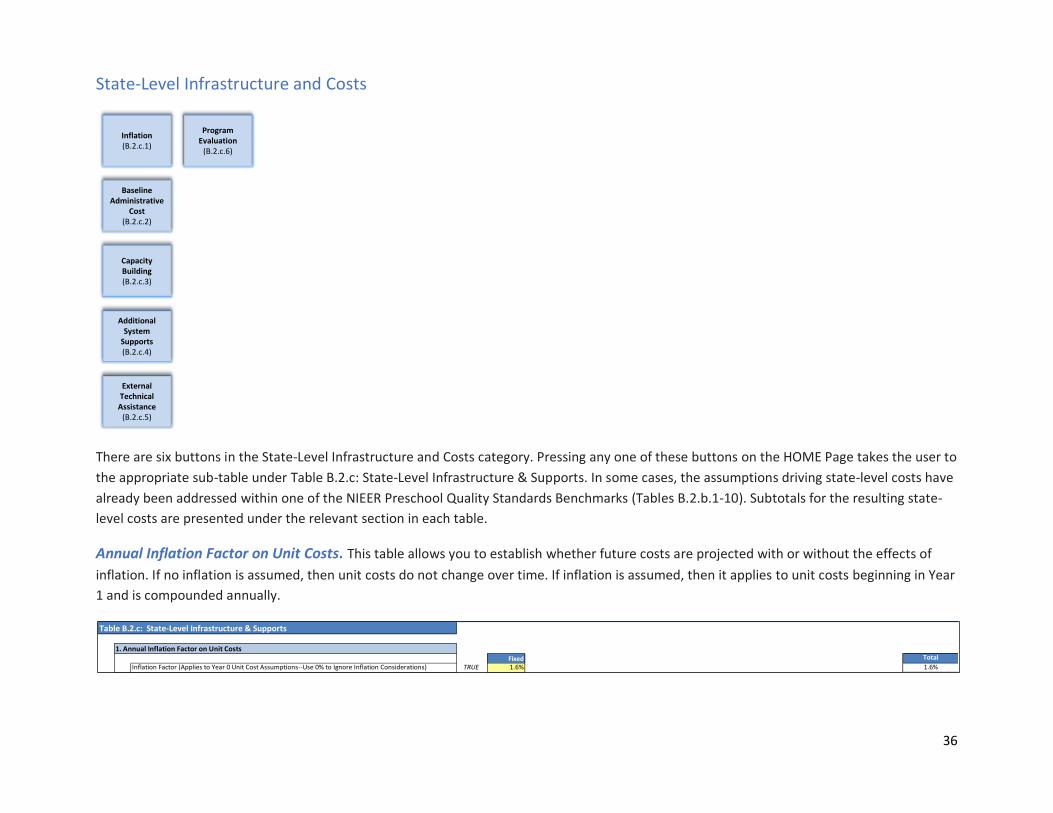
36
State-Level Infrastructure and Costs
There are six buttons in the State-Level Infrastructure and Costs category. Pressing any one of these buttons on the HOME Page takes the user to
the appropriate sub-table under Table B.2.c: State-Level Infrastructure & Supports. In some cases, the assumptions driving state-level costs have
already been addressed within one of the NIEER Preschool Quality Standards Benchmarks (Tables B.2.b.1-10). Subtotals for the resulting state-
level costs are presented under the relevant section in each table.
Annual Inflation Factor on Unit Costs. This table allows you to establish whether future costs are projected with or without the effects of
inflation. If no inflation is assumed, then unit costs do not change over time. If inflation is assumed, then it applies to unit costs beginning in Year
1 and is compounded annually.
Inflation(B.2.c.1)
Baseline Administrative
Cost(B.2.c.2)
CapacityBuilding(B.2.c.3)
AdditionalSystem
Supports(B.2.c.4)
ExternalTechnical
Assistance (B.2.c.5)
ProgramEvaluation
(B.2.c.6)
Table B.2.c: State-Level Infrastructure & Supports
1. Annual Inflation Factor on Unit CostsFixed Total
Inflation Factor (Applies to Year 0 Unit Cost Assumptions--Use 0% to Ignore Inflation Considerations) TRUE 1.6% 1.6%
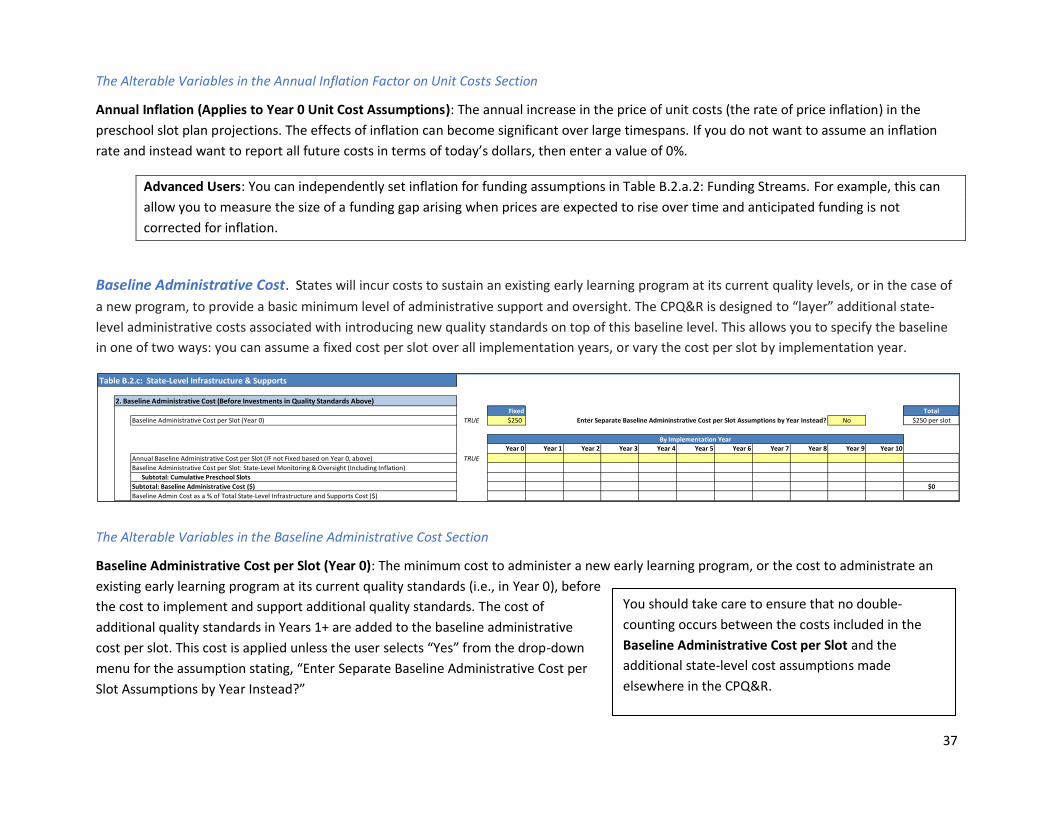
37
The Alterable Variables in the Annual Inflation Factor on Unit Costs Section
Annual Inflation (Applies to Year 0 Unit Cost Assumptions): The annual increase in the price of unit costs (the rate of price inflation) in the
preschool slot plan projections. The effects of inflation can become significant over large timespans. If you do not want to assume an inflation
rate and instead want to report all future costs in terms of today’s dollars, then enter a value of 0%.
Advanced Users: You can independently set inflation for funding assumptions in Table B.2.a.2: Funding Streams. For example, this can
allow you to measure the size of a funding gap arising when prices are expected to rise over time and anticipated funding is not
corrected for inflation.
Baseline Administrative Cost. States will incur costs to sustain an existing early learning program at its current quality levels, or in the case of
a new program, to provide a basic minimum level of administrative support and oversight. The CPQ&R is designed to “layer” additional state-
level administrative costs associated with introducing new quality standards on top of this baseline level. This allows you to specify the baseline
in one of two ways: you can assume a fixed cost per slot over all implementation years, or vary the cost per slot by implementation year.
The Alterable Variables in the Baseline Administrative Cost Section
Baseline Administrative Cost per Slot (Year 0): The minimum cost to administer a new early learning program, or the cost to administrate an
existing early learning program at its current quality standards (i.e., in Year 0), before
the cost to implement and support additional quality standards. The cost of
additional quality standards in Years 1+ are added to the baseline administrative
cost per slot. This cost is applied unless the user selects “Yes” from the drop-down
menu for the assumption stating, “Enter Separate Baseline Administrative Cost per
Slot Assumptions by Year Instead?”
Table B.2.c: State-Level Infrastructure & Supports
2. Baseline Administrative Cost (Before Investments in Quality Standards Above)Fixed Total
Baseline Administrative Cost per Slot (Year 0) TRUE $250 Enter Separate Baseline Admininstrative Cost per Slot Assumptions by Year Instead? No $250 per slot
By Implementation Year
Year 0 Year 1 Year 2 Year 3 Year 4 Year 5 Year 6 Year 7 Year 8 Year 9 Year 10
Annual Baseline Administrative Cost per Slot (IF not Fixed based on Year 0, above) TRUE
Baseline Administrative Cost per Slot: State-Level Monitoring & Oversight (Including Inflation)
Subtotal: Cumulative Preschool Slots
Subtotal: Baseline Administrative Cost ($) $0
Baseline Admin Cost as a % of Total State-Level Infrastructure and Supports Cost ($)
You should take care to ensure that no double-
counting occurs between the costs included in the
Baseline Administrative Cost per Slot and the
additional state-level cost assumptions made
elsewhere in the CPQ&R.
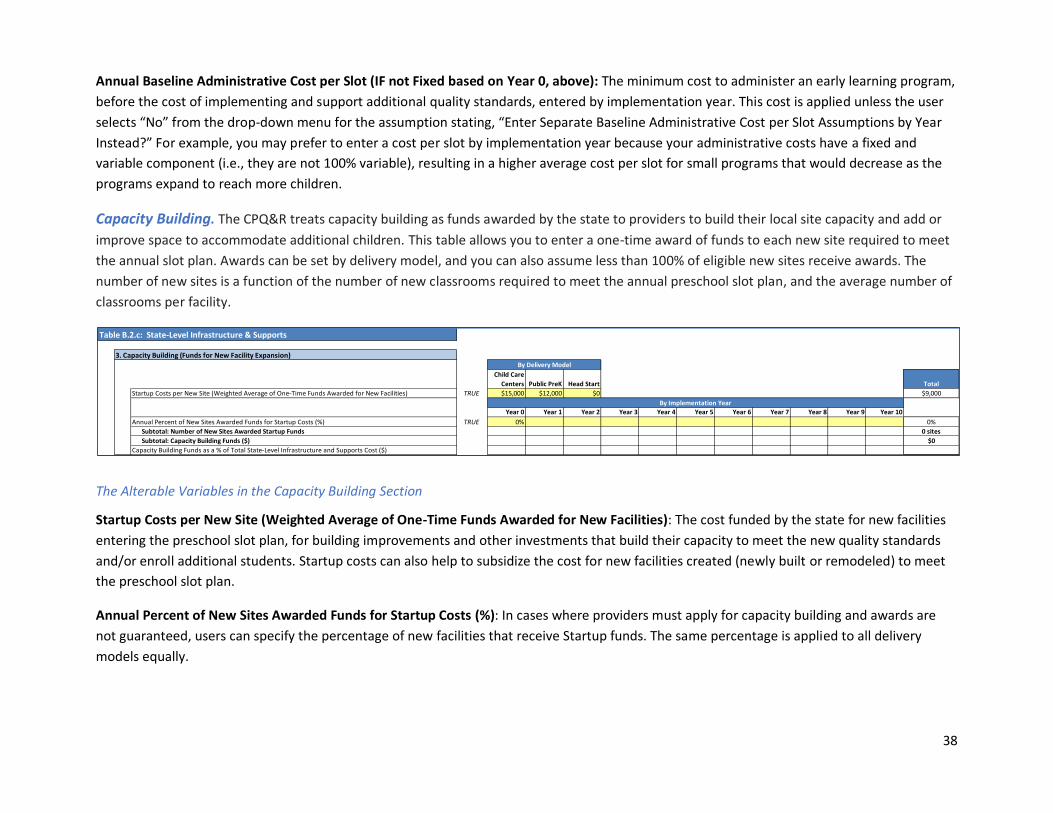
38
Annual Baseline Administrative Cost per Slot (IF not Fixed based on Year 0, above): The minimum cost to administer an early learning program,
before the cost of implementing and support additional quality standards, entered by implementation year. This cost is applied unless the user
selects “No” from the drop-down menu for the assumption stating, “Enter Separate Baseline Administrative Cost per Slot Assumptions by Year
Instead?” For example, you may prefer to enter a cost per slot by implementation year because your administrative costs have a fixed and
variable component (i.e., they are not 100% variable), resulting in a higher average cost per slot for small programs that would decrease as the
programs expand to reach more children.
Capacity Building. The CPQ&R treats capacity building as funds awarded by the state to providers to build their local site capacity and add or
improve space to accommodate additional children. This table allows you to enter a one-time award of funds to each new site required to meet
the annual slot plan. Awards can be set by delivery model, and you can also assume less than 100% of eligible new sites receive awards. The
number of new sites is a function of the number of new classrooms required to meet the annual preschool slot plan, and the average number of
classrooms per facility.
The Alterable Variables in the Capacity Building Section
Startup Costs per New Site (Weighted Average of One-Time Funds Awarded for New Facilities): The cost funded by the state for new facilities
entering the preschool slot plan, for building improvements and other investments that build their capacity to meet the new quality standards
and/or enroll additional students. Startup costs can also help to subsidize the cost for new facilities created (newly built or remodeled) to meet
the preschool slot plan.
Annual Percent of New Sites Awarded Funds for Startup Costs (%): In cases where providers must apply for capacity building and awards are
not guaranteed, users can specify the percentage of new facilities that receive Startup funds. The same percentage is applied to all delivery
models equally.
Table B.2.c: State-Level Infrastructure & Supports
3. Capacity Building (Funds for New Facility Expansion)By Delivery Model
Child Care
Centers Public PreK Head Start Total
Startup Costs per New Site (Weighted Average of One-Time Funds Awarded for New Facilities) TRUE $15,000 $12,000 $0 $9,000
By Implementation Year
Year 0 Year 1 Year 2 Year 3 Year 4 Year 5 Year 6 Year 7 Year 8 Year 9 Year 10
Annual Percent of New Sites Awarded Funds for Startup Costs (%) TRUE 0% 0%
Subtotal: Number of New Sites Awarded Startup Funds 0 sites
Subtotal: Capacity Building Funds ($) $0
Capacity Building Funds as a % of Total State-Level Infrastructure and Supports Cost ($)
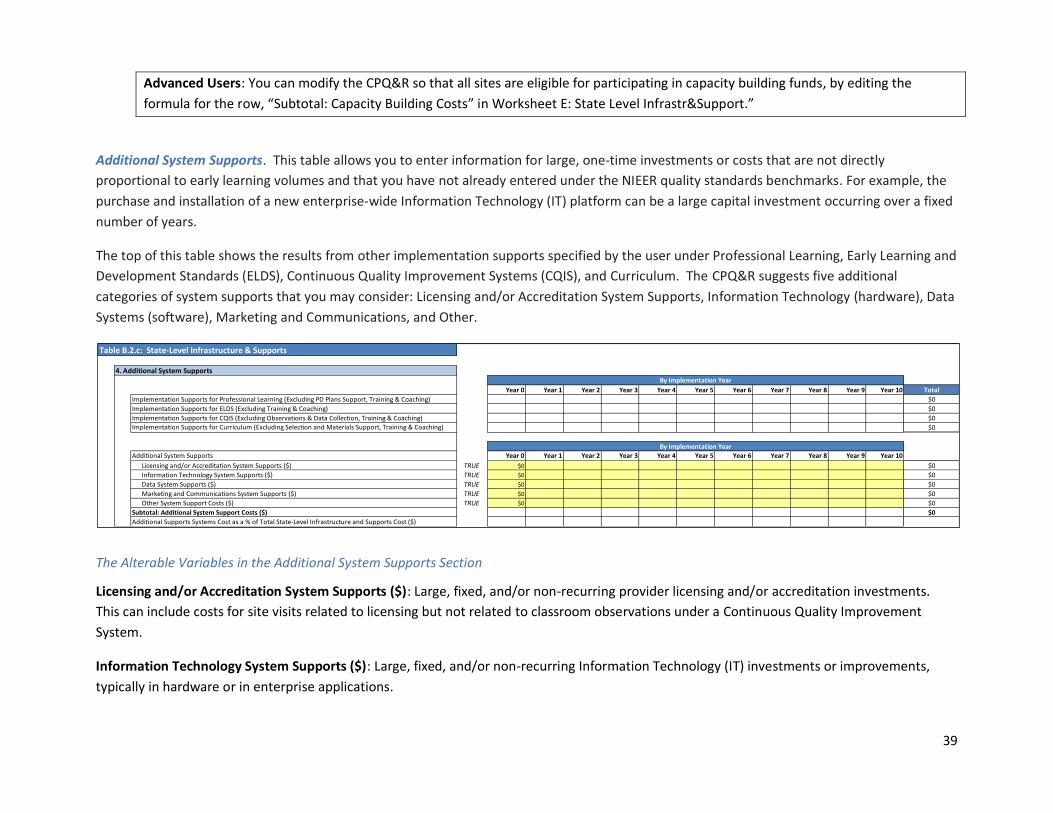
39
Advanced Users: You can modify the CPQ&R so that all sites are eligible for participating in capacity building funds, by editing the
formula for the row, “Subtotal: Capacity Building Costs” in Worksheet E: State Level Infrastr&Support.”
Additional System Supports. This table allows you to enter information for large, one-time investments or costs that are not directly
proportional to early learning volumes and that you have not already entered under the NIEER quality standards benchmarks. For example, the
purchase and installation of a new enterprise-wide Information Technology (IT) platform can be a large capital investment occurring over a fixed
number of years.
The top of this table shows the results from other implementation supports specified by the user under Professional Learning, Early Learning and
Development Standards (ELDS), Continuous Quality Improvement Systems (CQIS), and Curriculum. The CPQ&R suggests five additional
categories of system supports that you may consider: Licensing and/or Accreditation System Supports, Information Technology (hardware), Data
Systems (software), Marketing and Communications, and Other.
The Alterable Variables in the Additional System Supports Section
Licensing and/or Accreditation System Supports ($): Large, fixed, and/or non-recurring provider licensing and/or accreditation investments.
This can include costs for site visits related to licensing but not related to classroom observations under a Continuous Quality Improvement
System.
Information Technology System Supports ($): Large, fixed, and/or non-recurring Information Technology (IT) investments or improvements,
typically in hardware or in enterprise applications.
Table B.2.c: State-Level Infrastructure & Supports
4. Additional System SupportsBy Implementation Year
Year 0 Year 1 Year 2 Year 3 Year 4 Year 5 Year 6 Year 7 Year 8 Year 9 Year 10 Total
Implementation Supports for Professional Learning (Excluding PD Plans Support, Training & Coaching) $0
Implementation Supports for ELDS (Excluding Training & Coaching) $0
Implementation Supports for CQIS (Excluding Observations & Data Collection, Training & Coaching) $0
Implementation Supports for Curriculum (Excluding Selection and Materials Support, Training & Coaching) $0
By Implementation Year
Additional System Supports Year 0 Year 1 Year 2 Year 3 Year 4 Year 5 Year 6 Year 7 Year 8 Year 9 Year 10
Licensing and/or Accreditation System Supports ($) TRUE $0 $0
Information Technology System Supports ($) TRUE $0 $0
Data System Supports ($) TRUE $0 $0
Marketing and Communications System Supports ($) TRUE $0 $0
Other System Support Costs ($) TRUE $0 $0
Subtotal: Additional System Support Costs ($) $0
Additional Supports Systems Cost as a % of Total State-Level Infrastructure and Supports Cost ($)
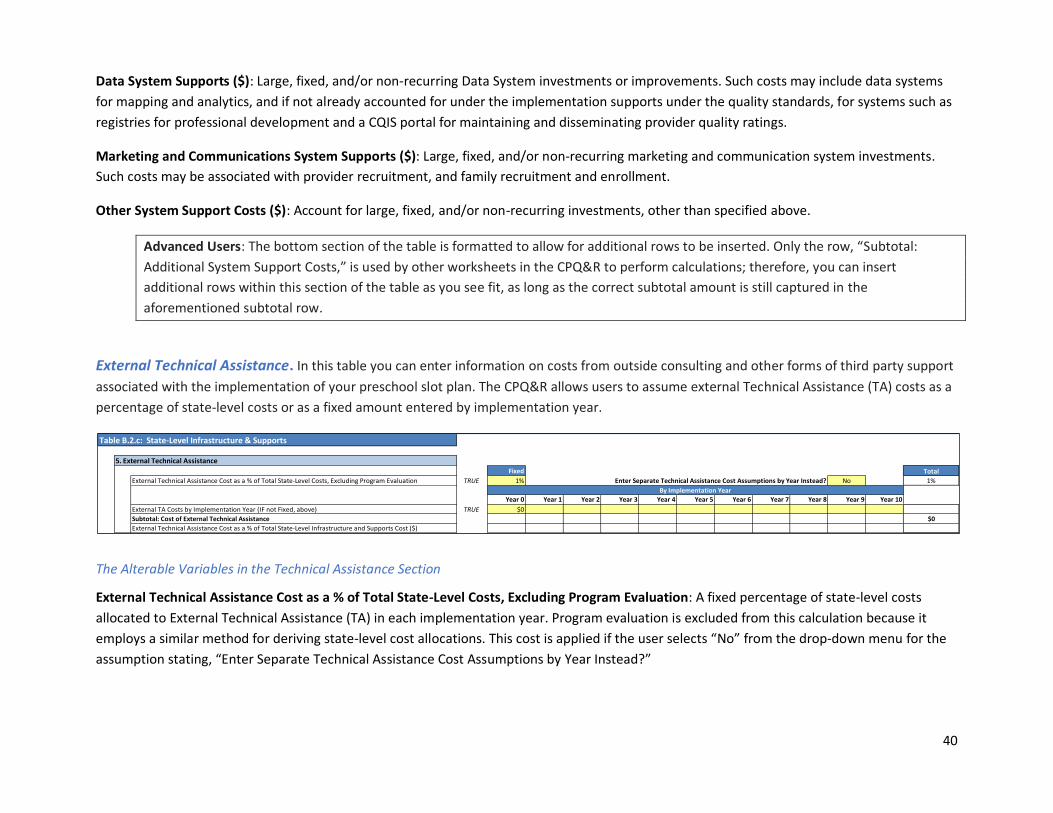
40
Data System Supports ($): Large, fixed, and/or non-recurring Data System investments or improvements. Such costs may include data systems
for mapping and analytics, and if not already accounted for under the implementation supports under the quality standards, for systems such as
registries for professional development and a CQIS portal for maintaining and disseminating provider quality ratings.
Marketing and Communications System Supports ($): Large, fixed, and/or non-recurring marketing and communication system investments.
Such costs may be associated with provider recruitment, and family recruitment and enrollment.
Other System Support Costs ($): Account for large, fixed, and/or non-recurring investments, other than specified above.
Advanced Users: The bottom section of the table is formatted to allow for additional rows to be inserted. Only the row, “Subtotal:
Additional System Support Costs,” is used by other worksheets in the CPQ&R to perform calculations; therefore, you can insert
additional rows within this section of the table as you see fit, as long as the correct subtotal amount is still captured in the
aforementioned subtotal row.
External Technical Assistance. In this table you can enter information on costs from outside consulting and other forms of third party support
associated with the implementation of your preschool slot plan. The CPQ&R allows users to assume external Technical Assistance (TA) costs as a
percentage of state-level costs or as a fixed amount entered by implementation year.
The Alterable Variables in the Technical Assistance Section
External Technical Assistance Cost as a % of Total State-Level Costs, Excluding Program Evaluation: A fixed percentage of state-level costs
allocated to External Technical Assistance (TA) in each implementation year. Program evaluation is excluded from this calculation because it
employs a similar method for deriving state-level cost allocations. This cost is applied if the user selects “No” from the drop-down menu for the
assumption stating, “Enter Separate Technical Assistance Cost Assumptions by Year Instead?”
Table B.2.c: State-Level Infrastructure & Supports
5. External Technical Assistance
Fixed Total
External Technical Assistance Cost as a % of Total State-Level Costs, Excluding Program Evaluation TRUE 1% Enter Separate Technical Assistance Cost Assumptions by Year Instead? No 1%
By Implementation Year
Year 0 Year 1 Year 2 Year 3 Year 4 Year 5 Year 6 Year 7 Year 8 Year 9 Year 10
External TA Costs by Implementation Year (IF not Fixed, above) TRUE $0
Subtotal: Cost of External Technical Assistance $0
External Technical Assistance Cost as a % of Total State-Level Infrastructure and Supports Cost ($)
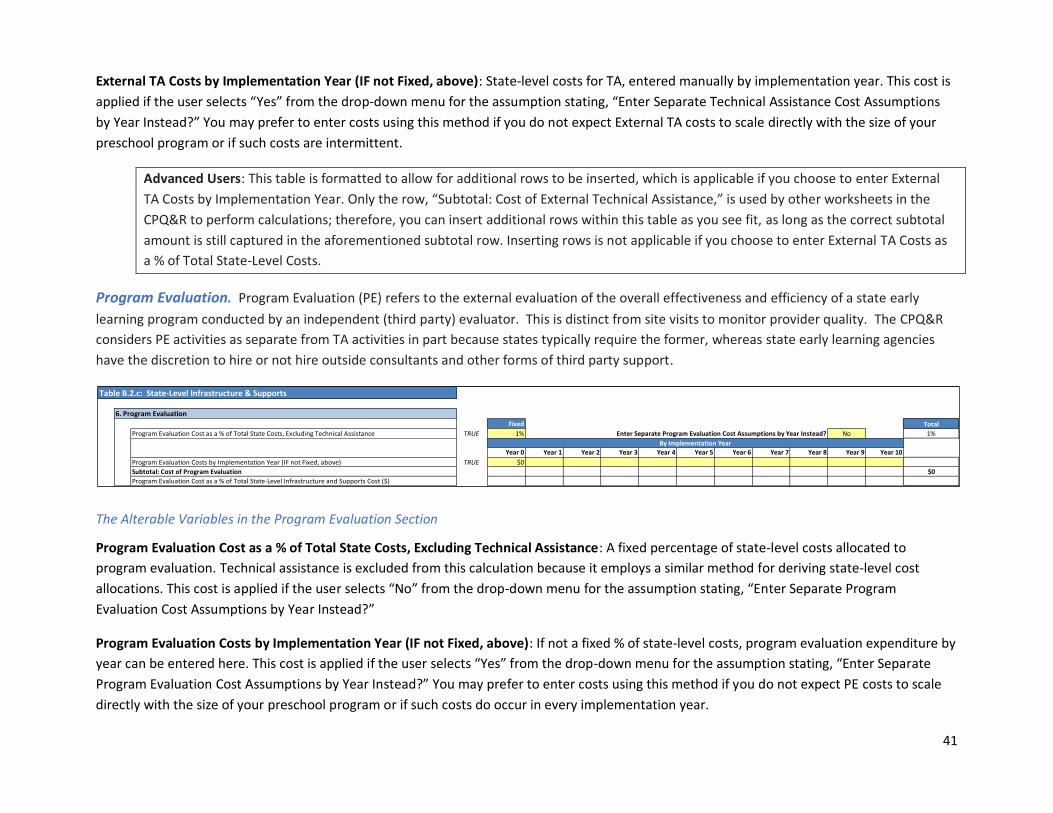
41
External TA Costs by Implementation Year (IF not Fixed, above): State-level costs for TA, entered manually by implementation year. This cost is
applied if the user selects “Yes” from the drop-down menu for the assumption stating, “Enter Separate Technical Assistance Cost Assumptions
by Year Instead?” You may prefer to enter costs using this method if you do not expect External TA costs to scale directly with the size of your
preschool program or if such costs are intermittent.
Advanced Users: This table is formatted to allow for additional rows to be inserted, which is applicable if you choose to enter External
TA Costs by Implementation Year. Only the row, “Subtotal: Cost of External Technical Assistance,” is used by other worksheets in the
CPQ&R to perform calculations; therefore, you can insert additional rows within this table as you see fit, as long as the correct subtotal
amount is still captured in the aforementioned subtotal row. Inserting rows is not applicable if you choose to enter External TA Costs as
a % of Total State-Level Costs.
Program Evaluation. Program Evaluation (PE) refers to the external evaluation of the overall effectiveness and efficiency of a state early
learning program conducted by an independent (third party) evaluator. This is distinct from site visits to monitor provider quality. The CPQ&R
considers PE activities as separate from TA activities in part because states typically require the former, whereas state early learning agencies
have the discretion to hire or not hire outside consultants and other forms of third party support.
The Alterable Variables in the Program Evaluation Section
Program Evaluation Cost as a % of Total State Costs, Excluding Technical Assistance: A fixed percentage of state-level costs allocated to
program evaluation. Technical assistance is excluded from this calculation because it employs a similar method for deriving state-level cost
allocations. This cost is applied if the user selects “No” from the drop-down menu for the assumption stating, “Enter Separate Program
Evaluation Cost Assumptions by Year Instead?”
Program Evaluation Costs by Implementation Year (IF not Fixed, above): If not a fixed % of state-level costs, program evaluation expenditure by
year can be entered here. This cost is applied if the user selects “Yes” from the drop-down menu for the assumption stating, “Enter Separate
Program Evaluation Cost Assumptions by Year Instead?” You may prefer to enter costs using this method if you do not expect PE costs to scale
directly with the size of your preschool program or if such costs do occur in every implementation year.
Table B.2.c: State-Level Infrastructure & Supports
6. Program Evaluation
Fixed Total
Program Evaluation Cost as a % of Total State Costs, Excluding Technical Assistance TRUE 1% Enter Separate Program Evaluation Cost Assumptions by Year Instead? No 1%
By Implementation Year
Year 0 Year 1 Year 2 Year 3 Year 4 Year 5 Year 6 Year 7 Year 8 Year 9 Year 10
Program Evaluation Costs by Implementation Year (IF not Fixed, above) TRUE $0
Subtotal: Cost of Program Evaluation $0
Program Evaluation Cost as a % of Total State-Level Infrastructure and Supports Cost ($)
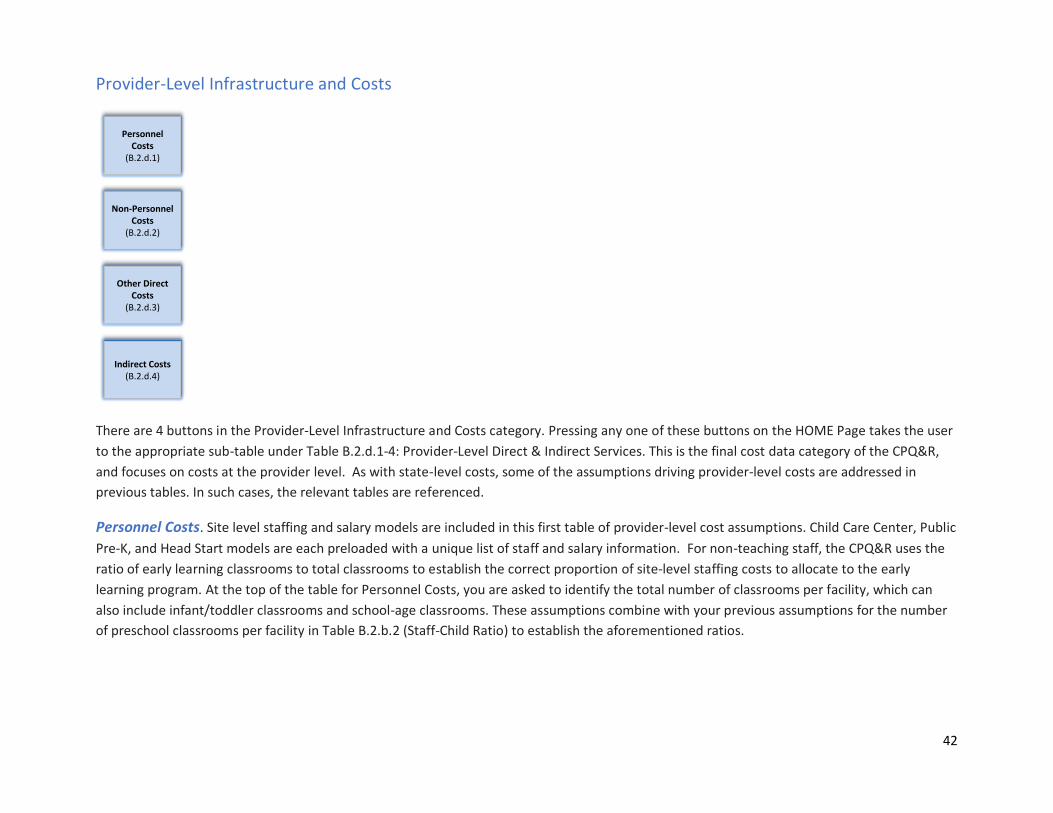
42
Provider-Level Infrastructure and Costs
There are 4 buttons in the Provider-Level Infrastructure and Costs category. Pressing any one of these buttons on the HOME Page takes the user
to the appropriate sub-table under Table B.2.d.1-4: Provider-Level Direct & Indirect Services. This is the final cost data category of the CPQ&R,
and focuses on costs at the provider level. As with state-level costs, some of the assumptions driving provider-level costs are addressed in
previous tables. In such cases, the relevant tables are referenced.
Personnel Costs. Site level staffing and salary models are included in this first table of provider-level cost assumptions. Child Care Center, Public
Pre-K, and Head Start models are each preloaded with a unique list of staff and salary information. For non-teaching staff, the CPQ&R uses the
ratio of early learning classrooms to total classrooms to establish the correct proportion of site-level staffing costs to allocate to the early
learning program. At the top of the table for Personnel Costs, you are asked to identify the total number of classrooms per facility, which can
also include infant/toddler classrooms and school-age classrooms. These assumptions combine with your previous assumptions for the number
of preschool classrooms per facility in Table B.2.b.2 (Staff-Child Ratio) to establish the aforementioned ratios.
Personnel Costs
(B.2.d.1)
Non-PersonnelCosts
(B.2.d.2)
Other Direct Costs
(B.2.d.3)
Indirect Costs(B.2.d.4)
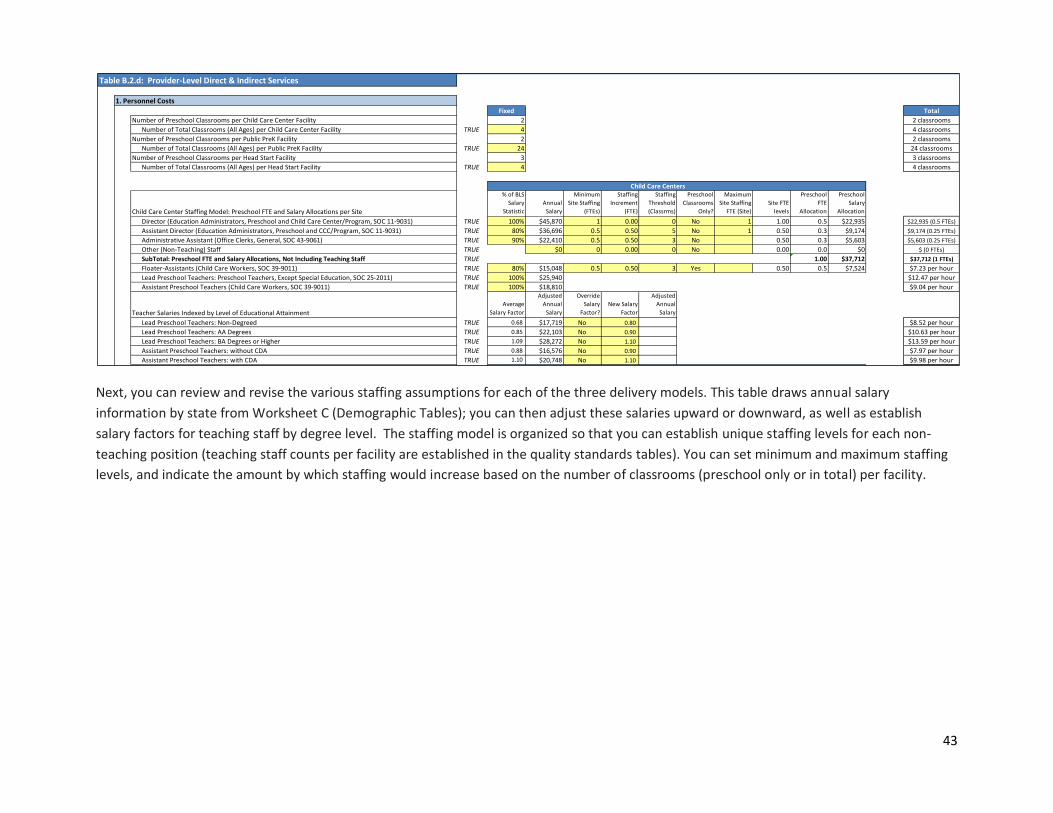
43
Next, you can review and revise the various staffing assumptions for each of the three delivery models. This table draws annual salary
information by state from Worksheet C (Demographic Tables); you can then adjust these salaries upward or downward, as well as establish
salary factors for teaching staff by degree level. The staffing model is organized so that you can establish unique staffing levels for each non-
teaching position (teaching staff counts per facility are established in the quality standards tables). You can set minimum and maximum staffing
levels, and indicate the amount by which staffing would increase based on the number of classrooms (preschool only or in total) per facility.
Table B.2.d: Provider-Level Direct & Indirect Services
1. Personnel CostsFixed Total
Number of Preschool Classrooms per Child Care Center Facility 2 2 classrooms
Number of Total Classrooms (All Ages) per Child Care Center Facility TRUE 4 4 classrooms
Number of Preschool Classrooms per Public PreK Facility 2 2 classrooms
Number of Total Classrooms (All Ages) per Public PreK Facility TRUE 24 24 classrooms
Number of Preschool Classrooms per Head Start Facility 3 3 classrooms
Number of Total Classrooms (All Ages) per Head Start Facility TRUE 4 4 classrooms
Child Care Centers
Child Care Center Staffing Model: Preschool FTE and Salary Allocations per Site
% of BLS
Salary
Statistic
Annual
Salary
Minimum
Site Staffing
(FTEs)
Staffing
Increment
(FTE)
Staffing
Threshold
(Classrms)
Preschool
Classrooms
Only?
Maximum
Site Staffing
FTE (Site)
Site FTE
levels
Preschool
FTE
Allocation
Preschool
Salary
Allocation
Director (Education Administrators, Preschool and Child Care Center/Program, SOC 11-9031) TRUE 100% $45,870 1 0.00 0 No 1 1.00 0.5 $22,935 $22,935 (0.5 FTEs)
Assistant Director (Education Administrators, Preschool and CCC/Program, SOC 11-9031) TRUE 80% $36,696 0.5 0.50 5 No 1 0.50 0.3 $9,174 $9,174 (0.25 FTEs)
Administrative Assistant (Office Clerks, General, SOC 43-9061) TRUE 90% $22,410 0.5 0.50 3 No 0.50 0.3 $5,603 $5,603 (0.25 FTEs)
Other (Non-Teaching) Staff TRUE $0 0 0.00 0 No 0.00 0.0 $0 $ (0 FTEs)
SubTotal: Preschool FTE and Salary Allocations, Not Including Teaching Staff TRUE 1.00 $37,712 $37,712 (1 FTEs)
Floater-Assistants (Child Care Workers, SOC 39-9011) TRUE 80% $15,048 0.5 0.50 3 Yes 0.50 0.5 $7,524 $7.23 per hour
Lead Preschool Teachers: Preschool Teachers, Except Special Education, SOC 25-2011) TRUE 100% $25,940 $12.47 per hour
Assistant Preschool Teachers (Child Care Workers, SOC 39-9011) TRUE 100% $18,810 $9.04 per hour
Teacher Salaries Indexed by Level of Educational Attainment
Average
Salary Factor
Adjusted
Annual
Salary
Override
Salary
Factor?
New Salary
Factor
Adjusted
Annual
Salary
Lead Preschool Teachers: Non-Degreed TRUE 0.68 $17,719 No 0.80 $8.52 per hour
Lead Preschool Teachers: AA Degrees TRUE 0.85 $22,103 No 0.90 $10.63 per hour
Lead Preschool Teachers: BA Degrees or Higher TRUE 1.09 $28,272 No 1.10 $13.59 per hour
Assistant Preschool Teachers: without CDA TRUE 0.88 $16,576 No 0.90 $7.97 per hour
Assistant Preschool Teachers: with CDA TRUE 1.10 $20,748 No 1.10 $9.98 per hour
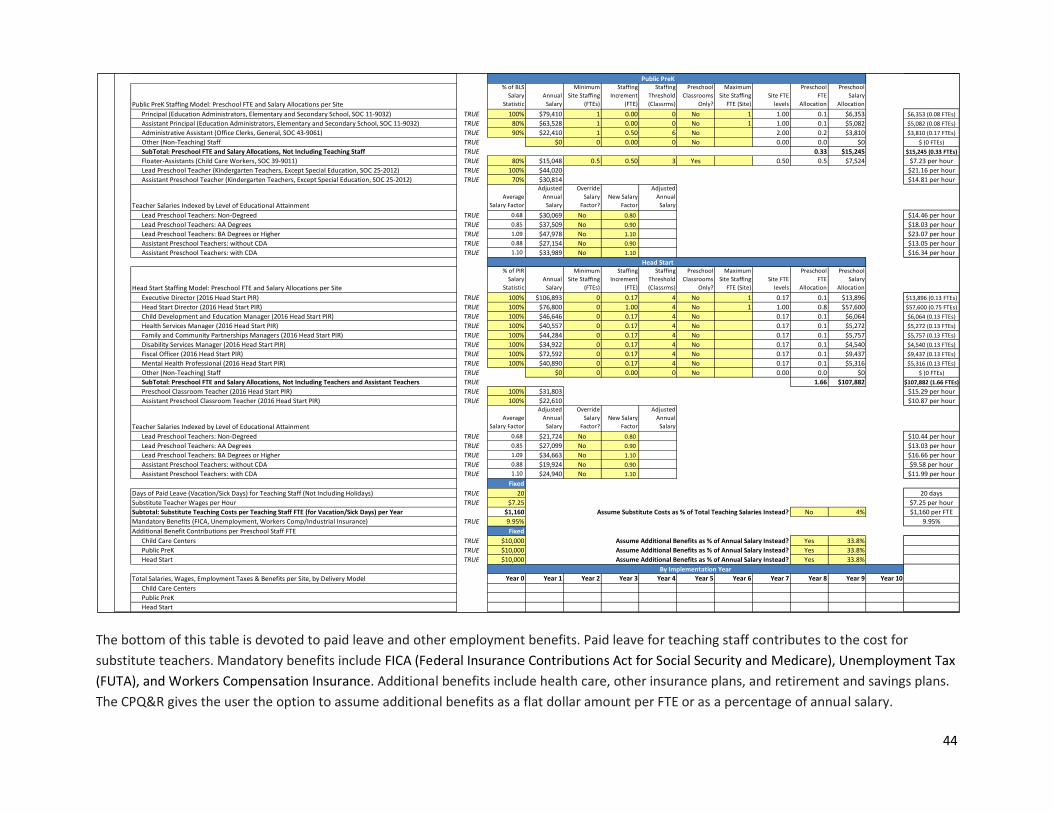
44
The bottom of this table is devoted to paid leave and other employment benefits. Paid leave for teaching staff contributes to the cost for
substitute teachers. Mandatory benefits include FICA (Federal Insurance Contributions Act for Social Security and Medicare), Unemployment Tax
(FUTA), and Workers Compensation Insurance. Additional benefits include health care, other insurance plans, and retirement and savings plans.
The CPQ&R gives the user the option to assume additional benefits as a flat dollar amount per FTE or as a percentage of annual salary.
Public PreK
Public PreK Staffing Model: Preschool FTE and Salary Allocations per Site
% of BLS
Salary
Statistic
Annual
Salary
Minimum
Site Staffing
(FTEs)
Staffing
Increment
(FTE)
Staffing
Threshold
(Classrms)
Preschool
Classrooms
Only?
Maximum
Site Staffing
FTE (Site)
Site FTE
levels
Preschool
FTE
Allocation
Preschool
Salary
Allocation
Principal (Education Administrators, Elementary and Secondary School, SOC 11-9032) TRUE 100% $79,410 1 0.00 0 No 1 1.00 0.1 $6,353 $6,353 (0.08 FTEs)
Assistant Principal (Education Administrators, Elementary and Secondary School, SOC 11-9032) TRUE 80% $63,528 1 0.00 0 No 1 1.00 0.1 $5,082 $5,082 (0.08 FTEs)
Administrative Assistant (Office Clerks, General, SOC 43-9061) TRUE 90% $22,410 1 0.50 6 No 2.00 0.2 $3,810 $3,810 (0.17 FTEs)
Other (Non-Teaching) Staff TRUE $0 0 0.00 0 No 0.00 0.0 $0 $ (0 FTEs)
SubTotal: Preschool FTE and Salary Allocations, Not Including Teaching Staff TRUE 0.33 $15,245 $15,245 (0.33 FTEs)
Floater-Assistants (Child Care Workers, SOC 39-9011) TRUE 80% $15,048 0.5 0.50 3 Yes 0.50 0.5 $7,524 $7.23 per hour
Lead Preschool Teacher (Kindergarten Teachers, Except Special Education, SOC 25-2012) TRUE 100% $44,020 $21.16 per hour
Assistant Preschool Teacher (Kindergarten Teachers, Except Special Education, SOC 25-2012) TRUE 70% $30,814 $14.81 per hour
Teacher Salaries Indexed by Level of Educational Attainment
Average
Salary Factor
Adjusted
Annual
Salary
Override
Salary
Factor?
New Salary
Factor
Adjusted
Annual
Salary
Lead Preschool Teachers: Non-Degreed TRUE 0.68 $30,069 No 0.80 $14.46 per hour
Lead Preschool Teachers: AA Degrees TRUE 0.85 $37,509 No 0.90 $18.03 per hour
Lead Preschool Teachers: BA Degrees or Higher TRUE 1.09 $47,978 No 1.10 $23.07 per hour
Assistant Preschool Teachers: without CDA TRUE 0.88 $27,154 No 0.90 $13.05 per hour
Assistant Preschool Teachers: with CDA TRUE 1.10 $33,989 No 1.10 $16.34 per hour
Head Start
Head Start Staffing Model: Preschool FTE and Salary Allocations per Site
% of PIR
Salary
Statistic
Annual
Salary
Minimum
Site Staffing
(FTEs)
Staffing
Increment
(FTE)
Staffing
Threshold
(Classrms)
Preschool
Classrooms
Only?
Maximum
Site Staffing
FTE (Site)
Site FTE
levels
Preschool
FTE
Allocation
Preschool
Salary
Allocation
Executive Director (2016 Head Start PIR) TRUE 100% $106,893 0 0.17 4 No 1 0.17 0.1 $13,896 $13,896 (0.13 FTEs)
Head Start Director (2016 Head Start PIR) TRUE 100% $76,800 0 1.00 4 No 1 1.00 0.8 $57,600 $57,600 (0.75 FTEs)
Child Development and Education Manager (2016 Head Start PIR) TRUE 100% $46,646 0 0.17 4 No 0.17 0.1 $6,064 $6,064 (0.13 FTEs)
Health Services Manager (2016 Head Start PIR) TRUE 100% $40,557 0 0.17 4 No 0.17 0.1 $5,272 $5,272 (0.13 FTEs)
Family and Community Partnerships Managers (2016 Head Start PIR) TRUE 100% $44,284 0 0.17 4 No 0.17 0.1 $5,757 $5,757 (0.13 FTEs)
Disability Services Manager (2016 Head Start PIR) TRUE 100% $34,922 0 0.17 4 No 0.17 0.1 $4,540 $4,540 (0.13 FTEs)
Fiscal Officer (2016 Head Start PIR) TRUE 100% $72,592 0 0.17 4 No 0.17 0.1 $9,437 $9,437 (0.13 FTEs)
Mental Health Professional (2016 Head Start PIR) TRUE 100% $40,890 0 0.17 4 No 0.17 0.1 $5,316 $5,316 (0.13 FTEs)
Other (Non-Teaching) Staff TRUE $0 0 0.00 0 No 0.00 0.0 $0 $ (0 FTEs)
SubTotal: Preschool FTE and Salary Allocations, Not Including Teachers and Assistant Teachers TRUE 1.66 $107,882 $107,882 (1.66 FTEs)
Preschool Classroom Teacher (2016 Head Start PIR) TRUE 100% $31,803 $15.29 per hour
Assistant Preschool Classroom Teacher (2016 Head Start PIR) TRUE 100% $22,610 $10.87 per hour
Teacher Salaries Indexed by Level of Educational Attainment
Average
Salary Factor
Adjusted
Annual
Salary
Override
Salary
Factor?
New Salary
Factor
Adjusted
Annual
Salary
Lead Preschool Teachers: Non-Degreed TRUE 0.68 $21,724 No 0.80 $10.44 per hour
Lead Preschool Teachers: AA Degrees TRUE 0.85 $27,099 No 0.90 $13.03 per hour
Lead Preschool Teachers: BA Degrees or Higher TRUE 1.09 $34,663 No 1.10 $16.66 per hour
Assistant Preschool Teachers: without CDA TRUE 0.88 $19,924 No 0.90 $9.58 per hour
Assistant Preschool Teachers: with CDA TRUE 1.10 $24,940 No 1.10 $11.99 per hour
Fixed
Days of Paid Leave (Vacation/Sick Days) for Teaching Staff (Not Including Holidays) TRUE 20 20 days
Substitute Teacher Wages per Hour TRUE $7.25 $7.25 per hour
Subtotal: Substitute Teaching Costs per Teaching Staff FTE (for Vacation/Sick Days) per Year $1,160 Assume Substitute Costs as % of Total Teaching Salaries Instead? No 4% $1,160 per FTE
Mandatory Benefits (FICA, Unemployment, Workers Comp/Industrial Insurance) TRUE 9.95% 9.95%
Additional Benefit Contributions per Preschool Staff FTE Fixed
Child Care Centers TRUE $10,000 Assume Additional Benefits as % of Annual Salary Instead? Yes 33.8%
Public PreK TRUE $10,000 Assume Additional Benefits as % of Annual Salary Instead? Yes 33.8%
Head Start TRUE $10,000 Assume Additional Benefits as % of Annual Salary Instead? Yes 33.8%
By Implementation Year
Total Salaries, Wages, Employment Taxes & Benefits per Site, by Delivery Model Year 0 Year 1 Year 2 Year 3 Year 4 Year 5 Year 6 Year 7 Year 8 Year 9 Year 10
Child Care Centers
Public PreK
Head Start

45
The Alterable Variables in the Personnel Costs Section
Number of Total Classrooms (All Ages) per [Type of] Facility: The number of classrooms including preschool, infant/toddler, kindergarten, and
grade school classrooms. Specifying the number of classrooms across all ages served, by delivery model, allows the CPQ&R to allocate a portion
of a typical facility’s shared personnel (and site level) costs to its preschool program. The ratio of preschool classrooms to total classrooms
establishes the allocation; the smaller the ratio the smaller the allocation of shared resources to the early learning program.
Staffing Model: Preschool FTE and Salary Allocations per Site: A separate staffing model is provided for each delivery model: Child Care Centers,
Public Pre-K, and Head Start. Lead teacher and assistant teacher staffing levels are established as part of the NIEER Quality Standards
Benchmarks. For other staff positions, the staffing model table allows you to establish site-level Full-Time Equivalent (FTE) counts allocated to
early learning. You can specify Minimum Site Staffing (FTEs) that are independent of the number of total classrooms, and Maximum Site
Staffing (FTEs) which cannot be exceeded regardless of the number of classrooms. In addition, you can enter a Staffing Threshold (Classrooms)
that dictates the number of classrooms required to trigger an increase in staffing, and a Staffing Increment (FTE) that is applied each time a
multiple of the staffing threshold is met. Finally, you can specify whether the staffing threshold applies to Preschool Classrooms Only, or to the
total classrooms in a facility. If you select “Yes” in the drop-down menu under Preschool Classrooms Only, then 100% of the staffing cost for that
position will be applied to the preschool program.
The preschool salary allocation in the staffing model is based on the preschool FTE allocation with the annual salary per FTE. The staffing model
provides salary data for each of the positions identified in the default model. Data for Child Care Centers and Public Pre-K is from the Bureau of
Labor Statistics (BLS); data for Head Start is from the U.S. Department of Health & Human Services’ Office of Head Start. The specific data
reference for each position is listed next to the position name. You can adjust these salaries up or down using the % of BLS Salary Statistic for
Child Care Centers and Public PreK, and the % of PIR Salary Statistic for Head Start.
Advanced Users: The staffing model table is formatted to allow users to easily insert rows for additional non-teaching staff positions,
without having to modify any of the other CPQ&R worksheets. You can add rows above “Other (Non-Teaching) Staff,” so long as the row,
“Subtotal: Preschool FTE and Salary Allocations, Not Including Teaching Staff,” correctly captures the intended FTE counts and salary
allocations. This design consideration allows the CPQ&R to easily accommodate the disparate staffing models that may be encountered
across various state settings.
Teacher Salaries Indexed by Level of Educational Attainment: In addition to establishing a state average salary for teachers and assistant
teachers (by applying a % to the state average from BLS or Head Start PIR data), users may take the further step of indexing this salary by degree
level. As a default, the CPQ&R uses indices based on Head Start salary data by degree level in your state (or if unavailable the national average
Head Start ratios). You can elect to override these indices, by entering “Yes” under Override Salary Factor, and enter your own assumption for

46
salary factors by degree level under New Salary Factor. If you choose to override the
salary factor, then you will see the adjusted annual salary reported to the right of
your new factor (replacing the previously reported adjusted annual salary reported
to the left).
Days of Paid Leave (Vacation/Sick Days) for Teaching Staff (Not Including
Holidays): The number of days for which substitute teachers will be required, using
an assumption of 8-hour workdays. Alternatively, you can assume substitute
teacher costs as a percentage of total teaching salaries, by entering “Yes” under the drop-down menu for the assumption, “Assume Substitute
Costs as a % of Total Teaching Salaries Instead?”, and entering an assumed percentage rate.
Mandatory Benefits (FICA, Unemployment, Workers Comp/Industrial Insurance): Benefits that employers are legally required to provide to
their employees. Mandatory benefits listed include FICA (Federal Insurance Contributions Act for Social Security and Medicare), Unemployment
Tax (FUTA), and Workers Compensation Insurance.
Additional Benefit Contributions per Preschool Staff FTE: Benefits offered to employees that are not legally required. Examples of additional
benefits listed include insurance plans and retirement and savings plans. You can enter the cost of additional benefits as a fixed dollar value per
FTE; alternatively, you can assume the cost as a percentage of annually salary by entering “Yes” under the drop-down menu for the assumption,
“Assume Additional Benefits as a % of Annual Salary Instead?” and entering an assumed percentage rate.
Advanced Users: For structural reasons, the cost of additional benefits may vary by delivery model. For example, in a state with a
publicly funded pension program, public school employees may not have a need for a separate retirement and savings plan, and the cost
of their pension plan may not fall upon the individual or the Public Pre-K site. In contrast, Child Care Centers may need to establish
separate retirement plans for their staff to make contributions (with employer matching). In this example, if the cost of a retirement and
savings plan for a Child Care Center is 11.1% of salaries, then the additional benefits rate assumed for Child Care Centers would be that
much higher than for Public Pre-K.
Non-Personnel Costs. The second table of provider-level cost assumptions addresses per-child operating costs, per-classroom early learning
occupancy costs, and site-level operating costs. Occupancy costs are driven by the assumed square footage assumed per early learning
classroom (and including an allocation for shared space). Site-level costs are allocated based on the proportion of early learning classrooms to
total classrooms. You have the option to assume lump sum amounts instead of breaking out cost assumptions by line item, which is useful in
You can use the Lump Sum feature when you want
occupancy and/or site-level costs to vary by Delivery
Model within a single scenario. In such situations, you
may find the detailed line items useful for generating
estimates for your lump sums (i.e., use that section of
the CPQ&R as a “mini-calculator”).
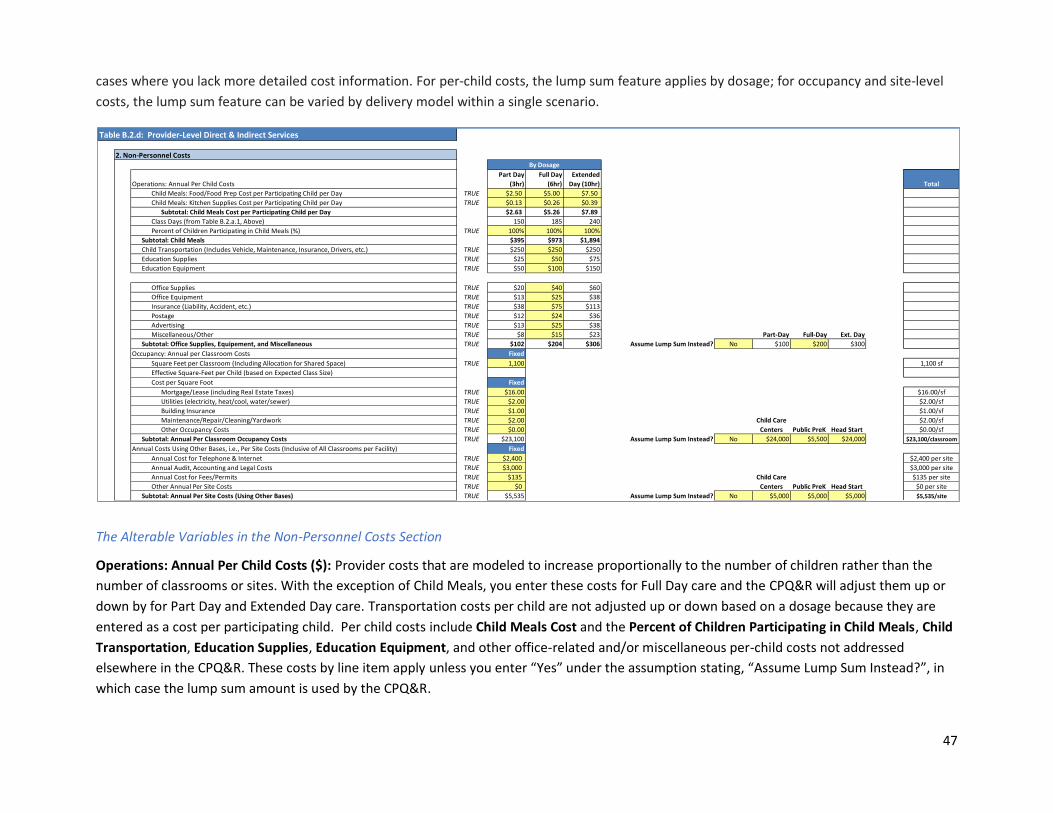
47
cases where you lack more detailed cost information. For per-child costs, the lump sum feature applies by dosage; for occupancy and site-level
costs, the lump sum feature can be varied by delivery model within a single scenario.
The Alterable Variables in the Non-Personnel Costs Section
Operations: Annual Per Child Costs ($): Provider costs that are modeled to increase proportionally to the number of children rather than the
number of classrooms or sites. With the exception of Child Meals, you enter these costs for Full Day care and the CPQ&R will adjust them up or
down by for Part Day and Extended Day care. Transportation costs per child are not adjusted up or down based on a dosage because they are
entered as a cost per participating child. Per child costs include Child Meals Cost and the Percent of Children Participating in Child Meals, Child
Transportation, Education Supplies, Education Equipment, and other office-related and/or miscellaneous per-child costs not addressed
elsewhere in the CPQ&R. These costs by line item apply unless you enter “Yes” under the assumption stating, “Assume Lump Sum Instead?”, in
which case the lump sum amount is used by the CPQ&R.
Table B.2.d: Provider-Level Direct & Indirect Services
2. Non-Personnel CostsBy Dosage
Operations: Annual Per Child Costs
Part Day
(3hr)
Full Day
(6hr)
Extended
Day (10hr) Total
Child Meals: Food/Food Prep Cost per Participating Child per Day TRUE $2.50 $5.00 $7.50
Child Meals: Kitchen Supplies Cost per Participating Child per Day TRUE $0.13 $0.26 $0.39
Subtotal: Child Meals Cost per Participating Child per Day $2.63 $5.26 $7.89
Class Days (from Table B.2.a.1, Above) 150 185 240
Percent of Children Participating in Child Meals (%) TRUE 100% 100% 100%
Subtotal: Child Meals $395 $973 $1,894
Child Transportation (Includes Vehicle, Maintenance, Insurance, Drivers, etc.) TRUE $250 $250 $250
Education Supplies TRUE $25 $50 $75
Education Equipment TRUE $50 $100 $150
Office Supplies TRUE $20 $40 $60
Office Equipment TRUE $13 $25 $38
Insurance (Liability, Accident, etc.) TRUE $38 $75 $113
Postage TRUE $12 $24 $36
Advertising TRUE $13 $25 $38
Miscellaneous/Other TRUE $8 $15 $23 Part-Day Full-Day Ext. Day
Subtotal: Office Supplies, Equipement, and Miscellaneous TRUE $102 $204 $306 Assume Lump Sum Instead? No $100 $200 $300
Occupancy: Annual per Classroom Costs Fixed
Square Feet per Classroom (Including Allocation for Shared Space) TRUE 1,100 1,100 sf
Effective Square-Feet per Child (based on Expected Class Size)
Cost per Square Foot Fixed
Mortgage/Lease (including Real Estate Taxes) TRUE $16.00 $16.00/sf
Utilities (electricity, heat/cool, water/sewer) TRUE $2.00 $2.00/sf
Building Insurance TRUE $1.00 $1.00/sf
Maintenance/Repair/Cleaning/Yardwork TRUE $2.00 Child Care $2.00/sf
Other Occupancy Costs TRUE $0.00 Centers Public PreK Head Start $0.00/sf
Subtotal: Annual Per Classroom Occupancy Costs TRUE $23,100 Assume Lump Sum Instead? No $24,000 $5,500 $24,000 $23,100/classroom
Annual Costs Using Other Bases, i.e., Per Site Costs (Inclusive of All Classrooms per Facility) Fixed
Annual Cost for Telephone & Internet TRUE $2,400 $2,400 per site
Annual Audit, Accounting and Legal Costs TRUE $3,000 $3,000 per site
Annual Cost for Fees/Permits TRUE $135 Child Care $135 per site
Other Annual Per Site Costs TRUE $0 Centers Public PreK Head Start $0 per site
Subtotal: Annual Per Site Costs (Using Other Bases) TRUE $5,535 Assume Lump Sum Instead? No $5,000 $5,000 $5,000 $5,535/site
48
Advanced Users: The CPQ&R assumes 50% of certain costs per child in Full Day care to generate estimates for Part Day care, and
similarly, assumes 150% of Full Day care costs for Extended Day. You can change these ratios by adjusting the formulas under Part Day
and Extended Day care in this table, without having to make changes to other worksheets in the CPQ&R.
Occupancy: Annual per Classroom Costs: Provider costs that are modeled to increase proportionally to the number of early learning classrooms.
State preschool standards often require a minimum square footage per child; this square footage multiplied by the maximum class size (quality
standard) can provide you with the Square Feet per Classroom (including shared space). The square footage is by the cost per square foot for
Mortgage/Lease, Utilities, Building Insurance, Maintenance, and Other Occupancy Costs. These costs by line item apply to all delivery models
unless you enter “Yes” under the assumption stating, “Assume Lump Sum Instead?”, in which case the lump sum amount you enter by delivery
model is used by the CPQ&R.
Annual Costs Using Other Bases, i.e., Per Site Costs ($): Provider costs that do not fit under a per child or per classroom classification and are
best expressed on a site-wide basis. You should enter the total site-level cost for each line item, not just the amounted allocated to early
learning, and the CPQ&R will allocate the correct portion of this total based on the ratio of early learning classrooms to total classrooms (for
each delivery model). These unit costs apply to all delivery models unless you enter “Yes” under the assumption stating, “Assume Lump Sum
Instead?”, in which case the lump sum amount you enter by delivery model is used by the CPQ&R.
You can obtain information on average Lease rates
per square foot from your current preschool
providers, or by contacting a commercial real estate
company contact in your state. You may find that
public schools are not subject to the same mortgage
or lease costs as sites occupied by Child Care Center
or Head Start providers, if those facilities are publicly
financed construction projects, in which case you
may want to use the Lump Sum feature for
occupancy costs.
49
Advanced Users: This table is formatted to allow for additional rows to be inserted at several places. Rows can be inserted immediately
above the subtotal row for “Child Meals,” between the rows the “Education Supplies” and “Education Equipment,” immediately above
the subtotal row for “Office Supplies, Equipment, and Miscellaneous,” immediately above the subtotal row for “Annual Per Classroom
Occupancy Costs,” or immediately above the subtotal row for “Annual Per Site Costs (Using other Bases).” In each case, if you follow
these instructions correctly and check to ensure that each subtotal row is correctly capturing these additional rows, then no other
changes are required to the CPQ&R.
Other Direct Costs. Other provider-level direct costs include the costs for screening/referral and support services entered under the NIEER
Quality Standards Benchmarks, annual child assessment costs, and the annualized cost for classroom materials and furnishings that typically last
for greater than one year. The top of this table is devoted to screening/referral and support services, the assumptions for which are entered
under the NIEER Preschool Quality Standards Benchmarks. The Cost per item shown in this section of the table represents a weighted average
cost based on the cost per participating child and the percentage of children in a classroom who are expected to participate; that weighted
average is then multiplied by the expected class size to give a total cost per classroom.
The next section of this table is preloaded with a list of classroom items related to the Environment Rating Scale (ERS); in some cases, the
number of items required is based on the expected class size, and in other cases you can input the desired number of items. The cost for these
items is then allocated over an assumed useful life. The CPQ&R default assumption is five years, (i.e., the purchase price is spread evenly over
five years). You instead choose to enter an annual lump sum amount by delivery model, if you lack more detailed cost information specific to
your program or if you want to vary the cost of ERS-related items by delivery model within a single scenario.
Advanced Users: You can overwrite the formula references (white-shaded cells) for the number of items for child assessments, chairs,
and dramatic play materials in this table, if you choose, without compromising other areas of the CPQ&R. You should not do so for the
number of items for screening/referral and support services without risking an error in the CPQ&R calculations, unless you also check to
ensuring your changes are consistent with your assumptions in the table devoted to that quality standard under NIEER Preschool Quality
Standards Benchmarks.
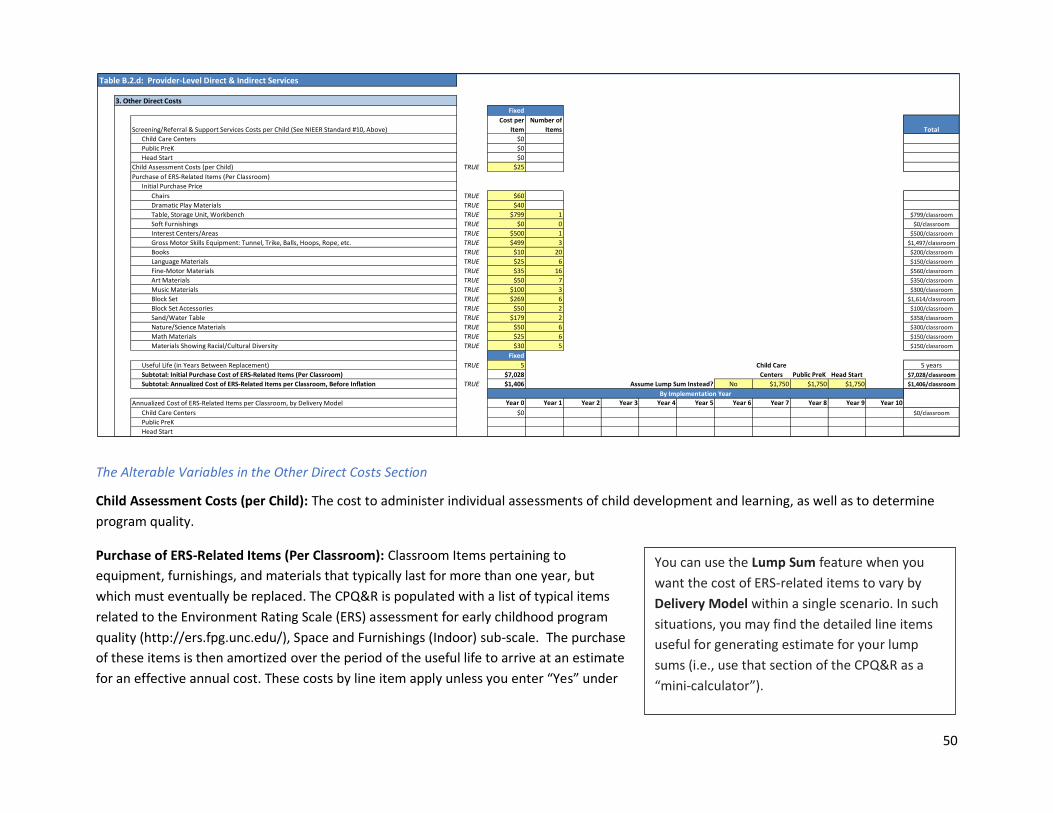
50
The Alterable Variables in the Other Direct Costs Section
Child Assessment Costs (per Child): The cost to administer individual assessments of child development and learning, as well as to determine
program quality.
Purchase of ERS-Related Items (Per Classroom): Classroom Items pertaining to
equipment, furnishings, and materials that typically last for more than one year, but
which must eventually be replaced. The CPQ&R is populated with a list of typical items
related to the Environment Rating Scale (ERS) assessment for early childhood program
quality (http://ers.fpg.unc.edu/), Space and Furnishings (Indoor) sub-scale. The purchase
of these items is then amortized over the period of the useful life to arrive at an estimate
for an effective annual cost. These costs by line item apply unless you enter “Yes” under
Table B.2.d: Provider-Level Direct & Indirect Services
3. Other Direct CostsFixed
Screening/Referral & Support Services Costs per Child (See NIEER Standard #10, Above)
Cost per
Item
Number of
Items Total
Child Care Centers $0
Public PreK $0
Head Start $0
Child Assessment Costs (per Child) TRUE $25
Purchase of ERS-Related Items (Per Classroom)
Initial Purchase Price
Chairs TRUE $60
Dramatic Play Materials TRUE $40
Table, Storage Unit, Workbench TRUE $799 1 $799/classroom
Soft Furnishings TRUE $0 0 $0/classroom
Interest Centers/Areas TRUE $500 1 $500/classroom
Gross Motor Skills Equipment: Tunnel, Trike, Balls, Hoops, Rope, etc. TRUE $499 3 $1,497/classroom
Books TRUE $10 20 $200/classroom
Language Materials TRUE $25 6 $150/classroom
Fine-Motor Materials TRUE $35 16 $560/classroom
Art Materials TRUE $50 7 $350/classroom
Music Materials TRUE $100 3 $300/classroom
Block Set TRUE $269 6 $1,614/classroom
Block Set Accessories TRUE $50 2 $100/classroom
Sand/Water Table TRUE $179 2 $358/classroom
Nature/Science Materials TRUE $50 6 $300/classroom
Math Materials TRUE $25 6 $150/classroom
Materials Showing Racial/Cultural Diversity TRUE $30 5 $150/classroom
Fixed
Useful Life (in Years Between Replacement) TRUE 5 Child Care 5 years
Subtotal: Initial Purchase Cost of ERS-Related Items (Per Classroom) $7,028 Centers Public PreK Head Start $7,028/classroom
Subtotal: Annualized Cost of ERS-Related Items per Classroom, Before Inflation TRUE $1,406 Assume Lump Sum Instead? No $1,750 $1,750 $1,750 $1,406/classroom
By Implementation Year
Annualized Cost of ERS-Related Items per Classroom, by Delivery Model Year 0 Year 1 Year 2 Year 3 Year 4 Year 5 Year 6 Year 7 Year 8 Year 9 Year 10
Child Care Centers $0 $0/classroom
Public PreK
Head Start
You can use the Lump Sum feature when you
want the cost of ERS-related items to vary by
Delivery Model within a single scenario. In such
situations, you may find the detailed line items
useful for generating estimate for your lump
sums (i.e., use that section of the CPQ&R as a
“mini-calculator”).
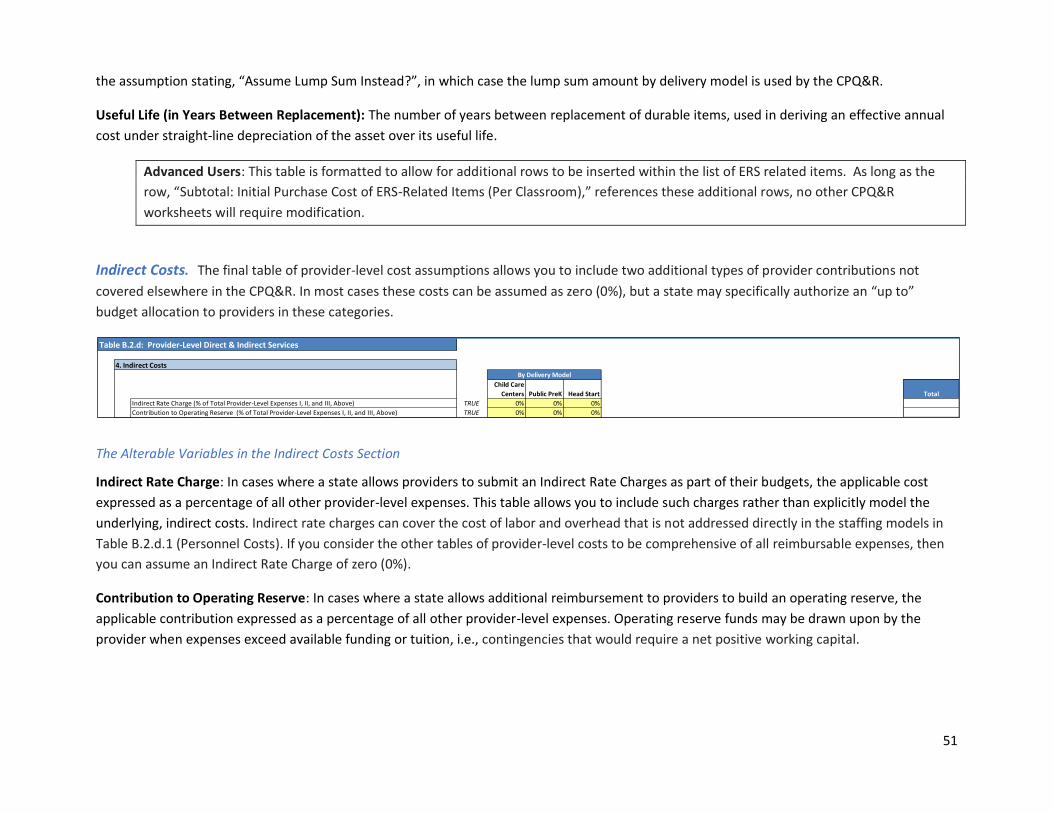
51
the assumption stating, “Assume Lump Sum Instead?”, in which case the lump sum amount by delivery model is used by the CPQ&R.
Useful Life (in Years Between Replacement): The number of years between replacement of durable items, used in deriving an effective annual
cost under straight-line depreciation of the asset over its useful life.
Advanced Users: This table is formatted to allow for additional rows to be inserted within the list of ERS related items. As long as the
row, “Subtotal: Initial Purchase Cost of ERS-Related Items (Per Classroom),” references these additional rows, no other CPQ&R
worksheets will require modification.
Indirect Costs. The final table of provider-level cost assumptions allows you to include two additional types of provider contributions not
covered elsewhere in the CPQ&R. In most cases these costs can be assumed as zero (0%), but a state may specifically authorize an “up to”
budget allocation to providers in these categories.
The Alterable Variables in the Indirect Costs Section
Indirect Rate Charge: In cases where a state allows providers to submit an Indirect Rate Charges as part of their budgets, the applicable cost
expressed as a percentage of all other provider-level expenses. This table allows you to include such charges rather than explicitly model the
underlying, indirect costs. Indirect rate charges can cover the cost of labor and overhead that is not addressed directly in the staffing models in
Table B.2.d.1 (Personnel Costs). If you consider the other tables of provider-level costs to be comprehensive of all reimbursable expenses, then
you can assume an Indirect Rate Charge of zero (0%).
Contribution to Operating Reserve: In cases where a state allows additional reimbursement to providers to build an operating reserve, the
applicable contribution expressed as a percentage of all other provider-level expenses. Operating reserve funds may be drawn upon by the
provider when expenses exceed available funding or tuition, i.e., contingencies that would require a net positive working capital.
Table B.2.d: Provider-Level Direct & Indirect Services
4. Indirect CostsBy Delivery Model
Child Care
Centers Public PreK Head Start Total
Indirect Rate Charge (% of Total Provider-Level Expenses I, II, and III, Above) TRUE 0% 0% 0%
Contribution to Operating Reserve (% of Total Provider-Level Expenses I, II, and III, Above) TRUE 0% 0% 0%
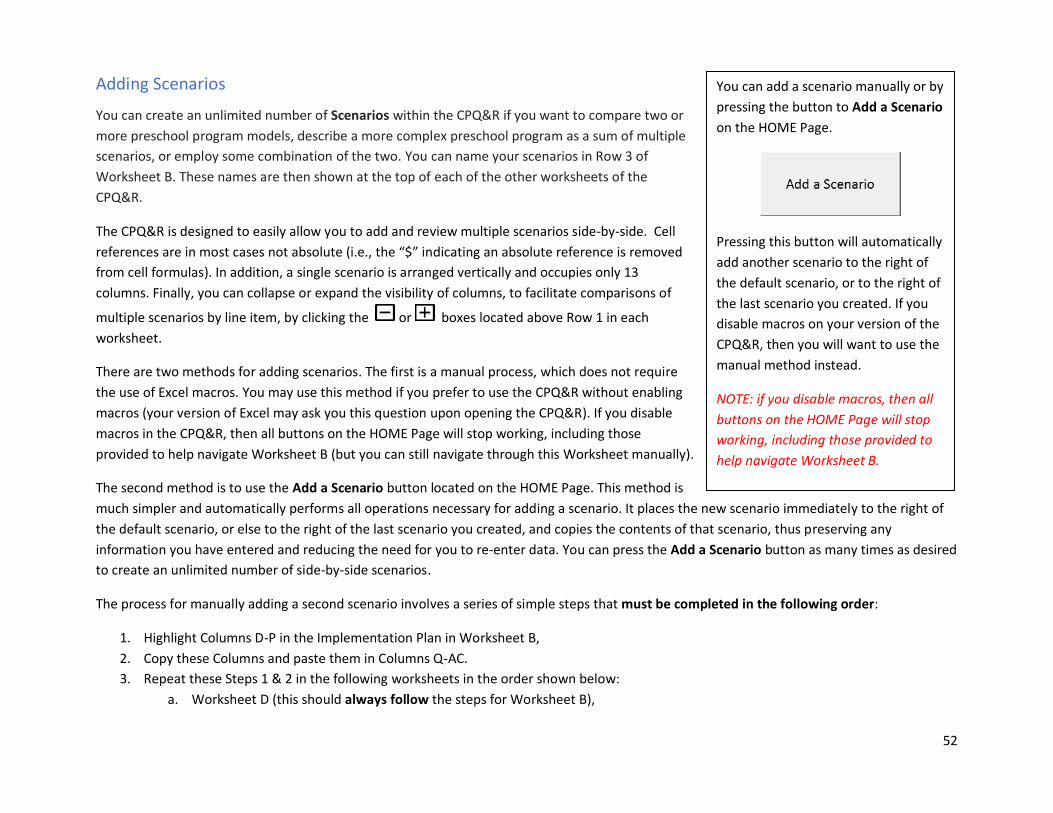
52
Adding Scenarios
You can create an unlimited number of Scenarios within the CPQ&R if you want to compare two or
more preschool program models, describe a more complex preschool program as a sum of multiple
scenarios, or employ some combination of the two. You can name your scenarios in Row 3 of
Worksheet B. These names are then shown at the top of each of the other worksheets of the
CPQ&R.
The CPQ&R is designed to easily allow you to add and review multiple scenarios side-by-side. Cell
references are in most cases not absolute (i.e., the “$” indicating an absolute reference is removed
from cell formulas). In addition, a single scenario is arranged vertically and occupies only 13
columns. Finally, you can collapse or expand the visibility of columns, to facilitate comparisons of
multiple scenarios by line item, by clicking the or boxes located above Row 1 in each
worksheet.
There are two methods for adding scenarios. The first is a manual process, which does not require
the use of Excel macros. You may use this method if you prefer to use the CPQ&R without enabling
macros (your version of Excel may ask you this question upon opening the CPQ&R). If you disable
macros in the CPQ&R, then all buttons on the HOME Page will stop working, including those
provided to help navigate Worksheet B (but you can still navigate through this Worksheet manually).
The second method is to use the Add a Scenario button located on the HOME Page. This method is
much simpler and automatically performs all operations necessary for adding a scenario. It places the new scenario immediately to the right of
the default scenario, or else to the right of the last scenario you created, and copies the contents of that scenario, thus preserving any
information you have entered and reducing the need for you to re-enter data. You can press the Add a Scenario button as many times as desired
to create an unlimited number of side-by-side scenarios.
The process for manually adding a second scenario involves a series of simple steps that must be completed in the following order:
1. Highlight Columns D-P in the Implementation Plan in Worksheet B,
2. Copy these Columns and paste them in Columns Q-AC.
3. Repeat these Steps 1 & 2 in the following worksheets in the order shown below:
a. Worksheet D (this should always follow the steps for Worksheet B),
You can add a scenario manually or by
pressing the button to Add a Scenario
on the HOME Page.
Pressing this button will automatically
add another scenario to the right of
the default scenario, or to the right of
the last scenario you created. If you
disable macros on your version of the
CPQ&R, then you will want to use the
manual method instead.
NOTE: if you disable macros, then all
buttons on the HOME Page will stop
working, including those provided to
help navigate Worksheet B.
53
b. Worksheet E,
c. Worksheet F,
d. Worksheet A.
When performed correctly, the new set of Annual Schedule Tables in Worksheet D is linked to the corresponding new columns in the
Implementation Plan in Worksheet B. This information then feeds the corresponding new scenarios copied and pasted in Worksheets E & F. The
modeling output for the new scenario is summarized in Worksheet A. You do not need to perform any copy-and-paste steps on the HOME Page
or on the Demographic Tables in Worksheet C.
The manual process described above can be repeated as many times as desired to create an unlimited number of side-by-side scenarios. For
example, a third scenario would occupy Columns AD-AP. You can also add more than one scenario simultaneously by pasting several adjacent
scenarios in Worksheet B, then repeating this operation in Worksheet D, etc.
If the user deviates from this order described above, error values may result. The occurrence of error values is a sign that you should delete the
new columns and start again. In addition, you should take care to ensure the same columns are copied and pasted in each worksheet; if you
copy different column ranges, then the CPQ&R formulas may not reference the correct cells between worksheets. Finally, it is important that
you copy the entire column range listed above (in the first scenario this is Columns D-P). Column D, for example, contains the logic required for
the “Assumptions Complete?” feature in Worksheet A and the green/red indicators on the HOME Page.
Before copying additional scenarios to the right, it is recommended that users first complete their review and editing of input assumptions in the
first scenario. This lessens the need to manually re-enter assumptions in each scenario that is added.
The CPQ&R employs “grouped” columns and rows to facilitate viewing and navigation within the Excel worksheets. After creating additional
scenarios, the you can hide columns so that only the “Total” columns are showing. This can help your to easily compare a large number of
scenarios side by side. Grouping is an Excel utility that allows the user to hide rows or columns by clicking on the boxes shown above certain
columns or to the left of certain rows on a worksheet. Upon clicking this box, the symbol will change to and the grouped columns or rows
will be hidden. Clicking the symbol again will unhide the rows or columns.
Creating Multiple-Scenario Systems. The term System applies to situations wherein the user wants to vary assumptions between subsets of
their overall preschool slot plan in a manner that is not accommodated by the structure of a single scenario. Essentially, a System is a
combination of two or more Scenarios. For example, you may want to model some of your preschool slots as rural and some as urban, and use
different unit cost assumptions for each. Row 4 of Worksheet B provides space for you to enter a common system name for each of these two
scenarios; the sum of these two scenarios would represent the total volumes and costs within your preschool program.

54
A single system can contain any number of scenarios. Furthermore, you can model two or more systems side-by-side, each comprised of
multiple scenarios. This design consideration gives the CPQ&R a high degree of flexibility in meeting the diverse needs among state preschool
programs.
If you create a system comprised of multiple scenarios, then there are a few tables within the Implementation Plan (Worksheet B) to consider so
that you avoid double-counting:
• Table B.2.a.2 (Available Funding Streams), if you are using lump sum funding (i.e., “Statewide”),
• Table B.2.b.6 (Professional Learning and Support), under “Other State-Level Implementation Supports for Professional Learning,”
• Table B.2.b.7 (Early Learning & Development Standards), under “Initial ELDS Development” and “Technical Assistance,”
• Table B.2.b.8 (Continuous Quality Improvement System), under “Upfront Development Costs,” “Assessment Tools…” and “Technical Assistance,”
• Table B.2.b.9 (Curriculum), under “Upfront Development Costs” and “Technical Assistance,”
• Table B.2.c.4 (Additional System Supports),
• Table B.2.c.5 (External Technical Assistance), if you are entering dollar amounts by implementation year,
• Table B.2.c.6 (Program Evaluation), if you are entering dollar amounts by implementation year.
In each of these tables, you are asked to enter an absolute dollar amount by implementation year. You could enter the total dollars for the
system in the first scenario and leave the corresponding tables in the remaining scenarios blank. Alternatively, you could pro-rate the dollars
across the different scenarios in a manner that sums to the correct total for the system. In either case, you should review the input assumptions
when creating a multiple-scenario system to ensure there is no double-counting of costs or funding.
The CPQ&R does not sum scenarios for multiple-scenario systems. You must complete this operation manually, but it is not difficult. The blank
worksheet included at the end of the CPQ&R provides space for you to perform such calculations without having to alter the other worksheets.
Although all of Worksheets A-F are unprotected (and can be edited in any way), the CPQ&R workbook itself is protected so that additional
worksheets cannot be inserted or deleted. This protection was necessary for the maintenance of the Cover Sheet, which includes information
about CEELO and NIEER and its partners, and the HOME Page, which requires macros for its operation.