Embed Size (px)
Citation preview

DISSERTATION
Titel der Dissertation
Investigating the specificity of human rhinoviruses 2A proteinases
angestrebter akademischer Grad
Doktor/in der Naturwissenschaften (Dr. rer.nat.) Verfasserin / Verfasser: Carla Sousa
Matrikel-Nummer: 0548709
Dissertationsgebiet (lt. Studienblatt):
Molekulare Biologie
Betreuerin / Betreuer: Univ.-Prof. Dr. Tim Skern
Wien, am 19. März 2008

Acknowledgements
I want to thank my supervisor Tim Skern for all the support, for being always available
and for keeping me motivated during these last three years.
I thank to Klarissa Schröttner and Regina Cencic for helping me during the first
months of my work. To Tina Kurz, David Neubauer and Jutta Steinberger for the great help in
translating everything from German to English (work related or not) and for the patience to
listen to all my complaining… To Katharina Krautgasser and Angelika Mühlebner for being
there every time I needed a friend. To Sina Mayer, Niki Stefan, Susanne Kretschmer, Steffi
Schertler Junping Zhu and Katja Trompf for the good times spent in the room 3.121. I also
want to say thank you to the Seipelt and Blaas labs, especially to Andrea Triendl for all the
help in cell culture and for taking time to listen to me when I was in a “not so happy mood”.
Also to Irene Gösler for the help with the Sf9 cells. I want to mention Nicole Föger for the
nice talks we had together. I want to thank all of them for the great atmosphere at work and
for the friendship. These were three great years of my life.
I want to thank to Ana Tomás and Helena Castro for all the support during my time in
Portugal.
I thank to my mother and my sister Marina for supporting all my decisions even when
it implied to move to a place 3000 km away and barely see them.
Finally I want to thank to Guillaume Blin for believing in me and for keeping me so
motivated during the writing of this thesis.

Summary
The picornavirus family is composed of small, non-enveloped viruses which contain a
single stranded RNA genome of positive polarity. The genome is translated into one large
polyprotein which is then processed into the mature viral proteins by virally encoded
proteinases. In human rhinoviruses and enteroviruses, two chymotrypsin-like proteinases,
3Cpro and 2Apro carry out these cleavages. 2Apro executes the first cleavage on the
polyprotein, cleaving itself from the VP1 capsid protein. 2Apro also cleaves several cellular
proteins, amongst which is the eukaryotic initiation factor (eIF) 4G. eIF4G is a scaffolding
protein that brings together the cellular capped mRNA and the ribosomes. Thus, the
cleavage of this factor leads to the shut off of the cellular translation, as the mRNA is no
longer able to reach the ribosome. The viruses can use this reduced translation machinery
as they do not need the cap-dependent initiation mechanism to bind the ribosome and
synthesize their proteins.
There are more than 100 serotypes of rhinoviruses divided in two genetic groups, A
and B. However, the level of sequence identity between the groups A and B is quite variable.
For example, there is only 40% amino acid identity between the 2Apro of HRV2 (group A) and
HRV14 (group B). Nevertheless, these two proteinases cleave their respective polyproteins
at practically the same rate. In contrast, HRV2 2Apro completes the cleavage of eIF4G
isoforms I and II at similar times whereas HRV14 2Apro cleaves first eIF4GI and eIF4GII later.
In order to understand and identify the residues responsible for the differences in properties
of these proteinases, we decided to perform site directed mutagenesis experiments. We
found that HRV14 2Apro cannot cleave the eIF4GI cleavage sequence in the polyprotein, due
to the presence of the arginine residue at P1. The mutations A104C or A104S in HRV14
2Apro restored cleavage when arginine was present at P1, although not to wild-type levels.
The crystal structure of HRV2 2Apro helped to identify the residues involved in HRV2
2Apro specificity. However, the low level of amino acid identity between HRV2 2Apro and
HRV14 2Apro limited the use of this crystal structure for HRV14 2Apro. Therefore, we purified
HRV14 2Apro with the objective of solving its crystal structure. We were able to obtain highly
purified protein at suitable concentrations for crystallization trials. However, the purified
protein appeared to be incorrectly folded. Optimization of the expression and purification
methods are needed.
We also wanted to identify new cellular binding partners of 2Apro. To this end, we used
a proteomics approach in which cellular proteins complexed with 2Apro were purified and
identified by mass spectroscopy. Although we identified some known and some putative
binding partners, none of the previously undetected proteins were bound or cleaved by 2Apro.

Optimization is needed in order to lower the amount of false positives and increase the
sensitivity for bona fide partners.
To know more about the interaction of viral proteinases with eIF4G, we purified a
domain of eIF4GII containing the cleavage sites for HRV2 2Apro and the leader proteinase of
foot and mouth disease virus and the binding site for eIF4E (cap binding protein). The
ultimate aim was to determine the crystal and nuclear magnetic resonance structures of this
fragment. The protein was successfully expressed in E. coli and labelled with 15N. However,
in both cases, the protein was incorrectly folded. Experiments with the eIF4GII complexed
with eIF4E need to be done, as there is evidence that eIF4E induces a conformational
change in eIF4G which leads to a defined structure.

Zusammenfassung
Die Familie der Picornaviridae besteht aus unbehüllten Viren mit einer
einzelsträngigen, linearen RNA mit positiver Polarität als Genom. Dieses wird in ein großes
Polyprotein translatiert und von viralen Proteinasen prozessiert. So entstehen die reifen
Proteine. In humanen Rhino- und Enteroviren sind zwei Chymotrypsin-ähnliche Proteasen
für die Prozessierung verantwortlich: 3Cpro and 2Apro. 2Apro führt den ersten Schnitt am
Polyprotein aus, indem es sich selbst vom VP1 Kapsidprotein schneidet. Weiters ist sie für
die Spaltung diverser zellulärer Proteine verantwortlich, darunter auch der eukaryotische
Initiationsfaktor (eIF) 4G. Dieser bringt die zelluläre gecappte mRNA und die Ribosomen
zusammen. Eine Spaltung dieses Faktors führt also zu einer Inhibierung der RNA und
Proteinsynthese der Wirtszelle. Die virale Translation bleibt davon unbeeinflusst, da sie
durch Verwendung einer IRES (internal ribosomal cleavage site) cap-unabhängig ist.
Es gibt mehr als 100 Serotypen von Rhinoviren die in 2 Gruppen eingeteilt werden: A
und B. Das Ausmaß der Übereinstimmung dieser beiden Gruppen ist variabel. Zum Beispiel
stimmt die Aminosäuresequenz der 2Apro von HRV2 (Gruppe A) und HRV14 (Gruppe B) nur
zu 40 % überein. Dennoch schneiden diese beiden Proteinasen ihr jeweiliges Polyprotein im
selben Ausmaß. Im Gegensatz dazu, ist die Spaltung des eIF4G unterschiedlich. HRV2 2Apro
spaltet die Isoformen eIF4GI and II gleichzeitig, während die HRV14 2Apro zuerst eIF4GI und
erst danach eIF4GII schneidet. Um diese unterschiedlichen Eigenschaften zu verstehen und
die verantwortlichen Reste zu identifizieren verwendeten wir ortspezifische Mutagenese.
HRV14 2Apro kann die eIF4GI Sequenz im Polyprotein nicht schneiden, wegen eines Arginin
Restes an der P1 Position. Die Mutationen A104C und A104S in der HRV14 2Apro
ermöglichten ein Spaltung von eIF4GI in Anwesenheit eines Arginins in P1 Position,
wenngleich nicht auf Wildtyp-Niveau.
Die Kristallstruktur von HRV2 2Apro half jene Reste zu identifizieren, die in die
Spezifität der HRV2 2Apro involviert sind. Durch die geringe Sequenzübereinstimmung
zwischen den Proteasen der beiden Gruppen kann diese Kristallstruktur aber nur bedingt für
die HRV 14 2Apro angewendet werden. Daher purifizierten wir HRV14 2Apro mit dem Ziel, ihre
Kristallstruktur zu bestimmen. Wir konnten hoch reines Protein in für die Kristallisation
geeigneter Konzentration herstellen. Da das Protein aber falsch gefaltet zu sein scheint, ist
eine Optimierung der Expression und Purifikation nötig.
Weiters wollten wir neue zelluläre Bindungspartner der HRV 2Apro identifizieren. Dafür
wurde die HRV 2Apro mit zelluläre Proteinen komplexiert, purifiziert und mittel
Massenspektroskopie identifiziert. Obwohl wir einige bereits bekannte und einige vermutliche
Bindungspartner identifizierten, wurde keines der zuvor undetektierten Proteine von der HRV

2Apro gebunden oder geschnitten. Daher ist eine Optimierung notwendig, um falsch positive
Ergebnisse zu minimieren und die Sensitivität für bona fide Partner zu erhöhen.
Um mehr über die Interaktion von viralen Proteasen mit eIF4G zu erfahren,
purifizierten wir jene Domaine of eIF4GII die die Spaltungstellen der HRV2 2Apro, der
Leaderproteinase des Maul- und Klauensäuchevirus und die Bindungsstelle für eIF4E (cap
bindendes Protein) enthält.
Das Ziel war, sowohl die Kristall- also auch die NMR (Nukleare Magnetresonanz) Struktur
dieses Fragmentes zu erhalten. Das Protein wurde erfolgreich in E.coli exprimiert und mit 15N
markiert. Allerdings war das Protein in beiden Fällen inkorrekt gefaltet. Da es Anzeichen
gibt, dass eIF4E eine Konformationsänderung im eIF4E induziert müssen Experimente mit
eIF4GII im Komplex mit eIF4E durchgeführt werden.

List of abbreviations All the abbreviations for amino acids are presented on table 22 in the appendix C.
μCi – microcurie
µl – microlitre
µM - micromolar
4EBP – 4E Binding Protein
aa – amino-acid
AP – Alkaline Phosphatase
APS - Ammonium persulfate
ATCC - American Type Culture Collection
ATP - Adenosine 5'-triphosphate
AUG – starting codon for methionine
BCIP - 5-Bromo-4-chloro-3-indolyl phosphate
°C – degrees centigrade
CaBP – Calmodulin Binding Protein
CAR – Coxsackie and Adenovirus Receptor
CBP – Cap Binding Protein
CD - Cluster of Differentiation
CIP - Calf Intestine Phosphatase
CITE – Cap Independent Translation Enhancer
CREB - cAMP Response Element-Binding
Cryo-EM – cryo Electron Microscopy
CTE – C-Terminal Extension
CV – Coxsackievirus
DAF – Decay Accelerating Factor
DMEM - Dulbecco’s Modified Eagle Medium
DMSO - Dimethyl sulfoxide
DNA - Deoxyribonucleic acid
DNase - Deoxyribonuclease
dNTP – deoxynucleotide triphosphate
DTT - Dithiothreitol
ECACC - European Collection of Cell Cultures ECL - Enhanced chemiluminescence
EDTA - Ethylenediaminetetraacetic
eIF – eukaryotic Initiation Factor

EMCV – Encephalomyocarditis Virus
ER – Endoplasmic Reticulum
Fc - fragment crystallizable
FCS - Foetal Calf Serum FMDV – Foot and Mouth Disease Virus
FPLC - Fast Protein Liquid Chromatography
g - gram
GST - Glutathione S-transferase
GTP - Guanosine-5'-triphosphate
HAV – Hepatitis A Virus
HEK cells - Human Embryonic Kidney cells
HeLa cells - Henrietta Lacks' cells
HEPES - 4-(2-hydroxyethyl)-1-piperazineethanesulfonic acid
HP – Heparan Sulphate
HRP - Horseradish Peroxidase
HRV – Human Rhinovirus
ICAM – Intercellular Adhesion Molecule
Ig – Immunoglobulin
IPTG - Isopropyl β-D-1-thiogalactopyranoside
IRES – Internal Ribosomal Entry Site
kb – kilobase
kDa - kilodalton
l - litre
Lpro – Leader Proteinase
Labpro – Leader Proteinase ab
Lbpro – Leader Proteinase b
LB – Luria Bertani
LCB - Lysis Cell Buffer
LDL – Low Density Lipoprotein
LGB – Lower Gel Buffer
M - Molar
MAPK - Mitogen-activated protein kinase
MEM - Modified Eagle Medium MFPL – Max F. Perutz Laboratories
mg – milligram
MHz - Megahertz
ml – millilitre
mm - millimetre
mM – millimolar
mmol - millimol
Mnk1 - (MAPK)-interacting kinase 1
MOI – Multiplicity Of Infection
MOPS - 3-(N-morpholino)propanesulfonic Acid
mRNA – messenger Ribonucleic Acid
MS – Mass Spectroscopy
NBT - Nitro blue tetrazolium
NCBI nr - National Center for Biotechnology Information – non redundant
ng – nanogram
nM – nanomolar
nm – nanometre
NMR - Nuclear Magnetic Resonance
NPC – Nuclear Pore Complex
NTP - Nucleotide triphosphate
Oct1 - Octamer Transcription Factor
PABP – PolyA Binding Protein
pBS - PBluescript
PBS - Phosphate Buffered Saline
PBS-T – PBS-Tween
PCR – Polymerase Chain Reaction
Phe – Phenylalanine
pmol - picomol
pol – polymerase
ppm – parts per million
pro - proteinase
PV – Poliovirus
RNA - Ribonucleic Acid
RNase- Ribonuclease
rpm – rotations per minute
RRL - Rabbit Reticulocyte Lysate
SDS - Sodium Dodecyl Sulfate
SDS-PAGE - SDS- Poly-Acrylamide Gel Electrophreis
Sf9 - Spodoptera frugiperda cells
SFM – Serum Free Medium
S-MEM - Minimum Essential Medium Eagle Joklik Modification

TAE - Tris-acetate-EDTA
TAP - Tandem Affinity Purification
TB – Terrific Broth
TBP – TATA box Binding Protein
TBq - Tera-becquerels
TCA - Trichloroacetic Acid
TE – Trypsin/EDTA
TEB – Tris/EDTA Buffer
TEMED - Tetramethylethylenediamine
TEV - Tobacco Etch Virus
TF – Transcription Factor
tRNA – transfer Ribonucleic Acid
U - Units
UGB – Upper Gel Buffer
UTR – Untranslated Region
UV – Ultra Violet
V - volts
v - volume
VP – Viral Protein
VPg – Virion Protein genome
w - weight
zVAD.fmk - benzylloxycarbonyl-Val-Ala-Asp(OMe).fluoromethyl ketone
zVAM.fmk - benzylloxycarbonyl-Val-Ala-Met.fluoromethyl ketone

Table of contents
1 Introduction ......................................................................................................................... 1 1.1 Picornaviruses ......................................................................................................................... 1
1.1.1 Human rhinoviruses ..................................................................................................................... 1 1.1.2 Viral particle ..................................................................................................................................... 2 1.1.3 Picornaviral Genome ..................................................................................................................... 4 1.1.4 Replication cycle ............................................................................................................................ 5 1.1.5 Binding to the receptor and cell entry....................................................................................... 8
1.1.5.1 Poliovirus.................................................................................................................................. 8 1.1.5.2 Coxsackievirus........................................................................................................................ 9 1.1.5.3 Foot and mouth disease virus............................................................................................. 9 1.1.5.4 Human rhinovirus ................................................................................................................... 9
1.1.6 Polyprotein processing............................................................................................................... 11 1.1.7 Picornaviral non-structural proteins ....................................................................................... 13 1.1.8 Picornaviral Proteinases............................................................................................................. 14
1.1.8.1 Leader proteinase (Lpro) ..................................................................................................... 14 1.1.8.1.1 Properties......................................................................................................................... 14 1.1.8.1.2 Structure........................................................................................................................... 14 1.1.8.1.3 Specificity ......................................................................................................................... 15 1.1.8.1.4 Interaction with cellular proteins ................................................................................... 16
1.1.8.2 3C proteinase (3Cpro)........................................................................................................... 16 1.1.8.2.1 Properties......................................................................................................................... 16 1.1.8.2.2 Structure........................................................................................................................... 16 1.1.8.2.3 Specificity ......................................................................................................................... 17 1.1.8.2.4 Interaction with cellular proteins ................................................................................... 17
1.1.8.3 Entero- and rhinoviruses 2A proteinase (2Apro) .......................................................... 18 1.1.8.3.1 Properties......................................................................................................................... 18 1.1.8.3.2 Structure........................................................................................................................... 18 1.1.8.3.3 Specificity ......................................................................................................................... 19 1.1.8.3.4 Interaction with cellular proteins ................................................................................... 20
1.2 Translation initiation............................................................................................................ 21 1.2.1 Cap-dependent translation........................................................................................................ 21
1.2.1.1 eIF4G........................................................................................................................................ 22 1.2.1.2 eIF4E ........................................................................................................................................ 23
1.2.2 Cap-independent translation ..................................................................................................... 23 2 Aim of the work................................................................................................................. 25
3 Materials and methods ................................................................................................... 26 3.1 Tissue culture........................................................................................................................ 26
3.1.1 Cell lines ........................................................................................................................................ 26 3.1.2 Media and solutions.................................................................................................................... 26 3.1.3 Cell culture .................................................................................................................................... 27
3.1.3.1 HeLa and HEK 293T cells .................................................................................................... 27 3.1.3.2 Sf9 insect cells ....................................................................................................................... 27
3.1.4 Cell counting................................................................................................................................. 27 3.1.5 Freezing and thawing of cells .................................................................................................. 27
3.2 Bacterial culture ................................................................................................................... 28 3.2.1 Bacterial strains ........................................................................................................................... 28 3.2.2 Media and antibiotics ................................................................................................................. 28 3.2.3 Plasmids ........................................................................................................................................ 29 3.2.4 Preparation of competent cells ................................................................................................ 29 3.2.5 Transformation............................................................................................................................. 29
3.3 DNA methods ........................................................................................................................ 30 3.3.1 Preparation of plasmid DNA from bacteria ........................................................................... 30
3.3.1.1 DNA miniprep ......................................................................................................................... 30 3.3.1.2 DNA midiprep ......................................................................................................................... 30
3.3.2 DNA separation on agarose gels............................................................................................. 30 3.3.3 Enzymatic reactions ................................................................................................................... 31
3.3.3.1 Restriction digestions of DNA .............................................................................................. 31 3.3.3.2 Ligation of DNA Fragments with T4 DNA Ligase.............................................................. 31 3.3.3.3 Phosphorylation of DNA 5´ ends ......................................................................................... 31 3.3.3.4 Filling-in of DNA 5´ recessed ends...................................................................................... 31 3.3.3.5 Dephosphorylation of DNA 5´ ends .................................................................................... 31
3.3.4 Purification of DNA Solutions .................................................................................................. 32 3.3.4.1 Phenol/Chloroform extractions ............................................................................................ 32 3.3.4.2 Ethanol Precipitation ............................................................................................................. 32 3.3.4.3 Elution of DNA Fragments from the Gel............................................................................. 32
3.3.5 DNA quantification ...................................................................................................................... 32 3.3.6 Amplification of DNA fragments by PCR (polymerase chain reaction) ......................... 32 3.3.7 Site directed mutagenesis......................................................................................................... 33
3.3.7.1 Cassette Cloning.................................................................................................................... 33 3.3.7.2 Cycle PCR .............................................................................................................................. 33
3.3.8 Sequencing reactions................................................................................................................. 34 3.3.9 List of primers .............................................................................................................................. 34
3.3.9.1 Primers for cloning................................................................................................................. 34 3.3.9.2 Primers for sequencing ......................................................................................................... 38
3.4 RNA methods ........................................................................................................................ 40 3.4.1 In vitro transcription ................................................................................................................... 40 3.4.2 In vitro translation ....................................................................................................................... 41
3.5 Protein methods ................................................................................................................... 41 3.5.1 Protein expression ...................................................................................................................... 41
3.5.1.1 Protein expression in LB and TB media ............................................................................. 41 3.5.1.2 Protein expression in M9 minimal medium ........................................................................ 42 3.5.1.3 Protein expression in Sf9 cells............................................................................................. 42
3.5.1.3.1 Transfection of Sf9 cells to generate a recombinant baculovirus........................... 42 3.5.1.3.2 Preparation of the P1 viral stock and amplification................................................... 42 3.5.1.3.3 Virus titer determination using end-point dilution ...................................................... 43 3.5.1.3.4 Expression of the recombinant protein ....................................................................... 43
3.5.2 Preparation of cell extracts ....................................................................................................... 44 3.5.2.1 Bacterial crude cell extracts ................................................................................................. 44 3.5.2.2 HeLa S10 extracts ................................................................................................................. 44
3.5.3 Protein purification ..................................................................................................................... 45 3.5.3.1 Batch purification ................................................................................................................... 45
3.5.3.1.1 binding to glutathione sepharose beads .................................................................... 45 3.5.3.1.2 Cleavage with preScissionTM Protease ...................................................................... 45 3.5.3.1.3 GST pull down................................................................................................................ 45 3.5.3.1.4 binding to m7GTP beads............................................................................................... 45
3.5.3.2 FPLC purification methods ................................................................................................... 46 3.5.3.2.1 Affinity purification ......................................................................................................... 46 3.5.3.2.2 Anion Exchange Chromatography .............................................................................. 46 3.5.3.2.3 Size Exclusion Chromatography ................................................................................. 46
3.5.3.5 TAP purification...................................................................................................................... 47 3.5.3.5.1 Strategy 1 (adapted from Rigaut G. et al. 1999) ....................................................... 47 3.5.3.5.2 Strategy 2 (adapted from Anne–Claude Gingras 2003) .......................................... 48
3.5.4 Buffer exchange and protein concentration......................................................................... 50 3.5.4.1 Dialysis .................................................................................................................................... 50 3.5.4.2 Protein concentration ............................................................................................................ 50
3.5.5 Protein quantification ................................................................................................................. 50 3.5.6 SDS- Poly-Acrylamide Gel Electrophreis (SDS-PAGE)...................................................... 50
3.5.6.1 SDS-PAGE (Laemmli, 1970) ............................................................................................... 50 3.5.6.2 SDS-PAGE Gradient gels..................................................................................................... 51

3.5.6.3 SDS-PAGE (Dasso and Jackson, 1989) ............................................................................ 51 3.5.6.4 Fluorography .......................................................................................................................... 52 3.5.6.5 Coomassie Staining of Polyacrylamide Gels..................................................................... 52 3.5.6.6 Silver Staining of Polyacrylamide Gels............................................................................... 52
3.5.7 Western blot analysis ................................................................................................................. 53 3.5.8 Maldi-Tof Mass Spectroscopy analysis ................................................................................. 54 3.5.9 NMR (Nuclear Magnetic Resonance) ...................................................................................... 55 3.5.10 Determination of protein melting point................................................................................ 55 3.5.11 Enzymatic reactions of proteins............................................................................................ 56
4 Results ................................................................................................................................ 57 4.1 Specificity of HRV 2A proteinases................................................................................... 57
4.1.1 Polyprotein and eIF4GI processing ........................................................................................ 57 4.1.2 Specific inhibition of 2Apro by zVAD.fmk and zVAM.fmk ................................................... 66
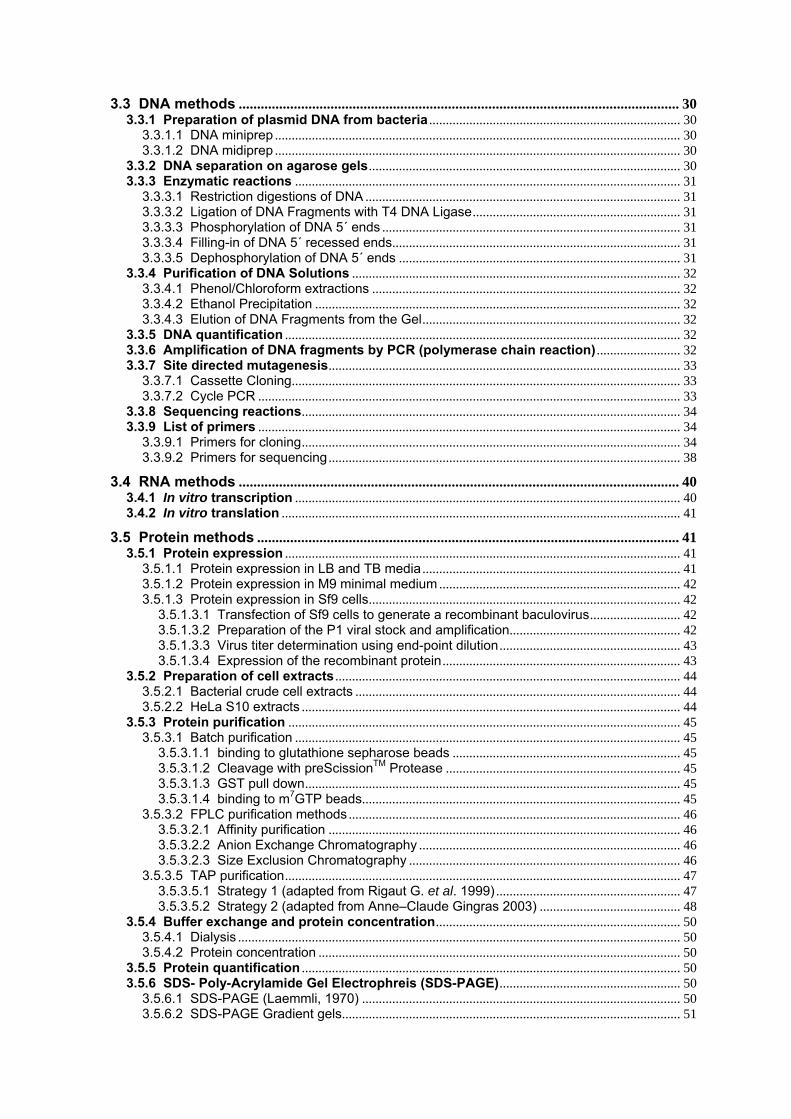
4.2 Analysis of HRV14 2Apro ..................................................................................................... 68 4.2.1 Expression and purification....................................................................................................... 68
4.3 Analysis of eIF4GII ............................................................................................................... 78 4.3.1 Expression and purification...................................................................................................... 78 4.3.2 NMR analysis ................................................................................................................................ 92 4.3.3 eIF4E expression and purification .......................................................................................... 97
4.4 Screening for HRV2 and HRV14 2Apro binding partners .......................................... 102 4.4.1 Expression and purification of the protein complexes ................................................... 102 4.4.2 Analysis of the putative binding partners ........................................................................... 107 4.4.3 Alternative approach for expression and purification of the protein complexes ..... 111
5 Discussion ....................................................................................................................... 117 5.1 Specificity of HRV 2A proteinases.................................................................................. 117 5.2 Protein purification for crystallization and NMR experiments ................................ 122 5.3 Screening of HRV2 and HRV14 2Apro binding partners ............................................. 123
6 Appendixes ...................................................................................................................... 126 6.1 Appendix A............................................................................................................................ 126
Mass spectroscopy results for the TAP experiments ................................................................. 126 6.2 Appendix B............................................................................................................................ 140
DNA and protein markers ................................................................................................................... 140 6.3 Appendix C............................................................................................................................ 142
Amino acids abbreviations ................................................................................................................ 142 6.4 Appendix D............................................................................................................................ 143
List of figures......................................................................................................................................... 143 List of tables .......................................................................................................................................... 147
7 Literature ............................................................................................................................... i


1. Introduction
1
1 Introduction
1.1 Picornaviruses The family Picornaviridae is composed of 9 genera (table 1), all infecting vertebrates.
Some are important human and animal pathogens, such as poliovirus (PV) or foot and mouth
disease virus (FMDV).
Genus Members Serotypes
Enterovirus Poliovirus, Coxsackievirus, 95
Swine Vesicular Disease Virus
Rhinovirus Common Cold Virus 103
Cardiovirus Encephalomyocarditis Virus, 5
Theilers Murine Encephalomyelitis
Virus, Mengovirus
Aphthovirus Foot-And-Mouth Disease Virus 8
Equine Rhinovirus A
Hepatovirus Including Hepatitis A Virus 3
Parechovirus Human Parechovirus 4
Erbovirus Equine Rhinovirus B 2
Kobuvirus Including Aichi Virus 2
Teschovirus Including Teschen Disease Virus 11
Table 1: The Genera of the family of Picornaviruses (Fauquet and International Committee on
Taxonomy of, 2005).
1.1.1 Human rhinoviruses Human rhinoviruses (HRV) are the most frequent cause of the common cold, a mild
infection of the upper respiratory tract, in humans. The primary sites of infection are the nose
and throat (Arruda et al., 1997). However, infection of the lower respiratory tract does occur
(Mosser et al., 2005; Papadopoulos et al., 2000). Rhinoviruses are also involved in
exacerbation of asthma and pneumonia (Turner, 2007; Xatzipsalti et al., 2005). Furthermore,
recent reports show a connection between rhinoviruses and severe respiratory-tract infection
in children (Renwick et al., 2007). There are more than 100 serotypes of HRV which are divided in two genetic groups,
A and B, according to sequence data on VP1 and VP4 (Laine et al., 2006; Savolainen et al.,
2002). However, recently, a new genotype of HRV, has been identified in patients presenting
symptoms of influenza-like disease where no influenza viruses were detected (Lamson et al.,
2006). The complete genome of three of these new viruses has been sequenced and

1. Introduction
2
revealed that they belong to a new species, HRV-C (Lau et al., 2007). The genome of HRV-
C viruses is relatively small compared with HRV-A and HRV-B. The polyprotein of HRV-C
showed 51% amino acid identity with HRV-A and 48% with HRV-B. Phylogenetic analysis of
HRV-C strains formed a distinct cluster from HRV-A and HRV-B (figure 1). Out of 26 HRV
strains isolated from children with acute respiratory tract infection, 21 were found to belong to
the HRV-C group (Lau et al., 2007).
Figure 1: Phylogenetic tree of the VP4 region of 26 HRV strains collected from nasopharyngeal aspirates (Lau et al., 2007).
A second classification system clusters these viruses according to the receptor used
to enter the host cell. The major group, which comprises 90% of the serotypes, binds the
intercellular adhesion molecule (ICAM) (Greve et al., 1989; Staunton et al., 1989) whereas
the minor group utilizes the Low Density Lipoprotein (LDL) receptor (Hofer et al., 1994). Some serotypes can also use the heparan sulphate (HS) receptor as a second receptor
(Khan et al., 2007).
1.1.2 Viral particle Picornaviruses are small, non-enveloped viruses with a single stranded RNA genome
of positive polarity. The term picornavirus is derived from the small (pico) size of the viral

1. Introduction
3
particle and their RNA genome. These viruses have a simple structure with a spherical
shape of about 30 nm of diameter, arranged in an icosahedral symmetry. The X-ray
structures of many picornaviruses are available and were crucial for understanding the viral
capsid. Among these structures are PV1 (Hogle et al., 1985), HRV14 (Rossmann et al.,
1985), HRV16 (Oliveira et al., 1993), FMDV serotype O (Acharya et al., 1989) and
coxsackievirus (CV) B3 (Muckelbauer et al., 1995).
The viral capsid is composed of four structural proteins, VP (Viral Protein) 1, VP2,
VP3 and VP4. The precursor of VP2 and VP4 is VP0, which is cleaved during the maturation
of the viral particle. VP1, VP2 and VP3 share the same topology despite having different
sequences. VP4 is located in the inner surface of the particle. The structure of the capsid
proteins is a wedge-shaped, eight stranded, antiparallel β-barrel. One copy of each protein
unites to form a protomer, the basic building block of the picornavirus capsid. 60 protomers
form the viral capsid (figure 2). The shape similarity shared by the viral proteins facilitates
their interaction with one another and their packing in the capsid. The interactions of the β-
barrel domains of adjacent proteins form a dense and rigid shell that surrounds the naked
RNA genome (Flint, 2004).
Figure 2: Structure of picornaviruses. A) Representation of the packing of VP1-VP2-VP3 structural
units. 60 copies of each viral protein pack tightly forming the viral capsid. The protomer is highlighted
in blue and forms two adjacent faces of an icosahedron. VP4 lies on the inner surface of the protein
shell. (Flint, 2004) B) Poliovirus particle determined from X-ray crystallographic data (Hogle et al.,
1985).
The functions of the viral capsid are protection of the genome from the surrounding
environment, recognition of cell receptors and thus tissue tropism determination,

1. Introduction
4
determination of antigenicity and release of the RNA genome. Despite their similarity,
picornaviral capsids vary in some physical properties. For example, cardioviruses,
enteroviruses, hepatoviruses and parechoviruses are acid stable and remain infective at pH
lower than 3. Other picornaviruses, such as rhinoviruses and aphthoviruses, are labile at pH
lower than 6 (Fields et al., 2007). These differences influence the location at which the
viruses replicate. For example, rhinoviruses replicate in the respiratory tract whereas
enteroviruses are able to replicate in the alimentary tract.
Although many structures of picornaviruses have been solved, there is still no insight
into why some genera have a high number of serotypes, such as human rhinoviruses, and
others like polioviruses have just few serotypes. The antigenicity of the picornaviruses is
determined by the loops that connect the β-strands and the N- and C- terminal sequences
that stretch out from the β-barrel domain. These regions contain the main structural
differences among VP1, VP2 and VP3 and the major neutralization antigenic sites of the
virus.
1.1.3 Picornaviral Genome Picornaviral genomes are composed of a single stranded RNA molecule of positive
polarity, with lengths of 7.1 kb (HRV) to 8.2 kb (FMDV). The viral genome is divided into
three regions: the 5’ UTR (untranslated region) (0.6 to 1.2 kb), the coding region (6.5 to 7 kb)
and the 3’ UTR (up to 0.1 kb) that contains a polyA tail of several dozen nucleotides (Agol,
2002). Picornaviral RNA does not possess a 5’ cap structure; instead the RNA is covalently
linked to the virion protein genome (VPg) (Flanegan et al., 1977; Lee et al., 1977) through a
tyrosine residue.
cis-Elements (RNA sequences that regulate the expression of genes located on that
same strand) involved in replication and translation of viral RNA are mainly present in the 5’
UTR. However, some can be found within the coding region. One cis-element present in the
5’ UTR is the Internal Ribosome Entry Site (IRES). The IRES is composed of discontinuous
RNA segments which associate with each other acquiring a functional conformation
(Witherell et al., 1995). This highly structured region of the genome serves as recognition site
for the ribosome, ensuring the formation of a pre-initiation template/ribosome complex (Agol,
2002). IRES sequences are formed by approximately 450 nucleotides and contain different
sequence and secondary structure among the different picornavirus genera. There are three
types of IRES in picornaviruses: type I in entero and rhinoviruses; type II in cardio, aphtho-
and parechoviruses and type III in hepatoviruses (figure 3). The classification of IRES was
based on sequence comparisons and biochemical or enzymatic probing (Ehrenfeld and
Teterina, 2002).

1. Introduction
5
Figure 3: Schematic representation of the predicted stem-loop structures in the (A) poliovirus, (B) encephalomyocarditis virus, and (C) hepatitis A virus 5’ UTR of the viral RNAs (Ehrenfeld
and Teterina, 2002).
The 5’ UTR also contains an oligopyrimidine stretch and an AUG codon separated by
about 20 nucleotides which was postulated as being a cis-acting element (Beck et al., 1983;
Pilipenko et al., 1992). However, it is not clear whether the oligopyrimidine, AUG codon and
the spacer function as a single template element or whether they are separated elements in
which the spacer determines the position of the AUG codon relative to the IRES (Pilipenko et
al., 1995).
Aphthoviruses and cardioviruses contain a polyC tract in their 5’ UTR, which varies in
length within the several serotypes. In cardioviruses the longer length of the polyC sequence
is associated with higher virulence (Fields et al., 2007).
The 3’ UTR is shorter than the 5’ UTR (47 nucleotides for HRV and up to 125
nucleotides in encephalomyocarditis virus (EMCV)) (Fields et al., 2007). The 3’ end contains
a pseudoknot which might be involved in the initiation of the synthesis of minus strand RNA
(Jacobson et al., 1993). Furthermore, the removal of the polyA tract in PV produces non-
infectious RNA (Spector and Baltimore, 1974). However, it was shown recently that the 3’
non coding region is not required for HRV and PV infectivity (Brown et al., 2005).
The coding region is composed of a single open-reading frame which is translated as
a single polyprotein. Processing of the polyprotein by viral proteinases gives the mature
proteins (Fields et al., 2007) (see section 1.1.6) .
1.1.4 Replication cycle Picornaviruses replicate in the cytoplasm of an infected cell. The replication cycle is
divided in three steps: attachment and entry, decoding of genetic information and synthesis
of new genomes and finally assembly and release of the particle.

1. Introduction
6
A single replication cycle can take 5 to 10 hours, depending on the virus,
temperature, host cell or pH. Figure 4 shows a schematic representation of the picornaviral
replication cycle.
Figure 4: Overview of the picornavirus replication cycle. After binding to the receptor (1) the
virus releases its genome and the VPg (virion protein, genome linked) is removed from the viral RNA
(2). The RNA is translated (3) into a polyprotein that is co-translationaly cleaved (4) into the the viral
proteins. The RNA synthesis is carried out in vesicular membranes where (-) strand RNAs are
synthesized by the RNA polymerase (5). The (-) strand RNAs are then used to produce more (+) stand
RNAs (6). During early infection the newly synthesized (+) RNA is translated into viral proteins (7)
while during late infection it is packed into the viral particles (8), which are finally released upon cell
lysis (9) (Fields et al., 2007).
Once the virus enters the cell its RNA needs to be translated as no cellular
polymerase can copy it and no viral enzymes are carried within the viral capsid.
Instead of a 5’-terminal cap structure, picornaviruses have an IRES sequence (see
section 1.1.3) which allows them to bind to the ribosomes and translate their genome. How
the viruses take over the cellular translation machinery will be described in section 1.1.6. In
EMCV the central domain of eukaryotic initiation factor (eIF) 4G (see section 1.2.1.1),
containing the binding sites for eIF3 (binds directly to the ribosome) and eIF4A (an RNA
helicase) remains and stimulates IRES mediated translation (Pestova et al., 2001).

1. Introduction
7
Additionally, FMDV RNA translation is also stimulated by the appearance of proteolytic
cleavage products of eIF4G (Ohlmann et al., 1995). An exception is hepatitis A virus (HAV)
which requires intact eIF4G (Borman and Kean, 1997).
Upon picornaviral infection, the intracellular membranes of the cell go through
rearrangement. The endoplasmatic reticulum (ER) and Golgi apparatus are destroyed and
double membrane vesicles fill the cytoplasm (Schlegel et al., 1996). Viral replication occurs
on the surface of these membranes. About 50,000 copies of the viral positive-stranded
genome are produced in the infected cell, through a negative-stranded intermediate (Fields
et al., 2007). The genomic RNA serves as mRNA and as template for synthesis of the
negative strand. These processes do not occur simultaneously (Barton et al., 1999).
The synthesis of the negative strand is performed by 3Dpol, a RNA dependent RNA
polymerase encoded by the virus. Once 3Dpol and other essential proteins have been
synthesized, the genomic RNA starts to be used as template for the negative-stranded
intermediate. The 3Dpol together with 3AB, forms two dimensional lattices coating the
membranes where the viruses replicate. These structures result in a increase of substrate
affinity simply by reducing the collisions between reactants (Lyle et al., 2002).
The shift between translation and replication is controlled by an RNA element at the 5’
end of the viral RNA genome, a cloverleaf structure of 64 nucleotides. 3CD (the polymerase
precursor) binds to this structure, repressing viral translation and promoting negative
stranded RNA synthesis (Gamarnik and Andino, 1998).
After release of the P1 region from the rest of the polyprotein, viral proteinases cleave
the VP0-VP3 and VP3-VP1 bonds. Afterwards, one copy of VP0, VP3 and VP1 assemble
forming an immature structural unit, the 5S protomer. Five protomers assemble to build a
pentamer, which can self-assemble in vivo and in vitro into empty capsids. There are two
models for the insertion of the viral RNA into the capsid. According to the first model, the
RNA is inserted into the intact capsid after it is assembled (Jacobson and Baltimore, 1968).
The second model states that the pentamers assemble with the RNA to form provirions
(Nugent and Kirkegaard, 1995).
The final step of assembly is the cleavage of VP0 into VP2 and VP4 by an unknown
proteinase activity. As the scissile bond is not accessible to viral or cellular proteinases, it
was suggested that the cleavage can be autocatalytic. The process would involve the Ser10
of VP2 and basic RNA groups that would serve as proton-abstracters as in a serine protease
type mechanism (Arnold et al., 1987). However, experiments in which the Ser10 was deleted
showed that this residue is not involved in the cleavage mechanism (Harber et al., 1991).
Later it was shown that the His195 of VP2 is probably involved in the VP0 cleavage. His195
may activate local bound water molecules that can initiate a nucleophilic attack at VP0

1. Introduction
8
cleavage site (Hindiyeh et al., 1999). This cleavage results in an increase in particle stability
and acquisition of infectivity (Lee et al., 1993).
After assembly and maturation, viral particles are released by lysis except for HAV
which is released without causing cytopathic effect. The cytopathic effect consists of
condensation of chromatin, nuclear blebbing, proliferation of membranous vesicles, changes
in membrane permeability, leakage of intracellular components and shrinking of the entire
cell (Fields et al., 2007).
1.1.5 Binding to the receptor and cell entry Picornaviruses use different cell surface molecules as receptors (table 2).
Virus Receptors
Foot and mouth disesase virus Heparan sulphate, αvβ3, αvβ8
Encephalomyocarditis virus VCAM-1, sialated glycophorin
Polioviruses 1-3 PVR (CD155)
Coxsackieviruses A ICAM-1, CD55, αvβ3, αvβ6
Coxsackieviruses B CAR, CD55 (DAF)
Echoviruses Α2β1-integrin, CD55
Parechovirus 1 αvβ1, αvβ3
Enteroviruses CD55, sialic acid
Hepatitis A virus HAVCR-1
Major group rhinoviruses ICAM-1, heparan sulphate
Minor group rhinoviruses LDL receptor family
Table 2: Viruses and their receptors. Adapted from (Fields et al., 2007).
PV, CV and HRV capsids have a five fold axis of symmetry, which is rounded by a
deep depression, named the canyon. Many receptors, such as ICAM or CD55, bind to the
canyon. Aphthoviruses and cardioviruses do not have these canyons (Fields et al., 2007).
1.1.5.1 Poliovirus PV uses CD155, an adhesion molecule of the Ig (Immunoglobulin), superfamily. The
Ig superfamily receptors have 2 to 5 Ig domains and the viral recognition site lies at the N-
terminal domain. This domain penetrates into the picornavirus canyon, causing instability in
the capsid, thus facilitating the release of RNA. (Rossmann et al., 2002). Upon receptor
binding, conformational changes occur leading to the formation of a pore through which the
RNA can enter the cell (Bubeck et al., 2005). Two recent studies suggest that poliovirus
enter different cells through different mechanisms (Bergelson, 2008). In the first study, the

1. Introduction
9
results showed that in HeLa and HEK 293 cells, the uncoating occurs within clathrin- and
caveolin-independent vesicles in the cell periphery and that it is more than a simple
consequence from the interaction with the receptor. It requires energy, an intact cytoskeleton
and activity of cellular tyrosine kinases (Brandenburg et al., 2007). The second study showed
that in human brain microvascular endothelial cells, viral entry is caveolin and dynamin
dependent. The internalization of the caveolar vesicles occurred in response to specific
signals from specific ligands. Additionally, the ligation of the virus to the receptor triggered
rearrangements of the actin cytoskeleton which were also required for the entry process
(Coyne et al., 2007).
1.1.5.2 Coxsackievirus CVA21 binds DAF (decay accelerating factor) and ICAM-I. CVB bind DAF on the
apical surface of the cell, inducing rearrangements that allow the viruses to access to their
actual receptor, CAR (coxsackie and adenovirus receptor), that is located in the tight
junctions of the cell (Fields et al., 2007).
1.1.5.3 Foot and mouth disease virus FMDV A12 uses integrin αvβ3 for attachment whereas the laboratorial strain FMDV O
uses HS (Jackson et al., 1996; Neff et al., 1998). FMDV (and some HRVs) enter the cell by
endocytosis and the uncoating process is induced by acidification of the endosome. In these
cases, the binding to the receptor does not trigger conformational changes, it just secures
the viral particle to the cell so it can enter via endocytic pathway. At pH 6.5, the viral capsid
separates itself into pentamers and releases the RNA (van Vlijmen et al., 1998).
1.1.5.4 Human rhinovirus As mentioned in section 1.1.1, major group human rhinoviruses bind to ICAM-I and
minor group human rhinoviruses bind to the LDL receptor family. Although the overall
structures of HRV are similar, the binding to their respective receptors is highly specific
(Kolatkar et al., 1999). For minor group HRVs, the receptor binding region, situated on the
left side of the five fold axis, contains mainly basic residues. Among these residues is a
lysine that is conserved in the minor group and seems to play a central role on receptor
recognition (Vlasak et al., 2003). The same region of major group HRVs contains mostly
uncharged or acidic residues. The nature of the interaction of LDL family receptors was
reported to be between acidic residues of the receptor and basic residues of ligands
(Yamamoto et al., 1984). Figure 5A shows the surface potential of the HRV2 (minor group)
pentamer. The area where the receptor binds was magnified (figure 5B) and compared to

1. Introduction
10
other HRVs of minor and major groups. Blue shows a positive potential and red shows a
negative one. A clear difference between groups can be observed (Vlasak et al., 2003).
Figure 5: Surface potential of the receptor binding site of several HRVs. A) HRV2 pentamer. B) Magnification of the receptor binding sites of HRV2, HRV1A (minor group), HRV14 and HRV16 (major
group). Blue areas show positive potential whereas red areas show negative potential. The conserved
lysine of minor group viruses is marked by a bold circle in the surface of HRV2. Adapted from Vlasak
et al., 2003.
Major group HRVs bind to their receptor ICAM-1 via residues that are located in the
canyon (Figure 6) (Kolatkar et al., 1999; Olson et al., 1993). This mode of binding prevents
bulky neutralizing antibodies from accessing the receptor binding site (Rossmann et al.,
2000). The binding occurs through the distal amino-terminal of ICAM-1. The tip of the most
distal domain of ICAM-1 presents a high level of shape and charge complementarity with the
wall and floor of the canyon of HRV14 and HRV16 (Kolatkar et al., 1999). This
complementarity is not observed in HRV2 (Rossmann et al., 2000).

1. Introduction
11
Figure 6: Cryo-EM (cryo electron microscopy) image reconstruction of HRV14 complexed with a soluble fragment of ICAM-1 (Kolatkar et al., 1999).
1.1.6 Polyprotein processing The polyprotein processing occurs co-translationally via intramolecular cleavages
(primary cleavages) and intermolecular cleavages (secondary cleavages). All picornaviruses
encode 3Cpro, which performs the primary cleavage between 2C and 3A (Fields et al., 2007).
The processing events vary among the different picornaviruses (figure 7). The single
picornaviral open reading frame is translated into a long polyprotein which is processed by
virally encoded proteinases. The picornaviral polyprotein is divided in three regions: P1, P2
and P3. P1 contains the four capsid proteins VP1 to VP4; P2 and P3 regions contain the
non-structural proteins. Cardioviruses and aphthoviruses contain an additional protein,
named Leader, preceding the P1 region.
Hepato- and parechoviruses polyprotein processing is the simplest among
picornaviruses. These viruses encode only one enzyme with proteolytic activity, 3Cpro. 3Cpro
performs the second primary cleavage between 2A and 2B in the P2 region (Martin et al.,
1995) and all the secondary cleavages of the HAV polyprotein, showing an activity profile
broader than that of 3Cpro of other picornaviruses (Schultheiss et al., 1994). The 2A protein of
these viruses has no known function.
In aphthoviruses and cardioviruses, 2A is not active as a proteinase. This protein is
released from the polyprotein through a mechanism in which the peptide bond between the
last residue of 2A and the first residue of 2B is not formed (Ryan et al., 1999). In this
mechanism, the nascent 2A interaction with the exit pore from the ribosome is altered. The
orientation of the protein within the peptidyl-transferase center of the ribosome is changed,
thus inhibithing the peptide bond formation and releasing the 2A (Ryan et al., 1999). The first
encoded protein in aphtho- and cardioviruses is the Leader protein (L). In cardioviruses, the
Leader protein has no proteolytic activity and the cleavage at its C-terminus is carried out by
3Cpro. However, the leader protein of mengovirus has a role in the antiviral host cell

1. Introduction
12
response, by interfering with the iron homeostasis and inducing NF-κB (Zoll et al., 2002). In
contrast to cardioviruses, the aphthoviruses Leader protein is a proteinase (Lpro) (Guarne et
al., 1998). It cleaves between its own C-terminus and the N-terminus of VP4. The secondary
cleavages are performed by 3Cpro.
For entero- and rhinoviruses, the primary cleavage that separates the P1 and P2
regions is carried out by 2Apro. The 3Cpro performs most of the secondary cleavages. In PV
the 3Cpro precursor, 3CDpro, cleaves between VP0 and VP3 and between VP3 and VP1 (Jore
et al., 1988; Ypma-Wong et al., 1988). Additionally, the 2Apro of PV and some HRV serotypes
can cleave the precursor 3CD into the products 3C’ and 3D’ (Hanecak et al., 1982; McLean
et al., 1976). However, the suppression of this cleavage site in PV does not affect viral
replication.
Figure 7: Primary cleavages of picornavirus polyprotein. Hepatoviruses possess the simplest
cleavage pattern in wich 3Cpro performs all the primary cleavages. In cardioviruses and aphthoviruses
2A releases itself from the 2B protein, although it is not a proteinase. 3Cpro separates 2A from the P1
region. FMDV Lpro releases itself from the VP4 protein. In enteroviruses and rhinoviruses the 2Apro
carries out the cleavage between P1 and P2 regions through autocleavage. Adapted from (Fields et
al., 2007).
After a first round of translation, picornaviral proteinases cleave the scaffolding
protein eIF4G, whose function is to bring together ribosomes and capped mRNA (figure 8
and section 1.2.1.1). The consequence of eIF4G cleavage is the host cell translation shut-off.
The cellular capped mRNA is no longer able to bind to the ribosomes. Therefore the virus

1. Introduction
13
takes over the cell translational machinery, through an IRES sequence present in its genome
(section 1.1.3), to synthesize all the proteins necessary for replication and assembly. The
cleavage of eIF4G by picornaviral proteinases will be described in detail in sections 1.1.8.1.4
and 1.1.8.3.4.
Figure 8: 5’ cap-dependent versus IRES-dependent translation initiation. Binding of eIF4E to the
5’ cap positions the ribosome on the mRNA. After eIF4G cleavage the 5’ capped mRNA can no longer
bind the ribosome. However, the IRES can bind the C-terminus of eIF4G which remains from the
cleavage and therefore recruit the ribosome.
1.1.7 Picornaviral non-structural proteins The P1 region contains the structural proteins described in section 1.1.2. P2 and P3
contain the non-structural proteins. This section will not consider those viral proteins with
proteinase activity; they will be described in more detail below.
P2 contains the proteins 2A, 2B and 2C. As mentioned above, aphtho- and
cardioviruses 2A do not have proteolytic function. However, EMCV 2A seems to be required
for efficient translation of EMCV RNA in vivo to neutralize the competition from cellular
mRNAs (Svitkin et al., 1998). 2B forms pores on the ER and Golgi membranes. Therefore, it
decreases the Ca2+ concentration in these organelles and increases the levels of this ion in
the cytoplasm. 2B is also involved in the anti-apoptotic response in polioviruses, perhaps due
to its ability to disturb the intracellular Ca2+ homeostasis (van Kuppeveld et al., 2005). The
precursor of 2B, 2BC, is responsible for the accumulation of the Golgi and ER derived
vesicles, in the cytosol, where viral replication takes place (Bienz et al., 1994). 2C binds to
membranes and RNA. In poliovirus, 2C binds to the 3’ end of the negative strand replication
intermediate (Goodfellow et al., 2003) and it may have a role in viral encapsidation (Vance et
al., 1997).
The P3 region consists of four proteins, 3A to 3D. 3A appears to have a role in
altering the ER-Golgi trafficking facilitating the evasion of the host immune system (Choe et
al., 2005). 3B is the virion protein genome (VPg) which covalently binds to the 5’ end of the

1. Introduction
14
viral RNA (Flanegan et al., 1977). This peptide is cleaved off the RNA upon entry in the cell
and is not necessary for translation. However, VPg is found in nascent RNA chains, both
positive and negative, (Pettersson et al., 1978) and acts as a primer for RNA synthesis (Paul
et al., 1998). Finally, 3D is the RNA dependent RNA polymerase responsible for copying the
RNA genome (section 1.1.4) (Crowder and Kirkegaard, 2004; Pata et al., 1995).
1.1.8 Picornaviral Proteinases 1.1.8.1 Leader proteinase (Lpro) Two in frame AUG codons that are situated 84 residues apart in the viral polyprotein
originate two forms of the Leader proteinase (Lpro). When the protein synthesis starts at the
first AUG codon Labpro is produced; when the synthesis starts at the second AUG codon Lbpro
is formed (Clarke et al., 1985; Sangar et al., 1987). Both proteins are active and able to
perform cleavage from the polyprotein in cis and in trans (Cao et al., 1995; Medina et al.,
1993).
1.1.8.1.1 Properties
Lpro is inhibited by general sulphydryl-specific reagents and E-64 (a general inhibitor
of cysteine proteinases), implying that this proteinase activity follows a papain like
mechanism (Burroughs et al., 1984; Kleina and Grubman, 1992).
1.1.8.1.2 Structure
The structure of Lbpro was solved by X-ray crystallography (Guarne et al., 1998). The
proteinase has a papain-like folding with two domains: a α-helical domain (also called left
domain) and a β-sheet domain (right domain). In contrast to papain, Lbpro has no prominent
surface loops and contains a C-terminal extension (CTE). The CTE structure is very flexible.
The active site is formed by the catalytic dyad Cys51 and the His148, at the interface
between the two domains (figure 9). Asp163 keeps the active His148 in the correct
orientation in respect to the Cys51.

1. Introduction
15
Figure 9: The structure of FMDV Lbpro. α-helices and β-strands are coloured green and magenta,
respectively. The CTE is presented in two possible conformations: ordered (orange) and disordered
(blue). Two active site residues are shown as ball and stick models (Guarne et al., 1998).
1.1.8.1.3 Specificity
The cleavage sites of Lpro are presented in table 3. The structure showed that the
most important interactions in the Lpro substrate-binding groove are with the residue at the P2
position (Guarne et al., 1998) (the nomenclature Pn-P1-P1’-Pn’ is that of (Schechter and
Berger, 1967)). The protein developed a pocket to anchor a hydrophobic residue at this P2
position. This pocket accepts valine or leucine; however, it does not accept a phenylalanine
(table 3).
In contrast, the residues at P3, P1 and P1’ are more variable. This might be because
P1 and P3 residues point away from the enzyme. At the P1 site, a positively charged
residue is well accepted as the Glu96 and Glu147 help to stabilize the positive charge and
the side chains provide a hydrophobic environment for the lysine side chain (Guarne et al.,
1998). It is not clear why Lpro accepts glycine at P1 position in the eIF4G isoforms.
Interestingly, the P1’ residue is the most variable among the substrates. (Guarne et al.,
1998). Although there is no structural information about the interaction of the substrate with
the enzyme, comparisons with the papain structure can provide some information on the P1’
residue. These analysis show that the Asp164 could accommodate a positively charged
residue at the P1’ site, as it happens for the cellular substrate, eIF4GI (Skern et al., 2002).

1. Introduction
16
Substrate
Cleavage sites
P * P’
54321 1234
Lbpro/VP4 QRKLK * GAGQ
eIF4GI FANLG * RTTL
eIF4GII LLNVG * SRRS
eIF4GII not cleaved FADFG * RQTP
Table 3: Lbpro cleavage sites on known substrates. eIF4GII is not cleaved at the analogous
sequence to that recognized in eIF4GI (last lane).
1.1.8.1.4 Interaction with cellular proteins
Lpro has developed a high level of specificity. Therefore, the only substrates known in
the cell are the two isoforms of eIF4G, whose cleavage leads to the host cell translation shut
off. As shown in table 3, Lpro does not cleave eIF4GII at the analogous site of eIF4GI; instead
the cleavage occurs at LNVG*SRRS (Gradi et al., 2004).
1.1.8.2 3C proteinase (3Cpro) 3Cpro was the first viral protein shown to have proteolytic activity through work done in
EMCV (Gorbalenya et al., 1979; Palmenberg et al., 1979; Svitkin et al., 1979) and PV
(Hanecak et al., 1982; Hanecak et al., 1984).
1.1.8.2.1 Properties
3Cpro are inhibited by N-ethylmaleimide, iodocetamide and Hg2+ ions (Pelham, 1978),
but not by E-64 (Orr et al., 1989). The mechanism of PV 3Cpro seems to be similar to the one
of serine proteases; however, this mechanism does not involve a thiolate-imidazolium ion
pair (Sarkany et al., 2001).
1.1.8.2.2 Structure
3Cpro is a single chain protein with homology to chymotrypsin-like serine proteases.
The X-ray structure of 3C from HAV (Allaire et al., 1994; Bergmann et al., 1997), HRV14
(Matthews et al., 1994), HRV2 (Matthews et al., 1999) and PV (Mosimann et al., 1997) are
available. All these structures contain two topologically equivalent six-stranded β-barrels. A
long, shallow groove for substrate binding is situated between the two domains. The catalytic
triad is constituted by His40, Cys146 and Glu71 in HRV14, and His44, Cys172 and Asp84 in
HAV (Gorbalenya et al., 1989; Kean et al., 1991). Figure 10 shows the structure of PV 3Cpro.

1. Introduction
17
A RNA binding site, constituted by basic residues is situated on the opposite side of
the active site. Two phenylalanine residues seem to play a role in RNA binding (Matthews et
al., 1994). The precursor of 3Cpro, 3CD interacts with the viral RNA and plays a role in
translational control (Gamarnik and Andino, 1998; Gamarnik and Andino, 2000; Marcotte et
al., 2007).
Figure 10: The structure of PV 3Cpro. The β-barrels are indicated in blue (domain I) and in green
(domain II). The individual four-stranded β-sheets are shown in dark-blue, cyan, and green (Mosimann
et al., 1997).
1.1.8.2.3 Specificity
3Cpro usually cleaves between Gln*Gly. However, the cleavage sites vary among
different genera. PV 3Cpro cleaves only between Gln*Gly whereas EMCV 3Cpro accepts
Glu*Ser or Glu*Ala and FMDV 3Cpro recognizes Gln*Leu and Gln*Ile as well. Nevertheless,
these sequences are not sufficient for cleavage; the flanking residues are also important for
specificity (Ypma-Wong et al., 1988). The residues at P4 and P2 sites are conserved in both
HRVs and enteroviruses (an aliphatic residue at P4 and proline at P2). Cardioviruses
process substrates that contain proline at P2 and P2’ sites. In rhino- and enteroviruses sites
P4, P1, P1’ and P2’ are sensitive to substitutions. HRV14 and PV have a preference for
alanine at P4, glutamine at P1, glycine at P1’ and proline at P2’ (Cordingley et al., 1990;
Long et al., 1989). EMCV accepts serine, cysteine, glycine and alanine at P1’ but not
threonine, isoleucine or tyrosine (Parks et al., 1989).
1.1.8.2.4 Interaction with cellular proteins
PV 3Cpro cleaves the transcription factors TFIIIC (Clark et al., 1991), TFIID (Clark et
al., 1993) Oct1 and CREB (Yalamanchili et al., 1997b; Yalamanchili et al., 1997c), and the
microtubule-associated protein 4 (Joachims et al., 1995). FMDV 3Cpro cleaves histone protein

1. Introduction
18
3 (Tesar and Marquardt, 1990) and the initiation factors eIF4A and eIF4GI (Belsham et al.,
2000). However eIF4GI cleavage happens later than the cleavage by Lpro.
All these cleavages affect host-cell transcription and translation.
1.1.8.3 Entero- and rhinoviruses 2A proteinase (2Apro) In enteroviruses and rhinoviruses, 2Apro is responsible for the initial cleavage of the
polyprotein, separating the structural proteins from the non structural ones. It cleaves
between its own N-terminus and the C-terminus of VP1. 2Apro also cleave several cellular
proteins.
1.1.8.3.1 Properties
2Apro are inhibited by iodocetamide, N-ethylmaleinimide and Hg2+ ions, but not E-64.
Chymostatin and elastatinal (serine proteinases inhibitors) are also efficient against 2Apro.
However, leupeptin, another inhibitor of serine and cysteine proteinases, has no effect
(Sommergruber et al., 1992). Recently, it was found that a methylated form of the caspase
inhibitor benzylloxycarbonyl-Val-Ala-Asp(OMe).fluoromethyl ketone (zVAD.fmk) inhibits 2Apro
(Deszcz et al., 2004). Based on structural analysis of zVAD.fmk and HRV2 2Apro, a new
inhibitor derived from zVAD.fmk was synthesized. The new compound was named
benzylloxycarbonyl-Val-Ala-Met.fluoromethyl ketone (zVAM.fmk). It inhibits specifically 2Apro
but not caspases. Therefore, zVAM.fmk is a specific tool to study the roles of 2Apro during
viral replication, as the proteinase can be inactivated at specific points of the infectious cycle
(Deszcz et al., 2006).
2Apro are also potential drug targets. Crowder and Kirkegaard (2005) showed that PV
bearing 2Apro without enzymatic activity can function as dominant negative inhibitors of wild-
type growth. In experiments in which cells are co-infected with wild type PV and PV bearing
mutations in the 2Apro sequence which make the proteinase inactive, the mutants suppress
the growth of the wild type viruses (Crowder and Kirkegaard, 2005). There is evidence that
the cleavage between VP1 and 2Apro is exclusively intramolecular (Toyoda et al., 1986).
Therefore, the uncleaved VP1-2A can accumulate and co-assemble with wild type VP0 and
VP3 forming non-functional capsids, preventing the growth of wild type viruses (Crowder and
Kirkegaard, 2005).
1.1.8.3.2 Structure
2Apro are cysteine proteinases with a chymotrypsin-like fold. The X-ray structure of
HRV2 2Apro has been solved (Petersen et al., 1999). The NMR structure of CVB4 2Apro is
also available (Baxter et al., 2006). 2Apro is composed of an N- and a C-terminal domain,
connected by an interdomain loop. This proteinase shows unique characteristics, compared

1. Introduction
19
to other chymotrypsin-like proteinases, the N-terminal domain is not a β-barrel, but a four
stranded anti-parallel β-sheet (figure 11). The C-terminal domain is made of a β-barrel and
contains a zinc ion that is tightly coordinated by Cys52, Cys54, Cys112 and His114. The zinc
ion is essential for the maintenance of the structure and is thought to compensate the
reduced size of the N-terminal domain. The zinc ion connects the interbarrel loop with the C-
terminal domain, therefore contributing to the stability of the protein (Petersen et al., 1999).
The active site of HRV2 2Apro is composed of a catalytic triad, His18, Asp35 and
Cys106 and is topologically similar to the chymotrypsin-like serine proteinases. The histidine
shows an unusual flexibility which is stabilized by the aspartate (Petersen et al., 1999).
During the interaction with the substrate, chymotrypsin-like proteases develop a negative
charge, which is stabilized by a structure named oxyanion hole. The stabilization is achieved
by a network of hydrogen bridges, by anchoring the residues 102-108 to a hairpin loop
formed by residues 62-65 (Petersen et al., 1999).
Figure 11: The structure of HRV2 2Apro. Ribbon diagram of the overall structure of HRV2 2Apro.The
residues composing the catalytic triad (His18, Asp35 and Cys106), the zinc ion (purple sphere) and
the zinc binding site are shown (Petersen et al., 1999).
1.1.8.3.3 Specificity
The minimum length of a substrate for HRV2 2Apro is 9 amino acids, P8 to P1’
(Sommergruber et al., 1992). The residues at positions P2 and P1’ are of great importance
for substrate recognition. P2 residue is able to form hydrogen bonds with Ser83 (in HRV2
2Apro or the equivalent residue in other 2Apro) and seems to provide favourable binding
energy. HRV2 2Apro accepts threonine, asparagine and serine at P2. At P1’ position, it only
processes glycine as Leu19 blocks the access of bulkier residues. The P1 position is more
flexible, accepting a variety of amino acids (methionine, leucine, tyrosine, phenylalanine,

1. Introduction
20
threonine and arginine) (Skern et al., 1991; Sommergruber et al., 1992). Moreover, HRV2
2Apro processes substrates with tyrosine and methionine at P1 site more efficiently than the
wild type alanine (Sommergruber et al., 1992). The structure shows that the substrate
binding site, S1, is narrow and deep and is mainly filled with the side chain of Cys101. This
characteristics make it possible to accommodate long and flexible side chains, like
methionine (Petersen et al., 1999). Additionally, the presence of Glu102 located at the
bottom of the pocket provides a negative charge that can support the presence of lysine or
arginine at the P1 site.
1.1.8.3.4 Interaction with cellular proteins
The best characterized cleavage of cellular proteins by 2Apro is the one of eIF4G, a
cellular protein involved in the initiation of protein synthesis. The cleavage of both eIF4GI and
II leads to the inhibition of host cell protein synthesis (Gradi et al., 1998b; Svitkin et al.,
1999). HRV and CV 2Apro were shown to cleave eIF4G directly (Lamphear et al., 1993; Liebig
et al., 2002). There is evidence that PV1 2Apro also cleaves eIF4G directly (Ventoso et al.,
1998). However, there is also evidence that the cleavage of eIF4G by PV1 2Apro can occur
indirectly, via activation of a not yet identified cellular proteinase. Furthermore, it was shown
that PV1 2Apro could be modified by caspases (Bovee et al., 1998; Wyckoff et al., 1992;
Zamora et al., 2002).
PV and HRV 2Apro cleave both isoforms of eIF4GI and II in vivo (Gradi et al., 1998a;
Gradi et al., 2003). HRV2 2Apro recognizes the sequence TLSTR*GPPR on eIF4GI and
PLLNV*GSRR in eIF4GII (Gradi et al., 2003). HRV2 2Apro binds eIF4GI in a distinct region
from the cleavage site (Foeger et al., 2002). Furthermore, the residues 669 to 674 have an
important role in the binding process (Foeger et al., 2002). The binding site is probably used
to dock the proteinase at some distance from the cleavage site. This shows that the cleavage
of eIF4G by 2Apro is a multi-step reaction in which the proteinase binds the substrate and
afterwards cleaves it (Foeger et al., 2002).
PV and CVB3 2Apro cleave the polyA binding protein (PABP) which is involved in
several aspects of mRNA metabolism and participates directly in translation initiation
(Joachims et al., 1999; Svitkin et al., 2001). The cleavage of PABP seems to correlate better
with the host translation shut-off than the cleavage of eIF4G isoforms (Kerekatte et al.,
1999).
HRV14 2Apro cleaves cytokeratin 8, a member of the intermediate filament family that
form the cytoskeleton together with actin filaments (Seipelt et al., 2000). CVB3 2Apro cleaves
dystrophin in myocytes leading to cardiomyopathy (Badorff et al., 1999). PV 2Apro cleaves the
TATA-box binding protein (TBP) (Yalamanchili et al., 1997a), reducing transcriptional activity

1. Introduction
21
of the cell. PV 2Apro also cleaves two nuclear pore complex (NPC) proteins, Nup153 and
Nup62 (Park et al., 2008).
Picornaviral 2Apro are also involved in apoptosis. CVB3 2Apro is able to induce
apoptosis through caspase 8 mediated activation of caspase 3 (Chau et al., 2007). The 2Apro
of PV1 and several HRV serotypes induce apoptosis through activation of caspase 3
(Calandria et al., 2004; Deszcz et al., 2005; Deszcz et al., 2004; Goldstaub et al., 2000).
1.2 Translation initiation 1.2.1 Cap-dependent translation In eukaryotes, more than 10 initiation factors (eIF) are involved in the initiation of
protein synthesis. The initiation of translation starts with the formation of the 43S complex by
association of the initiator Met-tRNA with the GTPase initiation factor eIF2a (bound to a
guanosine triphosphate (GTP)), the 40S ribosomal subunit and several initiation factors
(eIF1, eIF3, eIF5 and eIF1A) (Hershey and Merrick, 2000; Lopez-Lastra et al., 2005) (figure
12).
Figure 12: Diagram of translation initiation in eukaryotes (Lopez-Lastra et al., 2005).
The capped mRNA is recognized by the complex eIF4F which consists of the cap
binding protein eIF4E, the scaffolding protein eIF4G and the RNA helicase eIF4A (Hershey
and Merrick, 2000). This complex binds the 43S pre-initiation complex through interaction of
eIF4G with eIF3 (Hentze, 1997; Pain, 1996) and begins to unwind and scan the mRNA for

1. Introduction
22
the correct AUG codon. This activity is dependent on ATP hydrolysis. Once the initiation
codon is found, eIF2a hydrolyzes the bound GTP and the pre-initiation factors dissociate
from the small subunit (Pollard et al., 2002). Finally, the large ribosomal subunit binds the
small subunit and protein synthesis starts.
Of the factors mentioned above, two are relevant for this work, eIF4G and eIF4E.
1.2.1.1 eIF4G
The scaffolding protein eIF4G is a protein of 220 kDa, formerly named p220 and eIF-
4γ brings together components of the protein synthesis initiation mechanism (Gradi et al.,
1998a; LeFebvre et al., 2006). Two homologues sharing 46% identity have been identified in
mammals (Gradi et al., 1998a). Disruption of both isoforms of eIF4G in yeast is lethal (Goyer
et al., 1993).
Human eIF4G can be divided in three domains. The N-terminal domain contains the
binding sites for PABP and eIF4E (Imataka et al., 1998; Mader et al., 1995). eIF3, eIF4A and
RNA bind to the central domain (Imataka and Sonenberg, 1997; Pestova et al., 1996b). The
C-terminal domain contains a second binding site for eIF4A (Imataka and Sonenberg, 1997)
and a binding site for the protein kinase MnkI (Pyronnet et al., 1999). These sites are shown
on figure 13. eIF4G is also specifically cleaved by the picornaviral proteinases Lbpro and
2Apro.
Figure 13: Schematic drawing of eIF4GI. Binding sites for PABP, eIF4E, eIF4A, eIF3 and Mnk as
well as cleavage sites of the picornaviral 2Apro and Lbpro are shown. Adapted from Jackson, 2002 and
R. Cencic, PhD thesis 2005.
The N-terminal domain is essential for cap-dependent translation as it contains the
eIF4E binding site. The central domain is important for cap-independent translation (Pestova
et al., 1996b) and the C-terminal domain has a regulatory function, not being essential for the
activity of eIF4G (Morino et al., 2000).

1. Introduction
23
The interaction of eIF4G with PABP and eIF4E simultaneously brings together the 3’
and 5’ ends of the mRNA forming a pseudo-circular structure which regulates and stimulates
translation initiation (Wells et al., 1998) (figure 14).
Figure 14: Schematic representation of the initiation translation complex. eIF4G binds PABP and
eIF4E bringing together the 3’ and 5’ ends of the mRNA forming a pseudo-circular structure which
regulates and stimulates translation initiation (Lopez-Lastra et al., 2005).
1.2.1.2 eIF4E eIF4E, also known as the cap binding protein (CBP), recognizes and binds the
capped mRNA directly (Haghighat and Sonenberg, 1997). eIF4E is involved in the selection
of mRNAs; it therefore plays a role in the regulation of translation (Hershey and Merrick,
2000).
The interaction between eIF4E and the mRNA seems to be regulated by
phosphorylation. However, it is not necessary for its function as unphosphrylated eIF4E
stimulates translation in vitro (Svitkin et al., 1996). In fact, phosphorylation diminishes the
ability of eIF4E to bind capped mRNA (Scheper et al., 2002). eIF4E phosphorylation is
modulated in response to environmental stress such as heat shock (Duncan et al., 1987) or
viral infection (Feigenblum and Schneider, 1993; Kleijn et al., 1996).
Upon eIF4E binding, eIF4G residues 393 to 490 fold into a closed ring-shaped
structure of five helical segments (Gross et al., 2003). These interactions are required for
optimal growth and maintenance of polysome structure in vivo, in yeast (Gross et al., 2003).
1.2.2 Cap-independent translation Upon picornaviral infection, the cap-dependent translation is inhibited due to the
cleavage of eIF4G by picornaviral proteinases. The viral translation is then mediated by the
IRES structure present in the viral genome. The IRES structures can recruite the ribosome to
an initiator AUG codon (Belsham and Jackson, 2000).
The IRES mediated translation requires almost the complete set of initiation factors
except for eIF4E (Pestova et al., 1996a; Pestova et al., 1996b). The complex of eIF4A and

1. Introduction
24
the central domain of eIF4G, missing the eIF4E binding site, can replace the cap-binding
protein complex eIF4F during the formation of the 48S pre-initiation complex (Lopez-Lastra
et al., 2005) (figure 12). However, the eIFs are not always necessary for cap-independent
translation. The hepatitis C virus IRES binds directly the 40S complex without requiring any
initiation factor (Ji et al., 2004; Kolupaeva et al., 2000). Thus, the difference of cap-
independent from cap-dependent translation relies on how the cleaved eIF4G is anchored to
the RNA (Ehrenfeld and Teterina, 2002). The central domain of eIF4G binds directly to the
IRES sequence, upstream of the initiation site (Kolupaeva et al., 1998; Pestova et al.,
1996b). Additionally, it was shown that the central region of eIF4G is sufficient to deliver a
functional ribosomal subunit to mRNA (De Gregorio et al., 1999).
Cap-independent translation seems to occur also on cellular proteins under certain
conditions as heat shock or mitosis, in which cellular IRES appear to be involved (Cornelis et
al., 2000). However, it is not generally accepted that IRES are involved in cellular translation.
Some regions earlier identified as IRES turned out to be cryptic promoters or splicing sites
(Kozak, 2005; Kozak, 2007). This subject is still controversial (Kozak, 2001; Schneider et al.,
2001)

2. Aim of the work
25
2 Aim of the work The aim of the work was to investigate and characterize the 2Apro of HRV2 and
HRV14. Although they carry out the same reactions, these two proteins have different
properties and characteristics.
HRV2 and HRV14 2Apro cleave their respective polyproteins at similar rates, in
contrast, HRV14 2Apro cleaves eIF4GI and II slower than HRV2 2Apro, both in vitro and in vivo
(Gradi et al., 1998b; Svitkin et al., 1999).
What is the structural basis for the observed differences? Based on the structure of
HRV2 2Apro, we wanted to perform site directed mutagenesis experiments in order to identify
residues that are involved in the difference of specificity presented by these proteinases.
However, the low level of identity between HRV2 2Apro and HRV14 2Apro (40%) limits the
information which can be sained from the HRV2 2Apro. Therefore, we set out to purify and
crystallize HRV14 2Apro. We believe that the determination of this structure would shed light
on the specificities and mechanisms of the two 2Apro.
How do the picornaviral proteinases interact with eIF4G? We wanted to obtain
information on the nature of the interactions of these proteinases with eIF4G. For that, we
planned to purify a fragment of eIF4GII containing the cleavage sites of HRV2 2Apro and the
Lbpro of FMDV as well as the binding sites for the Lbpro and eIF4E. We wanted to crystallize
and perform NMR experiments with this fragment in order to gain information on its
interaction with Lbpro and eIF4E. eIF4E is believed to induce changes in the eIF4G structure
which are better recognized by the viral proteinases (Gross et al., 2003; Haghighat et al.,
1996; Hershey et al., 1999).
Does 2Apro interact with others cellular proteins? We planned to use the tandem
affinity purification (TAP) method developed by Rigaut et al., (1999) to identify new cellular
partners for 2Apro

3. Materials and methods
26
3 Materials and methods
3.1 Tissue culture 3.1.1 Cell lines
Spodoptera frugiperda Sf9 insect cells and HeLa cells Ohio were obtained from
European Collection of Cell Cultures (ECACC). HEK 293T cells (CRL-11268) were obtained
from the American Type Culture Collection (ATCC).
3.1.2 Media and solutions Dulbecco’s Modified Eagle Medium, Gibco BRL (DMEM) was suplemented with 10%
(v/v) Foetal Calf Serum (FCS) (Gibco BRL), 1% (v/v) 100x Penicillin/Streptomycin (Gibco
BRL) and 1% (v/v) 200 mM L-Glutamine (Gibco BRL). This medium was used for monolayer
culture of HeLa and HEK 293T cells. Minimum Essential Medium Eagle Joklik Modification (S-MEM) from Sigma was
supplemented with 7% Horse serum (Gibco), 1% (v/v) 100x Penicillin/Streptomycin (Gibco
BRL), 1% (v/v) 200 mM L-Glutamine (Gibco BRL), 1% (v/v) non essential aminoacids (Bio
Whitaker™) and 1% (v/v) Pluronic F-68 (Sigma, 10% w/v). Suspension cultures of HeLa cells
were grown in this medium.
SF 900 II SFM (Gibco BRL) medium, used for monolayer and suspension cultures of
Sf9 cells, was supplemented with 2% FCS (Gibco), 1% (v/v) 100x Penicillin/Streptomycin
(Gibco BRL) and 1% (v/v) 200 mM L-Glutamine (Gibco BRL).
Reduced Serum Medium modified of MEM (Eagle's) (OPTI-MEM Gibco BRL) was
used for transfection of HEK 293T cells.
For transfection of Sf9 cells we used Grace’s Insect Cell Culture Medium Modified
(Gibco BRL).
The buffer used to wash the cells was Phosphate Buffered Saline (PBS). The 10 x
stock contains 14 mM KH2PO4, 27 mM KCl, 43 mM Na2HPO4 and 1370 mM NaCl dissolved
in H2O.
The antibiotic solutions were prepared in 1x PBS and contained 60 mg/L Penicillin G
potassium salt, 100 mg/L of Streptomycine sulphate and 58 mg/L of glutamine.
The cells were detached from the culture flasks using a solution od 0.5% trypsin and
0.53 mM EDTA (TE) (Gibco BRL).

3. Materials and methods
27
3.1.3 Cell culture 3.1.3.1 HeLa and HEK 293T cells
Cells were cultured either in Petri-dishes or flasks (Nunc, Corning) with DMEM
medium supplemented with FCS, antibiotics and glutamine (see 3.1.2) at 37°C in presence
of 5% CO2. Before reaching complete confluence, the cells were washed with 1x PBS and
incubated with just enough TE (see 3.1.2) to cover the cells at 37°C for no more than 5
minutes. Once detached from the surface, the cells were taken up in fresh medium and
transferred to a new flask at a suitable dilution.
For preparation of HeLa S10 extracts (see 3.5.2.2) HeLa cells were also grown in
suspension. A suspension culture was set up from 5 confluent 175 cm2 flasks that were split
and transferred into a glass spinner flask containing one litre of S-MEM medium (see 3.1.2).
The cultures were kept at 37°C with 5% CO2 and the cell density was mantained between
2x10⁵ and 8x10⁵ cells/ml.
3.1.3.2 Sf9 insect cells
Cells were cultured in flasks (Nunc, Corning) or in glass conical flasks for the liquid
cultures with SF 900 II SFM medium supplemented with FCS, antibiotics and glutamine (see
3.1.2) at 27°C in a humidified chamber. Before reaching complete confluence or a density
superior to 2x10⁶ cells/ml, the cells were split. For the monolayer culture, the cells were
washed with 1x PBS and fresh medium was added. The cells were detached from the flask
by scraping with a glass Pasteur pipette and transferred to a new flask at a suitable dilution.
The liquid cultures were simply diluted in fresh medium at a suitable dilution and kept with
rotation at 120 rpm.
3.1.4 Cell counting After the cells were trypsinised and detached from the flask surface, they were taken
up in a known volume of fresh medium. 10 µl of the cell suspension were loaded onto a
haemocytometer (Neubauer improved counting chamber) and cells were counted under a
light microscope.
3.1.5 Freezing and thawing of cells HEK 293T cells growing logarithmically were washed twice with 1x PBS, trypsinized,
taken up in fresh medium and centrifuged at 1000 rpm for 5 minutes at 4°C. The supernatant
was disposed off and the cells were washed with 1x PBS and spun down at 1000 rpm for 5
minutes at 4°C. The cells were finally resuspended in 90% FCS and 10% DMSO, transferred
into cryo tubes (Nunc) and stored at -80°C in a freezing container (Nalgene) for two days

3. Materials and methods
28
before transfer to liquid nitrogen for long term storage. The same procedure was used for Sf9
cells except that they were grown in suspension and were stored in Sf-900 II SFM medium
containing 7.5% DMSO. The cell density of the stocks was 2x10⁶ cells/ml.
The recovery from the liquid nitrogen was done by quickly warming the cells to 37°C
in a water bath for 2 to 3 minutes and transferring them to 10 ml of fresh medium. A
centrifugation at 1200 rpm for 4 minutes at room temperature followed and the pellet was
resuspended in fresh medium and added to a new flask. Sf9 cells were kept in monolayer
culture during the adaptation from 20% FCS to 2% FCS supplemented medium and then
were transferred to suspension cultures.
3.2 Bacterial culture 3.2.1 Bacterial strains The bacterial strain used for modification and amplification of plasmids was E. coli
Top10F´ (F-mcrAΔ(mrr-hsdRMS-mrcBC) Φ80lacZΔm15ΔlacX74recA1deoRaraD139(ara-leu)7697
galU galK rpsL (StrR) endA1 nupG) (Invitrogen). For expression of recombinant proteins we
used the strains E. coli BL21 (DE3) LysS (hsdD gal (λcIts857 ind1 Sam7 nin5 lacUV5-T7gene1)
(Novagen) and E.coli JM101 (SupE thi Δ(lac-proAB) F’ [traD36 proAB+ lacIq lacZΔM15)
(Pharmacia). The strain E. coli DH10Bac™ (F- mcrA Δ(mrr-hsdRMS-mcrBC) Ф80lacZΔM15
ΔlacX74 recA1 endA1 araD139 Δ(ara, leu)7697 galU galK λ-rpsL nupG / bMON14272 / pMON7124)
(Invitrogen) was used to introduce genes into a baculovirus shuttle vector (bacmid).
3.2.2 Media and antibiotics Luria-Bertani (LB) medium (Roth) contains 10 g/l of tryptone, 5 g/l of yeast extract
and 10 g/l of NaCl. The pH is adjusted 7.0 and the medium is autoclaved before use.
Another medium used for bacterial growth was the Terrific Broth (TB) medium which
is prepared with 12 g/l bacto-tryptone, 24 g/l yeast extract and 4 ml/l glycerol. After
autocleavage a solution of 100 ml/l of 0.17 M KH2PO4/ 0.72 M K2HPO4 is added.
To express recombinant proteins labelled with 15N, the bacteria are grown in minimal
medium. To obtain this medium we prepare a solution of 33.7 mM Na2HPO4.2H2O, 22 mM
KH2PO4, 8.5 mM NaCl and 18.7 mM 15NH4Cl. This solution is autoclaved and added to a
filtered sterilized solution of 2 mM MgSO4, 1% trace elements, 0.4% glucose, 0.3 mM CaCl2,
1 µg/ml biotine, 1 µg/ml thiamine and suitable antibiotics.
The solid bacteria medium is obtained by addition of 1.5% Bacto-agar (Roth) to liquid
media before autoclaving. When the medium temperature reaches 50°C, antibiotics are
added to the final concentrations and poured into Petri dishes.

3. Materials and methods
29
The antibiotics used in this work were Ampicillin sodium salt (Sigma) dissolved in H2O
(100mg/ml) and Chloramphenicol (Calbiochem) dissolved in absolute ethanol (34 mg/ml).
The working dilutions of these antibiotics were 100 µg/ml.
3.2.3 Plasmids Table 4 shows the plasmids used throughout this work.
Plasmid Function
pCITE-1 (Novagen) In vitro transcription
pCITE-A1 (pCITE-1 modified by Andreas
Roetzer (Roetzer, 2004))
In vitro transcription
pET3b (Novagen) Protein expression in bacteria
pET 11d (Novagen) Protein expression in bacteria
pGEX-6P-1 (Amersham Pharmacia Biosciences) Protein expression in bacteria
pBluescript I KS (Stratagene) Blunt end cloning
pMZI (J. K. Greenblatt) Protein expression in mammalian cells
pVgRXR (Invitrogen) Transfection of mammalian cells
pFastBac (Invitrogen) Transformation of the bacterial strain E.
coli DH10Bac™
pproExHTA (Invitrogen) Protein expression in bacteria
Table 4: List of the plasmids used in this work. The origin of each plasmid is shown in brackets.
3.2.4 Preparation of competent cells A 3 ml overnight culture was diluted into 200 ml LB medium and incubated at 37°C
with rotation at 180 rpm. When the cell density reached an OD600 of 0.6, the bacteria were
collected into 50 ml sterile falcon tubes and centrifuged for 10 minutes at 4300 rpm at 4°C
(Heraeus Megafuge 1.0R). The pellet was resuspended in 25 ml of ice cold 0.1 M CaCl2,
incubated for 25 minutes on ice and centrifuged as described above. The pellet was taken in
10 ml of ice cold 0.1 M CaCl2 and kept at 4°C overnight without rotation. 2 ml of 80% glycerol
were added and mixed gently with the bacterial solution, which was then divided in 200 µl
aliquots, snap frozen in liquid nitrogen and stored at -80°C.
3.2.5 Transformation An aliquot of competent cells was thawed on ice for 10 minutes and incubated with
DNA (10 µl of a ligation or 1 µl of a plasmid) for 15 minutes on ice. A heat shock was then

3. Materials and methods
30
applied to the cells for 45 seconds at 42°C. The cells were chilled on ice for 2 to 3 minutes,
upon which 400 µl of LB medium was added. The cells were incubated at 37°C for 30
minutes and plated in Petri-dishes containing the appropriate medium and antibiotics.
Incubation at 37°C overnight followed.
3.3 DNA methods 3.3.1 Preparation of plasmid DNA from bacteria 3.3.1.1 DNA miniprep
A 3 ml culture of bacteria grown overnight was harvested by centrifugation at 14,000
rpm for 30 seconds at room temperature (eppendorf centrifuge 5415 C) and the cell pellet
resuspended in 100 µl of Solution I (50 mM glucose, 25 mM Tris-HCl pH 8.0 and 10 mM
EDTA). To lyse the cells, 200 µl of Solution II (0.2 N NaOH,1 % (w/v) SDS) were added, the
suspension was mixed gently and incubated for not more than 5 minutes at room
temperature. Precipitation of proteins and chromosomal DNA was done by addition of 150 µl
Solution III (3 M potassium acetate, 11.5 % (v/v) acetic acid) and again gentle mixing.
Alternatively, the solutions S1, S2 and S3 from the Nucleobond AX plasmid Midi Kit
(Macherey-Nagel) were used. The precipitate was separated by centrifugation for 5 min at
14,000 rpm at 4°C (eppendorf centrifuge 5417 R). The supernatant containing the plasmid
DNA was transferred to a new tube and the DNA was precipitated by addition of 1 ml of
absolute ethanol. The DNA pellet was dissolved in 200 µl of TEB buffer (10 mM Tris-HCl pH
8.0, 1 mM EDTA) and mixed with 200 µl of 5 M LiCl. After centrifugation 5 minutes at 14,000
rpm at 4°C (eppendorf centrifuge 5417 R), the supernatant was transferred to a new tube
and the DNA again precipitated with 1 ml of absolute ethanol. Finally the DNA pellet was
resuspended in an appropriate volume of H2O. This plasmid quality is suitable for digestions
(include 10 % (v/v) RNAse A (Sigma) at a concentration of 0.1 mg/ml) and sequencing
reactions.
3.3.1.2 DNA midiprep
Higher amounts of pure plasmid DNA (up to 500 µg) were obtained with the
Nucleobond AX plasmid Midi Kit (Macherey-Nagel) used according to the instructions of the
manufacturer.
3.3.2 DNA separation on agarose gels DNA was mixed with 1/10 of the total volume of 10x loading buffer (1 mM EDTA pH
8.0, 0.1 % (w/v) Orange G, 10 % (w/v) Ficoll in 0.5x TAE (20 mM Tris base, 5 mM sodium
acetate, 1 mM EDTA, adjust to pH 8.2 with HCl)) and separated according to size on

3. Materials and methods
31
agarose (GenXpress) gels. Depending on the size of DNA to be separated, the percentage
of agarose dissolved in 0.5x TAE was between 0.7 and 1.5 % (w/v). Gels were run with 2 to
8 V/cm (power pac 300, Biorad) in 0.5x TAE in wide mini-sub® or mini-sub® cell GT tanks
(Biorad) and DNA was visualized after ethidium bromide staining (dilute 10 mg/ml stock
solution 1:10,000 in 0.5x TAE) under UV (ultraviolet) light. The intensity of the DNA was
compared to a λDNA (promega) HindIII digested marker (see Appendix B).
3.3.3 Enzymatic reactions 3.3.3.1 Restriction digestions of DNA
Restriction endonucleases and 10x reaction buffers (New England Biolabs) were
used following the instructions of the manufacturer. Analytical digestions were performed in a
total volume of 20 µl with 0.5 to 1 µg DNA and preparative digestions in a total volume of 100
µl with 2 to 5 µg DNA.
3.3.3.2 Ligation of DNA Fragments with T4 DNA Ligase
A typical 20 µl reaction contained 50 ng of restricted vector DNA and 20 ng of insert
DNA in 1 mM ATP, 1x T4- DNA ligase buffer (30 mM Tris-HCl pH 7.8, 10 mM MgCl2, 10 mM
DTT, 1 mM ATP) and 0.5 µl T4-DNA ligase (New England Biolabs, 400 U/µl). The reactions
were incubated from 4 hours to overnight at room temperature.
3.3.3.3 Phosphorylation of DNA 5´ ends
Phosphorylation of 5´ ends was performed using T4 Polynucleotide Kinase (New
England Biolabs, 5 U/µg DNA) in the buffer supplied with the enzyme (70 mM Tris-HCl pH
7.6, 10 mM MgCl2, 5 mM DTT) and 1 mM ATP. The reaction was incubated for 30 min at
37°C prior to phenol/CHCl3 extraction and ethanol precipitation (see 3.3.4.1 and 3.3.4.2).
3.3.3.4 Filling-in of DNA 5´ recessed ends
0.5 µl of T4 DNA polymerase (New England Biolabs, 3 U/µl) were added to a fresh
PCR product (see 3.3.6) prior to its purification and incubated 10 minutes at 37°C. The
reaction was then stopped with 0.5 µl of a 0.5 M EDTA solution pH 8.0. The DNA was
extracted with phenol/CHCl3 and precipitated with ethanol (see 3.3.4.1 and 3.3.4.2).
3.3.3.5 Dephosphorylation of DNA 5´ ends
In order to avoid self-ligation, cleaved vectors were incubated with 1 U/pmol DNA
ends of calf intestine phosphatase (CIP) (New England Biolabs) in 20 mM Tris-HCl pH 8.0 for
45 minutes at 37°C. The enzyme was inactivated by incubation at 65°C for 45 minutes.
Afterwards, the reaction mixture was purified by elution from an agarose gel (see 3.3.4.3).

3. Materials and methods
32
3.3.4 Purification of DNA Solutions 3.3.4.1 Phenol/Chloroform extractions
To purify DNA from enzymes or other proteins and to remove other contaminants, 1%
(v/v) 0.5 M EDTA pH 8.0 and 1 volume of Tris-HCl pH 7.5 saturated phenol (Sambrok et al.,
1989) were added to the DNA solution and vortexed for 5 to 10 seconds. Phases were
separated by centrifugation for 2 min at 14,000 rpm at room temperature (eppendorf
centrifuge 5415 D) and the upper aqueous phase transferred into a new tube. After re-
extraction with 1 volume of CHCl3, the upper aqueous phase was ethanol precipitated (see
below).
3.3.4.2 Ethanol Precipitation
To purify or concentrate DNA, 10 % (v/v) 3 M sodium acetate pH 5.6 and 2 volumes
of absolute ethanol were added to the DNA solution. The mixture was incubated at -20°C for
at least 20 minutes and centrifuged for 15 min at 14,000 rpm at room temperature (eppendorf
centrifuge 5415 D). After discarding the supernatant, the pellet was air dried and taken up in
an appropriate volume of H2O.
3.3.4.3 Elution of DNA Fragments from the Gel
Elution of DNA from agarose gels was performed with the Wizard® SV Gel and PCR
Clean-Up System kit from Promega. The instructions of manufacturer were followed.
3.3.5 DNA quantification The concentration of DNA solutions was determined by UV spectroscopy at 260 nm
in a photometer (BioPhotometer, eppendorf). OD260 of 1 corresponds to 50 µg/ml of DNA.
Dilutions of 1/100 of the DNA solutions were prepared in H2O and measured against a blank
containing only H2O.
3.3.6 Amplification of DNA fragments by PCR (polymerase chain reaction)
A standard PCR reaction of 50 µl contained 10 ng of template DNA, 0.2 µg of each
primer, 1x Taq-polymerase buffer (supplemented with the enzyme), 0.2 mM dNTPs
(Invitrogen) and 0.6 U DyNAzyme II (Finnzyme) or 3 U of Pfu DNA polymerase I (Promega)
(for PCR products larger than 800 base pairs or to be cloned in expression vectors). The
aqueous solution was overlaid with one drop of mineral oil and the PCR reaction was done in
a Perkin Elmer DNA Thermal Cycler (Perkin) machine. DNA was denaturated at 94°C and
amplified in 20 to 35 cycles of denaturating at 94°C for 30 seconds, 30 to 90 seconds of

3. Materials and methods
33
annealing temperature (based on the melting temperature of the primers) and 30 to 90
seconds of extension temperature at 72°C (68°C for PfuI (Promega)). A final step of
extension temperature was done for 10 minutes at 72°C (68°C for PfuI (Promega)).
3.3.7 Site directed mutagenesis 3.3.7.1 Cassette Cloning
Cassette cloning consists in substituting, through digestion and ligation, a small DNA
fragment (up to 40 to 50 nucleotides) with a new fragment bearing the desired mutations.
Two primers complementary to each other, containing the desired mutations and the same
restriction sites used to digest the vector, were phosphorylated and ligated into a digested
and dephosphorylated vector (see 3.3.3.3 and 3.3.3.5).
Before the ligation reaction, the primers had been phosphorylated. 1 µg of each
primer was added to 1 mM ATP, 1x PNK (polynucleotide kinase) reaction buffer (70 mM Tris-
HCl, 10 mM MgCl2, 5 mM dithiothreitol (DTT), pH 7.6), 5 U of PNK (New England Biolabs)
and H2O in a total volume of 20 µl. The solution was overlaid with one drop of mineral oil and
a single cycle of incubation at 37°C for 30 minutes, 90°C for 30 seconds and 37°C for 5
minutes was done using a Perkin Elmer DNA Thermal Cycler (Perkin) machine.
The ligations were transformed into E. coli Top 10 F´ (Invitrogen) and the new
plasmid bearing the desired mutations was extracted and purified (see 3.2.5 and 3.3.3.2).
3.3.7.2 Cycle PCR
This method allows the introduction of a mutation by amplifying the complete plasmid.
The proof reading Pfu DNA Polymerase I (Promega) and a PCR machine with a heated lid
(T3 Thermocycler Biometra) were used. The mutagenesis was performed using two primers
complementary to each other bearing the mutation. Base pair exchange of up to 6
nucleotides is possible with this method. The mutated nucleotides lay in the middle of the
primer, flanked by 12 wild type nucleotides. To introduce the mutations, 20 cycles of
denaturing at 95°C for 2 minutes, 1 minute at usually 40°C (depending on the number of
nucleotides to be exchanged) and elongation for 2 minutes per kb of the template at 68°C,
were performed. The PCR reaction was set up with different dilutions of DNA (1 µg, 1 µg
1:10, 1 µg 1:100) (see 3.3.6). As a negative control a PCR was performed without the
primers. 10 µl of the PCR reaction were tested on an agarose gel (see 3.3.2). The remaining
40 µl were digested with 1 µl DpnI (20 U/µl, New England Biolabs) for at least 5 hours to
remove the methylated template DNA. 10 µl of the undigested DNA were used for
transformation in E.Coli Top 10 F´ (see 3.2.5).

3. Materials and methods
34
3.3.8 Sequencing reactions DNA sequencing was performed using the ABI PRISM 310 Genetic Analyzer and the
BigDye Terminator v3.1 Cycle Sequencing Kit (Applied Biosystems) according to the
instructions of the manufacturer. Dilution of the BigDye Terminator mix with 5x sequencing
buffer (100 mM Tris-HCl pH 9.0, 10 mM MgCl2) was optional. The sequencing reaction was
composed as follows: 0.2 µg plasmid DNA, 1 µl primer (4 to10 pmol/µl), 2 µl BigDye
Terminator mix, 3 µl 5x sequencing buffer added to water in a total volume of 20 µl.
The reaction was performed in a heated lid thermocycler (T3 Thermocycler Biometra).
30 cycles were performed with 30 sec at 96°C, 10 sec at 50°C and 4 min at 60°C. The
reaction was cleaned by spinning through Millipore UltrafreeMC columns packed with
Sephadex G-50 (DNA-grade, Pharmacia) for 3 minutes at 2500 rpm.
Alternatively the DNA samples and primers were sent to be sequenced in the Service
Department of IMP (Institute of Molecular Pathology) Vienna, headed by Gotthold Schaffner.
3.3.9 List of primers 3.3.9.1 Primers for cloning
Label Sequence and description (orientation 5’ to 3’)
TIM979 ACTGGAATTCGGTTTAGGACCGCGG
Sense primer to introduce HRV14 2Apro in the vector pGEX-6P1; EcoRI site
TIM1302 CCGGTAATTAAGAAGAGGAAAGGTGACATTAAATCCCGTGGTTTAGGACCGC
Sense oligo to introduce Arg in P1 position of HRV14 VP1 2Apro; AgeI, SacII sites
TIM1303 GGTCCTAAACCACGGGATTTAATGTCACCTTTCCTCTTCTTAATTA
Antisense oligo to introduce Arg in P1 position of HRV14 VP1 2Apro; AgeI, SacII
sites
TIM1304 CCGGTAATTAAGAAGAGGAAAGGTGACATTAAATCCTATGGTCCAGGACCGC
Sense oligo to introduce Leu in P2’ position of HRV14 VP1 2Apro; AgeI, SacII sites
TIM1305
TIM1315
GGTCCTGGACCATAGGATTTAATGTCACCTTTCCTCTTCTTAATTA
Antisense oligo to introduce Leu in P2’ position of HRV14 VP1 2Apro; AgeI, SacII
sites
CCGGTAATTAAGAAGAGGCGGACAACCCTTAGCACCTATGGGCCCCCACGGC
Sense oligo to introduce Tyr in P1 position of HRV14 VP1-(eIF4GI)- 2Apro; AgeI,
SacII sites
TIM1316 CGTGGGGGCCCATAGGTGCTAAGGGTTGTCCGCCTCTTCTTAATTA
Antisense oligo to introduce Tyr in P1 position of HRV14 VP1-(eIF4GI)- 2Apro;
AgeI, SacII sites
TIM1322 ATACAGGAAAGTCCGTACTATCCCAAA
Sense primer to introduce the mutation E84P in HRV2 2Apro

3. Materials and methods
35
Label Sequence and description (orientation 5’ to 3’)
TIM1323 TTTGGGATAGTACGGACTTTCCTGTAT
Antisense primer to introduce the mutation E84P in HRV2 2Apro
TIM1324 ATTGAAGGAAGCGAGTATTACCCAAGT
Sense primer to introduce the mutations N86S P87E in HRV14 2Apro
TIM1325 ACTTGGGTAATACTCGCTTCCTTCAAT
Antisense primer to introduce the mutations N86S P87E in HRV14 2Apro
TIM1327 CCGGTAATTAAGAAGAGGAAAGGTGACATTTCATCCTATGGTTTAGGACCGC
Sense oligo to introduce Ser in P3 position of HRV14 VP1 2Apro; AgeI, SacII sites
TIM1328 GGTCCTAAACCATAGGATGAAATGTCACCTTTCCTCTTCTTAATTA
Antisense oligo to introduce Ser in P3 position of HRV14 VP1 2Apro; AgeI, SacII
sites
TIM1329 ATTGAAGGAAACGAGTATTACCCAAGT
Sense primer to introduce the mutation P87E in HRV14 2Apro
TIM1330 ACTTGGGTAATACTCGTTTCCTTCAAT
Antisense primer to introduce the mutation P87E in HRV14 2Apro
TIM1331 CATGCCATGGGTTTAGGACCTAGGTACGG
Sense primer to introduce HRV14 2Apro in pET11d-TAPtag; NcoI site
TIM1332 CATGCCATGGCCTGTTCCTCTGCGATACA
Antisense primer to introduce HRV14 2Apro in pET11d-TAPtag; NcoI site
TIM1333 CATGCCATGGGCCCCAGTGACATGTATGT
Sense primer to introduce HRV2 2Apro in pET11d-TAPtag; NcoI site
TIM1334 CCATGCCATGGCTTGTTCTTCAGCACAATG
Antisense primer to introduce HRV2 2Apro in pET11d-TAPtag; NcoI site
TIM1336 CATGGGATCCATGTCCCCTATACTAGGT
Sense primer to introduce the GST tag plus PreScission cleavage site in the vector
pFastBac; BamHI site
TIM1337 CATGGAATTCGGGCCCCTGGAACAGAAC
Antisense primer to introduce the GST tag plus PreScission cleavage site in the
vector pFastBac; BamHI site
TIM1338 ATCTGGATTGAAGAAAACCCTTATTAC
Sense primer to introduce the mutation G85E in HRV14 2Apro
TIM1339 GTAATAAGGGTTTTCTTCAATCCAGAT
Antisense primer to introduce the mutation G85E in HRV14 2Apro
TIM1340 ATCTGGATTGAAGAAAGCGAGTATTAC
Sense primer to introduce the mutations G85E N86S P87E in HRV14 2Apro
TIM1341 GTAATACTCGCTTTCTTCAATCCAGAT
Antisense primer to introduce the mutations G85E N86S P87E in HRV14 2Apro

3. Materials and methods
36
Label Sequence and description (orientation 5’ to 3’)
TIM1342 TATGAAATACAGGGAAGTGAGTACTAT
Sense primer to introduce the mutation E82G in HRV2 2Apro
TIM1343 ATAGTACTCACTTCCCTGTATTTCATA
Antisense primer to introduce the mutation E82G in HRV2 2Apro
TIM1344 CCCCTCTCCACCAAAGATCTGACCACA
Sense primer to introduce the BglII restriction site upstream the PV1-VP1 2Apro
cleavage site; BglII site
TIM1345 TGTGGTCAGATCTTTGGTGGAGAGGGG
Antisense primer to introduce the BglII restriction site upstream the PV1-VP1 2Apro
cleavage site; BglII site
TIM1346
TIM1347
AACAAAGCGGTGTATACTGCAGGTTAC
Sense primer to introduce the BstZ17 I restriction site downstream the PV1-VP1
2Apro cleavage site; BstZ17 I site
GTAACCTGCAGTATACACCGCTTTGTT
Antisense primer to introduce the BstZ17 I restriction site downstream the PV1-
VP1 2Apro cleavage site; BstZ17 I site
TIM1348 GATCTGACCACACGTGGATTCGGACACCAAAACAAAGCGGTGTA
Sense oligo to introduce Arg in P1 position of PV1-VP1 2Apro; BglII, BstZ17 I sites
TIM1349 TACACCGCTTTGTTTTGGTGTCCGAATCCACGTGTGGTCA
Antisense oligo to introduce Arg in P1 position of PV1-VP1 2Apro; BglII, BstZ17 I
sites
TIM1353 GAATTCGCCATCACAGTCCAGAGA
Sense primer to introduce eIF4GII residues 445 to 744 in the vector pFastBac;
EcoRI site
TIM1354 GAATTCCTATTAATCGGCTTGGCTGTCTCG
Antisense primer to introduce eIF4GII residues 445 to 744 in the vector pFastBac;
EcoRI site
TIM1392 GGGGTTGGGCCGTGCGAGCCAGGAGAC
Sense primer to introduce the mutation A104C in HRV14 2Apro
TIM1393 GTCTCCTGGCTCGCACGGCCCAACCCC
Antisense primer to introduce the mutation A104C in HRV14 2Apro
TIM1394 GGGGTTGGGCCGTCAGAGCCAGGAGAC
Sense primer to introduce the mutation A104S in HRV14 2Apro
TIM1395 GTCTCCTGGCTCTGACGGCCCAACCCC
Antisense primer to introduce the mutation A104S in HRV14 2Apro
TIM1396 GGTGAGGGCCCTGCTGAACCAGGTGAC
Sense primer to introduce the mutation C101A in HRV2 2Apro

3. Materials and methods
37
Label Sequence and description (orientation 5’ to 3’)
TIM1397 GTCACCTGGTTCAGCAGGGCCCTCACC
Antisense primer to introduce the mutation C101A in HRV2 2Apro
TIM1398 GGTGAGGGCCCTAGTGAACCAGGTGAC
Sense primer to introduce the mutation C101S in HRV2 2Apro
TIM1399 GTCACCTGGTTCACTAGGGCCCTCACC
Antisense primer to introduce the mutation C101S in HRV2 2Apro
TIM1411 CTCGAGTCATTAGTGGTGGTGGTGGTGGTGCTGTTCCTCTGCGATACA
Antisense primer to introduce HRV14 2Apro plus a His tag in the vector pGEX-6P1;
XhoI site
TIM1472 GCGGAATTCTTTCATCCTGAAAGAGACC
Sense primer to introduce eIF4GII residues 552 to 744 in the vector pGEX-6P1;
EcoRI site
TIM1473 GCGGAATTCTCACTAATCATCGGCTTGGCTGTC
Antisense primer to introduce eIF4GII residues 552 to 744 in the vector pGEX-6P1;
EcoRI site
TIM1474 CACCGCTCGAGATGGGCCCCAGTGACATGTATG
Sense primer to introduce HRV2 2Apro in the vector pMZI; XhoI site
TIM1475 CGCGCACATATGTTGTTCTTCAGCACAATGG
Antisense primer to introduce HRV2 2Apro in the vector pMZI; NdeI site
TIM1476 CACCGCTCGAGATGGGTTTAGGACCTAGGTACG
Sense primer to introduce HRV14 2Apro in the vector pMZI; XhoI site
TIM1477 CGCGCACATATGCTGTTCCTCTGCGATACAC
Antisense primer to introduce HRV14 2Apro in the vector pMZI; NdeI site
TIM1492 GCGGAATTCTCACTAGTGGTGGTGGTGGTGGTGATCATCGGCTTGGCTGTC
Antisense primer to introduce eIF4GII residues 552 to 744 plus a His tag in the
vector pGEX-6P1; EcoRI site
TIM1518 GACCGCTCGAGATGGAATTCCACATGCCTCAGATCACT
Sense primer to introduce HIV 1 protease in the vector pMZI; XhoI, EcoRI sites
TIM1519 GCACATATGTCGAAGGATCCCAATTCCCAAGAAATT
Antisense primer to introduce HIV 1 protease in the vector pMZI; NdeI, BamHI
sites
TIM1520
TIM1521
GACCGCTCGAGATGGGCCCCTATGGACATCAATC
Sense primer to introduce CBV4 2Apro in the vector pMZI; XhoI site
CGCGCACATATGCTGTTCCATTGCATCATC
Antisense primer to introduce CBV4 2Apro in the vector pMZI; NdeI site
TIM1522 GACCGCTCGAGATGGAACTGACACTGTAC
Sense primer to introduce FMDV Lbpro in the vector pMZI; XhoI site

3. Materials and methods
38
Label Sequence and description (orientation 5’ to 3’)
TIM1523 CGCGCACATATGTTTGAGCTTGCGTTGAACC
Antisense primer to introduce FMDV Lbpro in the vector pMZI; NdeI site
TIM1532 CTTTAAATTTTTCGTCAATTGGGATCC
Sense primer to delete two stop codons in HIV 1 protease cloned in the vector
pMZI; MfeI, BamHI sites
TIM1533 GGATCCCAATTGACGAAAAATTTAAAG
Antisense primer to delete two stop codons in HIV 1 protease cloned in the vector
pMZI; MfeI, BamHI sites
TIM1544 CGCGCCATGGGATTTCATCCTGAAAGAGACC
Sense primer to introduce eIF4GII residues 552 to 744 in the vector pET11d; NcoI
site
TIM1545 GCGCCCATGGTCACTAGTGGTGGTGGTGGTGGTGATCATCGGCTTGGCTGTC
Antisense primer to introduce eIF4GII residues 552 to 744 plus a His tag in the
vector pET11d; NcoI site
TIM1546 CGCGCCATGGGTTTAGGACCTAGGTAC
Sense primer to introduce HRV14 2Apro in the vector pET11d; NcoI site
TIM1547 GCGGATCCTCACTAGTGGTGGTGGTGGTGGTGCTGTTCCTCTGCGATAC
Antisense primer to introduce HRV14 2Apro plus a His tag in the vector pET11d;
BamHI site
Table 5: List of primers used for cloning experiments.
3.3.9.2 Primers for sequencing
Label Sequence (orientation 5’ to 3’)
Target
TIM31 GTTTGCTGAATCAGG HRV14 VP1;
antisense
TIM69 CACATCAATAGGGCGCA HRV14 2Apro;
sense
TIM197 TCAATGCTTGAAGGAGC pGEX-6P1 and
pFastBac-GST
inserts; sense
TIM258 GAATTCGATCCCTTGTTCTTCAGCACA HRV2 2Apro;
antisense
TIM315 CCCACAAATTGATAAG pGEX-6P1 and
pFastBac-GST
inserts; sense

3. Materials and methods
39
Label Sequence (orientation 5’ to 3’)
Target
TIM326 GGAATTCTGGCCCCAGTGACATGTA HRV2 2Apro;
sense
TIM768 GAATCGGGATCCCTATCACTGTTCCTCTGCGATACACTC HRV14 2Apro;
antisense
TIM847 CCAGGAGACGCCGGTGGGATT HRV14 2Apro;
sense
TIM848 AATCCCACCGGCGTCTCCTGG HRV14 2Apro;
antisense
TIM967 ACCAGGTGACGCAGGTGGAAAGT HRV2 2Apro;
sense
TIM1109 TCTGAGATGCATGAATCTATTTTGGTATCTTATTCATCA HRV2 2Apro;
sense
TIM1312 ATACATCAAGGTTTAGTG HRV14 2Apro;
sense
TIM1331 CATGCCATGGGTTTAGGACCTAGGTACGG HRV14 2Apro;
sense
TIM1332
TIM1333
CATGCCATGGCCTGTTCCTCTGCGATACA
CATGCCATGGGCCCCAGTGACATGTATGT
HRV14 2Apro;
antisense
HRV2 2Apro;
sense
TIM1334 CATGCCATGGCTTGTTCTTCAGCACAATG HRV2 2Apro;
antisense
TIM1336 CATGGGATCCATGTCCCCTATACTAGGT
GST; sense
TIM1337 CATGGAATTCGGGCCCCTGGAACAGAAC
GST; antisense
TIM1346 AACAAAGCGGTGTATACTGCAGGTTAC
PV1 2Apro; sense
TIM1350 GACCAAGGTCACCTCCAA
PV1 2Apro; sense
TIM1351 TCCATGGCTTCTTCTTCG PV1 2Apro;
antisense
TIM1391 CTACAAATGTGGTATGGC pFastBac inserts;
antisense
TIM1518 GACCGCTCGAGATGGAATTCCACATGCCTCAGATCAC HIV 1 protease;
sense
TIM1519 GCACATATGTCGAAGGATCCCAATTCCCAAGAAATT
HIV 1 protease;
antisense

3. Materials and methods
40
Label Sequence (orientation 5’ to 3’)
Target
TIM1520 GACCGCTCGAGATGGGCCCCTATGGACATCAATC CBV4 2Apro;
sense
TIM1521 CGCGCACATATGCTGTTCCATTGCATCATC
CBV4 2Apro;
antisense
TIM1522 GACCGCTCGAGATGGAACTGACACTGTAC FMDV Lbpro;
sense
TIM1523 CGCGCACATATGTTTGAGCTTGCGTTGAACC
FMDV Lbpro;
antisense
M13(-40) GTTTTCCCAGTCACGAC Bacmid
(Invitrogen)
inserts; sense
M13 rev CAGGAAACAGCTATGAC Bacmid
(Invitrogen)
inserts; antisense
T7promoter TAATACGACTCACTATAGGG pET11d inserts;
sense
T7terminator GCTAGTTATTGCTCAGCGG pET11d inserts;
antisense
Table 6: List of primers used for sequencing.
3.4 RNA methods 3.4.1 In vitro transcription 2 to 5 µg of plasmid DNA were used to perform in vitro transcription experiments.
First, the plasmid DNA was cleaved with a restriction enzyme cleaving just downstream of
the protein coding sequence. Then, the linearized DNA was purified performing a
phenol/CHCl3 extraction followed by ethanol precipitation (see 3.3.4.1 and 3.3.4.2) and
resuspension in H2O. Finally, a typical transcription reaction composed of the cleaved
plasmid DNA, 5 mM DTT, 1x transcription buffer (40 mM Tris-HCl, pH 7.9, 10 mM NaCl, 6
mM MgCl2, 2mM spermidine) (Promega), 0.25 mM of all four NTPs (Amersham), 120 U
RNasin (Promega) and 18 U of T7 RNA Polymerase (Promega) was performed in a total
volume of 100 µl for 90 minutes at 37°C.
The template DNA was removed after the reaction by addition of 30 U DNase I
(Invitrogen) and 40 U RNasin (Promega) followed by an incubation of 20 min at 37°C. The
RNA was extracted with phenol/CHCl3 (see 3.3.4.1) and precipitated with 1/5 volumes of 8 M
NH4OAc and 2.5 volumes of absolute ethanol for a maximum of 15 minutes at -80°C. After

3. Materials and methods
41
centrifugation for 15 minutes at 14,000 rpm at 4°C (eppendorf centrifuge 5417 R), the RNA
pellet was washed with 500 µl 70 % ethanol and resuspended in 25 µl of H2O. The quality of
the RNA was checked on an agarose gel containing 0.1 % (w/v) SDS. Before staining the gel
with ethidium bromide (10 mg/ml stock solution 1:10,000 in 0.5x TAE), the SDS was
removed by shaking the gel in H2O for 30 to 60 minutes.
3.4.2 In vitro translation Translation reactions were performed at 30°C in a volume of 10 µl (or multiples of 10
µl, depending on how many aliquots needed to be taken at different time points) and
composed of 70% of Rabbit Reticulocyte Lysate (RRL) (Promega), 8 U of RNasin (40 U/µl,
Promega), 20 µM of amino acids mix without methionine (Promega), 4 µCi of [35S]-
Methionine (37 TBq/mmol, Hartmann Analytics) and 10 to 50 ng of RNA.
After pre-incubation for 2 minutes at 30°C, translation was started by addition of the
RNA. At different time points, aliquots were taken and the reaction was stopped by adding
1/10 volumes of 20 mM unlabelled cysteine/methionine in Laemmli sample buffer and
moving the samples to ice. In the experiments using the inhibitor zVAM.fmk, the inhibitor was
added 10 minutes after translation initiation. Negative controls were done with DMSO (the
solvent of zVAM.fmk) and without RNA.
Translation products were analysed by the polyacrylamide gel electrophoresis system
described by Dasso & Jackson (1989) and fluography (see 3.5.6.3 and 3.5.6.4) or by
Western Blot Analysis (see 3.5.7). The volumes loaded on the polyacrylamide gels were 2 µl
of a 10 µl reaction for the fluography and 3 µl of a 10 µl reaction for the Western Blot
Analysis.
3.5 Protein methods 3.5.1 Protein expression 3.5.1.1 Protein expression in LB and TB media
Expression of recombinant proteins was performed in E. coli BL21(DE3)LysS for pET
vectors or in E. coli JM101 for pGEX vectors. A single colony was grown in LB or TB media
containing the suitable antibiotics. The LB or TB media were inoculated 1:10 with the
overnight culture. The culture was incubated at 37°C on a shaker at 160 to 180 rpm. Once
the cell density reached an OD600 between 0.5 and 0.6, induction with the appropriate
concentration of IPTG (Isopropyl β-D-1-thiogalactopyranoside) was started depending on the
protein being expressed. The temperature was shifted to 20°C, 30°C or maintained at 37°C
(this was also protein specific) and the cells were incubated for several hours or overnight.

3. Materials and methods
42
Cells were harvested by centrifugation at 5000 rpm, 10 min, 4°C on Sorvall RC5C or RC5C
plus centrifuges. The cell pellets were snap-frozen in liquid nitrogen and stored at -80°C.
3.5.1.2 Protein expression in M9 minimal medium
Protein expression in M9 Minimal medium was performed in E. coli BL21(DE3)LysS.
A single colony was inoculated in M9 minimal medium containing the appropriate antibiotics.
The M9 minimal medium was inoculated with 1% of the pre-culture and incubated at 37°C on
a shaker at 160 rpm. Once the cell density reached an OD600 above 0.5, induction with 0.1
mM IPTG was started and the cells incubated for 5 hours shaking at 37°C. Cells were
harvested by centrifugation at 5000 rpm, 10 min, 4°C on Sorvall RC5C or RC5C plus
centrifuges. The cell pellets were snap-frozen in liquid nitrogen and stored at -80°C.
3.5.1.3 Protein expression in Sf9 cells
The protein expression in insect Sf9 cells was performed using the Bac-to-Bac®
Baculovirus Expression System from Invitrogen. The instructions of the manufacturer were
followed.
3.5.1.3.1 Transfection of Sf9 cells to generate a recombinant baculovirus
9x10⁵ Sf9 cells/well were seeded in a 6 well plate in 2ml of Sf-900 II SFM complete
media (containing 50 units/ml penicillin and 50 µg/ml streptomycin). The plate was incubated
at 27°C for 1 hour to allow the cells to attach. The transfection samples were prepared in 12
x 75 mm sterile tubes. 2 µg of purified bacmid were diluted in 100 µl of unsupplemented
Grace’s media and in other tube 6 µl of Cellfectin® Reagent (Invitrogen) were also diluted in
100 µl of unsupplemented Grace’s media. The diluted bacmid and Cellfectin® Reagent were
then combined, mixed gently and incubated for 45 minutes at room temperature. Meanwhile
the cells were washed two times with 2 ml of unsupplemented Grace’s media. After the
incubation, 0.8 ml of unsupplemented Grace’s media were added to the transfection mix and
this was added to the cells. An incubation period of 5 hours at 27°C followed, after which the
transfection mix was removed and 2 ml of complete growth media (Sf-900 II SFM media
containing 50 units/ml penicillin and 50 µg/ml streptomycin) were added to the cells. The
plate was incubated in a humidified incubator at 27°C for 72 hours (time at which the viral
infection was visible).
3.5.1.3.2 Preparation of the P1 viral stock and amplification
The media of the transfection was collected and transferred to a 15 ml falcon. After a
centrifugation at 800 rpm for 5 minutes at room temperature, the supernatant was transferred

3. Materials and methods
43
to a new falcon tube. This corresponds to the P1 viral stock. Short term storage was at 4°C
protected from light; long term storage was at -80°C, also protected from light.
The amplification of the viral stock was done as recommended by the manual Bac-to-
Bac® Baculovirus Expression System from Invitrogen. 2 x 10⁶ cells/ well were seeded in a 6
well plate in 2ml of Sf-900 II SFM complete media. The plate was incubated at 27°C for 1
hour to allow the cells to attach. 400 µl of the P1 viral stock were added to each well and the
plate was incubated at 27°C in a humidified chamber for 48 hours. The isolation of the viral
stock P2 was as for viral stock P1.
3.5.1.3.3 Virus titer determination using end-point dilution
5x10³ cells/well in Sf-900 II SFM complete media (100µl) were seeded in a 96 well
plate and incubated 1 hour at room temperature to allow the cells to attach. Dilutions of the
viral stock from 10-2 to 10-12 in Sf-900 II SFM complete media were prepared. 100 µl of each
dilution were added to the cells (12 wells per dilution). One row of 12 wells was not infected
and left for control. An incubation at 27°C in a humidified chamber followed for 6 to 10 days.
After that, the number of infected wells was counted. The wells considered infected
contained lysed cells and the wells non-infected contained a confluent layer of cells. The
method used to determine the virus titer was the one described by Reed and Muench (Reed
and Muench., 1938).
3.5.1.3.4 Expression of the recombinant protein
A time course experiment was done to determine the optimal level of expression.
6x10⁵ cells/well were seeded on a 24 well plate in Sf-900 II SFM complete media and
incubated 1 hour at room temperature to allow the cells to attach. The media was removed
and replaced with 300 ml of fresh one. The viral stock was added at a MOI (multiplicity of
infection) of 5 and the plate was incubated at 27°C in a humidified chamber. The
supernatants were harvested at the time points 24, 48, 72 and 96 hours. The samples were
boiled with ½ volumes of 2x Laemli sample buffer for 5 minutes and analyzed on SDS-PAGE
gels (see 3.5.6.1).
Once the conditions for expression were optimized the method was scaled up to
liquid cultures of 200 ml. The cells were transferred to 1 litre conical flasks at a concentration
of 2x10⁶ cell/ml in Sf-900 II SFM complete media and directly infected with the appropriate
amount of viral stock. The incubation was at 27°C in a humid chamber with constant rotation
at 120 rpm. After expression, the cells were harvested by centrifugation at 1200 rpm, 5
minutes at 4°C. The supernatant was then treated with glutathione sepharose beads in order
to purify the recombinant protein.

3. Materials and methods
44
3.5.2 Preparation of cell extracts 3.5.2.1 Bacterial crude cell extracts
The bacterial pellets stored at -80°C after expression were thawed on ice and
resuspended in 30 ml/litre of expression of the appropriate buffer. Cell disruption was
achieved by sonication using the device Homogenizer Sonopuls HD 200 from Bandelin. The
probe tip used was the MS 73D at a 40% cycle 4 times 30 seconds and one continuous cycle
for 30 seconds, on ice. The samples were centrifuged at 18,000 rpm in Sorvall RC5C or
RC5C plus centrifuges, for 30 minutes at 4°C. For small scale experiments the pellets were
resuspended in 1 to 1.5 ml of buffer and sonicated at a 20% cycle twice for 30 seconds and
one continuous cycle for 30 seconds, on ice. The centrifugation to separate the soluble
fraction (supernatant) from the unsoluble one (pellet), was done in an eppendorf centrifuge
5417R at 14,000 rpm for 30 minutes at 4°C.
The buffers used to ressuspend the bacterial pellets varied with the proteins being
purified. HRV2 2Apro, eIF4GII and eIF4E were resuspended in buffer A (50 mM Tris-HCl pH
8.0, 1 mM EDTA, 5 mM DTT, 5% glycerol, 50 mM NaCl). HRV14 2Apro was also
resuspended in buffer A, however at pH 9.0. In some experiments eIF4E was resuspended
in LCB buffer (20 mM Hepes pH 7.5, 0.2 mM EDTA, 100 mM KCl). All the proteins used in
GST pull down assays were taken up in ΔX buffer (150 mM NaCl, 10 mM EDTA, 50 mM Tris-
HCl pH 7.4).
3.5.2.2 HeLa S10 extracts
A 1 litre suspension culture (see 3.1.3.1) of HeLa Ohio Flow cells in logarithmic phase
(4 to 5x10⁵ cells/ml) was harvested at 1200 rpm, 10 min, 4oC (Beckmann J6-HC centrifuge).
Cells were then washed one time with 50 ml of ice cold 1x PBS and twice with 25 ml of ice
cold 1x PBS. After each wash, the cells were spun down at 1000 rpm for 8 minutes at 4°C on
a Heraeaus Megafuge 1.0R centrifuge. The pellet was taken in 1.5 volumes of hypotonic
lysis buffer (2 to 3 ml) (10 mM HEPES-KOH pH 7.2, 10 mM KOAc, 1.5 mM Mg(OAc)2, 2 mM
DTT) and left on ice for 10 minutes to allow the cells to swell. The lysis and homogenization
occurred by application of 250 to 300 strokes of a suitable Wheaton Dounce homogenizer.
The lysis was controlled by staining the cells with trypan blue and observing them at a light
microscope (more than 95% of the cells should be lysed). The cells were transferred to a 30
ml glass tube (Correx) and centrifuged at 4°C for 5 minutes at 3000 rpm to remove the cell
debris and nuclei. The speed was increased to 13,000 rpm for another 20 minutes in order to
separate the mitochondria. The centrifugation was done in a Sorvall RC5C plus centrifuge
with a Sorvall HB-4 rotor. The white lipid layers visible on the supernatant were removed.
The extract was dialysed for 3 hours (see 3.5.4.1) against 1 litre of dialysis buffer (10 mM

3. Materials and methods
45
HEPES-KOH pH 7.2, 90 mM KOAc, 1.5 mM Mg(OAc)2, 1 mM DTT), transferred to a clean 30
ml glass tube (Correx) and centrifuged at 13,000 rpm for 10 minutes at 4°C (Sorvall HB-4
rotor). After removing the lipid layer, aliquots of 380 µl were prepared, snap-frozen in liquid
nitrogen and stored at -80°C. The extract concentration was between 15 and 20 mg/ml.
3.5.3 Protein purification 3.5.3.1 Batch purification
3.5.3.1.1 binding to glutathione sepharose beads
An aliquot of 1 ml glutathione sepharose beads (Amersham Biosciences) per litre of
expression was washed three times with the appropriate buffer, mixed with bacterial extract
containing the GST fusion protein (see 3.5.2.1) and incubated for 4 hours to overnight at 4 °C
with rotation for binding. Unbound proteins to the beads were removed by washing the beads
3 times with the appropriate buffer. Beads with bound GST fusion proteins were stored as
50 % slurry in buffer at -80 °C. Aliquots were checked on an SDS- PAGE.
3.5.3.1.2 Cleavage with preScissionTM Protease
The cleavage of the fusion protein from the GST tag was done by incubation for 24
hours rotation at 4 °C with preScissionTM Protease (Amersham Biosciences, 1 U/100 µg
protein). Supernatants were separated by centrifugation at 1500 rpm for 1 minute at 4°C
(eppendorf centrifuge 5417R) and beads washed 3 times with buffer, keeping the
supernatants. The protein could then be purified by Size Exclusion Chromatography (see
3.5.3.2.3).
3.5.3.1.3 GST pull down
Glutathione sepharose beads coated with GST fusion proteins were incubated in ΔX
buffer (see 3.5.2.1) with 8 µl of RRL (Promega) for 2 hours at 4°C. After washing 3 times with
ΔX buffer the proteins were eluted by boiling in Laemmli sample buffer for 5 minutes. The
samples were resolved by electrophoresis and visualized by ECL detection of Western blot
membranes (see 3.5.7)
3.5.3.1.4 binding to m7GTP beads
eIF4E samples eluted from a Mono 10/10 column (see 3.5.3.2.2) were dialysed
against binding buffer (20 mM MOPS pH 7.6, 0.25 mM DTT, 0.1 mM EDTA, 50 mM NaF, 100
mM KCl) for 3 times for 1 hour at 4°C (see 3.5.4.1). After dialysis, the protein samples were
incubated with 100 µl of m7GTP beads (Amersham Biosciences) per 500 µl of sample,
overnight at 4°C with rotation. After washing the unbound proteins 3 times with binding

3. Materials and methods
46
buffer, the eIF4E was eluted by addition of 500 µl of elution buffer (20 mM MOPS pH 7.6,
0.25 mM DTT, 0.1 mM EDTA, 50 mM NaF, 550 mM KCl) and incubation for 3 hours at 4°C
with rotation. The centrifugations were done at 1500 rpm for 1 minute at 4°C on an eppendorf
centrifuge 5417R.
3.5.3.2 FPLC purification methods
Protein purification was performed based on size exclusion, affinity and anion
exchange, using the ÄKTA FPLC (Fast Protein Liquid Chromatography) system from
Amersham Biosciences. All the columns were purchased from Amersham Biosciences. 2 ml
fractions were collected using an automatic fraction collector connected to the ÄKTA FPLC
system. Purification experiments and cleaning of the columns were performed according to
the instructions of the manufacturer. Fractions were analysed by SDS-PAGE (see 3.5.6.1).
3.5.3.2.1 Affinity purification
Proteins bearing a His tag were purified using the HisTrap FF 1 ml affinity column.
Protein samples of 30 to 60 ml were loaded on the column and eluted with a gradient of
imidazole. The gradient program was as follows: 5 column volumes of 100% binding buffer
(50 mM Tris- HCl pH 8.0 or 9.0 (depending on the protein being purified), 50 mM NaCl), 20
column volumes of 0% to 100% of elution buffer (50 mM Tris- HCl pH 8.0 or 9.0 (depending
on the protein being purified), 50 mM NaCl, 500 mM imidazole) and 5 column volumes of
100% elution buffer.
3.5.3.2.2 Anion Exchange Chromatography
Proteins differing in electrostatic charge were separated via anion exchange
chromatography. Protein samples containing 5 to10 mg protein were loaded on a MonoQ
10/10 with a column volume of 8 ml. The proteins were eluted by using a gradient of NaCl.
The gradient program was as follows: 2.5 column volumes of 100% binding buffer (50 mM
Tris-HCl pH 8.0, 1 mM EDTA, 5 mM DTT, 5% glycerol, 50 mM NaCl), 2.5 column volumes of
0% to 20% of elution buffer (50 mM Tris-HCl pH 8.0, 1 mM EDTA, 5 mM DTT, 5% glycerol, 1
M NaCl), 15 column volumes of 20% to 60% of elution buffer, 2.5 column volumes of 60% to
100% of elution buffer and 2.5 column volumes of 100% elution buffer.
3.5.3.2.3 Size Exclusion Chromatography
Purification of proteins based on molecular weight differences was performed via size
exclusion chromatography. Sample volumes of 0.5 to 2 ml were loaded in a HiLoad 26/60
Superdex 75 prep grade column. The samples were separated by passing 1.2 column

3. Materials and methods
47
volumes of buffer A (50 mM Tris-HCl pH 8.0 or 9.0 (depending on the protein being purified),
1 mM EDTA, 5 mM DTT, 5% glycerol, 50 mM NaCl).
.
3.5.3.5 TAP purification
3.5.3.5.1 Strategy 1 (adapted from Rigaut G. et al. 1999)
The TAP (tandem affinity purification) method allows the purification of protein
complexes under native conditions, without prior knowledge of their composition, which are
then identified by mass spectroscopy (MS). This method is fast and can be used with a
relatively small number of cells. The TAP tag consists of two proteins, protein A of
Staphylococcus aureus (15.3 kDa) and a calmodulin binding peptide (CaBP, 3.0 kDa), which
are separated by the cleavage sequence recognized by the Tobacco Etch Virus (TEV)
protease (Rigaut et al., 1999).
The expression of the proteins of interest was done in BL21(DES3)LysS cells (see
3.5.1.1). The pellet of 1 litre expression was resuspended in 12 ml of buffer A (50 mM Tris-
HCl pH 8.0, 1 mM EDTA, 5 mM DTT, 5% glycerol, 50 mM NaCl) and sonicated (see 3.5.2.1).
The centrifugations to separate soluble from insoluble fractions were performed at 16,000
rpm for 35 minutes at 4°C. The supernatant (soluble fration), supplemented with 10 mM of
Tris-HCl pH 8.0, 150 mM of NaCl and 0.1% Igepal CA-630 (Sigma) (final concentrations),
was added to 600 µl of IgG sepharose beads (Amersham), previously washed 3 times with 2
ml of IPP150 buffer (10 mM Tris-HCl pH 8.0, 150 mM NaCl, 0.1% Igepal CA-630 (Sigma)).
The incubation was done at 4°C for 2 hours with rotation. After incubation the IgG sepharose
beads were spun down, the supernatant was removed and the beads were washed 3 times
with 2 ml of TEV cleavage buffer (10 mM Tris-HCl pH 8.0, 150 mM NaCl, 0.1% Igepal CA-
630 (Sigma), 0.5 mM EDTA, 1 mM DTT (added just before use)). The IgG sepharose beads
were then divided in two fresh tubes (approximately 300 µl of beads per tube), one for the
negative control (no incubation with HeLa S10 extracts) and one for incubation with the HeLa
S10 extracts. The positive controls were incubated with 50 mg of Hela S10 extracts for 2
hours at 4°C with rotation. After spinning down, the supernatant was removed and the beads
were washed 3 times with 2 ml of IPP150 buffer and 3 times with TEV cleavage buffer. 300
µl of TEV cleavage buffer plus 100 units of TEV protease (Invitrogen) were added to the IgG
sepharose beads and incubated overnight at 4°C with rotation. The IgG sepharose beads
were spun down and the supernatant was collected to a fresh tube, to which 1 volume of
IPP150 calmodulin binding buffer (10 mM β-mercaptoethanol, 10 mM Tris-HCl pH 8.0, 150
mM NaCl, 1 mM Mg-acetate, 1 mM imidazole, 2 mM CaCl2, 0.1% Igepal CA-630 (Sigma))
was added. The IgG sepharose beads were washed 3 times with 300 µl of IPP150
calmodulin binding buffer. The supernatants from the washing steps were added to the same
tube containing the first eluate. The final 1200 µl were added to 200 µl of calmodulin beads

3. Materials and methods
48
(Stratagen), previously washed with 3 times with 2 ml of IPP150 calmodulin binding buffer.
The mix was incubated at 4°C for 90 minutes with rotation. The beads were spun down, the
supernatant was removed and the beads were washed 3 times with 2 ml of calmodulin
binding buffer. The elution was performed with IPP150 calmodulin elution buffer (10 mM β-
mercaptoethanol, 10 mM Tris-HCl pH 8.0, 150 mM NaCl, 1 mM Mg-acetate, 1 mM imidazole,
2 mM EGTA, 0.1% Igepal CA-630 (Sigma)). 200 µl of elution buffer were added to the beads
and incubated 5 minutes at room temperature with agitation. The supernatant was collected
after the beads were spinned down. 5 different 200 µl fractions were eluted. All the
centrifugations to spin down beads were done at 1500 rpm for 1 minute at 4°C.
Protein precipitation
The precipitation procedure was as described by Ozols (1990). A solution of sodium
deoxicholate (20 mg/ml) was added to the samples to a final concentration of 150 µg/ml
followed by incubation at 4°C for 30 minutes with rotation. A 20% solution of trichloroacetic
acid (TCA) was added to a final concentration of 6% and the mix was incubated on ice for 1
hour. The sample was centrifuged at 2500 rpm at 4°C for 45 minutes. The supernatant was
removed and the pellet was ressuspended in 50 µl of 150 mM NaHCO3 pH 8.8; 43.8 mM
Tris-HCl pH 6.8 and 3% SDS. After protein quantification (see section 3.5.5) the samples
were sent for analysis by mass spectroscopy.
3.5.3.5.2 Strategy 2 (adapted from Anne–Claude Gingras 2003)
The genes of interest were cloned in the vector pMZI, which contains a TAP tag and
was constructed to transiently transfect human cells (Zeghouf et al., 2004). The expression
of the proteins was carried out using the Ecdysone-Inducible Mammalian Expression System
from Invitrogen. The cell line used for the experiments was the HEK 293T.
Transfection and protein expression
2x10⁶ cells/well were seeded in a 6 well plate in antibiotic-free media one day prior to
transfection. Cells were 80 to 90% confluent on the day of the transfection. 2 µg of the pMZI
vector carrying the gene of interest plus 2 µg of the vector pVgRXR from the expression
system (Invitrogen) were diluted in 250 µl of OptiMEM media (Gibco) at room temperature
and divided in 5 aliquots of 50 µl. 10 µl of lipofectamin 2000 (Invitrogen) were also diluted
and throughly mixed in 250 µl of OptiMEM medium and incubated at room temperature for 5
minutes. 50 µl of the lipofectamin 2000 solution were added to each aliquot of the tubes
containing the plasmid DNA. The final mix was incubated at room temperature for 20
minutes. Meanwhile, the cells were washed with 1 ml of 1x PBS and 1.5 ml of DMEM (Gibco)
supplemented with 2% FCS, antibiotic-free was added. The 5 aliquots of 100 µl containing

3. Materials and methods
49
lipofectamine and DNA were distributed equally over the well. The transfected cells were
incubated at 37°C in a humidified chamber for 4 hours. Then, the cells were trypsinized with
200 µl of trypsin/EDTA solution (Gibco) (see 3.1.3.1), neutralized by addition of 800 µl of
DMEM (Gibco) supplemented with 10% FCS, antibiotic-free and seeded in a 150 mm cell
culture dish. The cells were incubated overnight at 37°C in a humidified chamber in 30 ml of
DMEM (Gibco) supplemented with 10% FCS, antibiotic-free. On the next day, the media was
changed to DMEM (Gibco) supplemented with 10% FCS and 50 units/ml penicillin and 50
µg/ml streptomycin plus the desired concentration of ponasterone A (Invitrogen) to start the
induction of protein expression. Large scale experiments were induced for 48 hours.
Small scale experiments were performed in 6 well plates in which 200 µl of the
trypsinized transfected cells were used.
Protein purification
The cells were washed 3 times with 10 ml of 1x PBS and then were lysed in 1 ml of
lysis buffer (10% glycerol, 50 mM HEPES-KOH pH 8.0, 100 mM KCl, 2 mM EDTA, 0.1%
Igepal CA-630 (Sigma), 2 mM DTT, 1x sigma protease inhibitor, 10 mM NaF, 0.25 mM
NaOVO3, 5 nM calyculin A, 50 mM β-glycerolphosphate) for 30 minutes at 37°C and
harvested by scraping. To improve the protein recovery, two cycles of freeze and thaw in
liquid nitrogen intercalated with 37°C incubation were done. The cell debris was spun down
for 10 minutes at 14,000 rpm at 4°C. The supernatant was recovered and incubated, in
batch, with 100 µl of IgG sepharose beads (Amersham) (previously washed 3 times with 1 ml
of lysis buffer), at 4°C for 2 hours with rotation. The beads were spun down and the
supernatant removed. The beads were then washed 3 times with 1 ml of lysis buffer and 3
times with 1 ml of TEV buffer (10 mM Hepes-KOH pH 8.0, 150 mM NaCl, 0.1% Igepal CA-
630 (Sigma), 0.5 mM EDTA, 1 mM DTT). 300 µl of TEV buffer plus 100 units of TEV
protease (Invitrogen) were added to the IgG sepharose beads and incubated overnight at
4°C with rotation. Afterwards, the IgG sepharose beads were spun down and the supernatant
was transferred into a fresh tube to which 1 volume of calmodulin binding buffer (10 mM β-
mercaptoethanol, 10 mM Hepes-KOH pH 8.0, 150 mM NaCl, 1 mM MgOAd, 1 mM imidazole,
0.1% Igepal CA-630 (Sigma), 2 mM CaCl2) was added. The IgG sepharose beads were
washed 3 times with 300 µl of calmodulin binding buffer; the supernatants from the washing
steps were then added to the first supernatant. The final 1200 µl were added to 100 µl of
calmodulin beads (Stratagen) (previously washed 3 times with 1 ml of calmodulin binding
buffer). 1/250 volumes of 1M CaCl2 were added to the mix and incubated at 4°C for 90
minutes with rotation. The mix was spun down, the supernatant was removed and the
calmodulin beads were washed 2 times with calmodulin binding buffer and 3 times with
calmodulin rinsing buffer (50 mM NH4HCO3, 75 mM NaCl, 1 mM MgOAc, 1 mM imidazole, 2

3. Materials and methods
50
mM CaCl2). The protein elution was done by addition of 200 µl of calmodulin elution buffer
(50 mM NH4HCO3, 25 mM EGTA), followed by incubation at room temperature for 5 minutes
with agitation. The calmodulin beads were spun down and the supernatant recovered to a
fresh tube. The elution was repeated 4 times. The final eluates were frozen at -80°C until
protein quantification and mass spectroscopy analysis.
All the spin-down centrifugations were done at 4°C, 1500 rpm for 1 minute.
3.5.4 Buffer exchange and protein concentration 3.5.4.1 Dialysis
Dialysis was used for buffer changing. The protein solution was introduced into a bag
of a semi-permeable membrane made of cellulose acetate with a cut-off of 10 kDa prepared
as recommended by the manufacturer (Sigma). The sample was dialysed against the desired
buffer. A ratio of 100 times the volume of buffer compared to sample volume was used.
Dialysis was performed at 4°C in a beaker under slow stirring of the bag from 3 hours to
overnight. During the dialysis process the buffer was changed from 2 to 3 times.
3.5.4.2 Protein concentration
Amicon Ultra Centrifugal Filter Devices (Millipore) were used to concentrate protein
samples. The instructions of the manufacturers were followed. The centrifugations were
carried out at 4°C at maximum speed on a Megafuge 1.0R Hearaeus centrifuge for volumes
inferior to 4 ml and on an eppendorf centrifuge 5810R for volumes from 4 to 15 ml.
3.5.5 Protein quantification Quantification of proteins was performed with the kit BCA - Protein Assay Reagent A
from Pierce. The quantification was done following the microplate procedure provided with
the kit.
The Nanodrop spectrophotometer ND-1000 from Peqlab was also used to quantify
protein samples. The instructions of the manufacturer were followed.
3.5.6 SDS- Poly-Acrylamide Gel Electrophreis (SDS-PAGE) 3.5.6.1 SDS-PAGE (Laemmli, 1970)
SDS-Poly-Acrylamide Gel Electrophoresis (PAGE) was performed in Hoefer slab gel
units or in the mini-PROTEAN® 3 system from Biorad, assembled according to the
instructions of the manufacturers. The separating gel was poured, overlaid with 70% ethanol
and rinsed with H2O after polymerization. Afterwards, the stacking gel was prepared, the gel
unit assembled and the gel overlaid with 1 x running buffer (25 mM Tris base, 0.2 M Glycine,

3. Materials and methods
51
0.1 % (w/v) SDS). Protein samples mixed with Laemmli sample buffer (10 % (v/v) Glycerol, 5
% (v/v) β-Mercaptoethanol, 3 % (w/v) SDS, 62 mM Tris, 5 % (w/v) Bromophenol Blue, pH
adjusted to 6.8 with HCl) were denatured for 5 min (20 minutes in case of bacterial cultures
taken in 1x Laemmli sample buffer) at 95 °C and loaded onto the gel. Separation of protein
samples including a protein marker (Biorad prestained protein marker, 161-0373 (see
appendix B)) was performed at up to 20 mA in a power pac 300 from Biorad.
Acrylamide content 6 % 10 % 12.5 % 15 %
4x Lower Gel Buffer (ml) 1.5 1.5 1.5 1.5
30 % Acryl-/Bisacrylamide (ml) 1.2 2 2.5 3
H2O (ml) 3.3 2.5 2 1.5
10 % APS (µl) 36 36 36 36
TEMED (µl) 3.6 3.6 3.6 3.6
Table 7: Composition of Separating Gels (Laemmli, 1970). APS: Ammonium peroxidisulafte;
TEMED: N,N,N´,N´-Tetramethyl-ethylene diamine.
The lower gel buffer (LGB) is kept in stock 4x concentrated and contains 1.5 M Tris
base pH 8.8 and 0.4 % SDS. The upper gel buffer (UGB) is also kept in 4x concentarted
stocks and is composed of 0.5 M Tris base pH 6.8 and 0.4 % SDS.
The stoks of acrylamide/bisacrylamide are prepared by dissolving 29% acrylamide
(w/v) and 1% N,N´Methylene Bisacrylamide (w/v) in H2O, followed by filtration.
The stacking gel solution is prepared by adding 12.5 ml of UGB and 6.5 ml of 30%
acrylamide to 31 ml of H2O. For each gel, 2 ml of this solution are mixed with 12 µl 10 %
(w/v) APS and 4 µl TEMED before pouring.
3.5.6.2 SDS-PAGE Gradient gels
Gradient gels were prepared from two starting mixes containing 7% and 20%
bis/acrylamide. The solutions were combined gradually with the help of a mixer and pumped
into the gel units with Minipuls 2 pump from Gilson.
3.5.6.3 SDS-PAGE (Dasso and Jackson, 1989)
In order to better separate in vitro translation products, a protocol resulting in higher
resolution of proteins was used (Dasso and Jackson, 1989). Acrylamide and bisacrylamide
were prepared as separate solutions and only mixed directly before preparing the SDS-
PAGE. The composition of the separating gel was as listed in table 8.

3. Materials and methods
52
Acrylamide content 6 % 12.5 % 15 % 17.5 % 20 %
4x Lower Gel Buffer (ml) 1.5 1.5 1.5 1.5 1.5
30 % (w/v) Acrylamide (ml) 1.2 2.5 3 3.5 4
2.5 % (w/v) Bisacrylamide (ml) 0.209 0.209 0.209 0.209 0.209
H2O (ml) 3.06 1.8 1.26 0.758 0.261
10 % (w/v) APS (µl) 30 30 30 30 30
TEMED (µl) 3 3 3 3 3
Table 8: Composition of separating gels (Dasso & Jackson, 1989).
The stacking gel was composed of 333 µl 30 % (w/v) acrylamide, 104 µl 2.5 % (w/v)
bisacrylamide, 500 µl 4x UGB, 1.06 ml H2O, 20 µl 10 % (w/v) APS and 2 µl TEMED. When
the translation products were detected by radiolabelling and fluography (3.5.6.4); the [14C]-
labelled protein marker CFA626 from Amersham Biosciences was used (see appendix B).
3.5.6.4 Fluorography
[35S]-methionine labelled proteins were separated on SDS-PAGE. The gel was
washed twice for 15 minutes at room temperature with rotation in Enhancer solution (1M
sodium salicylate, 45% methanol) to increase the signal and lower the background. After
drying with vaccum on WhatmanTM 3MM paper, the gel was exposed to a KODAK BioMax
MR film overnight at -80°C.
3.5.6.5 Coomassie Staining of Polyacrylamide Gels
The gels were stained by incubation for 1 hour in commassie staining buffer (0.4 %
(w/v) Biorad Commassie Brilliant Blue R250, 45 % (v/v) methanol, 10 % (v/v) acetic acid,
filter before use) and destained by exchanging the staining buffer by water and boiling the gel
for several times in the microwave. Gels were vacuum-dried (Slab Gel Dryer SGD 4050,
Savant) on WhatmanTM 3MM paper for 1 hour at 80°C.
3.5.6.6 Silver Staining of Polyacrylamide Gels
In order to obtain higher detection sensitivity, proteins were visualized by silver
staining. Proteins were fixed by incubating the gels for 1 hr in fixing solution (50 % methanol,
12 % acetic acid, 0.05 % formaldehyde). Subsequently, the gels were washed three times for
20 minutes with 50 % ethanol. For sensitization, gels were placed in 0.02 % Na2S2O3 for 1
minute and washed three times 20 seconds with H2O. The gels were then incubated with
staining solution (0.2 % AgNO3, 0.075 % formaldehyde) for 20 minutes and washed twice for

3. Materials and methods
53
20 seconds with H2O. Proteins were developed with developing solution (6% Na2CO3,
0.0004% Na2S2O3.5H2O, 0.05% formaldehyde) for 10 minutes or until the protein bands
became visible. Washing was done twice for 2 minutes with H2O. The development was
stopped by incubation with stopping solution (50 % methanol, 12 % acetic acid) for 10 min
and the final washing was performed in 50% methanol for 20 minutes.
3.5.7 Western blot analysis For western blot analysis, protein samples and prestained protein marker (Biorad
prestained protein marker, 161-0373 (see appendix B)) were separated on SDS-PAGE. The
proteins were then transferred onto a membrane. For that, ImmobilonTM-P Transfer
Membrane (Millipore) was pre-soaked in methanol and placed together with 4 pieces of
WhatmanTM 3MM paper and 2 pads in the plastic support (Biocom). The transfer was
performed in the omniPAGE Blot mini (Biocom) filled with transfer buffer (1 % (w/v) glycine,
20 % (v/v) methanol, 25 mM Tris base pH 8.8) for 2 hrs at 400 mA. The transfer efficiency
was verified by staining the membrane with Ponceau S solution (Sigma) and washing with
H2O.
The immunoblot analysis was started by saturating the non-specific binding sites via
incubation with blocking buffer (0.2 % Tween 20, 0.2 % I-Block (Tropix)
in 1x PBS) for 30 minutes shaking. Subsequently, the membrane was incubated with the
primary antibody for 1 hour or overnight (in presence of 0.002% NaN3) at 4°C with rotation,
followed by three times washing for 10 minutes in 1x PBS/T (1.4 mM KH2PO4, 2.7 mM KC,
4.3 mM Na2HPO4, 137 mM NaCl, 0.1% Tween 20). Incubation with the secondary antibody
followed for 1 hour at 4°C with rotation.
For detection of alkaline phosphatase (AP) conjugated secondary antibodies, the
membrane was washed with tap water and incubated with 5 ml alkaline phosphatase buffer
(5 mM MgCl2, 100 mM NaCl, 100 mM Tris-HCl pH 9.6) supplemented with 25 µl NBT (Nitro
blue tetrazolium) (5 % (w/v) in 90 % dimethylformamide) and 25 µl BCIP (2.5 % (w/v) 5-
bromo-4-chloro-3-indolyl phosphate disodium salt, Sigma) until the proteins were visible (1 to
2 minutes). The colour reaction was stopped with H2O.
For horseradish peroxidase conjugated (HRP) antibodies, the detection was
performed with the Super Signal® West Pico chemiluminescent substrate kit from Pierce.
After incubation with the secondary antibody the membrane was washed three times 10
minutes with 1x PBS/T and 2 times 10 minutes with 1x PBS and covered with a 1:1 mix of
solutions of the detection kit for 5 minutes. The solution was removed and the membrane
was wrapped in SaranWrap and exposed to an autoradiography film (CL-X Posuse™ Film,
Pierce).

3. Materials and methods
54
Primary antibodies
Dilution
rabbit anti eIF4GI (N-terminal, antiserum, gift from
R. Rhoads, Shreveport, LA)
1:8000
rabbit anti β-actin (polyclonal, Sigma) 1:200
rabbit anti PABP (polyclonal, gift from Luiza
Deszcz, MFPL)
1:1000
mouse anti eIF1α (polyclonal, gift from J.
Pelletier, McGill Uni., Montreal)
1:2000
rabbit anti HRV2 2Apro (antiserum, gift from
Andrea Reischl, MedUni Vienna)
1:1000
goat anti GST (polyclonal, GE Healthcare) 1:10,000
Table 9: List of primary antibodies used in this work.
Secondary antibodies
dilution
His Probe™ HRP conjugated (Pierce) 1:10,000
anti rabbit HRP conjugated (Jackson) 1:20,000
anti goat HRP conjugated (Jackson) 1:20,000
anti rabbit AP conjugated (Sigma) 1:5000
anti mouse AP conjugated (Biorad) 1:10,000
Table 10: List of secondary antibodies used in this work.
3.5.8 Maldi-Tof Mass Spectroscopy analysis Maldi-TOF MS (Matrix assisted laser desorption ionization time of flight mass
spectrometry) allows the identification of proteins that are separated by SDS-PAGE (see
3.5.6.1) and e.g. silverstained (see 3.5.6.6) and digested enzymatically, preferentially with
trypsin. The peptide masses from the enzymatic digest are then compared to theoretical
mass values in the databases by using the Mascot and Peptide Search softwares. The
measurements were done at the Mass Spectrometry Facility of Max F. Perutz Laboratories
headed by Professor Gustav Ammerer.

3. Materials and methods
55
3.5.9 NMR (Nuclear Magnetic Resonance) NMR is a method used to determine the structure of a protein in solution and
investigate protein dynamics. The influence of a ligand on protein structure and/or dynamics
can be measured in the absence or presence of for example a substrate. The measurements
were done by Dr. Georg Kontaxis at the Computational and Structural Biology department of
Max F. Perutz Laboratories.
3.5.10 Determination of protein melting point Protein stability can be measured by determination of its melting temperature, which
is defined as the temperature at which the protein denatures. When a protein is heated
above its characteristic thermal stability point (protein melting point) significant unfolding
leads to exposed hydrophobic chains. This phenomenon can be measured by addition of a
specific dye which is non-fluorescent in a hydrophilic environment and fluorescent in a
hydrophobic environment (Yeh et al., 2006). The protein is mixed with the dye and the
temperature of the mix is increased constantly. When the protein reaches the melting point, it
starts to unfold and consequently exposes the hydrophobic residues, which trigger the dye to
emit fluorescence allowing the determination of the melting temperature easily.
The purified proteins were mixed with the SYPRO Orange dye (Invitrogen) in several
dilutions, from 0.1 to 1 mg of protein mixed with 1x to 150x concentrated dye (see table 11).
The dilutions were made to find the optimal ratio Protein/dye. The melting temperature was
measured in a real-time PCR machine (Biorad) using a single cycle from 20°C to 95°C, in
which the temperature was increased 1°C each 30 seconds.
Protein (mg) SYPRO Orange dye (x times concentrated)
0,1 10x 5x 1x
0,2 30x 15x 5x
0,3 50x 30x 10x
0,5 150x 100x 50x
1 150x 100x 50x
Table 11: Dilutions of protein/SYPRO Orange dye for protein melting point detection.

3. Materials and methods
56
3.5.11 Enzymatic reactions of proteins To measure the cleavage of β-actin and eIF1α by HRV2 and HRV14 2Apro, 8µl of RRL
(promega) or 50 mg of HeLa cell extracts (see 3.5.2.2) were incubated with 100 ng of HRV2
and HRV14 2Apro at 30°C (overnight with the HeLa extracts and 2 hours with the RRLs) in
buffer A (50 mM Tris-HCl pH 8.0 , 50 mM NaCl, 1 mM EDTA, 5 mM DTT, 5% glycerol). the
total volume was 10 µl. The reaction was stopped by placing the sample on ice and adding
10 µl of 2x Laemmli sample buffer. Controls were made with non-incubated samples and
incubation with buffer only. The samples were then analyzed by SDS-PAGE (3.5.6.1),
followed by immunoblotting using the appropriate antibody (3.5.7).

4. Results
57
4 Results
4.1 Specificity of HRV 2A proteinases The 2Apro used in this work are from HRV2, which belongs to the genetic group A and
enters the cell via LDL receptor; and HRV14, a member of the genetic group B which binds
to ICAM-I. Our work was focused on investigating the substrate specificity of the 2Apro of
these two viruses.
4.1.1 Polyprotein and eIF4GI processing HRV2 and HRV14 2Apro share only 40% identity at the amino acid level. The kinetics
of both proteins for self cleavage is very similar. For HRV2 2Apro in the rabbit reticulocyte
lysate (RRL), 50% of the self-cleavage of VP1-2Apro is complete at 20 minutes and the
complete cleavage is achieved between 60 and 120 minutes (figure 15A). HRV14 2Apro
reaches 50% cleavage at 30 minutes and finishes self-processing between the first and
second hours as HRV2 2Apro (figure 15B).
Figure 15: Fluorography of a 17.5% SDS-PAGE showing an in vitro translation experiment. A) HRV2 VP1-2Apro wild-type; B) HRV14 VP1-2Apro wild-type. RRLs were incubated with or without 10
ng/µl of the indicated mRNAs as described in section 3.4.2. 10 µl samples were taken at the indicated
time points after mRNA addition and protein synthesis was terminated by addition of unlabeled
methionine and cysteine and Laemmli Sample Buffer. Aliquots were analyzed on SDS-PAGE for
protein synthesis and thus self-processing of 2Apro. Lane 9 corresponds to the negative control
(without RNA) taken at the latest time point.
RRLs contain the eIF4GI and II, which are cleaved by 2Apro. Therefore, we can
observe eIF4GI cleavage by 2Apro by simply analysing the extracts where the proteinases
were translated via western blot against eIF4GI. In contrast with self cleavage, we observed

4. Results
58
that the cleavage of eIF4GI does not occur at similar rates for HRV2 and HRV14 2Apro. HRV2
2Apro cleaves the translation factor during the first hour whilst HRV14 2Apro cleavage is only
observed after two hours and is not complete after five hours. Figure 16 shows an
immunoblot against eIF4GI of the same samples of figure 15.
Figure 16: Immunoblot of 6% SDS-PAGE of the samples from figure 15 showing cleavage of eIF4GI by A) HRV2 VP1-2Apro and B) HRV14 VP1-2Apro. The proteins were detected by
immunoblotting using the eIF4GI N-terminal antiserum (1:8000).
We compared the HRV2 and HRV14 2Apro cleavage sites with the eIF4GI cleavage
site recognized by HRV2 2Apro. The cleavage sites of HRV2 and HRV14 are shown in table
12. The HRV14 2Apro cleavage sites of eIF4GI and II have not been determined yet.
However, CV and PV cleave eIF4GI at the same sequence as HRV2 2Apro (Lamphear et al.,
1993; Zamora et al., 2002). This supports the possibility that HRV14 2Apro recognizes the
same sequence on eIF4GI. In order to determine whether the eIF4GI cleavage site can be
recognized in the context of the polyprotein, we substituted the cleavage sequence on the
polyprotein by the sequence recognized by HRV2 2Apro in eIF4GI. The result is presented in
figure 17. HRV2 2Apro self-processing of the new cleavage site is slower than that of the wild
type, but the eIF4GI cleavage sequence is well tolerated in the polyprotein context (figure
17A). However, HRV14 2Apro is not able to recognize this sequence in the same context. The
first indications of cleavage could only be observed 180 minutes after translation initiation
(figure 17B).

4. Results
59
Substrate
Cleavage sites
P * P’
54321 1234
HRV 2 polyprotein IITTA (850) * GPSD
HRV14 polyprotein DIKSY (856) * GLGP
PV1 polyprotein DLTTY (881) * GFGH
eIF4GI TLSTR (681) * GPPR
eIF4GII PLLNV (699) * GSRR
Table 12: 2Apro cleavage sites on the respective polyproteins and eIF4G homologues. The viral
polyprotein sequences represent the C terminus of VP1 and the N terminus of 2Apro, respectively.
Numbers in bold indicate the positions of amino acid residues relative to the cleavage site. The
numbers in brackets refer to the P1 residue in the polyproteins and eIF4G isoforms. The cleavage
sites on eIF4G isoforms are the ones recognized by HRV2 2Apro (Gradi et al., 2003).
Figure 17: Fluorography of a 17.5% SDS-PAGE showing the processing of HRV2 and HRV14 VP1-2Apro bearing the eIF4GI cleavage site. A) HRV2 VP1-(eIF4GI)-2Apro; B) HRV14 VP1-(eIF4GI)-
2Apro. RRLs were incubated with or without 10 ng/µl of the indicated mRNAs as described in section
3.4.2. Samples were taken at the indicated time points after mRNA addition and protein synthesis was
terminated by addition of unlabeled methionine and cysteine and Laemmli Sample Buffer. Aliquots
were analyzed on SDS-PAGE for protein synthesis and thus self-processing of 2Apro. Lane 9
correspond to the negative control (without RNA) taken at the latest time point.
After observing such a different result for the two proteinases, we wanted to know in
more detail which residues are responsible for such a difference. The cleavage sequences of
HRV14 2Apro and eIF4GI differ significantly at the positions P3 (serine instead of lysine), P1
(arginine instead of tyrosine) and P2’ to P4’ (ProProArg instead of LeuGlyPro) (the
nomenclature Pn-P1-P1’-Pn’ is that of Schechter and Berger 1967). To find out which of
these substitutions were responsible for the absence of cleavage, we decided to change the

4. Results
60
eIF4GI cleavage sequence back to the HRV14 wild type by introducing one residue at the
time. As the P1 position is known to be important in defining specificity in chymotrypsin-like
enzymes (Brändén and Tooze, 1999), we chose to start by replacing the P1 arginine with
tyrosine (figure 18). Indeed this substitution was sufficient to restore HRV14 2Apro self-
cleavage to almost wild type levels.
Figure 18: Fluorography of a 17.5% SDS-PAGE showing the processing of HRV14 VP1-2Apro bearing the eIF4GI cleavage site in which the P1 residue arginine was substituted by tyrosine. RRLs were incubated with or without 10 ng/µl of the indicated mRNAs as described in section 3.4.2.
Samples were taken at the indicated time points after mRNA addition and protein synthesis was
terminated by addition of unlabeled methionine and cysteine and Laemmli Sample Buffer. Aliquots
were analyzed for protein synthesis by SDS-PAGE and thus self-processing of 2Apro. Lane 8
correspond to the negative control (without RNA) taken at the latest time point.
To see whether the tyrosine at P1 position is also crucial for recognition of the
cleavage site in the wild type sequence, we performed the reverse experiment. Replacing the
wild type tyrosine by an arginine gave us the construct HRV14 VP1 (Y289R) 2Apro. Figure
19A shows that the HRV14 2Apro can no longer perform self-cleavage, even after 7 hours of
translation. However, some non-specific protein degradation is observed after 2 hours. As
controls, we used the constructs HRV14 VP1 (K287S) 2Apro and HRV14 VP1 2Apro L2P
which contain a serine at P3 position and a proline at P2’ position respectively (as in the
eIF4GI cleavage sequence). These mutations do not affect HRV14 2Apro performance
whatsoever (figure 19B and 19C). The band seen at 30 kDa visible in figures 19B and 19C is
an unspecific product formed by the RRL itself as it is present also in the negative control. In
conclusion, these results show that HRV2 and HRV14 2Apro differ markedly in their specificity
at P1. HRV2 2Apro can accept arginine at P1 whereas HRV14 2Apro cannot.

4. Results
61
Figure 19: Fluorography of a 17.5% SDS-PAGE showing processing of HRV14 VP1-2Apro containing several substitutions at the cleavage site. A) HRV14 VP1 (Y289R) 2Apro; B) HRV14
VP1 (K287S) 2Apro C) HRV14 VP1 2Apro L2P. RRLs were incubated with or without 10 ng/µl of the
indicated mRNAs as described in section 3.4.2. 10 µl samples were taken at the indicated time points
after mRNA addition and protein synthesis terminated by addition of unlabeled methionine and
cysteine and Laemmli Sample Buffer. Aliquots were analyzed for protein synthesis by SDS-PAGE and
thus self-processing of 2Apro. Lanes 7 and 8 in panel A are the negative control at 60 and 420 minutes
respectively. Lanes 8 and 6 in panel B and C respectively correspond to the negative control (without
RNA) taken at the latest time points.
The HRV14 genome is more similar to enteroviruses than to other rhinoviruses
(Wang et al., 1998) and the cleavage site of HRV14 2Apro on the polyprotein is more related
to PV than to other rhinoviruses (table 12). The amino acid identity between the HRV14 2Apro
and PV1 is 47% (figure 20); the residue at position P1 is tyrosine for both proteinases (table
12). For these reasons, we decided to replace the P1 tyrosine on PV1 cleavage site by an
arginine and see whether the PV1 2Apro is affected as HRV14 2Apro. The pCITE PV1 VP1
2Apro (constructed by Andreas Roetzer (Roetzer, 2004)) was modified into pCITE PV1 VP1
(Y302R) 2Apro. Figure 21 shows that the presence of an arginine at P1 site slightly delays
PV1 2Apro self-processing. 50% cleavage of the wild type substrate is reached between 30

4. Results
62
and 60 minutes, whilst for the mutant it happens between 60 and 120 minutes. In conclusion,
PV1 2Apro self-processing differs from that of HRV14 2Apro.
Figure 20: Sequence alignment between HRV14 2Apro and PV1 2Apro. HRV 14 2Apro shares 47%
with PV1 2Apro. Conserved residues are represented in blue.
Figure 21: Fluorography of a 17.5% SDS-PAGE showing the processing of PV1 VP1-2Apro wild type (A) and a mutant containing an arginine at P1 site (B). A) PV1 VP1 2Apro wild type; B) PV1
VP1 (Y302R) 2Apro. RRLs were incubated with or without 10 ng/µl of the indicated mRNAs as
described in section 3.4.2. Samples were taken at the indicated time points after mRNA addition and
protein synthesis terminated by addition of unlabeled methionine and cysteine and Laemmli Sample
Buffer. Aliquots were analyzed for protein synthesis by SDS-PAGE and thus self-processing of 2Apro.
Lanes 9 correspond to the negative control (without RNA) taken at the latest time point.
After these observations, we used the structure of HRV2 2Apro solved by Petersen et
al. (1999) to look for non-conserved regions that might be important for the interaction
between the active site of the proteinase and the substrate. One of these regions is formed
by the residues 82 to 85 (85 to 88 in HRV14 2Apro) which form one side of the substrate-
binding cleft (Petersen et al., 1999). These residues are part of a β-hairpin loop named the
dityrosine flap that rotates and allows the proteinase to accommodate the P2 threonine in
HRV2 2Apro (Petersen et al., 1999). We thought that this might be an important region as it is

4. Results
63
in close contact with the substrate and is not conserved between HRV2 and HRV14. The
replacement of these residues on the HRV14 2Apro that contains an arginine at P1 by the
equivalent residues of HRV2 2Apro did not have any effect on the recognition of the substrate
(figure 22, A to D). HRV14 2Apro is still unable to recognize the cleavage sequence and all
the material remains unprocessed. The opposite experiment replacing the residues 82 to 85
on HRV2 2Apro, bearing the eIF4GI cleavage sequence, by the corresponding residues of
HRV14 2Apro also did not have any effect on the performance of the HRV2 2Apro (figure 22, E
and F).
Figure 22: Fluorography of a 17.5% SDS-PAGE showing the processing of HRV14 and HRV2 VP1-2Apro bearing several mutations on the 2Apro sequence. A) HRV14 VP1 (Y289R) 2Apro P87E; B) HRV14 VP1 (Y289R) 2Apro N86S P87E; C) HRV14 VP1 (Y289R) 2Apro G85E; D) HRV14 VP1
(Y289R) 2Apro G85E N86S P87E; E) HRV2 VP1-(eIF4GI)-2Apro E84P; F) HRV2 VP1-(eIF4GI)-2Apro
E82G. RRLs were incubated with or without 10 ng/µl of the indicated mRNAs as described in section

4. Results
64
3.4.2. Samples were taken at the indicated time points after mRNA addition and protein synthesis
terminated by addition of unlabeled methionine and cysteine and Laemmli Sample Buffer. Aliquots
were analyzed for protein synthesis by SDS-PAGE and thus self-processing of 2Apro. Lanes 9
correspond to the negative control (without RNA) taken at the latest time point.
Further analysis of HRV2 2Apro structure showed that the side chain of Cys101
protrudes into the S1 pocket (figure 23). This is the site on the enzyme that recognizes the
P1 substrate residue. At the bottom of the pocket, the presence of Glu102 provides a
negative charge which presumably assists in accepting the positive charge of the arginine at
position P1 (Petersen et al., 1999) (figure 23). The equivalent residues to Cys101 and
Glu102 in HRV14 2Apro are Ala104 and Glu105, respectively. Therefore, we wanted to know
whether the replacement of the Ala104 for a cysteine would influence the performance of
HRV14 VP1 (Y289R) 2Apro.
Figure 23: The structure of HRV2 2Apro. Ribbon diagrams of the overall structure of HRV2 2Apro. The
single α-helix is shown in green, the β-strands of the N-terminal and C-terminal domains are shown in
silver and deep blue, respectively. The three residues of the catalytic triad (His18, Asp35 and Cys106)
are shown as well as the residues Cys101 and Glu102. Residues 82 to 85 are marked with a black
rectangle.The figure was generated using the program Molscript (Kraulis, 1991) and was a kindly
prepared by Christina Mayer.
We obtained further support for investigating this residue by analysing 2Apro sequences of
other picornaviruses. This revealed that the residue at position 101 (for HRV2 2Apro) is
related to the residue at the P1 site (table 13). Group A rhinoviruses contain an alanine,
phenylalanine or valine at the P1 site and always a cysteine at position 101. Group B
rhinoviruses and all three serotypes of polioviruses have a tyrosine at the P1 site and an
alanine at position 104 (correspondent to 101 in HRV2 2Apro). Finally coxsackie B1, B3, B4,

4. Results
65
B5 and B6 viruses contain a threonine at the P1 site and a serine at position correspondent
to 101 in HRV2 2Apro (table 13).
Table 13: Occupancy of the P1 residue of the 2Apro cleavage site and residue 101 or its equivalent of 2Apro. The numbers refer to the residue position on the 2Apro. The P1 or equivalent
residues are shown in bold face. The active site residue cysteine (residue 106 in HRV2 2Apro) is
underlined. The sequence identifiers are: POLG_HRV2; POLG_HRV89; POLG_HRV14;
POLG_POL1M AND POLG_CXB4J (Sousa et al., 2006).
In the light of these relationships, we also decided to replace the Ala104 in HRV14 2Apro by
serine. Indeed the activity of HRV14 2Apro is partially recovered in both mutants (figure 24).
The cleavage product is observed after 1 hour of translation, in contrast with the wild type
alanine at position 104, in which no cleavage product is observed even after 7 hours of
translation (figure 19A). The mutant with a serine at residue 104 is more efficient than the
mutant bearing a cysteine at the same position (compare figure 24A with figure 24B).

4. Results
66
Figure 24: Fluorography of a 17.5% SDS-PAGE showing the processing of HRV14 VP1-2Apro containing an arginine at the P1 site and a mutation in position 104. A) HRV14 VP1 (Y289R)
2Apro A104C; B) HRV14 VP1 (Y289R) 2Apro A104S. RRLs were incubated with or without 10 ng/µl of
the indicated mRNAs as described in section 3.4.2. 10 µl samples were taken at the indicated time
points after mRNA addition and protein synthesis terminated by addition of unlabeled methionine and
cysteine and Laemmli Sample Buffer. Aliquots were analyzed for protein synthesis by SDS-PAGE and
thus self-processing of 2Apro. Lanes 9 correspond to the negative control (without RNA) taken at the
latest time point.
In an additional experiment we wanted to investigate whether the change from a
cysteine to an alanine (and serine, like in CBV4) in position 101 (equivalent residue to 104 in
HRV14 2Apro) in HRV2 2Apro would also affect self-processing. Figure 25 shows that the
processing of HRV2 VP1 2Apro C101A and HRV2 VP1 2Apro C101S are not affected by these
mutations. The activity of HRV2 2Apro remains at wild type levels. It seems that the residue at
this position is important for the acceptance of bulky residues at the P1 site but not when the
P1 residue has a small side chain such as alanine.
Figure 25: Fluorography of a 17.5% SDS-PAGE showing the processing of HRV2 VP1-2Apro containing a mutation in position 101. A) HRV2 VP1 2Apro C101A; B) HRV2 VP1 2Apro C101S.
RRLs were incubated with or without 10 ng/µl of the indicated mRNAs as described in section 3.4.2.
Samples were taken at the indicated time points after mRNA addition and protein synthesis terminated
by addition of unlabeled methionine and cysteine and Laemmli Sample Buffer. Aliquots were analyzed
for protein synthesis by SDS-PAGE and thus self-processing of 2Apro. Lanes 9 correspond to the
negative control (without RNA) taken at the latest time point.
4.1.2 Specific inhibition of 2Apro by zVAD.fmk and zVAM.fmk Recently, Deszcz et al. (2004) showed that human rhinoviruses are inhibited by the
caspase inhibitor zVAD.fmk, which was developed to inhibit caspases (fmk binds to SH
groups of an adjacent cysteine residue causing irreversible inhibition) (Deszcz et al., 2004).

4. Results
67
The inhibitor is methylated on the aspartic acid residue so that it can cross the cell
membrane. Once inside the cell, endogenous esterases remove the methyl group, allowing
the compound to inhibit caspases. Rhinoviral replication is blocked due to specific inhibition
of the 2Apro by the methylated form of zVAD.fmk. The methyl group satisfies the preference
of HRV2 2Apro for hydrophobic residues at P1. As the aspartic acid is not accepted at this
position by HRV 2Apro, the unmethylated form of zVAD.fmk has no inhibitory effect.
Based on these observations, Deszcz et al. (2006) designed a new inhibitor derived
from zVAD.fmk. The aspartate was replaced by a methionine, which had been shown to be a
better substrate than alanine for HRV2 2Apro (Skern et al., 1991). The new compound was
named zVAM.fmk and has no influence on caspase inhibition. Therefore, zVAM.fmk is a
specific inhibitor of HRV 2A proteinases (Deszcz et al., 2006). It inhibits 2Apro from several
rhinoviruses (HRV2, HRV14 and HRV16) both in vivo and in vitro as well as CVB4 in vitro.
We wanted to know whether this inhibitor is also effective against PV in vitro.
Therefore, we used the pCITE vector containing the sequence of VP1 and 2Apro of PV1
(construct from Andreas Roetzer (Roetzer, 2004)) to obtain the RNA. This RNA was in vitro
translated in presence and absence of zVAM.fmk. In a initial time course experiment of 1
hour, we tried to inhibit PV1 2Apro by adding 50 µM of zVAM.fmk. The inhibitor was added 10
minutes after translation initiation; control reaction mixtures contained DMSO only, as
zVAM.fmk is dissolved in DMSO. This concentration was shown to inhibit HRV14 2Apro
(Deszcz et al., 2006); however, it has no effect on PV1 2Apro (figure 26A). Therefore, we
raised the concentration of zVAM.fmk to 100 µM and 200 µM. Once again zVAM.fmk was
added 10 minutes after initiation of protein synthesis. Figure 26B shows that zVAM.fmk has
no effect in the self-processing of PV1 2Apro in vitro, even at concentrations as high as 200
µM.
Figure 26: 17.5% SDS-PAGE showing the inhibition of self-processing of HRV2 and HRV14 2Apro by zVAM.fmk. A) Autoradiogram of a time course of in vitro translation of PV1 VP1 2Apro. Ten
minutes after the start of protein synthesis, zVAM.fmk was added to a final concentration of 50 µM.

4. Results
68
Samples were taken at the times indicated, and 2Apro self-cleavage from VP1 was examined. In lane
7, translation was performed using 0.05% DMSO only, and lane 8 shows the negative control without
RNA taken at the latest time point. B) Autoradiogram of the in vitro translation products of RNAs from
PV1 VP1 2Apro. Ten minutes after the start of protein synthesis, zVAM.fmk was added to a final
concentration of 200 µM, 100 µM, or 50 µM (lanes 1 to 3). After 60 min of translation, samples were
taken and analyzed. Lane 4 shows 60 minutes translation of the RNAs without any inhibitor;
translation was also performed in the presence of 0.2% DMSO only (lane 5) and without RNA (lane 6).
4.2 Analysis of HRV14 2Apro
4.2.1 Expression and purification It was shown in section 4.1.1 that HRV14 2Apro has a different substrate specificity
compared to HRV2 2Apro. HRV2 2Apro cleaves a substrate bearing an arginine at P1 position;
HRV14 2Apro is unable to do so unless the residue in position 104 is a cysteine or a serine.
Even then, the cleavage is delayed and incomplete compared to wild type levels. Another
important difference observed was the cleavage of eIF4GI and II. eIF4GI cleavage by HRV14
2Apro is significantly delayed compared to HRV2 2Apro (figure 16) and the same is true for
eIF4GII (Schmid, 2002). Moreover, the susceptibility of HRV14 2Apro to the inhibitor
zVAM.fmk seems to be different from that of HRV2 2Apro. HRV14 2Apro is more sensitive to
zVAM.fmk in self-processing and more resistant to the inhibitor during the intermolecular
cleavage; this is opposite to the results with HRV2 2Apro (Deszcz et al., 2006).
To find explanations for these differences, we wished to obtain the three-dimensional
structure of HRV14 2Apro. Therefore, we set out to clone the HRV14 2Apro C109A (the
inactive form of the proteinase) carrying a C-terminal His tag into the plasmid pGEX-6P1,
which contains an N-terminal GST tag (figure 27).
Figure 27: Cloning strategy to introduce the inactive form of HRV14 2Apro carrying a His tag into pGEX-6P-1. pGEX-6P-1-HRV14 2Apro C109A. The ORFs were amplified with primers containing
EcoRI (primer named TIM979) and XhoI (primer named TIM1411) restriction sites. The reverse primer
contained also 6 histidines before two stop codons.

4. Results
69
The inclusion of the His tag was based on previous results. The expression of HRV14 2Apro
with a GST tag alone gave two products: the complete 2Apro and a truncated form which was
lacking the C-terminus (Cencic, 2005). We thought that by introducing an additional C-
terminal tag, we would be able to purify the intact 2Apro. The introduction of the His tag
indeed prevented the formation of the truncated form as can be observed in figure 28B. After
cleavage from the GST tag, there was only one band visible corresponding to the intact
protein with the His tag. The binding of the protein to Ni2+ column showed that the His tag
was present, and therefore that the protein was not truncated (figure 29B).
As the pGEX-6P1 vector is under control of the tac promoter, we used the bacterial
strain JM101 for the expression. These cells contain the lacIq gene that encodes a repressor
protein which binds to lac operator sequences and blocks transcription of down-stream
sequences. However, the lacIq gene product dissociates from the lac operator in the
presence of IPTG (Amann et al., 1988). The optimal conditions to express this protein were
0.1 mM of IPTG and incubation at 16°C for 5 hours (figure 28A). The volume of bacterial
culture was 2 litres.
Figure 28: Coomassie stained SDS-PAGE (10% (A) and 15% (B) polyacrylamide) of the expression of HRV14 2Apro-GST-His (A) and the protein after incubation with PreScission proteinase (Amersham) (B). Protein standards in kDa are shown in line M. A) T: total fraction; I:
insoluble fraction; S: soluble fraction. The expression was carried out at 16°C with 0.1 mM IPTG for 5
hours. Lanes 1 to 3 show the uninduced samples, lanes 4 to 6 the induced samples. 2µl of each
sample were loaded on the gel (0.02% of the sample total volume). B) 40 units of PreScission
proteinase (Amersham) were added to the soluble fraction and incubated with glutathione-sepharose
beads. Lane 1 shows the beads after washing; lanes 2 to 4 show the collected supernatants with the
HRV14 2Apro-His. 10µl of each sample were loaded (1% of the sample total volume).
After binding and cleavage from the glutathione beads (figure 28B) in buffer A, the fractions
were pooled and dialysed against phosphate buffer (500 mM NaCl, 20 mM Na-phosphate pH
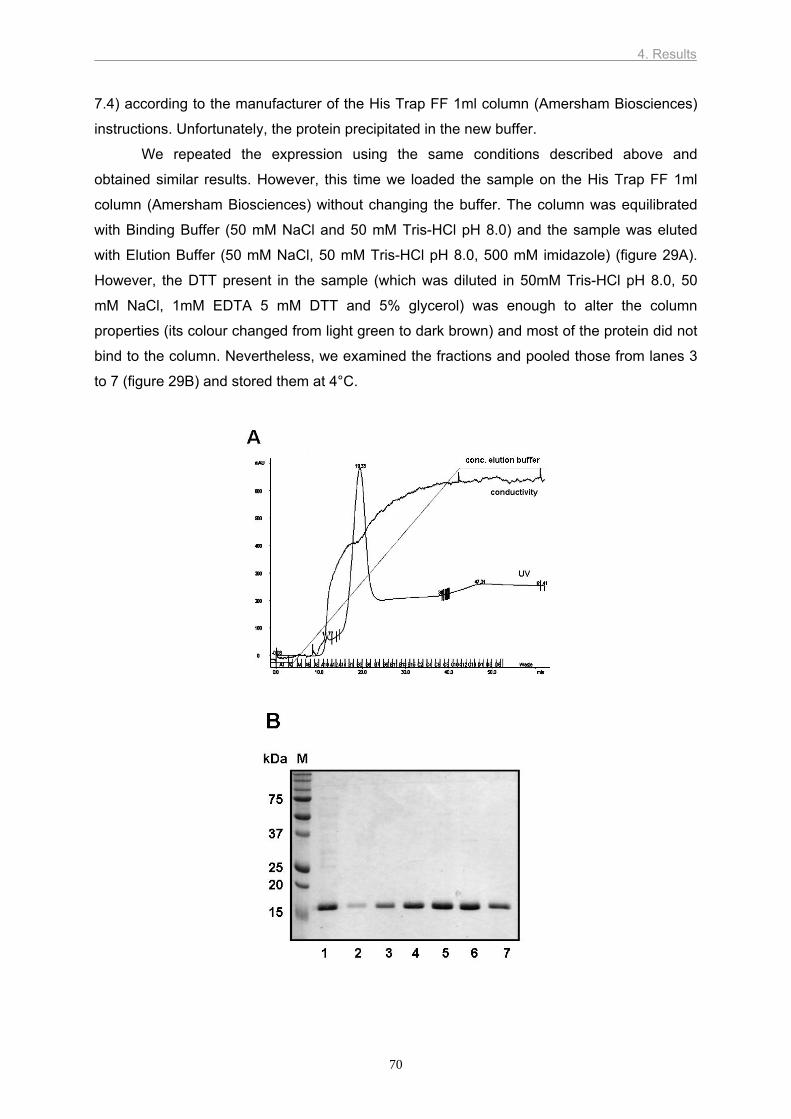
4. Results
70
7.4) according to the manufacturer of the His Trap FF 1ml column (Amersham Biosciences)
instructions. Unfortunately, the protein precipitated in the new buffer.
We repeated the expression using the same conditions described above and
obtained similar results. However, this time we loaded the sample on the His Trap FF 1ml
column (Amersham Biosciences) without changing the buffer. The column was equilibrated
with Binding Buffer (50 mM NaCl and 50 mM Tris-HCl pH 8.0) and the sample was eluted
with Elution Buffer (50 mM NaCl, 50 mM Tris-HCl pH 8.0, 500 mM imidazole) (figure 29A).
However, the DTT present in the sample (which was diluted in 50mM Tris-HCl pH 8.0, 50
mM NaCl, 1mM EDTA 5 mM DTT and 5% glycerol) was enough to alter the column
properties (its colour changed from light green to dark brown) and most of the protein did not
bind to the column. Nevertheless, we examined the fractions and pooled those from lanes 3
to 7 (figure 29B) and stored them at 4°C.

4. Results
71
Figure 29: A) Chromatogram of HRV14 2Apro-His purification performed on a HisTrap column 1 ml (Amersham). The UV units are presented in micro-arbitrary units and each fraction corresponds to
2 ml. B) Coomassie stained 15% SDS-PAGE of the fractions collected. Lane 1 shows the soluble
fraction before loading the column (3µl of 12 ml) and lanes 2 to 7 show the fractions collected (10µl of
2ml). Protein standards in kDa are shown in line M.
After two days at 4°C, the protein had however once again precipitated. To verify the
reasons for the precipitation, we dialysed the sample overnight against buffer A at pH 9.0, at
4°C. This was sufficient to re-dissolve the protein. Therefore, we decided to use buffers at pH
9.0 for future purifications.
For the next purification, we expressed 8 litres of bacterial culture under the same
conditions described above, except that the buffer used to dissolve the pellet was 50 mM
NaCl and 50 mM Tris-HCl pH 9.0. The major part of the expressed HRV14 2Apro was
insoluble (figure 30A). However, we incubated the soluble fraction with glutathione-
sepharose beads (1 mL of beads per litre of culture) and found a high amount of fusion
protein. Figure 30B shows the amount of HRV14 2Apro cleaved from 1 mL of beads.
Figure 30: Coomassie stained 12.5% SDS-PAGE of the expression of HRV14 2Apro-GST-His (A) and the protein after incubation with PreScission protease (Amersham) (B). A) T: total fraction; I:
insoluble fraction; S: soluble fraction. The expression was carried out at 16°C with 0.1 mM IPTG
overnight. Lanes 1 to 3 show the uninduced samples; lanes 4 to 6 the induced samples; 1.5µl of the
samples was loaded (0.01% of the sample total volume). B) 40 units of PreScission protease
(Amersham) were added to the soluble fraction and incubated with glutathione-sepharose beads.
Lane 1 shows the beads after washing; lanes 2 to 4 show the collected supernatants with the HRV14
2Apro-His. 10µl of the samples were loaded (1% of the sample total volume). Protein standards in kDa
are shown in line M.
After pooling all the fractions, we had a final volume of 24 mL of protein solution which were
loaded on a His Trap FF 1ml column (Amersham Biosciences), previously equilibrated with

4. Results
72
the same buffer in which the protein was ressuspended. The elution buffer contained 50 mM
NaCl, 50 mM Tris-HCl pH 9.0 and 500 mM imidazole. Figure 31A shows the chromatogram
of the purification and the protein eluted from the column.
Figure 31: A) Chromatogram of HRV14 2Apro-His purification performed on a HisTrap column 1 ml (Amersham). The UV units are presented in micro-arbitrary units and each fraction corresponds to
2 ml. B) Coomassie stained 12.5% SDS-PAGE of the fractions collected. Lane 1 shows the
soluble fraction before loading the column (3µl of 24 ml); lane 2 the flow-through; lane 3 the collected
waste fraction and lanes 4 to 6 show the fractions collected (10µl of 2ml), which correspond to the
fractions A2 to A4 from the peak observed on the chromatogram. Protein standards in kDa are shown
in line M.
The fractions from lane 4 to 6 were pooled, concentrated to 2 mL and injected on a HiLoad
26/60 Superdex prep grade column (Amersham Biosciences) for separation by gel filtration.
As figure 32B shows, most of the protein is eluted with the flow through, which corresponds
to peak 1 of figure 32A.

4. Results
73
Figure 32: A) Chromatogram of gel filtration performed on a superdex 26/60 column. The UV
units are presented in micro-arbitrary units and each fraction corresponds to 2 ml. B) Coomassie stained 12.5% SDS-PAGE of the fractions collected. Lane 1 shows the sample before loading the
column (10µl of 2ml); lanes 2 to 5 show the fractions of peak 1 of the chromatogram; lanes 6 to 9
show the fractions peak 2 (10μl of 2 ml). Peaks 3 and 4 had no protein (data not shown). Protein
standards in kDa are shown in line M.
However, peak 2 (figure 32A) contained some highly purified protein. After pooling the
samples from lanes 6 to 9 (figure 32B), they were concentrated from 10 ml to 400 µl. The
final concentration was 2,83 mg/ml (figure 33).

4. Results
74
Figure 33: Coomassie stained 12.5% SDS-PAGE of the concentrated HRV14 2Apro-His. Protein
standards in kDa are shown in line M. The amount of loaded protein was 2 µg.
As the protein was very pure, we decided to proceed with the preliminary experiments
for crystallization. The first step consists in the determination of the melting temperature of
the protein, which gives information on the folding state of a protein (Yeh et al., 2006). For
that, a fluorescent dye, which is sensitive to the nature of the solvent in which it is diluted, is
mixed with the protein. The dye is non-fluorescent in a hydrophilic environment and
fluorescent in a hydrophobic environment (Yeh et al., 2006). The protein is mixed with the
dye and the temperature of the mix is constantly increased. When the protein reaches its
melting point, it starts to unfold and consequently exposes the hydrophobic residues, which
trigger the dye to emit fluorescence allowing a simple determination of the melting
temperature. A typical melting temperature curve presents a sigmoid shape, from which is
possible to determine the melting temperature of the tested sample (figure 34).
Figure 34: Determination of the melting temperature of a protein. A) Graphic showing a typical
melting temperature curves of a purified protein. B) Graphic showing the derivative of (A) indicating
that the melting temperature is about 40°C. Each line represents a different dilution of protein and dye.
Data obtained from the N2B/3 proteinase from tick-born encephalitis virus, provided by Martina Kurz
and Zhu Junping.

4. Results
75
The purified HRV14 2Apro was mixed with the SYPRO Orange dye (Invitrogen) in several
dilutions. The melting temperature was measured in a real-time PCR machine (Biorad) using
a single cycle from 20°C to 95°C in which the temperature was increased 1°C every 30
seconds. However, the final graphic shows a decrease in fluorescence. This indicates that
the HRV14 2Apro is unstructured at room temperature, most likely aggregated (figure 35).
Figure 35: Graphic showing the melting temperature curve of HRV14 2Apro-His. Each line
represents a different dilution of protein and dye (see section 3.5.10, table 11 for the setup of the mix
of protein with SYPRO).
The next step was to change the strategy to increase further the expression whilst
reducing the purification steps by removing the GST tag. HRV14 2Apro C109A was amplified
and introduced together with a His tag in the pET11d vector using the restriction sites NcoI
and BamHI (figure 36). This plasmid was then transferred to the bacteria strain
BL21(DE3)LysS. These cells carry a chromosomal copy of the T7 RNA polymerase gene
under control of the lacUV5 promoter, which make them suitable to express genes cloned in
appropriate T7 expression vectors such as pET11d. Additionally, this strain of BL21 cells
encodes the T7 lysozyme, an inhibitor of T7 RNA polymerase. The expression of this
inhibitor suppresses basal expression of T7 RNA polymerase prior to induction (Studier,
1991).

4. Results
76
Figure 36: Cloning strategy to introduce the inactive form of HRV14 2Apro carrying a His tag into pET11d. pET11d-HRV14 2Apro C109A His. The ORFs were amplified with primers containing
NcoI (primer named TIM1546) and BamHI (primer named TIM1547) restriction sites. TIM1547
contains also 6 histidines before two stop codons.
We tested several temperatures, concentrations of IPTG and times of incubation. The
conditions which gave the highest amount of soluble protein turned out to be an overnight
incubation 1 of litre of bacterial culture at 16°C with 0.03 mM IPTG (figure 37, compare lanes
3, 6 and 9).
Figure 37: Coomassie stained 12.5% SDS-PAGE of the expression HRV14 2Apro-His. T: total
fraction; I: insoluble fraction; S: soluble fraction. The expression was carried out at 16°C with 0.01 and
0.03mM IPTG overnight. Lanes 1 to 3 show the uninduced samples; lanes 4 to 6 the induced samples
with 0.01mM IPTG; lanes 7 to 9 show the induced samples with 0.03mM IPTG. 3µl of the samples
was loaded (0.005% of the sample total volume). Protein standards in kDa are shown in line M.
The bacterial pellet was dissolved in 30 mL of 50 mM NaCl and 50 mM Tris-HCl pH 9.0 and
loaded on a His Trap FF 1ml column (Amersham Biosciences) pre-equilibrated with the

4. Results
77
same buffer. The protein was eluted with 50 mM NaCl, 50 mM Tris-HCl pH 9.0 and 500 mM
IPTG. Figure 38 shows the results.
Figure 38: A) Chromatogram of HRV14 2Apro-His purification performed on a HisTrap column 1 ml (Amersham). The UV units are presented in micro-arbitrary units and each fraction corresponds to
2 ml. B) Coomassie stained 12.5% SDS-PAGE of the fractions collected. Lane 1 shows the
soluble fraction before loading the column (3µl of 60 ml); lane 2 the soluble fraction after loading the
column (flow through) (3µl of 60 ml) and lanes 3 to 18 show the fractions collected (10µl of 2ml) of
peak 1 (see (A)). Protein standards in kDa are shown in line M. C) Coomassie stained 12.5% SDS-PAGE of the concentrated (pool of lanes 9 to 13 of panel B) HRV14 2Apro-His.
The fractions from lanes 9 to 13 of figure 38B were pooled and concentrated to 900 µl (figure
38C) and loaded on a HiLoad 26/60 Superdex prep grade column (Amersham Biosciences)
for separation by gel filtration (figure 39). Once again, most of the protein is eluted with the
flow through (peak 1, figure 39A); this probably indicates aggregation. For this reason, we did
not proceed to the melting temperature determination. Optimization of the purification method
is thus necessary. One possibility is to increase the concentration of NaCl in future
purifications. Unfotunately, these experiments fall out of the time frame of this project.

4. Results
78
Figure 39: A) Cromatogram of gel filtration performed on a superdex 26/60 column. The UV
units are presented in micro-arbitrary units and each fraction corresponds to 2 ml. B) and C) Coomassie stained 12.5% SDS-PAGE of the fractions collected. Lane 1 on panel B shows the
sample before loading the column (10µl of 900 µl); lanes 2 to 7 show the fractions of peak 1 of the
chromatogram; lanes 1 to 9 of panel C show the fractions corresponding to peak 2 of the
chromatogram (10μl of 2 ml). Protein standards in kDa are shown in lines M.
4.3 Analysis of eIF4GII 4.3.1 Expression and purification
eIF4G is a scaffolding protein which brings the capped mRNA and the ribosome
together. This protein is cleaved during picornaviral replication (Etchison et al., 1982) leading
to the so called cellular translation shut-off, allowing the viruses to take over the ribosome
and express their own proteins as the viral translation is cap independent. eIF4G has two
isoforms, eIF4GI and eIF4GII, which have the same function in the cell (Gradi et al., 1998a).
The translation shut-off, induced by the viral infection is only achieved when both isoforms

4. Results
79
are cleaved (Svitkin et al., 1999). There is evidence that the cleavage of eIF4G by
picornaviral proteinases is more efficient in the presence of the initiation factor eIF4E. It is
believed that eIF4E may induce a change in the eIF4G structure that is better recognized by
the viral proteinases (Gross et al., 2003; Haghighat et al., 1996; Hershey et al., 1999). To
investigate this idea, we set out to obtain structural data on the interaction of eIF4G with
eIF4E and picornaviral proteinases. We began with eIF4G, selecting a fragment of eIF4GII
comprising the residues 445 to 744 that contain the cleavage sites recognized by HRV2 2Apro
and FMDV Lbpro, the binding site for eIF4E and the binding sites for FMDV Lbpro and HRV2
2Apro.
We started by using the plasmid pGEX-6P1- eIF4GII (aa 445 to 744) with the flag tag
(a gift from A. Gradi, figure 40).
Figure 40: Scheme for the pGEX-6P1-eIF4GII-(aa 445-744)-FLAG vector provided by A. Gradi.
JM101 cells were transformed with the plasmid and the expression of eIF4GII was induced
with IPTG. We tested several expression conditions, using different temperatures, different
concentrations of IPTG and different times of incubation. Figure 41 shows a typical
expression at 37°C with 0.1 mM IPTG for 5.5 hours. We never saw a clear over-expression
of the protein. Nevertheless, we incubated the soluble fraction with glutathione-sepharose
beads and we could observe that the protein which has a molecular weight of 64 kDa, was
present (figure 41, lane 7).

4. Results
80
Figure 41: Coomassie stained 10% SDS-PAGE of the expression eIF4GII-GST aminoacids 445 to 744. Lane M shows the protein standards in kDa. T: total fraction; I: insoluble fraction; S: soluble
fraction. The expression was carried out at 37°C with 0.1 mM IPTG for 5.5 hours. Lanes 1 to 3 show
the uninduced samples; lanes 4 to 6 the induced samples; lane 7 the soluble fraction after incubation
with glutathione-sepharose beads (B) and line 8 shows the supernatant after incubation with the
beads (S); the volume loaded was 5µl (0.02% of the sample total volume).
After expressing 4 litres of bacterial culture using the same conditions used for the
experiment illustrated in figure 41, we incubated the soluble fraction with 1 ml of glutathione
beads per litre of expression and subsequently incubated the same beads (after washing)
with preScission proteinase. Figure 42 shows a coomassie stained gel with 0.3% of the total
amount of eIF4GII (3 ml) after cleavage from the glutathione beads. The eIF4GII fragment
has a molecular weight of 37 kDa after cleavage. GST tag remained in the beads (lane 1).
The higher molecular weight bands show uncleaved material and the bacterial chaperonin
GroEL which was identified by mass spectroscopy and will be mentioned later (lanes 2 to 4).
Figure 42: Coomassie stained 10% SDS-PAGE of eIF4GII aminoacids 445 to 744 after cleavage from the GST-tag. 40 units of PreScission protease (Amersham) were added to the soluble fraction

4. Results
81
incubated with glutathione-sepharose beads. Lane 1 shows the beads after washing with the GST tag;
lanes 2 to 4 show the collected supernatants with the 37 kDa fragment corresponding to eIF4GII,
uncleaved material and the bacterial chaperonin GroEL which was identified by mass spectroscopy.
Protein standards in kDa are shown in line M. 10µl of the samples were loaded (1% of the sample total
volume).
The samples from lanes 2 to 4 were pooled and concentrated to 2 ml and loaded on a
HiLoad 26/60 Superdex prep grade column (Amersham Biosciences) for gel filtration (figure
43A)
Figure 43: A) Chromatogram of gel filtration of the sample from figure 42, after being concentrated to 2 ml, performed on a superdex 26/60 column. The UV units are presented in
micro-arbitrary units and each fraction corresponds to 2 ml. B) Coomassie stained 10% SDS-PAGE of the fractions corresponding to peak 1 and 2 respectively. Protein standards in kDa are shown
in line M. 10µl of the samples were loaded (0.5% of the sample total volume).
The fractions of lanes 12 to 15 and lanes 16 to 18 of figure 43B were pooled and
concentrated to 700 µl and 1.5 ml, respectively. Figure 44 shows a coomassie stained gel
with 5µl of each sample after concentration.

4. Results
82
Figure 44: Coomassie stained 10% SDS-PAGE of the pooled and concentrated fractions of eIF4GII. Lane 1 corresponds to lanes 12 to 15 of figure 43B and lane 2 to lanes 16 to 18 lanes of
figure 43B. Protein standards in kDa are shown in line M. 5µl of the samples were loaded (0.7% (line
1) and 0.3% (line 2) of the sample total volume).
As the amount of protein obtained (0.8 mg) and the purity were not sufficient, we decided to
change the strategy of purification and use an insect cell purification system. We used the
Sf9 cells and the Bac-to-Bac Baculovirus Expression System from Invitrogen.
First, we started by introducing the GST tag (amplified from the vector pGEX-6P1)
into the pFastBac vector using the restriction sites BamHI and EcoRI (figure 45A). Secondly
we introduced the eIF4GII, amplified from the pGEX-6P1- eIF4GII (aa 445 to 744) flag tag,
using the restriction site for EcoRI, on both 5’ and 3’ ends. The vector was digested with
EcoRI and the eIF4GII DNA was introduced at the C-terminus of the GST tag (figure 45B).

4. Results
83
Figure 45: Cloning strategy to introduce the GST tag and eIF4GII residues 445 to 744 into the pFastBac vector (Invitrogen). A) The tag was amplified from the pGEX-6P-1(Amersham Pharmacia
Biosciences) vector with the primers TIM1336 and TIM1337 and introduced into pFastBac. B) The
eIF4GII, amplified with the primers TIM1353 and TIM1354, was then introduced in the EcoRI
restriction site.
The new vector pFastBac-GST-eIF4GII aa 445 to 744 was used to transform DH10Bac™
cells from Bac-to-Bac Baculovirus Expression System. These cells contain enzymes that
help to integrate the construct into the baculovirus genome. After confirming that the
integration of the eIF4GII with the GST tag was correct, the DNA was used to infect Sf9 cell
which are susceptible to the infection by the baculovirus of the system used. As the
baculovirus replicates, it also expresses the protein added to its genome. After the virus has
induced cell lysis, the expressed protein can be collected from the supernatant.
Figure 46 shows a western blot performed after the infection of 6 x 10⁵ Sf9 cells in 24 well
plates. After 48 hours of infection with an MOI of 5, the expression of eIF4GII-GSTtag is
evident (figure 46B).

4. Results
84
Figure 46: immunoblot of 12.5% SDS-PAGE showing the expression of eIF4GII-GST. The
proteins were detected by immunoblotting using the GST antiserum (1:1000). The left panel shows the
non infected samples and the right panel the infected ones. Samples were collected at 24, 48, 72 and
96 hours post infection (lanes 1, 2, 3, 4, respectively). 10µl of the samples plus 10 µl of Laemli sample
buffer were loaded (3.3% of the sample total volume). Protein standards in kDa are shown on the left
side of the panels.
The experiment was scaled up to 200 ml suspension culture with a cell density of
2x10⁶ Sf9 cells/ml (see section 3.5.1.3.4). The supernatant was collected after 48 hours and
incubated with glutathione-sepharose beads, after which the eIF4GII was cleaved from the
GST tag with PreScission proteinase (Amersham) and eluted from the beads (figure 47).
Surprisingly, the gel did not show a band with the predicted size of the eIF4GII fragment (37
kDa). The slowest migrating band (above 37 kDa) appearing in lane 3 of figure 47 was too
large to be eIF4GII after cleavage. As the size of this band is similar to that of PreScission
proteinase (data not shown) we assumed that it is the PreScission proteinase itself.
Figure 47: Coomassie stained 10% SDS-PAGE of eIF4GII after incubation with PreScission protease (Amersham). Lanes 1 and 2 show purified GST (5 and 3 µl respectively); lane 3 shows the
supernatant collected from the glutathione-sepharose beads (5µl of 1 ml). Protein standards in kDa
are shown in line M.

4. Results
85
Figure 47 (lane 3), also shows three bands at the length of the GST tag. The upper
band running at about 25 kDa in lane 3 is the GST tag (compare size with purified GST in
lanes 1 and 2). We think that the remaining two bands can be eIF4GII after PreScission
cleavage. We considered this hypothesis because PreScission proteinase is itself HRV14
3Cpro which is known to recognize Gln*Gly sequences for cleavage. The eIF4GII fragment
that we expressed also contains the Gln*Gly sequence (red in figure 48). Although the
adjacent residues to the Gln*Gly site are not those favoured by HRV14 3Cpro (Cordingley et
al., 1990; Long et al., 1989), we believe that the HRV14 3Cpro which cleaved the protein from
the GST tag could also have cleaved the expressesd eIF4GII fragment. An argument that
support our hypothesis is that FMDV 3Cpro was shown to cleave eIF4GI in a different site
from that expected for 3Cpro, at the sequence Glu711*Pro712 (figure 48) (Strong and
Belsham, 2004).
The reason why this fragment purified from Sf9 cells was cleaved whereas the same
fragment purified from bacteria was not may indicate that the expression in eukaryotic cells
could have introduced some post-translational modifications that affected the folding of the
protein, making it recognizable by the HRV14 3Cpro.
Figure 48: fragment of eIF4GII (residues 445 to 744) cloned in pGEX-6P1 (Amersham). Red
marks the putative cleavage site for PreScission protease (HRV14 3Cpro) (Amersham); blue shows the
eIF4E binding site; the orange line shows the residues important for Lbpro binding in eIF4GI and the
red line shows the residues important for 2Apro binding in eIF4GI (Foeger et al., 2002). The cleavage
sites for 2Apro and Lbpro are marked (Gradi et al., 2004). Finally the cleavage site of FMDV 3Cpro
correspondent to eIF4GI is also marked (Strong and Belsham, 2004). The numbers on the left refer to
the first residue of eIF4GII on each line.

4. Results
86
Since the fragment C-terminal to the Gln*Gly sequence contains all the regions we
are interested in, we decided to clone it in the pGEX-6P1 vector and try to express it again in
bacteria, as this is a simpler system. The new eIF4GII fragment starts with the aminoacid
Phe552 and ends with a His tag after the Glu744. The insert was amplified from the vector
pGEX-6P1- eIF4GII (aa 552 to 744) flag tag introducing the restriction sites for EcoRI. Once
again the plasmid pGEX-6P1 was digested with EcoRI and the insert was introduced after
the 3’ end of the GST tag (Figure 49).
Figure 49: Cloning strategy to introduce the fragment corresponding to the residues 552 to 744 of eIF4GII into pGEX-6P-1. pGEX-6P-1-eIF4GII 552-744. The ORFs were amplified with the primers
TIM1472 and TIM1354.
The amount of expressed protein from pGEX-6P-1-eIF4GII 552-744 was higher than with the
larger fragment; however the recovery after incubation with glutathione beads was still not
high enough for structural studies (figure 50).
Figure 50: Coomassie stained 10% SDS-PAGE of the expression eIF4GII-GST-His aminoacids 552 to 744 (A) and the protein after incubation with PreScission protease (Amersham) (B). A) T:
total fraction; I: insoluble fraction; S: soluble fraction. The expression was carried out at 20°C with 0.5

4. Results
87
mM IPTG overnight. Lanes 1 to 3 show the uninduced samples; lanes 4 to 6 the induced samples; 3µl
of the samples were loaded (0.015% of the sample total volume). B) 40 units of PreScission protease
(Amersham) were added to the soluble fraction and incubated with glutathione-sepharose beads.
Lane 1 shows the beads after washing; lanes 2 to 4 show the collected supernatants with the eIF4GII.
10µl of the samples were loaded (1% of the sample total volume). The upper arrow indicates a protein
which is systematically co-purified with eIF4GII and was identified as GroEL chaperone from E. coli by
mass spectroscopy (excised band of lane 2). Protein standards in kDa are shown in line M.
The excised band on lane 3 (figure 50B) corresponds to a protein which was systematically
co-purified with the eIF4GII fragment. We thought that it could be a binding partner.
Consequently, we sent it for mass spectroscopy identification. The results showed that this
protein is the E. coli chaperone GroEL (data not shown).
As the yield and purity of the new eIF4GII fragment were not satisfactory, we decided
to try the expression using a different plasmid and a different bacteria strain. The chosen
plasmid was the pET11d (Novagen) which can be expressed with the cells BL21(DE3)LysS.
The smaller fragment of eIF4GII (aminoacids 552 to 744) with the C-terminal His tag was
introduced into the pET11d plasmid using the restriction enzyme NcoI. The new plasmid was
named pET11d-eIF4GII aa 552 to 744 His tag (figure 51).
Figure 51: Cloning strategy to introduce the fragment corresponding to the residues 552 to 744 of eIF4GII carrying a His tag into pET11d. pET11d-eIF4GII 552-744 His. The ORFs were amplified
with the primers TIM1544 and TIM1545. TIM 1545 contains also 6 histidines before two stop codons.
We started by optimizing the expression at small scale (25 ml of bacterial culture),
trying several temperatures, concentrations of IPTG and times of incubation. Figure 52A
shows that the protein is well expressed and soluble at 37°C with 0.1mM IPTG for 5 hours.
As the band that we thought to correspond to eIF4GII runs at a higher molecular weight than
the predicted (22.2 kDa, compare with figure 50B), we performed some experiments to
confirm the content of this band. Figure 52B presents a western blot against the His tag

4. Results
88
showing that the band above 25 kDa corresponds to the eIF4GII fragment. The reason why
eIF4GII is only visible in the total and soluble fractions might be due to the low efficiency of
the sonication, as the amount of protein is rather low in the insoluble fraction (figure 52A,
lane 5). The probe used for detection was a nickel (Ni2+) activated derivative of horseradish
peroxidase (HRP) (HisProbe™-HRP, Pierce) prepared to detect poly-histidine-tagged
proteins. Additionally, a sample of this band was sent for mass spectroscopy analysis, which
confirmed that this protein is indeed the eIF4GII fragment (data not shown).
Figure 52: Coomassie stained 12.5% SDS-PAGE of the expression eIF4GII-GST aminoacids 552 to 744. A) Lane M shows the protein standards in kDa. T: total fraction; I: insoluble fraction; S: soluble
fraction. The expression was carried out at 37°C with 0.1 mM IPTG for 5 hours. Lanes 1 to 3 show the
uninduced samples; lanes 4 to 6 the induced samples. 3µl of the samples were loaded (0.005% of the
sample total volume). B) Immunoblot of 12.5% SDS-PAGE showing the expression of eIF4GII
(induced fractions corresponding to lane 4 to 6 of figure 52A). The proteins were detected by
immunoblotting using an anti-histidine probe: nickel (Ni2+) activated derivative of horseradish
peroxidase (1:10,000) (HisProbe™-HRP, Pierce).
The conditions chosen for expression at large scale were the same shown in figure 52A for
the small scale. We incubated 1 litre of bacterial culture at 37°C for 5 hours with 0.1 mM of
IPTG. The soluble fraction was loaded on a His Trap FF 1ml column (Amersham
Biosciences) equilibrated with 50 mM NaCl, 50 mM Tris-HCl pH 8.0. The proteins were
eluted by a gradient of imidazole (elution buffer: 50 mM NaCl, 50 mM Tris-HCl pH 8.0, 500
mM imidazole). Figure 53A shows the result of the FPLC purification, in which one single
peak can be observed. 10 µl of each fraction from the FPLC purification were loaded on a
12.5% SDS-PAGE. The fractions 9 to 15, corresponding to the peak seen in figure 53A
contain a band with the expected molecular weight for the eIF4GII fragment expressed
(figure 53B).

4. Results
89
Figure 53: A) Chromatogram of eIF4GII-His aminoacid 552 to 744 performed on a HisTrap column 1 ml (Amersham). The UV units are presented in micro-arbitrary units and each fraction
corresponds to 2 ml. B) Commassie stained 10% SDS-PAGE of the fractions collected. Lane 1
shows the total fraction before loading the column (3µl of 60 ml); lane 2 the soluble fraction before
loading the column (3µl of 60 ml); lane 3 the flow-through and lanes 4 to 18 show the fractions
collected (10µl of 2ml). Protein standards in kDa are shown in line M.
The fractions of lanes 9 to 10 and 11 to 15, containing the eIF4GII fragment (figure 53, panel
B) were pooled separately and dialysed against buffer A overnight (in order to remove the
imidazole). Afterwards the two samples were concentred to 600 µl each (figure 54).

4. Results
90
Figure 54: Commassie stained 12.5% SDS-PAGE of the pooled and concentrated fractions of eIF4GII. Lane 1 corresponds to the pool of lanes 9 and 10 of figure 53B and lane 2 corresponds to
the pool of lanes 11 to 15 of figure 53B. Protein standards in kDa are shown in line M. 2µl of 600 µl of
the samples were loaded).
These two samples were pooled together to a total volume of 1.2 ml and loaded on a HiLoad
26/60 Superdex prep grade column (Amersham Biosciences) for separation by gel filtration
(figure 55A). The fractions corresponding to the peaks 1 and 2 are shown in figure 55B.

4. Results
91
Figure 55: A) Chromatogram of gel filtration performed on a superdex 26/60 column. The UV
units are presented in micro-arbitrary units and each fraction corresponds to 2 ml. B) Commassie stained 10% SDS-PAGE of the fractions collected. Lane 1 shows the sample before loading the
column (10µl of 1.2 ml); lanes 2 to 9 show the fractions of peak 1 of the chromatogram; lanes 10 to 18
show the fractions correspondent peak 2 of the chromatogram (10μl of 2 ml). Protein standards in
kDa are shown in line M.
Fractions of lane 13 to lane 16 of figure 55B (a total amount of 8 ml) were pooled and
concentrated to 600 µl. The concentration of the purified protein was 2.4 mg/ml; a sample of
5 µg was examined for purity on a polyacrilamide gel (figure 56).
Figure 56: Commassie stained 12.5% SDS-PAGE of the pooled and concentrated fractions 13 to 16 of eIF4GII of figure 55B. Protein standards in kDa are shown in line M. The amount of sample
loaded was 5 µg.
The next step was to determine the melting temperature of the purified eIF4GII, in
order to find the best conditions to set up the crystals. For that SYPRO Orange dye
(Invitrogen) was used. As explained in section 4.2.1, this dye is sensitive to the nature of the
solvent in which it is diluted when it is mixed with the protein. The determination of the

4. Results
92
melting temperature of a protein can give information about its folding status. Unfortunately,
the eIF4GII fragment tested seems to be unstructured in solution, as the results show no
melting temperature curve (figure 57). For comparison with a typical melting curve of a
correctly folded protein see figure 34.
Figure 57: Melting temperature curve of eIF4GII-His amino acids 552 to 744. Each line represents
a different dilution of protein (see section 3.5.10, table 11 for the setup of the mix of protein with
SYPRO).
4.3.2 NMR analysis An alternative way to determine protein structures by crystallography is nuclear
magnetic resonance (NMR). NMR is based on a quantum mechanical magnetic
phenomenon of the nucleus named spin (I). The hydrogen nucleus (1H) has a half integer
spin and is the most important nucleus to study proteins. Other relevant nuclei for biological
studies are 15N, 13C and 31P. The “spinning” nucleus can be pictured as a rotative positive
charge which generates a magnetic field. Without an external magnetic field, the direction of
the axis of spin is random; however, when such a field is present each “nuclear magnet”
adopts a specific orientation. For nuclei with spin -1/2, two orientations are possible, a low
energy state (α) and a high energy state (β). α aligns in the same direction as the applied
field and β aligns at the opposite direction. The spins in the α state are slightly more
abundant than the spins in the β state, which makes NMR an intrinsically insensitive
technique.
The NMR phenomenon corresponds to transition between α and β energy levels and
it occurs when an appropriate amount of energy (resonance) is supplied to the system by a
pulse of electromagnetic radiation at a frequency of vL. The higher the external magnetic
field, the greater is the difference in energy between the α and β states and the more
sensitive is the NMR experiment. Despite the intrinsic insensitivity of the technique, NMR is

4. Results
93
very useful when applied to small molecules. It gives information on molecular dynamics,
protein folding and intra and intermolecular interactions. Additionally, the method is carried
out in solution, resembling the native physiological conditions.
Chemical shift
The electrons that surround the nucleus “shield” it from the static field, B0 as they also
interact with the magnetic field. The electron density is directly proportional to the shielding,
so the higher the electron density the lower is the resonance frequency. Thus, nuclei that are
bonded to electronegative atoms experience NMR transitions of higher energy. The
resonance frequencies, in NMR are expressed in independent manner of B0: the chemical
shift scale (δ).
δppm = (vobs – vref) / v0 * 106
in which vobs is the frequency of a resonance of interest, v0 is the spectrometer frequency and
vref is the frequency of a signal from a chosen reference compound. The units of chemical
shift are dimensionless and expressed in parts per million (ppm). This allows NMR spectra
from spectrometers with different operating frequencies to be compared directly. The
reference substance is dependent on the nucleus under analysis. It was conventioned that
the ppm scale should show the zero at the right side. An “upfield” shift corresponds to an
increase in nuclear shielding and a lower resonance frequency. Chemical shifts in proteins
are influenced by noncovalent interactions, namely hydrogen bonding and proximity and
relative orientation of carbonyl groups and aromatic rings. These interactions can give
information of the local environment of a nucleus in a protein and are a function of the
secondary and tertiary structures. For example, upfield shifts are observed in α-helices
whereas β-sheets are shifted to lower fields.
Chemical shifts are very sensitive to a large number of variables such as structural,
electronic, magnetic and dynamic. Chemical shifts give a tremendous amount of information
on the system under investigation. For instance, large shift dispersion indicates that a protein
is well structured and suitable for further measurements and calculations. Figure 58 shows a
typical spectrum of a well structured protein. In this case, the shift dispersion is between 1
and 7 ppm.

4. Results
94
Figure 58: Superimposition of 1H-15N-HSQC of 15NLbproC51A and 1H-15N-HSQC of 15N/13C LbproC51A. The 15N labelled sample is drawn in blue and the double labelled one in red. The two
spectra are shifted somewhat to make the corresponding peaks better visible. Thus, they lie next to
and not on top of each other. Figure taken from R. Cencic PhD thesis, 2005.
Relaxation time
Another important concept is the relaxation time. Relaxation corresponds to a
process by which the excited spin state, responsible for the NMR signal, returns to
equilibrium. Two relaxation mechanisms can be observed: longitudinal relaxation (T1) which
measures the exchange of a spin excess of energy with the surroundings and how difficult
the process is; and transversal relaxation (T2) which measures how efficient is the exchange
of energy between spins. An isolated nuclear spin would present rather long relaxation times;
however, within molecules, relaxation can be induced by exchange of energy with the
surrounding or other spins in the same molecule. The relaxation rates are specifically related
to molecule motion and are very important to study molecular dynamics.
In order to begin the determination of the NMR structure of eIF4GII, we expressed the
protein in minimal medium containing 15N labelled ammonium chloride as the sole source of
nitrogen. The conditions of the expression were the same used to express pET11d-eIF4GII
aa 552 to 744 His tag, and the plasmid was the also the same. Figure 59 shows the FPLC
chromatogram after purification on the His Trap FF 1ml column (Amersham Biosciences) and
the fractions correspondent to the peaks observed.

4. Results
95
Figure 59: A) Chromatogram of eIF4GII-His aminoacid 552 to 744 performed on a HisTrap column 1 ml (Amersham). The UV units are presented in micro-arbitrary units and each fraction
corresponds to 2 ml. B) and C) Commassie stained 10% SDS-PAGE of the fractions collected. Lane 1 on panel B shows the soluble fraction before loading the column (3µl of 60 ml); lane 2 the flow-
through and lanes 3 to 9 and 1 to 4 of panel C show the fractions collected (10µl of 2ml). Protein
standards in kDa are shown in line M.
Fractions of lines 1 to 4 of figure 59C (8 ml) were pooled and concentrated to 250 µl (figure
60). The concentration of the protein is 150 µM. This concentration is far form optimal as the
measurements are normally done at concentrations higher than 1 mM. Nevertheless, we
decided to perform a preliminary measurement. As for NMR experiments the proteins do not
need to be highly pure, we did not perform a gel filtration. Instead the sample was directly
measured.

4. Results
96
Figure 60: Commassie stained 12.5% SDS-PAGE of the pooled and concentrated fractions of eIF4GII. Protein standards in kDa are shown in line M. 2 µg of protein were loaded.
The measurements were done by Georg Kontaxis (MFPL). The measurements were
done at 25°C with 5% D2O in buffer A (50 mM Tris-HCl pH 8.0, 50 mM NaCl, 1 mM EDTA, 5
mM DTT, 5% glycerol) in a 800 MHz Varian Inova device. Figure 61 shows the spectrum of 15N-eIF4GII alone in red. There is only a small 1H shift dispersion which is between 7.5 and 9
ppm. This, as explained above, indicates that the protein is not well structured. One possible
reason for these results is that eIF4GII might need another factor, such as eIF4E (Gross et
al., 2003; Haghighat et al., 1996; Hershey et al., 1999) or Lbpro, to acquire a defined
structure. We added Lbpro at a four fold excess; however, no differences were observed (blue
spectrum, figure 61). The remaining factor to check was eIF4E and we decided to purify this
protein to see whether this idea is correct.

4. Results
97
Figure 61: Superimposition of 15N-eIF4GII (red) and 15N-eIF4GII plus FMDV Lb (blue). The 1H shift
dispersion between 7.5 and 9 ppm indicates that the protein is not folded.
4.3.3 eIF4E expression and purification As the attempts to crystallize and obtain the NMR structure of a fragment of eIF4GII
(which contains the binding site for eIF4E, see section 4.3.2) were not successful, we
decided to express and purify the mouse eIF4E. We chose the mouse isoform because it
shares 98% identity with the human eIF4E and it was already cloned in an expression vector.
It was shown previously that Lbpro can cleave eIF4GI more efficiently in the presence of
eIF4E (Gradi et al., 2004). eIF4E induces a change on eIF4GI conformation that makes it
accessible to the proteinase. For this reason, we wanted to add eIF4E to the labelled
eIF4GII, in order to perform new NMR measurements and see whether eIF4GII acquires a
folded structure.
We started the expression using the vector pET3b-meIF4EΔ27 which lacks the first
27 amino acids at the N-terminus, making the protein more stable (a kind gift from Jerry
Pelletier, McGill University, Montreal). It also lacks a tag. The binding sites for the cap
structure, 4EBP and eIF4G remain in the truncated protein. The protein was well expressed
with the conditions used (30°C with 0.1 mM IPTG for 5 hours); however, it was completely
insoluble, under these conditions (figure 62).

4. Results
98
Figure 62: Commassie stained 12.5% SDS-PAGE of the expression eIF4EΔ27. T: total fraction; I:
insoluble fraction; S: soluble fraction. The expression was carried out at 30°C with 0.1 mM IPTG for 5
hours. Lanes 1 to 3 show the uninduced samples; lanes 4 to 6 the induced samples; 3.5µl of the
samples were loaded (0.012% of the sample total volume). Protein standards in kDa are shown in line
M.
As there was a second plasmid available (gift from Regina Cencic, McGill University,
Montreal), we decided to try to express it instead of trying other conditions with the first
plasmid. The new plasmid is named pproExHTA-meIF4E wt which contains the complete
sequence of the mouse eIF4E and an N-terminal His tag (figure 63).
Figure 63: Scheme for the ppro ExHTA-meIF4E vector provided by Regina Cencic.
Once again, we tested several expression conditions, using different media for
expression and different buffers for the cell extracts. Figure 64 shows four different
conditions used to express eIF4E. The expression was carried out at 16°C with 0.1 mM IPTG
for 5 hours in all cases. The growth media and the buffers used to resuspend the pellets
were different (see section 3.2.2 and for buffers composition section 3.5.2.1). In panel A, the
expression was done in Terrific Broth (TB) medium and the pellet was resuspended in buffer
A. Panel B shows the expression in TB medium and ressuspension of the pellet in Lysis Cell

4. Results
99
Buffer (LCB) buffer. In panel C the expression was carried out in Luria Bertoni (LB) medium
and the pellet was taken in buffer A. Finally, in panel D the expression was done in LB
medium and the pellet was resuspended in LCB buffer. The optimal procedure was
expression in TB medium. The buffer used to resuspend the soluble fraction was buffer A.
Figure 64: Commassie stained 12.5% SDS-PAGE of the expression eIF4E. T: total fraction; I:
insoluble fraction; S: soluble fraction. The expression was carried out at 16°C with 0.1 mM IPTG for 5
hours. Lanes 1 to 3 show the uninduced samples; lanes 4 to 6 the induced samples; 3.5µl of the
samples were loaded (0.35% of the sample total volume). Protein standards in kDa are shown in line
M. A) Expression in TB medium and pellet ressuspended in buffer A; B) Expression in TB medium
and pellet ressuspended in LCB buffer; C) Expression in LB medium and pellet ressuspended in buffer
A; D) Expression in LB medium and pellet ressuspended in LCB buffer; E) Immunoblot of 12.5% SDS-
PAGE showing the fraction of lane 6 of panel A blotted against an anti histidine serum (HisProbe™-
HRP, Pierce) (1:10,000).
As a first attempt at purification, we loaded the soluble fraction on a His Trap FF 1ml
column (Amersham Biosciences) equilibrated with 50 mM NaCl, 50 mM Tris-HCl pH 8.0. The
proteins were eluted by a gradient of imidazole (elution buffer: 50 mM NaCl, 50 mM Tris-HCl
pH 8.0, 500 mM imidazole). However, eIF4E failed to bind the column (data not shown). After
repeating the expression, we decided to use a mono Q 10/10 column (figure 65) for
purification.

4. Results
100
Figure 65: A) Chromatogram of eIF4E performed on a MonoQ 10/10 column (Amersham). The
UV units are presented in micro-arbitrary units and each fraction corresponds to 2 ml. B) and C) Commassie stained 10% SDS-PAGE of the fractions collected. Lane 1 on panel B shows the
soluble fraction before loading the column (3µl of 60 ml); lane 2 the flow-through and lanes 3 to 9 and
1 to 4 of panel C show the fractions collected (10µl of 2ml) of peak 2. peaks 1, 3 and 4 had no protein
with the relevant weight (data not shown). Protein standards in kDa are shown in line M.
The fractions of lanes 8 and 9 of figure 65B, which had a band running at the weight
predicted for eIF4E were dialysed against a buffer containing 20 mM MOPS, 0.25 mM DTT,
0.1 mM EDTA, 50 mM NaF and 100 mM KCl, 3 times one hour at 4°C. Afterwards they were
incubated with 100µl of m7GTP beads for 3 hours at 4°C. After incubation the beads were
washed 2 times with the same buffer and the eIF4E was eluted with a new buffer (20 mM
MOPS, 0.25 mM DTT, 0.1 mM EDTA, 50 mM NaF and 500 mM KCl). After washing and
elution the protein was highly pure (figure 66, lane 4).

4. Results
101
Figure 66: Commassie stained 12.5% SDS-PAGE of eIF4E eluted from m7GTP beads. Lane 1
shows 2µl (of 60 µl) of m7GTP beads after elution; lane 2 the eIF4E fraction after incubation; lane 3
the washing buffer and line 4 the eluate containing the purified eIF4E. 10µl of 1 ml were loaded in
lanes 2 to 4. Protein standards in kDa are shown in line M.
The protein was then concentrated from 8 ml to 250 µl and quantified (100µM). Figure 67
shows the concentrated protein (A) and an immunoblot of the same sample performed with
an anti-histidine probe (B). This concentration is rather low for NMR experiments.
Additionally, as it needs to be complexed with eIF4GII 15N labelled at least at a ratio of 1:1,
the protein will be too diluted to obtain reasonable measurements. For these reasons we
need to purify higher and more concentrated amounts of eIF4E. Then this protein will be
used with eIF4GII 15N labelled in NMR experiments. These experiments are not presented as
they fall out of the time frame of this project.
Figure 67: eIF4E after purification and concentration. A) Commassie stained 12.5% SDS-PAGE of
the concentrated eIF4E. Protein standards in kDa are shown in line M. 3µg of the sample was loaded.
B) Immunoblot of 12.5% SDS-PAGE showing the sample of panel A blotted against an anti histidine
probe (HisProbe™-HRP, Pierce) (1:10,000).

4. Results
102
4.4 Screening for HRV2 and HRV14 2Apro binding partners 4.4.1 Expression and purification of the protein complexes
HRV 2Apro bind and cleave several cellular proteins such as eIF4G and cytokeratin 8
(Foeger et al., 2002). We wanted to identify further binding partners of HRV2 2Apro and
HRV14 2Apro in the host cell by using a modified version of the method developed by Rigaut
et al. (1999). The tandem affinity purification (TAP) method allows the purification of protein
complexes under native conditions, without prior knowledge of their composition. The
proteins isolated are then identified by mass spectroscopy (MS). This method is fast and can
be used with a relatively small number of cells. The TAP tag consists of two proteins, protein
A of Staphylococcus aureus (15.3 kDa) and a calmodulin binding peptide (CaBP, 3.0 kDa)
which are separated by the cleavage sequence recognized by the Tobacco Etch Virus (TEV)
protease. Figure 68 shows a schematic representation of the method.
Figure 68: Overview of TAP procedure (adapted from Rigaut et al., 1999).
We started by introducing the TAP tag (20.5 kDa) into the expression vector pET11d
(Novagen) using the restriction sites SmaI and NcoI. The vector was digested with NcoI; the
TAP tag was extracted from the pBluescript vector with the restriction enzymes SmaI and
NcoI. The introduction of the TAP tag into the vector eliminated the NcoI site on the 3’ end of
the insert; therefore the NcoI site on the 5’ end of the tag could be used for further cloning
(figure 69).

4. Results
103
Figure 69: Cloning strategy to introduce the TAP tag into pET11d. The tag was cut from the pBS
(PBluescript) vector with NcoI and SmaI and introduced into pET11d digested with NcoI only.
Consequently, the SmaI and the 3’ end NcoI restriction sites were eliminated.
Once the vector pET11d-TAP was ready, the inactive forms of HRV2 2Apro (16.2 kDa)
and HRV14 2Apro (16.0 kDa), in which the active cysteine had been substituted by an
alanine, were introduced in frame with the TAP tag. The new vectors were named pET11d-
TAP-HRV2 2Apro C106A and pET11d-TAP-HRV14 2Apro C109A (figure 70). The expressed
proteins with the TAP tag have a size of 36.7 kDa and 36.5 kDa respectively.

4. Results
104
Figure 70: Cloning strategy to introduce the inactive forms of HRV2 and HRV14 2Apro into pET11d-TAP. A) pET11d-TAP-HRV2 2Apro C106A. B) pET11d-TAP-HRV14 2Apro C109A. The ORFs
were amplified with the primers TIM1333 and TIM1332 (A) and TIM1331 and TIM1332 (B) and
introduced into pET11d digested with NcoI. The TAP tag is C-terminal.
The bacteria strain BL21(DES3)LysS was used to express the plasmids described
above. We tested several expression conditions, such as temperature, IPTG concentration
and time of incubation. Figure 71 shows a typical coomassie stained gel of samples collected
after expression. The conditions of expression were 1 litre of bacterial culture incubated at
30°C with 0.5 mM IPTG for 5 hours. The expression of the TAP tag only is evident (figure
71A), whilst the expression of the inactive HRV2 and HRV14 2Apro is not visible (figure 71B
and 71C).

4. Results
105
Figure 71: Commassie stained 10% SDS-PAGE of the expression of: A) Tap tag, B) HRV2 2Apro-TAP and C) HRV14 2Apro-TAP. Lane M shows the protein standards in kDa. T: total fraction; I:
insoluble fraction; S: soluble fraction. The expression was carried out at 30°C with 0.5 mM IPTG for 5
hours. The samples were mixed with 2x Laemmli sample buffer; the volume loaded was 4µl (0.4% of
the sample total volume).
We thought that the amount of expressed proteins was not high and probably they
were not visible in the crude extract. Therefore, we decided to incubate the soluble fractions
with IgG beads (Amersham Biosciences) for 1 hour at 4°C, in order to remove non-specific
proteins and concentrate the tagged proteins. As can be observed in figure 72, the
expressed 2Apro and TAP tag were easily identified on a coomassie stained gel. The bands
observed at above 50 kDa and 25 kDa correspond to the heavy and light chains of IgG,
respectively.

4. Results
106
Figure 72: Commassie stained 10% SDS-PAGE of the soluble fractions from the expressions of TAP, HRV2 2Apro-TAP and HRV14 2Apro-TAP. A) TAP and HRV2 2Apro-TAP: lanes 1, 2, 4, 5 and 6
show the soluble fractions after incubation with IgG beads; lanes 1 and 5 were expressed at 30°C with
0.5 mM IPTG; lanes 2 and 6 were expressed at 30°C with 1mM IPTG; lane 4 was expressed at 37°C
with 1mM IPTG; lanes 3 and 7 are the supernatants after incubation. B) HRV14 2Apro-TAP: lane 1
shows the total fraction of the uninduced expression (30°C, 0.5 mM IPTG); lane 2 the total fraction of
the expressed protein; lane 3 the soluble fraction of the expressed protein; lane 4 the soluble fraction
after incubation with IgG beads and lane 5 shows the supernatant after incubation. The samples were
mixed with 2x Laemmli sample buffer; the volume loaded was 4µl (0.16% of the sample total volume).
The bands observed at above 50 kDa and 25 kDa correspond to the heavy and light chains of IgG,
respectively. Lane M shows the protein standards in kDa.
The samples bound to the IgG beads were further incubated with 50 mg of HeLa cells S10
extracts (see section 3.5.2.2) so that any putative binding partners of HRV2 and HRV14 2A
proteinases could bind them. Subsequently, the method described by Rigaut et al. (1999)
was used to purify any complexes. Figure 73 shows the result after purification and protein
precipitation. The precipitation step was necessary to remove the detergent present in the
buffer used to elute the complexes from the calmodulin beads (Ozols, 1990). The final pellet
was ressuspend in 50 mM of ammonium hydrogencarbonate (NH4HCO3).

4. Results
107
Figure 73: Silver stained 7 to 20% SDS-PAGE of TAP (A), HRV2 2Apro-TAP (B) and HRV14 2Apro-TAP (C). Lane M shows the protein standards in kDa. Lanes 2, 4 and 6 were incubated with 50 mg of
HeLa cells extracts; lanes 1, 3 and 5 were not incubated (negative controls). The arrows indicate
proteins that are not present on the negative controls. The samples were mixed with 2x Laemmli
sample buffer; the volume loaded was 5µl (2.5% of the sample total volume).
Several proteins were present only in the samples incubated with HeLa extracts (indicated by
the arrows in figure 73) and not in the negative controls. We decided therefore to send those
samples to be analysed by mass spectroscopy. The results are shown in appendix A.
4.4.2 Analysis of the putative binding partners Table 14 shows some of the proteins that were co-purified with HRV2 2Apro-TAP and
HRV14 2Apro-TAP. We selected these proteins due to their function in the cell and due to the
fact that other proteins with similar functions are cleaved by picornaviral 2Apro (see 1.1.8.3.4).
We focused on ribosomal proteins, translation and transcription factors, RNA binding
proteins and proteins involved in cell structure.

4. Results
108
Identified proteins function
eIF4GI translation
PABP translation
eEF1α translation
ß-actin cell structure and integrity
hnRNP U RNA binding protein
S17 Ribosomal protein
RAP74 Transcription factor
RBAF600 Interaction with
retinoblastoma protein
Table 14: Proteins purified with the TAP method and identified by mass spectroscopy. These
proteins were selected for further investigation due to their function in the cell.
One candidate, the retinoblastoma-associated factor 600 (RBAF600), was excluded
after literature research revealed that this factor binds calmodulin (Nakatani et al., 2005). As
we could not obtain antibodies against ribosomal protein S17, hnRNPU protein and
eukaryotic translation elongation factor 1 alpha (eIF1 α), they were also excluded from future
research. Finally, we considered the protein eIF4GI, binding to HRV2 2Apro, as a positive
control for this method (Foeger et al., 2002) as well as the PABP, which is cleaved by CVB3
2Apro (Kerekatte et al., 1999) and PV 3Cpro (Kuyumcu-Martinez et al., 2002). β-actin was
chosen as putative HRV 2Apro binding partner.
We started the analysis of the putative interaction of β-actin with HRV2 and HRV14
2Apro by performing GST pull downs to confirm its binding to 2Apro. Figure 74 shows ̴1 µg of
the expressed GST tag, HRV2 2Apro C106A - GST and HRV14 2Apro C109A - GST
expressed in JM101 cells and bound to glutathione-sepharose beads.

4. Results
109
Figure 74: Commassie stained 12.5% SDS-PAGE of GST tag (lane 1), HRV2 2Apro C106A – GST (lane2) and HRV14 2Apro C109A – GST (lane 3).
These samples were incubated with 8 µl RRL overnight at 4°C, and after elution of
the proteins from the beads with Laemmli sample buffer, we performed western blots against
eIF4GI, PABP and β-actin. We chose RRL to perform the incubations because these extracts
come from mammalian cells and contain all the proteins that we decided to test (Pelham and
Jackson, 1976). The results of the experiment are shown in figure 75. eIF4GI and PABP bind
to HRV2 2Apro but not to HRV14 2Apro (figure 75A and B). However, as HRV14 2Apro is known
to cleave eIF4GI and PABP (personal communication of Luiza Deszcz), the fact that the pull-
down experiments do not show an interaction between the HRV14 2Apro and these two
proteins could indicate that the affinity of HRV14 2Apro for PABP and eIF4GI is low or that the
binding is reversible, as it was observed for the interaction between Lbpro and eIF4GI (Foeger
et al., 2002). β-actin does not bind neither HRV2 2Apro nor HRV14 2Apro (figure 75C).

4. Results
110
Figure 75: GST pulldown of eIF4GI (6% SDS-PAGE) (A), PABP (12.5% SDS-PAGE) (B) and β-actin (12.5% SDS-PAGE) (C). Glutathione-Sepharose beads coated with purified GST (lane 2) and
with GST- HRV2 2Apro and GST- HRV14 2Apro (lanes 3 and 4, respectively). Lane 1 shows the input
loading, corresponding to 2µl of RRL. The bound proteins were detected by immunoblotting using the
antisera of eIF4GI (1:8000), PABP (1:1000) and β actin (1:1000). Protein standards in kDa are shown
on the left side of the panel.
Although β-actin does not bind HRV2 or HRV14 2Apro, we still wanted to see whether
this protein is cleaved by the viral proteinases, as the interaction could be too weak to be
observed with GST-pulldown experiments. Additionally, we also tested the eIF1α for
cleavage as we were able to obtain an antibody against it (gift from Regina Cencic). To this
end, we incubated 8µl of RRL (promega) and 50 mg of HeLa cell extracts with 100 ng of
HRV2 and HRV14 2Apro at 30°C (overnight with the HeLa extracts and 2 hours with the
RRLs) and performed a western blot against β-actin and the eIF1α. PAPB was used as
control for the cleavage by HRV 2Apro (Luiza Deszcz, personal communication). Figure 76
shows that HRV2 2Apro is not able to cleave either β-actin or eIF1α. HRV14 2Apro is also not
able to cleave eIF1α under the conditions used.

4. Results
111
Figure 76: Immunoblot of 12.5% SDS-PAGE of β actin, PABP and eIF1 α. 50 mg of HeLa cell
extracts or 8 µl of RRL (Promega) were incubated with 100 ng of recombinant HRV2 and HRV14 2Apro
at 30°C during 2 hours (RRL) or overnight (HeLa extracts). A) α-PABP (1:1000); lane 1 shows RRLs
without HRV2 2Apro; lane 2 RRLs incubated with HRV2 2Apro. B) anti β-actin (1:1000); lane 1 shows
RRLs without HRV2 2Apro; lane 2 RRLs incubated with HRV2 2Apro. C) α-eIF1α (1:2000); lane 1
shows Hela cell extracts not incubated; lane 2 HeLa cell extracts incubated without proteinases; lane 3
Hela cell extracts incubated with HRV2 2Apro and lane 4 RRLs incubated with HRV14 2Apro.
4.4.3 Alternative approach for expression and purification of the protein complexes The results shown above were not satisfactory. Therefore, we decided to modify the
method. Instead of over-expressing the HRV2 and HRV14 2Apro in bacteria, we decided to
transiently transfect human cells with the same proteinases. We used the pMZI vector,
developed by Zeghouf et al. (2003) which was given to us by J. K. Greenblatt. This vector
contains an ecdysone promoter and the TAP tag. The ecdysone promoter allows the use of
the Ecdysone-Inducible Mammalian Expression System (Invitrogen). In this system we use
ponasterone A, an analogue of ecdysone, to induce the expression of the gene cloned
downstream of the promoter. As mammalian cells are not responsive to ecdysone or
analogs, the basal levels of transcription are very low (Ecdysone-Inducible Mammalian
Expression System, version E, Invitrogen).
The inactive forms of HRV2 2Apro and HRV14 2Apro were cloned into pMZI vector
using the restriction enzymes NdeI and XhoI, in frame with the TAP tag which is located in
the 3’ end of the construct (figure 77). The new vectors were named pMZI-HRV2 2Apro
C106A and pMZI-HRV14 2Apro C109A.

4. Results
112
Figure 77: Cloning strategy to introduce the inactive forms of HRV2 and HRV14 2Apro into pMZI. A) pMZI-HRV2 2Apro C106A. B) pMZI-HRV14 2Apro C109A. The ORFs were amplified with the primers
TIM1474 and TIM1475 (A) and TIM1476 and TIM1477 (B) and introduced into pMZI digested with
NdeI and XhoI. The TAP tag is C-terminal.
HEK 293T cells are highly transfectable (ATCC). Therefore we chose these cells for
this set of experiments, in which the pMZI vectors were co-transfected with the vector
pVgRXR from the Ecdysone-Inducible Mammalian Expression System (Invitrogen). The
transfection was done using lipofectamin 2000 from Invitrogen, following the manufacturer
instructions. The expression was induced using ponasterone A (Invitrogen) and cell extracts
were prepared from several time points to observe the progress of the protein expression.
Figure 78 shows the result of the first small scale transfection (6 well plate), in which the
expressed HRV2 2Apro-TAP and HRV14 2Apro-TAP can be observed. For the protein
detection, we used a polyclonal antibody against HRV2 2Apro which also detects the protein A
domain of the TAP tag. Protein A binds to the Fc region of the antibody.

4. Results
113
Figure 78: immunoblot of 12.5% SDS-PAGE showing the expression of HRV2 2Apro-TAP and HRV14 2Apro-TAP after a small scale transfection of HEK-293T cells. The proteins were detected
by immunoblotting using the HRV2 2Apro antiserum (1:1000). Protein standards in kDa are shown in
line M. Lane 10 shows a positive control for the immunoblot (HRV2 2Apro-TAP). The antiserum used is
targeting the protein A, which is part of the TAP tag.
After confirming that the transfection was successful, we performed large scale
experiments using the protocol described by Anne-Claude Gingras (see section 3.5.3.5.2).
However, the large scale experiments did not show any expression of 2Apro; only the TAP tag
alone is expressed (figure 79).
Figure 79: Immunoblot of 12.5% SDS-PAGE showing the expression of HRV2 2Apro-TAP and HRV14 2Apro-TAP after transfection of 2x10⁶ HEK-293T cells and 48 hours expression. The
proteins were detected by immunoblotting using the HRV2 2Apro antiserum (1:1000). Lane 1 shows the
non transfected sample; lane 2 the TAP tag; lanes 3 and 4 show HRV2 2Apro-TAP and HRV14 2Apro-
TAP respectively. Protein standards in kDa are shown in line M. The antiserum used is targeting the
protein A, which is part of the TAP tag.

4. Results
114
As the TAP tag is visible on the western blots, a possible technical error could be excluded.
Instead, we thought of the possibility of the HRV2 and HRV14 2Apro being toxic for the cells.
For this reason we wanted to know how cells react to other viral proteins. Can HEK 293T
cells overexpress other 2Apro or proteinases of other viruses? To this end, we cloned the
inactive forms of HIV 1 proteinase (provided by Petra Schlick (Schlick, 2004)), CVB4 2Apro
(constructed by Andreas Roetzer (Roetzer, 2004)) and FMDV Lbpro (constructed by Regina
Cencic (Cencic, 2005)) into the pMZI vector using the restriction enzymes NdeI and XhoI
(figure 80). The new vectors are pMZI-HIV1pro D25A D125A (encodes a protein product of
42.5 kDa), pMZI-CBV4 2Apro C110A (encodes a protein product of 37.0 kDa) and pMZI-
FMDV Lbpro C51A (encodes a protein product of 40.3 kDa).
Figure 80: Cloning strategy to introduce the inactive forms of HIV1 protease, CBV4 2Apro and FMDV Lbpro into pMZI. A) pMZI-HIV1pro D25A D125A (primers TIM1518 and TIM1519). B) pMZI-

4. Results
115
CBV4 2Apro C110A (primers TIM1520 and TIM1521). C) pMZI-FMDV Lbpro C51A (primers TIM1522
and TIM1523). The ORFs were introduced into pMZI digested with NdeI and XhoI. The TAP tag is C-
terminal.
These plasmids were transfected into HEK 293T cells. The protein complexes were purified
via the same methods used for pMZI-HRV2 2Apro C106A and pMZI-HRV14 2Apro C109A. The
expression was induced for 48 hours with different concentrations of ponasterone A. Only
pMZI-FMDV Lbpro was successfully expressed (figure 81).
Figure 81: immunoblot of 12.5% SDS-PAGE showing the expression pMZI-TAP (A), HIV 1pro-TAP (B), CBV4 2Apro-TAP (C) and FMDV Lbpro-TAP after a large scale transfection of HEK-293T cells and 48 hours expression (D). The proteins were detected by immunoblotting using the HRV2
2Apro antiserum (1:1000). Lane 1 shows the non transfected sample; lanes 2 to 6 show the induction
with different concentrations of ponasterone A. Lane 7 shows a positive control for the immunoblot
(HRV2 2Apro-TAP). Protein standards in kDa are shown in line M. The antiserum used is targeting the
protein A, which is part of the TAP tag.
The eluted fractions of pMZI-FMDV Lbpro and pMZI from the calmodulin beads were
quantified and loaded on a 7 to 20% SDS-PAGE for silver staining (figure 82) and sent for
mass spectroscopy analysis. Lbpro cleaved of the protein A (first part of the TAP tag) has a
molecular weight of 22.8 kDa and it was not observed on the gel. The band running at 37
kDa (figure 82, lane 2) might be glyceraldehyde-3-phosphate dehydrogenase or annexin A2,

4. Results
116
according wtih the results presented in tables 20 and 21 (appendix A). Unfortunately none of
the 28 proteins identified appeard to be a promising candidate for a binding partner. Also, the
one the protein that is known to bind Lbpro, the eIF4GI is missing. Possibly the amount of
purified protein complexes was not sufficient for mass spectroscopy detection.
Figure 82: Silver stained 7 to 20% SDS-PAGE of TAP FMDV Lbpro-TAP. After transfection and
expression for 48 hours in HEK-293T cells, the cells were lysed and the supernatants were purified
using the TAP tag protocol (see section 3.5.3.5.2). The volume loaded was 15µl (3.7% of the sample
total volume). Protein standards in kDa are shown in line M.
The new strategy for the TAP tag protocol is closer to physiological conditions.
Although the viral proteins are still over-expressed, the interaction with the cellular
components occurs in biological conditions where the proteins are in native conditions and
functional. This difference from first method is an improvement as it can help to minimize the
number of false positives. However, it is necessary to determine whether over-expression of
picornaviral proteinases in human cells, even in their inactive forms, is harmful for the cells.
Of all the proteinases tested, only the FMDV Lbpro was successfully expressed, though the
results from the TAP purification failed to show any promising binding partners. Therefore,
further experiments must be done to optimise and scale-up the method.

5. Discussion
117
5 Discussion
HRV are responsible for about 50% of the common cold. Although common cold is not
a severe infection it has a major economic impact. It is estimated that $40 billion are spent
every year in the United States to treat common cold (Fendrick et al., 2003). Therefore, it is
very important to study and understand these viruses.
There has been constant research to find a vaccine against HRV. However the large
number of HRV serotypes makes this task very difficult as one serotype is not neutralized by
antibodies produced against other serotype. An alternative approach is to develop antiviral
drugs against the non-structural proteins.
Until recently, picornaviral 3Cpro and its precursor 3CD have been seen as the main
potential drug targets. 3Cpro is the most well studied picornaviral proteinase as it performs the
majority of the maturation cleavages on the polyprotein. Among the inhibitors developed
against these proteins is the rupintrivir (formerly known as AG-7088), an irreversible inhibitor of
rhino- and enteroviruses 3Cpro (Binford et al., 2005). Rupintrivir has been tested in clinical trials
and the results showed that this inhibitor is able to moderate the severity of the symptoms and
reduce the viral load during infection (Binford et al., 2007). Another inhibitor similar to rupintrivir
is “compound 1” ((E)-(S)-4-((S)-2-(3-[(5-methyl-isoxazole-3-carbonyl)-amino]-2-oxo-2H-pyridin-
1-yl)-pent-4-ynoylamino)-5-((S)-2-oxo-pyrrolidin-3-yl) pent-2-enoic acid ethyl ester), which also
demonstrated broad-spectrum activities against several HRV serotypes tested in vitro (Patick
et al., 2005). These inhibitors interact with conserved residues of 3Cpro suggesting efficacy
against a broad number of serotypes (Matthews et al., 1999).
However, as mentioned in sections 1.1.8.3.1 and 4.1.2 HRV 2Apro of picornaviruses are
potential targets for antiviral drugs. Yet, these proteins vary greatly among the different
serotypes. In order to develop effective inhibitors, it is of great importance to understand the
substrate specificity of the different rhinoviral 2Apro.
The work in this thesis covered three aspects in order to characterize two rhinoviral
2Apro, namely the investigation of the specificity of HRV2 and HRV14 2Apro during substrate
recognition, the expression and purification of HRV14 2Apro and the cellular initiation factor
eIF4GII for structural studies as well a the search for new cellular binding partners of
picornaviral proteinases.
5.1 Specificity of HRV 2A proteinases The first part of this work was centred on determining the substrate specificity of the
2Apro of HRV2 and HRV14. These two proteins share only 40% amino acid residues. We
showed that HRV2 and HRV14 2Apro have different kinetics when processing eIF4GI in vitro

5. Discussion
118
(figure 16) and we wanted to know which residues are responsible for the differences
observed.
We found that HRV14 2Apro is not able to process the polyprotein when the cleavage
sequence is that of eIF4GI. In contrast, HRV2 2Apro processes a polyprotein bearing the
eIF4GI cleavage sequence at practically wild type levels. One caveat could be that it is
necessary to determine the sequence cleavage in eIF4GI for HRV14 and other group B
rhinoviruses to see whether the same site is used for cleavage. However, as eIF4GI is cleaved
by CV and PV 2Apro at the same sequence as HRV2 2Apro (Lamphear et al., 1993; Zamora et
al., 2002), the hypothesis that HRV14 2Apro can cleave eIF4GI at the same sequence seems
plausible. Actually, our results showed that a single modification on the cleavage sequence of
eIF4GI was sufficient to HRV14 2Apro recognize the cleavage site. This modification was made
at P1 position in which we replaced the arginine by a tyrosine (the residue recognized by
HRV14 2Apro in the polyprotein). We then introduced new mutations at P3 and P2’ sites which
also show differences among the two proteinases. The results showed that these mutations
did not produce any effect on the performance of the protease, enhancing the significance of
the P1 site for substrate recognition by HRV14 2Apro.
Considering that HRV B group rhinoviruses, amongst them HRV14 2Apro, are closer
related to enteroviruses than to group A rhinoviruses (Laine et al., 2005), we wanted to see
whether PV1 2Apro was also unable to recognize an arginine at P1 position. We would have
expected a result similar to HRV14 2Apro as the wild type residue at P1 position in the
polyprotein is a tyrosine for both HRV14 and PV (table 13). Additionally, the sequence identity
is higher between HRV14 2Apro and PV1 2Apro than between HRV14 2Apro and HRV2 2Apro
(figure 83). Surprisingly, the outcome of this experiment was only a slight delay on the activity
of the 2Apro. This indicates that the 2Apro specificity lies mainly in the non-conserved regions of
the protein.
A
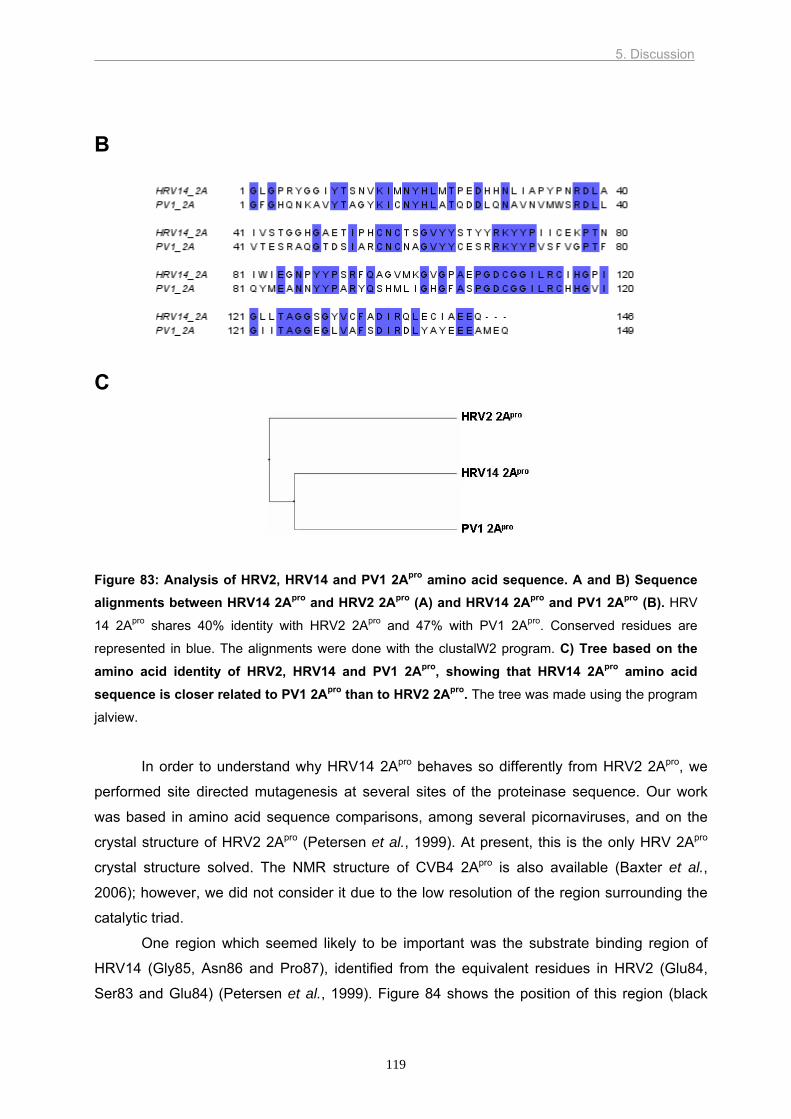
5. Discussion
119
B
C
Figure 83: Analysis of HRV2, HRV14 and PV1 2Apro amino acid sequence. A and B) Sequence alignments between HRV14 2Apro and HRV2 2Apro (A) and HRV14 2Apro and PV1 2Apro (B). HRV
14 2Apro shares 40% identity with HRV2 2Apro and 47% with PV1 2Apro. Conserved residues are
represented in blue. The alignments were done with the clustalW2 program. C) Tree based on the amino acid identity of HRV2, HRV14 and PV1 2Apro, showing that HRV14 2Apro amino acid sequence is closer related to PV1 2Apro than to HRV2 2Apro. The tree was made using the program
jalview.
In order to understand why HRV14 2Apro behaves so differently from HRV2 2Apro, we
performed site directed mutagenesis at several sites of the proteinase sequence. Our work
was based in amino acid sequence comparisons, among several picornaviruses, and on the
crystal structure of HRV2 2Apro (Petersen et al., 1999). At present, this is the only HRV 2Apro
crystal structure solved. The NMR structure of CVB4 2Apro is also available (Baxter et al.,
2006); however, we did not consider it due to the low resolution of the region surrounding the
catalytic triad.
One region which seemed likely to be important was the substrate binding region of
HRV14 (Gly85, Asn86 and Pro87), identified from the equivalent residues in HRV2 (Glu84,
Ser83 and Glu84) (Petersen et al., 1999). Figure 84 shows the position of this region (black

5. Discussion
120
rectangle). However, changes in this region had no effect on the HRV14 2Apro mutant bearing
an arginine at P1. Furthermore, in the reciprocal experiment, when the residues from HRV14
2Apro were introduced into HRV2 2Apro sequence (Glu84Pro and Glu82Gly), no influence on the
recognition of substrate by the HRV2 2Apro was observed.
Figure 84: The structure of HRV2 2Apro. Ribbon diagrams of the overall structure of HRV2 2Apro (Same as figure 23). The single α-helix is shown in green, the β-strands of the N-terminal and C-
terminal domains are shown in silver and deep blue, respectively. The three residues of the catalytic
triad are shown as are residues C101 and E102. Residues 82 to 85 are marked with a black rectangle.
The figure was generated using the program Molscript (Kraulis, 1991) and was a kindly prepared by
Christina Mayer.
Further analysis of HRV2 2Apro identified the Cys101 side chain (corresponding to
Ala104 in HRV14 2Apro) as a important residue for substrate recognition. This residue
protrudes into the S1 pocket, the site on the enzyme that recognizes the P1 substrate residue
(figure 84). At the end of the pocket, the presence of Glu102 provides a negative charge which
presumably assists in accepting the positive charge of the arginine at position P1 (Petersen et
al., 1999). Further support for the importance of Cys101 and Glu102 was obtained from the
structure of the Streptomyces griseus proteinase B (SGPB). This enzyme is the closest related
serine protease to picornaviral 2Apro. Interestingly, the equivalent residues in this protease to
the ones mentioned above are Ala192 and Glu192A (Bateman et al., 2000). Bateman et al.
(2000) found that an inhibitor with tyrosine at the P1 position bound to SGPB 10 to 20 times
stronger than another inhibitor with arginine at P1 position. These results support the role of
Cys101 and thus of the equivalent Ala104 in the specificity of HRV14 2Apro. Additionally, the
residue content at position 101 (for HRV2 and correspondent residue for other picornaviruses)
is consistent with the amino acid content at the P1 position (see table 13). Based on these
analyses, we decided to replace the Ala104 of HRV14 2Apro, containing the arginine at P1
position, by a cysteine and by a serine. We were expecting that the HRV14 2Apro would

5. Discussion
121
accept the arginine at P1 position and perform the cleavage from VP1, like HRV2 2Apro, at
least for the mutant containing a cysteine at position 104. However, the rate of self-processing
was far from being restored to the wild type levels. Evidently, other residues are also involved
in recognition of the P1 residue. Thus, the structure of HRV14 2Apro is required before
identification of such residues can be made, given the low level of identity between HRV2 and
HRV14 2Apro.
In PV1 2Apro, the residue at position 104 is alanine as for HRV14 2Apro; however, the
residue corresponding to Glu102 is a serine. This could help explain why PV1 2Apro can accept
an arginine at P1 position, in contrast with HRV14 2Apro. However, once again, the low level of
similarity between the two proteins renders difficult the identification of other residues involved
in determining specificity.
We have shown that HRV2 2Apro and HRV14 2Apro differ significantly in the specificity at
P1 position. It will be interesting to investigate whether these differences are related with
differences in pathogenicity of viruses from the two genetic groups. Furthermore, these
differences have to be taken into account when designing inhibitors. Indeed, Deszcz et al.
(2006) reported recently a specific inhibitor for 2Apro which is active against several HRV 2Apro
and CVB4 2Apro in vitro (see sections 1.1.8.3.1 and 4.1.2). However, zVAM.fmk inhibits
different 2Apro to different extents. HRV2 2Apro is inhibited in the intermolecular cleavage of
eIF4GI and not during the self-processing whilst HRV14 2Apro is affected during the self-
processing and, to a lesser extent, in the intermolecular cleavage. The sensitivity of 2Apro to
zVAM.fmk during the intermolecular cleavage varies from the nanomolar range for HRV2 2Apro
to the micromolar range for HRV14 2Apro. CBV4 is inhibited at intermediate levels between
HRV2 and HRV14 2Apro. We showed that PV1 2Apro is not inhibited at the intramolecular
cleavage. In contrast, the intermolecular cleavage as well as viral replication are inhibited by
zVAM.fmk (K. Kirkegaard, personal communication). These results are summarised in table
15.
zVAM.fmk effect in picornaviral 2Apro and caspases activity
Protein Polyprotein cleavage (intramolecular)
Cleavage of eIF4GI (intermolecular)
HRV2 2Apro
HRV14 2Apro
PV1 2Apro
CVB4 2Apro
Pro-caspase 9
++
+++
-
?
-
+++
+
+++
+
-
Table 15: Summary of the effect of zVAM.fmk on the inhibition of picornaviral 2Apro.

5. Discussion
122
In conclusion, we have shown that HRV2 and HRV14 2Apro have different specificities
at the P1 position in the polyprotein context. Furthermore, our results showed that the residue
in position 101 of HRV2 2Apro (104 for HRV14 2Apro) is involved in the discrimination of the
residues accepted by these proteinases at the P1 site. These results, together with the
structure of HRV14 2Apro, will help to understand the mechanisms of HRV 2Apro and facilitate
the discovery of new inhibitors.
5.2 Protein purification for crystallization and NMR experiments Rhinoviral and enteroviral 2Apro cleavage mechanisms vary at a great extent. For
instance, it was shown that PV 2Apro cleaves eIF4G in the same manner as HRV2 2Apro
(Cencic, 2005) and not as HRV14 2Apro, although PV is closer related to group B HRVs
(Laine et al., 2005). Additionally, the mechanisms used by 2Apro to cleave eIF4G are still a
matter of controversy (see section 1.1.8.3.4).
To better understand HRV14 2Apro mechanisms, we set out to purify and crystallize
HRV14 2Apro. In addition, we wanted to understand the interaction of this and other
picornaviral proteinases, such as FMDV Lbpro, with the cellular protein eIF4G. For that we
planned to obtain a fragment of eIF4GII, containing the binding site for eIF4E and the
cleavage sites for FMDV Lbpro and HRV2 2Apro (residues 552 to 744) for crystallization and
for NMR experiments. Although the structures of two fragments of eIF4GI are available
(residues 393 to 490 (Gross et al., 2003) and residues 745 to 1003 (Marcotrigiano et al.,
2001), none of these fragments contain neither binding sites nor cleavage sites for
picornaviral proteases.
The purification of both proteins was successful, although the expression levels were
low and the proteins were mainly insoluble. We obtained 1.2 mg of HRV14 2Apro at a
concentration of 2.83 mg/ml; 1.5 mg of eIF4GII at a concentration of 2.4 mg/ml and 0.25 mg
of 15N labelled eIF4GII at a concentration of 150 µM. However, it was not possible to set
either protein for crystallization because they appeared unstructured after purification.
We found HRV14 2Apro to be unstable at high concentrations under pH 9.0 in the
buffers used throughout this work, remarkably different from HRV2 2Apro which is folded and
active at pH 8.0. The buffer contents are mainly 50 mM Tris-HCl pH 9.0 and 50 mM NaCl.
Perhaps a higher concentration of NaCl will help HRV14 2Apro to keep its structure during the
purification process.
The domain of eIF4GII purified was also unstructured, both in the samples prepared
for crystallization and in the labelled sample prepared for NMR studies. However, this
observation was not surprising as it has been shown that the binding of eIF4E induces

5. Discussion
123
changes in the conformation of eIF4GI (Gross et al., 2003; Hershey et al., 1999). We believe
that eIF4E and picornaviral proteinases such as FMDV Lbpro can also introduce modifications
in the structure of eIF4GII. Therefore, we performed a second NMR experiment in which a
four fold excess of inactive FMDV Lbpro was added to the 15N labelled eIF4GII. Unfortunately,
the results showed that eIF4GII was, once again, unstructured. One of the reasons could
have been the rather low concentration of eIF4GII upon addition of FMDV Lbpro. However, we
believe that the complex with eIF4E is of primary importance, as the formation of the
complex eIF4GII-eIF4E seems to acquire a structure that is better recognized by picornaviral
2Apro (Haghighat et al., 1996). To this end, we expressed and purified eIF4E to a level of
purity and concentration sufficient to perform preliminary NMR experiments. Unfortunately,
these experiments fall out of the time frame of this thesis. Nevertheless, we believe that the
addition of an excess of non labelled eIF4E to 15N labelled eIF4GII will form a stable and well
structured complex and we will be able to solve the structure of this important domain.
However, the expression of eIF4GII probably needs to be done in eukaryotic cells, as our
results showed that only the fragment of eIF4GII expressed in Sf9 cells was putatively
recognized by the HRV14 3Cpro (see section 4.3.1). These results indicate that eIF4GII only
acquires a correctly folding state when expressed in a eukaryotic system, perhaps due to
post-translation modifications.
5.3 Screening of HRV2 and HRV14 2Apro binding partners Picornaviral 2Apro bind and cleave several cellular proteins. Rhinovirus and
enterovirus 2Apro cleave eIF4G and PABP. HRV14 2Apro cleaves cytokeratin 8. PV 2Apro
cleave TATA-box binding protein (TBP) and two nuclear pore complex (NPC) proteins,
Nup153 and Nup62. CV 2Apro cleave dystrophin causing cardiomyopathy (Badorff et al.,
2000; Badorff et al., 1999; Foeger et al., 2002; Kerekatte et al., 1999; Park et al., 2008;
Seipelt et al., 2000; Yalamanchili et al., 1997a).
Despite this long list we wanted to find out whether other and yet undetected partners
in the host cell for HRV2 and HRV14 2Apro exist. To that end, we chose the TAP method
developed by Rigaut et al. (1999). We used a different approach in that the 2Apro were over
expressed in E. coli and after sonication and binding to IgG beads they were incubated with
HeLa extracts.
Two proteins that are known to bind HRV2 2Apro were found, eIF4GI and PABP
((Foeger et al., 2002) and Luiza Deszcz, personal communication). We considered the
interaction of these proteins with the 2Apro as positive controls for the method. However,
cytokeratin 8 was not found. One of the reasons for this result could have been that the
interaction of cytokeratin 8 with HRV14 2Apro is very weak or that the expression levels of this

5. Discussion
124
protein is below the limit of sensitivity of the detection method used. The amount of total
protein extract was very high and proteins that are highly expressed can mask other proteins
that have very low expression levels.
We selected some proteins co-purified with the HRV2 and HRV14 2Apro and identified
by mass spectroscopy analysis to use in further experiments in order to confirm their
interaction with 2Apro. The criteria for the choice were the role of the proteins in the cell. For
instance, the identified proteins should be involved in transcription, translation or be part of
the cytoskeleton. A literature search excluded some of the candidates such as
retinoblastoma-associated factor 600 (RBAF600), which binds to calmodulin beads (Nakatani
et al., 2005). Our interest in this protein was based on the known interaction of other viral
proteins with retinoblastoma, namely simian virus 40 (SV40) (Moens et al., 2007). Some of
the proteins selected like ribosomal protein S17 or hnRNPU could not be investigated due to
lack of antibodies. It will be of interest to acquire antibodies and perform pull-down
experiments to confirm whether there is an interaction with HRV2 and HRV14 2Apro.
In the end, three of the selected proteins were tested for interaction with HRV2 and
HRV14 2Apro. β-actin and PABP were tested for binding and cleavage. The translation factor
eEF1α was tested for cleavage. The results showed that PABP binds and is cleaved by
HRV2 2Apro, confirming the results of Luiza Deszcz (data not shown). In contrast, β-actin
does not bind neither is cleaved by HRV2 and HRV14 2Apro. Finally, the eEF1α is not
cleaved by any of the two proteases in vitro; therefore we did not perform the binding
experiments. The outcome of this work suggests that the method used was not optimal;
perhaps the amount of cell extract used for incubation was too high, which raised such an
elevated number of false positives.
To achieve conditions closer to physiological levels we used the vector (pMZI) for
human cells transfection which contains the TAP tag, developed by Zeghouf et al. (2004).
We introduced the inactive forms of HRV2 and HRV14 2Apro in this vector and transfected
transiently human HEK 293T cells with the two constructs. We did not success in expressing
the viral proteases in large scale experiments; only cells transfected with the empty vector
expressed the TAP tag. We hypothesised that HRV2 and HRV14 2Apro can be toxic for the
cells, even the inactive form, and maybe the expression would have been blocked.
Therefore, we decided to clone the inactive forms of HIV 1 protease, CVB4 2Apro and FMDV
Lbpro in the pMZI vector and tried to express them. Only FMDV Lbpro was successfully
expressed; however, the results from the mass spectroscopy analysis did not reveal any
potential Lbpro binding partner. For the other proteins, it is possible that they are toxic for the
cells.
In conclusion, the TAP method is a useful tool for identification of protein-protein
interactions. The modifications that we introduced in the method only worked partially. We

5. Discussion
125
were able to confirm two interactions of cellular proteins with 2Apro; however we failed in
identifying new binding partners for these proteinases. Further optimization of the method is
necessary, namely find the optimal expression conditions in the HEK 293T cells or even try
the expression of 2Apro-TAP tag in yeast by creating stable clones expressing the inactive
viral proteins, as described in the original method (Rigaut et al., 1999).

6. Appendixes
126
6 Appendixes 6.1 Appendix A Mass spectroscopy results for the TAP experiments HRV14-2Apro C109A negative control
Table 16: HRV14-2Apro C109A negative control. Search against the mammalian subset of the NCBI
nr database.
protein Mass kDa score
gi|223036
troponin C-like protein
16696 889
gi|109327
myosin-light-chain kinase (EC
2.7.1.117), skeletal muscle -
rabbit
65997 635
gi|162648
albumin [Bos taurus]
71244 494
gi|106586
Ig kappa chain V-III (KAU cold
agglutinin) - human
23037 170
gi|27806751
alpha-2-HS-glycoprotein [Bos
taurus]
39193 105
gi|33700
immunoglobulin lambda light
chain [Homo sapiens]
25519 72
gi|29649713
protease serine 1 [Homo
sapiens]
9218 64

6. Appendixes
127
HRV14-2Apro C109A positive
protein Mass kDa score
gi|4506787
IQ motif containing GTPase
activating protein 1 [Homo sapiens]
189761 1610
gi|12667788
myosin, heavy polypeptide 9, non-
muscle [Homo sapiens]
227646 1591
gi|223036
troponin C-like protein
16696 1553
gi|18088719
Tubulin, beta polypeptide [Homo
sapiens]
50096 1342
gi|15277503
ACTB protein [Homo sapiens]
40536 1039
gi|42476013
NHL repeat containing 2 [Homo
sapiens]
80249 760
gi|2119266
tubulin alpha-1 chain - human
50804 705
gi|5729877|ref|NP_006588.1| heat
shock 70kDa protein 8 isoform
gi|14993776
skeletal myosin light chain kinase
[Homo sapiens]
65214 539
gi|16507237
heat shock 70kDa protein 5
(glucose-regulated protein, 78kDa)
[Homo sapiens]
72402 386
gi|162648
albumin [Bos taurus]
71244 374
gi|17986258
smooth muscle and non-muscle
myosin alkali light chain isoform 1
[Homo sapiens]
17090 323
gi|19070472 retinoblastoma-associated factor 600 [Homo sapiens]
580607 308
gi|5123454|ref|NP_005336.2| heat
shock 70kDa protein 1A [Homo
sapiens]

6. Appendixes
128
protein Mass kDa score
gi|57209936
melanoma antigen, family D, 2
[Homo sapiens]
55932 266
gi|4506693 ribosomal protein S17 [Homo sapiens]
15597 256
gi|266992
Splicing factor, arginine/serine-rich 2
(Splicing factor SC35) (SC-35)
(Splicing component, 35 kDa)
25560 245
gi|14141163 heterogeneous nuclear ribonucleoprotein U isoform a [Homo sapiens]
91164 225
gi|189998
M2-type pyruvate kinase
58447 201
gi|5032069
splicing factor 3b, subunit 4 [Homo
sapiens]
44414 179
gi|16741043
MRCL3 protein [Homo sapiens]
19839 174
gi|54696696
annexin A1 [Homo sapiens]
38918 173
gi|7706310
LUC7-like 2 [Homo sapiens]
48104 169
gi|48734733 Eukaryotic translation elongation factor 1 alpha 1 [Homo sapiens]
50438 161
gi|42490910
Ribosomal protein L13 [Homo
sapiens]
24308 127
gi|538581 polyadenylate-binding protein - human
70508 126
gi|54696638
heat shock 27kDa protein 1 [Homo
sapiens]
22826 125
gi|45219787
Ribosomal protein S3a [Homo
sapiens]
30184 120
gi|106529
Ig kappa chain C region (allotype
Inv(1,2)) - human (fragment)
11161 109

6. Appendixes
129
protein Mass kDa score
gi|12803339
PAI-RBP1 protein [Homo sapiens]
44291 100
gi|4506455
reticulocalbin 1 precursor [Homo
sapiens]
38866 99
gi|62897725|dbj|BAD96802.1|
ribosomal protein L19 variant [Homo
gi|2521983|dbj|BAA22652.1|
alpha2-HS glycoprotein [Homo
sapiens]
gi|33150766
heparin-binding protein HBp15
[Homo sapiens]
14866 86
gi|19343694
MAP7 protein [Homo sapiens]
84146 81
gi|61369330|gb|AAX43318.1|
nuclease sensitive element binding
gi|7657532|ref|NP_055439.1| S100
calcium-binding protein A6
gi|56205102
single stranded DNA binding protein
3 [Homo sapiens]
28692 69
gi|16924231
ribosomal protein S19 [Homo
sapiens]
17271 66
gi|51471019
PREDICTED: similar to 60S
ribosomal protein L29 (Cell surface
heparin binding protein HIP) [Homo
sapiens]17146
59
Table 17: HRV14-2Apro C109A positive. Search against the mammalian subset of the NCBI nr
database. The highlighted proteins were considered relevant for this work.

6. Appendixes
130
HRV2-2Apro C106A negative control
protein Mass kDa score
gi|7766868
Chain B, 2a Cysteine Proteinase From
Human Rhinovirus 2
16596 2954
gi|54306511
CTAP-tag [Cloning vector pUAST-
CTAP]
20524 1229
gi|50507914
yellow cameleon 2.60 [synthetic
construct]
73565 1031
gi|38491478
GroEL [Escherichia coli]
57434 719
gi|208991
protein A signal fusion protein
27046 454
gi|71665
calmodulin - electric eel
16799 432
gi|223036
troponin C-like protein
16696 408
gi|26246446
Trigger factor [Escherichia coli
CFT073]
48221 250
>gi|16131182|ref|NP_417762.1| 30S
ribosomal subunit protein S5
[Escherichia coli K12]
gi|229552
albumin [Bos taurus]
68083 147
gi|16974825
Chain A, Solution Structure Of
Calcium-Calmodulin N-Terminal
Domain
8483 135
gi|106529
Ig kappa chain C region (allotype
Inv(1,2)) - human (fragment)
11161 130
gi|12516297
galactitol-specific enzyme IIA of
phosphotransferase system
[Escherichia coli O157:H7]
17011 99
gi|29649713
protease serine 1 [Homo sapiens]
9218 93
gi|25013638
NIa-Pro protein [Tobacco etch virus]
27738 82

6. Appendixes
131
protein Mass kDa score
gi|261553
GTP cyclohydrolase I (N-terminal)
[Escherichia coli, Peptide Partial, 50
aa, segment 1 of 2]
5544 73
gi|4506773
S100 calcium-binding protein A9
[Homo sapiens]
13291 68
gi|457116
S20 protein
9763 61
>gi|16131199|ref|NP_417779.1| 50S
ribosomal subunit protein L3
[Escherichia coli K12]
gi|226334
myosin L kinase
36258 1854
Table 18: HRV2-2Apro C106A negative control. Search against all entries in the NCBI nr database.

6. Appendixes
132
HRV2-2Apro C106A positive
protein Mass kDa score
gi|7766868
Chain B, 2a Cysteine
Proteinase From Human
Rhinovirus 2
16596 18034
gi|38490010
polyprotein [Human rhinovirus
30]
53303 5710
gi|4506787
IQ motif containing GTPase
activating protein 1 [Homo
sapiens]
189761 5026
gi|109327
myosin-light-chain kinase (EC
2.7.1.117), skeletal muscle -
rabbit
65997 2317
gi|54306511
CTAP-tag [Cloning vector
pUAST-CTAP]
20524 2020
gi|50507914
yellow cameleon 2.60 [synthetic
construct]
73565 1490
gi|56205916 retinoblastoma-associated factor 600 (RBAF600) [Homo sapiens]
580547 1294
gi|4506693 ribosomal protein S17 [Homo sapiens]
15597 1238
gi|4885109
calmodulin 3 [Homo sapiens]
17152 1059
gi|4586876
huntingtin [Homo sapiens]
351557 1025
gi|24111820
trigger factor [Shigella flexneri
2a str. 301]
48163 1015
gi|14250401 actin, beta [Homo sapiens]
41321 956
gi|18088719
Tubulin, beta polypeptide [Homo
sapiens]
50096 741

6. Appendixes
133
protein Mass kDa score
gi|2119266
tubulin alpha-1 chain - human
50804 700
gi|48734733 Eukaryotic translation elongation factor 1 alpha 1 [Homo sapiens]
50438 624
gi|31645
glyceraldehyde-3-phosphate
dehydrogenase [Homo sapiens]
36202 544
gi|693933
2-phosphopyruvate-hydratase
alpha-enolase; carbonate
dehydratase [Homo sapiens]
47421 518
gi|20072478
PAI-RBP1 protein [Homo
sapiens]
44995 505
gi|30583577
vesicle amine transport protein
1 homolog (T californica) [Homo
sapiens]
42122 493
gi|189998
M2-type pyruvate kinase
58447 416
>gi|5729877|ref|NP_006588.1|
heat shock 70kDa protein 8
isoform 1 [Homo sapiens]
gi|12667788
myosin, heavy polypeptide 9,
non-muscle [Homo sapiens]
227646 362
gi|52783777
Phosphoglycerate kinase 1
44973 355
gi|17986258
smooth muscle and non-muscle
myosin alkali light chain isoform
1 [Homo sapiens]
17090 354
gi|32358 hnRNP U protein [Homo sapiens]
89631 342
gi|4507895
vimentin [Homo sapiens]
53710 296
gi|32454741
serine (or cysteine) proteinase
inhibitor, clade H, member 1
precursor [Homo sapiens]
46525 289

6. Appendixes
134
protein Mass kDa score
gi|16507237
heat shock 70kDa protein 5
(glucose-regulated protein,
78kDa) [Homo sapiens]
72402 288
gi|27676004
similar to ribosomal protein L9
[Rattus norvegicus]
21994 281
gi|10863927
peptidylprolyl isomerase A
isoform 1 [Homo sapiens]
18098 280
gi|54696696
annexin A1 [Homo sapiens]
38918 265
gi|57036493
PREDICTED: similar to
ribosomal protein S19 [Canis
familiaris]
16051 243
gi|18645167
Annexin A2, isoform 2 [Homo
sapiens]
38780 237
gi|15559443
Hypothetical protein BC014089
[Homo sapiens]
14669 236
gi|3309539
liprin-beta1 [Homo sapiens]
113632 229
gi|28614
aldolase A [Homo sapiens]
39706 227
gi|56972440
Ribosomal protein L3 [Homo
sapiens]
46365 224
gi|38201623 eukaryotic translation initiation factor 4 gamma, 1 isoform 1 [Homo sapiens]
176094 223
gi|999893
Chain B, Triosephosphate
Isomerase (Tim) (E.C.5.3.1.1)
Complexed With 2-
Phosphoglycolic Acid
36807 211
gi|57209936
melanoma antigen, family D, 2
[Homo sapiens]
55932 200

6. Appendixes
135
protein Mass kDa score
gi|2773160
neuronal tissue-enriched acidic
protein [Homo sapiens]
22941 183
gi|6016838|dbj|BAA85184.1| 14-
3-3gamma [Homo sapiens]
gi|33187679
hypothetical protein [Homo
sapiens]
14682 177
gi|185945
immunoglobulin kappa chain
constant region [Homo sapiens]
11773 166
gi|35871
RAP74 [Homo sapiens]
58276 161
gi|5031857
lactate dehydrogenase A [Homo
sapiens]
36950 154
gi|107082
microtubule-associated protein
4 - human
121618 153
gi|180985
CpG island protein
39022 149
gi|19343933
PPP3CA protein [Homo
sapiens]
58306 148
gi|4092054
GTP binding protein [Homo
sapiens]
24668 93
gi|16418383
transcriptional repressor NAC1
[Homo sapiens]
57906 90
gi|460317
chaperonin
58598 79
gi|55959887
peroxiredoxin 1 [Homo sapiens]
19135 78
gi|54695918
flap structure-specific
endonuclease 1 [Homo sapiens]
42908 76
gi|13569488
OSBP related protein 11 [Homo
sapiens]
35076 75
gi|55859705
tropomyosin 2 (beta) [Homo
sapiens]
37010 74

6. Appendixes
136
protein Mass kDa score
gi|55749406
transcription elongation factor A
(SII)-like 1 [Homo sapiens]
18686 68
gi|27802691
caspase 9, apoptosis-related
cysteine protease [Homo
sapiens]
47035 66
Table 19: HRV2-2Apro C106A positive. Search against the mammalian subset of the NCBI nr
database. The highlighted proteins were considered relevant for this work.

6. Appendixes
137
Lbpro negative control
Table 20: Lbpro negative control. Search against the mammalian subset of the NCBI nr database.
protein Mass kDa score
gi|825635
calmodulin [Homo sapiens]
17152 4097
gi|16974825
Chain A, Solution Structure Of
Calcium-Calmodulin N-Terminal
Domain
8483 2405
gi|29649713
protease serine 1 [Homo
sapiens]
9218 66
gi|38051823
Plasminogen [Homo sapiens]
93263 59
gi|14993776
skeletal myosin light chain
kinase [Homo sapiens]
65214 55

6. Appendixes
138
Lbpro positive
protein Mass kDa score
gi|825635
calmodulin [Homo sapiens]
17152 7812
gi|4506773
S100 calcium-binding protein A9
[Homo sapiens]
13291 372
gi|18490211
Unknown (protein for
MGC:23888) [Homo sapiens]
26503 239
gi|21614544 S100 calcium-binding protein A8
[Homo sapiens]
10885 233
gi|14043538
Unknown (protein for
IMAGE:4110141) [Homo
sapiens]
27865 199
gi|16554039
unnamed protein product [Homo
sapiens]
65755 179
gi|4885111
calmodulin-like 3 [Homo
sapiens]
16937 173
gi|31645
glyceraldehyde-3-phosphate
dehydrogenase [Homo sapiens]
36202 160
gi|8393159
calmodulin-like skin protein
[Homo sapiens]
15911 144
gi|29649713
protease serine 1 [Homo
sapiens]
9218 111
gi|38348366
suprabasin [Homo sapiens]
25377 100
gi|62122917
filaggrin 2 [Homo sapiens]
249296 94
gi|3891470
Chain A, Crystal Structure Of
Human Galectin-7 In Complex
With Galactosamine
14992 91
6. Appendixes
139
protein Mass kDa score
gi|6912286
caspase 14 precursor [Homo
sapiens]
27947 87
gi|18645167
Annexin A2 [Homo sapiens]
38780 71
gi|62897625
beta actin variant [Homo
sapiens]
42080 67
gi|5803225
tyrosine 3/tryptophan 5 -
monooxygenase activation
protein, epsilon polypeptide
[Homo sapiens]
29326 65
gi|4506671
ribosomal protein P2 [Homo
sapiens]
11658 64
gi|38051823
Plasminogen [Homo sapiens]
93263 63
gi|4885375
histone cluster 1, H1c [Homo
sapiens]
21352 60
gi|38014625
RPL8 protein [Homo sapiens]
23114 60
gi|338695
beta-tubulin
50240 56
gi|229532
ubiquitin
8446 55
gi|5729877
heat shock 70kDa protein 8
isoform 1 [Homo sapiens]
71082 51
gi|4503113
cystatin M precursor [Homo
sapiens]
16785 45
gi|494296
Chain B, Cathepsin D
(E.C.3.4.23.5)
26457 43
gi|60097902
filaggrin [Homo sapiens]
435036 39
gi|178995
arginase (EC 3.5.3.1)
34884 38
Table 21: Lbpro positive. Search against the mammalian subset of the NCBI nr database.

6. Appendixes
140
6.2 Appendix B DNA and protein markers
Figure 85: DNA marker. λ-DNA (Promega) digested with the restriction enzyme HindIII. 1µg/well was
loaded.
Figure 86: Biorad prestained protein marker. Catalog number 161-0373. 5µl of marker were
loaded.

6. Appendixes
141
Figure 87: [14C] Methylated proteins (Amersham Biosciences). Catalog number CFA-626. 5µl of
marker were loaded.

6. Appendixes
142
6.3 Appendix C Amino acids abbreviations Amino acid Three letters
abbreviation One letter abbreviation
Alanine Ala
A
Cysteine Cys
C
Aspartate Asp
D
Glutamate Glu
E
Phenylalanine Phe
F
Glycine Gly
G
Histidine His
H
Isoleucine Ile
I
Lysine Lys
K
Leucine Leu
L
Methionine Met
M
Asparagine Asn
N
Proline Pro
P
Glutamine Gln
Q
Arginine Arg
R
Serine Ser
S
Threonine Thr
T
Valine Val
V
Tryptophan Trp
W
Tyrosine Tyr
Y
Table 22: List and abbreviations of the 20 amino acids.

6. Appendixes
143
6.4 Appendix D List of figures Figure 1: Phylogenetic tree of the VP4 region of 26 HRV strains collected from nasopharyngeal aspirates. Figure 2: Structure of picornaviruses. Figure 3: Schematic representation of the predicted stem-loop structures in the (A) poliovirus, (B) encephalomyocarditis virus, and (C) hepatitis A virus 5’ UTR of the viral RNAs. Figure 4: Overview of the picornavirus replication cycle. Figure 5: Surface potential of the receptor binding site of several HRVs. Figure 6: Cryo-EM (cryo electron microscopy) image reconstruction of HRV14 complexed with a soluble fragment of ICAM-1. Figure 7: Primary cleavages of picornavirus polyprotein. Figure 8: 5’ cap-dependent versus IRES-dependent translation initiation. Figure 9: The structure of FMDV Lbpro. Figure 10: The structure of PV 3Cpro. Figure 11: The structure of HRV2 2Apro. Figure 12: Diagram of translation initiation in eukaryotes. Figure 13: Schematic drawing of eIF4GI. Figure 14: Schematic representation of the initiation translation complex. Figure 15: Fluorography of a 17.5% SDS-PAGE showing an in vitro translation experiment. Figure 16: Immunoblot of 6% SDS-PAGE of the samples from figure 16 showing cleavage of eIF4GI by A) HRV2 VP1-2Apro and B) HRV14 VP1-2Apro. Figure 17: Fluorography of a 17.5% SDS-PAGE showing the processing of HRV2 and HRV14 VP1-2Apro bearing the eIF4GI cleavage site. Figure 18: Fluorography of a 17.5% SDS-PAGE showing the processing of HRV14 VP1-2Apro bearing the eIF4GI cleavage site in which the P1 residue arginine was substituted by tyrosine. Figure 19: Fluorography of a 17.5% SDS-PAGE showing processing of HRV14 VP1-2Apro containing several substitutions at the cleavage site. Figure 20: Sequence alignment between HRV14 2Apro and PV1 2Apro. Figure 21: Fluorography of a 17.5% SDS-PAGE showing the processing of PV1 VP1-2Apro wild type (A) and a mutant containing an arginine at P1 site (B). Figure 22: Fluorography of a 17.5% SDS-PAGE showing the processing of HRV14 and HRV2 VP1-2Apro bearing several mutations on the 2Apro sequence. Figure 23: The structure of HRV2 2Apro.

6. Appendixes
144
Figure 24: Fluorography of a 17.5% SDS-PAGE showing the processing of HRV14 VP1-2Apro containing an arginine at the P1 site and a mutation in position 104. Figure 25: Fluorography of a 17.5% SDS-PAGE showing the processing of HRV2 VP1-2Apro containing a mutation in position 101. Figure 26: 17.5% SDS-PAGE showing the inhibition of self-processing of HRV2 and HRV14 2Apro by zVAM.fmk. Figure 27: Cloning strategy to introduce the inactive form of HRV14 2Apro carrying a His tag into pGEX-6P-1. Figure 28: Coomassie stained SDS-PAGE (10% (A) and 15% (B) polyacrylamide) of the expression of HRV14 2Apro-GST-His (A) and the protein after incubation with PreScission proteinase (Amersham) (B). Figure 29: A) Chromatogram of HRV14 2Apro-His purification performed on a HisTrap column 1 ml (Amersham). B) Coomassie stained 15% SDS-PAGE of the fractions collected. Figure 30: Coomassie stained 12.5% SDS-PAGE of the expression of HRV14 2Apro-GST-His (A) and the protein after incubation with PreScission protease (Amersham) (B). Figure 31: A) Chromatogram of HRV14 2Apro-His purification performed on a HisTrap column 1 ml (Amersham). B) Coomassie stained 12.5% SDS-PAGE of the fractions collected. Figure 32: A) Chromatogram of gel filtration performed on a superdex 26/60 column. B) Coomassie stained 12.5% SDS-PAGE of the fractions collected. Figure 33: Coomassie stained 12.5% SDS-PAGE of the concentrated HRV14 2Apro-His. Figure 34: Determination of the melting temperature of a protein. Figure 35: Graphic showing the melting temperature curve of HRV14 2Apro-His. Figure 36: Cloning strategy to introduce the inactive form of HRV14 2Apro carrying a His tag into pET11d. Figure 37: Coomassie stained 12.5% SDS-PAGE of the expression HRV14 2Apro-His. Figure 38: A) Chromatogram of HRV14 2Apro-His purification performed on a HisTrap column 1 ml (Amersham). B) Coomassie stained 12.5% SDS-PAGE of the fractions collected. C) Coomassie stained 12.5% SDS-PAGE of the concentrated (pool of lanes 9 to 13 of panel B) HRV14 2Apro-His. Figure 39: A) Cromatogram of gel filtration performed on a superdex 26/60 column. B) and C) Coomassie stained 12.5% SDS-PAGE of the fractions collected. Figure 40: Scheme for the pGEX-6P1-eIF4GII-(aa 445-744)-FLAG vector provided by A. Gradi. Figure 41: Coomassie stained 10% SDS-PAGE of the expression eIF4GII-GST aminoacids 445 to 744. Figure 42: Coomassie stained 10% SDS-PAGE of eIF4GII aminoacids 445 to 744 after cleavage from the GST-tag. Figure 43: A) Chromatogram of gel filtration of the sample from figure 43, after being concentrated to 2 ml, performed on a superdex 26/60 column. B) Coomassie stained 10% SDS-PAGE of the fractions corresponding to peak 1 and 2 respectively. Figure 44: Coomassie stained 10% SDS-PAGE of the pooled and concentrated fractions of eIF4GII.

6. Appendixes
145
Figure 45: Cloning strategy to introduce the GST tag and eIF4GII residues 445 to 744 into the pFastBac vector (Invitrogen). Figure 46: immunoblot of 12.5% SDS-PAGE showing the expression of eIF4GII-GST. Figure 47: Coomassie stained 10% SDS-PAGE of eIF4GII after incubation with PreScission protease (Amersham). Figure 48: fragment of eIF4GII (residues 445 to 744) cloned in pGEX-6P1 (Amersham). Figure 49: Cloning strategy to introduce the fragment corresponding to the residues 552 to 744 of eIF4GII into pGEX-6P-1. Figure 50: Coomassie stained 10% SDS-PAGE of the expression eIF4GII-GST-His aminoacids 552 to 744 (A) and the protein after incubation with PreScission protease (Amersham) (B). Figure 51: Cloning strategy to introduce the fragment corresponding to the residues 552 to 744 of eIF4GII carrying a His tag into pET11d. Figure 52: Coomassie stained 12.5% SDS-PAGE of the expression eIF4GII-GST aminoacids 552 to 744. Figure 53: A) Chromatogram of eIF4GII-His aminoacid 552 to 744 performed on a HisTrap column 1 ml (Amersham). B) Commassie stained 10% SDS-PAGE of the fractions collected. Figure 54: Commassie stained 12.5% SDS-PAGE of the pooled and concentrated fractions of eIF4GII. Figure 55: A) Chromatogram of gel filtration performed on a superdex 26/60 column. B) Commassie stained 10% SDS-PAGE of the fractions collected. Figure 56: Commassie stained 12.5% SDS-PAGE of the pooled and concentrated fractions 13 to 16 of eIF4GII of figure 56B. Figure 57: Melting temperature curve of eIF4GII-His amino acids 552 to 744. Figure 58: Superimposition of 1H-15N-HSQC of 15NLbproC51A and 1H-15N-HSQC of 15N/13C LbproC51A. Figure 59: A) Chromatogram of eIF4GII-His aminoacid 552 to 744 performed on a HisTrap column 1 ml (Amersham). B) and C) Commassie stained 10% SDS-PAGE of the fractions collected. Figure 60: Commassie stained 12.5% SDS-PAGE of the pooled and concentrated fractions of eIF4GII. Figure 61: Superimposition of 15N-eIF4GII (red) and 15N-eIF4GII plus FMDV Lb (blue). Figure 62: Commassie stained 12.5% SDS-PAGE of the expression eIF4EΔ27. Figure 63: Scheme for the ppro ExHTA-meIF4E vector provided by Regina Cencic. Figure 64: Commassie stained 12.5% SDS-PAGE of the expression eIF4E. Figure 65: A) Chromatogram of eIF4E performed on a MonoQ 10/10 column (Amersham). B) and C) Commassie stained 10% SDS-PAGE of the fractions collected. Figure 66: Commassie stained 12.5% SDS-PAGE of eIF4E eluted from m7GTP beads. Figure 67: eIF4E after purification and concentration.

6. Appendixes
146
Figure 68: Overview of TAP procedure (adapted from Rigaut et al., 1999). Figure 69: Cloning strategy to introduce the TAP tag into pET11d. Figure 70: Cloning strategy to introduce the inactive forms of HRV2 and HRV14 2Apro into pET11d-TAP. Figure 71: Commassie stained 10% SDS-PAGE of the expression of: A) Tap tag, B) HRV2 2Apro-TAP and C) HRV14 2Apro-TAP. Figure 72: Commassie stained 10% SDS-PAGE of the soluble fractions from the expressions of TAP, HRV2 2Apro-TAP and HRV14 2Apro-TAP. Figure 73: Silver stained 7 to 20% SDS-PAGE of TAP (A), HRV2 2Apro-TAP (B) and HRV14 2Apro-TAP (C). Figure 74: Commassie stained 12.5% SDS-PAGE of GST tag (lane 1), HRV2 2Apro C106A – GST (lane2) and HRV14 2Apro C109A – GST (lane 3). Figure 75: GST pulldown of eIF4GI (6% SDS-PAGE) (A), PABP (12.5% SDS-PAGE) (B) and β-actin (12.5% SDS-PAGE) (C). Figure 76: Immunoblot of 12.5% SDS-PAGE of β actin, PABP and eIF1 α. Figure 77: Cloning strategy to introduce the inactive forms of HRV2 and HRV14 2Apro into pMZI. Figure 78: immunoblot of 12.5% SDS-PAGE showing the expression of HRV2 2Apro-TAP and HRV14 2Apro-TAP after a small scale transfection of HEK-293T cells. Figure 79: Immunoblot of 12.5% SDS-PAGE showing the expression of HRV2 2Apro-TAP and HRV14 2Apro-TAP after transfection of 2x10⁶ HEK-293T cells and 48 hours expression. Figure 80: Cloning strategy to introduce the inactive forms of HIV1 protease, CBV4 2Apro and FMDV Lbpro into pMZI. Figure 81: immunoblot of 12.5% SDS-PAGE showing the expression pMZI-TAP (A), HIV 1pro-TAP (B), CBV4 2Apro-TAP (C) and FMDV Lbpro-TAP after a large scale transfection of HEK-293T cells and 48 hours expression (D). Figure 82: Silver stained 7 to 20% SDS-PAGE of TAP FMDV Lbpro-TAP. Figure 83: Analysis of HRV2, HRV14 and PV1 2Apro amino acid sequence. A and B) Sequence alignments between HRV14 2Apro and HRV2 2Apro (A) and HRV14 2Apro and PV1 2Apro (B). C) Tree based on the amino acid identity of HRV2, HRV14 and PV1 2Apro, showing that HRV14 2Apro amino acid sequence is closer related to PV1 2Apro than to HRV2 2Apro. Figure 84: The structure of HRV2 2Apro. Ribbon diagrams of the overall structure of HRV2 2Apro (Same as figure 24). Figure 85: DNA marker (Promega). Figure 86: Biorad prestained protein marker. Figure 87: [14C] Methylated proteins (Amersham Biosciences).

6. Appendixes
147
List of tables Table 1: The Genera of the family of Picornaviruses. Table 2: Viruses and their receptors. Adapted from (Fields et al., 2007). Table 3: Lbpro cleavage sites on known substrates. Table 4: List of the plasmids used in this work. Table 5: List of primers used for cloning experiments. Table 6: List of primers used for sequencing. Table 7: Composition of Separating Gels (Laemmli, 1970). Table 8: Composition of separating gels (Dasso & Jackson, 1989). Table 9: List of primary antibodies used in this work. Table 10: List of secondary antibodies used in this work. Table 11: Dilutions of protein/SYPRO Orange dye for protein melting point detection. Table 12: 2Apro cleavage sites on the respective polyproteins and eIF4G homologues. Table 13: Occupancy of the P1 residue of the 2Apro cleavage site and residue 101 or its equivalent of 2Apro. Table 14: Proteins purified with the TAP method and identified by mass spectroscopy. Table 15: Summary of the effect of zVAM.fmk on the inhibition of picornaviral 2Apro. Table 16: HRV14-2Apro C109A negative control. Table 17: HRV14-2Apro C109A positive. Table 18: HRV2-2Apro C106A negative control. Table 19: HRV2-2Apro C106A positive. Table 20: Lbpro negative control. Table 21: Lbpro positive. Table 22: List and abbreviations of the 20 amino acids.

7. Literature
i
7 Literature Acharya, R., Fry, E., Stuart, D., Fox, G., Rowlands, D. and Brown, F. (1989) The three-dimensional
structure of foot-and-mouth disease virus at 2.9 A resolution. Nature, 337, 709-716.
Agol, V.I. (2002) Picornavirus genome: an overview. In Semler, B.L. and Wimmer, E. (eds.), Molecular Biology of Picornaviruses. ASM Press, Washington, D. C., pp. 127-148.
Allaire, M., Chernaia, M.M., Malcolm, B.A. and James, M.N. (1994) Picornaviral 3C cysteine proteinases have a fold similar to chymotrypsin-like serine proteinases. Nature, 369, 72-76.
Amann, E., Ochs, B. and Abel, K.J. (1988) Tightly regulated tac promoter vectors useful for the expression of unfused and fused proteins in Escherichia coli. Gene, 69, 301-315.
Arnold, E., Luo, M., Vriend, G., Rossmann, M.G., Palmenberg, A.C., Parks, G.D., Nicklin, M.J. and Wimmer, E. (1987) Implications of the picornavirus capsid structure for polyprotein processing. Proc Natl Acad Sci U S A, 84, 21-25.
Arruda, E., Pitkaranta, A., Witek, T.J., Jr., Doyle, C.A. and Hayden, F.G. (1997) Frequency and natural history of rhinovirus infections in adults during autumn. J Clin Microbiol, 35, 2864-2868.
Badorff, C., Berkely, N., Mehrotra, S., Talhouk, J.W., Rhoads, R.E. and Knowlton, K.U. (2000) Enteroviral protease 2A directly cleaves dystrophin and is inhibited by a dystrophin-based substrate analogue. J Biol Chem, 275, 11191-11197.
Badorff, C., Lee, G.H., Lamphear, B.J., Martone, M.E., Campbell, K.P., Rhoads, R.E. and Knowlton, K.U. (1999) Enteroviral protease 2A cleaves dystrophin: evidence of cytoskeletal disruption in an acquired cardiomyopathy. Nat Med, 5, 320-326.
Barton, D.J., Morasco, B.J. and Flanegan, J.B. (1999) Translating ribosomes inhibit poliovirus negative-strand RNA synthesis. J Virol, 73, 10104-10112.
Bateman, K.S., Anderson, S., Lu, W., Qasim, M.A., Laskowski, M., Jr. and James, M.N. (2000) Deleterious effects of beta-branched residues in the S1 specificity pocket of Streptomyces griseus proteinase B (SGPB): crystal structures of the turkey ovomucoid third domain variants Ile18I, Val18I, Thr18I, and Ser18I in complex with SGPB. Protein Sci, 9, 83-94.
Baxter, N.J., Roetzer, A., Liebig, H.D., Sedelnikova, S.E., Hounslow, A.M., Skern, T. and Waltho, J.P. (2006) Structure and dynamics of coxsackievirus B4 2A proteinase, an enyzme involved in the etiology of heart disease. J Virol, 80, 1451-1462.
Beck, E., Forss, S., Strebel, K., Cattaneo, R. and Feil, G. (1983) Structure of the FMDV translation initiation site and of the structural proteins. Nucleic Acids Res, 11, 7873-7885.
Belsham, G.J. and Jackson, R.J. (2000) Translation initiation on picornavirus RNA. In Sonenberg, N., Hershey, J.W. and Mathews, M. (eds.), Tranlational control of gene expression. Cold Spring Harbor Laboratory Press, New York, pp. 869-900.
Belsham, G.J., McInerney, G.M. and Ross-Smith, N. (2000) Foot-and-mouth disease virus 3C protease induces cleavage of translation initiation factors eIF4A and eIF4G within infected cells. J Virol, 74, 272-280.
Bergelson, J.M. (2008) New (fluorescent) light on poliovirus entry. Trends Microbiol.
Bergmann, E.M., Mosimann, S.C., Chernaia, M.M., Malcolm, B.A. and James, M.N. (1997) The refined crystal structure of the 3C gene product from hepatitis A virus: specific proteinase activity and RNA recognition. J Virol, 71, 2436-2448.

7. Literature
ii
Bienz, K., Egger, D. and Pfister, T. (1994) Characteristics of the poliovirus replication complex. Arch Virol Suppl, 9, 147-157.
Binford, S.L., Maldonado, F., Brothers, M.A., Weady, P.T., Zalman, L.S., Meador, J.W., 3rd, Matthews, D.A. and Patick, A.K. (2005) Conservation of amino acids in human rhinovirus 3C protease correlates with broad-spectrum antiviral activity of rupintrivir, a novel human rhinovirus 3C protease inhibitor. Antimicrob Agents Chemother, 49, 619-626.
Binford, S.L., Weady, P.T., Maldonado, F., Brothers, M.A., Matthews, D.A. and Patick, A.K. (2007) In vitro resistance study of rupintrivir, a novel inhibitor of human rhinovirus 3C protease. Antimicrob Agents Chemother, 51, 4366-4373.
Borman, A.M. and Kean, K.M. (1997) Intact eukaryotic initiation factor 4G is required for hepatitis A virus internal initiation of translation. Virology, 237, 129-136.
Bovee, M.L., Lamphear, B.J., Rhoads, R.E. and Lloyd, R.E. (1998) Direct cleavage of elF4G by poliovirus 2A protease is inefficient in vitro. Virology, 245, 241-249.
Brändén, C.-I. and Tooze, J. (1999) Introduction to protein structure. Garland Publishing, New York.
Brandenburg, B., Lee, L.Y., Lakadamyali, M., Rust, M.J., Zhuang, X. and Hogle, J.M. (2007) Imaging Poliovirus Entry in Live Cells. PLoS Biol, 5, e183.
Brown, D.M., Cornell, C.T., Tran, G.P., Nguyen, J.H. and Semler, B.L. (2005) An authentic 3' noncoding region is necessary for efficient poliovirus replication. J Virol, 79, 11962-11973.
Bubeck, D., Filman, D.J. and Hogle, J.M. (2005) Cryo-electron microscopy reconstruction of a poliovirus-receptor-membrane complex. Nat Struct Mol Biol, 12, 615-618.
Burroughs, J.N., Sangar, D.V., Clarke, B.E., Rowlands, D.J., Billiau, A. and Collen, D. (1984) Multiple proteases in foot-and-mouth disease virus replication. J Virol, 50, 878-883.
Calandria, C., Irurzun, A., Barco, A. and Carrasco, L. (2004) Individual expression of poliovirus 2Apro and 3Cpro induces activation of caspase-3 and PARP cleavage in HeLa cells. Virus Res, 104, 39-49.
Cao, X., Bergmann, I.E., Fullkrug, R. and Beck, E. (1995) Functional analysis of the two alternative translation initiation sites of foot-and-mouth disease virus. J Virol, 69, 560-563.
Cencic, R. (2005) Structure and Function Relationships in the FMDV Leader Protease. PhD thesis. University of Vienna, Vienna.
Chau, D.H., Yuan, J., Zhang, H., Cheung, P., Lim, T., Liu, Z., Sall, A. and Yang, D. (2007) Coxsackievirus B3 proteases 2A and 3C induce apoptotic cell death through mitochondrial injury and cleavage of eIF4GI but not DAP5/p97/NAT1. Apoptosis, 12, 513-524.
Choe, S.S., Dodd, D.A. and Kirkegaard, K. (2005) Inhibition of cellular protein secretion by picornaviral 3A proteins. Virology, 337, 18-29.
Clark, M.E., Hammerle, T., Wimmer, E. and Dasgupta, A. (1991) Poliovirus proteinase 3C converts an active form of transcription factor IIIC to an inactive form: a mechanism for inhibition of host cell polymerase III transcription by poliovirus. Embo J, 10, 2941-2947.
Clark, M.E., Lieberman, P.M., Berk, A.J. and Dasgupta, A. (1993) Direct cleavage of human TATA-binding protein by poliovirus protease 3C in vivo and in vitro. Mol Cell Biol, 13, 1232-1237.
Clarke, B.E., Sangar, D.V., Burroughs, J.N., Newton, S.E., Carroll, A.R. and Rowlands, D.J. (1985) Two initiation sites for foot-and-mouth disease virus polyprotein in vivo. J Gen Virol, 66 (Pt 12), 2615-2626.

7. Literature
iii
Cordingley, M.G., Callahan, P.L., Sardana, V.V., Garsky, V.M. and Colonno, R.J. (1990) Substrate requirements of human rhinovirus 3C protease for peptide cleavage in vitro. J Biol Chem, 265, 9062-9065.
Cornelis, S., Bruynooghe, Y., Denecker, G., Van Huffel, S., Tinton, S. and Beyaert, R. (2000) Identification and characterization of a novel cell cycle-regulated internal ribosome entry site. Mol Cell, 5, 597-605.
Coyne, C.B., Kim, K.S. and Bergelson, J.M. (2007) Poliovirus entry into human brain microvascular cells requires receptor-induced activation of SHP-2. Embo J, 26, 4016-4028.
Crowder, S. and Kirkegaard, K. (2004) Complete three-dimensional structures of picornaviral RNA-dependent RNA polymerases. Structure, 12, 1336-1339.
Crowder, S. and Kirkegaard, K. (2005) Trans-dominant inhibition of RNA viral replication can slow growth of drug-resistant viruses. Nat Genet, 37, 701-709.
Dasso, M.C. and Jackson, R.J. (1989) On the fidelity of mRNA translation in the nuclease-treated rabbit reticulocyte lysate system. Nucleic Acids Res, 17, 3129-3144.
De Gregorio, E., Preiss, T. and Hentze, M.W. (1999) Translation driven by an eIF4G core domain in vivo. Embo J, 18, 4865-4874.
Deszcz, L., Cencic, R., Sousa, C., Kuechler, E. and Skern, T. (2006) An antiviral peptide inhibitor that is active against picornavirus 2A proteinases but not cellular caspases. J Virol, 80, 9619-9627.
Deszcz, L., Gaudernak, E., Kuechler, E. and Seipelt, J. (2005) Apoptotic events induced by human rhinovirus infection. J Gen Virol, 86, 1379-1389.
Deszcz, L., Seipelt, J., Vassilieva, E., Roetzer, A. and Kuechler, E. (2004) Antiviral activity of caspase inhibitors: effect on picornaviral 2A proteinase. FEBS Lett, 560, 51-55.
Duncan, R., Milburn, S.C. and Hershey, J.W. (1987) Regulated phosphorylation and low abundance of HeLa cell initiation factor eIF-4F suggest a role in translational control. Heat shock effects on eIF-4F. J Biol Chem, 262, 380-388.
Ehrenfeld, E. and Teterina, N.L. (2002) Initiation of translation of picornavirus RNAs: structure and function of the Internal Ribosome Entry Site. In Semler, B.L. and Wimmer, E. (eds.), Molecular Biology of Picornaviruses. ASM Press, Washington, D. C., pp. 159-169.
Etchison, D., Milburn, S.C., Edery, I., Sonenberg, N. and Hershey, J.W. (1982) Inhibition of HeLa cell protein synthesis following poliovirus infection correlates with the proteolysis of a 220,000-dalton polypeptide associated with eucaryotic initiation factor 3 and a cap binding protein complex. J Biol Chem, 257, 14806-14810.
Fauquet, C. and International Committee on Taxonomy of, V. (2005) Virus taxonomy: classification and nomenclature of viruses; 8th report of the International Committee on Taxonomy of Viruses. Elsevier/Academic Press, Oxford.
Feigenblum, D. and Schneider, R.J. (1993) Modification of eukaryotic initiation factor 4F during infection by influenza virus. J Virol, 67, 3027-3035.
Fendrick, A.M., Monto, A.S., Nightengale, B. and Sarnes, M. (2003) The economic burden of non-influenza-related viral respiratory tract infection in the United States. Arch Intern Med, 163, 487-494.
Fields, B.N., Knipe, D.M. and Howley, P.M. (2007) Fields' virology. Wolters Kluwer Health/Lippincott Williams & Wilkins, Philadelphia.

7. Literature
iv
Flanegan, J.B., Petterson, R.F., Ambros, V., Hewlett, N.J. and Baltimore, D. (1977) Covalent linkage of a protein to a defined nucleotide sequence at the 5'-terminus of virion and replicative intermediate RNAs of poliovirus. Proc Natl Acad Sci U S A, 74, 961-965.
Flint, S.J. (2004) Principles of virology: molecular biology, pathogenesis, and control of animal viruses. ASM Press, Washington, D.C.
Foeger, N., Glaser, W. and Skern, T. (2002) Recognition of eukaryotic initiation factor 4G isoforms by picornaviral proteinases. J Biol Chem, 277, 44300-44309.
Gamarnik, A.V. and Andino, R. (1998) Switch from translation to RNA replication in a positive-stranded RNA virus. Genes Dev, 12, 2293-2304.
Gamarnik, A.V. and Andino, R. (2000) Interactions of viral protein 3CD and poly(rC) binding protein with the 5' untranslated region of the poliovirus genome. J Virol, 74, 2219-2226.
Goldstaub, D., Gradi, A., Bercovitch, Z., Grosmann, Z., Nophar, Y., Luria, S., Sonenberg, N. and Kahana, C. (2000) Poliovirus 2A protease induces apoptotic cell death. Mol Cell Biol, 20, 1271-1277.
Goodfellow, I.G., Polacek, C., Andino, R. and Evans, D.J. (2003) The poliovirus 2C cis-acting replication element-mediated uridylylation of VPg is not required for synthesis of negative-sense genomes. J Gen Virol, 84, 2359-2363.
Gorbalenya, A.E., Donchenko, A.P., Blinov, V.M. and Koonin, E.V. (1989) Cysteine proteases of positive strand RNA viruses and chymotrypsin-like serine proteases. A distinct protein superfamily with a common structural fold. FEBS Lett, 243, 103-114.
Gorbalenya, A.E., Svitkin, Y.V., Kazachkov, Y.A. and Agol, V.I. (1979) Encephalomyocarditis virus-specific polypeptide p22 is involved in the processing of the viral precursor polypeptides. FEBS Lett, 108, 1-5.
Goyer, C., Altmann, M., Lee, H.S., Blanc, A., Deshmukh, M., Woolford, J.L., Jr., Trachsel, H. and Sonenberg, N. (1993) TIF4631 and TIF4632: two yeast genes encoding the high-molecular-weight subunits of the cap-binding protein complex (eukaryotic initiation factor 4F) contain an RNA recognition motif-like sequence and carry out an essential function. Mol Cell Biol, 13, 4860-4874.
Gradi, A., Foeger, N., Strong, R., Svitkin, Y.V., Sonenberg, N., Skern, T. and Belsham, G.J. (2004) Cleavage of eukaryotic translation initiation factor 4GII within foot-and-mouth disease virus-infected cells: identification of the L-protease cleavage site in vitro. J Virol, 78, 3271-3278.
Gradi, A., Imataka, H., Svitkin, Y.V., Rom, E., Raught, B., Morino, S. and Sonenberg, N. (1998a) A novel functional human eukaryotic translation initiation factor 4G. Mol Cell Biol, 18, 334-342.
Gradi, A., Svitkin, Y.V., Imataka, H. and Sonenberg, N. (1998b) Proteolysis of human eukaryotic translation initiation factor eIF4GII, but not eIF4GI, coincides with the shutoff of host protein synthesis after poliovirus infection. Proc Natl Acad Sci U S A, 95, 11089-11094.
Gradi, A., Svitkin, Y.V., Sommergruber, W., Imataka, H., Morino, S., Skern, T. and Sonenberg, N. (2003) Human rhinovirus 2A proteinase cleavage sites in eukaryotic initiation factors (eIF) 4GI and eIF4GII are different. J Virol, 77, 5026-5029.
Greve, J.M., Davis, G., Meyer, A.M., Forte, C.P., Yost, S.C., Marlor, C.W., Kamarck, M.E. and McClelland, A. (1989) The major human rhinovirus receptor is ICAM-1. Cell, 56, 839-847.
Gross, J.D., Moerke, N.J., von der Haar, T., Lugovskoy, A.A., Sachs, A.B., McCarthy, J.E. and Wagner, G. (2003) Ribosome loading onto the mRNA cap is driven by conformational coupling between eIF4G and eIF4E. Cell, 115, 739-750.

7. Literature
v
Guarne, A., Tormo, J., Kirchweger, R., Pfistermueller, D., Fita, I. and Skern, T. (1998) Structure of the foot-and-mouth disease virus leader protease: a papain-like fold adapted for self-processing and eIF4G recognition. Embo J, 17, 7469-7479.
Haghighat, A. and Sonenberg, N. (1997) eIF4G dramatically enhances the binding of eIF4E to the mRNA 5'-cap structure. J Biol Chem, 272, 21677-21680.
Haghighat, A., Svitkin, Y., Novoa, I., Kuechler, E., Skern, T. and Sonenberg, N. (1996) The eIF4G-eIF4E complex is the target for direct cleavage by the rhinovirus 2A proteinase. J Virol, 70, 8444-8450.
Hanecak, R., Semler, B.L., Anderson, C.W. and Wimmer, E. (1982) Proteolytic processing of poliovirus polypeptides: antibodies to polypeptide P3-7c inhibit cleavage at glutamine-glycine pairs. Proc Natl Acad Sci U S A, 79, 3973-3977.
Hanecak, R., Semler, B.L., Ariga, H., Anderson, C.W. and Wimmer, E. (1984) Expression of a cloned gene segment of poliovirus in E. coli: evidence for autocatalytic production of the viral proteinase. Cell, 37, 1063-1073.
Harber, J.J., Bradley, J., Anderson, C.W. and Wimmer, E. (1991) Catalysis of poliovirus VP0 maturation cleavage is not mediated by serine 10 of VP2. J Virol, 65, 326-334.
Hentze, M.W. (1997) eIF4G: a multipurpose ribosome adapter? Science, 275, 500-501.
Hershey, J.W. and Merrick, W.C. (2000) The pathway and mechanism of initiation of protein synthesis. In Sonenberg, N., Hershey, J.W. and Mathews, M. (eds.), Tranlational control of gene expression. Cold Spring Harbor Laboratory Press, New York, pp. 33-88.
Hershey, P.E., McWhirter, S.M., Gross, J.D., Wagner, G., Alber, T. and Sachs, A.B. (1999) The Cap-binding protein eIF4E promotes folding of a functional domain of yeast translation initiation factor eIF4G1. J Biol Chem, 274, 21297-21304.
Hindiyeh, M., Li, Q.H., Basavappa, R., Hogle, J.M. and Chow, M. (1999) Poliovirus mutants at histidine 195 of VP2 do not cleave VP0 into VP2 and VP4. J Virol, 73, 9072-9079.
Hofer, F., Gruenberger, M., Kowalski, H., Machat, H., Huettinger, M., Kuechler, E. and Blaas, D. (1994) Members of the low density lipoprotein receptor family mediate cell entry of a minor-group common cold virus. Proc Natl Acad Sci U S A, 91, 1839-1842.
Hogle, J.M., Chow, M. and Filman, D.J. (1985) Three-dimensional structure of poliovirus at 2.9 A resolution. Science, 229, 1358-1365.
Imataka, H., Gradi, A. and Sonenberg, N. (1998) A newly identified N-terminal amino acid sequence of human eIF4G binds poly(A)-binding protein and functions in poly(A)-dependent translation. Embo J, 17, 7480-7489.
Imataka, H. and Sonenberg, N. (1997) Human eukaryotic translation initiation factor 4G (eIF4G) possesses two separate and independent binding sites for eIF4A. Mol Cell Biol, 17, 6940-6947.
Jackson, T., Ellard, F.M., Ghazaleh, R.A., Brookes, S.M., Blakemore, W.E., Corteyn, A.H., Stuart, D.I., Newman, J.W. and King, A.M. (1996) Efficient infection of cells in culture by type O foot-and-mouth disease virus requires binding to cell surface heparan sulfate. J Virol, 70, 5282-5287.
Jacobson, M.F. and Baltimore, D. (1968) Morphogenesis of poliovirus. I. Association of the viral RNA with coat protein. J Mol Biol, 33, 369-378.
7. Literature
vi
Jacobson, S.J., Konings, D.A. and Sarnow, P. (1993) Biochemical and genetic evidence for a pseudoknot structure at the 3' terminus of the poliovirus RNA genome and its role in viral RNA amplification. J Virol, 67, 2961-2971.
Ji, H., Fraser, C.S., Yu, Y., Leary, J. and Doudna, J.A. (2004) Coordinated assembly of human translation initiation complexes by the hepatitis C virus internal ribosome entry site RNA. Proc Natl Acad Sci U S A, 101, 16990-16995.
Joachims, M., Harris, K.S. and Etchison, D. (1995) Poliovirus protease 3C mediates cleavage of microtubule-associated protein 4. Virology, 211, 451-461.
Joachims, M., Van Breugel, P.C. and Lloyd, R.E. (1999) Cleavage of poly(A)-binding protein by enterovirus proteases concurrent with inhibition of translation in vitro. J Virol, 73, 718-727.
Jore, J., De Geus, B., Jackson, R.J., Pouwels, P.H. and Enger-Valk, B.E. (1988) Poliovirus protein 3CD is the active protease for processing of the precursor protein P1 in vitro. J Gen Virol, 69 (Pt 7), 1627-1636.
Kean, K.M., Teterina, N.L., Marc, D. and Girard, M. (1991) Analysis of putative active site residues of the poliovirus 3C protease. Virology, 181, 609-619.
Kerekatte, V., Keiper, B.D., Badorff, C., Cai, A., Knowlton, K.U. and Rhoads, R.E. (1999) Cleavage of Poly(A)-binding protein by coxsackievirus 2A protease in vitro and in vivo: another mechanism for host protein synthesis shutoff? J Virol, 73, 709-717.
Khan, A.G., Pichler, J., Rosemann, A. and Blaas, D. (2007) Human rhinovirus type 54 infection via heparan sulfate is less efficient and strictly dependent on low endosomal pH. J Virol, 81, 4625-4632.
Kleijn, M., Vrins, C.L., Voorma, H.O. and Thomas, A.A. (1996) Phosphorylation state of the cap-binding protein eIF4E during viral infection. Virology, 217, 486-494.
Kleina, L.G. and Grubman, M.J. (1992) Antiviral effects of a thiol protease inhibitor on foot-and-mouth disease virus. J Virol, 66, 7168-7175.
Kolatkar, P.R., Bella, J., Olson, N.H., Bator, C.M., Baker, T.S. and Rossmann, M.G. (1999) Structural studies of two rhinovirus serotypes complexed with fragments of their cellular receptor. Embo J, 18, 6249-6259.
Kolupaeva, V.G., Pestova, T.V. and Hellen, C.U. (2000) An enzymatic footprinting analysis of the interaction of 40S ribosomal subunits with the internal ribosomal entry site of hepatitis C virus. J Virol, 74, 6242-6250.
Kolupaeva, V.G., Pestova, T.V., Hellen, C.U. and Shatsky, I.N. (1998) Translation eukaryotic initiation factor 4G recognizes a specific structural element within the internal ribosome entry site of encephalomyocarditis virus RNA. J Biol Chem, 273, 18599-18604.
Kozak, M. (2001) New ways of initiating translation in eukaryotes? Mol Cell Biol, 21, 1899-1907.
Kozak, M. (2005) A second look at cellular mRNA sequences said to function as internal ribosome entry sites. Nucleic Acids Res, 33, 6593-6602.
Kozak, M. (2007) Lessons (not) learned from mistakes about translation. Gene, 403, 194-203.
Kraulis, P.J. (1991) MOLSCRIPT: a program to produce both detailed and schmatic plots of protein structures. J. Appl. Crystallogr., 24, 946-950.
Kuyumcu-Martinez, N.M., Joachims, M. and Lloyd, R.E. (2002) Efficient cleavage of ribosome-associated poly(A)-binding protein by enterovirus 3C protease. J Virol, 76, 2062-2074.

7. Literature
vii
Laemmli, U.K. (1970) Cleavage of structural proteins during the assembly of the head of bacteriophage T4. Nature, 227, 680-685.
Laine, P., Blomqvist, S., Savolainen, C., Andries, K. and Hovi, T. (2006) Alignment of capsid protein VP1 sequences of all human rhinovirus prototype strains: conserved motifs and functional domains. J Gen Virol, 87, 129-138.
Laine, P., Savolainen, C., Blomqvist, S. and Hovi, T. (2005) Phylogenetic analysis of human rhinovirus capsid protein VP1 and 2A protease coding sequences confirms shared genus-like relationships with human enteroviruses. J Gen Virol, 86, 697-706.
Lamphear, B.J., Yan, R., Yang, F., Waters, D., Liebig, H.D., Klump, H., Kuechler, E., Skern, T. and Rhoads, R.E. (1993) Mapping the cleavage site in protein synthesis initiation factor eIF-4 gamma of the 2A proteases from human Coxsackievirus and rhinovirus. J Biol Chem, 268, 19200-19203.
Lamson, D., Renwick, N., Kapoor, V., Liu, Z., Palacios, G., Ju, J., Dean, A., St George, K., Briese, T. and Lipkin, W.I. (2006) MassTag polymerase-chain-reaction detection of respiratory pathogens, including a new rhinovirus genotype, that caused influenza-like illness in New York State during 2004-2005. J Infect Dis, 194, 1398-1402.
Lau, S.K., Yip, C.C., Tsoi, H.W., Lee, R.A., So, L.Y., Lau, Y.L., Chan, K.H., Woo, P.C. and Yuen, K.Y. (2007) Clinical features and complete genome characterization of a distinct human rhinovirus (HRV) genetic cluster, probably representing a previously undetected HRV species, HRV-C, associated with acute respiratory illness in children. J Clin Microbiol, 45, 3655-3664.
Lee, W.M., Monroe, S.S. and Rueckert, R.R. (1993) Role of maturation cleavage in infectivity of picornaviruses: activation of an infectosome. J Virol, 67, 2110-2122.
Lee, Y.F., Nomoto, A., Detjen, B.M. and Wimmer, E. (1977) A protein covalently linked to poliovirus genome RNA. Proc Natl Acad Sci U S A, 74, 59-63.
LeFebvre, A.K., Korneeva, N.L., Trutschl, M., Cvek, U., Duzan, R.D., Bradley, C.A., Hershey, J.W. and Rhoads, R.E. (2006) Translation initiation factor eIF4G-1 binds to eIF3 through the eIF3e subunit. J Biol Chem, 281, 22917-22932.
Liebig, H.D., Seipelt, J., Vassilieva, E., Gradi, A. and Kuechler, E. (2002) A thermosensitive mutant of HRV2 2A proteinase: evidence for direct cleavage of eIF4GI and eIF4GII. FEBS Lett, 523, 53-57.
Long, A.C., Orr, D.C., Cameron, J.M., Dunn, B.M. and Kay, J. (1989) A consensus sequence for substrate hydrolysis by rhinovirus 3C proteinase. FEBS Lett, 258, 75-78.
Lopez-Lastra, M., Rivas, A. and Barria, M.I. (2005) Protein synthesis in eukaryotes: the growing biological relevance of cap-independent translation initiation. Biol Res, 38, 121-146.
Lyle, J.M., Bullitt, E., Bienz, K. and Kirkegaard, K. (2002) Visualization and functional analysis of RNA-dependent RNA polymerase lattices. Science, 296, 2218-2222.
Mader, S., Lee, H., Pause, A. and Sonenberg, N. (1995) The translation initiation factor eIF-4E binds to a common motif shared by the translation factor eIF-4 gamma and the translational repressors 4E-binding proteins. Mol Cell Biol, 15, 4990-4997.
Marcotrigiano, J., Lomakin, I.B., Sonenberg, N., Pestova, T.V., Hellen, C.U. and Burley, S.K. (2001) A conserved HEAT domain within eIF4G directs assembly of the translation initiation machinery. Mol Cell, 7, 193-203.
Marcotte, L.L., Wass, A.B., Gohara, D.W., Pathak, H.B., Arnold, J.J., Filman, D.J., Cameron, C.E. and Hogle, J.M. (2007) Crystal structure of poliovirus 3CD protein: virally encoded protease and precursor to the RNA-dependent RNA polymerase. J Virol, 81, 3583-3596.

7. Literature
viii
Martin, A., Escriou, N., Chao, S.F., Girard, M., Lemon, S.M. and Wychowski, C. (1995) Identification and site-directed mutagenesis of the primary (2A/2B) cleavage site of the hepatitis A virus polyprotein: functional impact on the infectivity of HAV RNA transcripts. Virology, 213, 213-222.
Matthews, D.A., Dragovich, P.S., Webber, S.E., Fuhrman, S.A., Patick, A.K., Zalman, L.S., Hendrickson, T.F., Love, R.A., Prins, T.J., Marakovits, J.T., Zhou, R., Tikhe, J., Ford, C.E., Meador, J.W., Ferre, R.A., Brown, E.L., Binford, S.L., Brothers, M.A., DeLisle, D.M. and Worland, S.T. (1999) Structure-assisted design of mechanism-based irreversible inhibitors of human rhinovirus 3C protease with potent antiviral activity against multiple rhinovirus serotypes. Proc Natl Acad Sci U S A, 96, 11000-11007.
Matthews, D.A., Smith, W.W., Ferre, R.A., Condon, B., Budahazi, G., Sisson, W., Villafranca, J.E., Janson, C.A., McElroy, H.E., Gribskov, C.L. and et al. (1994) Structure of human rhinovirus 3C protease reveals a trypsin-like polypeptide fold, RNA-binding site, and means for cleaving precursor polyprotein. Cell, 77, 761-771.
McLean, C., Matthews, T.J. and Rueckert, R.R. (1976) Evidence of ambiguous processing and selective degradation in the noncapsid proteins of rhinovirus 1A. J Virol, 19, 903-914.
Medina, M., Domingo, E., Brangwyn, J.K. and Belsham, G.J. (1993) The two species of the foot-and-mouth disease virus leader protein, expressed individually, exhibit the same activities. Virology, 194, 355-359.
Moens, U., Van Ghelue, M. and Johannessen, M. (2007) Oncogenic potentials of the human polyomavirus regulatory proteins. Cell Mol Life Sci, 64, 1656-1678.
Morino, S., Imataka, H., Svitkin, Y.V., Pestova, T.V. and Sonenberg, N. (2000) Eukaryotic translation initiation factor 4E (eIF4E) binding site and the middle one-third of eIF4GI constitute the core domain for cap-dependent translation, and the C-terminal one-third functions as a modulatory region. Mol Cell Biol, 20, 468-477.
Mosimann, S.C., Cherney, M.M., Sia, S., Plotch, S. and James, M.N. (1997) Refined X-ray crystallographic structure of the poliovirus 3C gene product. J Mol Biol, 273, 1032-1047.
Mosser, A.G., Vrtis, R., Burchell, L., Lee, W.M., Dick, C.R., Weisshaar, E., Bock, D., Swenson, C.A., Cornwell, R.D., Meyer, K.C., Jarjour, N.N., Busse, W.W. and Gern, J.E. (2005) Quantitative and qualitative analysis of rhinovirus infection in bronchial tissues. Am J Respir Crit Care Med, 171, 645-651.
Muckelbauer, J.K., Kremer, M., Minor, I., Diana, G., Dutko, F.J., Groarke, J., Pevear, D.C. and Rossmann, M.G. (1995) The structure of coxsackievirus B3 at 3.5 A resolution. Structure, 3, 653-667.
Nakatani, Y., Konishi, H., Vassilev, A., Kurooka, H., Ishiguro, K., Sawada, J., Ikura, T., Korsmeyer, S.J., Qin, J. and Herlitz, A.M. (2005) p600, a unique protein required for membrane morphogenesis and cell survival. Proc Natl Acad Sci U S A, 102, 15093-15098.
Neff, S., Sa-Carvalho, D., Rieder, E., Mason, P.W., Blystone, S.D., Brown, E.J. and Baxt, B. (1998) Foot-and-mouth disease virus virulent for cattle utilizes the integrin alpha(v)beta3 as its receptor. J Virol, 72, 3587-3594.
Nugent, C.I. and Kirkegaard, K. (1995) RNA binding properties of poliovirus subviral particles. J Virol, 69, 13-22.
Ohlmann, T., Rau, M., Morley, S.J. and Pain, V.M. (1995) Proteolytic cleavage of initiation factor eIF-4 gamma in the reticulocyte lysate inhibits translation of capped mRNAs but enhances that of uncapped mRNAs. Nucleic Acids Res, 23, 334-340.

7. Literature
ix
Oliveira, M.A., Zhao, R., Lee, W.M., Kremer, M.J., Minor, I., Rueckert, R.R., Diana, G.D., Pevear, D.C., Dutko, F.J., McKinlay, M.A. and et al. (1993) The structure of human rhinovirus 16. Structure, 1, 51-68.
Olson, N.H., Kolatkar, P.R., Oliveira, M.A., Cheng, R.H., Greve, J.M., McClelland, A., Baker, T.S. and Rossmann, M.G. (1993) Structure of a human rhinovirus complexed with its receptor molecule. Proc Natl Acad Sci U S A, 90, 507-511.
Orr, D.C., Long, A.C., Kay, J., Dunn, B.M. and Cameron, J.M. (1989) Hydrolysis of a series of synthetic peptide substrates by the human rhinovirus 14 3C proteinase, cloned and expressed in Escherichia coli. J Gen Virol, 70 (Pt 11), 2931-2942.
Ozols, J. (1990) Amino acid analysis. Methods Enzymol, 182, 587-601.
Pain, V.M. (1996) Initiation of protein synthesis in eukaryotic cells. Eur J Biochem, 236, 747-771.
Palmenberg, A.C., Pallansch, M.A. and Rueckert, R.R. (1979) Protease required for processing picornaviral coat protein resides in the viral replicase gene. J Virol, 32, 770-778.
Papadopoulos, N.G., Bates, P.J., Bardin, P.G., Papi, A., Leir, S.H., Fraenkel, D.J., Meyer, J., Lackie, P.M., Sanderson, G., Holgate, S.T. and Johnston, S.L. (2000) Rhinoviruses infect the lower airways. J Infect Dis, 181, 1875-1884.
Park, N., Katikaneni, P., Skern, T. and Gustin, K.E. (2008) Differential targeting of nuclear pore complex proteins in poliovirus-infected cells. J Virol, 82, 1647-1655.
Parks, G.D., Baker, J.C. and Palmenberg, A.C. (1989) Proteolytic cleavage of encephalomyocarditis virus capsid region substrates by precursors to the 3C enzyme. J Virol, 63, 1054-1058.
Pata, J.D., Schultz, S.C. and Kirkegaard, K. (1995) Functional oligomerization of poliovirus RNA-dependent RNA polymerase. Rna, 1, 466-477.
Patick, A.K., Brothers, M.A., Maldonado, F., Binford, S., Maldonado, O., Fuhrman, S., Petersen, A., Smith, G.J., 3rd, Zalman, L.S., Burns-Naas, L.A. and Tran, J.Q. (2005) In vitro antiviral activity and single-dose pharmacokinetics in humans of a novel, orally bioavailable inhibitor of human rhinovirus 3C protease. Antimicrob Agents Chemother, 49, 2267-2275.
Paul, A.V., van Boom, J.H., Filippov, D. and Wimmer, E. (1998) Protein-primed RNA synthesis by purified poliovirus RNA polymerase. Nature, 393, 280-284.
Pelham, H.R. (1978) Translation of encephalomyocarditis virus RNA in vitro yields an active proteolytic processing enzyme. Eur J Biochem, 85, 457-462.
Pelham, H.R. and Jackson, R.J. (1976) An efficient mRNA-dependent translation system from reticulocyte lysates. Eur J Biochem, 67, 247-256.
Pestova, T.V., Hellen, C.U. and Shatsky, I.N. (1996a) Canonical eukaryotic initiation factors determine initiation of translation by internal ribosomal entry. Mol Cell Biol, 16, 6859-6869.
Pestova, T.V., Kolupaeva, V.G., Lomakin, I.B., Pilipenko, E.V., Shatsky, I.N., Agol, V.I. and Hellen, C.U. (2001) Molecular mechanisms of translation initiation in eukaryotes. Proc Natl Acad Sci U S A, 98, 7029-7036.
Pestova, T.V., Shatsky, I.N. and Hellen, C.U. (1996b) Functional dissection of eukaryotic initiation factor 4F: the 4A subunit and the central domain of the 4G subunit are sufficient to mediate internal entry of 43S preinitiation complexes. Mol Cell Biol, 16, 6870-6878.

7. Literature
x
Petersen, J.F., Cherney, M.M., Liebig, H.D., Skern, T., Kuechler, E. and James, M.N. (1999) The structure of the 2A proteinase from a common cold virus: a proteinase responsible for the shut-off of host-cell protein synthesis. Embo J, 18, 5463-5475.
Pettersson, R.F., Ambros, V. and Baltimore, D. (1978) Identification of a protein linked to nascent poliovirus RNA and to the polyuridylic acid of negative-strand RNA. J Virol, 27, 357-365.
Pilipenko, E.V., Gmyl, A.P., Maslova, S.V., Khitrina, E.V. and Agol, V.I. (1995) Attenuation of Theiler's murine encephalomyelitis virus by modifications of the oligopyrimidine/AUG tandem, a host-dependent translational cis element. J Virol, 69, 864-870.
Pilipenko, E.V., Gmyl, A.P., Maslova, S.V., Svitkin, Y.V., Sinyakov, A.N. and Agol, V.I. (1992) Prokaryotic-like cis elements in the cap-independent internal initiation of translation on picornavirus RNA. Cell, 68, 119-131.
Pollard, T.D., Earnshaw, W.C. and Johnson, G.T. (2002) Cell biology. Saunders, Philadelphia, Penn.; London.
Pyronnet, S., Imataka, H., Gingras, A.C., Fukunaga, R., Hunter, T. and Sonenberg, N. (1999) Human eukaryotic translation initiation factor 4G (eIF4G) recruits mnk1 to phosphorylate eIF4E. Embo J, 18, 270-279.
Reed, L.J. and Muench., H. (1938) A simple method of estimating 50 per cent end-points. Amer. Jour. Hygiene, 27, 493-497.
Renwick, N., Schweiger, B., Kapoor, V., Liu, Z., Villari, J., Bullmann, R., Miething, R., Briese, T. and Lipkin, W.I. (2007) A recently identified rhinovirus genotype is associated with severe respiratory-tract infection in children in Germany. J Infect Dis, 196, 1754-1760.
Rigaut, G., Shevchenko, A., Rutz, B., Wilm, M., Mann, M. and Seraphin, B. (1999) A generic protein purification method for protein complex characterization and proteome exploration. Nat Biotechnol, 17, 1030-1032.
Roetzer, A. (2004) Untersuchung der Wechselwirkung von Enteroviralen 2A Proteinasen mit dem Eukaryotishen Initiationfaktor eIF4GI. Diploma thesis. University of Vienna, Vienna.
Rossmann, M.G., Arnold, E., Erickson, J.W., Frankenberger, E.A., Griffith, J.P., Hecht, H.J., Johnson, J.E., Kamer, G., Luo, M., Mosser, A.G. and et al. (1985) Structure of a human common cold virus and functional relationship to other picornaviruses. Nature, 317, 145-153.
Rossmann, M.G., Bella, J., Kolatkar, P.R., He, Y., Wimmer, E., Kuhn, R.J. and Baker, T.S. (2000) Cell recognition and entry by rhino- and enteroviruses. Virology, 269, 239-247.
Rossmann, M.G., He, Y. and Kuhn, R.J. (2002) Picornavirus-receptor interactions. Trends Microbiol, 10, 324-331.
Ryan, M.D., Donnelly, M., Lewis, A., Mehrotra, A.P., Wilkie, J. and Gani, D. (1999) A Model for Nonstoichiometric, Costranslational Protein Scission in Eukaryotic Ribosomes. Bioorganic Chemistry, 27, 55-79.
Sambrok, J., Fritsch, E.F. and Maniatis, T. (1989) Molecular Cloning: A Laboratory Manual. Cold Spring Harbour Laboratory, New York.
Sangar, D.V., Newton, S.E., Rowlands, D.J. and Clarke, B.E. (1987) All foot and mouth disease virus serotypes initiate protein synthesis at two separate AUGs. Nucleic Acids Res, 15, 3305-3315.
Sarkany, Z., Szeltner, Z. and Polgar, L. (2001) Thiolate-imidazolium ion pair is not an obligatory catalytic entity of cysteine peptidases: the active site of picornain 3C. Biochemistry, 40, 10601-10606.

7. Literature
xi
Savolainen, C., Blomqvist, S., Mulders, M.N. and Hovi, T. (2002) Genetic clustering of all 102 human rhinovirus prototype strains: serotype 87 is close to human enterovirus 70. J Gen Virol, 83, 333-340.
Schechter, I. and Berger, A. (1967) On the size of the active site in proteases. I. Papain. Biochem Biophys Res Commun, 27, 157-162.
Scheper, G.C., van Kollenburg, B., Hu, J., Luo, Y., Goss, D.J. and Proud, C.G. (2002) Phosphorylation of eukaryotic initiation factor 4E markedly reduces its affinity for capped mRNA. J Biol Chem, 277, 3303-3309.
Schlegel, A., Giddings, T.H., Jr., Ladinsky, M.S. and Kirkegaard, K. (1996) Cellular origin and ultrastructure of membranes induced during poliovirus infection. J Virol, 70, 6576-6588.
Schlick, P. (2004) Investigation of the HIV proteinase substrate specificity and inhibitor sensitivity using a bacterial genetic screen. PhD thesis. University of vienna, Vienna.
Schmid, E. (2002) Strukturspezifische Untersuchung rhinoviraler Proteasen unter besonderer Berückschtigung der Spaltung der eIF4G Isoformen. Diploma thesis. University of Vienna, Vienna.
Schneider, R., Agol, V.I., Andino, R., Bayard, F., Cavener, D.R., Chappell, S.A., Chen, J.J., Darlix, J.L., Dasgupta, A., Donze, O., Duncan, R., Elroy-Stein, O., Farabaugh, P.J., Filipowicz, W., Gale, M., Jr., Gehrke, L., Goldman, E., Groner, Y., Harford, J.B., Hatzglou, M., He, B., Hellen, C.U., Hentze, M.W., Hershey, J., Hershey, P., Hohn, T., Holcik, M., Hunter, C.P., Igarashi, K., Jackson, R., Jagus, R., Jefferson, L.S., Joshi, B., Kaempfer, R., Katze, M., Kaufman, R.J., Kiledjian, M., Kimball, S.R., Kimchi, A., Kirkegaard, K., Koromilas, A.E., Krug, R.M., Kruys, V., Lamphear, B.J., Lemon, S., Lloyd, R.E., Maquat, L.E., Martinez-Salas, E., Mathews, M.B., Mauro, V.P., Miyamoto, S., Mohr, I., Morris, D.R., Moss, E.G., Nakashima, N., Palmenberg, A., Parkin, N.T., Pe'ery, T., Pelletier, J., Peltz, S., Pestova, T.V., Pilipenko, E.V., Prats, A.C., Racaniello, V., Read, G.S., Rhoads, R.E., Richter, J.D., Rivera-Pomar, R., Rouault, T., Sachs, A., Sarnow, P., Scheper, G.C., Schiff, L., Schoenberg, D.R., Semler, B.L., Siddiqui, A., Skern, T., Sonenberg, N., Tahara, S.M., Thomas, A.A., Toulme, J.J., Wilusz, J., Wimmer, E., Witherell, G. and Wormington, M. (2001) New ways of initiating translation in eukaryotes. Mol Cell Biol, 21, 8238-8246.
Schultheiss, T., Kusov, Y.Y. and Gauss-Muller, V. (1994) Proteinase 3C of hepatitis A virus (HAV) cleaves the HAV polyprotein P2-P3 at all sites including VP1/2A and 2A/2B. Virology, 198, 275-281.
Seipelt, J., Liebig, H.D., Sommergruber, W., Gerner, C. and Kuechler, E. (2000) 2A proteinase of human rhinovirus cleaves cytokeratin 8 in infected HeLa cells. J Biol Chem, 275, 20084-20089.
Skern, T., Hampölz, B., Guarné, A., Fita, I., Bergmann, E., Petersen, J. and James, M.N. (2002) Structure and function of picornavirus proteinases. In Semler, B.L. and Wimmer, E. (eds.), Molecular Biology of Picornaviruses. ASM Press, Washington, D. C., pp. 199-212.
Skern, T., Sommergruber, W., Auer, H., Volkmann, P., Zorn, M., Liebig, H.D., Fessl, F., Blaas, D. and Kuechler, E. (1991) Substrate requirements of a human rhinoviral 2A proteinase. Virology, 181, 46-54.
Sommergruber, W., Ahorn, H., Zophel, A., Maurer-Fogy, I., Fessl, F., Schnorrenberg, G., Liebig, H.D., Blaas, D., Kuechler, E. and Skern, T. (1992) Cleavage specificity on synthetic peptide substrates of human rhinovirus 2 proteinase 2A. J Biol Chem, 267, 22639-22644.
Sousa, C., Schmid, E.M. and Skern, T. (2006) Defining residues involved in human rhinovirus 2A proteinase substrate recognition. FEBS Lett, 580, 5713-5717.

7. Literature
xii
Spector, D.H. and Baltimore, D. (1974) Requirement of 3'-terminal poly(adenylic acid) for the infectivity of poliovirus RNA. Proc Natl Acad Sci U S A, 71, 2983-2987.
Staunton, D.E., Merluzzi, V.J., Rothlein, R., Barton, R., Marlin, S.D. and Springer, T.A. (1989) A cell adhesion molecule, ICAM-1, is the major surface receptor for rhinoviruses. Cell, 56, 849-853.
Strong, R. and Belsham, G.J. (2004) Sequential modification of translation initiation factor eIF4GI by two different foot-and-mouth disease virus proteases within infected baby hamster kidney cells: identification of the 3Cpro cleavage site. J Gen Virol, 85, 2953-2962.
Studier, F.W. (1991) Use of bacteriophage T7 lysozyme to improve an inducible T7 expression system. J Mol Biol, 219, 37-44.
Svitkin, Y.V., Gorbalenya, A.E., Kazachkov, Y.A. and Agol, V.I. (1979) Encephalomyocarditis virus-specific polypeptide p22 possessing a proteolytic activity: preliminary mapping on the viral genome. FEBS Lett, 108, 6-9.
Svitkin, Y.V., Gradi, A., Imataka, H., Morino, S. and Sonenberg, N. (1999) Eukaryotic initiation factor 4GII (eIF4GII), but not eIF4GI, cleavage correlates with inhibition of host cell protein synthesis after human rhinovirus infection. J Virol, 73, 3467-3472.
Svitkin, Y.V., Hahn, H., Gingras, A.C., Palmenberg, A.C. and Sonenberg, N. (1998) Rapamycin and wortmannin enhance replication of a defective encephalomyocarditis virus. J Virol, 72, 5811-5819.
Svitkin, Y.V., Imataka, H., Khaleghpour, K., Kahvejian, A., Liebig, H.D. and Sonenberg, N. (2001) Poly(A)-binding protein interaction with elF4G stimulates picornavirus IRES-dependent translation. Rna, 7, 1743-1752.
Svitkin, Y.V., Ovchinnikov, L.P., Dreyfuss, G. and Sonenberg, N. (1996) General RNA binding proteins render translation cap dependent. Embo J, 15, 7147-7155.
Tesar, M. and Marquardt, O. (1990) Foot-and-mouth disease virus protease 3C inhibits cellular transcription and mediates cleavage of histone H3. Virology, 174, 364-374.
Toyoda, H., Nicklin, M.J., Murray, M.G., Anderson, C.W., Dunn, J.J., Studier, F.W. and Wimmer, E. (1986) A second virus-encoded proteinase involved in proteolytic processing of poliovirus polyprotein. Cell, 45, 761-770.
Turner, R.B. (2007) Rhinovirus: more than just a common cold virus. J Infect Dis, 195, 765-766.
van Kuppeveld, F.J., de Jong, A.S., Melchers, W.J. and Willems, P.H. (2005) Enterovirus protein 2B po(u)res out the calcium: a viral strategy to survive? Trends Microbiol, 13, 41-44.
van Vlijmen, H.W., Curry, S., Schaefer, M. and Karplus, M. (1998) Titration calculations of foot-and-mouth disease virus capsids and their stabilities as a function of pH. J Mol Biol, 275, 295-308.
Vance, L.M., Moscufo, N., Chow, M. and Heinz, B.A. (1997) Poliovirus 2C region functions during encapsidation of viral RNA. J Virol, 71, 8759-8765.
Ventoso, I., MacMillan, S.E., Hershey, J.W. and Carrasco, L. (1998) Poliovirus 2A proteinase cleaves directly the eIF-4G subunit of eIF-4F complex. FEBS Lett, 435, 79-83.
Vlasak, M., Blomqvist, S., Hovi, T., Hewat, E. and Blaas, D. (2003) Sequence and structure of human rhinoviruses reveal the basis of receptor discrimination. J Virol, 77, 6923-6930.
Wang, Q.M., Johnson, R.B., Sommergruber, W. and Shepherd, T.A. (1998) Development of in vitro peptide substrates for human rhinovirus-14 2A protease. Arch Biochem Biophys, 356, 12-18.

7. Literature
xiii
Wells, S.E., Hillner, P.E., Vale, R.D. and Sachs, A.B. (1998) Circularization of mRNA by eukaryotic translation initiation factors. Mol Cell, 2, 135-140.
Witherell, G.W., Schultz-Witherell, C.S. and Wimmer, E. (1995) Cis-acting elements of the encephalomyocarditis virus internal ribosomal entry site. Virology, 214, 660-663.
Wyckoff, E.E., Lloyd, R.E. and Ehrenfeld, E. (1992) Relationship of eukaryotic initiation factor 3 to poliovirus-induced p220 cleavage activity. J Virol, 66, 2943-2951.
Xatzipsalti, M., Kyrana, S., Tsolia, M., Psarras, S., Bossios, A., Laza-Stanca, V., Johnston, S.L. and Papadopoulos, N.G. (2005) Rhinovirus viremia in children with respiratory infections. Am J Respir Crit Care Med, 172, 1037-1040.
Yalamanchili, P., Banerjee, R. and Dasgupta, A. (1997a) Poliovirus-encoded protease 2APro cleaves the TATA-binding protein but does not inhibit host cell RNA polymerase II transcription in vitro. J Virol, 71, 6881-6886.
Yalamanchili, P., Datta, U. and Dasgupta, A. (1997b) Inhibition of host cell transcription by poliovirus: cleavage of transcription factor CREB by poliovirus-encoded protease 3Cpro. J Virol, 71, 1220-1226.
Yalamanchili, P., Weidman, K. and Dasgupta, A. (1997c) Cleavage of transcriptional activator Oct-1 by poliovirus encoded protease 3Cpro. Virology, 239, 176-185.
Yamamoto, T., Davis, C.G., Brown, M.S., Schneider, W.J., Casey, M.L., Goldstein, J.L. and Russell, D.W. (1984) The human LDL receptor: a cysteine-rich protein with multiple Alu sequences in its mRNA. Cell, 39, 27-38.
Yeh, A.P., McMillan, A. and Stowell, M.H. (2006) Rapid and simple protein-stability screens: application to membrane proteins. Acta Crystallogr D Biol Crystallogr, 62, 451-457.
Ypma-Wong, M.F., Dewalt, P.G., Johnson, V.H., Lamb, J.G. and Semler, B.L. (1988) Protein 3CD is the major poliovirus proteinase responsible for cleavage of the P1 capsid precursor. Virology, 166, 265-270.
Zamora, M., Marissen, W.E. and Lloyd, R.E. (2002) Multiple eIF4GI-specific protease activities present in uninfected and poliovirus-infected cells. J Virol, 76, 165-177.
Zeghouf, M., Li, J., Butland, G., Borkowska, A., Canadien, V., Richards, D., Beattie, B., Emili, A. and Greenblatt, J.F. (2004) Sequential Peptide Affinity (SPA) system for the identification of mammalian and bacterial protein complexes. J Proteome Res, 3, 463-468.
Zoll, J., Melchers, W.J., Galama, J.M. and van Kuppeveld, F.J. (2002) The mengovirus leader protein suppresses alpha/beta interferon production by inhibition of the iron/ferritin-mediated activation of NF-kappa B. J Virol, 76, 9664-9672.

Curriculum Vitae Name: Carla Cristina Jacinto de Sousa
Date of birth: 1979/06/10
Nationality: Portuguese
Address: Sankt Johann Gasse 1-5/4/15 1050 Wien, Austria
Telephone: +43 699 10776107
Email: [email protected]; [email protected]
Academic degrees, fields of study, dates 1997-2002-Graduated in Biochemistry, Faculty of Sciences, Oporto University. Final mark: 13/20.
Present position, institution, starting date
PhD student at the department of Biochemistry of The Medical University of Vienna, Austria, under supervision of Professor Tim Skern. Started on October 2004. Previous positions, institutions, dates - Mar. 2004 – Sept. 2004: work on the department of Animal Breeding and Genetics of the Veterinary Medicine University of Vienna, under the supervision of Professor Christian Schlötterer, on population genetics. - Jan. 2003 - Jan. 2004: started as recipient of a "Initiation to Research Grant" in the Molecular Immunology Unit of the Molecular and Cellular Biology Institute, Oporto, under the supervision of Dr. Ana M. Tomás on the subject " Functional analysis of two tryparedoxins of Leishmania infantum and their validation as drug targets ". - Sep. 2001 - Sept. 2002: Diploma project on the subject “Isolation and characterization of tryparedoxins of Leishmania infantum”, under the supervision of Dr. Ana M. Tomás, in the Molecular Immunology Unit of the Molecular and Cellular Biology Institute, Oporto. Final mark: 18/20. - Mar. 2001 - Sept. 2001: voluntary work at the Molecular Immunology Unit of the Molecular and Cellular Biology Institute, Oporto, under the supervision of Dr. Ana M. Tomás. Main scientific area of research Molecular Biology Interests Cell Biology, Molecular Biology, Biochemistry, Virology, Microbiology, Immunology.

Publications - Sousa C., Schmid E.M., Skern T. (2006) Defining residues involved in human rhinovirus 2A proteinase substrate recognition, FEBS letters, 580, 5713-5717. - Deszcz L., Cencic R., Sousa C., Kuechler E. and Skern T. (2006) An anti-viral peptide inhibitor active against picornaviral 2A proteinases but not cellular caspases, J. of Virology, 80, 9619-9627. - Schlötterer C., Neumeier H., Sousa C., and Nolte V. (2006) Highly Structured Asian Drosophila melanogaster Populations: A New Tool for Hitchhiking Mapping?,Genetics 172, 287-292. - Castro H, Sousa C., Novais M, Santos M, Budde H, Cordeiro-da-Silva A, Flohé L, Tomás A. M. (2004) Two linked genes of Leishmania infantum encode tryparedoxins localized to cytosol and mitochondrion, Mol Biochem Parasitol, 136, 137-147. - Castro H.; Sousa C.; Santos M.; Cordeiro-da-Silva A.; Flohé L.; Tomás A. M. (2002) Complementary antioxidant defence by cytoplasmic and mitochondrial peroxiredoxin of Leishmania infantum, Free Radic Biol Med, 33, 1552-1562.