Embed Size (px)
Citation preview

OTP Bank Plc.
Summary of the first quarter 2018 results
(English translation of the original report submitted
to the Budapest Stock Exchange)
Budapest, 11 May 2018

SUMMARY OF THE FIRST QUARTER 2018 RESULTS
2/52
CONSOLIDATED FINANCIAL HIGHLIGHTS1 AND SHARE DATA Main components of the Statement of recognised income
in HUF million 1Q 2017 4Q 2017 1Q 2018 Q-o-Q Y-o-Y
Consolidated after tax profit 52,859 68,454 65,050 -5% 23%Adjustments (total) -13,902 8,934 -14,216 -259% 2%Consolidated adjusted after tax profit without the effect of adjustments 66,762 59,520 79,266 33% 19%
Pre-tax profit 76,204 66,063 89,696 36% 18%Operating profit 88,721 85,077 92,830 9% 5%
Total income 188,756 208,852 206,335 -1% 9%Net interest income 132,180 140,523 143,614 2% 9%Net fees and commissions 44,549 58,073 49,579 -15% 11%Other net non-interest income 12,026 10,256 13,142 28% 9%
Operating expenses -100,035 -123,775 -113,505 -8% 13%Total risk costs -12,475 -19,120 -1,289 -93% -90%One off items -42 106 -1,845
Corporate taxes -9,442 -6,543 -10,430 59% 10%Main components of balance sheet
closing balances in HUF million 1Q 2017 4Q 2017 1Q 2018 Q-o-Q Y-o-Y
Total assets 11,295,754 13,190,228 13,511,182 2% 20%Total customer loans (net, FX adjusted) 5,721,239 7,013,904 7,102,159 1% 24%
Total customer loans (gross, FX adjusted) 6,613,915 7,717,862 7,856,093 2% 19%Allowances for possible loan losses (FX adjusted) -892,676 -703,958 -753,934 7% -16%
Total customer deposits (FX adjusted) 8,357,216 10,260,240 10,385,228 1% 24%Issued securities 263,629 250,320 258,602 3% -2%Subordinated loans 76,565 76,028 75,266 -1% -2%Total shareholders' equity 1,436,232 1,640,055 1,592,448 -3% 11%
Indicators based on adjusted earnings 1Q 2017 4Q 2017 1Q 2018 Q-o-Q Y-o-Y ROE (from accounting net earnings) 15.0% 16.9% 16.2% -0.7%p 1.2%pROE (from accounting net earnings, on 12.5% CET1 ratio) 18.3% 20.3% 19.4% -1.0%p 1.1%pROE (from adjusted net earnings) 18.8% 14.7% 19.7% 5.0%p 0.9%pROA (from adjusted net earnings) 2.4% 1.9% 2.4% 0.6%p 0.0%p
Operating profit margin 3.22% 2.65% 2.83% 0.18%p -0.40%pTotal income margin 6.86% 6.50% 6.28% -0.22%p -0.58%p
Net interest margin 4.80% 4.38% 4.37% 0.00%p -0.43%pCost-to-asset ratio 3.64% 3.85% 3.46% -0.40%p -0.18%pCost/income ratio 53.0% 59.3% 55.0% -4.3%p 2.0%p
Risk cost to average gross loans 0.65% 0.70% 0.03% -0.67%p -0.62%pTotal risk cost-to-asset ratio 0.45% 0.60% 0.04% -0.56%p -0.41%pEffective tax rate 12.4% 9.9% 11.6% 1.7%p -0.8%p
Net loan/(deposit+retail bond) ratio (FX adjusted) 68% 68% 68% 0%p 1%pCapital adequacy ratio (consolidated, IFRS) - Basel3 18.5% 14.6% 16.9% 2.3%p -1.5%pTier1 ratio - Basel3 16.0% 12.7% 15.0% 2.4%p -1.0%pCommon Equity Tier 1 ('CET1') ratio - Basel3 16.0% 12.7% 15.0% 2.4%p -1.0%p
Share Data 1Q 2017 4Q 2017 1Q 2018 Q-o-Q Y-o-Y EPS diluted (HUF) (from unadjusted net earnings) 202 261 248 -5% 23%EPS diluted (HUF) (from adjusted net earnings) 255 227 303 33% 19%Closing price (HUF) 8,093 10,720 11,420 7% 41%Highest closing price (HUF) 9,396 10,930 11,750 8% 25%Lowest closing price (HUF) 8,093 9,930 10,790 9% 33%Market Capitalization (EUR billion) 7.3 9.7 10.2 6% 39%Book Value Per Share (HUF) 5,129 5,857 5,687 -3% 11%Tangible Book Value Per Share (HUF) 4,534 5,219 5,074 -3% 12%Price/Book Value 1.6 1.8 2.0 10% 27%Price/Tangible Book Value 1.8 2.1 2.3 10% 26%P/E (trailing, from accounting net earnings) 10.3 10.7 10.9 2% 6%P/E (trailing, from adjusted net earnings) 10.3 10.6 10.8 2% 5%Average daily turnover (EUR million) 15 14 17 19% 16%Average daily turnover (million share) 0.5 0.4 0.5 8% -10%
SHARE PRICE PERFORMANCE MOODY’S RATINGS
OTP Bank - FX long term deposits Baa3
OTP Mortgage Bank - Covered mortgage bond Baa1
S&P GLOBAL RATINGS OTP Bank and OTP Mortgage Bank - FX Long term credit rating BBB-
DAGONG GLOBAL RATING OTP Bank - FX long term credit rating BBB+
FITCH'S RATING OTP Bank Russia - Long term credit rating BB
1 Structural adjustments made on consolidated IFRS profit and loss statement as well as balance sheet, together with the calculation methodology of adjusted indicators are detailed in the Supplementary data section of this Report.
4,000
5,000
6,000
7,000
8,000
9,000
10,000
11,000
12,000
13,000
31/12/2015 30/06/2016 31/12/2016 30/06/2017 31/12/2017
CECE Banking Sector Index (relative to OTP)
Bloomberg EMEA Banks Index (relative to OTP)
OTP

SUMMARY OF THE FIRST QUARTER 2018 RESULTS
3/52
SUMMARY – OTP BANK’S RESULTS FOR FIRST QUARTER 2018
Summary of the first quarter 2018 results of OTP Bank Plc. has been prepared on the basis of its separate and consolidated IFRS financial statements for 31 March 2018 or derived from that. At presentation of first quarter 2018 report of OTP Bank we applied International Financial Reporting Standards adopted by the European Union. The impact of shifting from IAS 39 to IFRS 9 – in accordance with the standards – was incorporated into the opening balance of own equity including the deferred tax effect.
SUMMARY OF THE FIRST QUARTER 2018
The Hungarian economy had an excellent performance in 2017, the annual GDP growth was 4%. The growth is wide-based: the strengthening household consumption and the improving investment activity have become the real engine of expansion, with the export performance remaining robust. It was positive that the economic growth coupled with stable balance indicators: the annual budget deficit stood at 2% and the public debt to GDP declined from 76% to 73.6%. The current account surplus is still meaningful (2.9% of GDP). Due to such a strong base economic performance in 2018 can be even better. Based on the Convergence Program submitted to the European Committee in May the Ministry of National Economy expects 4.3% growth, whereas in its Inflation Report published on 27 March 2018 the National Bank of Hungary (NBH) forecasted almost identical growth for this year (4.2%).
As for the loan volume expansion in Hungary, in 2017 all segments demonstrated a turnaround and in 2018 both the household and corporate sectors are expected to continue their dynamic growth. It is important to note that despite the robust corporate and retail lending activity no sign of overheating is experienced, penetration levels are still way below the V4 (so called Visegrad 4 countries, i.e. Poland, Slovakia, Czech Republic and Hungary) levels. Furthermore, the macro-prudential brakes introduced by the NBH contribute to the stable development of the local financial sector, whereas the debt service capability of households is solid as a result of the ongoing wage growth.
The introduction of the certified consumer friendly mortgage loan product reached its goal: on one hand lending rates have come down, at the same time out of newly disbursed mortgages the weight of fixed rate mortgages with a fixing period of at least one year kept increasing and by March their share comprised 76% for the sector. In order to boost fixed rate mortgage lending the NBH initiated a mortgage bonds purchase programme and plays an active role both on the primary and secondary markets.
As for the local yield environment, the short end of the curve remained practically unchanged with the 3M BUBOR being at 3 bps (q-o-q flat).
The ruling Government coalition was re-elected with a 2/3 majority again on the general elections held on 8 April 2018; markets reacted positively to the outcome. According to preliminary information, within the priorities of the new cabinet one can expect the continuation of the rigorous control of balance indicators, as well as initiatives aimed at improving the competitiveness of the economy and fostering growth in the long run.
On 18 April the deputy governor of NBH outlined a dynamic loan volume growth path for the 2018-2030 period, accordingly the overall loan-to-GDP penetration level of the sector may increase from 32% in 2017 to 70% alongside a sustainable annual average nominal economic growth rate of 6%. Meanwhile the indebtedness can remain in a tolerable range provided the major criteria set by the central bank are met. Under such penetration growth path, corporate exposures may expand by 12% on average annually, household loan volumes by 15%, within that mortgages by 18%, respectively.
Within the European Union the Central East European region remained the centre of growth: almost all countries within the OTP universe will enjoy strong growth in 2018. Such a positive picture is coupled with fiscal rigour, declining public debt and unemployment rates and low interest rate environment. At the same time almost all countries face tight labour market which generates wage inflation.
The new and more stringent sanctions against Russia announced on 6 April resulted in a significant RUB weakening, several stock exchange listed Russian companies suffered massive sale-offs and local government yields sharply increased. The communication of the CBR suggests that monetary easing might temporarily be put on hold in 2018. Still, most of the analysts expect only a marginal growth setback and the rating agencies confirmed their ratings for Russia.

SUMMARY OF THE FIRST QUARTER 2018 RESULTS
4/52
Consolidated earnings: HUF 79.3 billion adjusted after tax profit in 1Q, stable net interest margin (4.37%), improving adjusted ROE (19.7%)
The consolidated accounting after tax profit was HUF 65 billion (+23% y-o-y). In line with the management’s guidance only one material adjustment items appeared in 1Q 2018, namely the banking tax in the amount of -HUF 14.7 billion (after tax). This amount includes the full-year Hungarian levy booked already in 1Q in a lump-sum, as well as the quarterly part of the Slovakian banking tax. Besides, there were two minor positive adjustment items in this period:
+HUF 380 million effect of acquisitions (after tax);
+HUF 129 million dividends and net cash transfers (after tax).
As a result, the total amount of adjustment items within 1Q 2018 accounting profit represented -HUF 14.2 billion (after tax), fairly similar to that of in the base period.
As for the y-o-y development of particular P&L lines one should consider that neither the performance of Splitska banka (Croatia), nor that of Vojvodjanska banka (Serbia) was consolidated in 1Q 2017. Furthermore, the average quarterly FX rate of UAH against HUF weakened by 13% y-o-y and that of RUB by 10%, respectively.
In 1Q 2018 OTP Group posted HUF 79.3 billion adjusted after-tax profit (+19% y-o-y). The non-Hungarian profit contribution improved substantially (1Q 2017: 33%, 1Q 2018: 46%). As for the individual performances, OTP Core posted HUF 39.1 billion net profit, followed by DSK Bank with over HUF 11 billion. The Russian subsidiary excelled itself with HUF 8.5 billion, the Croatian operation with HUF 7.7 billion (of which OBH made HUF 2.7 billion and Splitska banka realized HUF 5 billion) and the Ukrainian operation with HUF 5.8 billion. As for the Russian subsidiary one should go back to 2012 to see such strong quarterly results, whereas the Ukrainian 1Q profit was the strongest ever. The same applies to OTP Romania (HUF 1.5 billion). There was a meaningful profit contribution from the Leasing operation (HUF 2.5 billion) and the Asset Management group (HUF 1.2 billion), besides the Slovakian (HUF 0.8 billion), Serbian (HUF 0.6 billion, of which HUF 460 million was realized by Vojvodjanska banka) and Montenegrin banks (HUF 0.7 billion) were all profit-makers. Though Touch Bank suffered another loss-making quarter (-HUF 1.3 billion), its magnitude declined both q-o-q and y-o-y.
The consolidated adjusted ROE for 1Q increased to 19.7% (+0.9 pp y-o-y). The accounting ROE for the same period was 16.2% (+1.2 pps y-o-y). Many of the outstanding net profit numbers at subsidiaries
level were coupled with strong profitability indicators, too: in 1Q the Ukrainian ROE stood at 68.2%, the Russian at 25.7%, the Bulgarian at 17.3%, the Croatian at 12.8% and the Romanian at 12.3%, respectively.
Key components of the adjusted after tax profit improvement: on one hand total risk costs declined to all-time low levels (-HUF 1.3 billion), at the same time the operating profit grew by 5% y-o-y: increasing total income (+9% y-o-y) offset the 13% y-o-y surge of operating expenses. In 1Q the effective tax rate was 11.6% (-0.8 pp y-o-y).
Within consolidated total income the net interest income improved by 9% y-o-y, while the net fee and commission income grew by 11%. The y-o-y erosion of NIM (1Q: 4.37%, -43 bps y-o-y) was offset by the higher volume of performing loans, as a result the net interest income grew by HUF 11.4 billion compared to the base period.
One of the most apparent evidences of the supportive macroeconomic environment is the steady improvement of the credit profile. On one hand the DPD90+ ratio dropped to 8.9%. Furthermore, the DPD90+ volume growth (adjusted for FX and the effect of sales and write offs) reached only HUF 7.3 billion versus the quarterly average of HUF 12.7 billion in 2017. The volume of Stage 3 exposure under IFRS 9 amounted to HUF 961 billion at the end of 1Q (12.2% of gross loans).
Total risk costs amounted to -HUF 1.3 billion. The consolidated risk cost rate was 0.03%.
The other important consequence of the favourable operating environment and low interest rates is the continuing increase of the performing volumes: in 1Q the FX-adjusted loan book advanced by HUF 151 billion (+2% q-o-q). All credit segments realized volume increase. As for the major Group members performing exposures grew by 2% at OTP Core, by 3% at OTP Russia and DSK Bank and by 6% at OTP Ukraine. Vojvdjanska banka realized a 3% increase ytd, while Merkantil, CKB Montenegro and OTP Romania reached 2% growth. Regarding the product segments the SME book grew the fastest (+5% ytd) followed by corporate dynamics (+3%). The consumer loan portfolio expanded by 2% ytd and mortgages grew by 1%, respectively.
At the same time the FX-adjusted deposit portfolio grew by HUF 127 billion (+1% q-o-q). The strongest quarterly deposit inflow was registered at OTP Core (+4%) and OTP Romania (+8%).
With respect to the q-o-q profit dynamics the adjusted after tax profit grew by HUF 19.7 billion (+33% q-o-q), but P&L lines were distorted by one-offs.
Quarterly risk costs dropped by 93% q-o-q, furthermore operating expenses moderated a lot (-HUF 10.3 billion q-o-q) after a seasonally high 4Q

SUMMARY OF THE FIRST QUARTER 2018 RESULTS
5/52
levels. A sharp quarterly drop was realized in administrative costs (marketing, expert fees), yet personnel expenses still kept increasing q-o-q as a result of the strong wage inflation.
Within core banking revenues Net Interest Income grew by 2% q-o-q. Lower margins were offset by increasing performing exposure, though calendar and base effect also affected the quarterly development. Recall: in 4Q 2017 OTP Core had a HUF 1.3 billion one-off distorting upward the NII (for details see at OTP Core section), at the same time at OTP Romania an accounting adjustment had around HUF 2 billion effect, but in negative direction. Also, in 4Q 2017 there was only one month net interest earnings realized at Vojvodjanska banka (HUF 1 billion) versus a full quarter in 1Q 2018 HUF 3 billion).
The quarterly development of F&C income (-15% q-o-q, -HUF 8.5 billion) was shaped by several factors. On one hand the base period was distorted by HUF 5 billion success fee at OTP Fund Management (booked within F&C), also, similar to previous years, the financial transaction tax on card transactions had to be paid in a lump-sum in the first quarter for the whole year, based on the annual volume of previous year’s transactions. This item amounted to HUF 1.6 billion in 1Q 2018 at OTP Core, similar to previous years. There was another negative item at OTP Core: effective from 12 February 2018 the Debt Management Agency reduced the selling fees on household-targeted government papers. The estimated annual negative impact is around HUF 3.5 billion. At the same time the quarterly dynamics were supported by the fact that the total amount of credit card refunds (HUF 1.9 billion) was booked in lump-sum in 4Q 2017.
Other net non-interest income grew by around HUF 3 billion q-o-q.
As a result, 1Q total income marginally eroded (-1% q-o-q), but it was offset by lower operating expenses (-8% q-o-q), so the operating profit improved by 9% q-o-q.
In 1Q FX-moves had a moderate impact on earnings: the average UAH rate weakened 6% against HUF q-o-q, whereas the RUB devaluation was 2%.
The quarterly NIM (4.37%) remained stable. Out of the major Group members OTP Core suffered a 10 bps decline, the erosion was less meaningful in Bulgaria and Croatia (-4 bps and -1 bp q-o-q, respectively). On the other hand, margins improved q-o-q both in Russia (+29 bps) and Ukraine (+18 bps)
At the end of 1Q 2018 the Group’ liquidity position was comfortably stable: operative liquidity reserves comprised EUR 9.3 billion equivalent.
Consolidated capital adequacy ratio (in accordance with BASEL III)
By the end of March 2018 the consolidated Common Equity Tier1 ratio under IFRS was 15.0% (+2.4 pps q-o-q, -1.0 pp y-o-y). Neither the quarterly net result was included (only audited net result may be included), nor was the accrued dividend amount deducted from the regulatory capital when calculating the IFRS consolidated capital adequacy ratios. Including those items the CET1 ratio would have been 15.6%.
In line with the Resolution made by the AGM the Bank has accrued HUF 15,330 million dividend that will be paid in the future from the 1Q 2018 retained earnings.
The preliminary estimate for the impact of implementing the IFRS 9 standards on the retained earnings in the opening consolidated balance sheet as of 1 January 2018, including the deferred tax effect, has been finalised in line with the audit of the standalone financials (-HUF 50.4 billion). As flagged earlier, OTP Bank opted to apply transitional rules (phase-in), accordingly in 2018 the negative CET1 impact will be 3 bps, in line with preliminary estimate.
Credit rating, shareholder structure
During 1Q 2018 there was no change in the credit rating of OTP Bank. Accordingly, OTP Bank Plc.’s long term foreign-currency deposit rating is ‘Baa3’ by Moody’s with stable outlook. OTP Mortgage Bank’s issuer rating was ‘Baa3’ with stable outlook and their covered bond carried a rating of ‘Baa1’. According to S&P Global OTP Bank an OTP Mortgage Bank had a rating of ‘BBB-‘, the outlook is stable. From Dagong Global OTP Bank has ꞌBBB+ꞌ long term ratings, the outlook is stable. OTP Bank Russia has a ꞌBBꞌ rating by Fitch, the outlook is stable.
Regarding the ownership structure of the Bank, by 31 March 2018 the following investors had more than 5% influence (voting rights) in the Company: MOL (the Hungarian Oil and Gas Company, 8.67%), the Rahimkulov family (8.02%), OPUS Securities SA (5.23%) and Groupama Group (5.18%).

SUMMARY OF THE FIRST QUARTER 2018 RESULTS
6/52
POST BALANCE SHEET EVENTS
Hungary
The Fidesz-Christian Democratic People’s Party (KDNP) collation has been reelected with 2/3 majority during the parliamentary elections on 8 April 2018. On 7 May the President asked Mr. Viktor Orbán to form his new cabinet.
On 13 April OTP Bank’s AGM elected Mr. Olivier Péqueux into its Supervisory Board and Audit Committee replacing Mr. Dominique Uzel.
In early May the Hungarian government submitted its convergence program for 2018-2022 period to the European Committee. The program anticipates a pace of economic growth significantly exceeding the EU average enabling faster convergence. Accordingly, in the forthcoming four years GDP growth will be in the access of 4% and the public debt to GDP will shrink below 60% by 2022 as a result of disciplined budgetary policy.
Russia
On 6 April 2018 the United States imposed new sanctions against Russia striking at some of the country’s biggest companies, oligarchs and senior officials to punish Moscow for its alleged meddling in the 2016 U.S. election and other ongoing aggressions in Crimea and Syria.
Romania
According to the extraordinary announcement by OTP Bank as of 19 April 2018: The acquisition of the 99.28% shareholding held by National Bank of Greece S.A. in Romanian Banca Romaneasca S.A. and the acquisition of other Romanian exposures of other Romanian subsidiaries of NBG by OTP Bank Romania S.A that - due to the non-fulfilment of the conditions precedents by the longstop date - the share purchase agreement entered into on 26 July 2017 has been terminated. With reference to this development, on 18 April 2018, OBR withdrew the appeal filed against the National Bank of Romania’s first instance decision, in which the central bank did not grant its approval with respect to the Transaction.
On 7 May 2018 the National Bank of Romania raised the base rate by 25 bps to 2.50%.
Serbia
On 11 April 2018 the Serbian central bank decided to cut the key rate by 25 bps to 3%.

SUMMARY OF THE FIRST QUARTER 2018 RESULTS
7/52
CONSOLIDATED AFTER TAX PROFIT BREAKDOWN BY SUBSIDIARIES (IFRS)2
in HUF million 1Q 2017 4Q 2017 1Q 2018 Q-o-Q Y-o-Y Consolidated after tax profit 52,859 68,454 65,050 -5% 23%
Adjustments (total) -13,902 8,934 -14,216 -259% 2%Consolidated adjusted after tax profit without the effect of adjustments 66,762 59,520 79,266 33% 19%
Banks total without one-off items1 63,608 52,772 75,755 44% 19%OTP CORE (Hungary)2 40,848 31,685 39,095 23% -4%Corporate Centre (after tax)3 1,137 -1,755 1,111 -163% -2%OTP Bank Russia4 7,553 6,328 8,520 35% 13%Touch Bank (Russia)5 -2,259 -2,236 -1,315 -41% -42%OTP Bank Ukraine6 3,311 5,242 5,833 11% 76%DSK Bank (Bulgaria)7 13,391 10,445 11,258 8% -16%OBR (Romania)8 1,308 952 1,504 58% 15%OTP banka Srbija (Serbia)9 -6 -1,634 573 -135%OBH (Croatia)10 -1,847 6,035 7,718 28% -518%OBS (Slovakia)11 90 -1,469 770 -152% 756%CKB (Montenegro)12 82 -819 688 -184% 737%
Leasing 2,053 2,763 2,473 -10% 20%Merkantil Bank + Car, adj. (Hungary)13 1,942 2,317 1,648 -29% -15%Foreign leasing companies (Croatia, Bulgaria, Romania, Serbia)14 111 446 825 85% 645%
Asset Management 1,087 5,194 1,221 -76% 12%OTP Asset Management (Hungary) 1,046 5,071 1,074 -79% 3%Foreign Asset Management Companies (Ukraine, Romania, Bulgaria)15 41 123 147 19% 263%
Other Hungarian Subsidiaries 5 -1,239 41 -103% 685%Other Foreign Subsidiaries (Slovakia, United Kingdom, Montenegro, Romania, Serbia, Croatia, Belize)16
51 307 38 -88% -25%
Eliminations -42 -277 -263 -5% 523% Total adjusted after tax profit of HUNGARIAN subsidiaries17 44,936 35,807 42,706 19% -5%Total adjusted after tax profit of FOREIGN subsidiaries18 21,825 23,717 36,559 54% 68%Share of foreign profit contribution, % 33% 40% 46% 16% 41%
2 Relevant footnotes are in the Supplementary Data section of the Report.

SUMMARY OF THE FIRST QUARTER 2018 RESULTS
8/52
CONSOLIDATED AND SEPARATE, UNAUDITED IFRS REPORTS OF OTP BANK PLC.
CONSOLIDATED STATEMENT OF RECOGNIZED INCOME Main components of the Statement of recognized income
in HUF million 1Q 2017 4Q 2017 1Q 2018 Q-o-Q Y-o-Y
Consolidated after tax profit 52,859 68,454 65,050 -5% 23%Adjustments (total) -13,902 8,934 -14,216 -259% 2%
Dividends and net cash transfers (after tax) 139 30 129 332% -7%Goodwill/investment impairment charges (after tax) 512 -5,606 0 -100% -100%Special tax on financial institutions (after corporate income tax) -14,730 -171 -14,725 0%Impact of fines imposed by the Hungarian Competition Authority (after tax)
177 0 0 -100%
Effect of acquisitions (after tax) 0 14,681 380 -97% Consolidated adjusted after tax profit without the effect of adjustments 66,762 59,520 79,266 33% 19%
Before tax profit 76,204 66,063 89,696 36% 18%Operating profit 88,721 85,077 92,830 9% 5%
Total income 188,756 208,852 206,335 -1% 9%Net interest income 132,180 140,523 143,614 2% 9%Net fees and commissions 44,549 58,073 49,579 -15% 11%Other net non-interest income 12,026 10,256 13,142 28% 9%
Foreign exchange result, net 5,004 3,955 7,238 83% 45%Gain/loss on securities, net 1,719 1,295 779 -40% -55%Net other non-interest result 5,304 5,006 5,124 2% -3%
Operating expenses -100,035 -123,775 -113,505 -8% 13%Personnel expenses -49,560 -56,780 -57,598 1% 16%Depreciation -9,722 -12,376 -11,304 -9% 16%Other expenses -40,753 -54,619 -44,604 -18% 9%
Total risk costs -12,475 -19,120 -1,289 -93% -90%Provision for loan losses -10,647 -13,371 -570 -96% -95%Other provision -1,828 -5,749 -719 -87% -61%
Total one-off items -42 106 -1,845 Gain on the repurchase of own Upper and Lower Tier2 Capital 0 0 0 Result of the treasury share swap at OTP Core -42 106 -1,845
Corporate taxes -9,442 -6,543 -10,430 59% 10%INDICATORS 1Q 2017 4Q 2017 1Q 2018 Q-o-Q Y-o-Y
ROE (from accounting net earnings) 15.0% 16.9% 16.2% -0.7%p 1.2%pROE (from adjusted net earnings) 18.8% 14.7% 19.7% 5.0%p 0.9%pROA (from adjusted net earnings) 2.4% 1.9% 2.4% 0.6%p 0.0%p
Operating profit margin 3.22% 2.65% 2.83% 0.18%p -0.40%pTotal income margin 6.86% 6.50% 6.28% -0.22%p -0.58%p
Net interest margin 4.80% 4.38% 4.37% 0.00%p -0.43%pNet fee and commission margin 1.62% 1.81% 1.51% -0.30%p -0.11%pNet other non-interest income margin 0.44% 0.32% 0.40% 0.08%p -0.04%p
Cost-to-asset ratio 3.64% 3.85% 3.46% -0.40%p -0.18%pCost/income ratio 53.0% 59.3% 55.0% -4.3%p 2.0%p
Risk cost for loan losses-to-average gross loans 0.65% 0.70% 0.03% -0.67%p -0.62%pTotal risk cost-to-asset ratio 0.45% 0.60% 0.04% -0.56%p -0.41%pEffective tax rate 12.4% 9.9% 11.6% 1.7%p -0.8%p
Non-interest income/total income 30% 33% 30% -2%p 0%pEPS base (HUF) (from unadjusted net earnings) 202 262 248 -5% 23%EPS diluted (HUF) (from unadjusted net earnings) 202 261 248 -5% 23%EPS base (HUF) (from adjusted net earnings) 255 227 303 33% 19%EPS diluted (HUF) (from adjusted net earnings) 255 227 303 33% 19%
Comprehensive Income Statement 1Q 2017 4Q 2017 1Q 2018 Q-o-Q Y-o-Y Consolidated after tax profit 52,859 68,454 65,050 -5% 23%Fair value changes of financial instruments measured at fair value through other comprehensive income
4,970 4,104 -4,224 -203% -185%
Fair value adjustment of derivative financial instruments designated as cash-flow hedge
0 0 1
Fair value adjustment of strategic open FX position hedging net investment in foreign operations
543 274 -705 -357% -230%
Foreign currency translation difference 10,736 -8,140 4,277 -153% -60%Change of actuarial losses (IAS 19) 0 -241 0 -100%
Net comprehensive income 69,108 64,450 64,398 0% -7%o/w Net comprehensive income attributable to equity holders 68,890 64,370 64,362 0% -7%Net comprehensive income attributable to non-controlling interest 218 80 36 -55% -83%
Average exchange rate of the HUF (in HUF) 1Q 2017 4Q 2017 1Q 2018 Q-o-Q Y-o-Y HUF/EUR 297 309 307 0% 4%HUF/CHF 241 289 292 1% 21%HUF/USD 224 275 276 0% 23%

SUMMARY OF THE FIRST QUARTER 2018 RESULTS
9/52
CONSOLIDATED BALANCE SHEET Main components of balance sheet
in HUF million 1Q 2017 4Q 2017 1Q 2018 Q-o-Q Y-o-Y
TOTAL ASSETS 11,295,754 13,190,228 13,511,182 2% 20%Cash and amount due from banks 1,351,267 1,198,046 1,264,606 6% -6%Placements with other banks 347,441 462,180 460,641 0% 33%Financial assets at fair value 210,599 344,417 307,136 -11% 46%Securities available-for-sale 1,669,298 2,174,718 2,104,417 -3% 26%Net customer loans 5,778,811 6,987,834 7,102,159 2% 23%Net customer loans (FX adjusted1) 5,721,239 7,013,904 7,102,159 1% 24%
Gross customer loans 6,708,882 7,690,419 7,856,093 2% 17%Gross customer loans (FX adjusted1) 6,613,915 7,717,862 7,856,093 2% 19%
o/w Retail loans 4,329,815 4,875,734 4,947,536 1% 14%Retail mortgage loans (incl. home equity) 2,321,061 2,453,634 2,455,901 0% 6%Retail consumer loans 1,482,627 1,875,226 1,919,302 2% 29%SME loans 526,127 546,874 572,333 5% 9%
Corporate loans 2,027,526 2,577,226 2,636,335 2% 30%Loans to medium and large corporates 1,941,672 2,375,799 2,414,305 2% 24%Municipal loans 85,855 201,427 222,030 10% 159%
Car financing loans 217,051 264,744 272,222 3% 25%Bills and accrued interest receivables related to loans 39,523 158 0 -100% -100%
Allowances for loan losses -930,071 -702,585 -753,934 7% -19%Equity investments 10,041 12,269 16,913 38% 68%Securities held-to-maturity 1,218,822 1,310,331 1,537,619 17% 26%Premises, equipment and intangible assets, net 360,314 413,389 410,638 -1% 14%
o/w Goodwill, net 107,573 100,976 100,318 -1% -7%Premises, equipment and other intangible assets, net 252,740 312,414 310,320 -1% 23%
Other assets 349,160 287,044 307,051 7% -12%TOTAL LIABILITIES AND SHAREHOLDERS' EQUITY 11,295,754 13,190,228 13,511,182 2% 20%Liabilities to credit institutions and governments 491,895 472,068 537,682 14% 9%Customer deposits 8,441,077 10,233,471 10,385,228 1% 23%Customer deposits (FX adjusted1) 8,357,216 10,260,240 10,385,228 1% 24%
o/w Retail deposits 6,077,407 7,290,603 7,445,850 2% 23%Household deposits 5,090,141 6,095,712 6,203,164 2% 22%SME deposits 987,266 1,194,891 1,242,685 4% 26%
Corporate deposits 2,268,399 2,954,962 2,926,854 -1% 29%Deposits to medium and large corporates 1,733,683 2,264,984 2,163,721 -4% 25%Municipal deposits 534,716 689,978 763,132 11% 43%
Accrued interest payable related to customer deposits 11,410 14,675 12,524 -15% 10%Issued securities 263,629 250,320 258,602 3% -2%
o/w Retail bonds 19,875 6,500 6,038 -7% -70%Issued securities without retail bonds 243,754 243,821 252,564 4% 4%
Other liabilities 586,357 518,286 661,957 28% 13%Subordinated bonds and loans2 76,565 76,028 75,266 -1% -2%Total shareholders' equity 1,436,232 1,640,055 1,592,448 -3% 11%
Indicators 1Q 2017 4Q 2017 1Q 2018 Q-o-Q Y-o-Y Loan/deposit ratio (FX adjusted1) 79% 75% 76% 0%p -3%pNet loan/(deposit + retail bond) ratio (FX adjusted1) 68% 68% 68% 0%p 1%pStage 3 loan volume under IFRS 9 960,509 Stage 3 loans under IFRS9/gross customer loans 12.2% 90+ days past due loan volume 941,546 707,211 696,882 -1% -26%90+ days past due loans/gross customer loans 14.1% 9.2% 8.9% -0.3%p -5.2%pTotal provisions/90+ days past due loans 98.8% 99.3% 108.2% 8.8%p 9.4%p
Consolidated capital adequacy - Basel3 1Q 2017 4Q 2017 1Q 2018 Q-o-Q Y-o-Y Capital adequacy ratio (consolidated, IFRS) 18.5% 14.6% 16.9% 2.3%p -1.5%pTier1 ratio 16.0% 12.7% 15.0% 2.4%p -1.0%pCommon Equity Tier1 ('CET1') capital ratio 16.0% 12.7% 15.0% 2.4%p -1.0%pRegulatory capital (consolidated) 1,249,250 1,228,628 1,454,460 18% 16%
o/w Tier1 Capital 1,082,777 1,062,701 1,288,998 21% 19%o/w Common Equity Tier1 capital 1,082,777 1,062,701 1,288,998 21% 19%
Tier2 Capital 166,473 165,927 165,463 0% -1%o/w Hybrid Tier2 89,935 89,935 89,935 0% 0%
Consolidated risk weighted assets (RWA) (Credit&Market&Operational risk)
6,768,003 8,389,920 8,582,683 2% 27%
o/w RWA (Credit risk) 5,552,337 6,795,559 6,980,967 3% 26%RWA (Market & Operational risk) 1,215,665 1,594,361 1,601,716 0% 32%
Closing exchange rate of the HUF (in HUF) 1Q 2017 4Q 2017 1Q 2018 Q-o-Q Y-o-Y HUF/EUR 309 310 313 1% 1%HUF/CHF 289 265 265 0% -8%HUF/USD 289 259 254 -2% -12%1 For the FX adjustment, the closing cross currency rates for the current period were used to calculate the HUF equivalent of loan and deposit volumes in the base periods. 2 The ICES bonds are considered as Tier2 debt, but accounting-wise they are treated as part of the shareholders’ equity.

SUMMARY OF THE FIRST QUARTER 2018 RESULTS
10/52
OTP BANK’S HUNGARIAN CORE BUSINESS
OTP Core Statement of recognized income:
Main components of the Statement of recognised income in HUF million
1Q 2017 4Q 2017 1Q 2018 Q-o-Q Y-o-Y
After tax profit without the effect of adjustments 40,848 31,685 39,095 23% -4%Corporate income tax -5,179 -1,637 -3,526 115% -32%
Pre-tax profit 46,026 33,322 42,621 28% -7%Operating profit 38,033 33,042 37,961 15% 0%
Total income 87,926 91,506 89,539 -2% 2%Net interest income 57,586 60,132 59,506 -1% 3%Net fees and commissions 24,249 26,214 23,840 -9% -2%Other net non-interest income 6,091 5,161 6,193 20% 2%
Operating expenses -49,893 -58,464 -51,578 -12% 3%Total risk costs 8,035 174 6,505 -19%
Provisions for possible loan losses 6,988 4,139 7,706 86% 10%Other provisions 1,048 -3,964 -1,200 -70% -215%
Total one-off items -42 106 -1,845 Gain on the repurchase of own Upper and Lower Tier2 Capital 0 0 0 0% 0%Revaluation result of the treasury share swap agreement -42 106 -1,845
Indicators 1Q 2017 4Q 2017 1Q 2018 Q-o-Q Y-o-Y ROE 12.6% 8.8% 10.8% 2.0%p -1.8%pROA 2.3% 1.7% 2.0% 0.3%p -0.3%p
Operating profit margin 2.2% 1.7% 2.0% 0.2%p -0.2%pTotal income margin 5.06% 4.80% 4.60% -0.20%p -0.45%p
Net interest margin 3.31% 3.16% 3.06% -0.10%p -0.25%pNet fee and commission margin 1.39% 1.38% 1.23% -0.15%p -0.17%pNet other non-interest income margin 0.35% 0.27% 0.32% 0.05%p -0.03%p
Operating costs to total assets ratio 2.9% 3.1% 2.7% -0.4%p -0.2%pCost/income ratio 56.7% 63.9% 57.6% -6.3%p 0.9%p
Cost of risk/average gross loans1 -1.07% -0.58% -1.10% -0.52%p -0.04%pEffective tax rate 11.3% 4.9% 8.3% 3.4%p -3.0%p
1 Negative Cost of risk/average gross loan volumes indicators imply provision release.

SUMMARY OF THE FIRST QUARTER 2018 RESULTS
11/52
Main components of OTP Core’s Statement of financial position:
Main components of balance sheet closing balances in HUF mn
1Q 2017 4Q 2017 1Q 2018 Q-o-Q Y-o-Y
Total Assets 7,186,708 7,704,135 8,037,659 4% 12%Net customer loans 2,462,973 2,634,920 2,681,001 2% 9%Net customer loans (FX adjusted) 2,462,073 2,636,951 2,681,001 2% 9%
Gross customer loans 2,667,329 2,793,871 2,852,776 2% 7%Gross customer loans (FX adjusted) 2,664,812 2,795,949 2,852,776 2% 7%
Retail loans 1,764,241 1,823,160 1,845,164 1% 5%Retail mortgage loans (incl. home equity) 1,279,878 1,275,672 1,278,196 0% 0%Retail consumer loans 316,750 372,006 383,621 3% 21%SME loans 167,613 175,481 183,347 4% 9%
Corporate loans 900,571 972,790 1,007,612 4% 12%Loans to medium and large corporates 871,004 936,987 959,649 2% 10%Municipal loans 29,567 35,803 47,964 34% 62%
Provisions -204,356 -158,951 -171,775 8% -16%Provisions (FX adjusted) -202,739 -158,998 -171,775 8% -15%
Deposits from customers + retail bonds 4,868,019 5,388,080 5,576,136 3% 15%Deposits from customers + retail bonds (FX adjusted) 4,845,391 5,388,056 5,576,136 3% 15%
Retail deposits + retail bonds 3,198,516 3,477,983 3,634,768 5% 14%Household deposits + retail bonds 2,623,670 2,821,360 2,934,921 4% 12%
o/w: Retail bonds 19,875 6,500 6,038 -7% -70%SME deposits 574,846 656,624 699,847 7% 22%
Corporate deposits 1,646,875 1,910,073 1,941,368 2% 18%Deposits to medium and large corporates 1,149,319 1,290,959 1,253,863 -3% 9%Municipal deposits 497,557 619,114 687,505 11% 38%
Liabilities to credit institutions 288,139 285,539 314,015 10% 9%Issued securities without retail bonds 299,280 288,799 299,451 4% 0%Total shareholders' equity 1,303,288 1,430,256 1,422,547 -1% 9%
Loan Quality 1Q 2017 4Q 2017 1Q 2018 Q-o-Q Y-o-Y Stage 3 loan volume under IFRS 9 (in HUF million) 257,516 Stage 3 loans under IFRS 9/gross customer loans (%) 9.0% 90+ days past due loan volume (in HUF million) 243,919 179,618 175,935 -2% -28%90+ days past due loans/gross customer loans (%) 9.1% 6.4% 6.2% -0.3%p -3.0%pTotal provisions/90+ days past due loans (%) 83.8% 88.5% 97.6% 9.1%p 13.9%p
Market Share 1Q 2017 4Q 2017 1Q 2018 Q-o-Q Y-o-Y Loans 20.3% 20.6% 20.8% 0.2%p 0.5%pDeposits1 24.3% 26.1% 26.2% 0.1%p 1.9%pTotal Assets 25.0% 25.7% 26.3% 0.6%p 1.3%p
Performance Indicators 1Q 2017 4Q 2017 1Q 2018 Q-o-Q Y-o-Y Net loans to (deposits + retail bonds) (FX adjusted) 51% 49% 48% -1%p -3%pLeverage (closing Shareholder's Equity/Total Assets) 18.1% 18.6% 17.7% -0.9%p -0.4%pLeverage (closing Total Assets/Shareholder's Equity) 5.5x 5.4x 5.7x 0.3x 0.1xCapital adequacy ratio (OTP Bank, non-consolidated, Basel3, HAS until 4Q 2016, IFRS from 1Q 2017) 32.2% 31.4% 31.8% 0.4%p -0.3%pCommon Equity Tier1 ratio (OTP Bank, non-consolidated, Basel3, HAS until 4Q 2016, IFRS from 1Q 2017) 29.5% 29.0% 29.5% 0.5%p 0.0%p
1 Market share figures changed retroactively due to data revision.

SUMMARY OF THE FIRST QUARTER 2018 RESULTS
12/52
P&L developments
Without the effect of adjustment items OTP Core posted a profit after tax of HUF 39.1 billion in 1Q 2018, falling short of the base period by 4%, but showing a q-o-q 23% increase.
The profit before tax moderated by 7% y-o-y, reasoned partly by the lower provision write-backs, whereas the operating profit remained stable. The quarterly profit improvement was shaped mostly by favourable developments in risk costs and seasonally dropping operating costs, whereas revenues were negatively influenced by both technical and seasonal factors.
It was favourable that total income (without one-off items) went up by 2% y-o-y. Within that net interest income expanded by 3% y-o-y. Gross interest revenues benefited from dynamic organic loan volume growth, the continuing shift of liquidity reserves toward longer duration and higher yielding Hungarian government bonds. The investment of additional liquidity generated by the deposit inflow added to the interest revenues, too. The 1Q 2018 net interest margin (3.06%) declined by 25 bps compared to 1Q 2017; this was to a great extent driven by the continuing erosion of short-term reference rates used as benchmark rates for variable rate loans. The quarterly average 3M BUBOR rate diminished y-o-y by 23 bps.
1Q net interest income contracted q-o-q by 1%. This can be explained by the calendar effect and a base effect: certain one-off items booked in 4Q 2017 in connection with agent fees related to purchase loan disbursements added HUF 1.3 billion to the NII line in the previous quarter. On the
other hand, continued expansion of performing loans, especially consumer loans, as well as further growth in long maturity higher yielding government bonds affected interest revenues positively.
Short-term reference rates did not erode further q-o-q in 1Q 2018: the average rate of 3M BUBOR shrank by a mere 1 bp to 2 bps.
The net interest margin eroded q-o-q by 10 bps, but adjusted for the above-mentioned HUF 1.3 billion one-off item accounted for in 4Q 2017 the 4Q NIM would have stood at 3.09%, implying a q-o-q decline of only 3 bps.
The net fee and commission income decreased by 2% y-o-y. On one hand, growing transactional turnover and volumes resulted in stronger card, deposit and transaction-related fee revenues. However, securities fee income moderated because the distribution fees on certain household targeted government bonds were reduced by the Government Debt Management Agency in two steps: from 17 July 2017 and February 2018.
Net fees dropped by 9% q-o-q. Apart from the seasonality-driven decline, the quarterly development was also explained by the fact that similar to previous years, the financial transaction tax on card transactions had to be paid in a lump-sum in the first quarter for the whole year, based on the annual volume of previous year’s transactions. This item amounted to HUF 1.6 billion in 1Q 2018 (similar to 1Q 2017). The reduction of retail government bonds’ distribution fees by the Government Debt Management Agency effective from mid-February was a drag on quarterly development of fee revenues, too. However, the quarterly dynamics were positively affected by base effect: the annual amount of refunds related to the usage of credit cards (HUF 1.9 billion) was booked in one lump-sum in 4Q 2017.
In 2018 OTP Bank will be paying altogether HUF 1.3 billion into the Compensation Fund (established in order to indemnify the victims of Quaestor and Hungaria Securities Ltd.). The whole annual amount was already accounted for in 1Q 2018, in line with IFRS standards. The contributions can be deducted immediately from the nominal amount of banking tax or financial transaction tax or corporate tax. Due to the deductibility, in the adjusted P&L structure the Compensation Fund contributions booked in a lump-sum in 1Q 2018, as well as the deductions are presented within the financial transaction tax.
The other net non-interest income (without one-offs) grew by 2% y-o-y.
In 1Q 2018 -HUF 1.8 billion negative revaluation result was recorded on the Revaluation result of the treasury share swap agreement line. The reason for this was that according to the structure of the
1Q 2018 adjusted profit after tax of OTP Core reached HUF 39.1 billion (-4% y-o-y)
Operating profit remained stable y-o-y, whereas risk cost releases moderated
The q-o-q improving result (+23%) was due to higher provision write-backs and seasonally lower operating expenses
Continuing q-o-q erosion of net interest margin
Further diminishing DPD90+ ratio
Performing loan growth reached 11% y-o-y and 2.3% q-o-q. In quarterly comparison both consumer and SME loans advanced by 4%
Performing mortgage loans expanded by 1% q-o-q and 2% y-o-y, amidst 32% growth in new mortgage loan disbursements. Within new housing loan applications the share of fixed rate and within that, the proportion of certified consumer-friendly loans has been rising further

SUMMARY OF THE FIRST QUARTER 2018 RESULTS
13/52
swap agreement, the extraordinary dividend announced by MOL Plc. reduced that net present value component of the swap deal which relates to the dividends. The expected realization of the extraordinary dividend in 2Q 2018 will neutralize the negative NPV-effect booked in 1Q.
Operating expenses increased by 3% y-o-y mostly as a result of higher personnel expenses, but amortization went up, too. Personnel expense growth was driven by base salary hikes in 2017 and higher number of employees. These were partially offset by the 2.5 pps reduction of social and health care contributions to be paid by employers effective from January 2018. (In 2017 the Government cut these contributions by 5 pps).
The q-o-q 12% decrease in operating costs was mainly due to the base effect of higher marketing expenses, advisory costs in connection with M&A and integration tasks, as well as business development projects booked in 4Q 2017, and also the seasonality of other general costs.
On the total risk costs line a release of HUF 6.5 billion was recognized in 1Q 2018, 19% less than a year ago.
The DPD90+ volumes adjusted for FX rate movements and sales and write offs declined by HUF 2 billion in 1Q 2018 (the decline was HUF 5 billion in 2016 adjusted for the technical effect of the AXA portfolio take-over and HUF 14 billion in 2017, respectively). In 1Q 2018 HUF 2 billion non-performing exposures were sold or written off. The DPD90+ ratio moderated by 0.3 pp q-o-q and by 3.0 pps y-o-y to 6.2%. The ratio of Stage 3 loans under IFRS 9 to total gross loans stood at 9.0% at the end of March.
Balance sheet trends
The FX-adjusted gross loan portfolio increased by 7% y-o-y. However, due to the sales and write-offs of non-performing loans, the performing (DPD0-90) loan volume developments are more illustrative: performing loans advanced by 2.3% q-o-q and by 11% y-o-y (FX-adjusted).
Whereas the organic loan expansion was predominantly driven by corporate loan growth both in 2016 and 2017, in 2018 the structure of quarterly loan growth showed a more balanced picture. All segments posted positive growth rates q-o-q: within the overall 2.3% performing loan growth mortgages expanded by 1%, consumer and SME loans by 4%, and medium and large corporate loans by 2%.
The outstanding stock of mortgage loans has finally switched into growth mode in the second half of 2017: the performing mortgage volumes have grown q-o-q in every quarter since 3Q 2017. In 1Q 2018 the q-o-q expansion was 1%. In 1Q mortgage loan applications at OTP Core represented
HUF 81.9 billion (+5% q-o-q, +35% y-o-y). New disbursements showed a 32% increase y-o-y. OTP Bank’s market share in new mortgage loan contractual amounts reached 28.5% in 1Q 2018.
From October 2017 the share of fixed rate mortgages within total mortgage loan applications has been steadily rising. The proportion of fixed rate housing loans (with an interest rate fixation period of at least 5 years) within applications for non-subsidized housing loans reached 77% in March 2018.
The gradually increasing share of certified customer-friendly mortgages is also positive: their proportion within new fixed rate market-based housing loan applications stood at 61% in April 2018.
OTP Bank helps the Hungarian families realize their housing aims through its active participation in the Housing Subsidy Scheme for Families (CSOK), too. In 1Q 2018 around 2,500 applications for the CSOK subsidy were registered at OTP Bank with a value of HUF 9 billion. Applicants also combined CSOK subsidy with subsidized or market-based loan applications in the amount of HUF 15 billion. Also thanks to the additional demand generated by the CSOK, state subsidized housing loan applications represented HUF 22.4 billion in 1Q 2018, up by 6% y-o-y.
Performing consumer loan volumes advanced by 28% y-o-y and 4% q-o-q (FX adjusted). The yearly increase was supported by few big ticket Lombard loans disbursed in 2Q 2017; without these the y-o-y growth would have been 17%.
Within consumer loans, cash loan growth was outstanding: the quarterly performing cash loan growth reached 9%, whereas the yearly increase accelerated to 40%. OTP’s market share in the outstanding cash loan volumes stood at 34.5% at the end of March.
FX-adjusted deposit volumes (including retail bonds) increased by 15% y-o-y and by 3% q-o-q. The yearly growth was equally supported by retail and corporate expansion, while the quarterly growth was mainly propelled by the continued strong pace of household deposit growth and the q-o-q 11% jump in municipal deposits.
At the end of March 2018 OTP kept HUF 17 billion in three-month central bank deposits. As for the distribution of the liquidity reserves of the Bank, during the last twelve months there has been a gradual shift towards longer duration Hungarian government securities.

SUMMARY OF THE FIRST QUARTER 2018 RESULTS
14/52
OTP FUND MANAGEMENT (HUNGARY) Changes in assets under management and financial performance of OTP Fund Management:
Main components of P&L account in HUF mn
1Q 2017 4Q 2017 1Q 2018 Q-o-Q Y-o-Y
After tax profit w/o dividends and net cash transfer 1,046 5,071 1,074 -79% 3%Income tax -102 -497 -107 -78% 5%
Profit before income tax 1,149 5,568 1,181 -79% 3%Operating profit 1,149 5,588 1,181 -79% 3%
Total income 1,539 6,982 1,698 -76% 10%Net interest income 0 0 0 -94% -84%Net fees and commissions 1,538 6,955 1,701 -76% 11%Other net non-interest income 0 28 -3 -111%
Operating expenses -390 -1,395 -517 -63% 33%Other provisions 0 -20 0 -100% -100%
Main components of balance sheet closing balances in HUF mn
1Q 2017 4Q 2017 1Q 2018 Q-o-Q Y-o-Y
Total assets 18,046 20,587 21,784 6% 21%Total shareholders' equity 10,701 17,958 18,952 6% 77%
Asset under management in HUF bn
1Q 2017 4Q 2017 1Q 2018 Q-o-Q Y-o-Y
Assets under management, total (w/o duplicates) 1,522 1,519 1,261 -17% -17%Retail investment funds (closing, w/o duplicates) 994 942 912 -3% -8%Volume of managed assets (closing, w/o duplicates) 529 576 350 -39% -34%
Volume of investment funds (with duplicates) 1,176 1,171 1,160 -1% -1%money market 276 219 172 -22% -38%bond 367 311 294 -6% -20%mixed 34 48 60 26% 77%security 133 148 158 7% 19%guaranteed 66 49 44 -9% -32%other 301 396 431 9% 43%
The OTP Fund Management posted HUF 1.1 billion profit in 1Q 2018 underpinning a 3% y-o-y increase. The 79% q-o-q decline can be explain by the base effect of accounted performance fees generated by the fund management activities in 4Q 2017.
Both the profit before tax and the operating profit increased by 3% y-o-y, the latter is the result of the 10% y-o-y increase of total income and the 33% expansion of operating expenses. Net fees and commissions improved by 11% y-o-y supported by a shift towards higher fee-generating products. The 75% q-o-q decline was due to the above mentioned performance fees booked in 4Q.
Considering the whole market, in 1Q 2018 the managed assets of BAMOSZ members increased
q-o-q. Equity and mixed funds as well as total return funds and real estate funds experienced increasing cash inflow, while money market funds, bond funds and protected funds suffered an outflow.
Assets under management at the Company dropped by HUF 226 billion q-o-q as a result of an intragroup portfolio re-allocation. The volume of AUM marginally declined both q-o-q and y-o-y (-1% respectively). The shift within different types of investment funds resembled pretty much the whole market during the quarter.
The market share of OTP Fund Management (without duplications) was 23.5%, lower by 0.4 pp y-o-y. The Company retained its market leading position.

SUMMARY OF THE FIRST QUARTER 2018 RESULTS
15/52
MERKANTIL BANK AND CAR (HUNGARY) Performance of Merkantil Bank and Car:
Main components of P&L account in HUF mn
1Q 2017 4Q 2017 1Q 2018 Q-o-Q Y-o-Y
After tax profit without the effect of adjustments 1,942 2,317 1,648 -29% -15%Income tax -56 -38 0 Profit before income tax 1,998 2,355 1,648 -30% -17%
Operating profit 1,546 1,174 1,786 52% 16%Total income 3,009 2,891 3,269 13% 9%
Net interest income 2,779 3,326 3,098 -7% 11%Net fees and commissions -128 -45 -30 -34% -77%Other net non-interest income 359 -390 202 -44%
Operating expenses -1,464 -1,718 -1,484 -14% 1%Total provisions 452 1,181 -137
Provision for possible loan losses 559 463 -139 Other provision -106 719 1
Main components of balance sheet closing balances in HUF mn
1Q 2017 4Q 2017 1Q 2018 Q-o-Q Y-o-Y
Total assets 351,217 369,180 376,903 2% 7%Gross customer loans 282,564 292,925 298,693 2% 6%Gross customer loans (FX-adjusted) 282,409 293,099 298,693 2% 6%
Retail loans 25,838 28,860 28,427 -2% 10%Corporate loans 83,961 89,585 94,835 6% 13%Car financing loans 172,609 174,654 175,431 0% 2%
Allowances for possible loan losses -36,415 -21,000 -20,915 0% -43%Allowances for possible loan losses (FX-adjusted) -36,343 -21,001 -20,915 0% -42%Deposits from customers 31,173 20,799 19,473 -6% -38%Deposits from customer (FX-adjusted) 31,173 20,799 19,473 -6% -38%
Retail deposits 25,446 19,250 17,706 -8% -30%Corporate deposits 5,726 1,549 1,767 14% -69%
Liabilities to credit institutions 287,526 303,371 314,443 4% 9%Issued securities 3 0 0 -100%Total shareholders' equity 26,400 30,268 27,248 -10% 3%
Loan Quality 1Q 2017 4Q 2017 1Q 2018 Q-o-Q Y-o-Y Stage 3 loan volume under IFRS 9 (in HUF million) 23,126 Stage 3 loans under IFRS 9/gross customer loans (%) 7.7% Cost of risk/average gross loans (%) -0.80% -0.63% 0.19% 0.82%p 0.99%p90+ days past due loan volume (in HUF million) 32,353 16,874 17,298 3% -47%90+ days past due loans/gross customer loans (%) 11.4% 5.8% 5.8% 0.0%p -5.7%pTotal provisions/90+ days past due loans (%) 112.6% 124.5% 120.9% -3.5%p 8.4%p
Performance Indicators 1Q 2017 4Q 2017 1Q 2018 Q-o-Q Y-o-Y ROA 2.3% 2.5% 1.8% -0.7%p -0.4%pROE 31.3% 29.4% 22.9% -6.5%p -8.4%pTotal income margin 3.49% 3.16% 3.59% 0.43%p 0.10%pNet interest margin 3.22% 3.63% 3.40% -0.23%p 0.18%pCost/income ratio 48.6% 59.4% 45.4% -14.0%p -3.3%p

SUMMARY OF THE FIRST QUARTER 2018 RESULTS
16/52
The Merkantil Bank and Car posted adjusted HUF 1.6 billion after tax profit of in 1Q 2018, The q-o-q and y-o-y lower profit was mainly attributable to loan-related risk costs development: against provision releases in the base period, in 1Q 2018 provisions were made.
In 1Q the net interest income increased by 11% y-o-y, the expansion of performing loan volumes, as well as the lower funding costs had a positive NII-effect.
The q-o-q developments on the other net non-interest income line were shaped by base effect: in 4Q 2017 there was a sale of a claim resulting a HUF 0.4 billion drop in other income (simultaneously other risk cost line decreased by the same amount).
Operating expenses grew moderately y-o-y (+1%), whereas the significant drop of 14% q-o-q was due to lower marketing and personnel expenses.
In 1Q 2018 DPD90+ volumes (adjusted for FX rate changes and sold and written off volumes) increased by HUF 0.3 billion against the quarterly average decline of HUF 0.3 billion in 2017. The ratio of DPD90+ loans decreased by 5.7 pps y-o-y to 5.8% parallel with HUF 14.0 billion problem loans being sold or written off for the last twelve months. The volume of Stage 3 loans amounted to HUF 23 billion at the end of 1Q (7.7% of total gross loans).
The FX-adjusted performing loan portfolio expanded by 13%. The volume of performing corporate exposures increased by 6% q-o-q and by 14% y-o-y, respectively. Car loans expanded by 12% on a yearly base. Annual total new loan origination grew by 31% y-o-y, within that the volume of newly disbursed car loans surged by 27% y-o-y. Merkantil retained its market leading position both in terms of new loan disbursements and volumes.

SUMMARY OF THE FIRST QUARTER 2018 RESULTS
17/52
IFRS REPORTS OF THE MAIN SUBSIDIARIES
In the following parts of the Summary the after tax profit of the foreign subsidiaries are presented without any received dividends and net cash transfers, and without other adjustment items in case of certain foreign subsidiaries. The structural adjustments on the lines of subsidiaries’ Statements of recognised income as well as description of calculation methods of performance indices can be found in the Supplementary data annex.
DSK GROUP (BULGARIA)
Performance of DSK Group:
Main components of P&L account in HUF mn
1Q 2017 4Q 2017 1Q 2018 Q-o-Q Y-o-Y
After tax profit without the effect of adjustments 13,391 10,445 11,258 8% -16%Income tax -1,496 -827 -1,143 38% -24%Profit before income tax 14,887 11,271 12,401 10% -17%
Operating profit 15,776 13,747 15,446 12% -2%Total income 26,278 26,997 26,930 0% 2%
Net interest income 18,392 17,756 17,927 1% -3%Net fees and commissions 6,394 7,304 6,896 -6% 8%Other net non-interest income 1,492 1,936 2,107 9% 41%
Operating expenses -10,502 -13,250 -11,484 -13% 9%Total provisions -890 -2,476 -3,045 23% 242%
Provision for possible loan losses -466 -2,718 -4,183 54% 797%Other provision -423 242 1,138 370%
Main components of balance sheet closing balances in HUF mn
1Q 2017 4Q 2017 1Q 2018 Q-o-Q Y-o-Y
Total assets 1,895,337 1,925,740 1,978,056 3% 4%Gross customer loans 1,144,119 1,184,871 1,223,884 3% 7%Gross customer loans (FX-adjusted) 1,158,307 1,194,113 1,223,884 2% 6%
Retail loans 827,073 833,791 848,893 2% 3%Corporate loans 331,234 360,322 374,991 4% 13%
Allowances for possible loan losses -141,609 -109,137 -110,035 1% -22%Allowances for possible loan losses (FX-adjusted) -143,318 -109,989 -110,035 0% -23%Deposits from customers 1,563,146 1,626,924 1,631,333 0% 4%Deposits from customer (FX-adjusted) 1,572,999 1,637,702 1,631,333 0% 4%
Retail deposits 1,347,251 1,463,398 1,474,304 1% 9%Corporate deposits 225,747 174,305 157,029 -10% -30%
Liabilities to credit institutions 32,077 4,802 44,838 834% 40%Total shareholders' equity 212,740 250,296 220,814 -12% 4%
Loan Quality 1Q 2017 4Q 2017 1Q 2018 Q-o-Q Y-o-Y Stage 3 loan volume under IFRS 9 (in HUF million) 149,552 Stage 3 loans under IFRS 9/gross customer loans (%) 12.2% Cost of risk/average gross loans (%) 0.16% 0.90% 1.37% 0.47%p 1.21%p90+ days past due loan volume (in HUF million) 129,209 93,936 94,426 1% -27%90+ days past due loans/gross customer loans (%) 11.3% 7.9% 7.7% -0.2%p -3.6%pTotal provisions/90+ days past due loans (%) 109.6% 116.2% 116.5% 0.3%p 6.9%p
Performance Indicators 1Q 2017 4Q 2017 1Q 2018 Q-o-Q Y-o-Y ROA 2.9% 2.2% 2.3% 0.1%p -0.5%pROE 21.8% 17.0% 17.3% 0.4%p -4.5%pTotal income margin 5.60% 5.66% 5.54% -0.12%p -0.06%pNet interest margin 3.92% 3.72% 3.69% -0.04%p -0.23%pCost/income ratio 40.0% 49.1% 42.6% -6.4%p 2.7%pNet loans to deposits (FX-adjusted) 65% 66% 68% 2%p 4%p
FX rates (in HUF) 1Q 2017 4Q 2017 1Q 2018 Q-o-Q Y-o-Y HUF/BGN (closing) 157.8 158.6 159.8 1% 1%HUF/BGN (average) 158.1 159.3 159.0 0% 1%

SUMMARY OF THE FIRST QUARTER 2018 RESULTS
18/52
DSK Group posted an after tax profit of HUF 11.3 billion in 1Q 2018, an 8% growth q-o-q and 16% decline y-o-y.
On the yearly basis operating profit decreased by 2%, as a result of total income growing by 2% and operating expenses by 9%, respectively. The significant decline of net results was due to higher risk cost exceeding HUF 2 billion. On the quarterly basis operating expenses increased by 12% with stable total income and operating expenses declining by 13%.
Net interest margin eroded by 23 bps y-o-y to 3.69% and net interest income declined by 3%. Despite the slight quarterly contraction of NIM (4 bps) and the calendar effect, net interest income increased by 1% q-o-q due to growing performing loan volumes.
Net fee and commission income improved by 8% y-o-y due to the growth of deposit and transactions related fee revenues, while on the quarterly basis it decreased by 6% resulting from the lower loan related F&C income.
Operating expenses decreased by 13% q-o-q mainly due to lower marketing and IT spending, as
well as decreasing advisory cost. Large part of the 9% yearly growth can be explained by the higher personnel expenses stemming from the digitalisation and retail internet banking development projects.
1Q total risk cost amounted to HUF 3 billion (+23% q-o-q). Risk cost rate grew to 1.37%, the negative developments were induced by the provisions made on consumer and corporate exposures. The FX-adjusted DPD90+ volumes excluding the impact of loan sales and write-offs remained unchanged q-o-q. The DPD90+ ratio decreased by 0.2 pp q-o-q to 7.7% (-3.6 pps y-o-y). The volume of Stage 3 loans amounted to HUF 150 billion at the end of 1Q (12.2% of total gross loans).
The FX-adjusted growth of performing loans reached 10% y-o-y supported by strengthening retail disbursement activity. Mortgage loan disbursement went up by 10% q-o-q in local currency (+87% y-o-y), so performing mortgage loan volumes grew by 2% q-o-q (+9% y-o-y). Cash loan and POS loan disbursements returned to the levels seen in 3Q 2017 (+11% q-o-q, +29% y-o-y), the performing consumer loan portfolio went up by 1% q-o-q (+4% y-o-y, FX-adjusted).
Corporate and SME loan disbursements fell short of the record 4Q level, but increased by 57% y-o-y in 1Q. Performing corporate loan portfolio grew by 5% q-o-q and 16% y-o-y.
The FX-adjusted deposit base was stable on a quarterly basis as the retail deposit expansion counterbalanced the corporate deposit outflow; on the yearly basis the overall deposit volume growth was 4%. As a favourable development net loan-to-deposit ratio increased to 68% (+2 pps q-o-q).
The quarterly drop of shareholders’ equity is due to the reclassification of dividend payable to the mother company into short-term liabilities.
HUF 11.3 billion profit in 1Q (-16% y-o-y) as a result of operating results shrinking by 2% and higher risk cost on the yearly basis
Net interest income improved q-o-q, the expansion of performing loan volumes counterbalanced the negative effect from the 4 bps NIM erosion
Stronger business activity: FX-adjusted performing loans grew by 10% y-o-y and 3% q-o-q supported by further strengthening retail loan sales
SUMMARY OF THE FIRST QUARTER 2018 RESULTS
19/52
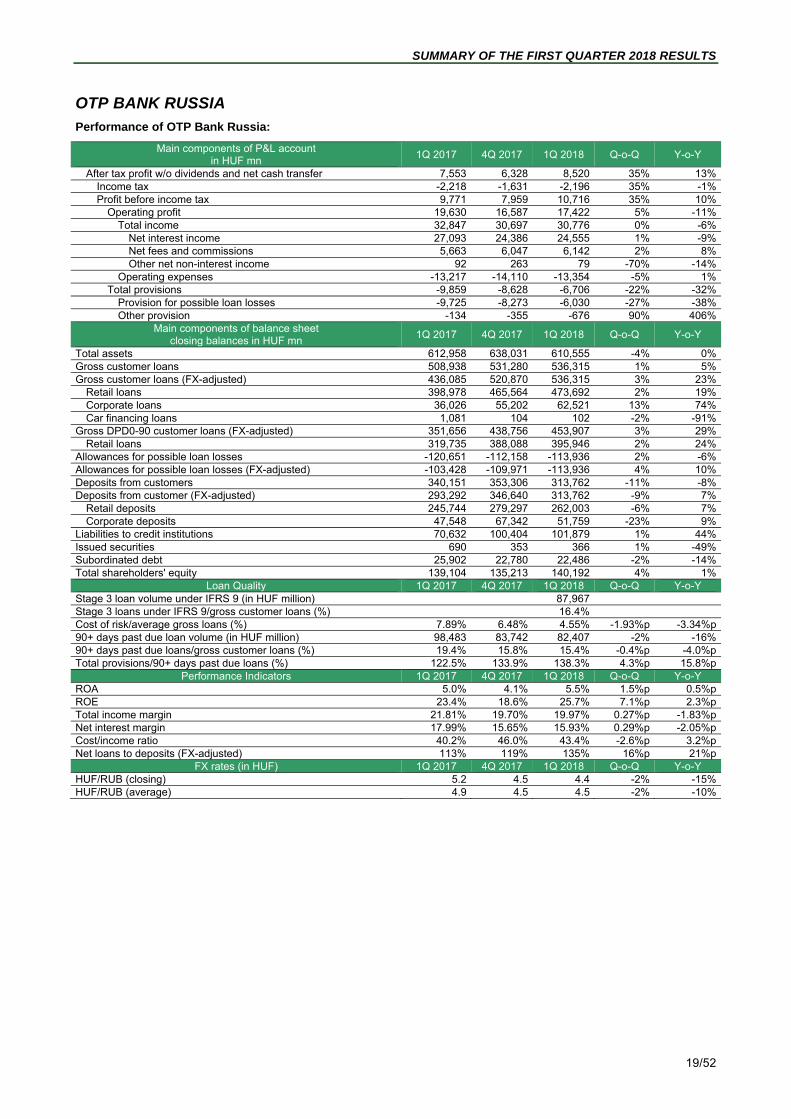
OTP BANK RUSSIA
Performance of OTP Bank Russia:
Main components of P&L account in HUF mn
1Q 2017 4Q 2017 1Q 2018 Q-o-Q Y-o-Y
After tax profit w/o dividends and net cash transfer 7,553 6,328 8,520 35% 13%Income tax -2,218 -1,631 -2,196 35% -1%Profit before income tax 9,771 7,959 10,716 35% 10%
Operating profit 19,630 16,587 17,422 5% -11%Total income 32,847 30,697 30,776 0% -6%
Net interest income 27,093 24,386 24,555 1% -9%Net fees and commissions 5,663 6,047 6,142 2% 8%Other net non-interest income 92 263 79 -70% -14%
Operating expenses -13,217 -14,110 -13,354 -5% 1%Total provisions -9,859 -8,628 -6,706 -22% -32%
Provision for possible loan losses -9,725 -8,273 -6,030 -27% -38%Other provision -134 -355 -676 90% 406%
Main components of balance sheet closing balances in HUF mn
1Q 2017 4Q 2017 1Q 2018 Q-o-Q Y-o-Y
Total assets 612,958 638,031 610,555 -4% 0%Gross customer loans 508,938 531,280 536,315 1% 5%Gross customer loans (FX-adjusted) 436,085 520,870 536,315 3% 23%
Retail loans 398,978 465,564 473,692 2% 19%Corporate loans 36,026 55,202 62,521 13% 74%Car financing loans 1,081 104 102 -2% -91%
Gross DPD0-90 customer loans (FX-adjusted) 351,656 438,756 453,907 3% 29%Retail loans 319,735 388,088 395,946 2% 24%
Allowances for possible loan losses -120,651 -112,158 -113,936 2% -6%Allowances for possible loan losses (FX-adjusted) -103,428 -109,971 -113,936 4% 10%Deposits from customers 340,151 353,306 313,762 -11% -8%Deposits from customer (FX-adjusted) 293,292 346,640 313,762 -9% 7%
Retail deposits 245,744 279,297 262,003 -6% 7%Corporate deposits 47,548 67,342 51,759 -23% 9%
Liabilities to credit institutions 70,632 100,404 101,879 1% 44%Issued securities 690 353 366 1% -49%Subordinated debt 25,902 22,780 22,486 -2% -14%Total shareholders' equity 139,104 135,213 140,192 4% 1%
Loan Quality 1Q 2017 4Q 2017 1Q 2018 Q-o-Q Y-o-Y Stage 3 loan volume under IFRS 9 (in HUF million) 87,967 Stage 3 loans under IFRS 9/gross customer loans (%) 16.4% Cost of risk/average gross loans (%) 7.89% 6.48% 4.55% -1.93%p -3.34%p90+ days past due loan volume (in HUF million) 98,483 83,742 82,407 -2% -16%90+ days past due loans/gross customer loans (%) 19.4% 15.8% 15.4% -0.4%p -4.0%pTotal provisions/90+ days past due loans (%) 122.5% 133.9% 138.3% 4.3%p 15.8%p
Performance Indicators 1Q 2017 4Q 2017 1Q 2018 Q-o-Q Y-o-Y ROA 5.0% 4.1% 5.5% 1.5%p 0.5%pROE 23.4% 18.6% 25.7% 7.1%p 2.3%pTotal income margin 21.81% 19.70% 19.97% 0.27%p -1.83%pNet interest margin 17.99% 15.65% 15.93% 0.29%p -2.05%pCost/income ratio 40.2% 46.0% 43.4% -2.6%p 3.2%pNet loans to deposits (FX-adjusted) 113% 119% 135% 16%p 21%p
FX rates (in HUF) 1Q 2017 4Q 2017 1Q 2018 Q-o-Q Y-o-Y HUF/RUB (closing) 5.2 4.5 4.4 -2% -15%HUF/RUB (average) 4.9 4.5 4.5 -2% -10%

SUMMARY OF THE FIRST QUARTER 2018 RESULTS
20/52
The HUF denominated financial figures of OTP Bank Russia are distorted by the HUF/RUB moves: the 1Q 2018 closing rate showed q-o-q 2% and y-o-y 15% depreciation of RUB against HUF; whereas the 1Q average rate weakened by 2% q-o-q and 10% y-o-y. Therefore, local currency P&L and balance sheet dynamics can be materially different from those in HUF terms.
In 1Q 2018 OTP Bank Russia posted HUF 8.5 billion after tax profit, which underpins a material improvement y-o-y and q-o-q as well (+25% and +37% respectively, in RUB terms).
As for the rouble denominated yearly earnings dynamics, operating profit was flat as the 4% y-o-y growth of total income was counterbalanced by the 12% increase of operating expenses. Thus the yearly improvement of net results was predominantly driven by the 25% drop of risk cost. On the quarterly basis growth of operating profit (+7%) as well as the decline of risk cost (-21%) fuelled the q-o-q improvement in the after tax profit.
Despite narrowing net interest margin net interest income increased by 1% on yearly basis in RUB terms (+2% q-o-q). As a favourable development NIM improved by 29 bps q-o-q and decreased by 2 pps to 15.9% y-o-y.
Net fee and commission income grew in RUB terms by 20% y-o-y due to insurance fee income on cash loans with insurance policies and other products growing considerably, while commission income generated by credit cards declined due to the shrinkage of the average outstanding portfolio. Net F&C income increased by 3% q-o-q partly due to lower agent fee expense.
Operating expenses grew y-o-y by 12% in RUB terms, within that personnel expenses by 10% and administrative expenses by 19%, respectively. On the quarterly basis personnel expense increased by 7% in RUB terms, but overall operating expenses declined by 4% due to the seasonality of material expenses.
In 1Q 2018 the moderation of loan portfolio quality deterioration continued, the FX-adjusted increase in DPD90+ loans (adjusted for loan sales and write-offs) amounted to HUF 6.7 billion versus (1Q 2017 8.3, 2Q 9.4, 3Q 7.9, 4Q 7.1). The DPD90+ ratio improved by 0.4 pp to 15.4% q-o-q (-4.0 pps y-o-y). Total risk cost decreased y-o-y, as well as q-o-q (25 and 21% respectively). The risk cost rate decreased accordingly to 4.5% in 1Q. The volume of Stage 3 loans amounted to HUF 88 billion at the end of 1Q (16.4% of total gross loans).
In 1Q 2018 the growth of the loan portfolio continued, the FX-adjusted performing (DPD0-90) loan portfolio expanded by 29% y-o-y and by 3.5% q-o-q. In consumer lending the fourth quarter is seasonally the strongest, therefore we see lower disbursement volumes on the quarterly comparison in 1Q. However, on the yearly basis POS disbursements increased by 25% and cash loan disbursements by 60%. So, the FX-adjusted performing POS loan portfolio surged by 28% y-o-y and was flat q-o-q. The FX-adjusted volume of performing cash loans grew by 45% y-o-y and 7% q-o-q. With regards to the credit card segment, the portfolio growth that has been in place since 2H 2017 continued and we already see y-o-y performing volume growth (+2% q-o-q, +3% y-o-y).
FX-adjusted performing corporate loan volumes kept on growing dynamically (+14% q-o-q, +82 y-o-y), due to the favourable development of large corporate exposures and commercial factoring. With the portfolio expansion in the last 12 months the share of corporate loans within gross loans grew from 8% to 12%. The newly originated loans are mainly local currency denominated, so the share of FX loans within the corporate segment is below 20%.
FX-adjusted total deposits increased by 7% y-o-y; within that both retail and corporate segments performed well. Retail deposits decreased by 6% q-o-q, while the corporate deposits drooped by 23%. FX-adjusted net loan-to-deposit ratio stood at 135% at the end of 1Q 2018 (+16 pps q-o-q).
HUF 8.5 billion after tax profit in 1Q (+25% y-o-y in local currency) with stable operating profit and lower risk cost
Net interest income grew by 2% q-o-q in RUB terms, with NIM growing by 0.3 pp and performing loan volumes expanding
In 1Q loan portfolio quality deterioration remained moderate, risk cost rate declined to 4.5%
Due to seasonality loan disbursements dropped q-o-q, but performing loan volumes grew nevertheless by 3% q-o-q

SUMMARY OF THE FIRST QUARTER 2018 RESULTS
21/52
TOUCH BANK (RUSSIA)
Performance of Touch Bank:
Main components of P&L account in HUF mn
1Q 2017 4Q 2017 1Q 2018 Q-o-Q Y-o-Y
After tax profit w/o dividends and net cash transfer -2,259 -2,236 -1,315 -41% -42%Income tax 558 537 321 -40% -43%Profit before income tax -2,817 -2,773 -1,636 -41% -42%
Operating profit -2,665 -2,287 -1,006 -56% -62%Total income 158 613 763 24% 384%
Net interest income 218 559 658 18% 201%Net fees and commissions -68 46 96 109% -241%Other net non-interest income 8 8 10 19% 23%
Operating expenses -2,823 -2,900 -1,769 -39% -37%Total provisions -152 -487 -630 29% 315%
Provision for possible loan losses -153 -484 -615 27% 302%Other provision 1 -2 -15 602%
Main components of balance sheet closing balances in HUF mn
1Q 2017 4Q 2017 1Q 2018 Q-o-Q Y-o-Y
Total assets 28,059 33,693 34,200 2% 22%Gross customer loans 6,953 12,812 13,999 9% 101%Gross customer loans (FX-adjusted) 5,940 12,556 13,999 12% 136%
Retail loans 5,940 12,556 13,999 12% 136%Corporate loans 0 0 0
Allowances for possible loan losses -198 -1,657 -2,907 77% Allowances for possible loan losses (FX-adjusted) -169 -1,623 -2,907 80% Deposits from customers 21,398 26,352 26,122 -1% 22%Deposits from customer (FX-adjusted) 18,297 25,826 26,122 1% 43%
Retail deposits 18,297 25,826 26,122 1% 43%Corporate deposits 0 0 0
Liabilities to credit institutions 0 0 0 Subordinated debt 0 0 0 Total shareholders' equity 6,509 7,142 7,519 5% 16%
Loan Quality 1Q 2017 4Q 2017 1Q 2018 Q-o-Q Y-o-Y Stage 3 loan volume under IFRS 9 (in HUF million) 1,706 Stage 3 loans under IFRS 9/gross customer loans (%) 12.2% Cost of risk/average gross loans (%) 17.32% 15.43% 18.46% 3.03%p 1.14%pCost of risk/average (FX-adjusted) gross loans 17.72% 15.66% 18.81% 3.15%p 1.09%p90+ days past due loan volume (in HUF million) 21 1,283 1,691 33% 90+ days past due loans/gross customer loans (%) 0.3% 10.0% 12.1% 2.1%p 11.8%pTotal provisions/90+ days past due loans (%) 953.4% 129.1% 171.9% 42.6%p -781.5%p
Performance Indicators 1Q 2017 4Q 2017 1Q 2018 Q-o-Q Y-o-Y Total income margin 2.41% 7.83% 9.03% 1.20%p 6.62%pNet interest margin 3.33% 7.14% 7.78% 0.64%p 4.45%pNet loans to deposits (FX-adjusted) 32% 42% 42% 0%p 11%p
FX rates (in HUF) 1Q 2017 4Q 2017 1Q 2018 Q-o-Q Y-o-Y HUF/RUB (closing) 5.2 4.5 4.4 -2% -15%HUF/RUB (average) 4.9 4.5 4.5 -2% -10%
Touch Bank is part of OTP Bank Russia from legal point of view, and it is operating under the same banking license, but as a separate digital banking business line. In order to provide transparent information Touch Bank is presented as a separate virtual entity.
In 1Q 2018 Touch Bank’s after tax loss amounted to HUF 1.3 billion (-35% y-o-y, -40% q-o-q in local currency). Total income growth continued in 1Q (+27% q-o-q in RUB terms), within that net interest income grew by 20% q-o-q driven by the loan portfolio growth. Net fee and commission income almost doubled q-o-q: on one hand F&C income
grew, on the other refunds to customers were seasonally lower.
Operating expenses amounted to HUF 1.8 billion in 1Q 2018 decreasing by 38% q-o-q in RUB terms (-30% y-o-y) mostly due to base effect.
Risk cost increased by 32% q-o-q in RUB terms. The loan portfolio quality deteriorated, the DPD90+ ratio grew to 12.1%, almost equal to the Stage 3 ratio.
In 1Q 2018 gross loans grew further in 1Q (+12% q-o-q, +136% y-o-y on an FX-adjusted basis) and reached HUF 14 billion.
In 1Q total deposits grew by 1% (FX-adjusted) amid lower deposit rates.
Declining, HUF 1.3 billion loss in 1Q
Moderate q/q loan portfolio growth; closing volume of gross loans was HUF 14 billion
Worsening loan portfolio quality, DPD90+

SUMMARY OF THE FIRST QUARTER 2018 RESULTS
22/52
OTP BANKA HRVATSKA (CROATIA)
Performance of OTP banka Hrvatska (including Splitska banka):
Main components of P&L account in HUF mn
1Q 2017 4Q 2017 1Q 2018 Q-o-Q Y-o-Y
After tax profit without the effect of adjustments -1,847 6,035 7,718 28% -518%Income tax 417 -938 -1,456 55% -449%Profit before income tax -2,264 6,973 9,174 32% -505%
Operating profit 3,140 8,676 7,576 -13% 141%Total income 7,818 19,216 18,187 -5% 133%
Net interest income 5,955 13,483 13,166 -2% 121%Net fees and commissions 1,301 3,913 3,599 -8% 177%Other net non-interest income 562 1,820 1,422 -22% 153%
Operating expenses -4,678 -10,540 -10,611 1% 127%Total provisions -5,404 -1,703 1,598 -194% -130%
Provision for possible loan losses -5,011 -891 1,597 -279% -132%Other provision -393 -812 1 -100% -100%
Main components of balance sheet closing balances in HUF mn
1Q 2017 4Q 2017 1Q 2018 Q-o-Q Y-o-Y
Total assets 639,423 1,821,613 1,755,802 -4% 175%Gross customer loans 483,195 1,121,938 1,138,641 1% 136%Gross customer loans (FX-adjusted) 489,061 1,132,068 1,138,641 1% 133%
Retail loans 316,968 629,255 640,836 2% 102%Corporate loans 171,972 483,924 479,159 -1% 179%Car financing loans 121 18,889 18,646 -1%
Allowances for possible loan losses -55,397 -63,752 -70,256 10% 27%Allowances for possible loan losses (FX-adjusted) -56,131 -64,399 -70,256 9% 25%Deposits from customers 508,805 1,395,087 1,371,458 -2% 170%Deposits from customer (FX-adjusted) 506,973 1,404,534 1,371,458 -2% 171%
Retail deposits 440,002 997,777 991,619 -1% 125%Corporate deposits 66,971 406,757 379,839 -7% 467%
Liabilities to credit institutions 40,802 132,765 81,145 -39% 99%Total shareholders' equity 72,917 238,935 248,521 4% 241%
Loan Quality 1Q 2017 4Q 2017 1Q 2018 Q-o-Q Y-o-Y Stage 3 loan volume under IFRS 9 (in HUF million) 110,466 Stage 3 loans under IFRS 9/gross customer loans (%) 9.7% Cost of risk/average gross loans (%) 4.29% 0.32% -0.58% -0.90%p -4.87%p90+ days past due loan volume (in HUF million) 56,771 74,325 78,246 5% 38%90+ days past due loans/gross customer loans (%) 11.7% 6.6% 6.9% 0.2%p -4.9%pTotal provisions/90+ days past due loans (%) 97.6% 85.8% 89.8% 4.0%p -7.8%p
Performance Indicators 1Q 2017 4Q 2017 1Q 2018 Q-o-Q Y-o-Y ROA -1.2% 1.4% 1.8% 0.4%p 2.9%pROE -10.0% 10.3% 12.8% 2.5%p 22.8%pTotal income margin 4.92% 4.31% 4.16% -0.15%p -0.76%pNet interest margin 3.75% 3.02% 3.01% -0.01%p -0.73%pCost/income ratio 59.8% 54.9% 58.3% 3.5%p -1.5%pNet loans to deposits (FX-adjusted) 85% 76% 78% 2%p -7%p
FX rates (in HUF) 1Q 2017 4Q 2017 1Q 2018 Q-o-Q Y-o-Y HUF/HRK (closing) 41.5 41.6 42.1 1% 1%HUF/HRK (average) 41.4 41.4 41.8 1% 1%

SUMMARY OF THE FIRST QUARTER 2018 RESULTS
23/52
Based on the acquisition agreement on purchasing 100% shareholding of Splitska banka d.d., member of Société Générale Group signed on 20 December 2016 between OTP banka Hrvatska, the Croatian subsidiary of OTP Bank and Société Générale Group, on 2 May 2017 the financial closure of the transaction has been completed and Splitska banka was consolidated.
The Croatian P&L account was adjusted for the one-off items directly related to the acquisition; these corrections are shown on consolidated level among the adjustment items. The balance sheet items were not adjusted for the acquisition effect.
The Croatian operation (including Splitska banka) posted HUF 7.7 billion adjusted after tax profit in 1Q 2018, implying a 28% improvement q-o-q. This reflects mainly the provision release on the total risk cost line. Splitska banka delivered HUF 5.0 billion after tax profit in 1Q 2018, up from HUF 3.3 billion a quarter ago (+51%).
Return on equity (ROE) climbed to 12.8% versus 9.3% in 2017 as a whole.
The comparability of the financial performance on a yearly base is limited, as 1Q 2017 did not incorporate any contribution from Splitska banka; the first time consolidation happened in May 2017. The loss reported in 1Q 2017 was explained to a great extent by provisions booked on a big corporate exposure.
As for other key P&L lines, in 1Q 2018 Splitska banka contributed HUF 7.4 billion to the net interest income, HUF 2.4 billion to the net fees and commissions, HUF 0.6 billion to the other net non-interest income, -HUF 6.0 billion to the operating expenses and +HUF 1.6 billion to the total risk costs line, respectively.
In 1Q 2018 the operating result moderated by 14% q-o-q, explained partially by technical factors and seasonality. The net interest income dropped by 2% due to the negative calendar effect; both performing loans and margins remained stable q-o-q. The y-o-y 73 bps net interest margin decline of the Croatian operation was mainly reasoned by the dilution effect of the lower margin at Splitska banka.
The net fee income eroded by 8% over the quarter, and other net non-interest income dropped by 22% q-o-q, both changes can be partly attributed to seasonality.
Operating expenses grew by 1% q-o-q. 5 branches were closed down in the first quarter, while the number of employees declined by 11 persons q-o-q (based on FTE number). The cost to income ratio improved y-o-y by 1.5 pps to 58.3%.
In 1Q a release of altogether HUF 1.6 billion was reflected on the total risk cost line, against the creation of -HUF 1.7 billion in the previous quarter and -HUF 5.4 billion a year ago. During 1Q 2018 loan-related risk cost releases happened primarily in the corporate segment.
The FX-adjusted increase in DPD90+ loans (adjusted for loan sales and write-offs) amounted to HUF 3 billion in 1Q 2018, the deterioration befell mainly in consumer loans. In the HUF 9 billion problem loans were sold or written off in the period under review. The DPD90+ ratio changed to 6.9% (+0.2 pp q-o-q, -4.9 pps y-o-y, latter was mainly driven by the Splitska transaction). The Croatian operation’s Stage 3 ratio under IFRS 9 in percentage of total gross loans stood at 9.7% at the end of March.
At the end of March the gross loan volumes of Splitska banka amounted to HUF 640 billion, whereas performing loans comprised HUF 616 billion. Excluding Splitska-effect the performing loans expanded by 3% y-o-y (FX-adjusted).
Performing retail loan volumes increased by 1% q-o-q; mortgage loan disbursements moderated by 7% q-o-q, but jumped by 85% y-o-y. Cash loan sales remained stable q-o-q, and corporate loan production showed a 13% improvement over the last quarter.
There was a 2% deposit outflow in the last quarter. The net loan to deposit ratio increased by 2 pps q-o-q to 78% (FX-adjusted).
In 1Q 2018 the Croatian banking group posted HUF 7.7 billion adjusted net profit with ROE getting close to 13%
The integration of Splitska banka is in progress, the merger is expected to be completed in the second half of 2018
The net interest margin remained stable q-o-q
The FX-adjusted performing loan portfolio grew by 0.3% q-o-q, while deposits melted down by 2% (FX-adjusted)
SUMMARY OF THE FIRST QUARTER 2018 RESULTS
24/52
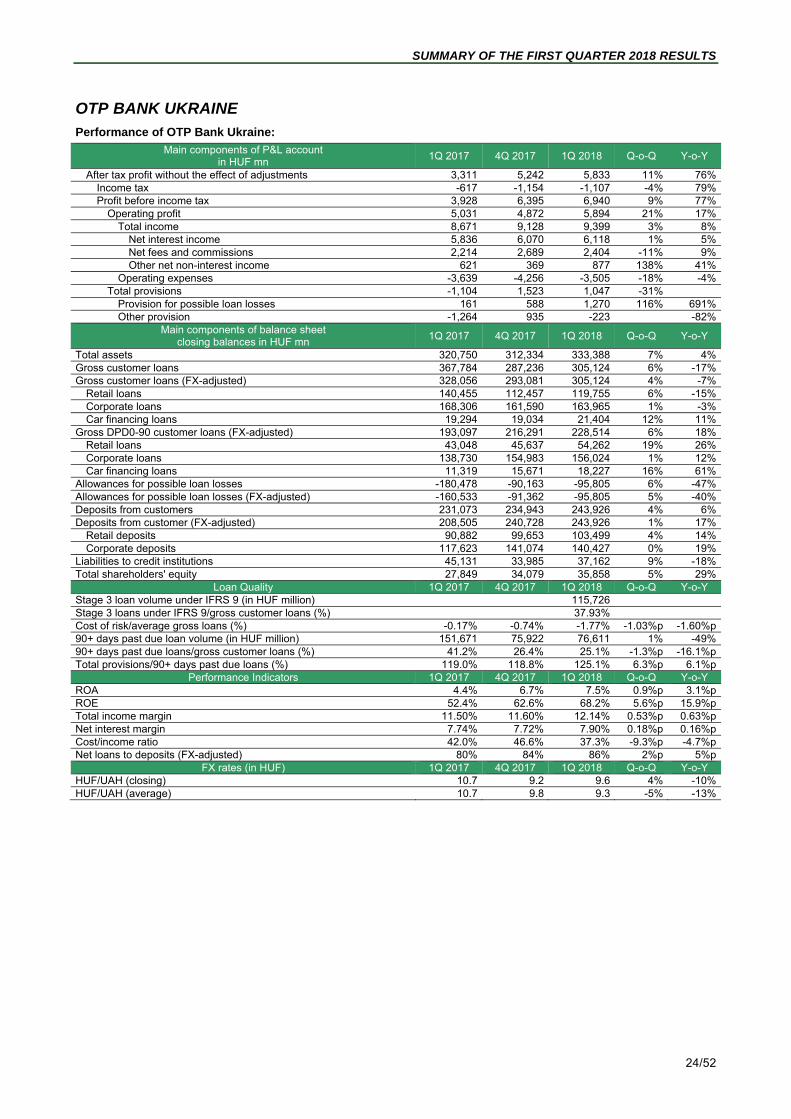
OTP BANK UKRAINE
Performance of OTP Bank Ukraine:
Main components of P&L account in HUF mn
1Q 2017 4Q 2017 1Q 2018 Q-o-Q Y-o-Y
After tax profit without the effect of adjustments 3,311 5,242 5,833 11% 76%Income tax -617 -1,154 -1,107 -4% 79%Profit before income tax 3,928 6,395 6,940 9% 77%
Operating profit 5,031 4,872 5,894 21% 17%Total income 8,671 9,128 9,399 3% 8%
Net interest income 5,836 6,070 6,118 1% 5%Net fees and commissions 2,214 2,689 2,404 -11% 9%Other net non-interest income 621 369 877 138% 41%
Operating expenses -3,639 -4,256 -3,505 -18% -4%Total provisions -1,104 1,523 1,047 -31%
Provision for possible loan losses 161 588 1,270 116% 691%Other provision -1,264 935 -223 -82%
Main components of balance sheet closing balances in HUF mn
1Q 2017 4Q 2017 1Q 2018 Q-o-Q Y-o-Y
Total assets 320,750 312,334 333,388 7% 4%Gross customer loans 367,784 287,236 305,124 6% -17%Gross customer loans (FX-adjusted) 328,056 293,081 305,124 4% -7%
Retail loans 140,455 112,457 119,755 6% -15%Corporate loans 168,306 161,590 163,965 1% -3%Car financing loans 19,294 19,034 21,404 12% 11%
Gross DPD0-90 customer loans (FX-adjusted) 193,097 216,291 228,514 6% 18%Retail loans 43,048 45,637 54,262 19% 26%Corporate loans 138,730 154,983 156,024 1% 12%Car financing loans 11,319 15,671 18,227 16% 61%
Allowances for possible loan losses -180,478 -90,163 -95,805 6% -47%Allowances for possible loan losses (FX-adjusted) -160,533 -91,362 -95,805 5% -40%Deposits from customers 231,073 234,943 243,926 4% 6%Deposits from customer (FX-adjusted) 208,505 240,728 243,926 1% 17%
Retail deposits 90,882 99,653 103,499 4% 14%Corporate deposits 117,623 141,074 140,427 0% 19%
Liabilities to credit institutions 45,131 33,985 37,162 9% -18%Total shareholders' equity 27,849 34,079 35,858 5% 29%
Loan Quality 1Q 2017 4Q 2017 1Q 2018 Q-o-Q Y-o-Y Stage 3 loan volume under IFRS 9 (in HUF million) 115,726 Stage 3 loans under IFRS 9/gross customer loans (%) 37.93% Cost of risk/average gross loans (%) -0.17% -0.74% -1.77% -1.03%p -1.60%p90+ days past due loan volume (in HUF million) 151,671 75,922 76,611 1% -49%90+ days past due loans/gross customer loans (%) 41.2% 26.4% 25.1% -1.3%p -16.1%pTotal provisions/90+ days past due loans (%) 119.0% 118.8% 125.1% 6.3%p 6.1%p
Performance Indicators 1Q 2017 4Q 2017 1Q 2018 Q-o-Q Y-o-Y ROA 4.4% 6.7% 7.5% 0.9%p 3.1%pROE 52.4% 62.6% 68.2% 5.6%p 15.9%pTotal income margin 11.50% 11.60% 12.14% 0.53%p 0.63%pNet interest margin 7.74% 7.72% 7.90% 0.18%p 0.16%pCost/income ratio 42.0% 46.6% 37.3% -9.3%p -4.7%pNet loans to deposits (FX-adjusted) 80% 84% 86% 2%p 5%p
FX rates (in HUF) 1Q 2017 4Q 2017 1Q 2018 Q-o-Q Y-o-Y HUF/UAH (closing) 10.7 9.2 9.6 4% -10%HUF/UAH (average) 10.7 9.8 9.3 -5% -13%

SUMMARY OF THE FIRST QUARTER 2018 RESULTS
25/52
The financial performance and indicators of OTP Bank Ukraine in HUF terms were affected by the HUF/UAH exchange rate moves: in 1Q 2018 the closing rate of UAH appreciated by 4% q-o-q, but weakened by 10% y-o-y. The 1Q average rates also demonstrated weakening (-5% q-o-q and -13% y-o-y, respectively). As a result, there are some differences in local currency P&L and balance sheets dynamics versus those in HUF terms.
OTP Bank Ukraine posted HUF 5.8 billion an all-time high adjusted after tax profit in 1Q 2018 marking a 76% increase against the base period. The quarterly ROE reached 68.2% the highest among subsidiary banks across the Group.
Given the significant HUF/UAH cross-currency moves y-o-y and q-o-q, we rather analyse the P&L developments in UAH terms.
1Q operating result surged by 35% y-o-y, the key reason was the y-o-y 21% increase in net interest income. The q-o-q improvement in operating profit was rather the result of lower operating expenses.
The y-o-y NII dynamics (in UAH) were positively influenced by the higher NIM and also by the growing volume of performing loans. Amid the higher interest environment the net interest margin advanced to 7.90% (+18 bps q-o-q and +16 bps y-o-y).
Net F&C income (in UAH) jumped by 25% y-o-y supported by corporate transactions and deposit-related fee income; the stronger overall business activity had its positive impact, too.
Operating expenses in UAH increased by 11% y-o-y amid a 14.4% average inflation in 1Q. The q-o-q drop of 13% was reasoned by lower personnel expenses and declining marketing and advisory costs.
In 1Q there was a provision release of HUF 1.0 billion equivalent mainly in the large corporate segment. The DPD90+ volumes (FX-adjusted and excluding the impact of loan sales and write-offs) increased by HUF 1.6 billion (versus HUF 1.3 billion decline for the entire 2017).
During the last twelve months HUF 65 billion equivalent of non-performing loans were sold or written off, of which HUF 2.5 billion were executed in 1Q 2018. As a result, the DPD90+ ratio dropped to 25.1% (-1.3 pps q-o-q, -16.1 pps y-o-y). The volume of Stage 3 loans amounted to HUF 116 billion at the end of 1Q (37.9% of total gross loans).
The FX-adjusted total performing loan book grew by 18% y-o-y and by 6% q-o-q. Within that especially the volume of retail loans grew dynamically (+26% y-o-y and +19% q-o-q). The outstanding increase of consumer exposures (+54% y-o-y and +9% q-o-q) were induced by credit card and POS volumes. For the latter new flows advanced by 50% y-o-y in UAH terms. Mortgage lending has not been resumed, thus the performing mortgage book eroded further (-20% y-o-y and -5% q-o-q). Car financing has been re-started in 1Q 2017 and the FX-adjusted volumes surged by 61% y-o-y. Performing corporate exposures grew by 1% q-o-q, however, the y-o-y increase was more significant (+12%). Alongside the steady disbursement activity in corporate segment, the leasing also demonstrates significant uptick.
Deposits (adjusted for the FX-effect) expended by 1% q-o-q and leaped by 17% y-o-y amid further declining offered deposit rates.
The Ukrainian subsidiary posted the highest ROE within subsidiary banks across the Group (ROE: 68.2%); all time high quarterly profit: HUF 5.8 billion
Outstanding 1Q earnings due to q-o-q moderating operating expenses and increasing total income; provision release also supported the quarterly profit
The DPD90+ ratio dropped a lot y-o-y partly as a result of write offs and sales
Performing loan volumes advanced by 18% y-o-y, whereas deposits increased by 17%, respectively (FX-adjusted)

SUMMARY OF THE FIRST QUARTER 2018 RESULTS
26/52
OTP BANK ROMANIA
Performance of OTP Bank Romania:
Main components of P&L account in HUF mn
1Q 2017 4Q 2017 1Q 2018 Q-o-Q Y-o-Y
After tax profit without the effect of adjustments 1,308 952 1,504 58% 15%Income tax -575 -138 -463 236% -19%Profit before income tax 1,883 1,090 1,967 80% 4%
Operating profit 2,949 941 1,894 101% -36%Total income 7,158 6,013 6,629 10% -7%
Net interest income 5,330 3,656 5,112 40% -4%Net fees and commissions 769 761 829 9% 8%Other net non-interest income 1,060 1,596 689 -57% -35%
Operating expenses -4,210 -5,072 -4,735 -7% 12%Total provisions -1,065 149 72 -51% -107%
Provision for possible loan losses -1,026 -58 -249 329% -76%Other provision -39 207 321 55% -918%
Main components of balance sheet closing balances in HUF mn
1Q 2017 4Q 2017 1Q 2018 Q-o-Q Y-o-Y
Total assets 588,209 624,060 646,378 4% 10%Gross customer loans 520,174 535,140 536,965 0% 3%Gross customer loans (FX-adjusted) 511,735 538,765 536,965 0% 5%
Retail loans 374,012 380,354 377,521 -1% 1%Corporate loans 137,723 158,411 159,444 1% 16%
Allowances for possible loan losses -75,287 -56,909 -59,672 5% -21%Allowances for possible loan losses (FX-adjusted) -71,895 -57,145 -59,672 4% -17%Deposits from customers 325,251 337,691 365,635 8% 12%Deposits from customer (FX-adjusted) 322,087 339,757 365,635 8% 14%
Retail deposits 241,340 254,970 264,727 4% 10%Corporate deposits 80,747 84,788 100,908 19% 25%
Liabilities to credit institutions 180,216 196,377 192,772 -2% 7%Total shareholders' equity 43,726 53,481 48,271 -10% 10%
Loan Quality 1Q 2017 4Q 2017 1Q 2018 Q-o-Q Y-o-Y Stage 3 loan volume under IFRS 9 (in HUF million) 0 0 83,940 0.00% 0.00%Stage 3 loans under IFRS 9/gross customer loans (%) 0.0% 0.0% 15.6% 0.0%p 0.0%pCost of risk/average gross loans (%) 0.8% 0.0% 0.2% 0.1%p -0.6%p90+ days past due loan volume (in HUF million) 91,925 72,133 61,263 -15.1% -33.4%90+ days past due loans/gross customer loans (%) 17.7% 13.5% 11.4% -2.1%p -6.3%pTotal provisions/90+ days past due loans (%) 81.9% 78.9% 97.4% 18.5%p 15.5%p
Performance Indicators 1Q 2017 4Q 2017 1Q 2018 Q-o-Q Y-o-Y ROA 0.9% 0.6% 1.0% 0.3%p 0.1%pROE 12.2% 8.1% 12.3% 4.3%p 0.1%pTotal income margin 4.93% 3.85% 4.22% 0.36%p -0.72%pNet interest margin 3.67% 2.34% 3.25% 0.91%p -0.42%pCost/income ratio 58.8% 84.4% 71.4% -12.9%p 12.6%pNet loans to deposits (FX-adjusted) 137% 142% 131% -11%p -6%p
FX rates (in HUF) 1Q 2017 4Q 2017 1Q 2018 Q-o-Q Y-o-Y HUF/RON (closing) 67.9 66.6 67.1 1% -1%HUF/RON (average) 68.4 67.5 66.8 -1% -2%

SUMMARY OF THE FIRST QUARTER 2018 RESULTS
27/52
In July 2017 OTP Bank Romania S.A., the Romanian subsidiary of OTP Bank signed an acquisition agreement on purchasing a 99.28% shareholding held in the Romanian Banca Romaneasca S.A. by National Bank of Greece S.A and certain other Romanian exposures held by different subsidiaries of National Bank of Greece S.A.
On 14 March 2018 the National Bank of Romania (NBR) notified the bank that it did not grant its approval for the acquisition; the Bank appealed against the decision.
Due to the non-fulfilment of the conditions precedents by the longstop date the share purchase agreement has been terminated. As a result, on 18 April 2018 OBR withdrew the appeal filed against NBR’s first instance decision, in which NBR did not grant its approval with respect to the transaction.
OTP Bank Romania posted HUF 1.5 billion net profit in 1Q 2018 exceeding the base period by 15% (+58% q-o-q).
Quarterly earning dynamics and profitability indicators were significantly distorted since in 4Q 2017 there were certain accounting corrections influencing several P&L lines: -HUF 2.0 billion appeared on the net interest income, +0.4 billion on the other income and +0.9 billion on the other risk costs line, respectively.
1Q operating profit dropped by 36% y-o-y as a result of lower total income (-7% y-o-y) and higher operating expenses (+12% y-o-y).
The net interest income eroded by 4% y-o-y. Higher interbank rates had negative impact on funding costs, however the bank managed to realize higher interest income, too. The 4Q accounting correction also had a negative impact on net interest margin. 1Q NIM (3.25%) dropped by 42 bps y-o-y.
Other net non-interest income declined by 35% y-o-y due to a base effect: in 1Q 2017 the bank booked a substantial income from property sale on that line.
Quarterly operating expenses grew by 12% y-o-y due to higher personal expenses (+13% y-o-y), and higher contributions paid to supervisory authorities.
On a quarterly base operating expenses moderated by 7%. Both personal expenses and amortization costs declined (-4% and -14% q-o-q, respectively), within administrative expenses marketing costs and expert fees came down, too.
On 1Q total risk costs line there was a HUF 0.1 billion provision release as a result of write backs on other risk cost line.
DPD90+ volumes (FX-adjusted, without sales and write-offs) decreased by HUF 3 billion in 1Q 2018, induced by lower non-performing mortgage and corporate exposures. During 1Q HUF 7 billion problem loans were sold/written off. The DPD90+ ratio declined to 11.4% (-6.3 pps y-o-y, -2.1 pps q-o-q). The volume of Stage 3 exposures amounted to HUF 84 billion at the end of 1Q (15.6% of total gross loans).
The FX-adjusted performing loan volumes increased by 12% y-o-y and by 2% q-o-q. Both the retail and corporate segment supported the expansion (+9% and +22% y-o-y, respectively). Within retail the consumer and SME segments were the key drivers of growth (+17% and 20% y-o-y, respectively), while mortgage volumes grew by 3%. As for new loan disbursements, in 1Q mortgages surged by 34% y-o-y, whereas the cash loan sales grew by 16% y-o-y.
FX-adjusted deposit volumes increased by 14% y-o-y and by 8% q-o-q. The growth was supported by retail and corporate inflows, too.
The Romanian subsidiary posted HUF 1.5 billion after tax profit in 1Q 2018 (+15% y-o-y) supported by provision release, too
Operating profit dropped by 36% y-o-y as a result of lower total income (-7% y-o-y) and higher operating expenses (+12% y-o-y)
The performing loan volumes increased by 12% y-o-y supported by robust consumer and SME lending dynamics

SUMMARY OF THE FIRST QUARTER 2018 RESULTS
28/52
OTP BANKA SRBIJA (SERBIA)
Performance of OTP banka Srbija (including Vojvodjanska banka):
Main components of P&L account in HUF mn
1Q 2017 4Q 2017 1Q 2018 Q-o-Q Y-o-Y
After tax profit without the effect of adjustments -6 -1,634 573 -135% Income tax 0 109 10 -91% -100%Profit before income tax -6 -1,744 563 -132%
Operating profit 136 604 909 51% 567%Total income 1,889 4,004 6,616 65% 250%
Net interest income 1,424 2,794 4,645 66% 226%Net fees and commissions 411 954 1,589 67% 286%Other net non-interest income 54 256 383 50% 611%
Operating expenses -1,753 -3,400 -5,707 68% 226%Total provisions -143 -2,348 -346 -85% 143%
Provision for possible loan losses -122 -2,297 -391 -83% 220%Other provision -20 -51 45 -190% -322%
Main components of balance sheet closing balances in HUF mn
1Q 2017 4Q 2017 1Q 2018 Q-o-Q Y-o-Y
Total assets 121,461 482,887 464,689 -4% 283%Gross customer loans 106,738 306,874 315,504 3% 196%Gross customer loans (FX-adjusted) 109,358 309,043 315,504 2% 189%
Retail loans 49,862 156,967 163,522 4% 228%Corporate loans 59,496 152,076 151,982 0% 155%
Allowances for possible loan losses -24,797 -19,759 -25,266 28% 2%Allowances for possible loan losses (FX-adjusted) -25,968 -19,905 -25,266 27% -3%Deposits from customers 72,998 349,553 338,223 -3% 363%Deposits from customer (FX-adjusted) 74,992 351,976 338,223 -4% 351%
Retail deposits 49,700 240,360 240,662 0% 384%Corporate deposits 25,292 111,616 97,561 -13% 286%
Liabilities to credit institutions 13,373 38,397 35,308 -8% 164%Subordinated debt 2,491 2,505 2,525 1% 1%Total shareholders' equity 28,451 80,070 75,561 -6% 166%
Loan Quality 1Q 2017 4Q 2017 1Q 2018 Q-o-Q Y-o-Y Stage 3 loan volume under IFRS 9 (in HUF million) 0 0 32,335 0.00% 0.00%Stage 3 loans under IFRS 9/gross customer loans (%) 0.00% 0.00% 10.2% 0.00%p 0.00%pCost of risk/average gross loans (%) 0.5% 6.3% 0.5% -5.8%p 0.0%pCost of risk/average (FX-adjusted) gross loans (%) 0.5% 6.3% 0.5% -5.8%p 0.0%p90+ days past due loan volume (in HUF million) 33,496 28,372 29,210 3.0% -12.8%90+ days past due loans/gross customer loans (%) 31.4% 9.2% 9.3% 0.0%p -22.1%pTotal provisions/90+ days past due loans (%) 74.0% 69.6% 86.5% 16.9%p 12.5%p
Performance Indicators 1Q 2017 4Q 2017 1Q 2018 Q-o-Q Y-o-Y ROA 0.0% -3.3% 0.5% 3.7%p 0.5%pROE -0.1% -17.5% 3.1% 20.6%p 3.2%pTotal income margin 6.30% 7.97% 5.74% -2.22%p -0.56%pNet interest margin 4.75% 5.56% 4.03% -1.53%p -0.72%pCost/income ratio 92.8% 84.9% 86.3% 1.3%p -6.5%pNet loans to deposits (FX-adjusted) 111% 82% 86% 4%p -25%p
FX rates (in HUF) 1Q 2017 4Q 2017 1Q 2018 Q-o-Q Y-o-Y HUF/RSD (closing) 2.5 2.6 2.6 1% 6%HUF/RSD (average) 2.5 2.6 2.6 0% 5%

SUMMARY OF THE FIRST QUARTER 2018 RESULTS
29/52
Based on the acquisition agreement signed on 4 August 2017 by OTP banka Srbija a.d. Novi Sad, the Serbian subsidiary of OTP Bank and the Group of National Bank of Greece (“NBG”) on purchasing 100% shareholding held in the Serbian Vojvodjanska banka a.d. („VOBAN”) and NBG Leasing d.o.o. and certain other Serbian exposures held by the Group of the National Bank of Greece S.A. the financial closure of the transaction has been completed on 1 December 2017 and Vojvodjanska banka was consolidated.
The Serbian P&L account was adjusted for the one-off items directly related to the acquisition; these corrections are shown on consolidated level among the adjustment items. The balance sheet items were not adjusted for the acquisition effect.
The Serbian operation (including Vojvodjanska banka) posted HUF 0.6 billion profit after tax in 1Q 2018 versus a loss of HUF 6 million in the base period. Out of the quarterly profit Vojvodjanska banka added HUF 0.5 billion to the Serbian after tax profit.
The q-o-q developments on P&L lines were distorted by the consolidation of Vojvodjanska banka: in 4Q 2017 only one month contribution was booked, whereas in 1Q a full quarter performance was consolidated within the results.
The 1Q operating profit was HUF 0.9 billion of which the contribution of Vojvodjanska banka comprised HUF 0.6 billion. Withint that it brought in HUF 3.1 billion in net interest income, HUF 1.1 billion in net fees and commissions and HUF 0.2 billion other income, respectively. The operating costs reached -HUF 3.8 billion, while the total risk cost amounted to -HUF 0.1 billion.
The 1Q net interest margin (4.03%) of the Serbian operation dropped by 153 bps q-o-q and it was partly the result of technical factors through the consolidation of Vojvodjanska banka3.
The 1Q operating profit of the Serbian operation grew almost seven fold y-o-y, within that net interest income increased more than three times y-o-y, while net fees and commissions grew by nearly four times. Without the effect of Vojvodjanska acquisition the operating profit more than doubled, total income grew by 17% and operating expense by 8% y-o-y, respectively.
1Q total risk costs comprised -HUF 0.3 billion, all related to lending; on other risk cost there was a marginal provision release.
The DPD90+ loan portfolio (FX-adjusted, without sales and write-offs) practically remained unchanged in 1Q 2018. In 1Q there were no substantial non-performing portfolio sales or writte-offs either. The DPD90+ ratio stood at 9.3% at the end of 1Q 2018, no change q-o-q. The volume of Stage 3 exposure amounted to HUF 32 billion at the end of 1Q (10.2% of total gross loans).
Loan volume trends y-o-y were mainly shaped by the consolidation of Vojvodjanska banka. The performing (DPD0-90) loan portfolio was consolidated on a gross base, whereas the DPD90+ volumes were consolidated net of provisions, i.e. adjusted for provisions already set aside at the time of consolidation. Gross loan volumes (FX-adjusted) expanded almost three times y-o-y, while the performing portfolio nearly quadrupled. The quarterly growth was 2% both for the gross and performing loan volumes. Latter was supported by the retail segment: the performing book advanced by 4% q-o-q, whereas the consumer exposure increased by 5% q-o-q, respectively.
Out of new disbursement, cash loans grew by 9% q-o-q while mortgages demonstrated strong y-o-y dynamism (+134%).
The FX-adjusted deposit base expanded four and a half times y-o-y, but eroded by 4% q-o-q mainly as a result of corporate outflows.The net loan-to-deposit ratio increased by 4%-points q-o-q to 86%.
3 The 4Q 2017 Serbian margin was upwardly biased by the fact that practically the full December net interest income of Vojvodjanska banka was consolidated, but according to the performance indicator calculation methodology, the total assets of Vojvodjanska banka (which influences the denominator of net interest margin) was counted in only from the end of December.
The Serbian operation posted HUF 0.6 billion profit in 1Q 2018 of which Vojvodjanska banka’s contribution was HUF 0.5 billion
Operating profit surged by almost seven fold y-o-y, three-quarter of which came from Vojvodjanska banka
Performing loan volumes further increased (+2% q-o-q) supported by the retail sector

SUMMARY OF THE FIRST QUARTER 2018 RESULTS
30/52
OTP BANKA SLOVENSKO (SLOVAKIA)
Performance of OTP Banka Slovensko*:
Main components of P&L account in HUF mn
1Q 2017 4Q 2017 1Q 2018 Q-o-Q Y-o-Y
After tax profit without the effect of adjustments 90 -1,469 770 -152% 756%Income tax -50 -128 -196 53% 296%Profit before income tax 140 -1,341 967 -172% 592%
Operating profit 1,801 1,402 754 -46% -58%Total income 4,437 4,345 3,644 -16% -18%
Net interest income 3,412 3,314 2,785 -16% -18%Net fees and commissions 933 916 794 -13% -15%Other net non-interest income 92 115 65 -43% -30%
Operating expenses -2,636 -2,942 -2,890 -2% 10%Total provisions -1,661 -2,743 213 -108% -113%
Provision for possible loan losses -1,636 -2,701 134 -105% -108%Other provision -26 -42 78 -287% -405%
Main components of balance sheet closing balances in HUF mn
1Q 2017 4Q 2017 1Q 2018 Q-o-Q Y-o-Y
Total assets 444,108 452,084 437,645 -3% -1%Gross customer loans 384,442 382,932 384,941 1% 0%Gross customer loans (FX-adjusted) 389,235 385,907 384,941 0% -1%
Retail loans 329,033 333,463 335,172 1% 2%Corporate loans 60,151 52,414 49,743 -5% -17%
Allowances for possible loan losses -32,481 -28,098 -35,614 27% 10%Allowances for possible loan losses (FX-adjusted) -32,886 -28,316 -35,614 26% 8%Deposits from customers 353,455 343,924 349,249 2% -1%Deposits from customer (FX-adjusted) 357,213 346,488 349,249 1% -2%
Retail deposits 331,030 321,361 322,176 0% -3%Corporate deposits 26,183 25,126 27,074 8% 3%
Liabilities to credit institutions 8,432 10,020 10,054 0% 19%Subordinated debt 6,178 6,205 6,254 1% 1%Total shareholders' equity 27,126 32,200 25,066 -22% -8%
Loan Quality 1Q 2017 4Q 2017 1Q 2018 Q-o-Q Y-o-Y Stage 3 loan volume under IFRS 9 (in HUF million) 43,994 Stage 3 loans under IFRS 9/gross customer loans (%) 11.4% Cost of risk/average gross loans (%) 1.72% 2.76% -0.14% -2.91%p -1.86%p90+ days past due loan volume (in HUF million) 44,990 35,968 36,314 1% -19%90+ days past due loans/gross customer loans (%) 11.7% 9.4% 9.4% 0.0%p -2.3%pTotal provisions/90+ days past due loans (%) 72.2% 78.1% 98.1% 20.0%p 25.9%p
Performance Indicators (%) 1Q 2017 4Q 2017 1Q 2018 Q-o-Q Y-o-Y ROA 0.1% -1.3% 0.7% 2.0%p 0.6%pROE 1.3% -21.2% 12.1% 33.3%p 10.8%pTotal income margin 4.01% 3.80% 3.34% -0.46% -0.67%Net interest margin 3.08% 2.90% 2.55% -0.34% -0.53%Cost/income ratio 59.4% 67.7% 79.3% 11.6%p 19.9%pNet loans to deposits (FX-adjusted) 100% 103% 100% -3%p 0%p
FX rates (in HUF) 1Q 2017 4Q 2017 1Q 2018 Q-o-Q Y-o-Y HUF/EUR (closing) 308.7 310.1 312.6 1% 1%HUF/EUR (average) 309.2 311.6 311.1 0% 1%
* P&L account lines and indicators are adjusted for banking tax and Deposit Protection Fund contributions

SUMMARY OF THE FIRST QUARTER 2018 RESULTS
31/52
OTP Banka Slovensko posted HUF 770 million adjusted after tax profit in 1Q 2018 against a loss of HUF 1.5 billion in the base period. The quarterly performance was partly shaped by technical changes, as a result the operating profit dropped by 46%, at the same time there was a provision release.
1Q net interest income declined by 16% q-o-q (-18% y-o-y). The quarterly decline to a greater extent was due to a methodology change (at the same time risk costs also came down), but decrasing margins took their toll, too.
1Q net fee and commission income decreased by 13% q-o-q partly due to seasonality. Also, effective from January 2018 monitoring fees were accrued for 12 months, whereas contract modification fees for the whole maturity of the loan, respectively.
Operating expenses decreased by 2% q-o-q attributable to the seasonality of administrative costs (within that IT and marketing, as well as training expenses declined).
On the total risk cost line there was a HUF 0.2 billion release. The FX-adjusted DPD90+ loan growth (without the effect of sales and write-offs) against the quarterly average of HUF 1.3 billion deterioration for the last 5 quarters. The DPD90+ ratio remained unchanged q-o-q (9.4%) (-2.3 pps y-o-y). In 1Q 2018 around HUF 0.1 billion equivalent non-performing loans were sold or written off. The volume of Stage 3 exposure amounted to HUF 44 billion at the end of 1Q (11.4% of the gross loan book).
The FX-adjusted gross loan book shrank by 1% y-o-y, while the performing loan book expanded by 1.4%. The latter can be explained by 8% higher mortgage volumes; FX-adjusted corporate loan volumes declined by 16% y-o-y. In 1Q 2018 the newly disbursed cash loan volumes advanced by 28% y-o-y; new mortgage originations remained stable y-o-y.
The FX-adjusted deposit volumes eroded by 2% y-o-y, but increased by 2% q-o-q. The latter was driven by the 8% expansion of corporate volumes comprising 7% of the total deposit book; retail volumes remained flat.
1Q adjusted after tax profit of HUF 770 million as a result of risk cost release and deteriorating operating profit
Further improving DPD90+ ratio (1Q: 11.7%, -2.3 pps y-o-y)
FX-adjusted performing loan book grew by 1.4% y-o-y

SUMMARY OF THE FIRST QUARTER 2018 RESULTS
32/52
CRNOGORSKA KOMERCIJALNA BANKA (MONTENEGRO)
Performance of CKB:
Main components of P&L account in HUF mn
1Q 2017 4Q 2017 1Q 2018 Q-o-Q Y-o-Y
After tax profit w/o dividends and net cash transfer 82 -819 688 -184% 737%Income tax 0 -11 -85 672% -100%Profit before income tax 82 -808 773 -196% 840%
Operating profit 524 319 406 27% -23%Total income 2,278 3,008 2,374 -21% 4%
Net interest income 1,623 1,664 1,717 3% 6%Net fees and commissions 531 1,381 638 -54% 20%Other net non-interest income 124 -37 19 -151% -85%
Operating expenses -1,754 -2,689 -1,968 -27% 12%Total provisions -442 -1,127 367 -133% -183%
Provision for possible loan losses -192 -703 272 -139% -242%Other provision -250 -425 94 -122% -138%
Main components of balance sheet closing balances in HUF mn
1Q 2017 4Q 2017 1Q 2018 Q-o-Q Y-o-Y
Total assets 185,478 197,590 191,162 -3% 3%Gross customer loans 137,644 138,485 139,898 1% 2%Gross customer loans (FX-adjusted) 139,361 139,561 139,898 0% 0%
Retail loans 72,115 73,554 73,301 0% 2%Corporate loans 67,245 66,008 66,598 1% -1%
Allowances for possible loan losses -52,454 -38,899 -39,651 2% -24%Allowances for possible loan losses (FX-adjusted) -53,108 -39,201 -39,651 1% -25%Deposits from customers 138,878 152,316 147,270 -3% 6%Deposits from customer (FX-adjusted) 139,553 153,290 147,270 -4% 6%
Retail deposits 109,066 117,230 114,303 -2% 5%Corporate deposits 30,487 36,059 32,968 -9% 8%
Liabilities to credit institutions 19,181 17,962 17,981 0% -6%Subordinated debt 0 0 0 -100% -100%Total shareholders' equity 21,143 21,127 19,795 -6% -6%
Loan Quality 1Q 2017 4Q 2017 1Q 2018 Q-o-Q Y-o-Y Stage 3 loan volume under IFRS 9 (in HUF million) 0 0 49,005 0.00% 0.00%Stage 3 loans under IFRS 9/gross customer loans (%) 0.0% 0.0% 35.0% 0.0%p 0.0%pCost of risk/average gross loans (%) 0.6% 2.1% -0.8% -2.8%p -1.3%pCost of risk/average (FX-adjusted) gross loans (%) 0.6% 2.0% -0.8% -2.8%p -1.3%p90+ days past due loan volume (in HUF million) 54,256 43,395 41,880 -3.5% -22.8%90+ days past due loans/gross customer loans (%) 39.42% 31.34% 29.94% -1.4%p -9.5%pTotal provisions/90+ days past due loans (%) 96.7% 89.6% 94.7% 5.0%p -2.0%p
Performance Indicators 1Q 2017 4Q 2017 1Q 2018 Q-o-Q Y-o-Y ROA 0.2% -1.6% 1.4% 3.1%p 1.3%pROE 1.6% -14.9% 14.2% 29.1%p 12.6%pTotal income margin 4.84% 5.92% 4.96% -0.95%p 0.12%pNet interest margin 3.45% 3.27% 3.59% 0.32%p 0.14%pCost/income ratio 77.0% 89.4% 82.9% -6.5%p 5.9%pNet loans to deposits (FX-adjusted) 62% 65% 68% 3%p 6%p
FX rates (in HUF) 1Q 2017 4Q 2017 1Q 2018 Q-o-Q Y-o-Y HUF/EUR (closing) 308.7 310.1 312.6 1% 1%HUF/EUR (average) 309.2 311.6 311.1 0% 1%

SUMMARY OF THE FIRST QUARTER 2018 RESULTS
33/52
The Montenegrin CKB Bank posted HUF 0.7 billion profit in 1Q 2018. The better quarterly result versus the base period was due mainly to a provision release in 1Q 2018.
The 1Q operating profit declined by 23% y-o-y: the higher total income (+4% y-o-y) could not offset the increase in operating expenses (12% y-o-y). The net interest income improved by 6% y-o-y. The quarterly increase (+3%) is due to a methodology change: certain lending-related income previously booked within net fees and commissions was shifted into NII since January 2018.
The q-o-q 54% drop in net fee and commission is reasoned by methodology change: effective from 4Q 2017 the contribution paid into the deposit insurance scheme and booked earlier within net fees and commissions was shifted into the operating cost line in a lump sum for the whole year (HUF 0.7 billion). The y-o-y 20% surge in net fees and commissions was reasoned also by that reclassification.
Other net non-interest income declined by HUF 0.1 billion y-o-y.
Operating expenses increased by 12% y-o-y as a result of higher fees paid to regulatory authorities reflecting the reclassification of the contribution paid into the deposit insurance scheme.
The total risk cost represented +HUF 0.4 billion in 1Q. There were provision releases both on lending related risk cost line and other risk cost lines.
The DPD90+ loan volume (FX-adjusted, without sales and write offs) decreased by HUF 0.4 billion in 1Q. During the first three months of 2018 HUF 1.3 billion non-performing loans were sold/written off. The DPD90+ ratio (29.9%) improved further by 9.5 pps y-o-y (-1.4 pps q-o-q). The volume of Stage 3 exposures amounted to HUF 49 billion at the end of 1Q (35.0% of total gross loans)
The FX-adjusted performing loan portfolio increased by 16% y-o-y and by 2% q-o-q. The strong yearly increase was mainly due to the remarkable growth of corporate exposures (+37% y-o-y). The retail portfolio increased less dynamically (+6% y-o-y): the mortgage loans advanced by 8% y-o-y, the consumer portfolio by 3%, whereas the SME exposure by 9% y-o-y, respectively.
The FX-adjusted deposit portfolio grew by 6% y-o-y, but eroded by 4% q-o-q. As a result, the net loan-to-deposit ratio changed to 68%.
In 1Q CKB posted HUF 0.7 billion net profit which translates into 14.2% ROE
Operating profit dropped by 23% y-o-y as a result of higher total income (+4% y/y) and higher operating expenses (+12% y/y); moreover there was a provision release in 1Q
The y/y 16% surge in performing loan volumes was mainly induced by higher corporate exposures

SUMMARY OF THE FIRST QUARTER 2018 RESULTS
34/52
STAFF LEVEL AND OTHER INFORMATION
31/12/2017 31/03/2018
Branches ATM POS
Headcount (closing)
Branches ATM POS Headcount (closing)
OTP Core 362 1,945 70,002 9,049 361 1,923 70,348 9,261 DSK Group 367 890 7,005 4,872 366 899 7,486 4,868OTP Bank Russia (w/o employed agents)
134 230 1,079 4,956 134 230 1,033 4,946
Touch Bank (Russia) 0 0 0 356 0 0 0 351OTP Bank Ukraine (w/o employed agents)
85 115 382 2,224 85 140 386 2,205
OTP Bank Romania 96 139 4,351 1,163 96 137 4,320 1,188OTP banka Hrvatska (including Splitska banka)
196 528 10,765 2,430 191 535 10,872 2,419
OTP Banka Slovenko 62 148 276 674 62 146 274 686OTP banka Srbija (including Vojvodjanska banka)
157 254 5,098 2,103 157 255 5,224 2,026
CKB 29 91 4,070 429 29 89 4,185 419Foreign subsidiaries, total 1,126 2,395 33,026 19,206 1,120 2,431 33,780 19,107Other Hungarian and foreign subsidiaries
860 849
OTP Group (w/o employed agents) 29,116 29,217OTP Bank Russia - employed agents 5,771 5,439OTP Bank Ukraine - employed agents 747 653
OTP Group (aggregated) 1,488 4,340 103,028 35,633 1,481 4,354 104,128 35,309
PERSONAL AND ORGANIZATIONAL CHANGES
In the first quarter of 2018 there was no change in the composition of the Board of Directors, the Supervisory Board, the Audit Committee and the Auditor of the Bank.

SUMMARY OF THE FIRST QUARTER 2018 RESULTS
35/52
FINANCIAL DATA

SUMMARY OF THE FIRST QUARTER 2018 RESULTS
36/52
SEPARATE AND CONSOLIDATED IFRS STATEMENT OF FINANCIAL POSITION
in HUF million OTP Bank Consolidated
31/03/2018 31/03/2017 change 31/03/2018 31/03/2017 changeCash, due from banks and balances with the National Banks
496,123 637,013 -22% 1,264,606 1,351,267 -6%
Placements with other banks, net of allowance for possible placement losses
1,043,732 774,590 35% 460,641 347,441 33%
Financial assets at fair value through profit or loss
270,317 179,467 51% 307,136 210,599 46%
Non-trading securities mandatorily at fair value through profit or loss
0 0 541 0 0
Securities available-for-sale (at fair value through OCI)
1,668,984 1,672,719 0% 2,104,417 1,669,298 26%
Loans, net of allowance for loan losses 2,197,801 1,968,949 12% 7,102,159 5,778,811 23%Shares and equity investments 967,967 682,140 42% 16,913 10,041 68%Securities held-to-maturity (at amortized cost) 1,273,861 951,078 34% 1,537,619 1,218,822 26%Tangible and intangible assets 99,119 90,238 10% 410,638 360,314 14%Other assets 159,162 229,763 -31% 306,510 349,161 -12%
TOTAL ASSETS 8,177,067 7,185,957 14% 13,511,182 11,295,754 20%Liabilities to credit institution and to the National Bank of Hungary
798,360 644,649 24% 537,682 491,895 9%
Deposits from customers 5,379,953 4,693,061 15% 10,385,228 8,441,077 23%Liabilities from issued securities 54,614 83,718 -35% 258,602 263,629 -2%Fair value adjustment of derivative financial instruments held for trade
67,594 74,873 -10% 59,113 62,786 -6%
Other liabilities 332,996 326,982 2% 602,844 523,571 15%Subordinated bonds and loans 108,314 109,156 -1% 75,266 76,565 -2%
TOTAL LIABILITIES 6,741,830 5,932,439 14% 11,918,734 9,859,523 21%Share capital 28,000 28,000 0% 28,000 28,000 0%Retained earnings and other reserves without earnings
1,335,284 1,144,969 17% 1,559,349 1,412,180 10%
Profit or loss for the financial year according to the balance sheet
81,450 89,393 -9% 64,971 52,798 23%
Treasury shares -9,496 -8,844 7% -63,245 -60,257 5%Non-controlling interest 0 0 3,374 3,510 -4%
TOTAL SHAREHOLDERS' EQUITY 1,435,237 1,253,517 14% 1,592,448 1,436,232 11%TOTAL LIABILTITIES AND SHAREHOLDERS' EQUITY
8,177,067 7,185,957 14% 13,511,182 11,295,754 20%

SUMMARY OF THE FIRST QUARTER 2018 RESULTS
37/52
SEPARATE AND CONSOLIDATED IFRS STATEMENT OF RECOGNIZED INCOME
in HUF million OTP Bank Consolidated
1Q 2018 1Q 2017 change 1Q 2018 1Q 2017 change Loans 33,485 29,377 14% 137,685 126,837 9%Placements with other banks 17,083 14,912 15% 17,653 11,830 49%Interest income due from banks and balances with the National Bank of Hungary
118 780 -85% 169 796 -79%
Securities held for trading 0 0 30 0 Securities available-for-sale 7,431 7,715 -4% 9,042 8,011 13%Securities held-to-maturity 11,431 11,162 2% 14,258 14,367 -1%Non-trading financial assets mandatorily at fair value through profit or loss
0 0 1 0
Interest expense on assets (negative interest income)
0 0 -118 0
Other interest income 0 0 2,701 1,965 37%Interest income 69,548 63,944 9% 181,420 163,807 11%
Interest expense due to banks and on deposits from the National Banks
-16,988 -15,136 12% -14,807 -10,906 36%
Deposits from customers -6,655 -3,840 73% -17,928 -14,647 22%From issued securities 17 -117 -115% -1,268 -991 28%Subordinated an supplementary bonds and loans
-732 -797 -8% -538 -601 -10%
Interest income on liabilities (negative interest expense)
0 0 36 0
Other interest expense 0 0 -1,912 -1,582 21%Interest expense -24,357 -19,890 22% -36,417 -28,726 27%
Net interest income 45,190 44,055 3% 145,004 135,080 7%Provisions for loans -4,046 -915 342% -3,430 -11,765 -71%Provisions on placements 182 1 -52 29 -282%
Provision for loans and on placements -3,864 -915 323% -3,482 -11,737 -70%NET INTEREST INCOME AFTER PROVISIONS
41,326 43,140 -4% 141,522 123,343 15%
Income from fees and commissions 49,640 48,356 3% 78,103 70,168 11%Expense from fees and commissions -8,054 -6,776 19% -13,644 -11,597 18%
NET PROFIT FROM FEES AND COMMISSIONS
41,586 41,580 0% 64,459 58,572 10%
Foreign exchange gains and losses 1,413 1,578 -10% 3,460 2,913 19%Gains and losses on securities 1,158 863 34% -1,066 1,677 -164%Gains and losses on non-trading loans mandatorily at fair value through profit or loss
-220 0 -127 0
Gains on real estate transactions 54 56 -3% 574 897 -36%Dividend income and gains and losses on associated companies
70,459 77,378 -9% -99 171 -158%
Insurance premiums 0 0 200 0 Gains and losses on derivative instruments
1,075 604 78% 976 -263 -471%
Other operating income 849 2,103 -60% 9,595 5,622 71%Other operating expense -6,274 -3,833 64% -5,131 -3,667 40%
NET OPERATING RESULT 68,514 78,749 -13% 8,382 7,350 14%Personnel expenses -23,046 -21,699 6% -57,813 -49,560 17%Depreciation -5,041 -4,501 12% -12,244 -9,722 26%Other administrative expenses -39,121 -44,928 -13% -68,789 -69,598 -1%
OTHER ADMINISTRATIVE EXPENSES -67,208 -71,128 -6% -138,846 -128,881 8%PROFIT BEFORE INCOME TAX 84,218 92,341 -9% 75,517 60,384 25%Income tax -2,769 -2,948 -6% -10,467 -7,525 39%
NET PROFIT FOR THE PERIODS 81,450 89,393 -9% 65,050 52,859 23%From this, attributable to non-controlling interest 0 0 -79 -61 29%
NET PROFIT FOR THE PERIODS ATTRIBUTABLE OWNERS OF THE COMPANY
81,450 89,393 -9% 64,971 52,798 23%

SUMMARY OF THE FIRST QUARTER 2018 RESULTS
38/52
SEPARATE AND CONSOLIDATED IFRS STATEMENT OF CASH FLOWS
in HUF million OTP Bank Consolidated
31/03/2018 31/03/2017 change 31/03/2018 31/03/2017 changeOPERATING ACTIVITIES Profit before income tax 84,219 92,341 -9% 75,517 60,384 25%Adjustments to reconcile income before income taxes to net cash provided by operating activities
Income tax paid 0 0 -5,837 -3,425 70%Depreciation and amortization 5,030 4,501 12% 12,244 9,722 26%Provision for impairment / Release of provision 4,116 3,857 7% 2,005 13,029 -85%Share-based payment 868 843 3% 868 843 3%Unrealized gains / losses on fair value change of securities at fair value through other comprehensive income and fair value through profit or loss
4,579 4,232 8% 4,579 4,232 8%
Unrealized losses on fair value adjustment of derivative financial instruments
0 -4,607 -100% -4,496 13,519 -133%
Changes in operating assets and liabilities 115,611 -234,075 -149% 75,828 -240,048 -132%Net cash provided by operating activities 214,424 -132,908 -261% 160,708 -141,744 -213%INVESTING ACTIVITIES Net cash used in investing activities -216,409 -124,663 74% -178,735 -242,734 -26%FINANCING ACTIVITIES Net cash used in financing activities 96,537 -34,272 -382% 15,148 73,636 -79%Net increase in cash and cash equivalents 94,552 -291,843 -2,879 -310,842 -99%Cash and cash equivalents at the beginning of the period 347,854 880,266 -60% 800,689 1,128,610 -29%Cash and cash equivalents at the end of the period 442,406 588,423 -25% 797,810 817,768 -2%

SUMMARY OF THE FIRST QUARTER 2018 RESULTS
39/52
STATEMENT OF CHANGES IN CONSOLIDATED SHAREHOLDERS’ EQUITY (IFRS)
in HUF million Share capitalCapital reserve
Share based payment reserve
Retained earnings and
reserves
Put option reserves
Treasury shares
Non-controlling interest
Total
Balance as at 1 January 2017 28,000 52 28,237 1,476,657 -55,468 -60,121 3,292 1,420,649 0 0 0 0 0 0 0 0
Net profit for the year -- -- -- 52,798 0 -- 61 52,859 Other comprehensive income 0 0 0 16,092 0 0 157 16,249 Share-based payment -- -- 843 0 0 -- -- 843 Treasury shares 0 0 0 0 0 0 0 0 Dividend for the year 2016 -- -- -- -53,200 0 -- -- -53,200 Put option 0 0 0 0 0 0 0 0 Treasury shares 0 0 0 0 0 0 0 0 – sale 0 0 0 0 0 4 0 4 – loss on sale 0 0 0 -6 0 0 0 -6 – volume change 0 0 0 0 0 -139 0 -139 Payment to ICES holders 0 0 0 -1,028 0 0 0 -1,028 0 0 0 0 0 0 0 0 Balance as at 31 March 2017 28,000 52 29,080 1,491,313 -55,468 -60,256 3,510 1,436,231
in HUF million Share capitalCapital reserve
Share based payment reserve
Retained earnings and
reserves
Put option reserves
Treasury shares
Non-controlling interest
Total
Balance as at 31 December 2017 28,000 52 31,835 1,695,460 -55,468 -63,289 3,465 1,640,055 0 0 0 0 0 0 0 0 Modification due to the initial application of IFRS9 0 0 0 -50,401 0 0 -127 -50,528 0 0 0 0 0 0 0 0 Balance as at 1 January 2018 28,000 52 31,835 1,645,059 -55,468 -63,289 3,338 1,589,527
0 0 0 0 0 0 0 0 Net profit for the year 0 0 0 64,971 0 0 78 65,049 Other comprehensive income 0 0 0 -609 0 0 -42 -651 Share-based payment 0 0 868 0 0 0 0 868 Treasury shares 0 0 0 0 0 0 0 0 Dividend for the year 2017 0 0 0 -61,320 0 0 0 -61,320 Put option 0 0 0 0 0 0 0 0 Treasury shares 0 0 0 0 0 0 0 0 – sale 0 0 0 0 0 44 0 44 – loss on sale 0 0 0 -21 0 0 0 -21 – volume change 0 0 0 0 0 0 0 0 Payment to ICES holders 0 0 0 -1,049 0 0 0 -1,049 0 0 0 0 0 0 0 0 Balance as at 31 March 2018 28,000 52 32,703 1,647,031 -55,468 -63,245 3,374 1,592,447

SUMMARY OF THE FIRST QUARTER 2018 RESULTS
40/52
CONSOLIDATED SUBSIDIARIES AND ASSOCIATES
Name Initial capital/Equity
(HUF)
Ownership Directly
+ indirectly
(%)
Voting rights (%)
Classification1
1. Air-Invest Asset Management LLC. 400,000,000 100.00 100.00 L 2. Artemis LLC. 28,000,000 100.00 100.00 L 3. Bajor-Polár Center Real Estate Management LLC. 30,000,000 100.00 100.00 L 4. Bank Center No. 1. Ltd. 11,500,000,000 100.00 100.00 L 5. CIL Babér Ltd. 3,000,000 100.00 100.00 L 6. CRESCO d.o.o. HRK 39,000 100.00 100.00 L 7. Crnogorska Komercijalna Banka a.d. EUR 136,875,398 100.00 100.00 L 8. DSK Asset Management EAD BGN 1,000,000 100.00 100.00 L 9. DSK Auto Leasing EOOD BGN 1,000,000 100.00 100.00 L
10. DSK Bank EAD BGN 153,984,000 100.00 100.00 L 11. DSK Leasing AD BGN 3,334,000 100.00 100.00 L 12. DSK Leasing Insurance Broker EOOD BGN 5,000 100.00 100.00 L 13. DSK Mobile EAD BGN 250,000 100.00 100.00 L 14. DSK Operating lease EOOD BGN 1,000 100.00 100.00 L 15. DSK Tours EOOD BGN 8,491,000 100.00 100.00 L 16. DSK Trans Security EAD BGN 2,225,000 100.00 100.00 L 17. INGA KETTŐ Ltd. 8,000,000,000 100.00 100.00 L 18. Jet-Sol Ltd. 8,000,000 100.00 100.00 L 19. JN Parkolóház LLC. 4,800,000 100.00 100.00 L 20. LLC AMC OTP Capital UAH 10,000,000 100.00 100.00 L 21. LLC MFO "OTP Finance" RUB 3,933,000,000 100.00 100.00 L 22. LLC OTP Leasing UAH 45,495,340 100.00 100.00 L 23. Merkantil Bank Ltd. 2,000,000,000 100.00 100.00 L 24. Merkantil Rent Ltd. 6,000,000 100.00 100.00 L 25. Merkantil Car Ltd. 50,000,000 100.00 100.00 L
26. Merkantil Property Leasing Private Limited by Shares
50,000,000 100.00 100.00 L
27. Miskolci Diákotthon Investment, Utilization LLC. 5,000,000 100.00 100.00 L 28. MONICOMP Ltd. 20,000,000 100.00 100.00 L 29. NIMO 2002 Trading and Service LLC. 1,156,000,000 100.00 100.00 L 30. OTP Fund Management Ltd. 900,000,000 100.00 100.00 L 31. OTP Asset Management SAI S.A. RON 5,795,323 100.00 100.00 L 32. OTP Aventin d.o.o. HRK 40,000 100.00 100.00 L 33. OTP Bank JSC (Ukraine) UAH 6,186,023,111 100.00 100.00 L 34. OTP Bank Romania S.A. RON 1,379,252,880 100.00 100.00 L 35. OTP banka Hrvatska d.d. HRK 3,993,754,800 100.00 100.00 L 36. OTP Buildings s.r.o. EUR 18,717,301 100.00 100.00 L 37. OTP eBiz Ltd. 230,000,000 100.00 100.00 L 38. OTP Life Annuity Ltd. 2,000,000,000 100.00 100.00 L 39. OTP Factoring Bulgaria EAD BGN 1,000,000 100.00 100.00 L 40. OTP Factoring Montenegro d.o.o. EUR 1 100.00 100.00 L 41. OTP Factoring Serbia d.o.o. RSD 532,902,282 100.00 100.00 L 42. OTP Factoring Slovensko s.r.o. EUR 5,000 100.00 100.00 L 43. OTP Factoring SRL RON 500,400 100.00 100.00 L 44. OTP Factoring Ukraine LLC UAH 6,067,380,554 100.00 100.00 L 45. OTP Factoring Ltd. 500,000,000 100.00 100.00 L 46. OTP Faktoring Vagyonkezelő LLC. 3,000,000 100.00 100.00 L 47. OTP Financing Cyprus Company Limited EUR 1,001,000 100.00 100.00 L 48. OTP Financing Malta Ltd. EUR 105,000,000 100.00 100.00 L 49. OTP Financing Netherlands B.V. EUR 18,000 100.00 100.00 L 50. OTP Financing Solutions B.V. EUR 18,000 100.00 100.00 L 51. OTP Holding Ltd. EUR 131,000 100.00 100.00 L 52. OTP Holding Malta Ltd. EUR 104,950,000 100.00 100.00 L 53. OTP Hungaro-Projekt Ltd. 250,000,000 100.00 100.00 L
54. OTP Real Estate Investment Fund Management Ltd.
100,000,000 100.00 100.00 L
55. OTP Real Estate Ltd. 1,000,000,000 100.00 100.00 L 56. OTP Ingatlankezelő LLC. 50,000,000 100.00 100.00 L 57. OTP Real Estate Leasing Ltd. 214,000,000 100.00 100.00 L 58. OTP Ingatlanpont LLC. 6,000,000 100.00 100.00 L 59. OTP Facility Management LLC. 30,000,000 100.00 100.00 L 60. OTP Invest d.o.o. HRK 12,979,900 100.00 100.00 L 61. OTP Investments d.o.o. Novi Sad RSD 203,783,061 100.00 100.00 L 62. OTP Mortgage Bank Ltd. 27,000,000,000 100.00 100.00 L 63. OTP Card Factory Ltd. 450,000,000 100.00 100.00 L 64. OTP Building Society Ltd. 2,000,000,000 100.00 100.00 L 65. OTP Leasing d.d. HRK 8,212,000 100.00 100.00 L

SUMMARY OF THE FIRST QUARTER 2018 RESULTS
41/52
Name Initial capital/Equity
(HUF)
Ownership Directly
+ indirectly
(%)
Voting rights (%)
Classification1
66. OTP Leasing Romania IFN S.A. RON 23,036,300 100.00 100.00 L 67. OTP Lizing d.o.o. RSD 482,631,000 100.00 100.00 L 68. OTP Mérnöki Ltd. 3,000,000 100.00 100.00 L 69. OTP Mobile Service LLC. 1,210,000,000 100.00 100.00 L 70. OTP Nekretnine d.o.o. HRK 51,708,100 100.00 100.00 L 71. OTP Osiguranje d.d. HRK 40,900,000 100.00 100.00 L
72. OTP Funds Servicing and Consulting Company Limited by Shares
2,349,940,000 100.00 100.00 L
73. OTP Pénzügyi Pont Ltd. 50,000,000 100.00 100.00 L 74. OTP Services d. o. o. RSD 40,028 100.00 100.00 L 75. R.E. Four d.o.o., Novi Sad RSD 1,983,643,761 100.00 100.00 L 76. SB Leasing d.o.o. HRK 23,332,000 100.00 100.00 L 77. SB NEKRETNINE d.o.o. HRK 531,400 100.00 100.00 L 78. SB ZGRADA d.o.o. HRK 208,120,000 100.00 100.00 L 79. SC Aloha Buzz SRL RON 200 100.00 100.00 L 80. SC Favo Consultanta SRL RON 200 100.00 100.00 L 81. SC Tezaur Cont SRL RON 200 100.00 100.00 L
82. SPLC-C Real estate develompent, Real estate management LLC.
3,000,000 100.00 100.00 L
83. SPLC-P Real estate develompent, Real estate management LLC.
15,000,000 100.00 100.00 L
84. SPLC Property Management LLC. 10,000,000 100.00 100.00 L 85. Splitska banka d.d. HRK 991,425,800 100.00 100.00 L 86. TOP Collector LLC RUB 530,000 100.00 100.00 L 87. Velvin Ventures Ltd. USD 50,000 100.00 100.00 L 88. Vojvodjanska banka a.d. Novi Sad RSD 16,337,430,000 100.00 100.00 L 89. POK DSK-Rodina AD BGN 6,010,000 99.75 99.75 L 90. OTP Banka Slovensko a.s. EUR 111,580,509 99.38 99.38 L 91. OTP banka Srbija a.d. Novi Sad RSD 31,607,808,040 98.90 98.90 L 92. JSC "OTP Bank" (Russia) RUB 4,423,768,142 97.90 97.90 L 93. OPUS Securities S.A. EUR 31,000 51.00 L 94. Debt Management Project 1 Montenegro d.o.o. EUR 20,795,000 100.00 100.00 L 95. Balansz Private Open End Institutional Fund 30,931,279,011 100.00 100.00 L 96. OTP MRP 5,617,887,006 L 97. OTP Solution Fund UAH 87,539,641 100.00 100.00 L
1 Full consolidated
-L

SUMMARY OF THE FIRST QUARTER 2018 RESULTS
42/52
Ownership structure of OTP Bank Plc.
as at 31 March 2018
Description of owner Total equity
At the beginning of actual year End of actual period %1 %2 Qty %1 %2 Qty
Domestic institution/company 20.04% 20.26% 56,116,209 19.24% 19.46% 53,879,490Foreign institution/company 63.73% 64.44% 178,445,190 63.11% 63.81% 176,708,034Domestic individual 3.92% 3.97% 10,988,183 3.50% 3.54% 9,791,697Foreign individual 0.23% 0.23% 650,713 0.20% 0.20% 566,425Employees, senior officers 0.80% 0.81% 2,250,991 0.76% 0.77% 2,139,225Treasury shares3 1.09% 0.00% 3,063,853 1.10% 0.00% 3,071,141Government held owner4 0.08% 0.08% 226,012 0.08% 0.08% 226,012International Development Institutions5 0.03% 0.03% 70,502 0.03% 0.03% 82,107Other6 10.07% 10.18% 28,188,357 11.98% 12.11% 33,535,879TOTAL 100.00% 100.00% 280,000,010 100.00% 100.00% 280,000,0101 Ownership share. The data of Domestic individual and Employees, senior officers were revised for the beginning of actual year.
2 Voting rights 3 The treasury shares do not include the OTP shares held by ESOP. 4 E.g.: State Privatization Holding Co. Ltd., Social Security, Municipality, 100% state-owned companies, Pension Reform and Debt
Reduction Fund etc. 5 E.g.: EBRD, EIB, etc. 6 Non-identified shareholders according to the shareholders’ registry.
Number of treasury shares held in the year under review (2018)
1 January 31 March 30 June 30 September 31 DecemberOTP Bank 990,293 997,581 Subsidiaries 2,073,560 2,073,560 TOTAL 3,063,853 3,071,141
Shareholders with over/around 5% stake as at 31 March 2018
Name Number of shares Ownership Voting rightsMOL (Hungarian Oil and Gas Company Plc.) 24,000,000 8.57% 8.67%Megdet, Timur and Ruszlan Rahimkulov 22,199,077 7.93% 8.02%OPUS Securities S.A. 14,496,476 5.18% 5.23%Groupama Group 14,343,737 5.12% 5.18%
Senior officers, strategic employees and their shareholding of OTP shares as at 31 March 2018
Type1 Name Position No. of shares
held IT Dr. Sándor Csányi 2 Chairman and CEO 605,097IT Mihály Baumstark member 44,400IT Dr. Tibor Bíró member 15,356IT Tamás Erdei member 16,039IT Dr. István Gresa member 143,071IT Antal Kovács member, Deputy CEO 12,703IT Dr. Antal Pongrácz member 82,101IT Dr. László Utassy member 200,000IT Dr. József Vörös member 147,714IT László Wolf member, Deputy CEO 597,164FB Ágnes Rudas member 145,598FB Tibor Tolnay Chairman 54FB Dr. Gábor Horváth member 0FB András Michnai member 100FB Dominique Uzel member 0FB Dr. Márton Gellért Vági member 0SP László Bencsik Chief Financial and Strategic Officer, Deputy CEO 34,961SP András Tibor Johancsik Deputy CEO 4,510SP György Kiss-Haypál Deputy CEO 4,935
TOTAL No. of shares held by management: 2,053,8031 Employee in strategic position (SP), Board Member (IT), Supervisory Board Member (FB)
2 Number of OTP shares owned by Mr Csányi directly or indirectly: 2,405,097

SUMMARY OF THE FIRST QUARTER 2018 RESULTS
43/52
OFF-BALANCE SHEET ITEMS ACCORDING TO IFRS (consolidated, in HUF million) 1
a) Contingent liabilities
31/03/2018 31/03/2017Commitments to extend credit 1,822,877 1,324,075Guarantees arising from banking activities 550,420 398,765Confirmed letters of credit 12,441 13,045Legal disputes (disputed value) 15,326 44,514Contingent liabilities related to OTP Mortgage Bank 0 0Other 280,956 312,163Total: 2,682,020 2,092,5621 Those financial undertakings, which are important from valuation perspectives however not booked within the balance sheet (such as surety, guarantees, pledge related obligations, etc.)
Security issuances on Group level between 01/04/2017 and 31/03/2018
Issuer Type of security Security name Date of issue Date of maturity
Ccy
Outstanding consolidated
debt (in original
currency or HUF million) 31/03/2018
Outstanding consolidated debt (in HUF
million) 31/03/2018
OTP Bank Plc. Retail bond OTP_VK1_18/3 13/04/2017 13/04/2018 USD 2,475,765 629OTP Bank Plc. Retail bond OTP_DK_18/I 31/05/2017 31/05/2018 HUF 0 0OTP Bank Plc. Retail bond OTP_VK1_18/4 02/06/2017 02/06/2018 USD 4,029,344 1,023OTP Bank Plc. Retail bond OTP_VK1_18/5 14/07/2017 14/07/2018 USD 2,068,415 525OTP Bank Plc. Retail bond OTP_VK1_18/6 04/08/2017 04/08/2018 USD 690,372 175OTP Bank Plc. Retail bond OTP_VK1_18/7 29/09/2017 29/09/2018 USD 4,383,580 1,113OTP Bank Plc. Retail bond OTP_VK1_18/8 17/11/2017 17/11/2018 USD 2,997,723 761OTP Bank Plc. Retail bond OTP_VK1_18/9 20/12/2017 20/12/2018 USD 1,435,320 364OTP Bank Plc. Retail bond OTP_VK1_19/I 16/02/2018 16/02/2019 USD 3,047,725 774OTP Bank Plc. Retail bond OTP_VK1_19/2 29/03/2018 29/03/2019 USD 3,042,675 773OTP Banka Slovensko Corporate bond Bonds OTP V. 31/07/2017 30/07/2018 EUR 0 0OTP Banka Slovensko Mortgage bond OTP XXXII. 15/12/2017 14/12/2018 EUR 0 0
Security redemptions on Group level between 01/04/2017 and 31/03/2018
Issuer Type of security Security name Date of issue Date of maturity
Ccy
Outstanding consolidated
debt (in original
currency or HUF million) 31/03/2017
Outstanding consolidated debt (in HUF
million) 31/03/2017
OTP Bank Plc. Corporate bond OTPX2017B 17/06/2011 20/06/2017 HUF 3,703 3,703OTP Bank Plc. Corporate bond OTPX2017C 19/09/2011 25/09/2017 HUF 2,785 2,785OTP Bank Plc. Corporate bond OTPX2017D 20/10/2011 19/10/2017 HUF 385 385OTP Bank Plc. Corporate bond OTPX2017E 21/12/2011 28/12/2017 HUF 2,995 2,995OTP Bank Plc. Corporate bond OTPX2018A 03/01/2012 09/01/2018 HUF 472 472OTP Bank Plc. Retail bond OTPTBSZ6_17I 13/01/2012 15/12/2017 HUF 221 221OTP Bank Plc. Corporate bond OTPX2018B 22/03/2012 22/03/2018 HUF 3,544 3,544OTP Bank Plc. Corporate bond OTPX2017F 19/06/2012 16/06/2017 EUR 776,800 240OTP Bank Plc. Retail bond OTP_VK_17/I 10/04/2015 10/04/2017 USD 285,500 82OTP Bank Plc. Retail bond OTP_E1_17/4 18/03/2016 01/04/2017 EUR 6,407,000 1,978OTP Bank Plc. Retail bond OTP_E1_17/5 15/04/2016 29/04/2017 EUR 8,560,100 2,643OTP Bank Plc. Retail bond OTP_E1_17/6 27/05/2016 10/06/2017 EUR 11,658,600 3,599OTP Bank Plc. Retail bond OTP_VK1_17/3 27/05/2016 27/05/2017 USD 6,017,500 1,737OTP Bank Plc. Retail bond OTP_E1_17/7 10/06/2016 24/06/2017 EUR 3,615,700 1,116OTP Bank Plc. Retail bond OTP_E1_17/8 01/07/2016 15/07/2017 EUR 6,771,400 2,090OTP Bank Plc. Retail bond OTP_E1_17/9 10/08/2016 24/08/2017 EUR 8,544,600 2,638OTP Bank Plc. Retail bond OTP_E1_17/10 16/09/2016 30/09/2017 EUR 4,428,700 1,367OTP Bank Plc. Retail bond OTP_VK1_17/4 16/09/2016 16/09/2017 USD 1,452,900 419OTP Bank Plc. Retail bond OTP_VK1_18/1 20/01/2017 20/01/2018 USD 2,892,200 835OTP Bank Plc. Retail bond OTP_VK1_18/2 03/03/2017 03/03/2018 USD 4,329,500 1,250OTP Mortgage Bank Mortgage bond OMB2017_I 05/02/2015 28/07/2017 EUR 500,000,000 0OTP Banka Slovensko Mortgage bond OTP XXIX. 28/09/2016 27/09/2017 EUR 1,000,000 0OTP Banka Slovensko Mortgage bond OTP XXX. 16/12/2016 15/12/2017 EUR 14,000,000 0OTP Banka Slovensko Mortgage bond OTP XXXI. 29/03/2017 28/03/2018 EUR 8,000,000 0OTP Banka Slovensko Corporate bond Bonds OTP IV. 28/02/2017 27/02/2018 EUR 65,000,000 0

SUMMARY OF THE FIRST QUARTER 2018 RESULTS
44/52
RELATED-PARTY TRANSACTIONS
The compensation of key management personnel, such as the members of the Board of Directors, members of the Supervisory Board, key employees of the Bank and its major subsidiaries involved in the decision-making process in accordance with the compensation categories defined in IAS 24 Related party disclosures, is summarised below.
Compensations in HUF million 1Q 2017 4Q 2017 1Q 2018 Q-o-Q Y-o-Y Total 2,117 3,171 2,641 -17% 25%
Short-term employee benefits 1,407 2,233 1,756 -21% 25%Share-based payment 584 822 773 -6% 32%Other long-term employee benefits 117 84 112 33% -4%Termination benefits 9 20 0 -100% -100%Redundancy payments 0 12 0 -100%
Loans provided to companies owned by the management (normal course of business)
100,337 56,508 48,708 -14% -51%
Credit lines and treasury framework contracts of the members of Board of Directors and the Supervisory Board and their close family members (at normal market conditions)
360 3,743 3,759 0% 944%
Commitments to extend credit and guarantees 35,278 38,652 42,011 9% 19%Loans provided to unconsolidated subsidiaries 4,285 4,484 4,645 4% 8%
1 Members of the Board of Directors and the Supervisory Board, senior officers and the auditor of the company

SUMMARY OF THE FIRST QUARTER 2018 RESULTS
45/52
SUPPLEMENTARY DATA

SUMMARY OF THE FIRST QUARTER 2018 RESULTS
46/52
ADJUSTMENTS OF THE CONSOLIDATED IFRS BALANCE SHEET LINES Starting from 3Q 2017, in the adjusted balance sheets presented in the analytical section of the Summary the total amount of accrued interest receivables related to DPD90+ loans were netted with the provisions created in relation to the total exposure toward those particular clients, in case of the affected Group members. Therefore, this adjustment made on the accounting balance sheet has an impact on the consolidated gross customer loans and allowances for loan losses.
in HUF million 4Q 2017 1Q 2018 Gross customer loans (incl. accrued interest receivables related to loans) 7,726,631 7,896,670(-) Accrued interest receivables related to DPD90+ loans 36,212 40,576Gross customer loans (adjusted) 7,690,419 7,856,093 Allowances for loan losses -738,797 -794,510(-) Allocated provision on accrued interest receivables related to DPD90+ loans -36,212 -40,576Allowances for loan losses (adjusted) -702,585 -753,934
SUMMARY OF THE FIRST QUARTER 2018 RESULTS
47/52
FOOTNOTES OF THE TABLE ‘CONSOLIDATED AFTER TAX PROFIT BREAKDOWN BY SUBSIDIARIES (IFRS)’
General note: regarding OTP Core and other subsidiaries, profit after tax is calculated without received dividends and net cash transfers (and other adjustment items). Dividends and net cash transfers received from non-group member companies are shown on a separate line in one sum in the table, regardless to the particular receiver or payer group member company.
(1) OTP Core, Corporate Centre and foreign banks aggregated, excluding one-timers.
(2) OTP Core is an economic unit for measuring the result of core business activity of OTP Group in Hungary. Financials of OTP Core are calculated from the partially consolidated IFRS financial statements of certain companies engaged in OTP Group’s operation in Hungary. These companies include OTP Bank Hungary Plc., OTP Mortgage Bank Ltd, OTP Building Society Ltd, OTP Factoring Ltd, OTP Financial Point Ltd., and companies providing intragroup financing; OTP Bank Employee Stock Ownership Plan Organization was included from 4Q 2016; OTP Card Factory Ltd., OTP Facility Management Llc., MONICOMP Ltd. and OTP Real Estate Lease Ltd. were included from 1Q 2017. The consolidated accounting results of these companies are segmented into OTP Core and Corporate Centre. Latter is a virtual entity.
(3) Within OTP Group, the Corporate Centre acts as a virtual entity established by the equity investment of OTP Core for managing the wholesale financing activity for all the subsidiaries within OTP Group but outside OTP Core. Therefore the balance sheet of the Corporate Centre is funded by the equity and intragroup lending received from OTP Core, the intragroup lending received from other subsidiaries, and the subordinated debt and senior notes arranged by OTP Bank under its running EMTN program. From this funding pool, the Corporate Centre is to provide intragroup lending to, and hold equity stakes in OTP subsidiaries outside OTP Core. Main subsidiaries financed by Corporate Centre are as follows: Hungarians: Merkantil Bank Ltd, Merkantil Car Ltd, Merkantil Leasing Ltd, OTP Fund Management Ltd, OTP Real Estate Fund Management Ltd, OTP Life Annuity Ltd; foreigners: banks, leasing companies, factoring companies.
(4) From 1Q 2015 the performance of OTP Bank Russia does not contain the volumes and financial result of Touch Bank. From 1Q 2015 the statement of recognised income and balance sheet of LLC MFO “OTP Finance” was included in the Russian performance.
(5) Touch Bank is part of OTP Bank Russia from legal point of view, and it is operating under the same banking license, but as a separate digital banking business line. In order to provide transparent information Touch Bank is presented as a separate virtual entity.
(6) From 4Q 2008 figures are based on the aggregated financial statements of OTP Bank JSC and LLC OTP
Leasing Ukraine, from 4Q 2009 the result of LLC OTP Factoring Ukraine was also aggregated.
(7) From 3Q 2010 the result and balance sheet of OTP Factoring Bulgaria LLC was included. DSK Group balance sheet contains the loans sold to the factoring company at before sale gross value and the related provisions, as well.
(8) Net earnings are adjusted with the result of CIRS swap transactions executed with OTP Bank Hungary in relation to interbank financing. Before transfer balance sheet numbers are displayed. From 2Q 2010 the statement of recognised income and balance sheet of OTP Faktoring SRL was included. Banca Millennium was consolidated into OBR’s results from 1Q 2015.
(9) Including the financial performance of OTP Factoring Serbia d.o.o from 4Q 2010. Vojvodjanska banka has been consolidated from 4Q 2017.
(10) Splitska banka was consolidated into OBH’s results from 2Q 2017. Banco Popolare Croatia was consolidated into OBH’s results from 2Q 2014. From 1Q 2015 including the financial result and volumes of OTP Faktoring d.o.o.
(11) From 2012 on P&L data and related indices are adjusted for the special banking tax and the Slovakian Deposit Protection Fund contributions being introduced again in 2014, as well as the contribution into the Resolution Fund.
(12) Including the financial performance of OTP Factoring Montenegro d.o.o.
(13) Aggregated after tax profit of Merkantil Bank and Merkantil Car without dividends, net cash transfer, other adjustment items and provisioning for investments in subsidiaries.
(14) OTP Leasing Romania IFN S.A. (Romania), OTP Leasing d.d. and SB Leasing d.o.o. (Croatia), DSK Leasing AD (Bulgaria), OTP Lizing d.o.o, OTP Services d.o. (Serbia).
(15) LLC AMC OTP Capital (Ukraine) and OTP Asset Management SAI S.A. (Romania), DSK Asset Management (Bulgaria).
(16) OTP Buildings s.r.o. (Slovakia), OTP Real Slovensko s.r.o. (Slovakia), Velvin Ventures Ltd. (Belize), Debt Management Project 1 Montenegro d.o.o. (Montenegro), R.E. Four d.o.o., Novi Sad (Serbia), SC Aloha Buzz SRL, SC Favo Consultanta SRL, SC Tezaur Cont SRL (Romania), Cresco d.o.o. (Croatia), OTP Osiguranje d.d. (Croatia).
(17) Total Hungarian subsidiaries: sum of the adjusted after tax results of Hungarian group members, Corporate Centre and related eliminations.
(18) Total Foreign subsidiaries: sum of the adjusted after tax profits of foreign subsidiaries and one-off items (after tax).

SUMMARY OF THE FIRST QUARTER 2018 RESULTS
48/52
CALCULATION OF ADJUSTED LINES OF IFRS PROFIT AND LOSS STATEMENTS PRESENTED IN THE REPORT
In order to present Group level trends in a comprehensive way in the Report, the presented consolidated and separate profit and loss statements of this report were adjusted in the following way, and the adjusted P&Ls are shown and analysed in the Report. Consolidated accounting figures together with Separate accounting figures of OTP Bank are still disclosed in the Financial Data section. Adjustments:
The after tax effect of adjustment items (certain, typically non-recurring items from banking operations’ point of view) are shown separately in the Statement of Recognised Income. The following adjustment items emerged in the period under review and the previous year: received dividends, received and paid cash transfers, the effect of goodwill/investment impairment charges, special tax on financial institutions, the impact of fines imposed by the Hungarian Competition Authority, and the effect of acquisitions. Beside the Slovakian banking levy, the total amount of the special banking tax includes and the Slovakian Deposit Protection Fund contributions being introduced again in 2014, and the contribution into the Resolution Fund in Slovakia, too. The special banking tax, however, does not include the special tax levied on the result of investment services in the year of 2017 in Hungary, this item is presented among the operating expenses.
Other non-interest income elements stemming from provisioning release in connection with provisions on loans originated before the acquisitions of the subsidiaries have been reclassified to and deducted from the volume of provisions for possible loan losses in the income statement.
Other non-interest income is shown together with gains/losses on real estate transactions, but without the above mentioned income from the release of pre-acquisition provisions and without received cash transfers. However other non-interest expenses stemming from non-financial activities are added to the adjusted net other non-interest income line, therefore the latter incorporates the net amount of other non-interest income from non-financial activities.
From 4Q 2016 certain components of the result on derivative instruments have been presented on a separate line in the accounting P&L structure: on the Gains and losses on derivative financial instruments line (certain other components were continued to be booked on the net interest income and foreign exchange result line). In the previous accounting and adjusted P&L structure, items currently booked on the Gains and losses on derivative financial instruments line were accounted for on the net interest income, foreign exchange result and gains/losses on securities line. In 4Q 2016 the full annual amounts have been moved in one sum to the Gains and losses on derivative financial instruments line. In the adjusted P&L structure this new line constitutes part of the Net other non-interest result among Other net non-interest income.
The Gains and losses on non-trading loans mandatorily at fair value through profit or loss line appearing in the accounting P&L structure from 1Q 2018 was presented in the adjusted P&L structure on the Net other non-interest result line within the Other net non-interest income.
From 2Q 2014 OTP Bank’s share in the change in the shareholders’ equity of companies consolidated with equity method is reclassified from the After tax dividends and net cash transfers line to the Net other non-interest result (adj.) without one-offs line. Furthermore, received cash transfers within the framework of the subsidy programme targeting the expansion of POS network in Hungary in 3Q 2017 were reclassified from the After tax dividends and net cash
transfers line to the Net other non-interest result (adj.) without one-offs line.
Out of other expenses, other provisions are deducted and shown separately as other risk costs in the adjusted income statement. Other provisions contain provisioning on off-balance sheet liabilities and on legal contests, provisioning on securities, shares and other investments as well as provisioning on other assets.
Other administrative expenses have been adjusted in the following way in order to create a category comprising administrative cost items exclusively. Other costs and expenses and other non-interest expenses were included into the adjusted Other non-interest expenses. At the same time, the following cost items were excluded from adjusted other non-interest expenses: paid cash transfers – except for movie subsidies and cash transfers to public benefit organisations –, Other other non-interest expenses stemming from non-financial activities, and special tax on financial institutions.
Tax deductible transfers (offset against corporate taxes) paid by Hungarian group members from 3Q 2012 were reclassified from Other non-interest expenses to Corporate income tax. As a result, the net P&L effect of these transfers (i.e. the paid transfer less the related corporate tax allowances) is recognised in the corporate income tax line of the adjusted P&L. The amount of tax deductible transfers offset against the special tax on financial institutions is shown on a net base on the special tax on financial institutions line.
The financial transaction tax paid from the beginning of 2013 in Hungary is reclassified from other (administrative) expenses to net fee and commission income, both on consolidated and OTP Core level.
The Net insurance result line which appeared in the consolidated accounting P&L structure from 3Q 2017 is presented on the Net other non-interest result line within the Other net non-interest income in the adjusted P&L structure.
OTP Group is hedging the revaluation result of the FX provisions on its FX loans and interest claims by keeping hedging open FX positions. In the accounting statement of recognized income, the revaluation of FX provisions is part of the risk costs (within line “Provision for loan losses”), other provisions and net interest income lines, whereas the revaluation result of the hedging open FX positions is made through other non-interest income (within line “Foreign exchange result, net”). The two items have the same absolute amount but an opposite sign. As an adjustment to the accounting statement of income, these items are eliminated from the adjusted P&L. By modifying only the structure of the income statement, this correction does not have any impact on the bottom line net profits.
The Compensation Fund (established in Hungary in order to indemnify the victims of Quaestor and Hungarian Securities Ltd.) contributions booked from 1Q 2017 are recognized on the Other administrative expenses line of the accounting income statement, and are presented on the financial transaction tax and Special tax on financial institutions line the in the adjusted P&L structure.
In case of OTP Banka Slovensko and OTP Bank Romania the total revaluation result of intra-group swap deals – earlier booked partly within the net interest income, but also on the Foreign exchange gains and Net other non-interest result lines within total Other non-interest income – is presented on a net base on the net interest income line starting from 1Q 2016.
SUMMARY OF THE FIRST QUARTER 2018 RESULTS
49/52
Starting from 3Q 2016 the Ukrainian subsidiary started to calculate interest revenues based on net loan volumes. This resulted in a one-off structural correction between the net interest income and provision for loan losses in 3Q 2016.
Performance indicators (such as cost/income ratio, net interest margin, risk cost to average gross loans as well as ROA and ROE ratios) presented in this report are calculated on the basis of the adjusted profit and loss statement excluding adjustment items (unless otherwise indicated). Adjustment items include received dividends and net cash transfers, the effect of goodwill/investment impairment charges, special tax on financial institutions, the impact of fines imposed by the Hungarian Competition Authority, and the effect of acquisitions.
Within the report, FX-adjusted statistics for business volume developments and their product breakdown are disclosed, too. For FX adjustment, the closing cross currency rates for the current period were used to calculate the HUF equivalent of loan and deposit volumes in the base periods. Thus the FX adjusted volumes will be different from those published earlier.

SUMMARY OF THE FIRST QUARTER 2018 RESULTS
50/52
ADJUSTMENTS OF CONSOLIDATED IFRS P&L LINES
in HUF million 1Q 17 2Q 17 3Q 17 4Q 17
Audited 2017
Audited 1Q 18
Net interest income 135,080 137,987 138,961 141,727 553,755 145,004 (-) Revaluation result of FX provisions 343 -319 123 43 190 9 (+) Presentation of the revaluation result of intra-group swaps on the net interest income line realized at the Romanian and Slovakian operations
-120 87 -50 -20 -103 -202
(-) Netting of interest revenues on DPD90+ loans with the related provision (booked on the Provision for loan losses line) at OTP Core and CKB
2,437 1,467 1,102 955 5,961 956
(-) Effect of acquisitions 660 187 847 222 Net interest income (adj.) 132,180 136,925 137,026 140,523 546,654 143,614 Net fees and commissions 58,572 64,941 65,890 71,791 261,193 64,459 (+) Financial Transaction Tax -14,022 -11,189 -12,841 -13,718 -51,770 -14,880 (-) Effect of acquisitions -5 0 0 -5 0 Net fees and commissions (adj.) 44,549 53,757 53,049 58,073 209,428 49,579 Foreign exchange result 2,913 2,168 4,767 6,731 16,579 3,460 (-) Revaluation result of FX positions hedging the revaluation of FX provisions -1,923 -4,243 -874 2,690 -4,350 -3,605 (-) Presentation of the revaluation result of intra-group swaps on the net interest income line realized at the Romanian and Slovakian operations
-168 105 -837 86 -814 -173
(-) Effect of acquisitions 0 122 0 0 122 0 Foreign exchange result (adj.) 5,004 6,185 6,478 3,955 21,622 7,238 Gain/loss on securities, net 1,677 3,115 1,737 1,401 7,930 -1,066 Gain/loss on securities, net (adj.) with one-offs 1,677 3,115 1,737 1,401 7,930 -1,066 (-) Revaluation result of the treasury share swap agreement (booked as Gain on securities, net (adj) at OTP Core) -42 -198 996 106 862 -1,845 Gain/loss on securities, net (adj.) without one-offs 1,719 3,312 741 1,295 7,068 779 Gains and losses on real estate transactions 897 630 156 410 2,093 574 (+) Other non-interest income 5,622 20,523 8,827 27,996 62,968 9,595 (+) Gains and losses on derivative financial instruments -263 596 1,631 3,328 5,291 976 (+) Net insurance result 159 250 410 200 (+) Gains and losses on non-trading loans mandatorily at fair value through profit or loss -127 (-) Received cash transfers 1 1 572 9 584 144 (+) Received cash transfers within the framework of the subsidy programme targeting the expansion of POS network in Hungary
560 0 560 142
(-) Non-interest income from the release of pre-acquisition provisions 116 2,764 4,183 2,687 9,750 5,495 (+) Other other non-interest expenses -1,044 -1,061 -866 -6,695 -9,666 -732 (+) Change in shareholders' equity of companies consolidated with equity method 32 -149 459 71 413 -232 (-) Effect of acquisitions 0 14,228 275 17,768 32,271 1 (-) Presentation of the revaluation result of intra-group swaps on the net interest income line realized at the Romanian and Slovakian operations
49 -18 787 -106 712 -29
(-) One-off impact of regulatory changes related to CHF consumer contracts in Croatia -36 -6 -8 -4 -54 0 (-) One-off impact of the CHF mortgage loan conversion programme and regulatory changes related to mortgage loans in Romania
-58 -233 -206 134 -363 -174
(-) Impact of fines imposed by the Hungarian Competition Authority 194 0 0 0 194 0 (-) Netting of refunds related to legal cases (accounted for on the Net other non-interest result line) with the release of provisions created earlier for these cases (accounted for on the Other provisions line) from 1Q 2017 at OTP Bank Romania
-325 -539 -201 -134 -1,200 -165
Net other non-interest result (adj.) with one-offs 5,304 4,342 5,524 5,006 20,175 5,124 (-) Gain on the repurchase of own Upper and Lower Tier2 Capital (booked as Net other non-interest result (adj) at OTP Core and at the Corporate Centre)
0 0 0 0 0 0
Net other non-interest result (adj.) without one-offs 5,304 4,342 5,524 5,006 20,175 5,124

SUMMARY OF THE FIRST QUARTER 2018 RESULTS
51/52
in HUF million 1Q 17 2Q 17 3Q 17 4Q 17
Audited 2017
Audited 1Q 18
Provision for loan losses -11,737 -5,965 -5,614 -17,532 -40,848 -3,482 (+) Non-interest income from the release of pre-acquisition provisions 116 2,764 4,183 2,687 9,750 5,495 (-) Revaluation result of FX provisions 1,558 4,558 757 -2,728 4,144 3,590 (-) Expected one-off impact of the CHF mortgage loan conversion programme and regulatory changes related to mortgage loans in Romania
-95 -148 -189 2,209 1,777 -50
(+) Netting of interest revenues on DPD90+ loans with the related provision (booked on the Provision for loan losses line) at OTP Core and CKB
2,437 1,467 1,102 955 5,961 956
Provision for loan losses (adj.) -10,647 -6,145 -896 -13,371 -31,058 -570
Dividend income 171 3,142 748 90 4,152 -99 (+) Received cash transfers 1 1 572 9 584 144 (+) Paid cash transfers -494 -398 -645 -9,959 -11,496 -4,817 (-) Sponsorships, subsidies and cash transfers to public benefit organisations -492 -398 -645 -9,960 -11,495 -4,811 (-) Received cash transfers within the framework of the subsidy programme targeting the expansion of POS network in Hungary
560 0 560 142
(-) Dividend income of swap counterparty shares kept under the treasury share swap agreement 0 3,082 0 0 3,082 0 (-) Change in shareholders' equity of companies consolidated with equity method 32 -149 459 71 413 -232 After tax dividends and net cash transfers 139 209 302 30 680 129
Depreciation -9,722 -12,054 -13,897 -13,819 -49,493 -12,244 (-) Effect of acquisitions -627 -940 -940 -2,507 -940 Depreciation (adj.) -9,722 -11,427 -12,957 -12,376 -46,482 -11,304
Personnel expenses -49,560 -53,438 -53,831 -57,057 -213,886 -57,813 (-) Effect of acquisitions 0 -7 -4 -276 -287 -215 Personnel expenses (adj.) -49,560 -53,432 -53,827 -56,780 -213,599 -57,598
Income taxes -7,525 -12,312 -9,232 -12,434 -41,503 -10,467 (-) Corporate tax impact of goodwill/investment impairment charges 512 -782 -189 -5,102 -5,561 0 (-) Corporate tax impact of the special tax on financial institutions 1,423 46 46 47 1,561 1,417 (+) Tax deductible transfers (offset against corporate taxes) 0 -45 0 -2,117 -2,162 1,353 (-) Corporate tax impact of the effect of fines imposed by the Hungarian Competition Authority -17 0 0 0 -17 0 (-) Corporate tax impact of the effect of acquisitions 0 439 215 -2,952 -2,298 -101 Corporate income tax (adj.) -9,442 -12,060 -9,304 -6,544 -37,350 -10,430
Other operating expense, net -3,667 -16,067 -5,420 -26,076 -51,230 -5,131 (-) Other costs and expenses -838 -964 -1,149 -2,844 -5,795 -1,058 (-) Other non-interest expenses -1,538 -1,459 -1,511 -16,654 -21,162 -5,549 (-) Effect of acquisitions 0 -10,884 0 1,380 -9,504 1,799 (-) Revaluation result of FX provisions 22 4 -6 -4 16 6 (-) Expected one-off impact of regulatory changes related to CHF consumer contracts in Croatia 36 6 8 4 54 0 (-) Expected one-off impact of the CHF mortgage loan conversion programme and regulatory changes related to mortgage loans in Romania
153 380 395 -2,343 -1,414 225
(-) Netting of refunds related to legal cases (accounted for on the Net other non-interest result line) with the release of provisions created earlier for these cases (accounted for on the Other provisions line) from 1Q 2017 at OTP Bank Romania
325 539 201 134 1,200 165
Other provisions (adj.) -1,828 -3,688 -3,359 -5,749 -14,624 -719
Other administrative expenses -69,598 -52,567 -55,554 -58,353 -236,072 -68,789 (+) Other costs and expenses -838 -964 -1,149 -2,844 -5,795 -1,058 (+) Other non-interest expenses -1,538 -1,459 -1,511 -16,654 -21,162 -5,549 (-) Paid cash transfers -494 -398 -645 -9,959 -11,496 -4,817 (+) Film subsidies and cash transfers to public benefit organisations -492 -398 -645 -9,960 -11,495 -4,811 (-) Other other non-interest expenses -1,044 -1,061 -866 -6,695 -9,666 -732 (-) Special tax on financial institutions (recognised as other administrative expenses) -16,153 -215 -208 -218 -16,794 -16,142 (-) Tax deductible transfers (offset against corporate taxes) 0 -45 0 -2,117 -2,162 1,353 (-) Financial Transaction Tax -14,022 -11,189 -12,841 -13,718 -51,770 -14,880 (-) Impact of fines imposed by the Hungarian Competition Authority 0 0 0 0 0 0 (-) Effect of acquisitions -84 -362 -486 -931 -384 Other non-interest expenses (adj.) -40,753 -42,397 -43,937 -54,618 -181,706 -44,604

52/52
OTP Bank Plc.
Postal address: P.O.Box: 501 Budapest H-1876 Hungary
Phone: +36 1 473 5460
Fax: +36 1 473 5951
E-mail: [email protected]
Internet: www.otpbank.hu